RE: “Computer-generated video shows pollution spread ...
35
1 Nov 13, 2015 CBC Edmonton Newsroom Street Address: 123 Edmonton City Centre 10062-102 Avenue Edmonton, Alberta T5J 2Y8 Send a news tip Radio Newsroom: TEL: (780) 468-7401 FAX: (780) 468-7419 Mailing Address: P.O. Box 555 Edmonton, Alberta T5J 2P4 TEL: (780) 468-7500 TV Newsroom: TEL: (780) 468-7555 FAX: (780) 468-7510 Executive Producer, All Platforms Email: Neill Fitzpatrick TEL: (780) 468-7527 News Director Email: Gary Cunliffe TEL: (780) 468-7505 Audience Relations, CBC P.O. Box 500 Station A Toronto, ON Canada, M5W 1E6 Dear Mr. Fitzpatrick and Mr. Cunliffe, RE: “Computer-generated video shows pollution spread across the Prairies” Oct 8, 2015 http://www.cbc.ca/news/canada/edmonton/computer-generated-video-shows-pollution-spread- across-the-prairies-1.3261783 We believe this new item to be false and misleading and that the source material has been significantly distorted, as shown by the evidence herein. Our interest in energy-air pollution and the persistent ‘phase-out coal campaign’ is simply that, as scientists who examine evidence and facts, we are disturbed at the level of distorted reporting about a valuable resource/industry that provides Albertans with affordable power. We do not want to see Alberta become like Ontario, saddled with debt and an inefficient, costly grid. At present, Alberta has no public debt for utilities. Ontario’s debt is $44 billion and their overall provincial debt is $239 billion. Friends of Science Society P.O. Box 23167, Mission P.O. Calgary, Alberta Canada T2S 3B1 Toll-free Telephone: 1-888-789-9597 Web: friendsofscience.org E-mail: contact(at)friendsofscience(dot)org
Transcript of RE: “Computer-generated video shows pollution spread ...

1
Nov 13, 2015
CBC Edmonton Newsroom
Street Address: 123 Edmonton City Centre 10062-102 Avenue Edmonton, Alberta T5J 2Y8
Send a news tip
Radio Newsroom: TEL: (780) 468-7401 FAX: (780) 468-7419
Mailing Address: P.O. Box 555 Edmonton, Alberta T5J 2P4 TEL: (780) 468-7500
TV Newsroom:
TEL: (780) 468-7555
FAX: (780) 468-7510
Executive Producer, All Platforms Email: Neill Fitzpatrick TEL: (780) 468-7527
News Director Email: Gary Cunliffe TEL: (780) 468-7505
Audience Relations, CBC P.O. Box 500 Station A Toronto, ON Canada, M5W 1E6
Dear Mr. Fitzpatrick and Mr. Cunliffe,
RE: “Computer-generated video shows pollution spread across the Prairies” Oct 8, 2015
http://www.cbc.ca/news/canada/edmonton/computer-generated-video-shows-pollution-spread-across-the-prairies-1.3261783 We believe this new item to be false and misleading and that the source material has been significantly distorted, as shown by the evidence herein. Our interest in energy-air pollution and the persistent ‘phase-out coal campaign’ is simply that,
as scientists who examine evidence and facts, we are disturbed at the level of distorted
reporting about a valuable resource/industry that provides Albertans with affordable power. We
do not want to see Alberta become like Ontario, saddled with debt and an inefficient, costly grid.
At present, Alberta has no public debt for utilities. Ontario’s debt is $44 billion and their overall
provincial debt is $239 billion.
Friends of Science Society
P.O. Box 23167, Mission P.O.
Calgary, Alberta
Canada T2S 3B1
Toll-free Telephone: 1-888-789-9597
Web: friendsofscience.org
E-mail: contact(at)friendsofscience(dot)org

2
A significant portion of Ontario’s problems are related to poor decisions on power generation,
which stemmed from recommendations that were put forward there over a decade ago, in a
similar way to what is being done now, by Pembina Institute and CAPE.
The Pembina Institute report “A Costly Diagnosis…” which Dr. Vipond, for CAPE, frequently
cites, is not supported by the evidence.
In your report, you say:
“Dr. Joe Vipond of Canadian Association of Physicians for the Environment says the visual
representation of air pollution brings awareness of the issue to a whole new level….. He's
leading a campaign to shut down coal-fired power plants, one source of the emissions seen in
the video model.”
Dr. Vipond is quoted as saying:
"In the populated areas, it's the coal-fired power plants that are really causing the disturbances,"
he said, noting there are 12 plants west of Edmonton and several more to the south.
Our evidence, in our report “BURNING QUESTIONS” indicates that most asthma-respiratory
issues are related to ground level air quality – this study relates to aerial dispersion of oil
sands emissions.
Consequently, it appears that you are reporting false and unsubstantiated information to the
public.
We would be happy to comment or provide more information. We look forward to a prompt and
public correction.
Sincerely,
Michelle Stirling Communications Manager Friends of Science Society

3
Errors and Misrepresentations in:
RE: “Computer-generated video shows pollution spread across the Prairies” Oct 8, 2015
http://www.cbc.ca/news/canada/edmonton/computer-generated-video-shows-pollution-spread-
across-the-prairies-1.3261783
1) There are significant misrepresentations of the information presented in the original
Joint Oil Sands Monitoring conference, from which this information is taken.
2) Within the Joint Oil Sands Monitoring explanatory video by Heather Morrison of
Environment Canada, she presents the following image. http://aemera.org/oil-sands-
symposium-program/8-3-high-resolution-air-quality-modelling-in-the-oil-sands/
3) Ms. Morrison of Environment Canada states at 4:09 in the video that there has been a
decrease in sulfur dioxide concentrations from the coal-fired power plants “which aligns
very nicely with the mitigation that has happened over that time period…” and that this
image shows in blue where there has been a decrease to 2013.
4) Furthermore, the study is evaluating a model, a computer simulation, vis a vis
forecasting abilities related to landscape, emissions and weather conditions, with the
model specifically applied in the oil sands operations area. This is NOT a report or study
on output of emissions in all areas of the province.
5)
Coal-fired power
plants are in a
fairly dark blue.
They have
REDUCED SO2
emissions over 8
years from 2005.
4
6)
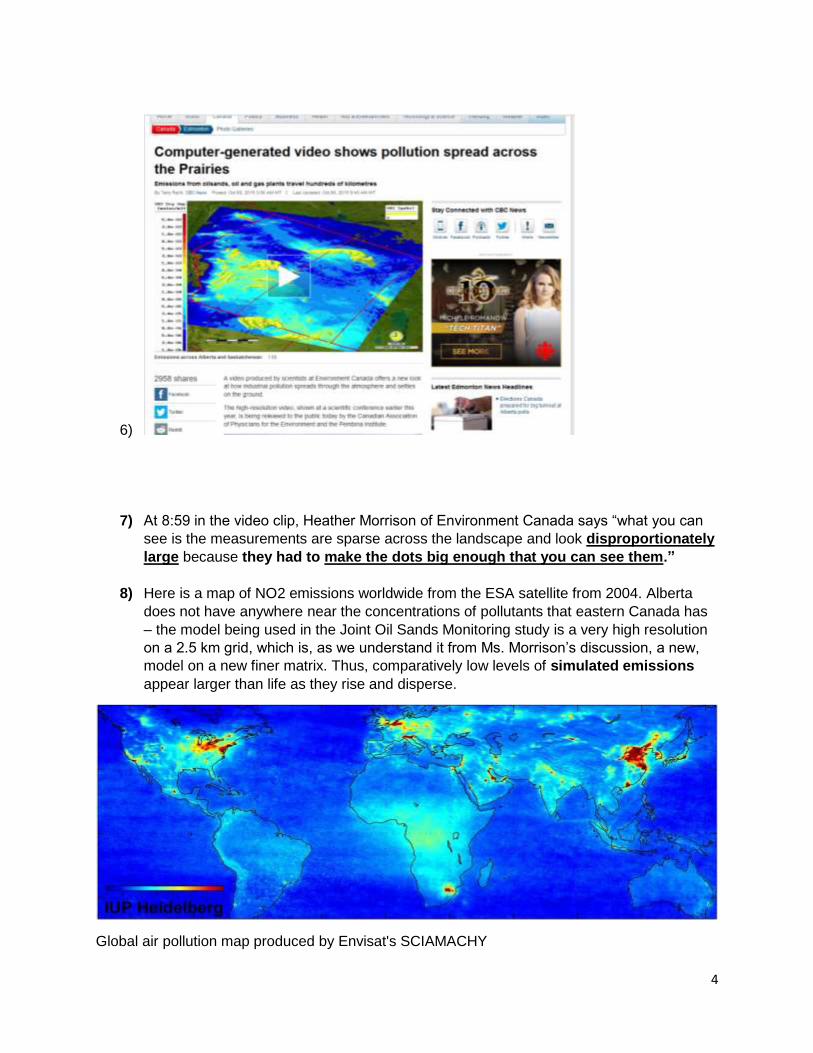
7) At 8:59 in the video clip, Heather Morrison of Environment Canada says “what you can
see is the measurements are sparse across the landscape and look disproportionately
large because they had to make the dots big enough that you can see them.”
8) Here is a map of NO2 emissions worldwide from the ESA satellite from 2004. Alberta
does not have anywhere near the concentrations of pollutants that eastern Canada has
– the model being used in the Joint Oil Sands Monitoring study is a very high resolution
on a 2.5 km grid, which is, as we understand it from Ms. Morrison’s discussion, a new,
model on a new finer matrix. Thus, comparatively low levels of simulated emissions
appear larger than life as they rise and disperse.
Global air pollution map produced by Envisat's SCIAMACHY

5
http://www.esa.int/Our_Activities/Observing_the_Earth/Envisat/Global_air_pollution_map_produ
ced_by_Envisat_s_SCIAMACHY
9) Here are the federal and provincial graphs of average monthly emissions for the city of
Edmonton for the past 10 to 30 years (depending on records) from federal and provincial
data sources. Air quality has consistently improved – emissions have significantly
dropped for most industries and in most areas of the nation. Please look at Edmonton’s
data.

6

7

8

9
10) Likewise the statements by Andrew Read of Pembina Institute misrepresent the purpose
of the video. The video images are first of all a model, a simulation.
"I think it really outlines the cumulative effects that are present from a large number of
emission sources," said Andrew Read, an analyst with the Pembina Institute, an
environmental watchdog agency.
"The video is really a good tool to demonstrate how emissions are distributed and dispersed in the province," he said.
As noted in your article, the simulation excludes all other source of emissions. So this
video only shows how high stack emissions from oil sands monitoring were possibly
distributed during a specific test period, based on specific parameters. As you note, it
does not include all forms of emissions or all sources, therefore it does not outline the
cumulative effects, because it deals with only one element.
Let us look at the sectors that emit GHGs in Alberta. Shutting coal fired power plants
would move to natural gas, which also has similar emissions.

10
One might conclude that Albertans will have to stop living in buildings, thus reducing
46% of GHGs.
If we look at the 2017 forecast chart for power generation in Alberta, we find that coal
generation will make up only about 1/3 of power generation in the province – therefore,
if 17% of GHGs come from power generation and coal fired power plants are closed,
as Dr. Vipond subsequently advocates for in your story, only 5% of GHGs would be
reduced from the above emissions chart – with 11% still being GROUND LEVEL
asthma inducing Diesel Emissions Particulates.

11
Looking at the AESO forecasts above, it is clear the the Alberta Electric System Operator sees
coal-fired power as an essential part of our power generation mix.
However, in your report, you say:
“Dr. Joe Vipond of Canadian Association of Physicians for the Environment says the visual
representation of air pollution brings awareness of the issue to a whole new level….. He's
leading a campaign to shut down coal-fired power plants, one source of the emissions seen in
the video model.”
Dr. Vipond is quoted as saying:
"In the populated areas, it's the coal-fired power plants that are really causing the
disturbances," he said, noting there are 12 plants west of Edmonton and several more to the
south.
Our evidence, in our report “BURNING QUESTIONS” indicates that most asthma-respiratory
issues are related to ground level air quality – this study relates to aerial dispersion of oil
sands emissions.
As shown in the pie graph above, buildings emit the most GHGs, while transportation is on a
part with non-coal fired power generation.
The graph below, addressing only PM2.5 in Canada, shows that coal-fired power generation is
only 0.5% of PM2.5 emissions. In Alberta in 2011, coal-fired power plants produced only 0.4%
of PM2.5.
Consequently, it appears that you are reporting false and unsubstantiated information to the
public.

12
We would like to see the substantiating evidence Dr. Vipond provided to you, to support his
claim that it is coal-fired power plants that are allegedly causing ‘disturbances’ in urban areas.
Dr. Vipond goes on with this quote:
"These coal plants have viable alternatives, they're not bringing any money into the
government pockets and they're having incredible health impacts on Albertans."
These are very bold statements.
What evidence to do you have to back them up?
a) What are the alleged ‘viable alternatives’?
b) What substantiating evidence do you have that coal-fired power plants do not bring any
money into the (Alberta) government’s pockets?
c) What evidence do you have to support the claim that coal-fired power plants are having
‘incredible health impacts on Albertans?”

13
11) There is an existing coal phase-out schedule, set by federal legislation. Most of the older
plants will soon be phased-out on their own. Evan Bahry of the Independent Power
Producers’ Society of Alberta has said that to replace current coal supply, it would
require eight natural gas plants, similar to that of the new Shepard Energy Centre in
Calgary, at a costs of $1.4 each or about $11 Billion in total. From a previous interview,
he reported that he doubts it would be possible to gather such capital or build that many
plants in such a short space of time. Please feel free to confirm with Mr. Bahry
independently.
12) Presently, Alberta has no public utility power debt – this would be eroded if some of the
renewables policies are incorporated according to the recent statements by the Premier
and Minister.
13) Is it good value for Albertans’ money to pay $11 billion (plus compensation estimated at
another $11.1 billion) to close coal fired power plants 10 to 15 years early, when it would
cost us nothing to wait? Based on our review of the evidence, there would be little or no
proportionate benefit to environment or health.

14
14) Regarding previous media reports of the claim that Alberta’s air quality is like that of
Toronto’s, here below is what a side-by-side comparison to Toronto air looks like. It does
not seem like the reporter did a fact check on this matter.

15
15) During the dates and timeframe referred to in the video clip of Heather Morrison from
Environment Canada, our people went to the CASA Data warehouse to see if the video
was portraying anything out of the ordinary. For the day of Feb. 17, 2015 which was

16
randomly selected by Heather Morrison (as she states in the video) there were no
exceedances of SO2 from any station.
Number Of Times Alberta Ambient Air Quality Objectives were
exceeded from February 17, 2015 to February 17, 2015
Parameter
Averaging Period
Objective
Station
Sulphur Dioxide
1-
Hour
24-
Hour
Annual
0.172
ppm
0.048
ppm
0.008
ppm
Anzac 0
0
0
Battle River North
Ambient Trailer 0
0
0
Battle River South
Ambient Trailer 0
0
0
Beaverlodge 0
0
0
Bertha Ganter - Fort
McKay
0
0
0
Breton 0
0
0
Bruderheim 0
0
0
Buffalo Viewpoint 0
0
0
Calgary Northwest 0
0
0
Calgary Southeast 0
0
0
Caroline 0
0
0
Carrot Creek 0
0
0
Clairmont-Portable 0
0
0
CNRL Horizon 0
0
0
Cold Lake South 0
0
0

17
Crescent Heights 0
0
0
Didsbury West 0
0
0
Edmonton Central 0
0
0
Edmonton East 0
0
0
Edmonton South 0
0
0
Edson 0
0
0
Elk Island 0
0
0
Elk Point Airport
(Portable) 0
0
0
Everdell 0
0
0
Evergreen Park 0
0
0
Falher 0
0
0
Ferrier Acres 0
0
0
Firebag 0
0
0
Fort Chipewyan
(WBEA)
0
0
0
Fort McKay South
(Syncrude UE1) 0
0
0
Fort McMurray-
Athabasca Valley 0
0
0
Fort McMurray-
Patricia McInnes 0
0
0
Fort Saskatchewan-
92 St and 96 Ave 0
0
0
Genesee 0
0
0
Grande Prairie (Henry
Pirker)
0
0
0
Hinton 0
0
0

18
James River 0
0
0
James River East 0
0
0
Lamont County 0
0
0
Lancaster 0
0
0
Lethbridge 0
0
0
Lower Camp 0
0
0
Mannix 0
0
0
Maskwa 0
0
0
Meadows 0
0
0
Mildred Lake 0
0
0
Millennium Mine 0
0
0
Olds South 0
0
0
Ponoka 0
0
0
Portable Taber 0
0
0
Power 0
0
0
Range Road 220 0
0
0
Red Deer - Riverside 0
0
0
Redwater Industrial 0
0
0
Rimbey Townsite 0
0
0
Rocky Mountain
House North 0
0
0
Ross Creek 0
0
0
Scotford (Temporary) 0
0
0
Scotford 2 0
0
0
Shell Muskeg River 0
0
0

19
Smoky Heights 0
0
0
ST. LINA 0
0
0
Steeper 0
0
0
Sylvan Lake East 0
0
0
Tomahawk 0
0
0
Valleyview 0
0
0
Violet Grove 0
0
0
Wagner2 0
0
0
Wapasu 0
0
0
Woodcroft 0
0
0
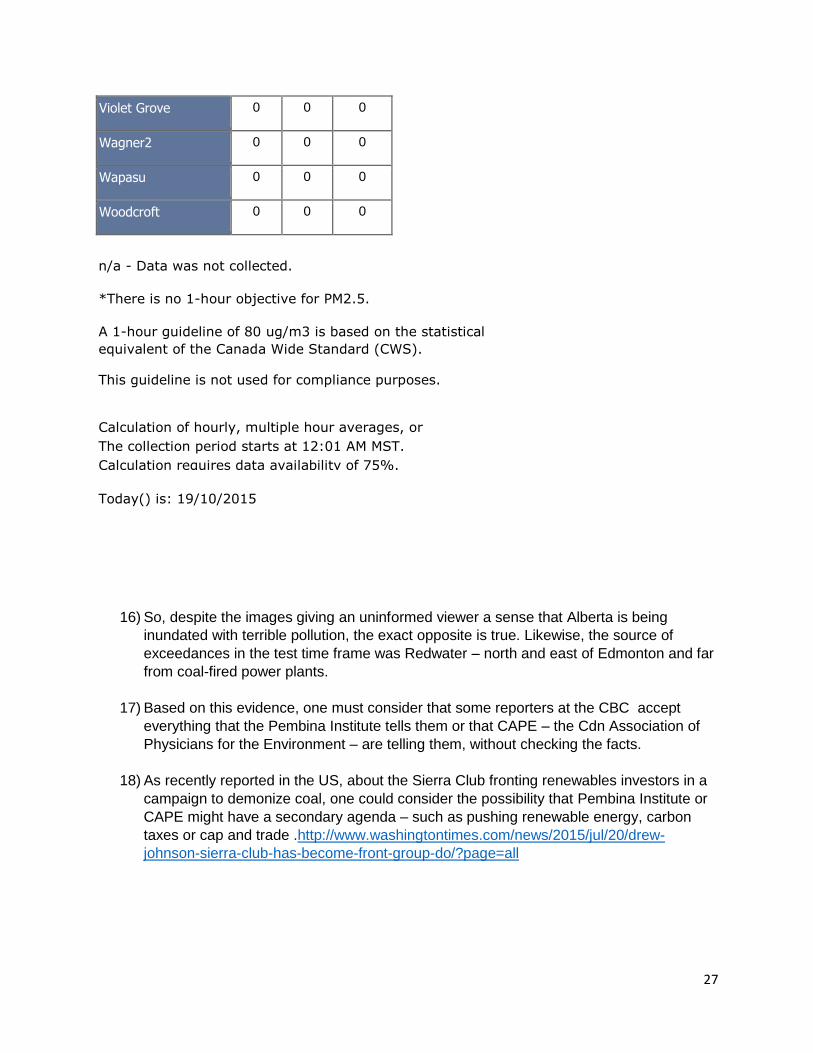
n/a - Data was not collected.
*There is no 1-hour objective for PM2.5.
A 1-hour guideline of 80 ug/m3 is based on the statistical
equivalent of the Canada Wide Standard (CWS).
This guideline is not used for compliance purposes.
Calculation of hourly, multiple hour averages, or
multiple day averages is based on consecutive hours.
The collection period starts at 12:01 AM MST.
Calculation requires data availability of 75%.
Today() is: 19/10/2015
We then checked to see about SO2 exceedances this year.

20
Number Of Times Alberta Ambient Air Quality Objectives were
exceeded from January 1, 2015 to September 30, 2015
Parameter
Averaging Period
Objective
Station
Sulphur Dioxide
1-
Hour
24-
Hour
Annual
0.172
ppm
0.048
ppm
0.008
ppm
Anzac 0
0
0
Battle River North
Ambient Trailer 0
0
0
Battle River South
Ambient Trailer 0
0
0
Beaverlodge 0
0
0
Bertha Ganter - Fort
McKay 0
0
0
Breton 0
0
0
Bruderheim 0
0
0
Buffalo Viewpoint 0
0
0
Calgary Northwest 0
0
0
Calgary Southeast 0
0
0
Caroline 0
0
0
Carrot Creek 0
0
0
Clairmont-Portable 0
0
0
CNRL Horizon 0
0
0
Cold Lake South 0
0
0
Crescent Heights 0
0
0
Didsbury West 0
0
0
Edmonton Central 0
0
0

21
Edmonton East 0
0
0
Edmonton South 0
0
0
Edson 0
0
0
Elk Island 0
0
0
Elk Point Airport
(Portable) 0
0
0
Everdell 0
0
0
Evergreen Park 0
0
0
Falher 0
0
0
Ferrier Acres 0
0
0
Firebag 0
0
0
Fort Chipewyan
(WBEA) 0
0
0
Fort McKay South
(Syncrude UE1) 0
0
0
Fort McMurray-
Athabasca Valley
0
0
0
Fort McMurray-
Patricia McInnes 0
0
0
Fort Saskatchewan-
92 St and 96 Ave 0
0
0
Genesee 0
0
0
Grande Prairie (Henry
Pirker) 0
0
0
Hinton 0
0
0
James River 0
0
0
James River East 0
0
0
Lamont County 0
0
0

22
Lancaster 0
0
0
Lethbridge 0
0
0
Lower Camp 0
0
0
Mannix 0
0
0
Maskwa 0
0
0
Meadows 0
0
0
Mildred Lake 0
0
0
Millennium Mine 0
0
0
Olds South 0
0
0
Ponoka 0
0
0
Portable Taber 0
0
0
Power 0
0
0
Range Road 220 0
0
0
Red Deer - Riverside 0
0
0
Redwater Industrial 15
3
0
Rimbey Townsite 0
0
0
Rocky Mountain
House North
0
0
0
Ross Creek 0
0
0
Scotford (Temporary) 0
0
0
Scotford 2 0
0
0
Shell Muskeg River 0
0
0
Smoky Heights 0
0
0
ST. LINA 0
0
0
Steeper 0
0
0

23
Sylvan Lake East 0
0
0
Tomahawk 0
0
0
Valleyview 0
0
0
Violet Grove 0
0
0
Wagner2 0
0
0
Wapasu 0
0
0
Woodcroft 0
0
0
n/a - Data was not collected.
*There is no 1-hour objective for PM2.5.
A 1-hour guideline of 80 ug/m3 is based on the statistical
equivalent of the Canada Wide Standard (CWS).
This guideline is not used for compliance purposes.
Calculation of hourly, multiple hour averages, or
multiple day averages is based on consecutive hours.
The collection period starts at 12:01 AM MST.
Calculation requires data availability of 75%.
Today() is: 19/10/2015
To date, there are no exceedances of SO2. So, despite the computer simulated video clip
showing patterns of simulated dispersal of oil sands emissions, in this time period there were no
exceedances.
We also cross-checked the time frame of the SO2 computer simulation video clip and found no
exceedances between August 10 and September 0, 2013, except for the Redwater location.
Number Of Times Alberta Ambient Air Quality Objectives were
exceeded from August 10, 2013 to September 10, 2015
Parameter
Averaging Period
Sulphur Dioxide
1-
Hour
24-
Hour
Annual
0.172
ppm
0.048
ppm
0.008
ppm

24
Objective
Station
Anzac 0
0
0
Battle River North
Ambient Trailer 0
0
0
Battle River South
Ambient Trailer 0
0
0
Beaverlodge 0
0
0
Bertha Ganter - Fort
McKay
0
0
0
Breton 0
0
0
Bruderheim 0
0
0
Buffalo Viewpoint 0
0
0
Calgary Northwest 0
0
0
Calgary Southeast 0
0
0
Caroline 0
0
0
Carrot Creek 0
0
0
Clairmont-Portable 0
0
0
CNRL Horizon 0
0
0
Cold Lake South 0
0
0
Crescent Heights 0
0
0
Didsbury West 0
0
0
Edmonton Central 0
0
0
Edmonton East 0
0
0
Edmonton South 0
0
0
Edson 0
0
0

25
Elk Island 0
0
0
Elk Point Airport
(Portable) 0
0
0
Everdell 0
0
0
Evergreen Park 0
0
0
Falher 0
0
0
Ferrier Acres 0
0
0
Firebag 0
0
0
Fort Chipewyan
(WBEA) 0
0
0
Fort McKay South
(Syncrude UE1) 0
0
0
Fort McMurray-
Athabasca Valley 0
0
0
Fort McMurray-
Patricia McInnes
0
0
0
Fort Saskatchewan-
92 St and 96 Ave
0
0
0
Genesee 0
0
0
Grande Prairie (Henry
Pirker) 0
0
0
Hinton 0
0
0
James River 0
0
0
James River East 0
0
0
Lamont County 0
0
0
Lancaster 0
0
0
Lethbridge 0
0
0
Lower Camp 0
0
0

26
Mannix 0
0
0
Maskwa 0
0
0
Meadows 0
0
0
Mildred Lake 0
0
0
Millennium Mine 0
0
0
Olds South 0
0
0
Ponoka 0
0
0
Portable Taber 0
0
0
Power 0
0
0
Range Road 220 0
0
0
Red Deer - Riverside 0
0
0
Redwater Industrial 46
8
0
Rimbey Townsite 0
0
0
Rocky Mountain
House North 0
0
0
Ross Creek 0
0
0
Scotford (Temporary) 0
0
0
Scotford 2 0
0
0
Shell Muskeg River 0
0
0
Smoky Heights 0
0
0
ST. LINA 0
0
0
Steeper 0
0
0
Sylvan Lake East 0
0
0
Tomahawk 0
0
0
Valleyview 0
0
0
27
Violet Grove 0
0
0
Wagner2 0
0
0
Wapasu 0
0
0
Woodcroft 0
0
0
n/a - Data was not collected.
*There is no 1-hour objective for PM2.5.
A 1-hour guideline of 80 ug/m3 is based on the statistical
equivalent of the Canada Wide Standard (CWS).
This guideline is not used for compliance purposes.
Calculation of hourly, multiple hour averages, or
multiple day averages is based on consecutive hours.
The collection period starts at 12:01 AM MST.
Calculation requires data availability of 75%.
Today() is: 19/10/2015
16) So, despite the images giving an uninformed viewer a sense that Alberta is being
inundated with terrible pollution, the exact opposite is true. Likewise, the source of
exceedances in the test time frame was Redwater – north and east of Edmonton and far
from coal-fired power plants.
17) Based on this evidence, one must consider that some reporters at the CBC accept
everything that the Pembina Institute tells them or that CAPE – the Cdn Association of
Physicians for the Environment – are telling them, without checking the facts.
18) As recently reported in the US, about the Sierra Club fronting renewables investors in a
campaign to demonize coal, one could consider the possibility that Pembina Institute or
CAPE might have a secondary agenda – such as pushing renewable energy, carbon
taxes or cap and trade .http://www.washingtontimes.com/news/2015/jul/20/drew-
johnson-sierra-club-has-become-front-group-do/?page=all

28
http://earthobservatory.nasa.gov/IOTD/view.php?id=77283&src=ve
19) Finally, above, these 2010 NASA images above on Alberta and the oil sands –
compared between a 2005 and 2008 image at the top – that do show increased
emissions, set in context of North America below (images acquired from 2005-2010)
show that oil sands emissions are about the same as a medium sized city or power plant
– and you can see how other areas of North America are polluted.
If Edmonton’s coal-fired power plants were such a pollution risk, why would they not
show up as a massive blob of dark brick red colors of Vancouver and the mid-
west/industrialized east of the US and Canada?
20) The conclusion of the above evidence shows that Alberta does have excellent air quality,
despite significant industrial activity, and based on the visible pattern above, it seems
clear that transportation is a major contributing factor to air pollution.
21) The SO2 dispersal video should also not surprise anyone. Here is a satellite video of
wildfire smoke from Siberia coming to North America. https://youtu.be/JzHXmrYd2tI
22) Below is a comparison chart showing the relative quantities of output of toxic pollutants
from wildfires in Alberta. Please note the equivalencies; the anti-coal-fired power plant

29
claims are disproportionate and exaggerated. While the human race should continue to
better manage pollution, when it comes to Mother Nature, nothing beats her for
generating GHGs, PM2.5 and PM10, heat, toxic VOCs, polycyclic Aromatic
Hydrocarbons and explosive turbulence, which is something you will never get from a
coal-fired power plant.
About Modelling Studies and Simulations
We also consulted with a data management / analysis professional (who is also an ecologist) who wrote:
The reporter should have asked the question: So what? Is this bad? Does it reflect reality? What good does it do? How does it compare to other jurisdictions (Notethat chunks of California and the entire Eastern NA region were far worse).
It is a model, therefore a logical construct. Outputs from models are not data, though they are often treated as such by media. The real life empirical data that we reviewed – also from EC - shows a decrease over time regardless of increased population / activity. It might be useful for predicting behavior of emissions plumes, but if they are within safe limits, who cares?
2006 Alberta population = 3.256 million 2014 Alberta population = 4.120 million http://www.statcan.gc.ca/tables-tableaux/sum-som/l01/cst01/demo26j-eng.htm http://www.statcan.gc.ca/tables-tableaux/sum-som/l01/cst01/demo02a-eng.htm
So, if SOx and NOx emissions are at about the same levels in 2014 as they were in 2006 that means in real terms a reduction of just over 26% per capita. That is a lot like what industry has been saying (assuming there is a direct correlation between GHG and SOx/NOx:
http://www.oilsandstoday.ca/topics/ghgemissions/Pages/default.aspx
The model appears to be parameterized on actual observations, but with no level of confidence / error margins disclosed.
The model shows a pattern of dispersion that is interesting, but meaningless without proper context (i.e. air quality in Alberta is consistently above minimum AQHI levels)
The observed numbers from Environment Canada validate that oil sands / electric generation industry in Alberta has been steadily decreasing emissions. (See graphs in Appendix)
The observed data show air quality improving from 2006 to 2014.
The observed data show a few AQHI spikes and as implied, seem to be correlated with winter atmospheric inversions.
30
He also comments that ozone is the only factor in Environment Canada information that shows a slight uptick – and adds this:
All show reductions in polluting emissions (leaving CO2 out) over time even as the population and industry has increased over the same period. The exception is ozone which is related to population and difficult to influence.
As per the EPA:
“Ground-level ozone (the primary constituent of smog) is the most complex, difficult to control, and pervasive of the six principal air pollutants. Unlike other pollutants, ozone is not emitted directly into the air by specific sources. Ozone is created by sunlight acting on NOx and VOC in the air. There are thousands of types of sources of these gases. Some of the common sources include gasoline vapors, chemical solvents, combustion products of fuels, and consumer products.”
http://www3.epa.gov/airtrends/aqtrnd95/o3.html
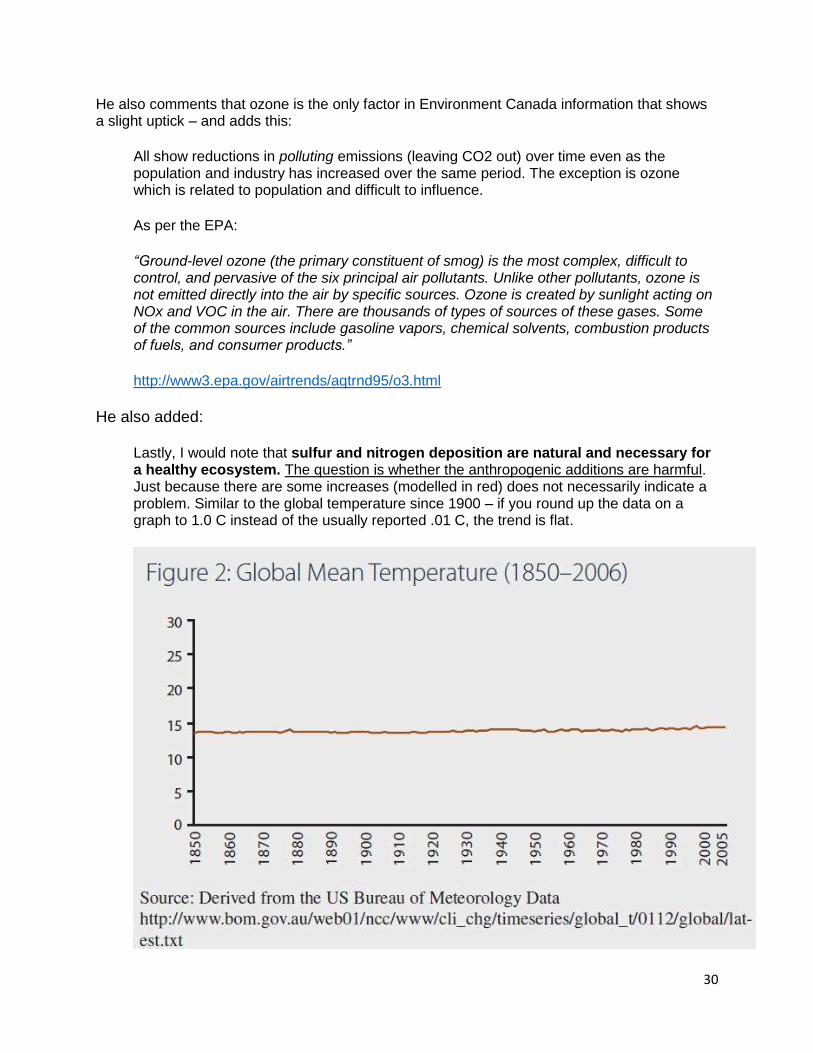
He also added:
Lastly, I would note that sulfur and nitrogen deposition are natural and necessary for a healthy ecosystem. The question is whether the anthropogenic additions are harmful. Just because there are some increases (modelled in red) does not necessarily indicate a problem. Similar to the global temperature since 1900 – if you round up the data on a graph to 1.0 C instead of the usually reported .01 C, the trend is flat.
31
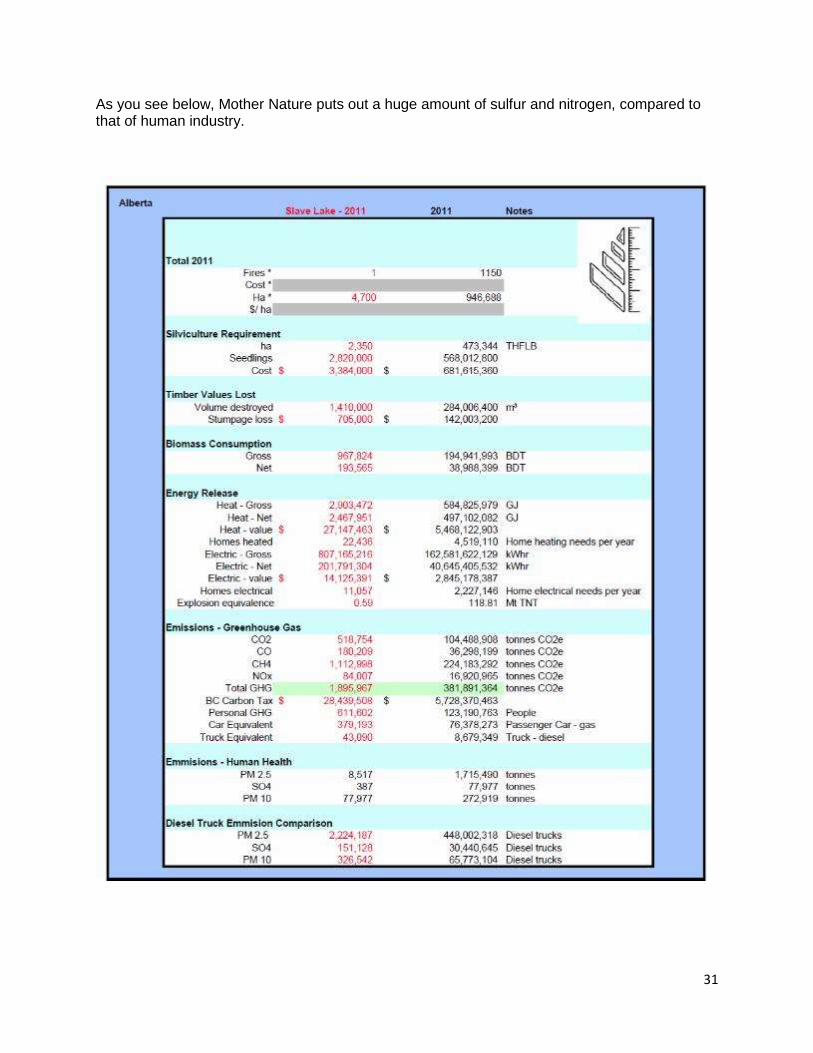
As you see below, Mother Nature puts out a huge amount of sulfur and nitrogen, compared to that of human industry.

32

33
ENVIRONMENT CANADA DATA:
https://www.ec.gc.ca/indicateurs-indicators/default.asp?lang=en&n=307CCE5B-1
Atlantic

34
Southern Quebec
Southern Ontario

35
Prairies and Northern Ontario
The line chart shows the average concentration of sulphur dioxide in the air in the Prairies and northern
Ontario from 1998 to 2012. In 2012, the annual average concentration of sulphur dioxide in outdoor air
was 0.6 parts per billion, or 14 percent lower than in 2011. A declining trend was detected from 1998 to
2012, representing a decrease of 68 percent (or an average decrease of 4.8 percent per year) over that
period.