rd-5th GRADE STUDENTS CATEGORIZED BY ORAL READING … Christi.pdf · ORAL READING FLUENCY 7 ......
37
ORAL READING FLUENCY 1 Running Head: ORAL READING FLUENCY RELATIONSHIP BETWEEN 3 rd -5 th GRADE STUDENTS CATEGORIZED BY ORAL READING FLUENCY PERCENTILE RANK AND MISSOURI COMMUNICATION ARTS ACHIEVEMENT LEVEL By Christi Rice Submitted to The Faculty of the Educational Specialist Program Northwest Missouri State University Department of Educational Leadership College of Education and Human Services Maryville, MO 64468 Field Study Committee Members Dr. Phil Messner Submitted in Fulfillment for the Requirements for 61-724 Field Study Spring 2012
Transcript of rd-5th GRADE STUDENTS CATEGORIZED BY ORAL READING … Christi.pdf · ORAL READING FLUENCY 7 ......
ORAL READING FLUENCY 1
Running Head: ORAL READING FLUENCY
RELATIONSHIP BETWEEN 3rd
-5th
GRADE STUDENTS CATEGORIZED BY ORAL
READING FLUENCY PERCENTILE RANK AND MISSOURI COMMUNICATION ARTS
ACHIEVEMENT LEVEL
By
Christi Rice
Submitted to
The Faculty of the Educational Specialist Program
Northwest Missouri State University
Department of Educational Leadership
College of Education and Human Services
Maryville, MO 64468
Field Study Committee Members
Dr. Phil Messner
Submitted in Fulfillment for the Requirements for
61-724 Field Study
Spring 2012

ORAL READING FLUENCY 2
ABSTRACT
This study was conducted to analyze the connection between oral reading fluency
percentile ranks and students’ communication arts state assessment scores in grades 3, 4,
and 5. Oral reading fluency percentile rankings for 1845 cases in School District XYZ
were compared to the achievement levels earned on the Missouri Communication Arts
MAP test over a three year time span. Results were interpreted using chi-square analysis.
Findings show that there is a significant difference in student Communication Arts
achievement levels when categorized by the oral reading fluency percentile rank.
Implications from this study suggest a continued focus on fluency in the literacy
block at all levels. Schools in District XYZ may consider using spring fluency data to
predict the percentage of students who will score advanced or proficient on the
Communication Arts assessment each year. Monitoring the fall and winter benchmark
data could assist schools in identifying students who are likely and unlikely to score
proficient each year. Specific instruction and practice routines in the classroom would
assist students in increasing their reading rate and accuracy.
ORAL READING FLUENCY 3
TABLE OF CONTENTS
ABSTRACT………………………………………………………………………2
LIST OF TABLES………………………………………………………………..5
LIST OF FIGURES……………………………………………………………….6
CHAPTER ONE: INTRODUCTION TO THE STUDY…………………………7
Introduction
Background, Issues and Concerns
Practice Under Investigation
School Policy
Conceptual Underpinnings for the Study
Statement of the Problem
Purpose of Study
Research Questions
Null Hypotheses
Anticipated Benefits of Study
Definition of Terms
CHAPTER TWO: REVIEW OF RELATED LITERATURE…………………….11
Oral Reading Fluency Defined
Fluency Instruction
Fluency Connected to Comprehension
Oral Reading Fluency Assessment
Analyzing Fluency Data
Conclusion

ORAL READING FLUENCY 4
CHAPTER THREE: RESEARCH DESIGN AND METHODOLOGY…………20
Field Study Methods
Research Design
Study Group Description
Data Collection Methods and Instrumentation
Statistical Data Analysis
CHAPTER FOUR: PRESENTATION AND ANALYSIS OF DATA…………..23
Presentation of the Data Analysis
CHAPTER FIVE: OVERVIEW, FINDINGS, AND RECOMMENDATIONS…32
Discussion of Findings
Conclusions
Recommendations
REFERENCES…………………………………………………………………..35

ORAL READING FLUENCY 5
LIST OF TABLES
Table 4-1: Summary of Chi Square Analysis Results Fluency and MAP Raw Data
Grades 3,4,5……………………………………………………… …………………...……23
Table 4-2: Summary of Chi Square Analysis Results Fluency and MAP Raw Data
Grade 3………………………………………………………………………………………23
Table 4-3: Summary of Chi Square Analysis Results Fluency and MAP Raw Data
Grade 4………………………………………………………………………………………24
Table 4-4: Summary of Chi Square Analysis Results Fluency and MAP Raw Data
Grade 5………………………………………………………………………………………24
Table 4-5: Summary of Chi Square Analysis Results Fluency and MAP Percentages
Grades 3,4,5 ……………………………………………………………………………..….27
Table 4-6: Summary of Chi Square Analysis Results Fluency and MAP Percentages
Grade 3 …………………………………………………………………………………..…27
Table 4-7: Summary of Chi Square Analysis Results Fluency and MAP Percentages
Grade 4 …………………………………………………………………………………..…27
Table 4-8: Summary of Chi Square Analysis Results Fluency and MAP Percentages
Grade 5 …………………………………………………………………………………..…28
Table 4-9: Summary of Chi Square Analysis Results Grade Level Comparison
Adv/Prof ………………………..………………………………………………………..…30

ORAL READING FLUENCY 6
LIST OF FIGURES
Figure 4-1: Number of Students Scoring Proficient/Advanced Categorized by Percentile Rank
Grades 3,4,5………………………………………………………………………….………25
Figure 4-2: Number of Students Scoring Proficient/Advanced Categorized by Percentile Rank
Grade 3………………………………………………………………………………………25
Figure 4-3: Number of Students Scoring Proficient/Advanced Categorized by Percentile Rank
Grade 4………………………………………………………………………………………26
Figure 4-4: Number of Students Scoring Proficient/Advanced Categorized by Percentile Rank
Grade 5………………………………………………………………………………………26
Figure 4-5: Percent of Students Scoring Proficient/Advanced Categorized by Percentile Rank
Grades 3,4,5 ……………………………………………………………………………..…28
Figure 4-6: Percent of Students Scoring Proficient/Advanced Categorized by Percentile Rank
Grade 3 …………………………………………………………………………………..…29
Figure 4-7: Percent of Students Scoring Proficient/Advanced Categorized by Percentile Rank
Grade 4 …………………………………………………………………………………..…29
Figure 4-8: Percent of Students Scoring Proficient/Advanced Categorized by Percentile Rank
Grade 5 …………………………………………………………………………………..…30
Figure 4-9: Advanced/Proficient Grade Level Comparisons Categorized by Percentile Rank
Grades 3,4,5 and combined ……………………………………………………………..…31

ORAL READING FLUENCY 7
CHAPTER ONE
INTRODUCTION TO THE STUDY
Introduction
This study examines the correlation between oral reading fluency rates and the effect
on standardized test proficiency. The goal of the study is to determine if students
whose oral reading rate is in the 75th
percentile are more likely to score advanced or
proficient on the Missouri communication arts assessment. ABC Elementary
administration would like to use the AIMSweb reading fluency report to predict the
adequate yearly progress percent. The three year data set for 3rd
-5th
graders was
collected in all three elementary buildings of the XYZ School District.
The report contains the following elements: 1) Background, issue and concerns, 2)
Practice Under Investigation, 3) School Policy, 4) Conceptual Underpinnings, 5)
Statement of the Problem, 6) Purpose of the Study, 7) Research Questions, 8) Null
Hypothesis, 9) Benefits of the Study, 10) Review of Literature, 11) Research
Methods, 12) Findings, 13) Conclusion, and 14) Recommendations.
Background, issues and concerns.
Research supports a focus on oral reading fluency as a component of balanced
literacy. Fluency combines rate, accuracy, expression, and phrasing to create structure
that mirrors spoken language. Due to the ability to measure rate and accuracy quickly,
easily, and objectively, teachers may focus on these aspects more than expression and
phrasing. Many students who read for speed begin to lose meaning because they are
not monitoring their comprehension to display expression. Reading without
expression or attention to punctuation denotes inadequate comprehension. Since

ORAL READING FLUENCY 8
comprehension is the outcome of reading, a student lacking the ability to formulate
meaning while reading will neither gain knowledge nor enjoy the task of reading.
Practice Under Investigation
Administration in district XYZ would like to increase students’ oral reading fluency
to improve reading comprehension. It is desirable to maintain at least 80% of students
reading at a rate that is commensurate with those above the 25th
percentile as
measured by the AIMSweb oral reading fluency probes and national norms. Students
who fall below the 25th
percentile receive tiered support of reading intervention.
Missouri measures communication arts achievement using the MAP assessment each
spring. ABC Elementary examines reading fluency scores for all students, increasing
instruction and practice to give students the best chance of scoring in the Advanced or
Proficient achievement levels on the test.
Conceptual Underpinnings
Reading fluency is a critical element of reading development and includes appropriate
rate, phrasing, and expression related to meaning. Comprehension of the text cannot
be sacrificed as students increase their rate. Calling words rapidly without attention to
meaning will damage actual reading development.
Statement of the Problem
It is unknown whether reading rates in the 75th
percentile and above give students a
greater chance of scoring proficiently on the Missouri MAP Communication Arts
assessment.
Purpose of the Study
ORAL READING FLUENCY 9
The purpose of this study was to determine if oral reading fluency percentile rank
predicts MAP achievement level.
Research Questions
The following research questions were constructed to investigate the problem.
RQ1: What percent of students in each percentile rank of the oral reading fluency
R-CBM score Advanced or Proficient on the MAP test?
RQ2: Is there a difference between student Communication Arts MAP test
proficiency levels when categorized by oral reading fluency rates?
Null Hypothesis alpha level
There is no difference between the proficiency levels on the Communication Arts
MAP test when categorized by the oral reading fluency rates. The alpha level is 0.05.
Anticipated Benefits of the Study
Schools may be able to predict the percent of students that will score Advanced or
Proficient on the Communication Arts MAP test based on students’ spring Reading-CBM
scores.
Definition of Terms
Oral reading fluency: the ability to read text with appropriate rate, phrasing, and
expression
Curriculum-based measurement: measure of achievement that aligns with national
curriculum for a particular grade level
R-CBM: Oral reading curriculum-based measurement
Intervention: intensified instruction additional to core instruction, addressing specific
skills in any content area.

ORAL READING FLUENCY 10
CHAPTER TWO
Review of Literature
ORAL READING FLUENCY 11
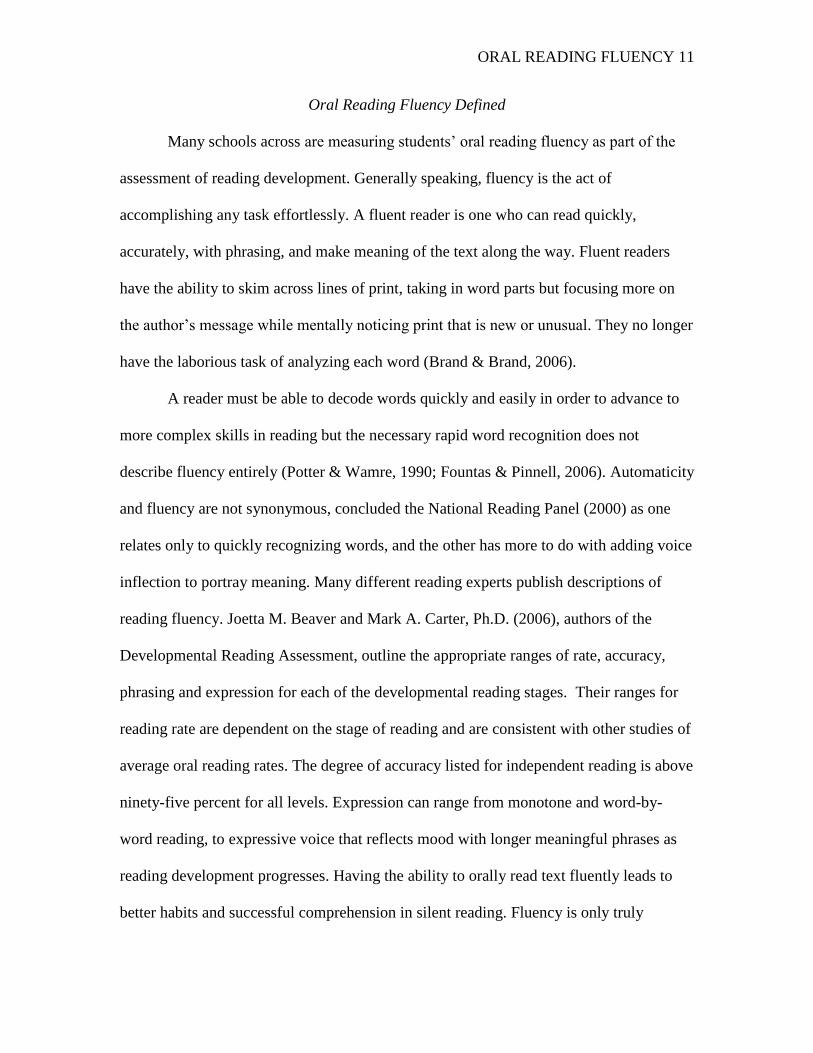
Oral Reading Fluency Defined
Many schools across are measuring students’ oral reading fluency as part of the
assessment of reading development. Generally speaking, fluency is the act of
accomplishing any task effortlessly. A fluent reader is one who can read quickly,
accurately, with phrasing, and make meaning of the text along the way. Fluent readers
have the ability to skim across lines of print, taking in word parts but focusing more on
the author’s message while mentally noticing print that is new or unusual. They no longer
have the laborious task of analyzing each word (Brand & Brand, 2006).
A reader must be able to decode words quickly and easily in order to advance to
more complex skills in reading but the necessary rapid word recognition does not
describe fluency entirely (Potter & Wamre, 1990; Fountas & Pinnell, 2006). Automaticity
and fluency are not synonymous, concluded the National Reading Panel (2000) as one
relates only to quickly recognizing words, and the other has more to do with adding voice
inflection to portray meaning. Many different reading experts publish descriptions of
reading fluency. Joetta M. Beaver and Mark A. Carter, Ph.D. (2006), authors of the
Developmental Reading Assessment, outline the appropriate ranges of rate, accuracy,
phrasing and expression for each of the developmental reading stages. Their ranges for
reading rate are dependent on the stage of reading and are consistent with other studies of
average oral reading rates. The degree of accuracy listed for independent reading is above
ninety-five percent for all levels. Expression can range from monotone and word-by-
word reading, to expressive voice that reflects mood with longer meaningful phrases as
reading development progresses. Having the ability to orally read text fluently leads to
better habits and successful comprehension in silent reading. Fluency is only truly

ORAL READING FLUENCY 12
achieved when the accuracy, speed, and expression are matched with good
comprehension (Rasinski, 2003).
Fluency Instruction
At one time in history, oral reading was essential. Not many people could read or
had access to books. The continuance of stories and information relied on word of mouth.
Orators had to rehearse to correctly provide the public with access to the printed word.
Today, books and print are prevalent in society and most individuals can read. While
some may read silently for pleasure, there are still pertinent reasons for oral recitation.
Actors learn to read lines from scripts with fluency. Politicians must read speeches
fluently in front of large audiences. Parents and teachers also have opportunity to read
fluently to children at home and in the classroom. (Fountas & Pinnell, 2006)
In 2003, The Partnership for Reading published a second edition report of the
National Reading Panel’s findings and conclusions, stating that fluency should be one of
the five areas of reading instruction. The Panel also listed phonemic awareness, phonics,
vocabulary and text comprehension as the other major areas of instruction important to
reading development. Anytime students are not automatic at recognizing words in text,
fluency instruction is needed (Armbruster, Lehr, & Osborn, 2003). Other indications that
a reader needs fluency instruction include: more than ten percent word recognition errors,
the student cannot read with expression, and/or the comprehension is poor. Several
instructional techniques are effective for increasing a student’s oral reading fluency.
Reading proficiency increases with effective instructional strategies and plenty of
practice (Rasinski & Padak, 2011).

ORAL READING FLUENCY 13
In the area of word identification, phonics and fluency should be critical elements
of early literacy instruction and practice. Edward Fry (1998) categorized several hundred
word families that could be taught as part of phonics instruction, aiding students in
reading many one syllable and multisyllabic words accurately and efficiently. These word
families are based upon phoneme chunks most frequently found in the English language.
Recognizing these phonemes on sight aides the reader in his ability to skim the text
quickly without individual word analysis.
The most effective instructional techniques for improving a child’s oral reading
rate include repeated oral reading of text and teachers modeling fluent reading. This
needs to be followed up with the teacher supplying voice support to students as they
practice. Instruction that will improve fluency includes repeated oral reading of texts.
Activities such as chorally reading poems, songs, plays, and speeches, are noted for being
authentic forms of fluency practice. (Kuhn & Stahl, 2000; NICHD, 2000; Rasinski, 2003;
Rasinski & Hoffman, 2003)
In addition to increasing the rate at which students accurately read and the ability
to use expression and phrasing, there are many more reasons to incorporate oral reading
practices in the classroom. Students begin to have a desire to read because the texts they
encounter invoke a range of human emotions, and it becomes desirable to share that
experience with others. Students also learn that performing literary works for others is an
enjoyable form of communication. They develop the connection between what is written,
what is read, and what is spoken. Their listening vocabulary and comprehension
increases. They learn to pronounce new words correctly and build word meaning,
increasing their ability to understand idioms through context clues. Oral reading practice

ORAL READING FLUENCY 14
builds confidence for speaking aloud to others, especially original or important
information. The exposure to a variety of print incorporates the typographical cues in text
to the spoken word, indicating meaning for the reader (Opitz & Rasinski,1998;
Armbruster, Lehr, & Osborn, 2003).
In order for fluency practice to be effective at increasing the rate and accuracy, as
well as improving expression and the ability to derive meaning from the text, the
passages need to be selected carefully to match the reader’s current abilities. If the text is
too difficult, the reader feels frustration and fails to experience any growth or
improvement. If the passage contains words that the student mostly knows or can easily
decode, the text is determined to be at the independent level for the child. The
independent level texts selected should be ones that the student can read with about 95%
accuracy (Armbruster, Lehr, & Osborn, 2003). Using a short reasonable selection, a
record of oral reading assessment can help a teacher determine the accuracy rate for a
particular student and analyze reading behaviors that the student is currently exhibiting.
Matching appropriate leveled texts to student abilities yields the most effective practice
results (Beaver, 2006).
It seems logical that most students who read more often become more fluent
readers. Additional practice allows readers to recognize words more accurately and read
quickly with more expression and better comprehension. Students become more
confident and begin a cycle of reading for enjoyment (Binkley, 1989; Dowhower, 1987,
1994; Rasinski & Hoffman, 2003; Samuels, 1979).

ORAL READING FLUENCY 15
Fluency Connected to Comprehension
Students who cannot read and process text quickly enough to learn new content
and master grade level knowledge fall behind and are at risk of grade level retention in
many schools. The growing number of students who are either retained or do not meet
proficiency standards puts the United States at risk of creating a larger number of citizens
that are limited in their earnings potential as adults and wind up in the poverty cycle
(Fiester & Foundation, 2010).
The prediction of this reading failure begins early in the child’s educational
career. A recent study sponsored by the U.S. Department of Education found 4th
grade
students’ oral reading fluency to be a strong predictor of silent reading comprehension. It
is common for students who have word decoding and fluency deficits to experience
problems comprehending what they read and lag behind their peers in overall reading
achievement. The strong correlation between fluency and comprehension is why it is
imperative to focus instruction of fluency (Allington,1983; Rasinski, 2003).
Several processes must be present to ensure that comprehension occurs. Children
need to be able to use the semantic, syntactic, and graphophonic cues of text quickly and
accurately to identify known and unknown words. Readers who heed punctuation clues
and know when to pause gain understanding as they read. They use context clues to
maintain meaning as they read. They also use reading comprehension strategies like
predicting, confirming, and self-correcting to monitor their understanding. As they move
from oral to silent reading children need to be able to make sense of the text, remember
information or story plot and recall information upon demand (Brand & Brand, 2006;
Clay, 1991; Opitz & Rasinski, 1998)
ORAL READING FLUENCY 16
As readers advance in their skill of reading fluently, they are also better able to
think critically about text. Many standardized comprehension tests have questions that
ask the student to evaluate the quality and consider the author’s purpose or point of view.
One highly effective reading strategy is making connections. This strategy calls for
readers to connect what they read in the text to their own schema , other texts, and the
world around them. They can draw upon past experiences to reason about characters’
actions and the intended message of the author. Disfluent readers are not able to think this
critically since their efforts of reading focus on decoding. Once fluency is disrupted, so is
understanding. (Fountas & Pinnell, 2006, 2011).
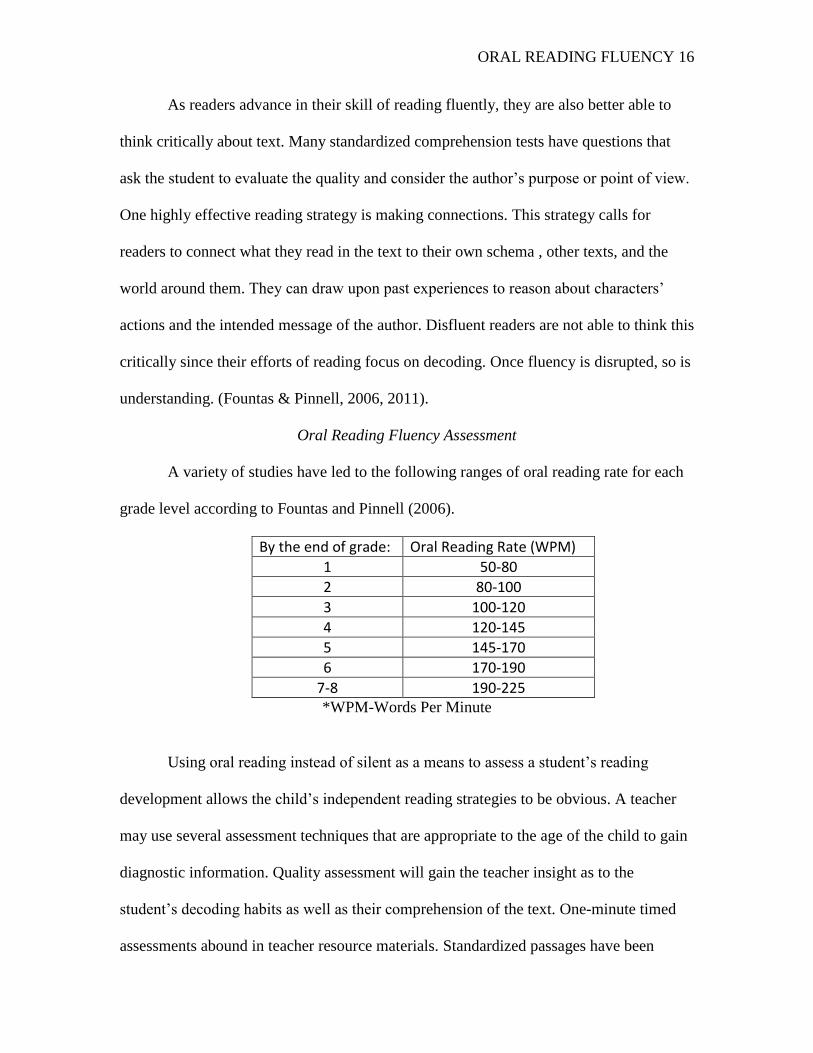
Oral Reading Fluency Assessment
A variety of studies have led to the following ranges of oral reading rate for each
grade level according to Fountas and Pinnell (2006).
By the end of grade: Oral Reading Rate (WPM)
1 50-80
2 80-100
3 100-120
4 120-145
5 145-170
6 170-190
7-8 190-225 *WPM-Words Per Minute
Using oral reading instead of silent as a means to assess a student’s reading
development allows the child’s independent reading strategies to be obvious. A teacher
may use several assessment techniques that are appropriate to the age of the child to gain
diagnostic information. Quality assessment will gain the teacher insight as to the
student’s decoding habits as well as their comprehension of the text. One-minute timed
assessments abound in teacher resource materials. Standardized passages have been

ORAL READING FLUENCY 17
developed which closely resemble grade level reading material. Common sources for
these are DiBELS and AIMSweb curriculum based measurements (CBM). By using
thousands of real student scores, norms are established and published in percentile rank
so teachers may compare their own students’ results to those of students across the
country. Each year the national norms are updated to reflect the scores that have been
reported from schools using the probes. (Learning, 2008; Shinn & Shinn, 2002; Opitz &
Rasinski, 1998). (McTighe, 2002)
Analyzing Fluency Data
The researcher’s school, as a professional learning community, organizes grade
level teams to review and analyze the oral reading fluency data. In the Failure is Not an
Option video series, Jay McTighe (2002) suggests that the most effective way to work
with data is to have grade level or department teams meet and analyze student work,
sharing the responsibility for success with all team members. Teams must have some
form of common formative assessment data available to monitor the learning of each
student. Clear standards of proficiency must be communicated to all teachers to that each
student is measured equally. Some system of timely information regarding the student
learning needs to be available to teachers so they can identify those needing additional
support or instruction (DuFour, DuFour, Eaker & Karhanek, 2010).
The use of the AIMSweb curriculum based measurements for data review is
pertinent and useful data for teachers. The immediate feedback allows teachers to use
results to guide day-to-day instruction and see the effects of intervention. As teachers
select research-based practices and strategies for teaching reading they use the data from
ORAL READING FLUENCY 18
progress monitoring to gauge the effectiveness frequently and adjust instruction
(Blankstein, 2004).
A Response to Intervention program provides a school-wide structure for
identifying students who are not fluent readers. Once students are screened and scores are
compared to norms for the age groups represented in the school, school resources can be
allocated into three tiers of support.
Tier 1, or level one, is support that occurs in the classroom, generally within core
instruction. Guided reading lessons address fluency issues as needed for students.
Interventions are put in place as soon as a student seems to struggle with the general
classroom instruction. Approximately 80-85% of students will have their instructional
needs met at this level.
Tier 2, or level two, is more tailored to the unique needs of the learners. These
interventions are reserved for students who do not succeed with the instruction or
intervention provided in Tier 1. Students may be grouped by similar need after some
diagnostic screening determines the skill deficits. Generally, about 10-15% of the
students need this form of specific intervention to be successful.
Tier 3, or level three, is the most intense of the three levels. Only 3-5% of
students in an average school might need this type of structured academic support. The
time or intensity of instruction is increased at this level to meet the chronic or severe
delay in academic progress.
Students in tiers 2 and 3 are progress monitored up to twice weekly to determine
if the intervention is effective. Classroom teachers and interventionists analyze the scores
and trend lines of scores relative to the student’s goals to decide on a course of action. A

ORAL READING FLUENCY 19
change of intervention strategy might be needed or an increase of intervention time might
be in order if the student is not making adequate progress in oral reading fluency (Wright,
2007).
Conclusion
At the time of this research, each state has its own testing program, aligned to
state derived learning standards for key subjects and grade levels. Each is required to
administer a state test annually. The federal No Child Left Behind Act requires all states
to assess virtually all students in grades 3 through 8 and at least one high school grade.
State tests vary widely in their degree of difficulty and format but all are considered high
stakes tests because the results hold school districts accountable for the progress by
appropriating funding and sanctions according to the comparison of scores to the
mandated adequate yearly progress. Adoption of the Common Core State Standards by
most states in the country will create more of an alignment in expectations across the
country. Each state will still devise its own assessment. A new wave of accountability
will match up with the revised state assessment when the student growth model begins to
be used by states to evaluate teacher effectiveness. The need to monitor student progress
in reading and predict success on the state assessment may become imperative, as
teachers are personally held accountable for student achievement measured by a reading
comprehension test (Chudowsky, Chudowsky, & Center on Education, 2010).

ORAL READING FLUENCY 20
CHAPTER THREE
RESEARCH DESIGN AND METHODOLOGY
Research Method
The following research methods were used to investigate the research questions stated
above. The methods of 1) research design, 2) study group identification, 3) data
collection and instrumentation, and 4) statistical analysis are described below.
Research Design
A group comparison post-post experimental study between students’ oral reading
fluency score categories and their CA MAP achievement level was used to investigate the
research questions stated above. The research design involves two nominal variables; the
independent variable being the rank of oral reading rate and the dependent variable is the
MAP achievement level categorized into 1) Basic and Below Basic and 2) Proficient and
Advanced. The study compares how each percentile rank performs on the CA MAP post
test. Comparative research was conducted using a chi square to analyze the significance
of the correlation between the oral reading fluency percentile rank and the MAP
achievement level.
Study Group Description
This study includes 1847 student cases; fluency and state assessment scores from 3rd
, 4th
,
and 5th
graders enrolled in a suburban Missouri school district with three elementary
buildings. Elementary ABC educates approximately 600 students annually, 92% of which
are Caucasian, with a total school Free and Reduced-price lunch rate of 42.1%. Total
enrollment for Elementary JKL is approximately 400 students, 88% Caucasian, with a
Free and Reduced-price lunch rate of 58.4%. Elementary QRS has an average enrollment

ORAL READING FLUENCY 21
of approximately 275 students, 93% Caucasian, and the Free and Reduced-price lunch
rate is currently 34.7%.
Data Collection Methods and Instruments to be Used
Each spring, students in 3rd
, 4th
, and 5th
grade are assessed with the Communication Arts
MAP test. The test is a written assessment of reading comprehension and language arts
mastery and is administered in 3 sessions. The same students are also assessed on their
oral reading fluency through a reading curriculum based measurement. This assessment
requires students to read each of three passages aloud for one minute apiece. The rate and
accuracy of oral reading are calculated by counting the number of words read correctly
per minute by the teacher administering the test. The scores of the oral reading CBM are
uploaded into the Aimsweb data management system which then rank orders the scores
from highest to lowest. Data charts are produced for each grade level at the building site.
The AIMSweb aggregate norms chart determines which scores fall into several percentile
ranks by comparing benchmark scores of all students who have been assessed and have
data entered into the system. Building principals granted with written permission access
to the CA MAP scores from the Missouri Department of Elementary and Secondary
Education website and the AIMSweb database for spring oral reading fluency scores for
all 3rd
, 4th
, and 5th
grade students for three years, 2009-2011. Data was kept in a locked
computer throughout the study.
Statistical analysis methods used
For RQ1 I will do a percentage chart showing the frequency of Advanced and
Proficient scores on the MAP test for each percentile rank of oral reading fluency.
ORAL READING FLUENCY 22
For RQ2 I will submit a chi square analysis describing the significance of
difference between students’ Communication Arts MAP test proficiency level when
categorized by oral reading fluency rates.

ORAL READING FLUENCY 23
CHAPTER FOUR
PRESENTATION AND ANALYSIS
Presentations of the Data Analysis
The following tables reveal the raw data for grades 3,4, and 5 combined (see Table 4-1),
grade 3 individually (see Table 4-2), grade 4 individually (see Table 4-3), and grade 5
individually (see Table 4-4). The tables reveal the number of students scoring advance or
proficient within each percentile rank along with the number of students scoring basic or
below basic within each percentile rank. Each table also gives the total number of
participants within the entire study and within each percentile rank.
Table 4-1
Table 4-2
Grades 3,4 and 5 Raw Data Advanced/Proficient Basic/Below Basic Total Below 25th %ile 7 189 196 25th -49th %ile 57 224 281 50th-74th %ile 183 309 492 75th-89th %ile 306 163 469 90th-100th %ile 356 53 409
Total 909 938 1847 p-Value 1.13667E-121
Grades 3 Raw Data Advanced/Proficient Basic/Below Basic Total Below 25th %ile 1 63 64 25th -49th %ile 17 72 89 50th-74th %ile 52 109 161 75th-89th %ile 102 64 166 90th-100th %ile 107 21 128
Total 279 329 608 p-Value 2.21075E-37
ORAL READING FLUENCY 24
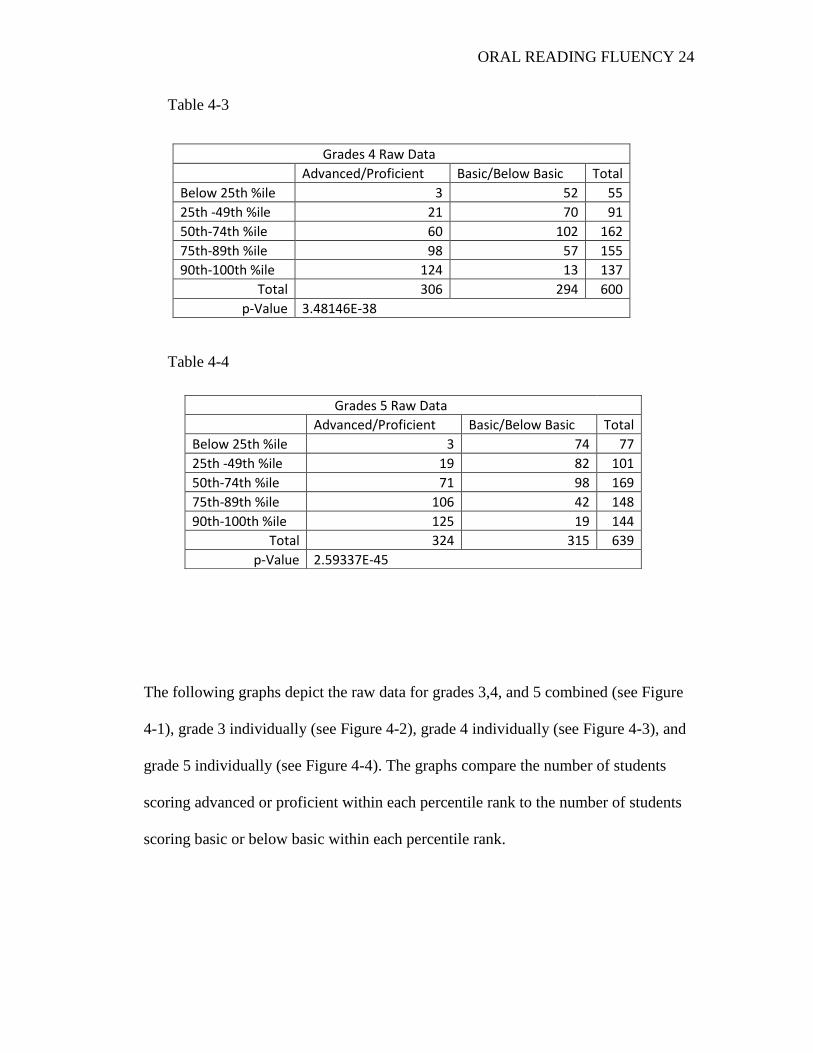
Table 4-3
Table 4-4
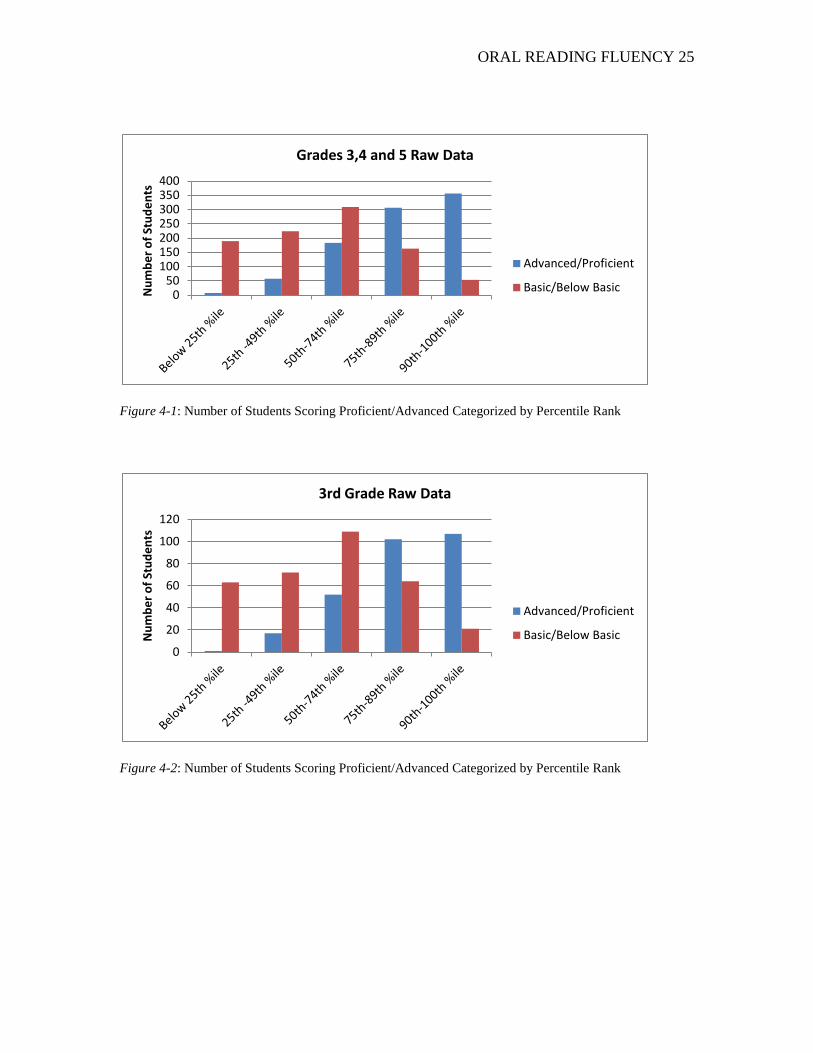
The following graphs depict the raw data for grades 3,4, and 5 combined (see Figure
4-1), grade 3 individually (see Figure 4-2), grade 4 individually (see Figure 4-3), and
grade 5 individually (see Figure 4-4). The graphs compare the number of students
scoring advanced or proficient within each percentile rank to the number of students
scoring basic or below basic within each percentile rank.
Grades 4 Raw Data Advanced/Proficient Basic/Below Basic Total Below 25th %ile 3 52 55 25th -49th %ile 21 70 91 50th-74th %ile 60 102 162 75th-89th %ile 98 57 155 90th-100th %ile 124 13 137
Total 306 294 600 p-Value 3.48146E-38
Grades 5 Raw Data Advanced/Proficient Basic/Below Basic Total Below 25th %ile 3 74 77 25th -49th %ile 19 82 101 50th-74th %ile 71 98 169 75th-89th %ile 106 42 148 90th-100th %ile 125 19 144
Total 324 315 639 p-Value 2.59337E-45
ORAL READING FLUENCY 25
Figure 4-1: Number of Students Scoring Proficient/Advanced Categorized by Percentile Rank
Figure 4-2: Number of Students Scoring Proficient/Advanced Categorized by Percentile Rank
050
100150200250300350400
Nu
mb
er
of
Stu
de
nts
Grades 3,4 and 5 Raw Data
Advanced/Proficient
Basic/Below Basic
0
20
40
60
80
100
120
Nu
mb
er
of
Stu
de
nts
3rd Grade Raw Data
Advanced/Proficient
Basic/Below Basic

ORAL READING FLUENCY 26
Figure 4-3: Number of Students Scoring Proficient/Advanced Categorized by Percentile Rank
Figure 4-4: Number of Students Scoring Proficient/Advanced Categorized by Percentile Rank
The following tables show the percentages for grades 3,4, and 5 combined (see Table
4-5), grade 3 individually (see Table 4-6), grade 4 individually (see Table 4-7), and
grade 5 individually (see Table 4-8). The tables show the percentage of students
scoring advanced or proficient within each percentile rank along with the percentage
0
20
40
60
80
100
120
140
Nu
mb
er
of
Stu
de
nts
4th Grade Raw Data
Advanced/Proficient
Basic/Below Basic
0
20
40
60
80
100
120
140
Nu
mb
er
of
Stu
de
nts
5th Grade Raw Data
Advanced/Proficient
Basic/Below Basic

ORAL READING FLUENCY 27
of students scoring basic or below basic within each percentile rank. The table also
gives the total percentage of advanced/proficient scores and basic/below basic scores
within the entire study.
Table 4-5
Table 4-6
Table 4-7
Grades 3,4 and 5 Percentages Advanced/Proficient Basic/Below Basic Total Below 25th %ile 3.6% 96.4% 100% 25th -49th %ile 20.3% 79.7% 100% 50th-74th %ile 37.2% 62.8% 100% 75th-89th %ile 65.2% 34.8% 100% 90th-100th %ile 87.0% 13.0% 100%
Total 49.2% 50.8% 100%
Grades 3 Percentages Advanced/Proficient Basic/Below Basic Total Below 25th %ile 1.6% 98.4% 100% 25th -49th %ile 19.1% 80.9% 100% 50th-74th %ile 32.3% 67.7% 100% 75th-89th %ile 61.4% 38.6% 100% 90th-100th %ile 83.6% 16.4% 100%
Total 45.9% 54.1% 100%
Grades 4 Percentages Advanced/Proficient Basic/Below Basic Total Below 25th %ile 5.5% 94.5% 100% 25th -49th %ile 23.1% 76.9% 100% 50th-74th %ile 37.0% 63.0% 100% 75th-89th %ile 63.2% 36.8% 100% 90th-100th %ile 90.5% 9.5% 100%
Total 51.0% 49.0% 100%
ORAL READING FLUENCY 28
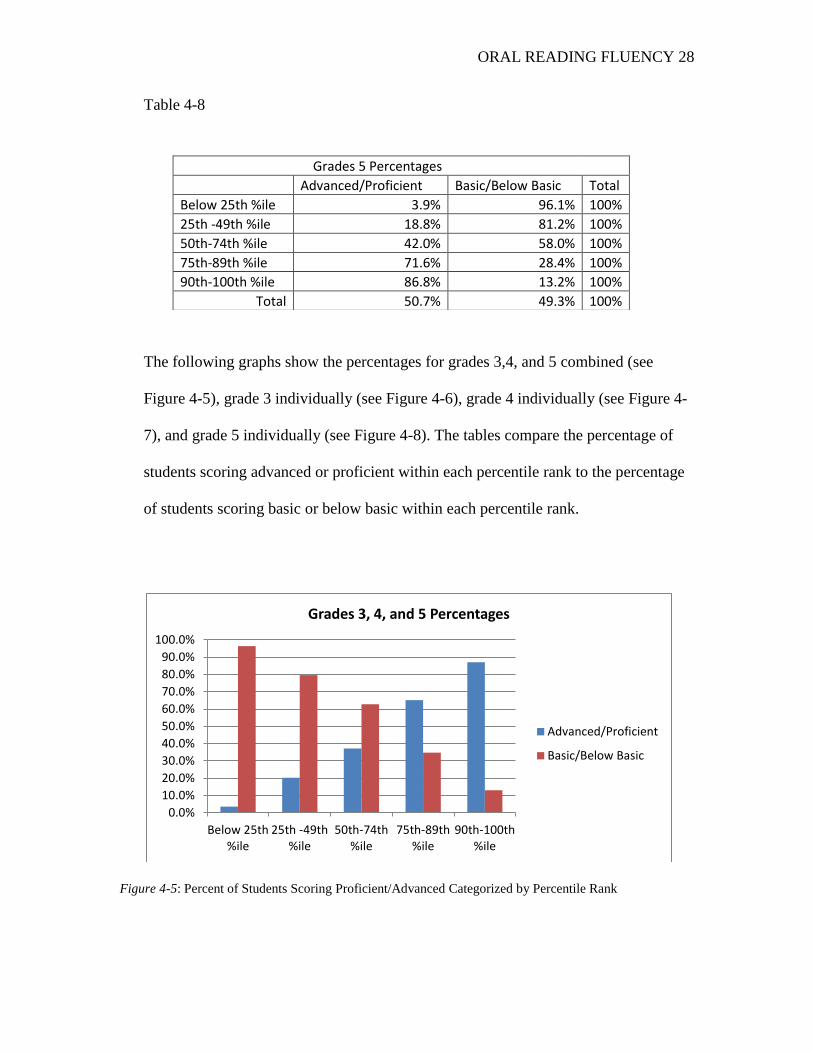
Table 4-8
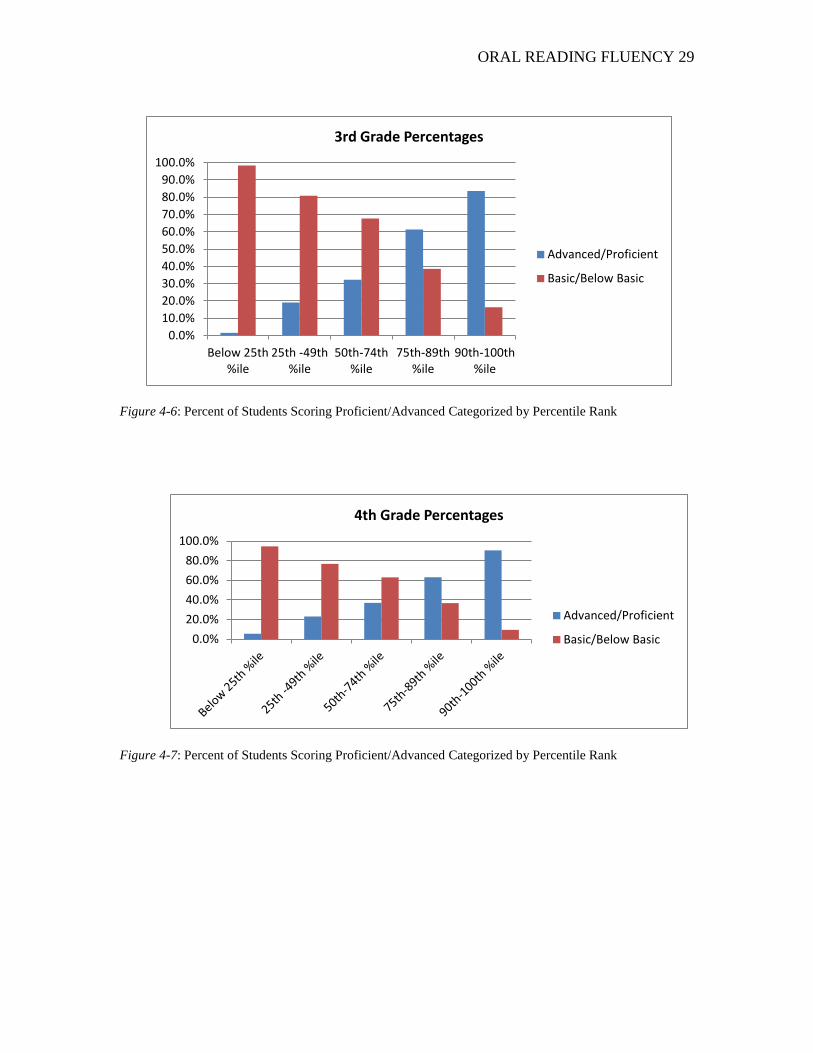
The following graphs show the percentages for grades 3,4, and 5 combined (see
Figure 4-5), grade 3 individually (see Figure 4-6), grade 4 individually (see Figure 4-
7), and grade 5 individually (see Figure 4-8). The tables compare the percentage of
students scoring advanced or proficient within each percentile rank to the percentage
of students scoring basic or below basic within each percentile rank.
Figure 4-5: Percent of Students Scoring Proficient/Advanced Categorized by Percentile Rank
0.0%
10.0%
20.0%
30.0%
40.0%
50.0%
60.0%
70.0%
80.0%
90.0%
100.0%
Below 25th%ile
25th -49th%ile
50th-74th%ile
75th-89th%ile
90th-100th%ile
Grades 3, 4, and 5 Percentages
Advanced/Proficient
Basic/Below Basic
Grades 5 Percentages Advanced/Proficient Basic/Below Basic Total Below 25th %ile 3.9% 96.1% 100% 25th -49th %ile 18.8% 81.2% 100% 50th-74th %ile 42.0% 58.0% 100% 75th-89th %ile 71.6% 28.4% 100% 90th-100th %ile 86.8% 13.2% 100%
Total 50.7% 49.3% 100%
ORAL READING FLUENCY 29
Figure 4-6: Percent of Students Scoring Proficient/Advanced Categorized by Percentile Rank
Figure 4-7: Percent of Students Scoring Proficient/Advanced Categorized by Percentile Rank
0.0%
10.0%
20.0%
30.0%
40.0%
50.0%
60.0%
70.0%
80.0%
90.0%
100.0%
Below 25th%ile
25th -49th%ile
50th-74th%ile
75th-89th%ile
90th-100th%ile
3rd Grade Percentages
Advanced/Proficient
Basic/Below Basic
0.0%
20.0%
40.0%
60.0%
80.0%
100.0%
4th Grade Percentages
Advanced/Proficient
Basic/Below Basic

ORAL READING FLUENCY 30
Figure 4-8: Percent of Students Scoring Proficient/Advanced Categorized by Percentile Rank
The following chart (see Table 4-9) compares percentages of students scoring
advanced or proficient in grades 3,4, and 5 at each percentile rank. The chart also lists
the combined advanced/proficient percentages for the three grades at each percentile
rank.
Table 4-9
Advanced/Proficient Grade Level Comparisons 3rd Grade A/P 4th Grade A/P 5th Grade A/P Combined Below 25th %ile 1.6% 5.5% 3.9% 3.6% 25th -49th %ile 19.1% 23.1% 18.8% 20.3% 50th-74th %ile 32.3% 37.0% 42.0% 37.2% 75th-89th %ile 61.4% 63.2% 71.6% 65.2% 90th-100th %ile 83.6% 90.5% 86.8% 87.0%
0.0%
20.0%
40.0%
60.0%
80.0%
100.0%
120.0%
Below 25th%ile
25th -49th%ile
50th-74th%ile
75th-89th%ile
90th-100th%ile
5th Grade Percentages
Advanced/Proficient
Basic/Below Basic

ORAL READING FLUENCY 31
The following graph (see Figure 4-9) compares percentages of students scoring
advanced or proficient in grades 3,4, and 5 at each percentile rank. The chart also
compares the combined grade level advanced/proficient percentages at each
percentile rank.
Figure 4-9: Advanced/Proficient Grade Level Comparisons Categorized by Percentile Rank
0.0%
10.0%
20.0%
30.0%
40.0%
50.0%
60.0%
70.0%
80.0%
90.0%
100.0%
Below 25th%ile
25th -49th%ile
50th-74th%ile
75th-89th%ile
90th-100th%ile
Advanced/Proficient Grade Level Comparisons
3rd Grade A/P
4th Grade A/P
5th Grade A/P
Combined

ORAL READING FLUENCY 32
CHAPTER 5
OVERVIEW, FINDINGS AND RECOMMENDATIONS
Discussion of Findings
Given that the chi square analysis yielded a p-value significantly less than 0.05 for
all data and subgroup data, the null hypothesis was rejected. There is a difference
between students’ Communication Arts MAP test proficiency levels when categorized by
oral reading fluency rates. In grades 3, 4, and 5, as the students’ oral reading rates
increase the Communication Arts MAP test proficiency levels increase as well. 65.2% of
the students in this study who read between the 75th
and 89th
percentile score proficient or
advanced on the Communication Arts MAP test. 87% of the students in the study who
read above the 90th
percentile scored proficient or advanced on the Communication Arts
MAP test.
Conclusions
The findings of this study are significant enough to warrant district XYZ to
continue to focus on fluency instruction in the elementary schools studied. The likelihood
that students will score proficient or higher on the Communication Arts MAP test
increases considerably once a student is able to read at a rate higher than the 50th
percentile rank.
A more detailed analysis of percentile rank could determine a precise level at
which there are more students scoring proficient and advanced than basic and below
basic on the MAP. Using the data from this study, we simply know that it falls
somewhere between the 50th
percentile and the 75th
percentile.
ORAL READING FLUENCY 33
A problem with this study is that it compares the MAP test as a silent reading
untimed comprehension test and the fluency percentile ranks that are based upon timed
oral reading rates. Students know they are not expected to retell or even monitor their
comprehension while reading which may encourage them to read much faster than they
would read silently on the MAP test. While the two tests are different in this manner, the
analysis shows that there is a correlation between how well a student reads aloud and
their performance on the state assessment.
Rasinski, Allington, and many other reading experts agree that reading fluency is
directly connected to comprehension. The National Reading Panel proposes fluency as a
critical element to literacy development. The intertwining relationship between the two
components should be nurtured and developed throughout elementary school.
Recommendations.
Fluency instruction has an important place in a balanced literacy program. Once
students become adept at decoding and can recognize most words automatically, it is
worth classroom instructional time to focus on training students to read at a faster than
average rate. The ability to read aloud quickly and accurately is likely to aid a student
when they are reading silently. While they may slow down or reread when reading
silently in a non-timed setting, the quick recall of words allows them the time to do so
during a test. Students who read faster cover more text. They are exposed to more words
and new vocabulary. Some classroom and homework time should be devoted to
increasing the capacity to read more text.

ORAL READING FLUENCY 34
Since the MAP test is a written comprehension test, the results of this study could
also prove that as reading fluency, including phrasing and expression improves, the
ability to understand and remember details from the text advances. Continued practice
using expression and correct phrasing orally transfers to silent reading as well.
Many Response to Intervention programs in schools offer tiered instruction for
three levels of support. District XYZ uses the national norm 25th
percentile as a cut score
for establishing tier two and three small group and intensive supports. Many of the
students who read above the 25th
percentile still need to have targeted, specific tier one
instruction and practice to cross into likelihood of proficiency on the MAP. A school may
be able to summarize oral reading fluency data in the spring and determine the percentage
of students who are likely to score proficient and advanced on the Communication Arts
MAP test. Monitoring the percentage of students who are on target for reading above the
50th
percentile throughout the year would help a school determine which students need
the continued support.
ORAL READING FLUENCY 35
References
Allington, R. (1983). The Reading Instruction Provided Readers of Differing Reading Ability.
Elementary School Journal , 83, 548-559.
Armbruster, B. B., Lehr, F., & Osborn, J. M. (2003). Put Reading First: The Research Building
Blocks for Teaching Children to Read. Jessup: Partnership for Reading.
Beaver, J. M. (2006). Developmental Reading Assessment K-3 Teacher Guide. Parsippany, NJ:
Celebration Press.
Beaver, J. M., & Carter, M. A. (2006). Developmental Reading Assessment 4-8. Parsippany , NJ:
Celebration Press.
Binkley, M. (1989). Becoming a nation of readers: What principals can do. Washington, D.C.:
U.S. Department of Education.
Blankstein, A. M. (2004). Failure Is Not An Option: Six Principles That Guide Student
Achievement in High-Performing Schools. Thousand Oaks, CA: Corwin Press.
Block, C. C., Parris, S. R., Reed, K. L., Whiteley, C. S., & Cleveland, M. D. (2009 йил May).
Instructional Approaches That Significantly Increase Reading Comprehension. Journal of
Educational Psychology , 262-281.
Brand, M., & Brand, G. (2006). Practical Fluency. Portland: Stenhouse.
Chudowsky, N., Chudowsky, V., & Center on Education, P. (2010). State Test Score Trends
Through 2008-09, Part 1: Rising Scores on State Tests and NAEP. Center on Education
Policy.
Clay, M. (1991). Becoming Literate: The Construction of Inner Control. Portsmouth, NH:
Heinemann.

ORAL READING FLUENCY 36
Development, N. I. (2000). Report of the National Reading Panel: teaching childen to Read: An
Evidence-Based Assessment of the Scientific Research Literature on Reading and Its
Implications for Reading Instruction: Reports of the Subgroups. Washington, D.C.: U.S.
Department of health and Human Services.
Dowhower, S. (1987). Effects of repeated reading on second-grade transitional readers' fluency
and comprehension. Reading Research Quarterly , 22 (4), 389-407.
Dowhower, S. (1994). Repeated reading revisited: Research into practice. Reading & Writing
Quarterly , 10 (4), 343-358.
DuFour, R., DeFour, R., Eaker, R., & Karhanek, G. (2010). Raising the Bar and Closing the
Gap: Whatever It Takes. Bloomington, IN: Solution Tree Press.
Fiester, L., & Foundation, A. E. (2010). Early Warning! Why Reading by the End of Third Grade
Matters. Annie E. Casey Foundation.
Fountas, C., I., & Pinnell, G. S. (2006). Teaching for Comprehending and Fluency. Portsmouth:
Heinemann.
Fry, E. (1998). The most common phonograms. The Reading Teacher , 51 (7), 284-289.
Kuhn, M., & Stahl, S. (2003). Fluency: A review of developental and remedial practices. Journal
of Educational Psychology , 95 (1), 3-21.
Learning, U. o. (2008 йил 14-August). DIBELS Data System. Retrieved 2012 йил 10-February
from History of DIBELS: www.dibels.uoregon.edu
McTighe, J. (2002). Failure is not an option. Failure is not an option . Bloomington, IN: HOPE
Foundation.
Opitz, M. F., & Rasinski, T. V. (1998). Good-bye Round Robin: Twenty-five Effective Oral
Reading Strategies. Portsmouth, NH: Heinemann.

ORAL READING FLUENCY 37
Paris, S., & Hoffman, J. (2004). Reading Assessments in Kindergarten through Third Grade:
Findings from the Center for the Improvement of Early Reading Achievement.
Elementary School Journal , 105 (2), 199-217.
Pinnell, G. S., & Fountas, I. C. (2011). The Continuum of Literacy Learning Grades PreK-8 A
Guide to Teaching (Second ed.). Portsmouth: Hienemann.
Potter, M., & Wamre, H. (1990). Curriculum based measurements and developmental reading
models: Opportunities for cross-validation. Exceptional Children , 57 (1), 16-25.
Rasinski, T. V. (2003). The Fluent Reader: Oral reading strategies for building word
recognition, fluency, and comprehension. New York, NY: Scholastic.
Rasinski, T. V., & Padak, N. (2011). Who Wants to Be a (Reading) Millionaire? The Reading
Teacher , 64 (7), 553-555.
Rasinski, T., & Hoffman, J. (2003). Oral reading in the school literacy curriculum. Reading
Research Quarterly , 38 (4), 510-522.
Raskinski, T., Rupley, W. H., & Nichols, W. D. (2008). Two essential ingredients: Phonics and
fluency getting to know each other. The Reading Teacher , 62 (3), 257-260.
Samuels, S. (1979). The method of repeated readings. The Reading Teacher , 32 (4), 403-408.
Shinn, M. M., & Shinn, M. R. (2002). AIMSweb Training Workbook: Administration and
scoring of reading curriculum-based measurement(R-CBM) for use in general outcome
measurement. NCS Pearson.
Wright, J. (2007). RtI Toolkit: A Practical Guide for Schools. Port Chester, NY: Dude
Publishing.