RCRA FACILITY INVESTIGATION (RFI) REPORT OF FINDINGS …
27
RCRA FACILITY INVESTIGATION (RFI) REPORT OF FINDINGS PHASE II For Person Generating Station Hazardous Waste Storage Facility -Natural Pit Area (NMT360010342) August 28, 1990
Transcript of RCRA FACILITY INVESTIGATION (RFI) REPORT OF FINDINGS …

RCRA FACILITY INVESTIGATION (RFI) REPORT OF FINDINGS
PHASE II
For Person Generating Station Hazardous Waste Storage Facility -Natural Pit Area
(NMT360010342)
August 28, 1990

TABLE OF CONTENTS
Chapter and Description
1.0 2.0
3.0
4.0
5.0
6.0
Certification Statement
Introduction ...... . Departures From RFI Workplan 2.1 EPA Revisions ..... 2.2 EPA Revisions for Phase II 2.3 Procedural Revisions Description of Sampling Activities 3.1 Sampling Objective 3.2 Sampling Team .. 3.3 Soil Descriptions 3.4 Sample Collection and Preservation 3.5 Quality Assurance Data Results ..... 4.1 Heavy Metals Analysis Findings . . . . . . . 5.1 Heavy Metals .... 5.2 Quality Assurance .. Additional Action and Conclusions 6.1 TCLP Analysis .. . 6.2 Conclusions ........ .
Appendix A. EPA RFI Workplan Approval Letters
Exhibit Exhibit Exhibit Exhibit
1. 2. 3. 4.
Sampling Map for the Natural Pit Area Sampling Map for the Background Samples Photographs of the Sampling Activities Soil Description Charts
Page iii
1 2 2 2 3 5 5 5 5 6 7 8 8
10 10 11 13 13 13
Exhibit 5. Exhibit 6.
Certificate of Analysis for Sampling Containers Laboratory Data Reports
Exhibit 7.
Exhibit 8.
Tolerance Interval Analysis for Sample Locations 1, 2, 3, and 4 (Background) Tolerance Factors (K) for One-Sided Normal Tolerance Intervals with Probability Level (Confidence Factor) Y = 0.95 and Coverage P=95%

Certification Statement
Document: RCRA FACILITY INVESTIGATION (RFI)
REPORT OF FINDINGS
PHASE II
For Person Generating Station Hazardous Waste Storage Facility - Natural Pit Area (NMT360010342)
August 28, 1990
I certify under penalty of law that this document and all attachments were prepared under my direction or supervision in accordance with a system designed to assure that qualified personnel properly gather and evaluate the information submitted. Based on my inquiry of the person or persons who manage the system, or those persons directly responsible for gathering the information, the information submitted is, to the best of my knowledge and belief, true, accurate, and complete. I am aware that there are significant penalties for submitting false information, including the possibility of fine and imprisonment for knowing violations.
Vice President of Electric Operations
iii

1.0 Introduction
In November 1986, Public Service Company of New Mexico (PNM), submitted its "Permit Application for a Hazardous Waste Storage Facility at PerEon Generating Station'', hereafter permit application, for the waste oil storage tank located at Person Generating Station. The permit was approved and became effective on August 31, 1988 .. That permit has the EPA designation of NMT360010342.
Paragraph C.4(a) of the permit required that PNM perform a RCRA Facility Investigation (RFI) for the Solid Waste Management Unit (SWMU), identified as the Natural Pit.Area, to assess and verify any release of hazardous waste to soil.
An RFI Workplan was prepared and submitted to EPA in Janaury 1989. On Ma~ch 1, 1989, EPA notified PNM of several modifications it wanted to see in the workplan. These modifications were made and the workplan was resubmitted to EPA in late March 1989.
On July 31, 1989, EPA notified PNM by letter that the RFI Workplan had been approved. The letter included two revisions which EPA added to the workplan~ A revised workplan did not need to be submitted, rather EPA instructed PNM to immediately initiate implementation of the approved RFI Workplan (as revised).
Soil sampling was conducted on August 1-2, 1989. An RFI report titled "RCRA Facility Investigation (RFI), Report of Findings, For Person Generating Station Hazardous Waste Storage Facility - Natural Pit Area", was submitted to EPA on January 18, 1990 and contained the analytical results from the soil sampling.
On May 30, 1990, EPA notified PNM that it had completed its review of the RFI Report and had concluded that the report was approvable with rev1s1ons enclosed with that letter. The rev1s1ons included the requirements for additional soil sampling and supplementary report as part of "Phase II" of the investigation. A copy of the EPA approval letter is contained in Appendix A of this report. Specific requirements for the additional sampling are described in Section 3.0 of this report.
1

2.0 Departures From the RFI Workplan
This section describes Person RFI activities which departed from the RFI Workplan as submitted in March 1989. Included as departures are revisions to the Workplan made by EPA in its approval letters. They are identified here because ··they were not included in the Workplan as written, but were added to the Workplan by reference in the EPA approval letter.
Other departures discussed here include changes in procedures made after the Workplan was submitted. In most cases these changes were made because preliminary ·testing of proposed procedures showed them to be unworkable in the field. These changes were discussed with EPA prior to actual implementation. One last departure res~lted from miscommunication with the analytical laboratory.
2.1 EPA Revisions
In the July 31, 1989 letter (See Appendix A) approving the RFI Workplan, EPA incorporated two revisions to the Workplan by reference to the letter. They were minor in nature and were discussed in the initial Report of Findings. The first revision, dealing with depth of sampling, is not relevant to Phase II sampling and is not discussed here. The second revision, dealing with statistical analysis, remains relevant and is repeated here.
Statistical Analysis
The Workplan describes tolerance interval analysis as the select(=d statistical method for the data. The method, as described, is sensitive to the normality of the data. In the event that the data are not normally distributed, or cannot be transformed to normal for analysis, the EPA added the following requirement:
"If data from soil borings does not conform to procedures described in Section 5.3, then a different statistical procedure will be used. This different procedure must be approved by the Administrative Authority."
2.2 EPA Revisions for Phase II
In the May 30, 1990 letter (See Appendix A) EPA approved the initial Report of Findings, with two revisions. One revision requested the inclusion of a certification statement as required by 40 CFR 270.11 in all submissions to EPA. The second rev1s1on required additional sampling to be conducted as Phase II of the RFI.
Certification
A certification statement was added to the revised initial Report of Findings and the report was resubmitted to EPA. A certification is also a part of this report.
2

Additional Sampling
Three additional soil borings in a location as shown on the sampling map attached to the May 30, 1990 EPA letter were required. Depths of sampling intervals were prescribed as 0 - 1', 1 - 2', 4 - 5', and 9 10'. Each sampling interval was to be analyzed for lead, chromium and arsenic. Analytical results were to be compared to background data by depth interval as collected during the initial phase of sampling. Because the initial sampling phase did not include a depth interval at 9
10', EPA allowed the use of the 4 - 5' background interval Eor comparison at this new depth.
2.3 Procedural Revisions
Soil Coring Method
In early July 1989, PNM personnel tested the hand auger method described in Section 7.2 of the Workplan. The hand auger was found to be unusable for the following two reasons:
1. The soil type at the study area is a gravelly sand with very low cohesion. It was very easy to core into, but more often than not the plug would not stay in the coring bucket, but would fall back down into the hole. It was felt that using the hand auger would exacerbate attempts to collect samples in a timely manner and would cause great disturbance to the soil sample.
2. The hand auger was impossible to operate without causing upper levels of the soil to fall down into the hole. It was felt that if the hand auger was used it would be impossible to prevent upper layers of contamination from penetrating to deeper layers. This would cause two problems: a) cross contamination in the analysis, and b) dispersion of the contamination to deeper soil layers.
To address these concerns, a drilling contractor was hired. The contractor used a drilling rig and core sampling device which typically provides undisturbed and intact soil cores. The soil cores were taken from a split tube sampler which penetrated the soil from the inside of a continual rotary auger tube. Separate split tube samplers were used for each suceeding sampling depth.
The auger and split spoon sections were steam cleaned on site prior to and after the drilling of each hole.
Analytical Method for Lead
The RFI workplan prescribes the use of EPA method 7421 for the analysis of lead. This method was used for lead analysis in the initial sampling phase. Miscommunication between the investigators and the analytical laboratory resulted in EPA method 7420 being used in the Phase II analysis. The difference between the two methods is the detection limit (0.5 mg/kg for method 7421 versus 10 mg/kg for method 7420). The
3

consequence of this is that Phase II analytical results using the less sensitive method had to be compared against background results quantified at a lower detection limit. This does not appear to have had a major impact on interpretation of the results, however.
4

3.0 Description of Sampling Activities
3.1 Sampling Objective
~I ~s
elements area at elevated
has been
The sampling,and analysis scheme employed for Phase II of this designed to determine the presence and extent of the metal arsenic, chromium, and lead in the soil of the Natural Pit Person Station. Because the initial sampling phase revealed levels of these elements at sample Site #5, this location focused on for the Phase II sampling. Except for the departure noted above in Section 2.3 of this report (split rotary auger combination used instead of a hand auger) the sampling scheme, as described in Sections 5.0 and 6.0 of Workplan, were followed exactly.
procedural tube and proposed the RFI
The basic approach was to collect soil samples at the following one foot intervals: 0 - 1', 1- 2', 4- 5', and 9- 10', at three designated locations as shown on the sampling map contained in Exhibit 1. The analytical results were then compared to results from like samples taken from a "background'' location during the initial Phase of sampling. Since no background interval was taken at the 9 - 10' depth, the 4 - 5' background interval was used for comarison to the new 9- 10' interva].
Background sample locations (sample Sites #1, #2, #3 and #4) were not specified in the RFI workplan but were selected at the time of the inital sampling phase. The background sample locations selected were located just east of the northeast corner of the Person Station property boundary. This area was believed to be more suitable for background analysis than any area within the Person Station property boundary. A map showing the approximate locations of the background samples is presented as Exhibit 2 of this report.
3.2 Sampling Team
The sampling team consisted of five persons with the following duties. Two persons operated the drilling rig. Two persons handled all duties associated with the collection and documentation of the samples, including the handling of containers, documenting date and time of collection on sampling sheets and labels, collection of samples into containers, and the taking of photographs of each sampling interval. All photographs are contained as Exhibit 3 of this report. The fifth person collected representative soil samples from each interval for characterization as described below.
3.3 Soil Descriptions
The soils underlying the RFI site are described in detail by the Soil Conservation Service (SCS) in a collective document, the Bernalillo County Soil Survey (USDA-SCS, 1977) (Provided as Table III-3, in Attachment 1 of the RFI workplan, "Assessment of Exposure Potentials of Person Generating Station''). The soil mapping unit of the RFI vicinity is desribed in the SCS as the Bluepoint-Kokan association comprising two fairly identifiable soil series. A reconnasisance hand augering of the
5

study area identified the RFI study area to consist specifically of the Kokan soil series.·
The background sample location (Site #1, #2, #3 and #4) was consequently selected in a Kokan soil series location.
Each depth interval at each sampling location was examined for physical soil properties to verify consistancy in soil type between the investigation samples (Site #9, #10, and #11) and the background samples (Site #1, #2, #3, and #4).
Representative samples were collected from each soil sampling interval to be analyzed and were described for texture, color, and calcareousness. Soil texture was determined utilizing a wet soil ribbon technique. Reaction to a 10% solution of hydrochloric acid identified calcareousness. A Munsell Soil Color Chart was used to describe the sample color while dry and wet.
and This
detail
In general, all samples were a gravelly sand, slightly calcareous, of a very pale brown color (dry), pale brown color (wet). description is consistant with the Kokan soil series described in by the Soil Conservation Service and presented in the Bernalillo County Soil Survey.
Soil description charts for all sampling locations and depth intervals are presented as Exhibit 4 of this report.
3.4 Sample Collection.and Preservation
Sampling occurred over a one-half day period on June 27, 1990.
The rotary auger/split tube sampling procedure was capable of withdrawing approximately 24 inches of undisturbed soil core per split tube sampler assembly. The auger/split tube assembly was operated in the following manner. The auger was initially advanced down to a depth of 4 feet. Only about the upper two feet of the soil interval would actually enter the split tube sampler. Because of the extreme dryness and fine grain consistancy of the soil, the two foot plug would "freeze" in the split tube and prevent any further entrance of deeper material. The auger subsequently would bore the hole in total. Soil samples would then be collected from the the split spoon for the 0 - 1' and 1 - 2' intervals. A clean split spoon would then be assembled into the aug,:r and the auger assembly would be advanced from the four foot depth down to 9 feet. Again, only about the upper two feet in this interval would actually be collected (corresponding to the 4 - 6' interval). A sample was then collected from the 4 - 5' interval. A third split spoon was then assembled into the auger and the auger assembly was advanced t~vo additional feet from 9 feet down to 11 feet. The split spoon was then removed and a sample collected from the 9 - 10' interval.
Each split tube was pulled out of the hole, laid across a metal rack, and opened. A photograph was taken of the section, then a representative sample from each designated one foot interval was removed with stainless steel sampling spoons and placed in 8 ounce wide mou:h
6

glass jars. Environmental container lot this report.
The jars were QA/QC checked and supplied by Eagle Picher Services. A copy of the Certificate of Analysis for the
used in this investigation is contained as Exhibit 5 of
Each sample jar was pre-labeled as to sample location number, and depth interval. The date and time of collection, and name and signature of sample collector were written on ~he label after each sample was collected. No preservation was needed for these samples.
Documentation for each sample was also maintained on sample logs. An example log is shown in Exhibit 1 of the RFI workplan. Chain of custody forms (See Exhibit 2 of the RFI workplan) were used to track movement of the samples from collection through delivery to the analytical laboratory.
The samples were delivered to the lab on the same day as collected, June 27, 1990.
3.5 Quality Assurance
Several steps were taken to ensure the quality of the results obtained from the sampling procedure. As mentioned above, a rotary auger - split tube sampling procedure was used to minimize cross contamination between soil layers. The rotary drills and split spoon samplers were steam cleaned before and after each hole to prevent cross contamination between sample locations. Individual split tube samplers were used for each successive sample ~nterval.
All team members involved in the handling of samples wore latex examination gloves.
Laboratory precision was assessed by the submittal of sample duplicates from sample Site #9. The duplicates were collected at the same time and consisted of placing similar amounts of soil from each interval of the soil core into their respective sample jars.
The analytical laboratory also selected several samples from the set to analyze in duplicate. For purposes of comparison to background th(=se duplicate results are averaged into a single value and reported as such in this report.
7

4.0 Data Results
Exhibit 6 of this report contains a copy of the analytical data report prepared by Assaigai Laboratories, Inc. The data tables contained in this report are extracted from the laboratory data report.
4.1 Heavy Metals Analysis
Natural Pit samples were analyzed for arsenic, chromium, and lead. As more fully described in Section 8.4 of the RFI workplan, the approach on heavy metals analysis was to statistically compare results from background samples to results from sample locations within the natural pit.
In the initial sampling phase, moisture content on each sample vas conducted to determine if correction for moisture content was needed in order to more accurately perform statistical comparisons between Natural Pit samples and background samples. It was determined that moisture content correction did not effect whether or not a sample exceeded its corresponding Threshold Limit. For this reason, moisture content analysis was not performed or corrected for in the Phase II investigation.
Exhibit 7 of this report contains the Tolerance Interval Analysis spreadsheet listings from the four background sample locations (Site #1, #2, #3 and #4) for samples collected during the initial sampling phase. Since each natural pit sample is compared to its corresponding depth from the background, the listings in Exhibit 7 are organized by metal with statistical parameters based on all background samples from each depth. Thus, there are four samples for each depth on which to perform the Tolerance Interval Analysis. The Threshold Limit (TL) was calculated from:
TL AVG + K * SD
where,
AVG arithmetic mean of the four samples K = Tolerance Factor for 95% coverage and 95% confidence SD standard deviation of the four samples
The Tolerance Factor (K) was taken from Table 5 of Appendix B in the EPA document Statistical Analysis of Ground 'Jater Moni taring Data at RCIZA Facilities. Table 5 is reproduced in Exhibit 8 of this report.
After calculating depth, all Natural Threshold Limit. Natural Pit sample
the Threshold Limit for each heavy metal at each Pit samples were compared against their corresponding Table 1 of this report shows the comparison of each
with its Threshold Limit.
8

Depth (ft) ==========
0 - 1 1' - 2 4 - 5 9 -10**
Depth (ft)
Table 1
Analytical Results from Natural Pit Area- Metals Phase II
(Uncorrected For Moisture Content)
ARSENIC (mg/kg)
Background Threshold Site # Site # Site # Site Average Limit 9A 9B 10 11
#
========== ========= ====== ====== ====== ====== 5.08 14.89 2.5 2.7* 24.5 28.0 5.08 8.93 2.3 1.8 25.7* 219.0 3.52 5.13 1.2 1.4 2.1 3.5 3.52 5.13 1.2 1.5. 1.6 1.7
CHROMIUM (mg/kg)
Background Threshold Site # Site # Site # Site Average Limit 9A 9B 10 11
#
========== ========== ========= ======= ====== ====== ====== 0 1 4.50 10.68 6.0 9.0* 64.0 66.0 1 - 2 4.20 11.76 7.0 6.0 89.0* 632.0 4 - 5 3.40 5.95 5.0 4.0 5.0 <2.0 9 -10** 3.40 5.95 5.0 6.0 4.0 6.0
LEAD (mg/kg)
Background Threshold Site # Site # Site # Site # Depth (ft) Average Limit 9A 9B 10 11 ========== ========== ========= ====== ====== ====== ====== 0 - 1 10.93 34.32 <10.0 <10. 0* 33.0 28.0
1 - 2 6. 72 24.59 <10.0 <10.0 48.0* 202.0 4 - 5 4.07 7.42 <10.0 <10.0 <10.0 10.0 9 -10** 4.07 7.42 <10.0 <10.0 <10.0 15.0
* Average from duplicate results reported by lab. **Background average and Threshold Limit values derived from
4 - 5 foot depth interval. No background samples were taken at 9 - 10 depth interval.
9

5.0 Findings
5.1 Heavy Metals
Background
In general, heavy metal concentrations tended to decrease with depth at the background sampling locations. This trend was most-obvious for lead concentrations and least for cadmium concentrations.
A requirement for use of the Tolerance Interval Analysis procedure ~ras that the data be normally distributed. The Coefficient of Variance (CV in the listings of Exhibit 7) was used as an indicator of normaiity. This method was described in Section 4.2.2 of the EPA document Statistical Analysis of Ground-Water Monitoring Data at RCRA Facilitie!S, February 1989. If the CV exceeds 1.00, there is evidence that the data are not normally distributed.
For the three parameters of interest in the Phase II sampling (Arsenic, Chromium, and Lead) the CV was less than 1.00, and the data was assumed to meet the normality requirement for use of the Tolerance Interval Analysis procedure.
Natural Pit
Values well above the Threshold Limits for arsenic, chromium and lead were seen at sample Site #10 and Site #11. No Threshold Limit exceedance was seen at sample Site #9.
Arsenic TL exceedances were seen only in the top 2 sampling intervals (i.e, 0- 2') at sample Sites #10 and #11. Values ranged from 5 times to 200 times the background average. No arsenic TL exceedances were detected in the 4 - 5' interval or the 9 -10' interval.
Chromium TL exceedances were seen primarily in the top 2 sampling intervals at sample Sites #10 and #11. Values ranged from 15 times to 150 times the background average. Additionally, the Chromium TL was slightly exceeded in the 9 - 10' interval at Site #11 (TL = 5.95 mg/kg, sample result = 6.0 mg/kg).
Lead TL exceedances were seen primarily in the top 2 sampling intervals at Site #10 and Site #11. Values ranged from 3 times to 30 times the background average. Analytical results did show that the Lead levels dropped off significantly below the 2 foot depth level.
The pattern of TL exceedances indicate that the heavy metal contamination is limited to the Natural Pit area only. Sample Site #9, showed no TL exceedances. This site is located down drainage from the rest of the Natural Pit area. It is approximately 10 feet down drainage from Site #5, sampled during the initial sampling phase.
10

5.2 Quality Assurance
Laboratory Duplicaies
The laboratory randomly selected several samples for duplicate analysis. The paired results listed by parameter are shown in Table 2. The data are insufficient to analyze by metal parameter. When the data are lumped as shown in Table 2, a mean and standard deviation of the values can be calculated. The analysis shows relatively good agreement for the laboratory duplicates. The standard deviation of the percent differences for all sample pairs was 9.6%.
Field Duplicates
Samples from sample Site #9 were split in the field and provided to the laboratory for duplicate analysis. The paired results listed by parameter are shown in Table 3. This table also summarizes the percent difference between pairs and shows the mean and standard deviation of the data values (if sufficient numbers of pairs are available). Pairs comprised of non-detectable values are shown but not included in the summary.
For the heavy metals, the standard deviation of the percent difference were 17.5%, and 23.8% for chromium, and arsenic, respectively. All samples analyzed for lead at Site #9 were below the laboratory detect:lon limit, thus no standard deviation could be calculated.
11

N Mean Std.Dev
Table 2
Precision Assessment for Laboratory Duplicates Phase II
Parameter A B %Diff ------------Arsenic 2.7 2.6 -3.8 Arsenic 25.0 26.4 5.3 Chromium 9.0 9.0 o.o Chromium 91.0 87.0 -4.6 Lead <10.0 <10.0 Lead 53.0 43.0 -23.2
N 5 5 5 Mean 36.1 33.6 -5.3 Std.Dev 32.5 30.2 9.6
Table 3
Precision Assessment for Field Duplicates Phase II
Arsenic Chromium Lead ----------------- ----------------- -----------------#9A #9B %Diff #9A #9B %Diff #9A #9B %Diff
2.5 2.7 7.4 6.0 9.0 33.3 <10.0 <10.0 2.3 1.8 -27.8 7.0 6.0 -16.7 <10.0 <10.0 1.2 1.4 14.3 5.0 4.0 -25.0 <10.0 <10.0 1.2 1.5 14.3 5.0 6.0 16.7 <10.0 <10.0
4 4 4 4 4 4 1.8 1.8 2.0 5.8 6.2 2.1 0.6 0.5 17.5 0.8 1.8 23.8
12

6.0 Additional Action and Conclusions
6.1 TCLP Analysis
The analytical results from both the initial sampling phase and Phase II showed statistically elevated levels of certain heavy metal compounds in the natural pit above levels seen in background sampling. Total analysis is typically not used to determine if contaminated soil is a hazardous waste, only that some level of contamin~tion has occurred.
Current EPA RCRA regulations stipulate the use of the EP Toxicity T•~st to determine if a non-listed waste is a hazardous waste. Additionally, new EPA regulations have replac~d the EP Toxicity Test with the Toxicity Characteristic Leachate Procedure (TCLP) for this same determination, effective September 25, 1990. ·
Whei the laboratory results for Phase II total analysis became available, the laboratory was instructed to run a TCLP analysis for lead, chromium, and arsenic on the sample from Site #11, 1 - 2' depth (Laboratory Number Sta #11 11-2). This soil sample gave the highest total results. The TCLP was chosen instead of the EP Toxicity test because the TCLP is believed to be more conservative on results and obviously is the method of choice by the EPA.
The analytical results for the TCLP analysis are shown in Table 4 and the TCLP laboratory data report is contained in Exhibit 6. The results show that none of the three heavy metal constituents tested, gave results above their respective TCLP standard. The highest leachate result was obtained from arsenic at 1.2 mg/L. Lead and chromium leaclted a similar amount at 0.20 mg/L and 0.19 mg/L, respectively. The TCLP regulatory standard for each is 5.0 mg/L.
6.2 Conclusions
Based on the TCLP analysis it is apparent that the heavy metal contamination detected does not indicate the presence of a hazardous waste in the natural pit area. The data also support the conclusion that the contamination is confined to the upper few feet of the natural pit area and has not migrated either vertically or horizontally.
The findings of the initial sampling phase detected no levels of chlorinated solvents or PCBs. Only small amounts of toluene and napthalene, associated with the known fuel oil contamination, WE~re detected. Heavy metal results were similar to that seen in the Phase II sampling reported here.
Based on these results our conclusion is that there is no regulatory reason to require removal of the soil in the Natural Pit area at Person Generating Station. The results do not support the hypothesis that the Natural Pit represents an area of release of a hazardous waste. Based on these results, PNM recommends that the Natural Pit soil be left in-situ and undisturbed. Excavation and removal of the soil to a landfill would not represent a demonstrable benefit to health or the environment.
13
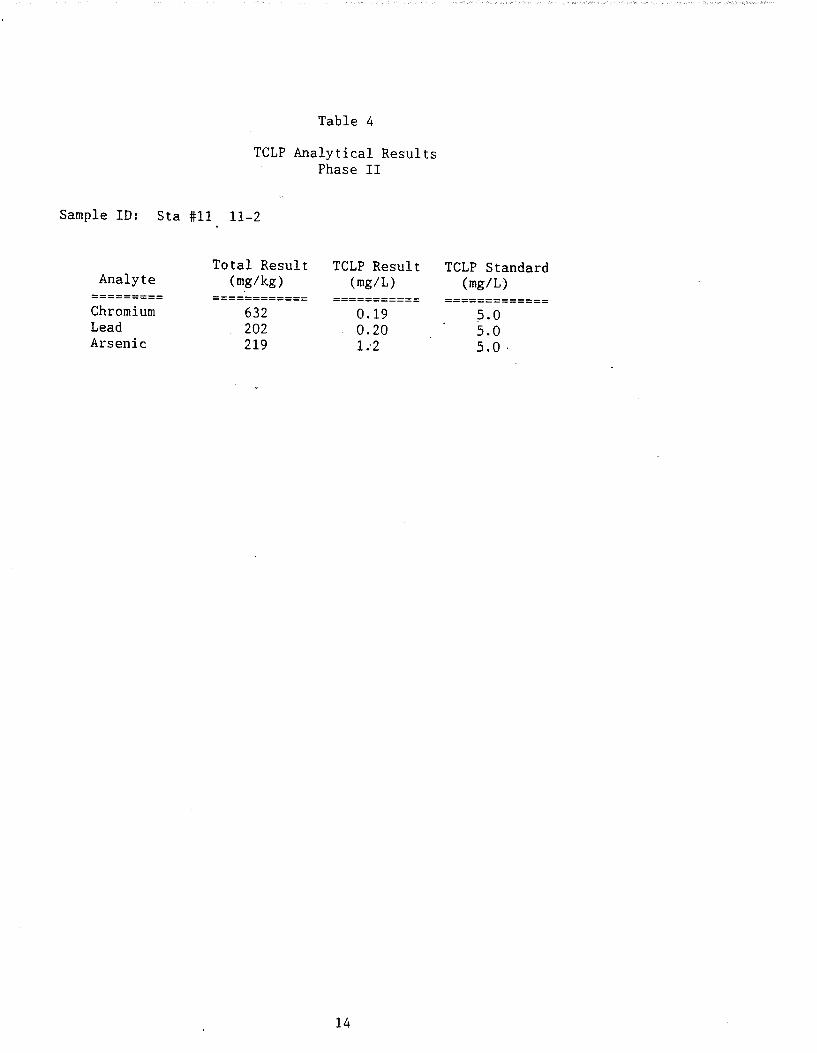
Table 4
TCLP Analytical Results Phase II
Sample ID: Sta #11 11-2
Total Result TCLP Result Analyte (mg/kg) (mg/L)
========= ============ =========== Chromium 632 0.19 Lead 202 0.20 Arsenic 219 1.2
14
TCLP Standard (mg/L)
============= s.o s.o s.o.

Appendix A
EPA RFI Approval Letters

ENVIRONMENTAL PROTECTION AGENCY REGION6
1445 ROSS AVENUE, SUITE 1200
DAUAS, TEXAS 75202
JUL 3 l 1989
CERTIFIED MAIL - RETURN RECEIPT REQUESTED Mr. Ron D. Johnson Public Service Company of New Mexico Alvarado Square Albuquerque, New Mexico 87158
RE: RFI Workplan - Public Service Canpany - NMT360010342 Dear Mr. Johnson:
We have canpleted a review of your response to our March 1, 1989, l€!tter regarding deficiencies in your RFI Workplan. We have detennined the Workplan to be approvable with the revisions that are described below: Page 9 of the revised RFI Workplan; Added to 2nd paragraph: If soil borings fran the 4 to 5 foot sampling intervals indicate cont~nination, then further soil s~npling will be required to detennine the vertical extent of cont~nination.
Page 18 of revised RFI Workplan; Added to 5th paragraph: If data fran soil borings does not confonn to procedures described in Section 5.3. then a different statistical procedure will be used. This different procedure must be approved by the Administrative Authority. Therefore, the approved RFI Workplan consists of the original January 11, 1939, submittal. plus your March 29, 1989, response to our notice of deficiency, and the above revisions.
You shall illVllediately initiate the implanentation of this approved RF'I Workplan, with the above stated revisions, according to the schedule contained in the Workplan. If you have any questions concerning this matter, please contact Rich Hayer of my staff at (214) 655-6785. Sincerely yours,
lP~~ Allyn 11. Oavi s
~Director Hazardous Waste Management Division cc: Kelley C. Crossman
New Mexico Environnental Improvement Division

UNITED STATES ENVIRONMENTAL PROTECTION I1GENCY
May 30, 1990
REGION 6
1445 ROSS AllENUE. SUITE 1200
DALLAS, TEXAS 75202-2733
CERTIFIED MAIL - RETURN RECEIPT REQUESTED
Ron D. Johnson Environmental Analyst A 1 varado Square Albuquerque, New Mexico 87158
RE: RFI Report- Public Service Company NMT360010342
Dear Mr. Johnson:
We have completed a review of your RCRA Facility Investigation (RFI) Report dated January 25, 1990. We have determined the Report to be approvable with enclosed revisions. These revisions include additional soil sampling requirements to ensure that no releases are occurring f1~om the Natural Pit area. Therefore, the approved RF1 Report consists of the above referenced document and the enclosed revisions.
You shall immediately initiate the implementation of this RFI Report, as approved. Also, submission of a "Phase II" RFI report detailing the results of the additional sampling requirements shall be due to EPA within 90 days of your receipt of this letter.
If you have any questions, your staff may contact Rich Mayer at ( 214) 655-6775.
Sincerely yours,
Q"'fn~~ Allyn M. Davis Director Hazardous Waste Management Division
Enclosure
cc: Elizabeth Gordon New Mexico Environmental
Improvement Division

REVISIONS TO THE PUBLIC SERVICE COMPANY RFI WORKPLAN
Below are the revisions which EPA has made to the Public Service Company
(PSC) RFI Report, dated January 25, 1990.
Page 24 of the RFI Report, Section 6.2 - Additional Sampling; the paragraph
below has been added to Section 6.2:
PSC shall take three soil borings with locations indicated on Figure 1.
These borings shall be sampled at the following intervals: 0- 1•, 0- 2•,
4- s•, and 9- 10•. Each sampling interval shall be analyzed for lead,
chromium, and arsenic. PSC may use the background soil samples from the
4- s• interval to compare to the active 9- 10 1 soil sample interval. For
these additional soil sampling requirements (Phase II), PSC shall comply with
all requirements of the approved RFI Workp14n (July 31, 1989).
Page 1 of the RFI Report, Section 1.0- Introduction; the following shall
be required for all RFI Reports, Workplans, quarterly progress reports, and
all other reports required by the permit (required by Permit Condition
C.4., page 11):
"Public Service Company shall certify all information submitted as required
by 40 CFR 270.11 (d). II
0
0
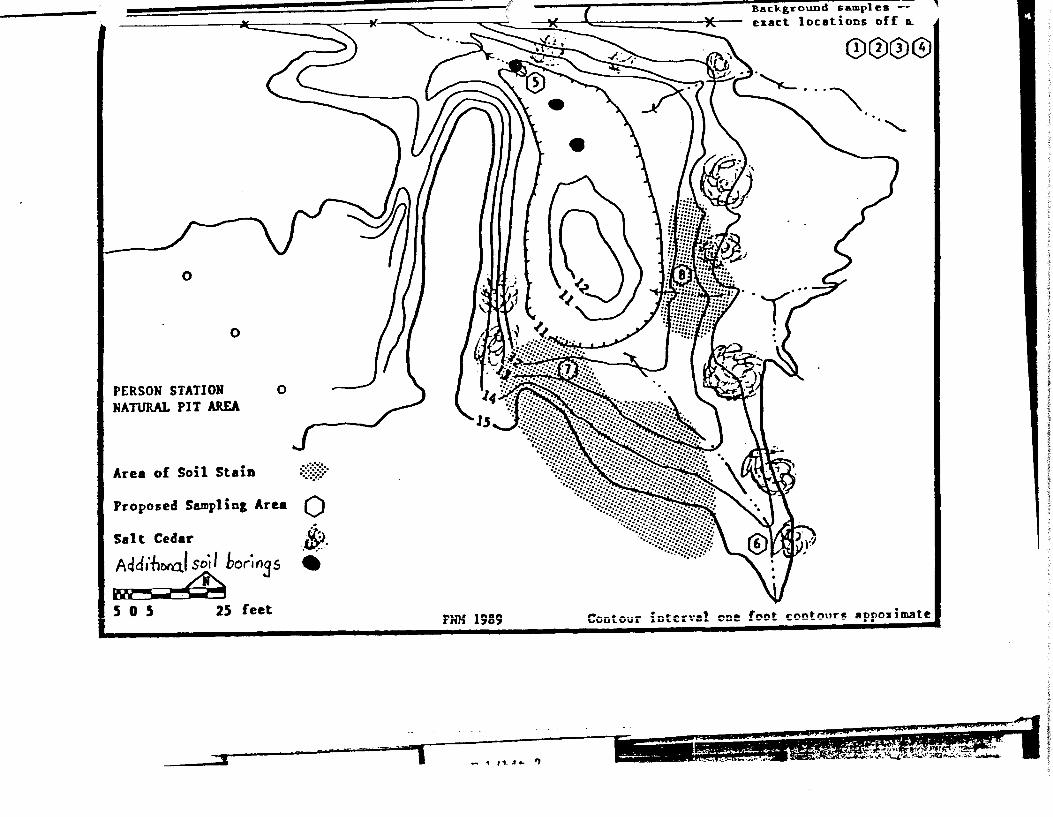
PERSON STATION 0 NATURAL PIT AREA
Area of Soil StaiD :;;:@~::·
Proposed Samplin& Area
Salt Cedar
Addinl>rll.f soil bor~fl3S w.-- -& 5 0 5 25 feet
0 a~~. -~ •
P~"K 1989 Cuutuur :_ ........... , &UL"-&•u&.
- "t'\...1 .. ,.,
Back&round samples -exact locations off ~
0®0® '-,;__ ... "
. ""-
cne !cot contour~ 3ppo~imate
'

Exhibit 1
Sampling Map for the Natural Pit Area

0
0
PERSON STATION NATURAL PIT AREA
Area of Soli Stain
Salt Cedar
0
.-:~:::·:·. ··:::::::·:·
·~)-..... Phase 1 Sa"1)11ng Sites 0 Phase II Proposed Sa"1)11ng Sites Q
vrw ~ n --
.s 0 .s 2.S feet
Background samples --> exact locations off map
Q)@Q)@ . \. ~ ... " .,
Contour interval one foot contours appoximate
PNM 1990

Exhibit 2
Sampling Map for the Background Samples

-----------
---------~-----
Property Boundary
PERSON STATION BACKGROUND
SAMPUNG AREA
Q) Sampling Locations
PNM January 1990 • -~
!I Cit
rw•- --........--- ------------ - ]
5 0 5 25 feel
(
J, ---------- --J_ ---- ~ ,.--- - - ---==-- __., ....-- -( ((--::-::;r~ \\\ \ ( f I (/ ·.\!.~~~II . ~ \ \ I .II I ®l :; I
I II 1 7 I :: tt;l;/1;
J J I 1/ I I I :t ><:: /(- II 1- I _LJ_ -~--,~-~ (~--f-r, r 1 L __
--?-;,r' ) __ j-j-ti_T_!_ I ()\ \.. _.con'fo; Interval one foot contows approximate

Exhibit 3
Photographs of the Sampling Activities