RCRA Assessment Plan for Single-Shell Tank Waste Management … · PNNL-12114 RCRA Assessment Plan...
125
PNNL-12114 RCRA Assessment Plan for Single-Shell Tank Waste Management Area S-SX at the Hanford Site V. G. Johnson C. J. Chou September 1999 Prepared for the U.S. Department of Energy under Contract DE-AC06-76RLO 1830
Transcript of RCRA Assessment Plan for Single-Shell Tank Waste Management … · PNNL-12114 RCRA Assessment Plan...

PNNL-12114
RCRA Assessment Plan for Single-Shell Tank Waste Management Area S-SX at the Hanford Site V. G. Johnson C. J. Chou September 1999 Prepared for the U.S. Department of Energy under Contract DE-AC06-76RLO 1830

DISCLAIMER This report was prepared as an account of work sponsored by an agency of the United States Government. Reference herein to any specific commercial product, process, or service by trade name, trademark, manufacturer, or otherwise does not necessarily constitute or imply its endorsement, recommendation, or favoring by the United States Government or any agency thereof, or Battelle Memorial Institute.
PACIFIC NORTHWEST NATIONAL LABORATORY operated by BATTELLE
for the UNITED STATES DEPARTMENT OF ENERGY
under Contract DE-AC06-76RL01830
Printed in the United States of America
Available to DOE and DOE contractors from the Office of Scientific and Technical Information, P.O. Box 62, Oak Ridge, TN 37831;
prices available from (615) 576-8401.
Available to the public from the National Technical Information Service, U.S. Department of Commerce, 5285 Port Royal Rd., Springfield, VA 22161
This document was printed on recycled paper.

PNNL-12114
RCRA Assessment Plan for Single-Shell Tank Waste Management Area S-SX at the Hanford Site V. G. Johnson C. J. Chou September 1999 Prepared for the U.S. Department of Energy under Contract DE-AC06-76RLO 1830 Pacific Northwest National Laboratory Richland, Washington 99352

iii
Summary A groundwater quality assessment plan was prepared for waste management area S-SX at the Hanford Site. Groundwater monitoring is conducted at this facility in accordance with Title 40, Code of Federal Regulation (CFR) Part 265, Subpart F [and by reference of Washington Administrative Code (WAC) 173-303-400(3)]. The facility was placed in assessment groundwater monitoring program status after elevated waste constituents and indicator parameter measurements (i.e., chromium, technetium-99 and specific conductance) in downgradient monitoring wells were observed and confirmed. A first determination, as allowed under 40 CFR 265.93(d), provides the owner/operator of a facility an opportunity to demonstrate that the regulated unit is not the source of groundwater contamination. Based on results of the first determination it was concluded that multiple source locations in the waste management area could account for observed spatial and temporal groundwater contamination patterns. Consequently, a continued investigation is required. This plan, developed using the data quality objectives process, is intended to comply with the continued investigation requirement. Accordingly, the primary purpose of the present plan is to determine the rate and extent of dangerous waste (hexavalent chromium and nitrate) and radioactive constituents (e.g., technetium-99) in groundwater and to determine their concentrations in groundwater beneath waste management area S-SX. Comments and concerns expressed by the Washington State Department of Ecology on the initial waste management area S-SX assessment report were addressed in the descriptive narrative of this plan as well as in the planned activities. Comment disposition is documented in a separate addendum to this plan.

v
Contents Summary ............................................................................................................................................ iii 1.0 Introduction ............................................................................................................................... 1.1 1.1 Background ....................................................................................................................... 1.1 1.2 Objectives and Scope ........................................................................................................ 1.3 1.3 Assumptions ...................................................................................................................... 1.4 1.4 General Approach and Plan Organization......................................................................... 1.4 2.0 Conceptual Model...................................................................................................................... 2.1 2.1 Hydrogeologic Setting....................................................................................................... 2.1 2.1.1 General .................................................................................................................. 2.1 2.1.2 S-SX Setting........................................................................................................... 2.1 2.2 Summary of Vadose and Groundwater Observations ....................................................... 2.2 2.2.1 Mobile Constituents in Groundwater ..................................................................... 2.2 2.2.2 Strontium-90, Cesium-137, and Alpha Emitters .................................................... 2.2 2.2.3 Contaminant Dynamics .......................................................................................... 2.5 2.3 Conceptualization of Contaminant Movement.................................................................. 2.9 2.3.1 Vertical Distribution............................................................................................... 2.10 2.3.2 Waste Source Characteristics ................................................................................. 2.11 2.3.3 Summary ................................................................................................................ 2.13 3.0 Statement of the Problem or Key Issues.................................................................................... 3.1 4.0 Decisions ................................................................................................................................... 4.1 5.0 Information Needs and Decision Rules ..................................................................................... 5.1 5.1 Groundwater Flow Rate and Direction ............................................................................. 5.1 5.1.1 Data Needs and Approach...................................................................................... 5.1 5.1.2 Data Uses................................................................................................................ 5.3 5.2 Placement of Monitoring Wells ........................................................................................ 5.3

vi
5.3 Extent of Contamination ................................................................................................... 5.6 5.3.1 Contaminant Depth Distributions........................................................................... 5.6 5.3.2 Origin of Technetium-99 in Groundwater.............................................................. 5.7 5.3.3 Origin of Cesium-137 in Groundwater .................................................................. 5.8 5.2.4 Characterization of Source Term Waste Constituents............................................ 5.9 6.0 Optimized Design for Data Acquisition .................................................................................... 6.1 6.1 Use of Existing Non-RCRA Standard Wells .................................................................... 6.1 6.2 Surrogate Analytes to Reduce Analytical Costs................................................................ 6.2 6.3 Depth Profiles: In Situ Probe and Field Screening Measurements .................................. 6.2 6.4 Use of National Laboratory Capabilities........................................................................... 6.2 6.5 Timing and Coordination .................................................................................................. 6.3 6.6 Integration with Site-Wide Groundwater Monitoring Project........................................... 6.3 7.0 References ................................................................................................................................. 7.1 Appendix A........................................................................................................................................ A.1 Appendix B ........................................................................................................................................ B.1 Appendix C ........................................................................................................................................ C.1

vii
Figures 1.1 Location Map of Seven Waste Management Areas at the Hanford Site ................................... 1.2 1.2 Location Map of Groundwater Monitoring Wells Around Waste Management Area S-SX..... 1.2 1.3 Summary of the Data Quality Objectives Process for the Waste Management Area S-SX Plan.......................................................................................................................... 1.5 2.1 Time Series Plots of Technetium-99, Chromium, and Nitrate in Waste Management Area S-SX Monitoring Network................................................................................................ 2.3 2.2 SX Tank Farm Cross Section .................................................................................................... 2.5 2.3 Gross Beta Time Series Plots in Selected Wells Near Waste Management Area S-SX............ 2.6 2.4 Tritium Contours and Water Table Map for 200 West Area, 1998 ........................................... 2.8 2.5 Preferential Pathways Conceptual Model.................................................................................. 2.9 2.6 Spatial and Temporal Correlation of Observed Technetium-99 in Groundwater and Possible Contaminant Source Areas in Waste Management Area S-SX................................... 2.12 5.1 Comparison of Detected Constituents in Borehole 41-09-39 with Constituents in Upgradient Well 299-W23-14 ................................................................................................... 5.2 5.2 Historical Water Levels Beneath SX Tank Farm ...................................................................... 5.4 5.3 Location Map of Existing and New Monitoring Wells Around Waste Management Area S-SX.................................................................................................................................. 5.5
1.1
1.0 Introduction 1.1 Background The single-shell tanks at Hanford contain radioactive and hazardous chemical waste generated from plutonium production and separation activities. The 149 single-shell tanks are hazardous waste manage-ment units regulated under the Resource Conservation and Recovery Act (RCRA) and Washington’s Hazardous Waste Management Act (HWMA, RCW 70.105) and its implementing requirements (Washington’s Dangerous Waste Regulations, WAC 173-303). The total holding capacity of the single-shell tanks is 355 million liters. The single-shell tanks con-tain approximately 87 million liters of highly caustic salt cake (mostly water-soluble salts such as sodium nitrate) and 45 million liters of sludge (mixture of water and insoluble salts and salt-containing liquids). The waste contains 190,000 tons of chemicals (sodium nitrates/nitrites, phosphates, sulfates, hexavalent chromium, and aluminum) and 130 million curies of radioactive waste (americium, cesium-137, pluto-nium, strontium-90, technectium-99, and uranium). Approximately 400 million liters of supernatant from the single-shell tanks were discharged to the ground via cribs, trenches, and tile fields. Tank leaks and spills account for over 4 million liters. To reduce additional leakage, most of the free liquids have been removed. Supernatant that was discharged to the ground, spills from past tank farm operations and tank leakage have the same mobile constituents (e.g., chromate, nitrate, technetium-99, and uranium), com-plicating groundwater data interpretations at some tank farm waste management areas (WMAs). The 149 single-shell tanks are grouped into farms. The 12 tank farms and their ancillary equipment and waste systems (e.g., transfer lines, diversion boxes, and salt well pipeline networks) are arranged in 7 WMAs for RCRA groundwater monitoring purposes (Figure 1.1) in accordance with the Tri-Party Agreement (TPA) (Ecology et al. 1989, as amended). The single-shell tanks are currently operating under interim status pending closure. They will be closed as a treatment, storage, and/or disposal facility under WAC 173-303-610 and Major Milestone series M-45-00 of the TPA. The interim status program involves either indicator evaluation monitoring or assessment monitoring. An assessment of the nature and extent of the contamination is required, if dangerous waste or dangerous waste constituents from the facility have entered the groundwater. Tank leaks and associated releases of tank waste including dangerous wastes and dangerous waste constituents, have resulted in documented groundwater contamination at four single-shell tank WMAs (S-SX, T, TX-TY, and B-BX-BY). This plan addresses WMA S-SX located in the 200 West Area of the Hanford Site (Figure 1.2). The principal mobile tank waste constituents identified for WMA S-SX are technetium-99 (as TcO4
-), hexavalent chromium (CrO42-) and nitrate (NO3
-). While radionuclide constit-uents contribute to the toxic dangerous waste designation, the latter two constituents are RCRA toxicity characteristic contaminants.

1.2
Figure 1.1. Location Map of Seven Waste Management Areas at the Hanford Site
Figure 1.2. Location Map of Groundwater Monitoring Wells Around Waste Management Area S-SX

1.3
Groundwater monitoring at WMA S-SX is regulated under RCRA interim-status regulations (40 CFR, Subpart F, by reference of WAC 173-303-400[3]). It was placed in assessment monitoring (40 CFR 265.93[d][4]) after elevated waste constituents and indicator parameter measurements (e.g., specific conductance, chromium, and technetium-99) in downgradient monitoring wells were observed and confirmed. An initial investigation (the first determination as allowed under 40 CFR 265.93[d]) of the possible source(s) and causative factors was conducted in accordance with the original groundwater quality assess-ment plan (Caggiano 1996). An assessment report of the initial findings was issued in February 1998 (Johnson and Chou 1998). The report concluded multiple source locations in the WMA exist to explain the observed spatial and temporal groundwater contamination patterns and that continued investigation, as required by 40 CFR 265. 93(d)(7)(i), was warranted. The report of the initial findings (Johnson and Chou 1998) was reviewed by outside experts, Ecology and others. As indicated in the original assess-ment plan (Caggiano 1996), follow-up or continued investigations were to be conducted in accordance with a new plan. Accordingly, the plan described in this document implements the additional studies suggested in the assessment report and those suggested by an expert panel review of vadose and ground-water conditions at the SX tank farm. Comments and concerns expressed by Ecology on the initial WMA S-SX assessment report were addressed, as appropriate, in the descriptive narrative of this plan as well as in the planned activities. Comment disposition and associated additional discussion documented in a separate addendum (Johnson and Chou 1999) to the assessment report. 1.2 Objectives and Scope The groundwater quality assessments for the single-shell tank WMAs are a component of the inte-grated vadose/groundwater characterization effort. The general or overall objective is to develop the necessary understanding of subsurface conditions and processes to support tank waste remediation and cleanup decisions and implement near-term actions to protect groundwater and the Columbia River. The specific objectives of this groundwater quality assessment plan are:
• to determine the appropriate tank waste constituents, reaction products and/or indicator parameter (including frequencies) to monitor.
• to fulfill requirements specified in 40 CFR 265.93(d)(7)(i). Specifically, to continue further deter-
minations required under 40 CFR 265.93(d)(4) (i.e., to determine the rate and extent of dangerous waste or dangerous waste constituent migration in the groundwater and to determine their concen-trations in the groundwater).
• to implement additional investigations in accordance with the groundwater quality assessment plan
(Caggiano 1996). • to address the groundwater related aspects of RPP (River Protection Project, formerly TWRS) facility
investigation (or the equivalent as negotiated through the Tri-Party Agreement process).

1.4
It should be noted that this plan does not cover preparation of a detailed facility description and related information. Such information will be part of the separate but integrated RPP (formerly TWRS) facility investigation for a related TPA milestone. Integration of groundwater and vadose zone investi-gations will be accomplished through the Tri-Party Agreement project management, the Hanford Site groundwater project, the Tank Farm Vadose Zone Project and the emerging Hanford Site vadose/ groundwater integration project. The need for information from the other investigations is indicated in this plan as an external information need. 1.3 Assumptions Parallel activities involving groundwater and vadose characterization at Hanford require that certain assumptions be made to prepare a plan that will be part of a larger integrated project. Accordingly, it is assumed that:
• the vadose and groundwater investigations at WMA S-SX will be conducted as separate but coordinated investigations
• adequate resources will be available for the planned activities.
Other activities are being conducted concurrently, e.g., expanded vadose/groundwater expert panel and national laboratory peer review of science and technology needs. The outcome of these near-term efforts may influence the type and extent of information needs for this assessment or may result in research that will address some of the tasks identified in this plan. These activities will be coordinated to ensure maximum utilization of all available resources and to avoid duplication of efforts. 1.4 General Approach and Plan Organization The plan is based on a modification of the seven data quality objectives (DQO) steps (EPA 1994) leading to a sampling and analysis plan that guides the fieldwork for various tasks. The process was originally designed by the U.S. Environmental Protection Agency (EPA) to expedite cleanup activities at superfund sites. Thus not all of the steps apply to a groundwater quality assessment. The two primary problems were described in Section 1.1 and the decisions needed for determination of the spatial and temporal unknowns are outlined in Section 4.0. Applicable DQO steps are used as appropriate. The general process is illustrated in Figure 1.3 (Chou and Johnson 1998). The important or essential aspects of the DQO process are that key decisions are identified in the form of questions or statements and that data acquired are appropriate to make the necessary decisions. The steps indicated by an asterisk in Figure 1.3 form the basis and organization of this plan. A review of existing site hydrogeological conditions and a conceptual model based on the most recent vadose zone and groundwater results are provided in Section 2.0 as background for the subsequent steps in the DQO process. Alternatives for obtaining critical data that either reduce costs or provide more

1.5
Figure 1.3. Summary of the Data Quality Objectives Process for the Waste Management Area S-SX Plan timely information for key decisions (design optimization) are discussed in Section 6.0. The final product of the DQO process is a sampling and analysis plan describing data collection design that meets the quan-titative and qualitative needs of the study. The sampling and analysis plan, including a description of tasks and schedule, is presented in Appendix A. Geologic cross-sections and as-built drawings of the existing RCRA and non-RCRA monitoring wells that will be used in the investigative activities are included in Appendix B. The information needs and actions needed to acquire the information, as described in Sections 3.0 through 5.0, are based on work sheets developed from the steps shown in Figure 1.3 and are included in Appendix C, Table C.1.

2.1
2.0 Conceptual Model 2.1 Hydrogeologic Setting 2.1.1 General The Hanford Site is located in a mid-latitudinal desert on the Columbia Plateau (see Figure 1.1). The arid climate is due to the rain shadow effect of the Cascade Mountains. Potential evaporation exceeds the average annual precipitation of ~16 cm/yr. Sagebrush and cheetgrass are the dominant plants. The uncon-fined aquifer and vadose zone occur in semi-cemented silts, sands, and gravels. The depth to ground-water is 60 to 80 m in the 200 Areas, dropping to ~20 m near the river. The average thickness of the unconfined aquifer is ~80 m. Groundwater travel time to the Columbia River from the 200 East Area is about 10 years, depending on hydrogeologic conditions and assumptions, and longer from the 200 West Area. 2.1.2 S-SX Setting The S-SX Tank Farm was constructed in a sequence of sedimentary units that overlie the Columbia River Basalt Group on the north limb of the Cold Creek syncline. These sedimentary units include the upper Miocene to Pliocene Ringold Formation, the Plio-Pleistocene unit, Pleistocene cataclysmic flood gravels and slack water sediments of the Hanford formation, and Holocene eolian deposits. The Ringold Formation consists of semi-indurated clay, silt, altered sediment, fine- to coarse-grained sand, and granule to cobble gravel. The lower half of the Ringold Formation is the main unconfined aquifer under the Hanford Site and contains five separate stratigraphic beds dominated by fluvial (river) gravels. These gravels are separated by intervals containing deposits typical of overbank (flood) and lacustrine (lake) sedimentary facies or layering patterns (Lindsey 1991). The lowermost of the fine-grained sequences is designated the lower mud sequence. The uppermost gravel unit, unit E, grades upward into interbedded fluvial sand and overbank deposits that are in turn overlain by lacustrine-dominated strata. The fluvial sand and gravel facies is the principal facies of the upper part of the Ringold Formation under the 200 West tank farms. In the S-SX tank farm the vadose zone is approximately 64 m (200 ft) thick. It consists of the Ringold Formation unit E, the Plio-Pleistocene, the Hanford formation, and Holocene deposits. The vadose zone stratigraphy beneath the S-SX tank farms is illustrated in three cross sections and a fence diagram included in Appendix B. These cross sections include gamma log profiles, the depth of cesium-137, and the moisture content in the soils relative to their stratigraphic position. Together these cross sections provide one stratigraphic interpretation of conditions at or near the two largest areas of vadose zone contamination (and the largest potential sources of groundwater contamination) in the S and SX tank farms (i.e., near tanks S-104, SX108, SX-109, and SX-115). Additional details concerning vadose zone stratigraphy, hydrogeology, waste composition, vadose zone contamination, leak history and tank farm operations are available in Wood et al. 1999.
2.2
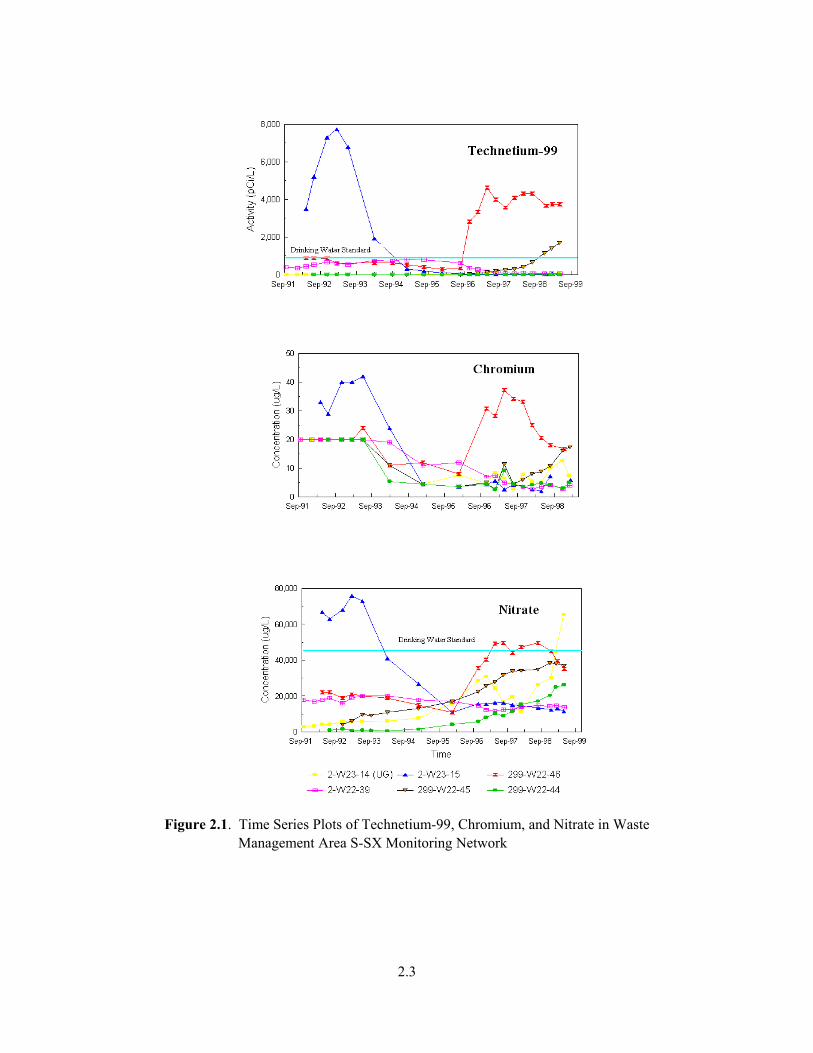
2.2 Summary of Vadose and Groundwater Observations 2.2.1 Mobile Constituents in Groundwater The WMA S-SX with its surrounding monitoring wells is shown in Figure 1.2. Elevated technetium-99 (Figure 2.1) has occurred in three RCRA wells (2-W23-15, 299-W22-45 and 2-W22-46) downgradient from the largest known soil contamination near tanks SX-108 and SX-109 and SX-115. Nitrate and chromate exhibited similar patterns as exhibited by technetium-99 (see Figure 2.1). Comparison with upgradient well 2-W23-14 data (waste constituent patterns, sodium/calcium relationships, and isotopic and chemical ratios) indicates the SX tank farm is the source (Johnson and Chou 1998). It should be noted that chromium concentrations shown in Figure 2.1 are based on filtered groundwater sample results. Samples were filtered through a 0.45-micron membrane filter, transferred to a bottle, and preserved with nitric acid to a pH less than 2 prior to chemical analysis. Filtered samples provide information on only the dissolved constituents that are present because suspended materials are removed from the filtration process. Therefore, filtered sample results are typically lower in concentration than unfiltered results. 2.2.2 Strontium-90, Cesium-137, and Alpha Emitters Confirmed detections of strontium-90 and cesium-137 in groundwater monitoring wells in the imme-diate vicinity of WMA S-SX have been limited primarily to one older well (299-W23-7) with the follow-ing exceptions. The HEIS database indicates a few positive occurrences for cesium-137 in RCRA wells 299-W22-39, 299-W22-45 and 299-W22-46 and older wells (e.g., 299-W23-1, 299-W23-2, 299-W23-3, 299-W23-9) located both inside and upgradient of WMA S-SX. In the latter cases, however, the apparent positive occurrences in the database are very close to the 2-sigma counting uncertainties for the reported results. Also, when the results for the above wells are normalized to their counting error and plotted versus time, there is no consistent trend of results greater than the 2-sigma counting errors with time. (Results below the 2-sigma counting error are flagged as non-detects in the HEIS database). In contrast to the expected sustained occurrence of values greater than the 2-sigma error if a “detect” reported in the database is real, a random fluctuation of both positive (+) and negative (-) values is reported. The latter commonly occurs for radionuclides that are at or near the detection limit. Lower detection limits than currently available would be needed to quantify cesium-137 concentrations below the current vendor detection limit of about 2 pCi/L (low-level method). However, considering that the drinking water stan-dard (4-mrem/yr equivalent) is 200 pCi/L for cesium-137, a lower detection limit does not seem justified from a regulatory or risk perspective (see Wood et al. [1999] and Johnson and Chou [1999] for additional evaluation and discussion of this issue). The positive occurrences of cesium-137 in well 299-W23-7, up to maximum of 49 pCi/L (June 1998) have been previously characterized as particulate in nature (Johnson and Chou 1998). The well is no longer capable of producing water by pumping. Therefore, it must be sampled without purging and has been identified for decommissioning as an interim corrective measure for WMA S-SX (i.e., wells with poor annular seals located inside the tank farm are potential vertical pathways and should be pressure grout sealed).
2.3
Figure 2.1. Time Series Plots of Technetium-99, Chromium, and Nitrate in Waste Management Area S-SX Monitoring Network

2.4
It should be noted that anomalous gross alpha (maximum of 247 pCi/L) occurred in well 29-W23-7 (third quarter 1998). Initial screening results for alpha emitters using low-level methods indicated the presence of primarily uranium and a mixture and low concentrations (<1 pCi/L) of various isotopes of plutonium, americium and curium. The transuranics were associated with particulates based on compar-ison of filtered and unfiltered samples. Whether these occurrences are an artifact of the well (cross contamination during drilling, well maintenance or sampling) or represent tank waste that somehow migrated into the well or represent actual aquifer contamination is currently unknown. Additional char-acterization of contaminant occurrences in this well was previously recommended (Johnson and Chou 1998). The inferred average groundwater flow direction for the WMA is toward the southeast. However, at the south end of the SX tank farm, the inferred direction is more easterly (see Figure 5.3). This more easterly shift in flow direction may have carried contaminants from the SX-115 tank leak past well 299-W23-15 and then to well 299-W22-46. Gamma logging results and soil core samples collected around tank SX-115 suggested lateral fingering of tank waste in the upper soil column (15 to 20 m depth) along the southwest corner of the tank. One hypothesis is that leakage from a water line that passes near tank SX-115 carried contaminants down to groundwater, which then intersected wells 299-W23-15 and 299-W22-46 (Johnson and Chou 1998). Another possible driving force is surface runoff that collects in a depression adjacent to the southwest corner of the SX tank farm. Alternatively, groundwater may take a more circuitous path than predicted from water table gradients. For example, groundwater may flow south from the SX-108 and SX-109 and SX-115 leak sites, pass by well 299-W23-15, and then travel eastward. Such deviations from a more linear path based on hydraulic gradients are plausible because of the anisotropy (non-uniform permeability of the aquifer) resulting from differential cementing of the Ringold gravels that has been observed in this area. While this altered flow-path hypothesis is partially testable, there is currently no direct evidence to either accept or reject it. Injection of a tracer in borehole 41-09-39 could be used to test the southerly groundwater flow direction hypothesis (i.e., a localized southerly deviation from the inferred southeast direction would be confirmed if a tracer injected in well 41-09-39 appeared in well 299-W23-15). The uncertainty in local groundwater flow direction underscores the importance of this parameter as a fundamental assessment characterization need. An interpretive schematic of cesium-137 depth distribution in the soil column at one of the largest tank leak sites is shown in Figure 2.2. Cesium-137 contours are based on spectral gamma logging of vertical boreholes and laterals beneath tanks SX-108 and SX-109. The maximum depth of cesium-137 was ~40 m below ground surface. Mobile tank waste constituents were expected to move to greater depths than the less mobile cesium-137, possibly reaching the water table at a depth of 64 m. More detailed stratigraphic cross sections and a fence diagram of stratigraphy beneath WMA S-SX and vicinity are presented in Appendix B. To further evaluate depth distribution of cesium-137 near SX-108/109, a thick wall casing (bore-hole 41-09-39) with a nose cone was driven to 40 m with a pile driver in 1997. The borehole was then extended by milling out the nose cone and then coring down to groundwater. A 7.5-cm diameter, 3-m long stainless steel well screen was installed to obtain groundwater samples (Myers et al. 1998). Core

2.5
Figure 2.2. SX Tank Farm Cross Section (highest 137Cs concentrations ~107 and 108 pCi/g occur in the
red zone at 70 – 85 ft [21 – 26 m] below the ground surface) samples were analyzed and groundwater samples were collected at three depths between January and April 1998. Core data suggest little, if any, tank waste migrated through the soil column to groundwater at this location (Detection Limit = 0.1 pCi/g and 1 pCi/g for cesium-137 and technetium-99, respectively). Groundwater results for 0.02-m, 0.5-m, and 3-m depths from the screened section of this borehole are consistent with the core sample results. Tritium and nitrate, the only groundwater contaminants found in significant concentrations, are attributed to upgradient sources. For example, the 216-S-25 crib received process condensate containing large quantities of tritium until the early 1990s and received nitrate in effluent from the resin column used in a groundwater remediation project conducted in 1985 to reduce uranium in groundwater beneath the 216-S-1/2 crib. Small amounts of technetium-99 were also discharged to this crib. 2.2.3 Contaminant Dynamics Contaminants attributable to tank waste sources tend to occur in groundwater as short-term transients (Figure 2.3).1 Four wells (299-W23-1, 299-W23-15, 299-W22-46, and 299-W23-2) within the WMA S-SX have exhibited this pattern at different times since 1985. Similar occurrences have been observed in at least one well in WMA T network and in one well at WMA B-BX-BY. In the latter case, the transients seem to occur over shorter time intervals (weeks rather than months). The differences in apparent time response may be related to stratigraphy. For example, WMA B-BX-BY is underlain by semi-uniform, sandy-textured soil as compared to the presence of less permeable silt and cemented sand and gravel layers in the 200 West Area. 1 Note: Gross beta was used because it was measured over a longer time period than was technetium-99.

2.6
Figure 2.3. Gross Beta Time Series Plots in Selected Wells Near Waste Management Area S-SX
(99Tc ≅ 2.5 x gross beta)
Well 299-W23-3
Well 299-W23-7
241-SY
241-SX Tank Farm
241-S Tank Farm
216-S-8Trench0 10050
Meters
216-S-3Cribs
216-S-4Crib
216-SX-2Crib
216-S-25 Crib
Single-Shell TankSuspected/ConfirmedLeaking Single-Shell TankMonitoring Well
216-S-21Crib
216-S-1&2Cribs
0
500
1,000
1,500
2,000
2,500
3,000
3,500
4,000
Gro
ss B
eta,
pC
i/L
Collection Date
Groundwater Flow Direction
1999/DCL/S-SX/004
'84 '88 '92 '96'86 '90 '94 '98
Well 299-W23-1
Well 299-W23-2
Well 299-W22-46
Well 299-W23-15
0
500
1,000
1,500
2,000
2,500
3,000
3,500
4,000
Gro
ss B
eta,
pC
i/L
Collection Date'84 '88 '92 '96'86 '90 '94 '98
0
500
1,000
1,500
2,000
2,500
3,000
3,500
4,000
Gro
ss B
eta,
pC
i/L
Collection Date'84 '88 '92 '96'86 '90 '94 '98
0
500
1,000
1,500
2,000
2,500
3,000
3,500
4,000
Gro
ss B
eta,
pC
i/L
Collection Date'84 '88 '92 '96'86 '90 '94 '98
0
500
1,000
1,500
2,000
2,500
3,000
3,500
4,000
Gro
ss B
eta,
pC
i/L
Collection Date'84 '88 '92 '96'86 '90 '94 '98
0
500
1,000
1,500
2,000
2,500
3,000
3,500
4,000
Gro
ss B
eta,
pC
i/L
Collection Date'84 '88 '92 '96'86 '90 '94 '98

2.7
Tritium/technetium-99 observations. As previously indicated, the upgradient crib (216-S-25) received large quantities of tritium and small amounts of technetium-99. Figure 2.4 shows the general areal distribution of tritium in the near-field and far-field vicinity of WMA S-SX based on averaged data for 1998. The maximum concentrations occur upgradient of the SX tank farm near the 216-S-25 crib. Concentrations are highest in a “corridor” running from the northwest to the southeast beneath the SX tank farm and appear to be consistent with a flow direction based on the gradient in water table elevation. The far field distribution of tritium concentration is uncertain because there are no monitoring wells east - southeast of the southern half of WMA S-SX (note dashed lines and question marks in Figure 2.4). Tritium occurs in tank waste as well and should be associated with other mobile tank waste constituents such as technetium-99. The upgradient sources are characterized by very high tritium/technetium-99 ratios (~10,000). The expected contemporary tritium/technetium-99 ratio was estimated to in the range of 1 – 10 (Johnson and Chou 1998). The ratio progressively declined from the west side of the SX tank farm to the east side where the ratios seemed to converge near the expected ratio for single shell tank sources noted above. In addition, during 1998 a transient was observed in well 299-W23-1, located inside the S tank farm (between tanks S-107 and S-110), for which the tritium/technetium-99 ratios were about 1. This occurrence is somewhat unique compared to the SX tank farm area because there is no large upgrad-ient source of tritium here. Thus, the ratio in well 299-W23-1 appears to be consistent with a “pure” tank waste source. The cause of the short-term transient that lasted for about a year is unclear. However, a similar event occurred in 1985-86 for which a low tritium-technetium-99 was also observed (<1). With the above as background, it is interesting to note that tritium/technetium-99 ratios >5,000 were observed for groundwater samples collected from the new borehole (49-09-39) near tank SX-109, indi-cating an upgradient source for both of these mobile constituents at this location. In addition, tritium has exhibited abruptly increasing and decreasing trends in upgradient well 299-W23-14. Tritium has been increasing in several downgradient wells at the SX tank farm (299-W22-45, 299-W22-39, 299-W23-3, and 299-W23-2) since September 1994. Most of this can be attributed to upgradient sources because of the low technetium-99 concentrations in these wells. Some deviation from this pattern is currently emerging at well 299-W22-45 where technetium-99 has been sharply increasing (up to 1,700 pCi/L for the third quarter of FY1999). The dynamic changes noted above reflect a variable release history to ugradient cribs and a complex hydrogeologic regime in the S-SX tank farm area. Comparison of tritium response patterns in upgradient and downgradient wells may allow some inferences about flow directions and rates. Leak volumes. Volume estimates for the major tank leaks vary depending on assumptions and interpretation of operational data. Leakage from tanks SX-108, 109 and 111 may have been is high as 400,000 gal (1,500,000 L) while leak volume from the next largest known tank leak in WMA S-SX was about 50,000 gal (190,000 L) from tank SX-115 (Jones et al. 1998; Wood et al. 1999). While the leak volume is critical to understanding or predicting the lateral and vertical movement of tank waste, the estimates should be considered as guesses at best. All that is known with any certainty is that soil borings and spectral gamma logs indicate major soil contamination exists beneath the above tanks. Additional subsurface characterization would be needed to define the volume of contaminated soil (Jones et al. 1998).

2.8
Figure 2.4. Tritium Contours and Water Table Map for 200 West Area, 1998
2.9
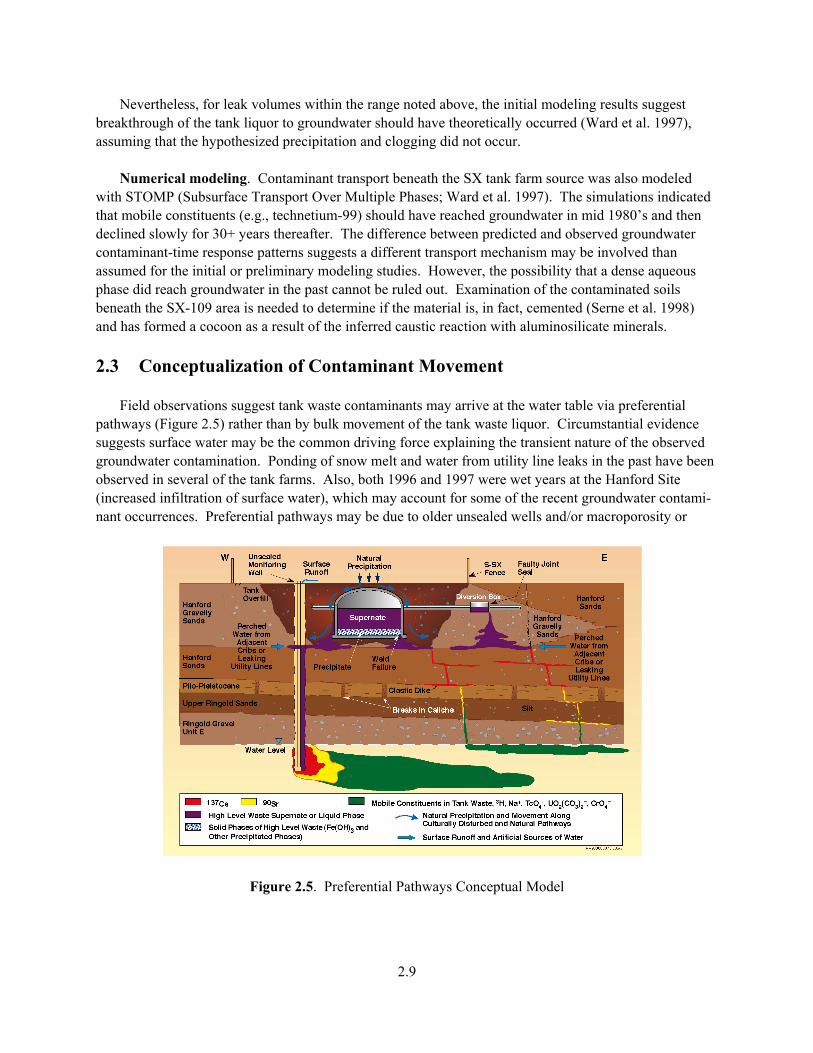
Nevertheless, for leak volumes within the range noted above, the initial modeling results suggest breakthrough of the tank liquor to groundwater should have theoretically occurred (Ward et al. 1997), assuming that the hypothesized precipitation and clogging did not occur. Numerical modeling. Contaminant transport beneath the SX tank farm source was also modeled with STOMP (Subsurface Transport Over Multiple Phases; Ward et al. 1997). The simulations indicated that mobile constituents (e.g., technetium-99) should have reached groundwater in mid 1980’s and then declined slowly for 30+ years thereafter. The difference between predicted and observed groundwater contaminant-time response patterns suggests a different transport mechanism may be involved than assumed for the initial or preliminary modeling studies. However, the possibility that a dense aqueous phase did reach groundwater in the past cannot be ruled out. Examination of the contaminated soils beneath the SX-109 area is needed to determine if the material is, in fact, cemented (Serne et al. 1998) and has formed a cocoon as a result of the inferred caustic reaction with aluminosilicate minerals. 2.3 Conceptualization of Contaminant Movement Field observations suggest tank waste contaminants may arrive at the water table via preferential pathways (Figure 2.5) rather than by bulk movement of the tank waste liquor. Circumstantial evidence suggests surface water may be the common driving force explaining the transient nature of the observed groundwater contamination. Ponding of snow melt and water from utility line leaks in the past have been observed in several of the tank farms. Also, both 1996 and 1997 were wet years at the Hanford Site (increased infiltration of surface water), which may account for some of the recent groundwater contami-nant occurrences. Preferential pathways may be due to older unsealed wells and/or macroporosity or
Figure 2.5. Preferential Pathways Conceptual Model

2.10
other natural vertical flow features. Whatever the nature of vertical movement, once a wetted zone develops, subsequent infiltration events will more readily follow the same path to groundwater (DOE 1997). It should be noted that Figure 2.5 is a simplified depiction of the movement of tank liquor via hypoth-esized preferential vertical pathways. Over time, multiple leaks could overlap one another and have different physical and chemical characteristics that could influence the degree of mobility of the tank waste. A flooding event, water line leak, or other enhanced infiltration event would result in a dilute fluid that would tend to spread at the very top of the aquifer. While not shown, fractionation of the less mobile (cesium, strontium and transuranics) and more mobile (technetium, nitrate, chromium) constituents with depth in the soil is expected. Alternative conceptualizations have been proposed that differ from what is presented here. Indeed, there are likely multiple transport pathways. The depiction presented in this plan is to emphasize those aspects of movement through the vadose zone that could have a significant impact on the dynamics of contaminant occurrence in groundwater and on how the contaminants are distributed in the aquifer beneath and adjacent to the WMA. The authors believe that existing groundwater and vadose observa-tions at WMA S-SX favor some type of preferential transport of surface water/tank waste mixtures down to the water table as relatively short (1 to 2 yr) but recurrent transient events. Whether or not the waste liquor itself migrates to groundwater in the SX tank farm is uncertain. For example, spectral gamma logs and soil core results suggest most of the leaked tank liquor may remain near the site of initial emplacement (see Figure 2.2 and purple zone in Figure 2.5). As noted previously, this inference is supported by experiments showing highly caustic waste reacts with the aluminosilicate soil minerals, forming a gel or precipitate that clogs the pore spaces in laboratory leaching columns (Serne et al. 1998). (No field evidence is available to test the hypothesized precipitation and/or cementing with silica/alumina dissolution products; this type of data can be acquired during decommissioning of 41-09-39). Episodic infiltration events, however, could still bring water in contact with the semi-solidified waste mass. The more mobile constituents could then migrate to groundwater via poorly sealed, old wells and/or through a network of vertical flow features (fractures or macropores). The Expert Panel Report (DOE 1997) also hypothesized vertical transport processes that could account for the transient contaminant occurrences in groundwater beneath WMA S-SX. 2.3.1 Vertical Distribution The vertical distribution of contaminants in the aquifer, as illustrated in Figure 2.5 may occur very near the top of the aquifer or may be more deeply distributed, depending on the transport pathway and soil moisture conditions. Unsaturated flow through the vadose zone should result in a very shallow contaminant layer at the top of the aquifer. Water entering an old well next to a tank leak could carry contaminants deeper into the aquifer because the tops of well casings inside the tank farms are below the ground surface. There are six older groundwater wells in the S and SX farms, four of which are imme-diately adjacent to tanks. A continuous source of water from a leaking utility line or fire hydrant may pass through soil contamination. Such water sources large enough to sustain saturated flow conditions could transport contaminants deeper into the aquifer (e.g., a fire hydrant inside the S-SX east fence line

2.11
and midway between S and SX farms was found to be leaking in 1997). Thus the vertical distribution in the aquifer may be an important clue to the nature of the vadose zone source and driving force. 2.3.2 Waste Source Characteristics It should also be noted that tank leaks are not the only potential sources of groundwater contami-nation. Spills (water and/or waste) from diversion boxes and transfer lines, as depicted in Figure 2.5, could contribute to groundwater contamination if re-mobilized by surface or near-surface water sources. Also, near-surface contamination is widespread in the S-SX tank farms and tends to be greatest in the southern half of the SX farm and along the east side of the S farm (DOE 1996; DOE 1998). Infiltration of surface water from runoff events is also more likely to occur along the east side of the S-SX tank farms because the land surface slopes downward into the tank farm along the east fence line. This was dramat-ically demonstrated in 1996 when a large water main separated near the northeastern side of S tank farm. The ground surface slopes downward and into the S tank farm in that area. Approximately 500,000 gal-lons (1,900,000 L) of water were released in a 1-hour period and flowed into a low spot inside and along the east fence line of S tank farm. Rapid melting of heavy snow pack can result in similar events. The latter two types of driving forces may account for the renewed (transient) occurrence of technetium-99 in well 299-W23-1 during 1997-98 (Johnson and Chou 1998). The largest known waste volume losses to the soil column occur in the SX-108, SX-109, SX-111 and SX-112 area. Tank SX-115 is also a major potential source area based on previous soil characterization results. Thus these tanks are primary suspect sources of groundwater contamination. Regardless of the source, the primary mobile radioactive and chemical constituents of interest should be similar (e.g., chromate, nitrate, technetium-99). The relative proportions, however, could vary depending on the tank farm or individual tanks and the waste they received. For example, tanks in the S farm are expected to have less chromium relative to nitrate than those in the SX tank farm. Also, six tanks (S-108, S-109, S-110, S-111, S-112 and SX-102) are classified as high complexant tanks. Leakage or surface contam-ination from operation of these tanks could include a more mobile fraction of normally immobile radio-active constituents (e.g., transuranics). None of the high complexant tanks have been identified as known or suspected leakers. However, this does not preclude surface spills of this type of waste. Once mobile contaminants enter the groundwater, they will be transported in the near surface ground-water in the downgradient direction. As previously noted, flow direction can deviate due to preferential pathways in the partially cemented Ringold sediments. The general flow paths of patches of contami-nated groundwater and likely source areas are illustrated in Figure 2.6. The observations imply there is (or was) a source in the southwestern corner of SX tank farm that accounts for the transient occurrence of technetium-99, chromium (filtered) and nitrate in wells 299-W23-15 and 299-W22-46. A source area in the S tank farm that accounts for transient occurrences that drift in the south-southeastern direction and pass other wells in the corridor or flowpath is suggested as shown in Figure 2.6. Alternatively, multiple sources located near the wells could account for the observed spatial and temporal occurrences (i.e., more than three sources could be involved). Better fingerprinting tools would be needed to distinguish one tank waste source from another (see Wood et al. 1999 for additional discussion of possible tank farm multiple sources that could lead to variations in or different inferences than those presented here).

2.12
Figure 2.6. Spatial and Temporal Correlation of Observed Technetium-99 in Groundwater and Possible
Contaminant Source Areas in Waste Management Area S-SX (1986-1997)
2.13
Deviation from the expected more easterly flow may be a result of lithologic controls on groundwater movement due to irregular macroscale cementing of the Ringold Formation. Both tracer drift tests and careful evaluation of contaminant arrival patterns (from upgradient sources) in WMA–SX monitoring wells can be used to partially test the hypothesized flow paths depicted in Figure 2.6. Additional information concerning the hydrogeologic setting, waste source characteristics, facilities, leak volumes, and conceptual understanding of subsurface conditions beneath the single-shell tank farms can be found in a recent summary and description of related vadose information needs (Jones et al. 1998, Wood et al. 1999). 2.3.3 Summary Based on the foregoing discussion and previous data and findings (Johnson and Chou 1998; Myers et al. 1998; Jones et al. 1998, Wood et al. 1999), the conceptual model (for groundwater assessment purposes) that seems to best fit currently available information is summarized as follows:
• Episodic infiltration of surface water periodically re-mobilizes either surface contamination or subsurface leakage from tanks or ancillary equipment.
• The transient nature of the groundwater contamination events result in random pulses that originate
from both the S and SX tank farms. Based on this transient nature, some type of preferential flow through the vadose zone to groundwater may be involved.
• Contaminant pulses move toward the southeast at the rate of 25 to 50 m/yr but may follow an
irregular flowpath due to the non-homogeneous nature of the aquifer host rock (partially cemented Ringold sands and gravels).
• Infiltration events that occur through the vadose zone result in a shallow contaminant layer at the top
of the aquifer. More deeply distributed contaminants could occur under more extreme or isolated conditions such as high-density waste, surface water migration down a well, or natural preferential pathway.
3.1
3.0 Statement of the Problem or Key Issues The initial investigation of groundwater quality conditions at WMA S-SX (Johnson and Chou 1998) addressed the basic question of whether or not the WMA was responsible for contributing to groundwater contamination. Because it was concluded that the WMA has impacted groundwater (Johnson and Chou 1998), the general focus of the continued investigation is to determine the rate and extent of migration of the hazardous waste or waste constituents in the groundwater and their concentrations [40 CFR 265(d)(4)) and by reference of WAC 173-303-400(3)]. The fundamental issues for the ongoing groundwater investigation are:
• the uncertainty in the location or source of groundwater contamination within the WMA • the causative factors (driving forces) that account for the temporal and spatial transient occurrences of
tank waste constituents in downgradient monitoring wells at WMA S-SX • the unknown depth distribution of contaminants in the unconfined aquifer.
The decisions and associated information needs are discussed in Section 4.0.

4.1
4.0 Decisions The decisions identified below are regulatory driven as stated in 40 CFR 265.93(d)(4)(i) and (ii) [and by reference of WAC 173-303-400(3)] and as indicated in the Technical Enforcement Guidance Docu-ment (EPA 1986). The primary decisional information needs for the ongoing groundwater quality assess-ment at WMA S-SX involve determinations of:
• the rate and extent of migration of the dangerous waste or dangerous waste constituents in the groundwater
• the vertical and horizontal concentration profiles of the dangerous waste constituents in the ground-
water originating from the regulated unit. Key site-specific decisions (expressed as questions) are listed below. A detailed summary of deci-sions, information needs, decision rules, and data collection design is presented in Appendix C (Table C.1). 1. What is the flow rate and direction where tank waste constituents have been observed in
groundwater?
2. Are the monitoring wells strategically located to delineate contaminant plumes from the regulated unit?
3. What is the areal extent and depth distribution of contaminants in the aquifer?
4. Is the renewed occurrence of technetium-99 in well 299-W23-1 (or any other well in the network) a
localized/borehole related effect or more widely distributed in the aquifer?
5. Is cesium-137 in old well 299-W23-7 (located inside the S-SX tank farms) borehole related or is it distributed in the aquifer?
6. Has the isotopic and chemical nature of the source term waste constituents been adequately charac-
terized in groundwater? The information needed to address these decisions is discussed in Section 5.0.

5.1
5.0 Information Needs and Decision Rules This section describes the information needs for addressing the general decisions and site-specific questions identified earlier. For discussion purposes, the information needs for WMA S-SX are organ-ized by category as a statement highlighted in bold. Where appropriate, decision rules are provided. 5.1 Groundwater Flow Rate and Direction The rate and direction of groundwater flow is fundamental to assessing the rate of migration and extent of groundwater contamination from the assumed source. Placement of new wells to enhance the likelihood of detecting contaminant plumes and estimating the arrival times at some point of potential exposure (or point of compliance) depend on knowing the rate and direction of groundwater flow. A location map of existing groundwater monitoring wells around WMA S-SX is shown in Figure 1.2. Geologic cross-sections and as-built drawings of the existing RCRA and non-RCRA monitoring wells that will be used in the investigative activities are included in Appendix B. 5.1.1 Data Needs and Approach The flow rate and direction where tank waste constituents have been observed in groundwater need to be determined. This fundamental information must be acquired by investigative techniques based on field measurements. Flow Rate. Flow rate is a fundamental parameter for predicting hypothetical plume movement and distribution and for assessing travel time between locations within the WMA. As a result of the declining water table (due to the termination of wastewater discharges to the ground in 1995) and the associated flattening of the water table gradient in the vicinity of WMA S-SX, flow rates will also decline. Thus a more current estimate of this parameter is needed. The rate of disappearance of a tracer introduced to boreholes, coupled with hydraulic conductivity and hydraulic gradient, can be used to estimate flow rates. The approach proposed is to uniformly mix sodium bromide within the screened interval of key wells. Following addition of the tracer, periodic in situ bromide measurements over the length of the screened interval are made with a set of downhole probes. This approach will also provide information on the vertical distribution of hydraulic properties within the aquifer (i.e., bromide will disappear more rapidly from the more transmissive zones). Slug tests and constant rate withdrawal tests will be used to determine hydraulic conductivity in the wells selected for testing. The single-well tracer test is an integral part of the slug test task in the scheduled activities shown later in Appendix A.1.

5.2
An opportunistic approach will also be used in conjunction with the tracer studies. This involves use of the time of arrival of the peak concentration at a downgradient well. For this purpose, tritium and nitrate will be tracked in borehole 41-09-39 for as long as the borehole is available for sampling. The concentrations observed in 41-09-39 between January 1998 and April 1998, using two different sampling methods and three depths, are shown as horizontal lines in the trend graphs for upgradient well 299-W23-14, Figure 5.1. Sampling from the 0.5-m and 3-m depths were collected with standard Hydrostar pumping protocol. The 2-cm depth sample was collected with a passive discrete depth device. Well 299-W23-14 is located 100 m upgradient from borehole 41-09-39. Based on current observations, the apparent travel time between the upgradient RCRA well (299-W23-14) and borehole 41-09-39 (see Figure 2.2) is ~2 years or an apparent flow rate of ~50 m/yr. This estimate can be refined more precisely when the peak in the concentration-time plot is fully developed in borehole 41-09-39.
Figure 5.1. Comparison of Detected Constituents in Borehole 41-09-39 (collected April 1998) with
Constituents in Upgradient Well 299-W23-14

5.3
The same opportunity exists between wells 299-W23-15 and 299-W22-46 where nitrate, technetium-99 and chromium that peaked in 1993 at well 299-W23-15 are now peaking in 299-W22-46 (see Fig-ure 2.1). The apparent flow rate based on these two wells is 35 m/yr. However, additional time is required for the time-concentration pattern to fully develop. Another opportunistic approach is the use of a tracer injected into borehole 41-09-39 just before the casing is pulled to decommission the well. Arrival of the tracer at downgradient wells would provide another check on flow rate (as well as on inferred flow direction). If current estimates of flow rate are correct, it will take 2 years (~50 m/yr based on Figure 5.1) for the tracer slug to travel to the nearest downgradient well (299-W23-3). The more classical approach for estimating flow rate (Darcy velocity) will be used as another evalua-tion of flow rate. This approach is based on hydraulic conductivity (K) of the aquifer in combination with water table gradient. The hydraulic conductivity will be estimated using slug tests and pumping tests in selected monitoring wells. Flow Direction. Flow direction will be inferred from water table elevations in available wells (both RCRA and non-RCRA wells). This approach depends on accurate depth-to-water measurements. Baro-metric evaluation will be conducted if needed. Reliable casing elevations will be obtained or assessed based on available information. After depth-to-water corrections are made, the water level measurements will be used to map the flow direction in the immediate vicinity of the WMA (wells identified for this purpose are described in Appendix B). Current estimates of flow direction are shown in Section 5.1.2, Figure 5.3. 5.1.2 Data Uses The flow rate and direction will be used as input parameters to predict contaminant plume (or patch) distribution patterns from sources within the WMA (e.g., MEMO model). This information will, in turn, be used to guide placement of new or replacement wells needed to enhance the monitoring well network. Model predictions can also be used, in conjunction with observed downgradient results from monitoring wells, to address the question of magnitude of the contamination (i.e., maximum concentrations relative to a risk-based standard). 5.2 Placement of Monitoring Wells Monitoring wells must be strategically located to delineate contaminant plumes coming from the regulated unit. The monitoring well, spatial coverage needs enhancement to increase the likelihood of detecting con-tamination from WMA S-SX and to evaluate areal extent of contamination. The four older wells located inside the tank farms can serve as interim wells for enhancing spatial coverage until they are abandoned. In addition, new wells located to fill gaps in spatial coverage and replacement wells due to declining water levels will be installed in accordance with the Hanford groundwater project RCRA drilling sched-ule. Criteria for when and where new wells are to be installed are: 1) projected time for water level to

5.4
reach the bottom of existing wells (see Appendix B); 2) anticipated shifts in flow direction (more easterly flow is anticipated as water level continues to drop); and 3) existing gaps in spatial coverage. Historical water levels and an indication of the recent rate of decline are illustrated in Figure 5.2. Tentative locations for three new wells planned for FY99 are shown in Figure 5.3. These locations are intended to:
• increase probability of detecting leaks from S farm (and/or to assess the areal extent of groundwater contamination at this location)
• extend coverage and to allow for losses due to declining water level in the southeast corner of
SX farm • investigate the depth distribution of current groundwater contamination at the southeast corner of
SX tank farm. Two existing non-RCRA wells (299-W23-9 and 299-W23-4) are also proposed as substitutes for the two upgradient RCRA wells (299-W23-13 and 299-W23-14) that will go dry in 1999. In addition to the “near field” or compliance boundary monitoring wells discussed above, there is a need to supplement the site-wide well network to better define the “far-field” extent of contaminants from the WMA. The area southwest of WMA S-SX has an insufficient number of wells to define possible contaminant distribution from the WMA in that area. Far-field wells will be included in out-year drilling plans (i.e., after enhanced spatial coverage near the S and SX tank farms and replacements for wells going dry). The specific locations and prioritization for outyear wells will be decided jointly between DOE, contractors, tribes, and Ecology representatives.
Figure 5.2. Historical Water Levels Beneath SX Tank Farm
175
180
185
190
195
200
205
210
215
Oct-54 Mar-60 Sep-65 Mar-71 Aug-76 Feb-82 Aug-87 Jan-93 Jul-98 Jan-04
Sample Date
Dep
th (f
t)
299-W23-3 299-W23-4

5.5
103 102 101
106 105 104
108 107
112 111 110
115 114 113
103 102 101
106 105 104
109 108 107
112 111 110
109
241-SY
241-SX Tank Farm
241-S Tank Farm
216-S-8Trench
W23-10
W23-9
W23-11
W23-13
W23-14
W23-8
W22-44
W23-15
W23-3
W22-39
W23-2
W23-7
W23-12
W23-1
W22-45
0 10050
Meters
1999/DCL/S-SX/024
W23-5
41-09-39
����
216-S-3 Cribs
216-S-4 Crib
216-SX-2 Crib
����241-SX-152
����������241-S-151
216-S-25 Crib
241-S-A Valve Pit
241-S-D Valve Pit
241-S-C Valve Pit
241-S-B Valve Pit
241-S-302B Catch Tank
102 101
103
241-SX-302Catch Tank
����
241-S-152
241-SX-151
241-SX-A&B Valve Pits
241-S-302ACatch Tank
103
Existing RCRA Network
Old Wells in AssessmentNetwork
Non RCRA Wells
Exploratory Borehole/Well(1997)
New RCRA Wells, FY99
New Deep RCRA Well, FY99
104Suspected/ConfirmedLeaking Single-ShellTank
Single-Shell Tank
���������������� Diversion Box
����
All S Tank names prefixed by 241-S-All SX Tank names prefixed by 241-SX-
B
104°
99°
109°
104°
116°
128°
A
1
2
3
216-S-21Crib
W23-4
WMA Boundary
W23-6W22-46
Groundwater Flow Direction
One Standard Deviation
One Standard Deviation
AB
Based on all network wells
Based on southeast wells only
W22-16
W22-6
UPR-200-W-10
UPR-200-W-49
UPR-200-W-80UPR-200-W-81
Unplanned Release (UPR)
UPR-200-W-51
Figure 5.3. Location Map of Existing and New Monitoring Wells Around Waste Management Area S-SX. (The indicated flow directions are based on solutions of the “three point problem” for determining inferred flow direction from water table elevations. Water level data for 1992 to 1997 were used from which a mean and standard deviation was calculated.

5.6
5.3 Extent of Contamination The manner in which the contaminants are distributed (i.e., vertically) in the aquifer can provide indi-cations of the nature of the vadose zone source and driving forces and likely transport processes through the vadose zone to groundwater (e.g., preferential pathways). Thus, this information need supports both the ongoing groundwater assessment as well as the tank farm facility investigation and/or corrective measures study. The chemical and physical nature of potential tank farm related groundwater contamina-tion is also an important aspect of the groundwater assessment. 5.3.1 Contaminant Depth Distributions The depth distribution of contaminants in the aquifer need to be assessed. As previously indicated, distinguishing between two basic transport processes responsible for ground-water contamination, i.e., saturated flow (where all pores spaces in the vadose zone are filled with water) or unsaturated flow, is fundamental to understanding driving forces within the WMA and identifying appropriate corrective measures. The answer may provide information about the nature of the driving force responsible for the occur-rence of contamination in the aquifer. For example, if there is a large utility line leak that mobilizes con-taminants by localized saturated flow, the contaminant should be more deeply distributed in the aquifer. However, if mobile contaminants were transported with slowly migrating moisture from natural infil-tration or a slow water line leak source (unsaturated flow) the contaminants should be distributed at shallower depths at the top of the aquifer. As noted above, contaminant transport through the vadose zone by unsaturated flow conditions would tend to concentrate the contaminant at the very top of the aquifer assuming salt content is diluted suffi-ciently so there is no density effect. On the other hand, migration of relatively undiluted, high density tank liquor through the vadose zone and into the aquifer would result more likely in a greater depth distri-bution as the dense liquid settles. The contaminant depth profile in the aquifer for the latter case would not show a sharp decline with depth. The considerations discussed above lead to the following decision criteria:
• If concentrations are highest at the very top of the aquifer and decrease rapidly with depth, unsatu-rated flow and dilution of the waste (i.e., low density) is implied. If there is a more uniform con-centration with depth, saturated flow may be implied.
• If concentrations increase with depth, rather than decrease, then density driven transport through the
vadose zone or via a preferential pathway may be indicated. If so, then depth extended boreholes or new deep monitoring wells may be needed to determine the maximum depth of occurrence. Alter-natively, enhanced infiltration and drainage of non-contaminated water down to the water table could depress or dilute the existing plume and cause the impression of an increase in concentration with depth.

5.7
5.3.1.1 Data Need and Approach The approach to obtaining the field data needed is to sample near the interface (0 to 2 cm depth layer) from selected monitoring wells, depth profile sampling within screened interval in selected wells, and during drilling of new wells planned for extending spatial coverage. Specific candidate wells in or near WMA recently (or currently) exceeding the drinking water standard for technetium-99 (900 pCi/L), nitrate or chromate (mobile tank waste indicators) are 299-W23-1, 299-W22-46, and 299-W22-45. If preliminary in situ profiling using electrical conductance and temperature suggest much higher concentrations at 0 to 2 cm than at greater depths, a Kabis discrete depth sampler or low purge volume sample system will be used in selected wells to acquire sufficient sample volume near the surface of the static water level in the well to analyze constituents of interest (e.g., technetium-99, nitrate, chromate, major anions, and cations). Vertical profiles of electrical conductivity should also define the thickness of the shallow surface contaminant layer. If such a condition exists, it could require a different approach to groundwater monitoring at this regulated unit (e.g., shallower depths for pump intake). To determine contaminant concentrations at greater depths (e.g., down to the bottom of the aquifer), sampling during drilling of new monitoring wells will be used. The need for replacement wells due to the declining water table provides opportunities to acquire additional depth data by extended drilling prior to completion of the replacement well. A drill and test mode will be used for this purpose during installation of new monitoring wells downgradient of SX tank farm.
5.3.1.2 Data Uses Results of this effort will be used to help answer fundamental questions about how contaminants enter the aquifer (an Expert Panel concern and closeout recommendation). The concentrations and depth of occurrence are also basic information needed by Ecology and DOE to decide if some type of remedial action may be appropriate (e.g., pump and treat). Alternatively, if contaminant concentrations well above drinking water standards are distributed too deeply to be effectively remediated, the knowledge is important to address long-term risk issues. 5.3.2 Origin of Technetium-99 in Groundwater Determine whether the renewed occurrence of technetium-99 in well 2-W23-1 is a localized/borehole related effect or is more widely distributed in the aquifer. A similar approach proposed for well 299-W23-7 could also be used to evaluate the nature of the transient occurrences in either this well or others. If the contaminant is a result of surface water transport along the casing wall, the distribution in the groundwater should be localized at the well. Extended pumping of the well in this case should show a sharp decline in technetium-99 and nitrate as a function of purge volume removed. This approach could be applied to any of the wells that exhibit short-term or transient contaminant response pattern. However, timing is important in these cases because there is a limited window of time within which to conduct the test. Continuous recording in situ electrical

5.8
conductivity probes have been purchased and are being considered for installation in key tank farm wells, including WMA S-SX. Therefore, an early warning of a transient event should be possible.
5.3.2.1 Data Need and Approach Information from this test would help explain the nature of transients in technetium-99, nitrate, and chromium concentrations that have been observed in this older S tank farm groundwater monitoring well. If due to a localized effect related to the borehole (poor seal), then decommissioning of the well can eliminate recurrence of groundwater contamination events at this location. The approach is to pump and sample with time. A borehole related effect should exhibit a sharp decline with extended pumping.
5.3.2.2 Data Uses The data from this type of test would contribute to the overall assessment of the rate and extent of groundwater contamination in the tank farm and how vadose zone contaminant in the tank farm may episodically reach groundwater. 5.3.3 Origin of Cesium-137 in Groundwater Determine whether cesium-137 in old well 299-W23-7 (located inside the S-SX tank farms) is a borehole effect or is distributed in the aquifer.
5.3.3.1 Data Need and Approach It has been hypothesized (DOE 1997) that cesium-137 could be more mobile than previously thought based on laboratory sorption data. The possible mechanisms and transport pathways proposed include colloid formation or association with colloidal size solids and transport along preferential pathways to groundwater. (Colloids are generally defined as particles below approximately 1 micrometer in size that are subject to Brownian motion; i.e., tend to remain in suspension. Consequently, they could migrate through porous media along with solutes in the liquid phase. A 0.45 micrometer membrane filter will pass smaller colloidal size material but will retain the >0.45 micrometer size particles). The only signif-icant detection of cesium-137 in groundwater in the immediate vicinity of WMA S-SX has been in well 299-W23-7. It was determined that this occurrence is real (i.e., above detection limits) and that it is particulate in nature (filtered versus unfiltered results). Because of the potential pathway indicated above, it is deemed important to determine the origin of cesium-137 in groundwater. Elevated gross alpha (>200 pCi/L) also has been recently detected in this well. The well in question is not located near any single-shell tank or currently known source of subsurface contamination. Also, spectral gamma logging indicated cesium-137 was near the detection limit (<1 pCi/g) for the entire length of the borehole, indicating the well did not pass through a contaminant zone. Thus if the low-level occurrence (maximum of 47 pCi/L) in this well is distributed in the aquifer, transport through the vadose zone to groundwater at an upgradient location and then movement toward this well in groundwater is implied. Other possible explanations include cross contamination from previous surface work around the well (e.g., fall in of fugitive dust, runoff, or contaminated tools) or surface contamination

5.9
from past transfer line leaks that ran down the well. If the latter is the case, then cleaning the well should remove this type of source (i.e., borehole-related effects). However, if the cesium is distributed in the aquifer, then the cesium-137 concentration in water pumped from the well should not change after cleaning the well and subsequent cleanup pumping. Also, a particle size distribution analysis (use of various pore size membrane filters and or particle size analyzer) could provide additional clues about the particulate/colloidal nature of the observed cesium-137 in the well. Thus, cleaning the well followed by development pumping with periodic sampling and particle size analysis should allow distinction between these two working hypotheses.
5.3.3.2 Data Uses The study outcome can be used to determine if low but detectable amounts of cesium-137 observed in well 299-W23-7 is an artifact of the well or an indication of aquifer contamination. If it is an artifact, either the well can be decommissioned or renovated by improving the recharge to the well and con-structing better seals. If the source is distributed in the aquifer (i.e., if it is still present after removal of a large volume of water), then it may support the hypothesized colloidal cesium transport mechanism and pathway. 5.3.4 Characterization of Source Term Waste Constituents Additional characterization of the isotopic and chemical nature of the source term waste constituents may be needed.
5.3.4.1 Data Need and Approach Additional isotopic and chemical characterization of the water samples is a basic information need. Optimization of this effort will involve using selected sampling (only those wells that have exhibited high technetium and other tank waste indicators). Thus the chances of finding the more exotic constituents would be maximized. Finding a more complete list of tank waste chemical constituents and isotopes would further tie the groundwater contamination to a tank waste source. At the present time, there are known upgradient sources of at least three of the same mobile contaminants (nitrate, technetium-99, and tritium) that are attributed to the tank farms, complicating interpretation. Thus the more definitive the fingerprint the more confidence in identifying specific sources within the WMA. Contaminated Soil Leachates. Comparing the list of isotopic and chemical constituents in ground-water with the water leachable fraction from contaminated soils beneath major tank leak or spill sources could allow either exclusion of major suspect sources or reduction of the target area for potential cor-rective measures. Leachates of actual contaminated soils are more reliable than tank waste composition estimates and tank waste analytical results because the soil contamination represents what actually was released from the tanks and available for potential re-mobilization. Contaminated soil samples near tanks SX-108 and SX-109 will be collected (Tank Farm Vadose Zone Project) during decommissioning of borehole 41-09-39 in 1999. These samples will provide valuable information on leachable or mobile contaminant ratios for this major potential source that can be compared directly with contaminant ratios observed in downgradient monitoring well 299-W22-46.

5.10
Colloids and Complexes. The documented occurrence of colloidal transuranics in groundwater at other DOE sites underscores the need to determine if such phases exist at the Hanford Site and, if so, the relative abundance or importance of this potential pathway. Investigation of colloidal transuranics was also included in the national laboratory recommendations for the integrated vadose/groundwater/river project. As previously noted, the potential for colloidal phases of cesium in the vadose zone beneath WMA S-SX was proposed as a possibility by the expert panel (DOE 1997). Transuranics in tank waste liquor may also be capable of greater mobility as a colloidal phase. Low-level methods will be used to screen for total plutonium in groundwater in selected wells. If detectable amounts are found, ultrafiltration cartridges (varying pore sizes in the low sub micron range) will be used to assess or characterize its physical-chemical nature. If most of the transuranics passes through the submicron filters, a solute complex form is implied. Because some of the tanks in the S-SX farms received complexants, this is also a possibility.
5.3.4.2 Data Uses The outcome of this study will be used to more closely link observed groundwater contamination to major tank waste leak sources (e.g., SX-108/109 or SX-115) or to exclude the likelihood of specific tank waste sources. Based on discussions presented in this section, a summary of the data acquisition needs, decisions, and approach to acquire new assessment data is provided in Appendix C. Optimized design for data acquisitions are presented in Section 6.0.
6.1
6.0 Optimized Design for Data Acquisition This section discusses alternatives for obtaining critical data that either reduce costs or provide more timely information for key decisions. The stand-alone sampling and analysis plan includes associated task descriptions, schedules, and quality assurance plan and is presented in Appendix A. 6.1 Use of Existing Non-RCRA Standard Wells As previously indicated, the old wells inside the S and SX tank farms are of value for extending spatial coverage for assessing areal extent of contamination (see Appendix B for as-builts and refer to Figure 5.3 for locations). These will be used for as long as the water table is above the bottom of the well. Upgradient wells 299-W23-4 and -9 are also important for assessing contaminants from upgradient sources because the two existing upgradient RCRA wells are going dry. Use of the older upgradient wells will allow available resources to be concentrated in the downgradient areas of WMA S-SX. A discussion follows about some of the older, non-RCRA wells that are also useful for groundwater characterization purposes. Cesium-137 Occurrence in Well 299-W23-7. At well 299-W23-7, an integrated approach is proposed that involves the CERCLA well decommissioning activity. The old wells inside the tank farms are on the decommissioning list. Because the first step is to perforate the casing prior to grout injection, this step should improve flow into the well so that the planned pumping and sampling can be conducted. At the present time, water can no longer be pumped from this well. If the re-perforation does not improve the flow, the well will be abandoned. Flow Rates. Opportunistic tracer tests, as described in Section 5.1.1.1, will be used to the maximum extent possible to assess flow rates. Routine monitoring provides the measurements necessary so that no additional costs are incurred by this approach. Use of arrival times of tritium in downgradient monitoring wells, which originated from upgradient disposal sites, provides another opportunity to estimate flow rates. There appear to be three cases where this can be done. The proposed tracer injection test in borehole 41-09-39 should serve as confirmation of flow rate estimates based on tritium arrival times. However, the latter information will not be available for about 2 years (i.e., travel time to nearest down-gradient well) whereas the contaminant arrival time approach can provide early information. Initial estimates based on three well pairs and two contaminants (technetium-99 and tritium) suggest ground-water flow rates of 30, 35, and 50 m/yr across the SX tank farm area. These estimates will be subjected to more rigorous statistical evaluation to test the robustness of the estimates.

6.2
6.2 Surrogate Analytes to Reduce Analytical Costs Gross beta and gross alpha will be used in conjunction with other measurements in lieu of continuing quarterly sampling for strontium-90 and cesium-137 (low-level gamma) in all network wells. The routine or key constituents include: • technetium-99 • nitrate (anion group) • chloride (anion group) • chromium (ICP metals group) • pH and electrical conductivity • gross alpha • gross beta • uranium. If the reported gross beta exceeds the expected gross beta level based on the technetium-99 present, then more specific isotopic analyses will be requested (e.g., strontium-90 and low-level gamma for cesium-137). Likewise, if gross alpha exceeds the expected alpha activity due to uranium, transuranics analyses will be requested. Special sampling for the more exotic isotopes listed above will be limited to those wells where significant tank waste indicators have occurred. 6.3 Depth Profiles: In Situ Probe and Field Screening Measurements Downhole specific conductance and temperature profiles in each well will be used to indicate the likelihood of detecting the hypothesized shallow contaminant layer. This will be accomplished by first removing the pump from each well and allowing a few weeks for the well to re-equilibrate. Then an in situ probe (e.g., a Hydrolab - pH, conductivity, Eh, temperature sonde) will be used to obtain a contin-uous profile over the screened interval. If the sonde is moved downward slowly in the well casing to prevent mixing, distinct and reliable profiles can be obtained. If significant amounts of technetium-99 are present, then nitrate should be elevated and the specific conductance sensor will detect it. Approximately 100 pCi of technetium-99 per mg/L of nitrate occurs at S-SX. Thus any significant occurrence, such as 3,000 to 4,000 pCi/L of technetium-99, would be equivalent to 30 to 40 mg/L of nitrate or a conductivity increase of about 60 µS/cm as compared to ambient background of about 225-250 µS/cm. The temperature profile can also indicate if favorable conditions exist for a layer at the top of the acquifer, because warmer water exists in the top of the aquifer. In those wells that have an indication of stratification, follow-up water samples will be collected for the constituents described in Section 6.2. Using this screening approach, the number of wells that must be sampled at multiple depths can be greatly reduced and considerable reduction in analytical costs also can be achieved. 6.4 Use of National Laboratory Capabilities As a result of the integrated vadose/groundwater/river project, national laboratory experts and state-of-the-art instrumentation are available to ensure sound assessments and remedial action are conducted.

6.3
Collaboration among Hanford Site scientists and the other national laboratories will address low-level transuranics in groundwater at selected wells at WMA S-SX as well as at other key locations on the Hanford Site. In addition, Pacific Northwest National Laboratory sponsored a modest, laboratory-directed, ground-water isotope colloid research study that will include sampling where single-shell tank farm waste constit-uents have appeared in groundwater. Both the national laboratory initiative and the Pacific Northwest National Laboratory study will be coordinated closely with the interests of the S-SX assessment. 6.5 Timing and Coordination The order in which planned activities are conducted is an important aspect of an optimized sampling and analysis plan as described in Appendix A. The following key activities will dictate subsequent activities for the S-SX WMA and, therefore, need to be conducted first. Flow Direction. Improved prediction of flow direction is needed early for optimum placement of new wells. Therefore, field work to assess depth-to-water and flow direction mapping needs to be addressed as early as feasible. Depth Profile Screening. Initial or screening measurements to assess the likelihood of a gradient in contaminant concentrations with depth is needed at an early date in order to decide if additional large volume sampling will be needed. Accordingly, the in situ probes proposed for this activity will be run as part of the hydrologic testing (slug tests) since the sampling pumps must be pulled at that time. Both activities can be conducted at the same time and avoid duplication of labor needed for removing and re-installing pumps. Slug Tests. Hydraulic conductivity is computed from these tests, which are in turn needed as input for flow rate calculations. Costs can be minimized by conducting all the tests at the time the pumps are pulled. New estimates of hydraulic conductivity are appropriate because water level has declined signifi-cantly and aquifer properties may be different than they were at the time the wells were installed in 1990 to 1992. The four RCRA compliant wells (299-W23-15, 299-W22-46, 299-W22-45, and 299-W22-46) installed with extended screens will be the primary targets for this activity. Advanced Isotopic Analysis. Samples for assessing the presence or absence of detectable transuranics using ultra low-level methods will be conducted early so that subsequent investigations to characterize the physical-chemical nature (colloid versus solute-complex) can be planned. Thus, samples will first be col-lected at wells where tank waste constituents have been identified. 6.6 Integration with Site-Wide Groundwater Monitoring Project The Hanford Site Groundwater Monitoring project, conducted by PNNL for DOE, tracks the general distribution of contaminant plumes across the Hanford Site from sources areas to the Columbia River. Key wells used for this purpose include some of those in the network for WMA S-SX, thus co-sampling can reduce costs for both projects. Additionally, WMA S-SX efforts benefit from the area-wide plume
6.4
maps and water table maps for the 200 West Area. Special investigations are also conducted under the auspices of the overall ground water monitoring project. Coordination of special investigations conducted by the site-wide project (e.g., colloidal transuranics and/or cesium-137 studies) with the WMA S-SX assessment activities will also help provide the information needs identified in this plan.

7.1
7.0 References Public Laws Resource Conservation and Recovery Act of 1976, as amended, Public Law 94-580, 90 Statute 2795, 42 USC 6901 et seq. Code of Federal Regulation 40 CFR 265, Code of Federal Regulations, Title 40, Part 265, Subpart F. Interim Status Standards for Owners of Hazardous Waste Treatment, Storage, and Disposal Facilities. Revised Code of Washington RCW 70.105, Revised Code of Washington, Title 70, Chapter 105. Hazardous Waste Management Act. Washington Administrative Code WAC 173-303-400, Washington Administrative Code. Interim Status Facility Standards, Olympia, Washington. WAC 173-303-610, Washington Administrative Code. Closure and Postclosure, Olympia, Washington. Others Caggiano, J. A. 1996. Groundwater Quality Assessment Monitoring Plan for Single-Shell Tank Waste Management Area S-SX. WHC-SD-EN-AP-191, Rev. 0, Westinghouse Hanford Company, Richland, Washington. Chou, C. J., and V. G. Johnson. 1998. “Balancing CERCLA and Facility Operations: Application of the DQO Process at Hanford’s Spent Nuclear Fuel Storage Basins,” in Annual Proceedings of the Institute of Nuclear Materials Management, July 26 – 30, 1998, Naples, Florida. DOE. 1996. Vadose Zone Characterization Project at the Hanford Tank Farms – SX Tank Farm Report. DOE/ID/12584-268, GJPO-HAN-4, U.S. Department of Energy, Richland, Washington. DOE. 1997. TWRS Vadose Zone Contamination Issue, Expert Panel Status Report. DOE/RL-97-49, U.S. Department of Energy, Richland Operations Office, Richland, Washington. DOE. 1998. Hanford Tank Farms Vadose Zone – S Tank Farm Report. GJO-97-13-TAR, GJO-HAN-11, U.S. Department of Energy, Richland, Washington.

7.2
Ecology – Washington State Department of Ecology, U.S. Environmental Protection Agency, and U.S. Department of Energy. 1989. Hanford Federal Facility Agreement and Consent Order. Document No. 89-10, Rev. 4 (The Tri-Party Agreement), Ecology, Olympia, Washington. EPA. 1986. RCRA Groundwater Monitoring Technical Enforcement Guidance Document. U.S. Envir-onmental Protection Agency, Washington, D.C. EPA. 1994. Guidance for the Data Quality Objective Process. EPA QA/G-4, U.S. Environmental Protection Agency, Washington, D.C. Johnson, V. G., and C. J. Chou. 1998. Results of Phase I Groundwater Quality Assessment for Single-Shell Tank Waste Management Area S-SX at the Hanford Site. PNNL-11810, Pacific Northwest National Laboratory, Richland, Washington. Johnson, V. G., and C. J. Chou. 1999. Addendum to the RCRA Assessment Report for Single-Shell Tank Waste Management Area S-SX at the Hanford Site. PNNL-11810 ADD.1, Pacific Northwest National Laboratory, Richland, Washington. Jones, T. E., R. Khaleel, D. A. Myers, J. W. Shade, and M. I. Wood. 1998. A Summary and Evaluation of Hanford Site Tank Farm Subsurface Contamination. HNF-2603, Rev. 0, Lockheed Martin Hanford Company, Richland, Washington. Lindsey, K. A. 1991. Revised Stratigraphy for the Ringold Formation, Hanford Site, South-Central Washington. WHC-SD-EN-EE-004, Westinghouse Hanford Company, Richland, Washington. Meyers, D. A., D. Moak, D. Parker, G. Gee, J. Serne, V. Johnson, and G. Last. 1998. Findings of the Extension of Borehole 41-09-39, 241-SX Tank Farm. HNF-2855, Lockheed Martin Hanford Company, Richland, Washington. Serne, R. J., J. M. Zachara, and D. S. Burke. 1998. Chemical Information on Tank Supernatants, Cs Adsorption from Tank Liquids onto Hanford Sediments, and Field Observations of Cs Migration from Past Tank Leaks. PNNL-11495, Pacific Northwest National Laboratory, Richland, Washington. Ward, A. L., G. W. Gee, and M. D. White. 1997. A Comprehensive Analysis of Contaminant Transport in the Vadose Zone Beneath Tank SX-109. PNNL-11463, Pacific Northwest National Laboratory, Richland, Washington. Wood, M. I., V. G. Johnson, S. P. Reidel, and T. E. Jones. 1999. Subsurface Conditions for the S-SX Waste Management Area. HNF-4936, Rev. 0, Lockheed Martin Hanford Corporation, Richland, Washington.

Appendix A

A.1
Appendix A This appendix consists of a field sampling plan (FSP) and a quality assurance project plan (QAPP). The FSP specifies the data collection design and the QAPP includes the procedures and project manage-ment controls intended to ensure the data collected and associated measurement errors are appropriate to meet the quantitative and qualitative needs of the study. Together these two plans form the Sampling and Analysis Plan. The Sampling and Analysis Plan is used as the principal controlling document for con-ducting the work identified in Section 5.0. A detailed summary of decisions, information needs, decision rules, and data collection design is presented in Appendix C (Table C.1). Activities that address the various information needs are grouped together where possible to make the most cost-efficient use of available resources. Accordingly, data needs may be addressed in more than one task or in different tasks than suggested by the titles and listing of data needs in Table C.1. The task/ activity schedule is included in Appendix A.1 (Figure A.1). A.1 Field Sampling Plan This appendix contains the data collection design and activity schedule for the continued groundwater quality assessment of waste management area (WMA) S-SX. The schedule for conducting specific tasks for this assessment is shown in Figure A.1. A description of each task as identified in the schedule (Fig-ure A.1), by task number and title, is provided as follows. Additional discussion and background infor-mation associated with the tasks are provided in the main body of the plan. A.1.1 Task Descriptions The tasks described as follows are a subpart of the Hanford Groundwater Monitoring Project man-aged for the U.S. Department of Energy (DOE) by Pacific Northwest National Laboratory. The dates indicated in Figure A.1 for the following task descriptions are approximate time periods or windows. Actual start and end dates may shift as detailed field plans by Waste Management North West are planned and scheduled and as parallel planning activities converge. It should be noted that personnel and equipment availability conflicts might cause deferral or rescheduling of some of the proposed work in this plan. Scheduling conflicts for critical path work will be resolved by management prioritization and or by use of subcontract labor as needed. The need to coordinate with the evolving RFI-CMS plans and associated vadose characterization may also alter the schedule to accommodate co-sampling opportunities.

A.2
A.1.1.1 SSX-1, Special Isotopic Analyses This preliminary effort will be used to determine if transuranics are present at concentrations lower than typically considered in regulatory monitoring programs and, if so, to determine if there is evidence for a complex or colloidal phase that enhances subsurface transuranic mobility. The Pacific Northwest National Laboratory (in collaboration with other national laboratories) is conducting a laboratory research study related to this objective. The needs of the WMA S-SX assessment will be closely coordinated with these studies to avoid duplication of effort and to share information and resources. A subsequent subtask plan will be prepared if there is sufficient indication to justify a colloid or mobile transuranics investiga-tion. Supplemental funding would be needed for a more intensive study of a potential colloidal phase and or complexed species. Exploratory groundwater samples for low-level isotopic analyses (e.g., plutonium-239/240 or stable fission product isotopes) will be collected where tank waste indicators have recently appeared (wells 299-W23-7, 299-W22-46 and 299-W23-1). The primary quality control objective of this task for the WMA S-SX assessment work is to ensure that appropriate water samples are collected for the special isotopic work. Because of the high sensitivity of the analytical methods to be employed, considerable care will be needed to prevent contamination of the samples during collection activities. Appropriate blanks and splits will be collected. The project scientist for the WMA S-SX assessment (V. Johnson, 509-376-0916) or his designee will supervise and or coordinate collection of these samples during a routine sampling event at the selected monitoring wells. A.1.1.2 SSX-2: Well Testing and Special Sampling This task combines those activities that require removal of the sample pumps for free access to the well. Cost savings are achieved by combining the activities and minimizing disruption of the ongoing monitoring program. The specific testing to be conducted under this task includes:
• hydraulic slug tests (includes borehole tracer test for velocity and hydraulic conductivity profile) • hydrochemical profiling (continuous pH, conductivity, Eh, temperature with depth to check for
vertical gradients) • surface sampling (top 0 - 2 cm layer).
Four existing RCRA wells and the three new wells planned for fiscal year 2000 (FY00) will be tested. The new wells will be tested after they are developed. Surface contamination of the pump and tubing must be prevented during removal and storage at the well head. The slug tests will be conducted first in the four existing RCRA wells suitable for hydrologic testing. (Note: only wells 299-W23-15, 299-W22-44, 299-W22-45 and 299-W22-46 have adequate water depth left to support hydrologic testing.) Ample time will be allowed for the well to re-equilibrate. The Kabis sampling (Mod II) and the hydrochemical profiling (Hydrolab sonde) will then be conducted in


A.5
these wells. The Kabis and sonde must both be lowered into position very slowly to minimize distur-bance, especially near the surface of the water in the well. The RCRA groundwater sampling group, Waste Management North West, will collect the Kabis samples and conduct the Hydrolab sonde meas-urements as instructed by the WMA S-SX Project Scientist. Analytes collected with the Kabis sampler are limited to anions, ICP metals, technetium-99, and tritium. A portable membrane filter apparatus will be used for filtered metals. Also, due to the 1,200-cc volume of the Kabis Mod II, the sample volumes submitted to the laboratory may be less than normally specified. Logistics of the activities must be coordinated with various components of the groundwater mon-itoring program. Initiation of the work will begin soon after the quarterly samples have been conducted. This should allow ample time to complete the work and re-install the sample pumps prior to the next regularly scheduled quarterly sampling event. A.1.1.3 SSX-3: Transport Modeling and Directional Mapping This task involves 1) predictive distribution of hypothetical contaminants released within the WMA and the likelihood of detection in available and/or planned monitoring wells; and 2) preparation of revised groundwater flow direction maps based on updated/corrected water level data from Task SSX-2. Modeling. This task will utilize the MEMO model for assessing monitoring well detection efficiency. The model has been used since 1992 to assess the efficiency of well spacing for various RCRA regulated units at the Hanford Site and to determine the number and optimum spacing of monitoring wells. Recent review comments from Ecology have raised doubt concerning the adequacy of spatial coverage of the existing well network at WMA S-SX. To address these concerns, this task will evaluate the MEMO model results using revised or varied input parameters (initial source dimensions, dispersivity, flow direc-tion and rate estimates, etc.). Changing input conditions and scale will be needed for this application. These will include average flow rates of 25 and 50 m/yr, three assumed possible flow directions (due east, due south and southeast), and initial source widths of 10, 20, and 40 m. The latter is chosen to simulate both small and large leak dispersion areas in the vadose zone. Output from this task will be used to help determine the likelihood of whether or not the monitoring network will intersect hypothetical contaminant plumes originating within the WMA under a range of directions to simulate non-uniform or irregular travel paths. Overall network detection efficiency will then be determined based on the composite results. This information will be communicated to Ecology and other interested parties and a joint decision will be made concerning the need for and location of additional monitoring wells. Flow Direction Mapping. The directional information is needed also to aid in selection of optimum locations for new wells to more adequately assess areal extent of groundwater contamination in the immediate vicinity of WMA S-SX. This activity involves use of depth-to-water information in network wells and any additional corrections or adjustments in depth to water that may be needed. A flow net map will be prepared using computer codes that simultaneously use all wells in the network. This map, in combination with the MEMO results, will be used to select the optimum locations for the new wells.

A.6
A.1.1.4 SSX-4: Well Drilling and Testing Determining the extent of groundwater contamination is required for this groundwater quality assess-ment (see Table C.1). For this purpose, three new wells are scheduled (and funded) for FY99 and several additional wells in the out years subject to availability of funding. One will be added in FY99 to increase downgradient spatial coverage at S farm. The other will be drilled (in FY99) to increase spatial coverage at SX tank farm. One deep well will be drilled to assess the depth distribution or vertical extent of contaminants. The latter will be drilled adjacent to well 299-W22-46 that currently exhibits elevated technetium-99 (Figure A.2). As indicated in task SSX-2, hydraulic slug tests will be conducted after wells are developed. Outyear (Figure A.1) drilling planing will include consideration of far-field wells to better define plume distribution. This task will comply with the requirements for monitoring well design and construction as specified in 40 CFR 265.91(c) by reference of WAC 173-303-400(3). Specifications for well designs and proce-dures for performing the well installations are contained in Washington Administrative Code (WAC 173-160) and contractor/sub-contractor procedure manuals (see Appendix A.2). Only special conditions related to the WMA S-SX groundwater assessment are described in this plan. Three ongoing and concurrent activities may result in amending the well drilling and testing task described in this plan. These activities are 1) a drilling DQO effort to prioritize all Hanford Site RCRA drilling; 2) the integrated vadose and groundwater project plan; and 3) development of the RFI workplan for WMA S-SX and adjacent facilities in accordance with new TPA milestones. The drilling task described here should be considered as the base case that could change as a result of these activities. This task addresses both areal and vertical extent of contamination. Variation in contaminant distri-bution with depth in the unconfined aquifer (as discussed in Section 5.0) includes the interface between the vadose or unsaturated zone and the water table. The objective is to investigate the overall variation with depth and the downward vertical extent of contaminant distribution in the unconfined aquifer. One deep borehole will address the vertical contamination issue down to the bottom of the unconfined aquifer. Capillary Fringe Zone Sampling. If contaminants enter the groundwater from beneath the tank farm under unsaturated flow conditions, they may be at their highest concentrations in the vicinity of the capil-lary fringe (above the water table) and in the near-surface groundwater especially very near the source, e.g., at the downgradient monitoring well locations. That is, because of the declining water levels (see Figure 5.2), residual contamination from previous contaminant plumes may be present above the present day water table. To evaluate this possibility, 1-L samples of drill cuttings will be collected at ~1.5 m increments beginning at least 6 m above the estimated static water level in the vicinity of the new S farm well and the two new SX wells. The samples will be refrigerated in air-tight containers until analyzed. One-to-one water extracts of the jar samples of drill cuttings collected near the water table will be analyzed in the laboratory for major tank waste indicators (chromium, nitrate, and technetium-99). The extracted sample media will be archived.

A.7
103 102 101
106 105 104
108 107
112 111 110
115 114 113
103 102 101
106 105 104
109 108 107
112 111 110
109
241-SY
241-SX Tank Farm
241-S Tank Farm
216-S-8Trench
W23-9
W22-44
W23-15
W23-3
W23-2
W23-1
W22-45
0 10050
Meters
1999/DCL/S-SX/008
41-09-39
����
216-S-3 Cribs
216-S-4 Crib
216-SX-2 Crib
��������241-SX-152 ����������
241-S-151
216-S-25 Crib
241-S-A Valve Pit
241-S-D Valve Pit
241-S-C Valve Pit
241-S-B Valve Pit
241-S-302B Catch Tank
102 101
103
241-SX-302Catch Tank
����
241-S-152
241-SX-151
241-SX-A&B Valve Pits
241-S-302ACatch Tank
103
Existing RCRA Wells
Non RCRA Wells in Use
N
104Suspected/ConfirmedLeaking Single-ShellTank
Single-Shell Tank
��������Diversion Box
������
All S Tank names prefixed by 241-S-All SX Tank names prefixed by 241-SX-
B
104°
99°
109°
104°
116°
128°
A
1
2
3
216-S-21Crib
Groundwater Flow DirectionOne Standard Deviation
One Standard Deviation
AB
Based on all network wellsBased on southeastwells only
W22-6
UPR-200-W-10
UPR-200-W-49
UPR-200-W-80UPR-200-W-81
Unplanned Release (UPR)
UPR-200-W-51
W22-46
W23-14
W23-13
ChangingFlowDirection
W22-39
6
7
8
4
5
W23-7
W23-4
1, 2, 3 - FY 1999
4, 5, 6 - FY 2000
7, 8 - FY 2001
Proposed New WellsNon-RCRA Well ThatIs Available, But NotCurrently Monitored
Exploratory Borehole/Well(1997)
WMA S-SX andSurrounding Facilities
Figure A.2. Location Map of Existing and Proposed Wells Around Waste Management Area S-SX (Wells 2, 4 and 5 are replacement wells. Wells 1, 6, 7, and 8 extend spatial coverage and Well 3 is a dual purpose deep characterization borehole to be completed as a replacement for 299-W22-46).

A.8
Top of Aquifer Sampling. After penetrating ~0.5 m into the saturated zone, a sampling pump will be installed so that water can be extracted for analysis of tank waste constituents listed in Task SSX-7. In order to minimize time during sample acquisition, the water samples will be collected with only minimal purging (<200 L) and without filtering. The water pumped to the surface will be transferred directly to 2 analytical grade 5-gal carboys, refrigerated, and taken to the lab for further analysis. After the sus-pended sediment settles, samples can be drawn for the standard set of analyses. Saturated Zone Depth Sampling. In addition to the near surface sampling event, a set of groundwater samples identified in Task SSX-7 will be collected at the maximum drill depth of ~6.1 m below static water level. A packer will be used to temporarily seal the drive shoe, or cutting edge, of the casing against the borehole wall. This will isolate the test zone from water inside the casing and eliminate move-ment of water from the annular space between the casing and the borehole wall. Intermediate depths will be sampled after the screen is installed. Field measurements or indicators (e.g., quick turnaround nitrate and chromate) will be analyzed to check both the near surface groundwater and the bottom of the borehole for unexpected conditions. If much higher concentrations are encountered at the bottom of the borehole than at the top, continuation with screen installation will be deferred (nominally 24 h) until DOE and Ecology representatives have been consulted. Intermediate shallow depths within the screened interval (4.6 m) will be sampled at a later date after the screen has been installed. Specific drilling and well completion specifications are the subject of another DQO process. The outcome of that effort may modify the base case described here. Deep Borehole. The deep borehole next to 299-W22-46 will be drilled to basalt at a maximum esti-mated depth of 175 m. Drill and test cuttings and groundwater sampling for the 0- to 6-m portion of the saturated zone will be as described above for the two standard monitoring well completions described above including the special groundwater sampling events at 0.5 m and 6 m. Intermediate depths are available from the existing shallow monitoring well 2-W22-46. Groundwater samples will also be collected as the casing is advanced at 12 m, 30 m, 60 m, 90 m, and 120 m below static water level. The bottom depth will also be sampled. The depths chosen provide greater sampling points at shallower depths where concentrations are expected to be changing the most rapidly with depth and will include collection of samples for chlorinated hydrocarbons. Groundwater produced from the formation as the drill bit is advanced will be analyzed periodically at the surface for indicators (e.g., specific conductance) and selected wellhead measurements (e.g., nitrate). The fixed depths for the pumped samples may be changed based on the “real time” well head data. An onsite hydrochemistry laboratory trailer will be used for the well head measurements. The current plan is to complete the deep borehole as a top-of-aquifer monitoring well that will serve as a replacement for 299-W22-46 that will be dry in 2+ years. All depth sampling for groundwater from this borehole will include samples for volatile organic carbons (e.g., carbon tetrachloride). Final specifi-cations for this well may be modified from the scenario described here, depending on the outcome of the RCRA drilling DQO process and the RFI-CMS DQO process.

A.9
A.1.1.5 SSX-5: Opportunistic Sampling – Well Decommissioning This task takes advantage of opportunities during well decommissioning to address the following data needs as identified in Section 5.0:
• direct determination of groundwater flow direction and rate (injection of tracer and arrival time at downgradient monitoring wells)
• isotopic/chemical fingerprinting of a major tank waste source.
This opportunity exists because borehole 41-09-39 (a new borehole drilled near tank SX-109) is located ideally to assess the flowpath and rate of groundwater immediately beneath the SX tank farm. Also, borehole 41-09-39 was temporarily completed with a screen for groundwater sampling. Therefore, it is also available for injection of a tracer. The upper section of the casing (0 – 40 m) passed directly through highly contaminated soil due to tank waste liquor that seeped from SX-109 and 108 in the 1960s. The maximum cesium-137 concentra-tions are about 100 million pCi/g (see Figure 2.2). If samples of this material can be obtained when the casing is pulled, a direct determination of water leachable tank waste constituents can be made to com-pare with the observed contaminants in downgradient monitoring wells. If this source area accounts for contaminants seen in downgradient wells, the water leachable constituents from the contaminated soil samples should match the relative constituent proportions (or ratios) in groundwater. Sampling and analysis for the above purposes will be conducted under a separate RPP sponsored activity and plan. Hydrologic Testing and Sampling. Just prior to pulling the casing, the well will be sampled for the last time and a tracer will be injected to assess flow direction and rate based on arrival of the tracer at the nearest downgradient wells (i.e., 299-W23-15, 299-W23-3, 299-W22-46, and/or 299-W22-39). By using a tracer that is detected in the routine quarterly monitoring measurements, no additional sampling and analytical costs will be incurred for this test. For this purpose, ~15,000 L of a 50-ppm bromide solution will be added to the well. The well will first be filled with sand or grouted to leave ~0.5 m of screened interval free at the top of the saturated zone for receiving the tracer slug. A shallow layer for initial place-ment of the tracer is desired to meet the initial patch diameter objective with a reasonable tracer volume. Depending on effective porosity of the semi-cemented Ringold Formation in this area (estimated at 0.05 to 0.1), the initial diameter of the tracer after injection is estimated to be on the order of 20 m. The diameter of an S-SX single-shell tank is 23 m. The proposed tracer experiment will also test the efficiency of the monitoring well spacing to detect a hypothetical leak from a major potential source in the SX tank farm. Previous models (MEMO) used to determine well monitoring efficiency for Hanford Site RCRA regulated units have assumed an initial source dimension of 20 m (i.e., a 20-m line source at the water table). Thus the planned tracer injection test is a direct test of the MEMO model. There is also the possibility that contaminated groundwater that may have originated from the SX-108 and 109 leaks may have first traveled south rather than southeast and then more easterly after passing well 299-W23-15 due to lateral preferential pathways in the semi-cemented Ringold formation. If so, this could explain how monitoring well (299-W23-15) located due south of a major leak source in the SX tank farm
A.10
intercepted mobile tank waste constituents from a transient event about 1992. The injection test con-ducted in 41-09-39 will also test this hypothesized alternative flow path. Source Fingerprinting –Water Extractable Soil Contaminants. As previously indicated, borehole 41-09-39 passed directly through the largest known leak to the soil column in the S and SX tank farms. If contaminants are re-mobilized and transported to groundwater from this source by enhanced infiltration, the relative composition of the mobile fraction should match the observed composition in groundwater. At the present time it is not possible to predict the expected composition of mobile waste constituents from a leak source because of the great uncertainty in tank contents. The most direct approach is to leach actual contaminated soils with simulated infiltrant (e.g., river water or raw water and/or rainwater or distilled water pre-equilibrated with uncontaminated soil) and analyze the leachate for the mobile con-stituents identified in groundwater. The information needs described above will be available from the RPP data acquired from contam-inated soil samples collected during removal of the casing. These sampling needs are included in the borehole 41-09-39 decommissioning plan. The objectives of the RPP vadose zone characterization program also include assessment of the mobility status of tank waste constituents in contaminated soils beneath single-shell tanks. Thus, the primary activity relevant to this plan is participation in the RPP planning and fieldwork to ensure the objectives for the WMA S-SX assessment are met. A.1.1.6 SSX-6: Evaluate Source of Cesium-137 in Well 299-W23-7 The objective is to determine if the contaminant occurrence is a borehole related effect or represents a more widespread occurrence in the vadose zone and aquifer (e.g., transported in the aquifer as a colloidal phase). Coordination of this testing with the DOE Environmental Restoration (ER) well remediation and decommissioning program is the most cost-efficient approach. Thus completion of this task will be coordinated with the ER decommissioning plan and the RPP vadose characterization project, which is in turn dependent on availability of funding. A.1.1.7 SSX-7: Quarterly Groundwater Sampling and Analysis Sampling in the WMA S-SX well network identified for this assessment is an ongoing activity funded under the groundwater monitoring project. A quarterly frequency is required by 40 CFR 265.93(d)(7)(i) by reference of WAC 173-303-400(3). This frequency is also judged to be adequate for assessing the rate and extent of contaminant migration in the groundwater, and contaminant concentrations for the WMA S-SX based on the time response of previous contaminant occurrences in monitoring wells and a relatively slow groundwater flow rate (25 to 50 m/yr). The constituents of concern are derived from the previous groundwater assessment plan (Caggiano 1996), comments from Ecology on the first assessment report for WMA S-SX and a relative hazard ranking (drinking water pathway) for single-shell tank waste (Chou et al. 1997). Based on these sources the major radioactive constituents of concern that would account for >99% of the hypothetical hazard (if ingested) for S-SX tank waste are uranium, cesium-137, strontium-90 and transuranics (isotopes of plutonium, americium, and curium). Chemical wastes of concern based on abundance and relative hazard

A.11
include nitrate, chromium and aluminum. Metals identified in the relative hazard ranking (>90% of relative hazard) for average tank waste (Chou et al. 1997) include antimony, bismuth, cadmium, iron, manganese, and molybdenum and may be mobile in the presence of complexing agents. Because complexants were added to some of the SX tanks, various metals could be present in a mobile form. Thus, a broad spectrum metal analyte group is indicated. The latter can be addressed by employing inductively coupled plasma (ICP) analysis and/or ICP-MS. As indicated in the optimization discussion (Section 6.0), specific isotopic analyses for alpha emitters will be requested if anomalous gross alpha results appear. Special studies conducted by the national lab consortiums and PNNL may employ ultra-low level methods to quantify both metals and radionuclides that may be present as part of colloid and contaminant pathway studies at the SX tank farm. If necessary, the base list of constituents of concern can be updated depending on the outcome of these special studies. Also, re-evaluation of the groundwater analyte list discussed above will be made when results of the near-surface and vadose zone soil sampling results are available from the S-SX vadose characterization work for the RFI-CMS are available. That is, once the potential soil column source of groundwater contamination is characterized, the analyte list for groundwater sampling can be modified as appropriate. Other basic hydrochemical information (alkalinity, total dissolved solids, electrical conductivity, pH) is needed to assess the status of the receiving water and to allow quality control checks (e.g., cation/anion charge balance, total dissolved solids versus the sum of major constituents). Changes in pH and alkalinity and the presence of silica would also be expected if tank waste or reaction products reached groundwater. Also, the mixing of raw water (Columbia River water) with ambient groundwater may be discernable because the specific conductance and total dissolved solids are much lower for river water than for groundwater. Total organic carbon is potentially important as a check on organically bound metal contaminants. Ecology identified carbon tetrachloride as an additional potential contaminant of concern based on the observation that the headspace in some of the tanks in WMA S-SX contained this volatile organic. The base list of constituents by analytical method or group and associated specific analytes of interest and detection limit requirements (MDL) for each quarterly sampling event are as follows: Chemical Constituents
• anions, ion chromatography method (nitrate, chloride, bromide, fluoride); MDL <500 µg/L • metals (filtered and unfiltered), ICP method (chromium, sodium, calcium, magnesium, potassium,
manganese, iron, aluminum); MDL <5 µg/L (aluminum, chromium, iron, and manganese) • uranium - total or chemical (fluorometric), unfiltered; MDL <0.1 µg/L • pH • specific conductance (lab method as well as field)

A.12
• alkalinity (lab 48-hr turnaround)
• total dissolved solids
• volatile organics Radioactive Constituents
• gross beta (unfiltered), gas flow proportional counter on dried samples; MDL <1 pCi/L • gross alpha (unfiltered), gas flow proportional counter on dried samples; MDL <0.5 pCi/L • technetium-99 (unfiltered), ion exchange separation and liquid scintillation; MDL <20 pCi/L • tritium (unfiltered); MDL <400 pCi/L, liquid scintillation on evaporated samples.
Isotope specific analyses will be requested (i.e., spectral gamma for cesium-137 and transuranics, and/or strontium-90) by the project scientist responsible for the RCRA assessment at this regulated unit under the following conditions:
• gross alpha and beta results are above natural background
• or > upgradient concentrations
• or cannot be accounted for by technetium-99 and/or uranium. An important requirement for use of gross alpha and gross beta measurements as surrogates for the more expensive isotope specific analyses is reliable gross count measurements. One source of uncertainty in the gross or total count method is the effect of salt residue (i.e., self-absorption of the beta particles). Because dissolved solids are very low in the vicinity of WMA S-SX, this is not anticipated to be a problem. Alternative, more reliable methods for gross count measurements are under investigation by the vendor, Quanterra. Implementation of the surrogate approach places increased demands on the quality control aspects of the gross count measurements. It should be noted that other methods will be relied on to assess the likely presence of alpha and beta emitters. For example, special ultra low-level isotopic analyses will be used to supplement the routine measurements (see Section A.1.1.1). Monitoring Wells. The list of wells to be sampled quarterly includes both RCRA and non-RCRA wells listed separately as follows (see Appendix B for as-builts). These wells are selected to monitor various sources (e.g., tanks, ancillary equipment, spills, and/or releases) within WMA S-SX.

A.13
RCRA Wells: 299-W22-39, 299-W22-44, 299-W22-45, 299-W22-46, 299-W23-13 299-W23-14, 299-W23-15; plus three new wells planned for FY99 Non-RCRA: 299-W23-1, 299-W23-2, 299-W23-3, 299-W23-4, 299-W23-7, 299-W23-9, 41-09-39 After 1999 or 2000, the older non-RCRA wells listed may not have a sufficient depth of water from which to pump. At that time they will be released for decommissioning. The new wells will be added to the sampling schedule as they are completed. Sampling Procedures. Standard conditions for routine monitoring will be used. They include pump-ing at ~1 gpm with a Hydrostar pump, removal of three bore volumes, and stabilization of indicator parameters prior to sample collection. Procedures are defined in the QAPP, Appendix A.2. Pump depths will be maintained at ~1.5 m below static water level to maintain comparability of results with previous monitoring data. The issue of variation with depth (i.e., shallow or microlayer at the top of the aquifer) is addressed elsewhere in this plan. A.1.1.8 SSX-8: Data Evaluation and Reporting Regular annual progress reports are required for RCRA sites that are in assessment. As required by 40 CFR 265.94(b)(2) [by reference of WAC 173-303-400(3)], the results of the groundwater quality assessment program must be submitted to the regulator (Ecology) no later than March 1 following each calendar year. Also, as part of the integration project, it is anticipated that quarterly status reports will be submitted to DOE and Ecology. Dissemination of technical findings to the scientific community is also an important aspect of this effort. It is anticipated that a paper will be written and presented at a profes-sional meeting in FY99. Borehole completion packages must also be prepared for each new monitoring well installed to document compliance with WAC 173-160. A.1.1.9 SSX-9: Project Planning and Direction This task involves ensuring that tasks are on schedule and that resources and personnel will be avail-able when they are needed, and developing workarounds when schedule conflicts occur. Preparation of the assessment plan (this document), participation in RCRA well drilling DQO activities for WMA S-SX, and any subsequent revisions of the assessment plan are also included in this task. Attending meetings with stakeholders and the integration project team leads to ensure coordination with other related projects is part of this task. A.1.2 Schedule The schedule for conducting the previously described tasks is shown in Figure A.1. Only start and end dates (columns 2 and 3) for FY99 are shown. It should be noted that this schedule was developed concurrently with other activities (e.g., RFI negotiations and vadose/groundwater integration, and tasks and time periods in the schedule may change.

A.14
Lines and Arrows. Solid vertical lines and arrows from one horizontal subtask or activity time line (solid black bars) indicate the flow/link of information needed to subsequent activities or reports and milestones. Milestones. Milestones are shown either as internal (open circle) or client (open diamonds) or regu-latory (solid diamonds). Tri-Party Agreement milestones associated with the RCRA facility investigation for the S-SX tank farms, and related facilities, are currently under negotiation which may impact some endpoint milestone dates shown. Time Duration. The stippled bars aligned horizontally with the bold task headings indicate the overall anticipated duration of the numbered tasks. The bold, dotted horizontal line at the top indicates that a follow-up investigation is anticipated if the outcome of the preliminary screening task is positive. Supplemental funding would be needed to conduct such an investigation. RPP (formerly TWRS) Connections. Ties to key RPP-related activities are shown as either input needed from RPP (dashed line leaving a box with RPP activity number) or a dashed line leading into a RPP activity box, indicating information that is needed by a RPP-related activity. The RPP projects (TW04) indicated in the boxes are described briefly as follows:
• TBR 650.23: Borehole 41-09-39 decommissioning and sampling.
Information is needed from this RPP activity for the fingerprinting task discussed in task SSX-5. The critical date involving the RPP schedule is when the screened section of borehole 41-09-39 is removed. The current RPP plan calls for decommissioning in two stages. The first stage is removal of the screen, which can begin much earlier than the removal of the upper portion of the casing that passes through the highly contaminated soil. Close coordination is needed because the groundwater assessment relies on obtaining both samples and injection of a tracer just prior to removal of the screen.
• TBR 650.415: RPP expense for RCRA monitoring well network.
This task identifies core sampling needs to support RPP performance assessment data needs. The S-SX groundwater assessment relies on both input of funding and data quality objectives to control the manner in which the boreholes for the new wells at S-SX are drilled and core sampled. The data derived from the core samples and related geological interpretations (e.g., stratigraphic fine structure) are input data needs to TBR 720.712.
• TBR 720.712: Manage closure and vadose zone activities.
The objective of this task is to develop the necessary understanding of subsurface conditions and processes to support RPP cleanup decisions and/or implement near-term actions to protect ground-water and the Columbia River. This activity is conducted in collaboration with the Hanford Site Vadose Zone/Groundwater/Columbia River Integration Project. The priorities are: first to deal with existing contamination from past leaks and spills, second to support decisions on retrieving waste

A.15
from tanks, and third to support tank farm closure decisions. The continued groundwater quality assessment at WMA S-SX not only provides input to the RPP vadose zone characterization project but also serves as a means to test the efficacy of interim corrective measures conducted under the overall umbrella of TBR 720.712.
A.2 Quality Assurance Plan The groundwater quality assessment investigation at WMA S-SX is an integral part of the RCRA groundwater-monitoring program of the consolidated Hanford Site groundwater monitoring project. The scope of the consolidated project includes: 1) groundwater monitoring; 2) flow and transport modeling; and 3) geohydrologic services necessary to install, design, monitor, and model groundwater quality and contaminant movement on the Hanford Site. The project is administered by Pacific Northwest National Laboratory for the Richland Operations Office of the U.S. Department of Energy, Environmental Restoration (ER) Branch. The consolidated groundwater project was established in 1996 when scope and personnel for the RCRA groundwater and related operational monitoring activities were transferred from Westinghouse Hanford Company to Pacific Northwest National Laboratory. The Quality Assurance (QA) Plan ETD-012, Rev. 0, the Hanford Ground-Water Monitoring Project Quality Assurance Project Plan and associated subcontractor procedures/manuals for the consolidated project currently in place cover much of the work activities required for conducting the WMA S-SX groundwater quality investigation. Accord-ingly, the primary emphasis of this appendix is on those activities not covered under the existing quality assurance plan. However, summaries of relevant sampling and analysis procedures, as well as reference to other supporting and or overarching documents, are included as needed to cover the planned activities described in the field sampling plan (see Appendix A.1). Project description, project organization and designated responsibilities, and project management interfaces between DOE and subcontractor organizations are described in the Hanford Ground-Water Monitoring Project Quality Assurance Project Plan (QA Plan, ETD-012, Rev. 0), here after referred to as the GW-QAPP. Also, because the Hanford Site now has many support contractors, some of the proce-dures referenced in this plan may be replaced by equivalent approved Project Hanford Management Contractor (PHMC) procedures. A.2.1 Groundwater Sampling and Analysis Procedures A.2.1.1 Sample Collection Groundwater sampling procedures, sample collection documentation, sample preservation and ship-ment, and chain-of-custody requirements are described in subcontractor operating procedures/manuals and in the GW-QAPP. Quality requirements for sampling activities, including requirements for proce-dures, containers, transport, storage, chain of custody, and records requirements, are specified in a state-ment of work to the performing subcontractor, Waste Management North West. To ensure that samples of known quality are obtained, the subcontractor is required to use contractor-controlled procedures based on standard methods for groundwater sampling whenever possible. Pacific Northwest National

A.16
Laboratory will review these procedures for technical quality and consistency. In addition, periodic assessments will be performed by Pacific Northwest National Laboratory to ensure that procedures are followed to maintain sample quality and integrity. A brief description of the sampling requirements is provided below. Samples are generally collected after three casing volumes are withdrawn or after field parameters (e.g., pH, temperature, specific conductance, and turbidity) have stabilized. Field parameters are meas-ured in a flow-through chamber. Generally turbidities should be equal to or below 5 NTU (nephelometric turbidity units, 1 NTU = 1 mg/L of solids) prior to sample collection. The project scientist, depending on site-specific conditions and sampling objectives, however, could override this general requirement. For example, collection of water at the top of the aquifer during drilling necessarily involves turbid, unfiltered water, which will be processed further in the laboratory. Thus the 5 NTU requirement will be waived for these special water samples. For routine groundwater samples, preservatives are added to the collection bottles in the laboratory prior to their use in the field. Duplicates, trip blanks, and field equipment blanks are collected as part of the general quality control program. The sampling and analysis methods and procedures and associated quality control results are described in more detail in Hartman and Dresel (1998). A.2.1.2 Analytical Procedures Procedures for field measurements (e.g., pH, specific conductance, temperature, and turbidity) are specified in the manufacturer’s manual for each instrument used. The approved laboratory for the groundwater monitoring program will operate under the requirements of current laboratory contracts and will use standard laboratory procedures as listed in the SW-846 (EPA 1986) or an alternate equivalent. Alternative procedures, when used, will meet the guidelines of SW-846, Chapter 10 (EPA 1986). Analytical methods and quality control for the RCRA groundwater monitoring activities are described in the GW-QAPP. Field screening measurements will be conducted in accordance with instrument manufacturers’ manuals and procedures as modified or amended by desk instructions issued to the field crew by the project scientist (or his designee). Wellhead measurements other than the standard parameters noted above will be conducted in a mobile laboratory trailer at the drill site. A.2.1.3 Data Storage and Retrieval All contract analytical laboratory results are submitted by the laboratory in electronic form and loaded in the Hanford Environmental Information System (HEIS) database. Parameters measured in the field either are entered into HEIS manually or through electronic transfer. Data from the HEIS database may be downloaded to smaller databases, such as the Geosciences Data Analysis Toolkit (GeoDAT) for data validation, data reduction, and trend analysis. All field and laboratory hydrochemical results for this assessment will be entered in the publicly accessible HEIS database. Hard copy data reports and field records are considered to be the record copy of the data and are stored at Pacific Northwest National Laboratory.

A.17
A.2.2 Hydrologic Testing Hydraulic conductivity will be determined using slug test and tracer test procedures as specified in a test plan that will be prepared by Pacific Northwest National Laboratory Field Hydrology and Chemistry Group for the S-SX monitoring wells. Basic procedures for the slug tests will follow PNL-MA-567 (“Aquifer Testing”), or the most recent revision(s) or equivalent of this document. Field data and other related information will be maintained in physical files at Pacific Northwest National Laboratory Ground-water Project Records files in Sigma V building. Hydraulic test results will be included in a Pacific Northwest National Laboratory topical report and summarized in the S-SX assessment report. None of the wells included in this task (see Appendix A.1) are in a radiation control zone and thus no special radiological safety provisions are required. A.2.3 Borehole Drilling and Testing Bechtel Hanford Company manages borehole drilling and well installation under their safety and related job control procedures. Data needs and objectives from this assessment plan are used as input to Bechtel Hanford Company to write the detailed specifications for the drilling contracts. The drilling and sampling activities and requirements associated with installation of three new RCRA compliant monitor-ing wells in FY00 for WMA S-SX groundwater assessment purposes, are summarized in the following section. A.2.3.1 Subtask Descriptions and Related Procedures The tasks involved in borehole drilling and sampling include the following:
• activity preparation
• location and designation of the borehole
• drilling and geologic material sampling
• sample handling
• analysis of samples
• documentation
• borehole geophysics
• well completion.

A.18
Activity Preparation. Preparation activities necessary before beginning fieldwork for borehole drilling include the following:
• coordinate with team members
• coordinate with support services
• evaluate drilling techniques
• obtain support documentation
• obtain monitoring and sampling equipment. Drilling Method. An air rotary method is required (in the saturated zone) to meet the objectives for this plan. The produced water will be analyzed in a continuous monitoring mode. Rotary methods do less damage to lithologic materials for stratigraphic interpretations. Borehole Locations. One deep RCRA monitoring well and two standard depth RCRA wells will be drilled in FY99. Additional replacement wells are anticipated for out years. The number of replacement wells is dependent on the rate of decline of the water table. The deep borehole (southeast corner of SX farm, see Figure 5.3) is designed to provide samples to characterize the sediments in the vadose zone and saturated zone and to characterize groundwater both hydrologically and hydrochemically with depth to the bottom of the aquifer. All borings will be constructed in accordance with WAC 173-160 requirements and other appropriate Hanford requirements (WHC-S-014, Rev. 7, 1992) or equivalent. If core samples are requested by other programs (e.g., RPP vadose characterization) then applicable portions of the following will apply during the drilling of the planned monitoring and aquifer characterization wells. Location Designators. Boreholes are given designations that relate to the area in which they are located, except in the 200 Areas. A permanent borehole number will be assigned once the well is installed and surveyed. Approximate locations are as shown in Figure 5.3. The project scientist respon-sible for this assessment or his/her designee will also be responsible for staking the exact locations for the wells. Prior to final staking, ground penetrating radar may be needed to assure that subsurface structures such as water lines, electrical runs, or waste transfer lines are avoided. The drilling permit requirements dictate the level of pre-drilling survey needed. Sample Handling. Samples obtained from the intact coring/sampling process during drilling will be sealed in Lexan, or other equivalent material liners, and refrigerated as soon as they are retrieved from the downhole sampler. Refrigeration can be standard sample coolers with precautions to prevent moisture from the cooler to impact the sample. Sample liners will be labeled with the borehole number, depth interval of the sample, and top and bottom of sample information. The samples will be transported after a field radiation and release survey, if required, to the appropriate laboratory for testing. Samples will be stored in refrigeration until analyzed.

A.19
Drilling and Coring Procedures. Experience has shown that large diameter cores (10 cm) in the gravelly sand zones are more successful in Hanford sediments. A technique using casing advance has been successfully demonstrated for this purpose. In addition, drilling fluids are not desirable because measuring the moisture content and matric potential are important RPP data quality objectives. Depend-ing on borehole location and projected depth, a 6-m starter casing 20 to 30 cm in diameter will be used. Downsizing the well casing during drilling will be done at appropriate intervals depending on well conditions. In addition, precautions to minimize disturbance of subsurface materials and to prevent contamination of the subsurface and groundwater during drilling should be taken. Flexible Drilling Contract Needed. Data quality can be significantly impacted if the appropriate type of drilling contract is not specified. It is of paramount importance to recognize that the three planned boreholes for FY99 are not simply for installation of a new monitoring well. Therefore, some down time (hourly rate schedule for drilling contractor) must be incorporated into the drilling plan for acquisition of core and groundwater samples as the borehole advances. It is difficult to predict the exact length of time this will take because the borehole will be advanced in a drill and test mode (i.e., field indicators will be analyzed during the saturated zone drilling that may modify pre-planned test intervals or depths). The data quality objectives cannot be met with a cost-per-foot drilling contract. An hourly rate must be included to cover drill rig standby time when core samples and groundwater testing is conducted to meet the objectives defined in this assessment plan. If continuous core is required by RPP from surface to the top of the cemented Ringold gravels at approximately 50 m below ground, plastic core liner will also be required (1/8-in. wall thickness Lexan). Approximately 70 m of core liner should be available to allow for potential damage during the coring and handling operation. Sampling Activities. Drill cutting samples will be taken at 0.5-m intervals in the phreatic zone beginning 6 m above the static water level. Cuttings for other intervals will be collected at the standard 1.5-m depth intervals for archival purposes. Sampling activities will be administered in accordance with applicable procedures in BHI-EE-01, Environmental Investigations Procedures, or WHC-CM-7-7, Environmental Investigations and Site Characterization Manual or equivalent Hanford Site approved procedure. If requested by RPP Vadose Zone Project, continuous core samples will be taken for geologic description of fine structure and gross lithology, and for laboratory tests that include saturated and unsaturated hydraulic conductivity, Kd, porosity and moisture content. Sealed cores in their liners will be refrigerated until analyzed. Sub-samples of cuttings in the phreatic zone will be extracted in the laboratory for key constituents in the Pacific Northwest National Laboratory, 300 Area laboratory (contact: Jeff Serne) using good labora-tory practice and procedures as described elsewhere (Myers et al. 1998). The archived standard drill cuttings (1.5-m intervals) will be analyzed as deemed appropriate at a later time and will be stored in the 2101M facility.

A.20
Core. All sampling will be conducted in accordance with procedure Soil and Sediment Sampling (BHI-EE-01, Procedure 4.0 or WHC-CM-7-7, EII 5.2, or equivalent, approved PHMC procedure). The well site geologist typically performs a description of the borehole sediments at the time of drilling in order to obtain a continuous lithologic record. However, with continuous core that is to be immediately sealed in the plastic core liners, the physical description will have to be performed at a later date when the core liners are opened for processing. A sampling device, which can be advanced with the casing and be efficiently retrieved to the surface, will be used. The sampler will retrieve intact sample with a minimum outside diameter of 10 cm, have the ability to advance in 3-m increments in downhole conditions, and will have Lexan (1/8-in wall thickness) or equivalent liners for sample retention. The sample liners should be in 0.6-m long, individual segments. The well site geologist will describe the samples in the field and record the descriptions on borehole logs per Geologic Logging (BHI-EE-01, Procedure 7.0, WHC-CM-7-7, EII 9.1) or equivalent, approved PHMC procedure where applicable. The field descriptions will be based on cuttings that are in excess of the core. Every sample collected will be recorded on a borehole log at the drill site because the cores will be immediately sealed. Detailed field lithologic descriptions of available material will include, if possi-ble, color, texture, sorting, bulk mineralogy, roundness, relative calcium carbonate reactivity, consolida-tion, and cementation. All drilling and well construction data, sample depths, radiological and chemical survey points, etc., will be documented on the borehole logs. Core Sample Handling. All sampling activities will be conducted in accordance with Bechtel Hanford Company, Westinghouse Hanford Company procedures (BHI-EE-01 or WHC-CM-7-7 and WHC-CM-7-8), or an approved, equivalent PHMC or Pacific Northwest National Laboratory procedure unless specified otherwise by a test plan. Special handling requirements may be associated with the type of analysis, laboratory procedures for the analysis, or regulatory requirements BHI procedure 3.0, “Chain of Custody,” and procedure 3.1, “Sample Packaging and Shipping.” Cores will be sealed immediately in the field by placing end caps on the Lexan core liners. Teflon tape on plastic end caps is acceptable if Teflon caps are not available. The caps will be securely taped to the liner to achieve an airtight seal. Archive samples will be delivered with a completed chain-of-custody form to the Hanford Geological Sample Library for archival after temporary custody during the analysis phase when all samples have been taken from the core. All samples will receive a radiation release sur-vey sticker prior to shipment. No drilling muds will be added to the borehole. Addition of other fluids such as water will be avoided unless absolutely necessary and approved by the well site geologist and project scientist. This is to allow for reliable determination of moisture content, make detection of moist zones or perched water zones easier, allow collection of representative moisture samples, and determine sorptive properties that are representative of actual subsurface conditions. Thus, considerable care must be take to avoid alteration of the natural state of the lithologic samples during the drilling and core recovery process. Drilling the boreholes during the cooler months of the year aids in preserving the natural moisture content of the sample. Groundwater Testing. Groundwater will be sampled during drilling of the shallow wells at two depths (0.5 m and 12 m). The deep borehole will be sampled at 0.5, 12, 30, 60, 90, and 120 m and at the

A.21
bottom of the borehole (top of basalt). Deviations from these planned depths may occur as a result of wellhead indicator results. The decision to change the above depths will be made by the project scientist and communicated to the drilling engineer. The fixed depth sampling will be accomplished using a packer to seal the bottom edge of the tem-porary casing against the borehole wall. Water will be pumped from the open hole below the packer using a Hydrostar or other appropriate sample/purge pump that will fit inside the packer tubing string. Turbidity will not be used as criteria for collection of samples for analysis. If turbidity is too high, water will be collected in a 5-gal carboy and subsampled at a later time after the sediment has settled. The decision to collect in 5-gal carboy samples (unfiltered) will made by the project scientist. Volatile organic carbon sample sets will be added to constituents of interest identified in Sec-tion A.1.1.7 for the deep borehole sampling events. During drilling, produced water will be tested at the surface by separating the water from the cuttings stream. Provision for this separator must be included in the specifications for the drilling contract. Periodic grab samples will be collected to track specific conductance and/or nitrate and radiological constituents during the active drilling. If these screening measurements indicate elevated dissolved constituents are encountered, a change in the pre-planned sampling depths may be made to take advantage of the discovery depth. A.2.4 Borehole Geophysics Geophysical logging provides data for comparison with core-derived data for stratigraphic interpre-tation. Geophysical tools will be used to determine in situ moisture content, help define hydrostrati-graphic units and to correlate these units among adjacent boreholes. They will also be used to identify any possible zones that are contaminated by gamma-emitting radionuclides. The boreholes will be logged in accordance with WHC-CM-7-7, EII 11.1, “Geophysical Logging” or equivalent, approved PHMC procedure. Geophysical logging probes will include high-resolution spectral gamma probes, gamma density, neutron-epithermal-neutron, and may include gross gamma. Only proven techniques with procedures adequate to control the quality of the data will be used. Optimal conditions for logging require that no more than one thickness of casing be present. This will require logging to be done in stages before each additional casing is telescoped into place. A.2.5 Well Completion The basic plan is to complete the two standard depth boreholes for FY00 as standard RCRA ground-water monitoring wells designed so that the wells can be deepened in the future. Unless modified prior to letting the drilling contract, the deep borehole will be drilled and tested to basalt and then completed as a standard RCRA groundwater monitoring well with a 4.6 m screen.

A.22
A.2.6 Groundwater Testing Procedures This section supplements the description previously provided. The procedures for groundwater sample collection, water-level measurements, and field measurements include the following or equivalent, approved PHMC (Procedures SML-EP-001 and ES-SSPM-001) or PNNL procedure, except where modified as required for purposes of this plan:
• BHI-EE-01, Procedure 4.1 “Ground-Water Sampling” • WHC-CM-7-8,6.1 “Disposal of Purgewater from Monitoring Wells” • WHC-CM-7-8, 5.1 “User Calibration of Groundwater M&TE” • WHC-CM-7-8, 5.2 “Groundwater M&TE Calibration by WHC Standard Lab” • WHC-CM-7-7, EII 10.2 “Water-Level Measurement Procedure” • WHC-CM-7-7, EII 1.2, 1.4 “Change Control Procedure” • BHI-EE-01, Procedure 3.0 “Chain of Custody” • BHI-EE-01, Procedure 4.0, “Soil and Sediment Sampling”
• PNL-MA-567, “Aquifer Testing” (including January 1999 updates).
All groundwater analyses will be done under the existing contract between Pacific Northwest National Laboratory and Quanterra (contract number MW6-SBB-A19981). All procedures, preservation requirements and techniques, accuracy and precision, and methods will follow the contract specifications. A.2.7 References 40 CFR 265, Code of Federal Regulations. Interim Status Standards for Owners and Operations of Hazardous Waste Treatment, Storage, and Disposal Facilities. BHI-EE-01. 1997. Environmental Investigations Procedures, Manual. Bechtel Hanford Company, Richland, Washington. Chou, C. J., V. G. Johnson, S. P. Reidel, and J. W. Shade. 1997. TWRS Phase I Privatization Site Environmental Baseline and Characterization Plan. HNF-SD-TWR-EV-001, Rev. A, Lockheed Martin Company, Richland, Washington. EPA. 1986. Test Methods for Evaluating Solid Waste Physical/Chemical Methods, 3rd ed. EPA SW-846, U.S. Environmental Protection Agency, Washington, D.C.

A.23
Hartman, M. J., and P. E. Dresel (eds). 1998. Hanford Site Groundwater Monitoring for Fiscal Year 1997. PNNL-11793, Pacific Northwest National Laboratory, Richland, Washington. Myers, D. A., D. Moak, D. Parker, G. Gee, J. Serne, V. Johnson, and G. Last. 1998. Findings of the Extension of Borehole 41-09-39, 241-SX Tank Farm. HNF-2855, Lockheed Martin Hanford Co., Richland, Washington. PNL-MA-567. Aquifer Testing. Pacific Northwest National Laboratory, Richland, Washington. WAC 173-160, Washington Administrative Code as amended. Minimum Standards for Construction and Maintenance of Wells. Washington State Administrative Code, Olympia, Washington. WAC 173-303-400, Washington Administrative Code. Interim Status Facility Standards. Olympia, Washington. WHC-CM-7-7. Westinghouse Hanford Environmental Investigations and Site Characterization Manual. Westinghouse Hanford Company, Richland, Washington. (Current version). WHC-CM-7-8, Rev. 7. Westinghouse Hanford Environmental Engineering and Technology. Westinghouse Hanford Company, Richland, Washington. (Current version). WHC-S-014, Rev. 7. 1992. Generic Specification -- Groundwater Monitoring Wells. Westinghouse Hanford Company, Richland, Washington. A.2.8 Bibliography EPA. 1984. Test Method for Determination of Inorganic Anions in Water by Ion Chromatography. EPA-600/4-84-017, Environmental Monitoring and Support Laboratory, U.S. Environmental Protection Agency, Cincinnati, Ohio. EPA. 1993. Data Quality Objectives Process for Superfund - Interim Final Guidance. EPA/540-R-93-071, U.S. Environmental Protection Agency, Washington, D.C. Khaleel, R. 1997. Test Plans for Measurement and Analysis of Vadose Sone Hydraulic Properties for the Tank Waste Disposal Site. FDNW-ENI-98-008, Fluor Daniel Northwest, Richland, Washington. PNL-6894. 1989. Procedures for Ground-Water Investigations. Pacific Northwest Laboratory, Richland, Washington.

Appendix B
Stratigraphic Cross Sections, Hydrographs, and As-Built Diagrams

B.1
Appendix B B.1 Stratigraphic Cross Sections, and As-Built Diagrams This appendix contains the construction drawings or as-built diagrams for both the RCRA compliant monitoring wells in the S-SX network and the older non-RCRA wells that have been included for assess-ment purposes. Other stratigraphic and hydrologic information for developing more detailed drilling plans and contract specifications is also provided for reference. B.1.1 Water Depths The current depth to water and depth of water within the screened or perforated sections of the assessment monitoring wells are given in Table B.1. Water depths in the wells are relatively shallow for several of the wells. The explanation for the greater depths of water in four of the RCRA compliant wells (299-W22-46, 299-W22-44, 299-W23-15 and 299-W22-45) is that extended screens (11 m) were installed in these wells in anticipation of declining water levels. Additional replacement wells will be required in the near future as the water level in the vicinity of WMA S-SX continues to decline (see Table B.2). Hydrographs for monitoring wells at S and SX tank farms are presented in Figures B.1 and B.2, respectively. These plots show that in addition to a general decline in water table, there are some changes indicating a shift to a more east-southeast flow direction, especially at the S tank farm. For example, see hydrographs for wells 299-W22-45 and 299-W22-44 in Figure B.1. A similar, although less pronounced, shift can be seen in Figure B.2 for Wells 299-W22-39 and 299-W22-46. Water level was higher in 299-W22-44 than in 299-W22-45 in the early 1990s. The elevation is about the same in both wells today, suggesting a shift to a more easterly direction. These changes must be allowed for in choosing locations for additional monitoring wells to either replace wells going dry or to improve spatial coverage. B.1.2 Lithology and Stratigraphy The as-builts include driller’s descriptions of drill cuttings indicating lithology at various depths in the vicinity of WMA S-SX. These descriptions can be correlated with the stratigraphic interpretations provided in Figures B.3, B.4, and B.5 for a more complete picture of the general stratigraphy in selected portions of the WMA near the proposed new well locations. The stratigraphy at greater depths than available from monitoring well information is indicated in Figure B.6. The lithologic log for core hole 299-W19-10, drilled to basalt near the south end of the 200 West Area, is also included at the end of this Appendix (Figure B.7). A fence diagram covering the entire WMA and vicinity, which includes updated stratigraphic interpretations as reported in Woods et al. (1999), is shown in Figure B.8. B.1.3 Use of Old Wells As-builts are also included for two older non-RCRA wells (299-W22-6 and 299-W22-16) that may be potential candidates for use as downgradient wells to extend the network. These older wells are larger in

B.2
diameter and may be amenable to deepening by under reaming methods. However, caution must be used in considering these wells for potential rehabilitation because they were near cribs that received very high levels of radioactive waste. For example, gross beta in these wells was >100,000 pCi/L in the past. Also, this contamination was present in the aquifer at a time when the water table was 5 to 6 meters higher than it is now. Thus, infiltration around or near the well could carry residual contaminants stored higher in the vadose zone down to the water table. Another consideration is that the old carbon steel wells have been shown to adsorb hexavalent chromium (Schalla 1992). Since chromium is a primary mobile constituent in tank waste, there is a concern that samples taken from such wells could be biased low. Deepening and installing a stainless steel screen could solve the latter problem. B.1.4 Reference Schalla, R. 1992. “Development and Purging for In Situ Sensors in Monitoring Wells,” in Current Practices in Ground Water and Vadose Zone Investigations, ASTM STP 1118, D. M. Nielsen and M. N. Sara, (eds.), American Society for Testing Materials, Philadelphia.
Table B.1. Water Levels for 241-S/SX Tank Farm Wells.
Water Level Elevation (abobe msl)
Well Date Depth to Water
(ft) (ft) (m)
299-W22-39 3/15/99 219.34 448.92 136.83 299-W22-44 3/15/99 229.15 448.98 136.85 299-W22-45 3/15/99 217.22 448.99 136.85 299-W22-46 3/15/99 222.34 448.84 136.81 299-W23-1 9/16/98 215.60 450.54 137.32 299-W23-13 3/15/99 216.06 450.27 137.24 299-W23-14 3/15/99 213.83 450.17 137.21 299-W23-15 3/15/99 205.94 449.50 137.01 299-W23-2 9/16/98 213.13 450.35 137.27 299-W23-3 9/16/98 213.50 450.06 137.18 299-W23-7 9/16/98 213.31 450.36 137.27 299-W23-9 6/09/99 215.46 449.04 136.87 NOTES: 1. Water level elevations are calculated by subtracting the measured depth to water from the
surveyed elevation for the well (using NGVD 29-2). 2. Depth-to-water values are transcribed from field records.

B.3
Table B.2. Predicted Time That RCRA Wells Monitoring the S-SX Waste Management Area Will Go Dry
Facility Well Regression
Equationa and R2
Elevation of Bottom of Screen (ft)
Water Level Elevation
March 1999 (ft)
Submerged Screen
March 1999 (ft)
Predicted Time
that Well Will
Go Dryb S-SX WMA 299-W23-13 Y = 458.93 – 2.40 X
R2 = 99.1% 446.14 450.27 4.13 January
2000 299-W23-14 Y = 458.54 – 2.32 X
R2 = 99.6% 445.70 450.17 4.47 March
2000 299-W23-15 Y = 457.26 – 2.10 X
R2 = 98.4% 429.61 449.50 19.89 August
2007 299-W22-46 Y = 456.50 – 2.03 X
R2 = 99.1% 438.70 448.84 10.14 March
2003 299-W22-39 Y = 456.68 – 2.05 X
R2 = 99.4% 443.96 448.92 4.96 September
2000 299-W22-45 Y = 457.20 – 2.20 X
R2 = 99.1% 429.07 448.99 19.92 May
2007 299-W22-44 Y = 458.44 – 2.64 X
R2 = 99.0% 432.57 448.98 16.41 September
2004 299-W23-9 Not available
(insufficient data) 432.70 449.04 17.34 January
2006c aX is the slope of the regression line and is expressed in ft/yr. bObtained by dividing the length of submerged screen (ft) minus 2 ft by the slope (ft/yr) of the regression equation. cObtained by using the rate of decline (2.32 ft/year) from the closest well (299-W23-14).

B.4
Figure B.1. Hydrographs of Wells Monitoring WMA S
Figure B.2. Hydrographs of Wells Monitoring WMA SX


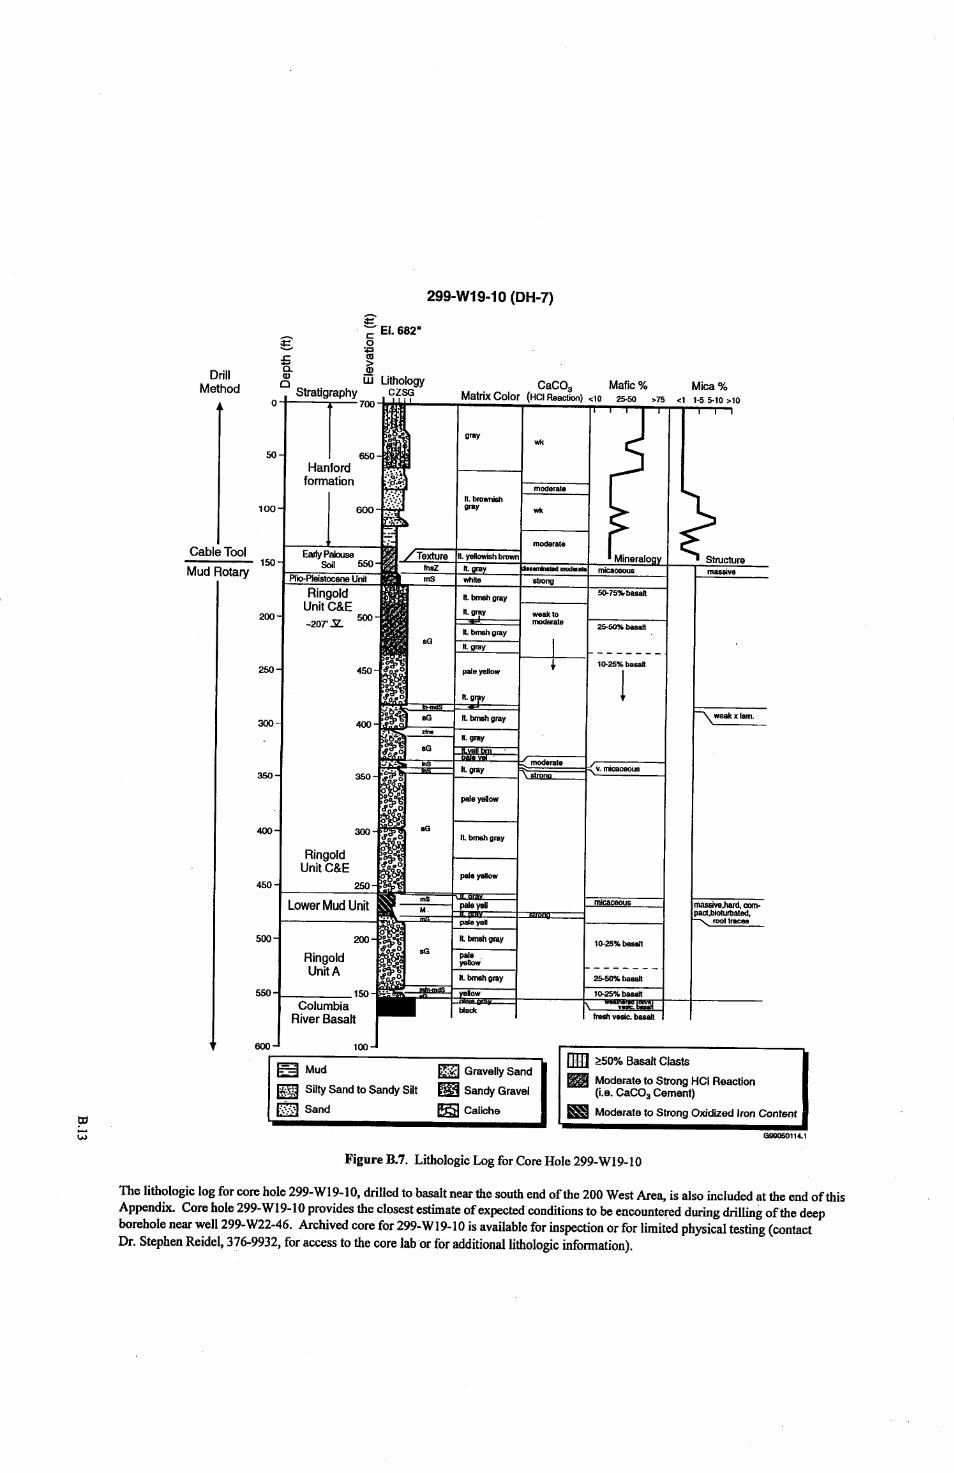


B.16
Figure B.8 is reproduced from Wood et al. (1999). This illustration is an interpretive schematic summary of the sedimentary units beneath WMA S-SX and vicinity. Emphasis is on the major vertical and areal transitions between coarse textured sediments (those with gravel) and fine textured sediment (sand, silt, and clay). These coarse-fine transitions have a significant influence on the movement of wastewater and natural infiltration through the vadose zone to groundwater. Not shown are several smaller lateral vari-ations or facies changes. However, the major facies changes are indicated with zig-zag lines and question marks. The Hanford formation (see legend) is depicted with 5 textural designations. The upper “Sand,” “Gravel Unit B,” and “Gravel Unit A” are equivalent to Lindsey’s H1 unit. The sandy unit below Gravel Unit A is equivalent to Lindsey’s H2 sand unit. In this diagram, we also include a sand-dominated unit that is within Lindsey’s H1 and lies between two gravel-dominated units. It should also be noted that the contacts between sedimentary units are most likely undulating. Straight lines were used here to simplify the graphic presentation. The detailed cross sections on which the figure is based are included in Wood et al. (1999). Also, calcium carbonate cementing (not shown) occurs in the Plio-Pleistocene unit and in the lowest unit shown (Ringold Formation). See Figure B.7 for an indication of the depth distribution and thickness of carbonate at a near-by location. Variable carbonate cementing in the saturated zone may cause preferential pathways for groundwater movement and is thus of considerable interest in understand-ing groundwater flow direction and rate beneath the study area. It is also noteworthy that the upper unconfined aquifer in this area occurs exclusively in the Ringold Formation.


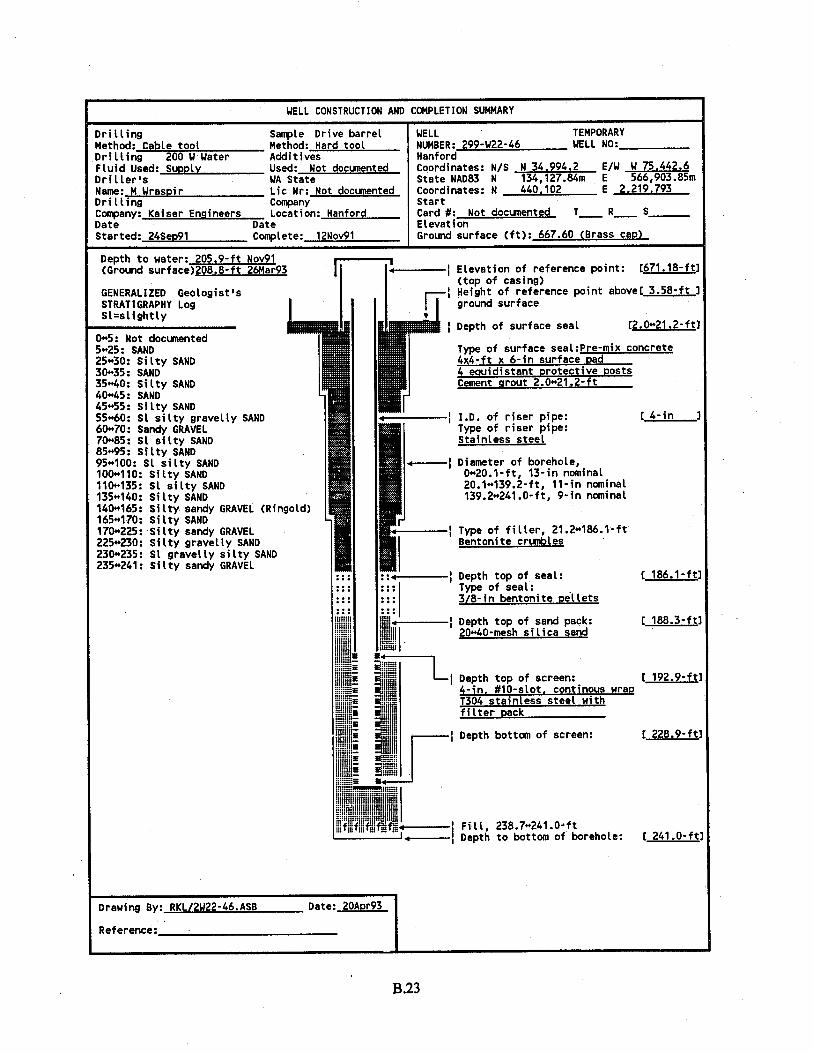


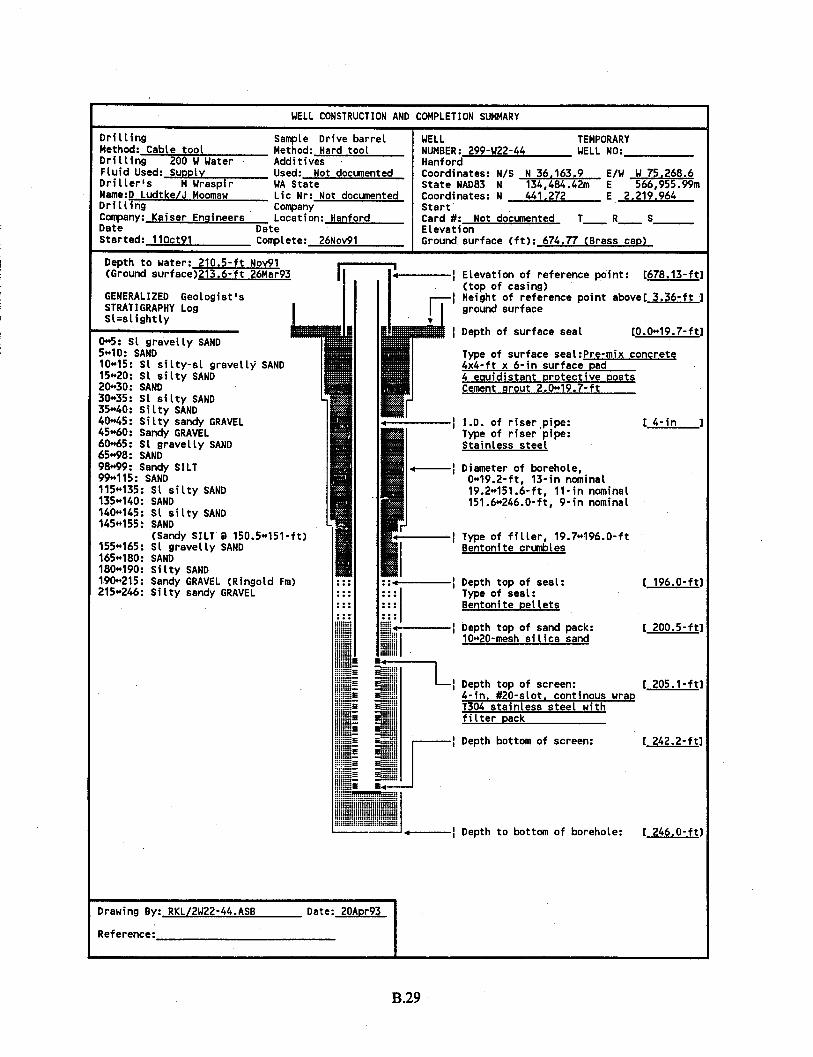

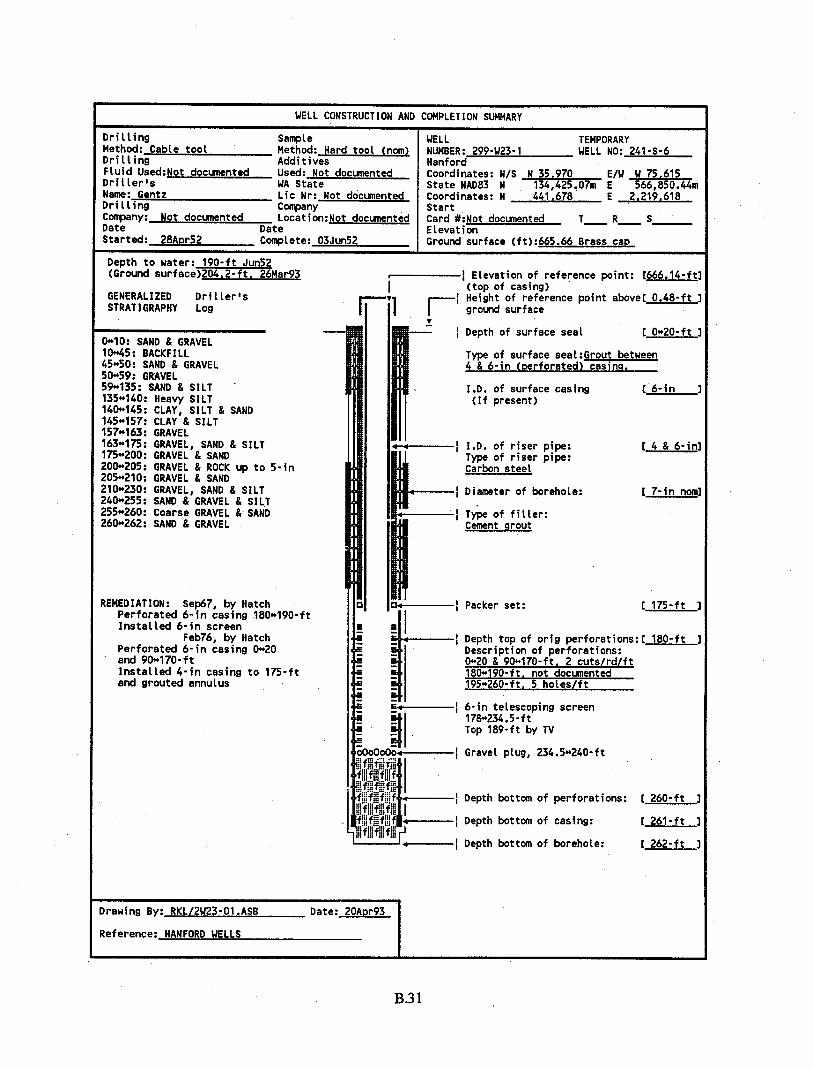


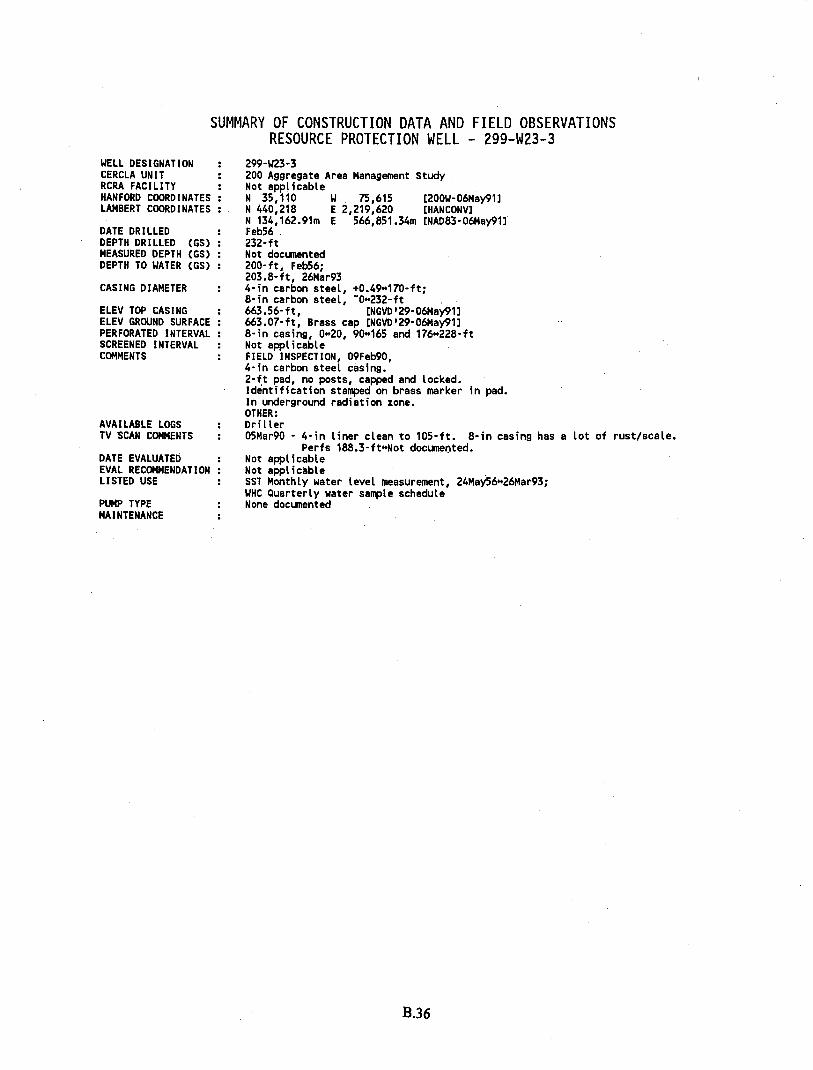


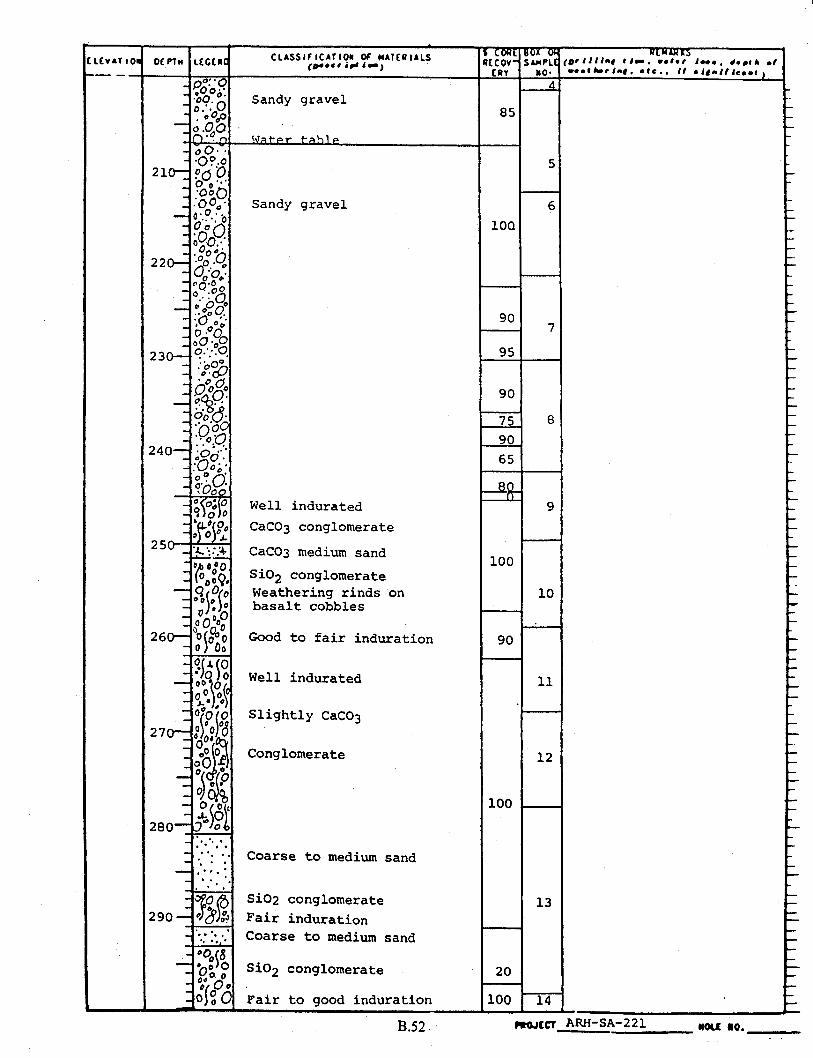


Appendix C
C.1
Appendix C Information presented in this appendix (Table C.1) includes the summary of objectives, decision rules, and data collection needs used to develop the narrative in the main body of this plan. Table C.1 evolved from meetings held with interested parties that included participants from RPP (formerly TWRS), DOE, Ecology, and MACTEC. The original version was revised based on new developments as a result of the Tri-Party Agreement milestone negotiations during November and December of 1998 that resulted in an agreement to prepare a separate work plan for a RCRA Facility Investigation/Corrective Measures Study (RFI/CMS). In addition, changes were made reflecting the outcome of a separate DQO conducted to address RCRA groundwater drilling activities for FY99 that was conducted by Environmental Quality Management, Richland, Washington, between December 1998 and January 1999. Comments provided by Ecology in a letter to DOE concerning the initial assessment results (PNNL-11810) were also incorporated to the extent possible. Vadose zone and related tasks identified in earlier versions of Table C.1 were removed. The RFI/CMS work plan will address vadose zone characterization needs and will ensure coordination with the groundwater work described here to ensure maximum information is obtained from all subsurface characterization activities in the vicinity of the S and SX tank farms. Also, it should be noted that the task to assess how tank related contaminants were distributed in groundwater at well 299-W23-1 might not be possible because of the transient nature of the contami-nation event that occurred in 1998. However, if there is a recurrence in this well, or any of the other network wells, the information needs and approach would be the same as indicated in Table C.1. Likewise, water can no longer be pumped from well 299-W23-7, which makes proposed testing unlikely until the well is either remediated or replaced. C.1 Reference PNNL-11810. 1998. Results of Phase I Groundwater Quality Assessment for Single-Shell Tank Waste Management Area S-SX at the Hanford Site. V. G. Johnson and C. J. Chou, Pacific Northwest National Laboratory, Richland, Washington.
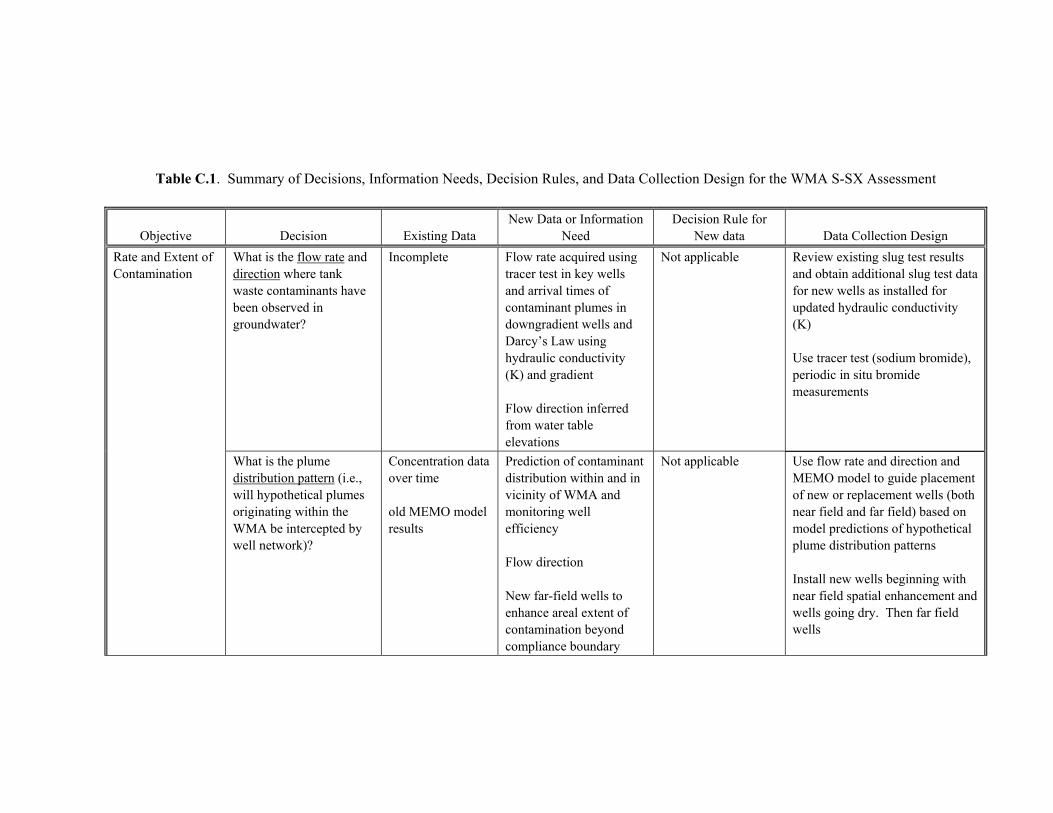
Table C.1. Summary of Decisions, Information Needs, Decision Rules, and Data Collection Design for the WMA S-SX Assessment
Objective
Decision
Existing Data
New Data or Information
Need
Decision Rule for
New data
Data Collection Design What is the flow rate and direction where tank waste contaminants have been observed in groundwater?
Incomplete
Flow rate acquired using tracer test in key wells and arrival times of contaminant plumes in downgradient wells and Darcy’s Law using hydraulic conductivity (K) and gradient Flow direction inferred from water table elevations
Not applicable
Review existing slug test results and obtain additional slug test data for new wells as installed for updated hydraulic conductivity (K) Use tracer test (sodium bromide), periodic in situ bromide measurements
Rate and Extent of Contamination
What is the plume distribution pattern (i.e., will hypothetical plumes originating within the WMA be intercepted by well network)?
Concentration data over time old MEMO model results
Prediction of contaminant distribution within and in vicinity of WMA and monitoring well efficiency Flow direction New far-field wells to enhance areal extent of contamination beyond compliance boundary
Not applicable
Use flow rate and direction and MEMO model to guide placement of new or replacement wells (both near field and far field) based on model predictions of hypothetical plume distribution patterns Install new wells beginning with near field spatial enhancement and wells going dry. Then far field wells

Table C.1. (contd)
Objective
Decision
Existing Data
New Data or
Information Need
Decision Rule for New
data
Data Collection Design Is the renewed occurrence of 99Tc in well 2-W23-1 a localized/borehole related effect or more widely distributed in the aquifer?
Incomplete
Large volume purging with periodic 99Tc measurements
If concentration of 99Tc declines rapidly with volume removed from the well, a borehole related effect is indicated If concentration of 99Tc remains consistent over the extended purge cycle, aquifer contamination is indicated
*Large volume purging: - Periodic measurements of 99Tc in well 2-W23-1 - If results indicate the source is distributed in the aquifer, an upgradient tank farm source is indicated *Note: assuming 99Tc transient persists.
Rate and Extent of Contamination
Have downgradient wells been strategically located to intercept migrating contaminants?
Incomplete
New/replacement wells are needed
Not applicable
Interim use of existing non-RCRA wells inside tank farms (install dedicated pumps) Enhance upgradient spatial coverage with existing upgradient non-RCRA well Install new/replacement downgradient wells(a) : near field first then far field

Table C.1. (contd)
Objective
Decision
Existing Data
New Data or
Information Need
Decision Rule for New
data
Data Collection Design Rate and Extent of Contamination
What is the depth distribution of contaminants in the aquifer?
Concentrations of contaminants at normal sampling depth (5 to 7 ft below the static water level) and at 2-ft level in 2 key wells
Concentrations of contaminants at top of water table (0 to 2 cm) and at depths within screened interval in selected wells Depth sampling during drilling Profile of contaminants in borehole
If concentrations vary with depth and higher concentration occurs at top then unsaturated flow through vadose zone is indicated. If concentration is more uniform with depth, vadose saturated flow as a driver is implied. If concentrations increase with depth then density driven transport through the vadose zone may be indicated. Additional stable isotope and chemical measurements may be needed
Use Kabis sampler and use screening parameters (NO3, Cr) and specific conductance profile in selected wells. If high concentrations occur at 0 to 2 cm, a low purge device will be used to acquire sufficient volume of water for the complete list of constituents of interest (99Tc, 137Cs, 90Sr, 237Np, 239Pu, 241Am, nitrate, chromate, major anions and cations). Install deep characterization well in a critical location. Sample at multiple depths closer to bottom of aquifer during drilling using packer and pump. Depths sampled should follow approximate vertical spacing; e.g., 0, 5, 10, 20, 40, 80, 160 m below static water level

Table C.1. (contd)
Objective
Decision
Existing Data
New Data or Information
Need
Decision Rule for
New data
Data Collection Design Rate and Extent of Contamination
Is 137Cs in old well 2-W23-7 (located inside the S-SX farms) borehole related or is it distributed in the aquifer?
Incomplete
Large volume purging with periodic filtered/ unfiltered 137Cs measurements Particle size analysis of existing particles in well water samples
If concentration of 137Cs declines rapidly with volume removed from the well, a borehole related effect is indicated Otherwise, aquifer contamination is indicated Also, if most of the 137Cs is associated with particles > 1 µm, colloid transport is unlikely
Large volume purging(b)
- Periodic filtered/unfiltered measurements of 137Cs in well 2-W23-7 (filter through ultra filtration cartridge, e.g., 1, 0.1, 0.05 µm filters)
- If results indicate a borehole related effect, the well should be removed, or decommissioned - If results indicate the source is distributed in the aquifer, efforts will be undertaken to study the hypothesized colloidal transport mechanism and pathway
Has the isotopic and chemical nature of the source term waste constituents been adequately characterized in groundwater?
Incomplete
Need to study other potentially long-lived radionuclides (e.g., 237Np, 79Se) and potentially complexed radionuclides (transuranics) Study the speciation of Cr, U, and the potential for colloidal phases of Cs and transuranics
Not applicable
Use selected wells that have exhibited high 99Tc and other tank waste indicators Colorometric/spectrophoto metric methods could be used to identify chemical species of Cr and U Use ultrafiltration cartridges to assess the presence or absence of a colloidal phase
(a) In accordance with RCRA groundwater program prioritization drilling schedule. (b) Assume well still produces water.

PNNL-12114
Distr.1
Distribution No. of Copies OFFSITE C. Abraham U.S. General Accounting Office 825 Jadwin Ave., MSIN #A1-80 Richland, WA 99352 2 Confederated Tribes and Bands of the Yakama Indian Nation Environmental Restoration Waste Management Program P.O. Box 151 Toppenish, WA 98948 ATTN: W. Riggsbee R. Jim 2 Confederated Tribes of the Umatilla Indian Reservation P.O. Box 638 Pendleton, OR 97801 ATTN: B. Burke T. Gilmore T. French Savannah River Site Aiken, SC 29802 2 Nez Perce Tribe Nez Perce Tribal Department of Environmental Restoration and Waste Management P.O. Box 365 Lapwai, ID 83540 ATTN: D. Powaukee S. Sobczyk
No. of Copies R. Patt Oregon Water Resources Water Resources Department 555 13th Street Northeast Salem, OR 97301 G. Pollet Heart of America Northwest Heart of American Northwest, Suite 208 Seattle, WA 98101 P. Rogers Jacobs Engineering Group, Inc. 3250 W. Clearwater Ave. Kennewick, WA 99336 S. Van Verst Washington State Department of Health Airdustrial Park, Bldg. 5 Olympia, Washington 98504 ONSITE 18 DOE Richland Operations Office C. E. Clark A5-15 M. J. Furman (7) H0-12 J. B. Hall A5-15 R. D. Hildebrand H0-12 R. A. Holten H0-12 R. W. Lober S7-51 E. M. Mattlin A5-15 J. K. McClusky S7-54 J. A. Poppiti G3-08 E. J. Rasmussen A5-58 K. M. Thompson H0-12 Public Reading Room H2-53

PNNL-12114
Distr.2
No. of Copies 2 Bechtel Hanford, Inc. B. H. Ford H0-02 G. Hinkel 2 Fluor Daniel Hanford, Inc. E. A. Fredenburg H6-12 F. A. Ruck H6-23 Fluor Daniel Northwest, Inc. F. M. Mann B4-43 7 Lockheed Martin Hanford Corporation R. J. Brown T4-08 C. B. Bryan T4-07 B. G. Erlandson R1-51 K. R. Fecht H0-02 A. J. Knepp H0-22 D. A. Myers G3-21 R. D. Wojtasek G3-21 2 MACTEC-ERS J. F. Bertsch B1-42 R. G. McCain B1-42 U.S. Environmental Protection Agency D. R. Sherwood B5-01 5 Washington State Department of Ecology S. L. Dahl B5-18 D. N. Goswami B5-18 A. D. Huckaby B5-18 S. Leja B5-18 S. McKinney (Olympia) B5-18
No. of Copies 2 Waste Management Federal Services, Inc. J. C. Sonnichsen H6-26 M. I. Wood H6-06 Waste Management Northwest M. G. Gardner H1-11 59 Pacific Northwest National Laboratory K. J. Cantrell K6-81 C. J. Chou (5) K6-81 J. L. Devary K6-96 P. E. Dresel K6-96 R. M. Ecker K6-91 J. C. Evans, Jr. K6-96 G. W. Gee K9-33 M. J. Hartman K6-96 F. N. Hodges K6-81 G. R. Holdren K6-81 D. G. Horton K6-81 V. G. Johnson (20) K6-96 S. P. Luttrell (5) K6-96 S. V. Mattigod K6-81 R. B. Mercer K6-96 L. F. Morasch K6-86 S. M. Narbutovskih K6-81 T. L. Page K9-18 S. P. Reidel K6-81 R. Schalla K6-96 R. J. Serne K6-81 R. M. Smith K6-96 F. A. Spane K6-96 P. D. Thorne K9-33 B. A. Williams K6-81 J. H. Zachara K8-96 Information Release Office (7) K1-06