RCED-93-40FS Rural Development: Profile of Rural Areasarchive.gao.gov/t2pbat6/149199.pdf · April...
36
April I!)93 RURAL DEVELOPMENT Profile of Rural Areas
-
Upload
duongquynh -
Category
Documents
-
view
216 -
download
3
Transcript of RCED-93-40FS Rural Development: Profile of Rural Areasarchive.gao.gov/t2pbat6/149199.pdf · April...

April I!)93 RURAL DEVELOPMENT
Profile of Rural Areas


GAO United States General Accounting OfYice Washington, D.C. 20648
Resources, Community, and Economic Development Division
B-261242
April 29,1993
The Honorable Patrick J. Leahy Chainnan The Honorable Richard G. Lugar Ranking Minority Member Committee on Agriculture,
Nutrition, and Forestry United States Senate
The Honorable Thomas A. Daschle United States Senate
This fact sheet responds to your December 5,1991, request that we develop a demographic and economic profile of rural areas on the basis of existing data sources. More specifically, it provides information on (1) trends in the population and age of persons in nonmetropolitan counties, (2) trends in nonmetropolitan per capita income and employment, and economic activities in nonmetropolitan areas; and (3) the geographic distribution of farm program payments.
Except as noted, data were analyzed according to metropolitan/nonmetropolit.an (metro/nonmetro) county classifications as defined by the Office of Management and Budget (OMB). In summary, we found the following:
l The nation’s rural population is declining as a percentage of the overall national population. In 1930, the rural population was 53.8 million (43.7 percent of the total U.S. population); in 1990, the rural population was 61.7 million (26 percent of the total population).’ Fifty-four percent of the nation’s nonmetro counties saw a decline in population during the 1980s. I,
l Nonmetro per capita income has been consistently lower than metro per capita income for over two decades, and from 1980 until mid-1992, nonmetro unemployment rates have been consistently higher than metro unemployment rates.
. Farming is no longer the primary economic activity in most nonmetro areas, although it remains a significant source of earned income. Although a variety of criteria may be used in defining a county’s primary economic activity, we defined it as an industry that provides 20 percent or more of a county’s labor and proprietor (earned) income. By this definition, in 1968,
‘This comparison is based on a Bureau of the Census classification of urban and rural areas rather than OMB’s because OMB’s standard delinition of metropolitan statistical areas was not issued until 1949.
Page 1 GAOiBCED-93-40FS Bud Development

B-261242
farm ing was a primary economic activity in only 22 percent of nonmetro counties. In contrast, manufacturing was a primary economic activity in 40 percent of nonmetro counties; federal, state, and local government enterprises were a primary economic activity in 31 percent of nonmetro counties; and m ining was a primary economic activity in 4.5 percent of nonmetro counties.
l Farm program payments (direct program payments to farm operators, excluding institutional recipients and nonoperator landlords, and excluding benefits from programs that support market prices) are widely distributed geographically. Ninety-four percent of all nonmetro counties have farms that received some of the total $9.6 billion in farm program payments in 1987 (the most recent available data). However, about 60 percent of all government payments went to 313,000 farms concentrated in the upper M idwest. In addition, 18 percent of the total farm program payments in 1987 were received by farmers in metro counties.
Section 1 of thii fact sheet contains information on trends in the population of and median age in nonmetro areas. Section 2 contains information on trends in per capita income and employment, and primary economic activities in nonmetro areas. Section 3 contains information on the geographic distribution of farm program payments.
We obtained the information for this fact sheet from publicly available data from the Census of Population and Housing, 1990, and the Census of Agriculture, 1987, both prepared by the Bureau of the Census; and the Regional Economic Information System, prepared by the Department of Commerce’s Bureau of Economic Analysis. Data on employment and unemployment were developed by the Bureau of the Census from the Bureau’s Current Population Survey. We did not independently verify 4 these data
We discussed the information in this fact sheet with officials from the Agriculture and Rural Economy Division of the U.S. Department of Agriculture’s Economic Research Service (ERS). These officials generally agreed with the information, stressing, however, that the analysis of economic activities can vary widely according to the criteria used to define a primary economic activity. In the past, ERS has used, and continues to use, different criteria for each economic activity. We have incorporated their comments where appropriate. For a complete
Page 2 GAWKED-93-40FS Rural Development

B-151240
discussion of our methodology, see appendix I. For a discussion of the terms metro/nonmetro and urban/rural, see appendix II.
As arranged with your offices, unless you publicly announce its contents earlier, we plan no further distribution of this fact sheet until 16 days after the date of this letter. At that time, we will send copies to appropriate Senate and House committees, interested Members of Congress, and the Secretary of Agriculture. We will make copies available to others on request.
Please contact me at (202) 612-6138 if you or your staff have any questions. Major contributors to this fact sheet are listed in appendix III.
Sincerely yours,
John W . Harman Director, Food and
Agriculture Issues
Page 3 GAWRCED-9340FS Rural Development
2,

Contents
Letter Section 1 6
Trends in Population Total, Urban, and Rural Population of the United States 6 Rural Population as a Percentage of the Total U.S. Population 7
Size and Median Age Population Growth Rates 8 Median Age of the Population 9
Section 2 11
Trends in Per Capita Annual Per Capita Income 11 Average Annual Unemployment Rates 12
Income, Employment, Farming-Dependent Counties 13 and Economic Other Sectoral Dependence 16
Activity Poorest Nonmetro Counties 18
Section 3 21
Distribution of Farm Distribution of Payments 21 Payments to Metro Farmers 22
Program Payments 1
Appendix I 24
Objectives, Scope, and Methodology Appendix II 26
Definitions of Metro qnd Nonmetro Areas 4 H Appendix III 32
Major Contributors to This Fact Sheet Tables Table 2.1: Economic Activities in Nonmetro Counties, Except 15
Agriculture, 1988 Table II, 1: Rural-Urban Contimmm Codes 30
Page 4 GhMtCED484OFS RuralDevelopment

Figures Figure 1.1: Total, Urban, and Rural Population of the United states, 1790-1990
-
7
Figure 1.2: Percentage of the Total US. Population Living in Rural Areas, 1790-1990
8
Figure 1.3: U.S. Population Growth Rates, 1800-1990 Figure 1.4: Median Age of the U.S. Population, 1820-1990 Figure 2.1: Average Annual Per Capita Income: Metro, Nonmetro,
and National, 196989
9 10 12
Figure 2.2: Average Annual Unemployment Rates: Metro and Nonmetro, 1980-92
13
Figure 2.3: Continental Nonmetro Farming-Dependent Counties, 1988
14
Figure 2.4: Continental Nonmetro Manufacturing-Dependent counties, 1988
16
Figure 2.6: Continental Nonmetro Government- Activities- Dependent Counties, 1988
Figure 2.6: Continental Nonmetro Mining-Dependent Counties, 1988
17
18
Figure 2.7: Poorest Nonmetro Counties, 1989 20 Figure 3.1: Distribution of Farm Program Payments, Metro and 22
Nonmetro, 1987 Figure 3.2: Farm Program Payments to Metro Areas, 1987 Figure 11.1: U.S. Population Density, 1990 Figure 11.2: Metro and Nonmetro Counties, 1990 Figure 11.3: Rural-Urban Continuum Codes, 1990
23 27 29 31
Abbreviations
BEA Bureau of Economic Analysis EBS Economic Research Service GAO General Accounting Office MSA Metropolitan Statistical Area OMB Office of Management and Budget SIC Standard Industrial Classification UA U&mized Area USDA US. Department of Agriculture
Pyle6 GAWRCED-93-40FS Rural Development

Section 1
Trends in Population Size and Median Age
This section discusses both historical trends in population size and changes in median population age. The population in rural areas has grown at a much slower rate than in urban areas. Fifty-four percent of the nation’s nonmetropolitan counties lost population during the 1980s. In both areas, however, the median age of the population has steadily increased.
Total, Urban, and Rural Population of the United States
than doubled, from 123 million to 248.7 million. Most of this increase, however, took place in urban areas. The urban population first exceeded the rural population in 1920 and continues to grow at a much faster pace. Between 1930 and 1990, the urban population grew 171 percent, from 68.9 million to 187 million. For the same time period, the rural population grew only 16 percent-from 53.8 million to 61.7 million.’
‘This comparison is based on the Bureau of the Census classification of urban and rural areas.
Page 6 GAO/WED-S340FS Rural Development
‘; ,

seenon 1 Tmnb In Population Slm md Medh Age
Figure 1.1: Total, Urban, and Rural Population of the United State*, 1790-1990
m ”*ooo Populrtion (In thouundo) 240,000
220,000
200,000
180,000
180,000
140,000
120,000
100,000
80,000
60,000
40,000
20,000
0
1790 lM0 1830 18SO 1870 1890 lolo 1030 1950 1970 lwo
Yrr
- Total U.S. Population -- Urban Population -**mm- Rural Populalkm
Note: This analysis is based on the Bureau of the Census’s definition of urban/rural
Source: Data are from the Statistical Abstract of the United States, 1992.
Rural Population as a The rural population has been declining as a percentage of the total population of the United States since the first census was taken in 1790. In l
Percentage of the 1790,96 percent of the population lived in rural areas; in 1990, this figure Totd U.S. Population dropped to 26 percent.2 Although the percentage of the population living in
rural areas has steadily decreased during the last two centuries, more than 80 percent of the total U.S. land area was designated as nonmetro in 1990.
qhis comparison uses the Bureau of the Census’s defiuition of urban/rural.
Page 7 GAWRCED-93-40FS Rural Development

sectton 1 Treab in Population Sire and Medhn Age
Figure 1.2: Percentage of the Total U.S. Population Living In Rural Areaa, 1790-1990
Puwnt of the total popuWon In rural ma0 100
70
80
80
40
30
20
10
0
1790 1810 1890 1860 1870 1890 1910 1939 1960 1970 1990
Year Note: This analysis is based on the Bureau of the Census’s definition of urban/rural.
Source: Data are from the Statistical Abstract of the United States, 1992.
Population Growth Rates
1920, urban population growth has outpaced rural population growth3 for each lo-year interval since the first Census of Population. The three exceptions to this trend were the decades ending in 1820,1940, and 1980, when the rural and the urban population growth rates were nearly a identical. For two decades (those ending in 1960 and 1960) rural population growth was negative as the total rural population declined.
SPopulation growth rates are calculated on the basis of the lo-year intervals used in the Census of Population.
Page 8 GAO/RCED-9340FS Rural Development

Section 1 Trende in Population Size and Median Age
Figure 1.3: U.S. Population Growth Rates, 1800-1990
100.0 OrowthRata
- National Growth Rate -- Urban Growth Rate l .=-mm Rural Growth Rate
Note: This analysis is based on the Bureau of the Census’s definition of urban/rural.
Source: Data are from the Statistical Abstract of the United States, 1992.
Median Age of the Population
The median age of the national population has been steadily increasing since 1820 except for a decline between 1960 and 1970, marking the effects of the baby boom era. There is little difference between the median ages of
a
the nonmetro and metro populations, which in 1990 were 32.7 and 31.6, respectively. However, in nonmetro areas, the percentage of the population 60 years old or older comprises a greater percentage of the population than in metro areas. Nationally, 16.8 percent of the population is 60 years or older; in metro areas, 16 percent; and in nonmetro areas, 19.4 percent.
Page 9 GAO/RCED-93-40FS Rural Development

section 1 Trendm in PopuIatioo Size aad Medhn Age
Agure 1.4: Median A9e of the U.S. Population, 1829-1999
36 MadIan Ago (yr.)
30
25
1830 1060 1070 1800 1910 1930 1050 1970 1990
Source: Data are from the Statistical Abstract of the United States, 1992.
a
Page 10 GMMRCED-93-4OFS Rural Development

Section 2
Trends in Per Capita Income, Employment, and Economic Activity
This section provides information on economic conditions and activities in nonmetro areas. The data show that per capita income is lower, and until mid-1992, unemployment was higher in nonmetro areas compared with metro areas. The nonmetro economy, however, has become more diverse over time, as farming is no longer a primary economic activity in most nonmetro areas. For the purposes of this fact sheet, a primary economic activity of a county is defined as a sector of the economy that provides 20 percent or more of a county’s labor and proprietor (earned) income. As defined, one or more industries in a county may be considered a primary economic activity. We recognize that other researchers use different standards in determining classifications which can result in different categorizations of counties. Business activities are classified according to the Standard Industrial Classification (SIC) Codes determined by the Office of Management and Budget (OMB).
Annual Per Capita Income
Nonmetro per capita income has consistently been lower than metro per capita income. The gap between the two is growing: in 1978, nonmetro per capita income was 77 percent of metro per capita income; in 1988, nonmetro per capita income was 72 percent of metro per capita income.
Page 11 GAO/RCED-93-40FS Rural Development
Section 2 Trend la Per Caplb Income, Employment, and l3umomk Actlvlty
hum 2.1: Avera- Annual PM Ca@m Income: Metro, Nonmetro, and National, 1969.89 (in 1987 ~~11~~~) AnnuolPuCapbIfwomr,
18,000
1(I,500
15,000
13,500
12,ooo
10,500
9,~
7,500
two
4,500
3‘W
1,500
0
IWO 1071 1873 1976 1070 1001 1883 1906 1ooT
- U.S. -- MeVopoiltan l *.**m Nonmetmpollten
Source: Regional Economic information System.
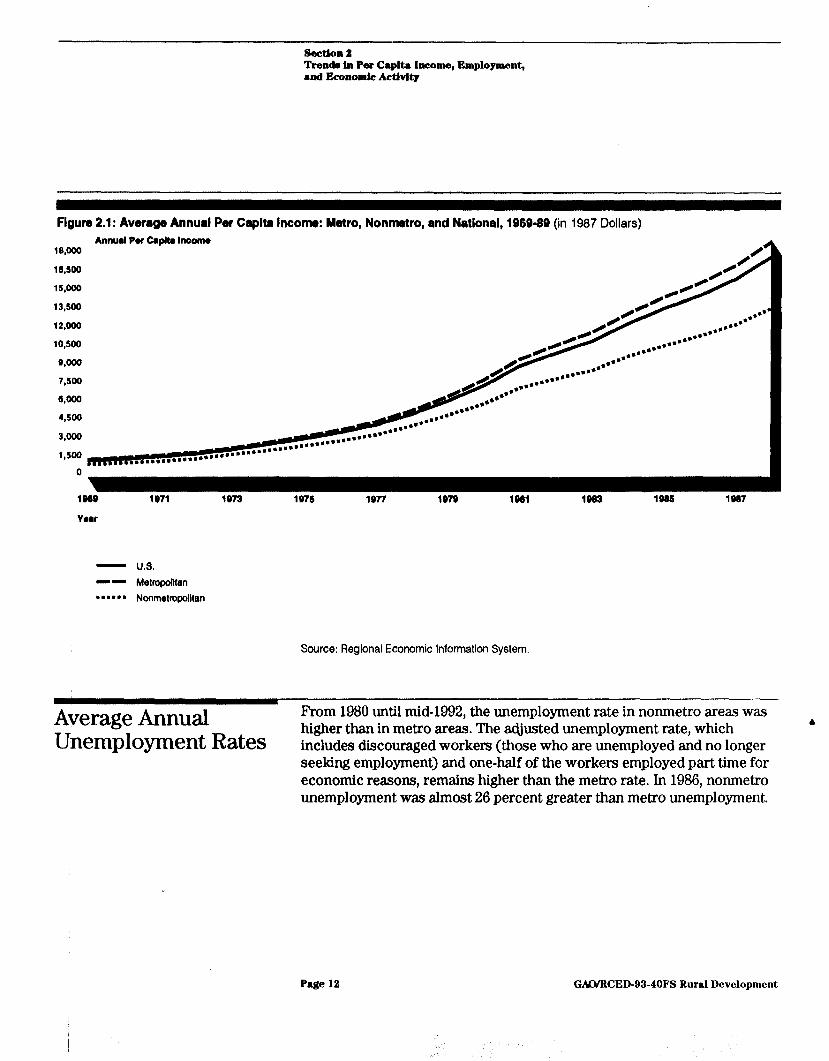
Average Annual From 1980 until mid-1992, the unemployment rate in nonmetro areas was higher than in metro areas. The musted unemployment rate, which a
Unemployment Rates includes discouraged workers (those who are unemployed and no longer seeking employment) and one-half of the workers employed part time-for economic reasons, remains higher than the metro rate. In 1986, nonmetro unemployment was almost 26 percent greater than metro unemployment.
Page 12 GAWRCED-93-4OFS Rural Development

secnoo t Trenda In Per Capita Income, Employment, and Economic Activity
Figure 2.2: Average Annual Unemployment Rater: Metro and Nonmetro, 198092 12.0 Unomploymont Rat0 (percent)
11.0
10.0
0.0
8.0
7.0
6.0
6.0
4.0
-- Metropolitan Unemployment Rate n l 9m-m Nonmetropolltan Unemployment Rate
Source: U.S. Department of Commerce, Bureau of the Census, Current Population Survey.
Farming-Dependent Counties
While farming continues to play an important role in many nonmetro areas, it is no longer the primary economic activity for nonmetro America. About 3.9 million people-l.6 percent of the total U.S. population-lived on farms in 1990; this represented a decline of 31 percent since 1980. The total number of farms also continues to decrease, dropping 12 percent from 2.4 million farms in 1981 to 2.1 million farms in 1990. In 1990, farming accounted for less than 2 percent of the gross national product.
With the decline in the number of farms and farmers since the 193Os, the nonmetro economy has changed from one dependent on agriculture to one dependent on a number of different economic activities. In fact, the number of nonmetro counties with a substantial economic dependence on farming has decreased 26 percent since 1979. In 1988, only 22 percent of
Page 13 GMYRCED9340FS Rural Development

Section 2 Trends in Per Capita Income, Employment, and Economic AcUvity
nonmetro counties (616 of 2,349) relied on agriculture as a primary economic activity. The location of these counties is shown in figure 2.3.
Igure 2.3: Continental Nonmetro Farming-Dependent Countleo, 1999
Farm income in 1988 as a percentage of labor and proprietor income:
Greater than or equal to 20 percent
I Less than 20 percent
I Metro counties
Source: Regional Economic Information System.
Page 14 GAWR~ED9340FS Rural Development

section 2 Tren& in Per Capita Income, Employment, l d Economic Activity
Other Sectoral Dependence
m Some economic activities in nonmetro counties are listed in table 2.1. As figure 2.3 illustrated, agriculture is concentrated in the M idwest. F’igures 2.4,2.6, and 2.6 illustrate the geographic concentration of manufacturing-, government-, and m ining-dependent counties, respectively. Manufacturing, the dominant economic activity in nonmetro areas, is heavily concentrated in the South and eastern United States. Government (federal, state, and local) activities are more widely dispensed, with some concentration in the Southwest. M ining-dependent counties’ are more scarce, with some concentration in the Appalachian region and parts of the West.
Table 2.1: Economic Activlthw in Nonmetro Countieo, Except Agriculture, 1988 Buoineu activity Number of counties
Manufacturing 945 Government activities 725
Percentage of nonmetro counties
40.2 30.9
Mining Source: Regional Economic Information System.
105 4.5
IThis category may be underestimated as some data on mining income were not reported because of concerna regarding data con!Mentiality.
Page 16 GAO/RCED-93-40FS Rural Development

Section Z Trenda in Per Capita Income, Employment, and Economic Activity
lgure 2.4: Continental Nonmetro Manufacturing-Dependent Countiee, 1988
Manufacturing income in 1988 as a percentage of labor and proprietor income:
Greater than or equal to 20 percent
m Less than 20 percent
El Metro counties
Source: Regional Economic Information System.
Page 16 GAWRCED-93-40FS Rural Development

Secuon e Trends in Per Capitr Income, Employment, and Eeonomlc Activity
Figure 2.6: Continental Nonmetrc Government- Activities Dependent Counties, 1988
Government actlvitles income in 1988 as a percentage of labor and proprietor income:
Greater than or equal to 20 percent
111 Less than 20 percent
lzl Metro counties
Source: Regional Economic Information System.
Page 17 GACVRCED-93-40FS Rural Development

Section 2 Trenda in Per Capita Income, Employment, and Economic Activity
lgun 2.6: Continental Nonmetro Mining-Dependent Counties, 1988
Mining activities income in 1988 as a percentage of labor and proprietor income:
Greater than or equal to 20 percent
Less than 20 percent
Metro counties
Source: Regional Economic Information System
Poorest Nonmetro Counties w
2.7. These counties are clustered in the South and Appalachian regions.
?-Lowest per capita income indicates the bottom 26 percent of counties when ranked by per capita income.
Page 18 GAWRCED-93-40FS Rural Development

soctloll2 Trend in Per CapMa Income, Employment, rnd Economic ACtlvlQ
Farming is not a significant factor in personal income for these regions. Many of the poorest nonmetro counties are located where populations contain a high percentage of racial m inorities.
Page 19 GMNRCED-93-4OFS Rural Development

Trendo In Per Capita Income, Employment, and EeonoInlc ActlvIty
lpre 2.7: Poorest Nonmetro Countlee, 1989
Per capita income in 1989:
Greater than or equal to nonmelro median or metro Between 25th percentile and 50th percentile of nonmetro counties
El Lowest 25 percent of nonmetro counties
Source: Regional Economic Information System.
Page 20 GAO/RCED-93-40PS Rural Development

Section 3
Distribution of Farm Program Payments
This section provides information on the geographic distribution of farm program payments. Farm program payments (government payments), as reported in the 1987 Census of Agriculture, include direct cash or generic commodity certificate payments received by the farm operator in 1987. This includes deficiency and diversion payments; wool payments; payments for the Dairy Termination Program, the Conservation Reserve Program, and other conservation programs; and all other federal farm programs under which payments were made directly to farm operators. They exclude payments to institutional recipients and nonoperator landlords. Farm program payments also do not include estimates of benefits from price support programs.
As defined by the 1987 Census of Agriculture, a farm was any place used for or connected with agricultural operations, under the day-to-day control of one individual or management, and that had, or normally would have had, $1,000 or more in total value of sales of agricultural products during the year.
Distribution of Payments
Seventy-five percent of all nonmetro counties have farms that receive some farm program payments. In 1987, farmers received $9.6 billion in farm program payments; farmers in seven states (Illinois, Iowa, Kansas, Minnesota, Nebraska, North Dakota, and South Dakota) received 60 percent of all government program payments. About two-thirds of all farms in these states receive farm program payments. These 313,000 farms account for 16 percent of all farms but 45 percent of all subsidized farms. The remaining 60 percent of farm program payments are disbursed among the other 386,000 subsidized farms in the remaining 43 states. According to Economic Research Service (ERS) demographers, less than 20 percent of the farms which received farm program payments in 1987 are located in farming-dependent counties. Figure 3.1 illustrates the distribution of a payments across the nation.
Page 2 1 GAO/RCED93-40FS Rural Development

sectton 3 Dhatributlon of Farm Program Paymenta
?gure 3.1: Diamibution of Farm Program Payments, Metro and Nonmetro, 1987
Total farm program payments in 1987 in each county (in thousands):
Greater than or equal to $10,000
I $1,000 to $9,999
I Less than $1,000
Source: U.S. Department of Commerce, Bureau of the Census, Census of Agriculture, 1987.
Payments to Metro Farmers
Farmers in metro areas receive 18 percent of all farm program payments (19 percent of the 698,986 subsidized farms are in metro areas.)
Page 22 GMYRCED-93-40FS Rural Development

seellon 3 DLtrlbution olFarm Program Paymentn
Seventy-one percent of the nation’s 2.08 million farms are in nonmetro counties; 29 percent are in metro counties.
Figure 3.2: Farm Program Payment8 to Metro Areaa, 1987
Total farm program payments in 1987 in each county (in thousands):
Greater than or equal to $10,000
111 $1,000 to $9,999
I Less than $1,000 or nonmetro
Source: Census of Agriculture, 1987.
Page 23 GAO/RCED-93-40FS Rural Development

Appendix I
Objectives, Scope, and Methodology
This fact sheet responds to the December 6,1991, request of the Chairman and two members of the Senate Committee on Agriculture, Nutrition, and Forestry, that we develop a demographic and economic profile of rural areas on the basis of existing data sources. More specifically, this fact sheet provides information on (1) trends in population and median age in nonmetro counties (sec. 1); (2) trends in nonmetro per capita income and employment, and economic activities (sec. 2); and (3) the distribution of farm program payments (sec. 3).
We obtained the information for this fact sheet from the Census of Population and Housing, 1990, the Census of Agriculture, 1987, and the Current Population Survey, prepared by the Bureau of the Census; and the Regional Economic Information System, prepared by the Department of Commerce’s Bureau of Economic Analysis (BEA). We did not independently verify these data.
Data were analyzed primarily according to metro/nonmetro classifications as defined by OMB, updated in 1990. For a discussion of the terms of metro/nonmetro, see appendix II.
The Census of Population and Housing, 1990, provided county-level data on total population counts and population by age group. Historical data on population size were obtained from Historical Statistics of the United States, Colonial Times to 1970.
County-level data on employment and unemployment are developed by the Bureau of the Census from the Current Population Survey. The Regional Economic Information System provided county-level data on labor and proprietor income and income by industrial sector. Business activities are classified by Standard Industrial Classification Codes determined by OMB. For the purposes of this fact sheet, a primary economic activity is defined as an economic sector that provides 20 percent or more of a county’s labor and proprietor (earned) income. As defined, one or more industries in a county may be considered a primary economic activity. We recognize that other researchers may use different standards to classify a primary economic activity. In fact, the U.S. Department of Agriculture’s (USDA) ERS uses a S-year average of 20 percent for farming, 30 percent for manufacturing, 26 percent for government, and 20 percent for mining. These standards are based on means and standard deviations and identify counties in which a particular industry was more important than average. These standards may result in different county classifications from those presented here.
Page 24 GAO/RCED-93-40FS Rural Development
t1 ::
+.

Appendix I objectlve8, Ikope, 8nd Methodology
The Census of Agriculture provided county-level data on the number of farms and farm program payments. Farm program payments (government payments) include direct cash or generic commodity certificate payments received by the farm operator in 1987. This includes deficiency and diversion payments; wool payments; payments for the Dairy Termination Program, the Conservation Reserve Program, and other conservation programs; and all other federal farm programs under which payments were made directly to farm operators. (This does not include payments to institutional recipients and nonoperator landlords.) Farm program payments do not include estimates of benefits from price support programs. If these benefits were included, the number of farms receiving government assistance would be greater and the distribution of benefits m ight be different from what we have presented.
We selected counties as the basis for analysis for two reasons: the availability of a wide range of socioeconomic data on a county basis, and the available classifications of counties as metro/nonmetro.
The disadvantage of using a county-based definition is that some people will be omitted from rural policy consideration. For example, where counties are very large, as in the West, or where the metropolitan city is relatively small, there will be some communities within the boundaries of metropolitan counties in which land use and lifestyles appear more rural than urban. USDA estimates that about 43 percent of the 1990 rural population lives in OMB-deAned metro counties.
We conducted our work between January and September 1992. We discussed the information in this fact sheet with USDA officials and have incorporated their comments where appropriate.
P8ge 26 GMMRCED-93-40FS Rum1 Development

Appendix II
Definitions of Metro and Nonmetro Areas
Metro/urban areas can be defined using several criteria. Once this is done, nonmetrolrural is then defined by exclusion-any area that is not metro/urban is nonmetrokural. Determining the criteria used has a great impact on the resulting classification of areas as metro/nonmetro or urban/rural. The Census Bureau classifies 61.7 million (26 percent) of the total population as rural, OMB classifies 66.9 million (23 percent) of the total population as nonmetro. According to the Census definition, 97.6 percent of the total U.S. land area is rural; according to the OMB definition, 84 percent of the land area is nonmetropolitan. LJSDA/ERS estimates that, in 1990,43 percent of the rural population lived in metropolitan counties. e
A further problem with dichotomous definitions is that they permit classification into only two categories-metro/urban or nonmetrokural. This cannot describe the metro/nonmetro continuum or the range of variation that exists in nonmetro areas. Ens attempts to overcome this limitation by further subdividing metro/nonmetro categories (see pp. 29 to 31). However, as with any definition, any broad generalizations about nonmetro conditions will not necessarily be representative for a subset of those areas.
For the purpose of illustration, the primary three definitions are presented here:
1. The Bureau of the Census defines an urbanized area (UA) by population density. According to this definition, each UA includes a central city and the surrounding densely settled territory that together have a population of 60,000 or more and a population density generally exceeding 1,000 people per square mile. A “county” is a political distinction and is not incorporated in the Bureau of the Census’s classification scheme, so one 8 UA may cover parts of several counties.
Under this definition, all persons living in UAS and in places (cities, towns, villages, etc.) with a population of 2,600 or more outside of IJAS are considered the urban population. All others are considered rural. Figure II. 1 illustrates the variations in population density.
Page 26 GAO/RCED-93-40FS Rural Development
.,, . . ,‘, ?” ‘, ,, ,.’ ‘.’ II.,“,*,,, ‘_ , s.,, ,,,

Defhltio~ of Metro and Nonmetro Areaa
Igum 11.1: U.S. Population Dendty, 1990
Population in 1990 per square mile:
Greater than or equal to 1,000
Less than 1,000 and greater than or equal to 100
Less than 100 and greater than 6
I Less than or equal lo 6
Source: Department of Commerce, Bureau of the Census, Census of Population and Housing, 1990.
Page 27 GAQ/RCED-93-4OFS Rural Development

Appendix II Dehklona of Metro and Nonmetro Aream
2. OMB designates areas as metro on the basis of standards released in January 1980. According to this definition, each metropolitan statistical area (MSA) must include at least
l one city with 60,000 or more inhabitants or . an urbanized area (defined by the Bureau of the Census) with at least
60,000 inhabitants and a total MSA population of at least 100,000 (76,000 in New England).
These standards provide that each MSA must include the county in which the central city is located (the central county) and additional contiguous counties (fringe counties), if they are economically and socially integrated with the central county. Any county not included in an MSA is considered nonmetro.
OMB periodically reclassifies counties on the basis of Census data and population estimates.
Page 28 GAWRCED-93-40FS Rural Development

Appendix II Deflnitlone of Metro and Nonmetro Areas
igure 11.2: Metro and Nonmetro Counticm, 1990
Counties:
m Metro El Nonmelro
Source: OMB.
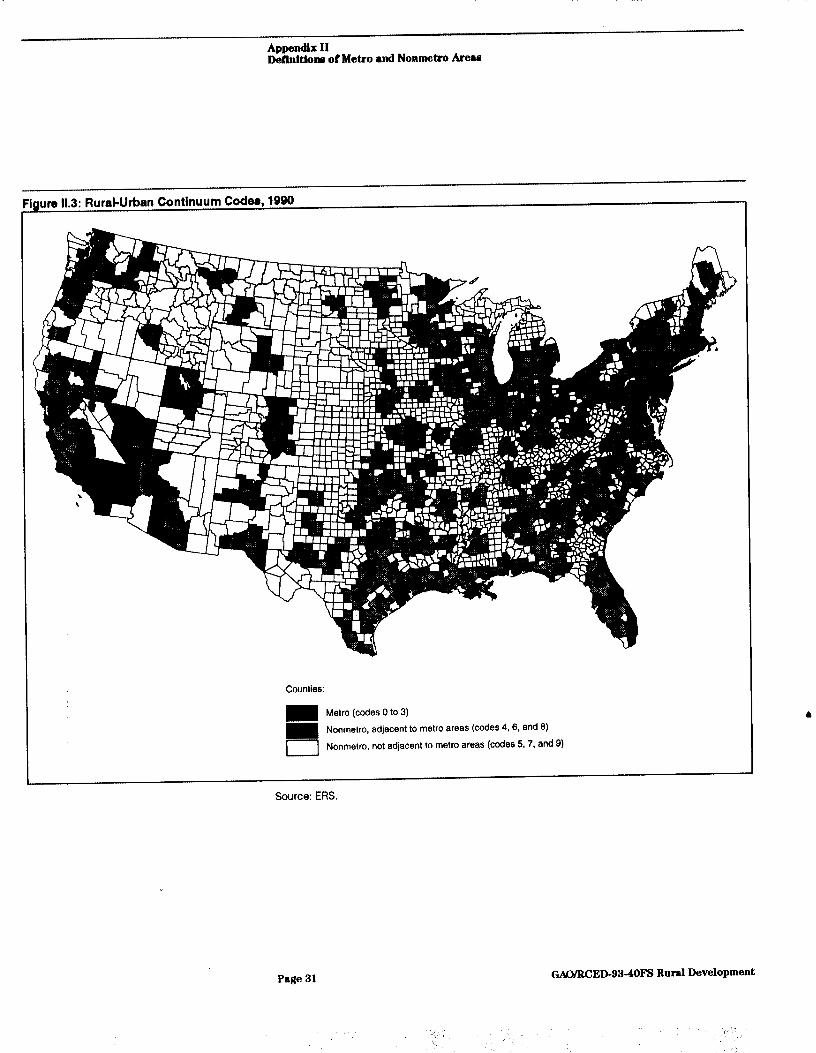
3. ERS uses rural-urban continuum codes to distinguish metro counties by size and nonmetro counties by their degree of urbanization or proximity to metro areas. USDA defines codes zero to 3 as metro, and 4 to 9 as nonmetro.
Page 29 GAO/RCED-93-40FS Rural Development
. . :;
1 ‘.

Appendix II Deflnitlona ol Metro and Nonmetro Areu
Table Il.1 : Rural-Urban Continuum Code* Rural-urban
continuum code Definition Central counties of metro areas with population of 1 million or more Fringe counties of metro areas with population of 1 million or more Counties in metro areas with population of 250,000 to 1 million
3 Counties in metro areas with population fewer than 250,000
7
Urban population of 20,000 or more, adjacent to a metro area Urban population of 20,000 or more, not adjacent to a metro area Urban Population of 2,500 to 19,999, adjacent to a metro area Urban population of 2,500 to 19,999, not adjacent to a metro area
8
9
Completely rural or urban population of fewer than 2,500, adiacent to a metro area Completely rural or urban population of fewer than 2,500, not adiacent to a metro area
Source: ERS.
Page 30 GAWRCED-93-40FS Rural Development
Appendix II DeUnltlona of Metro and Nonmetro Areaa
gure 11.3: Rural-Urban Continuum Coder, 1990
Counties:
Metro (codes 0 to 3)
m Nonmetro, adjacent to metro areas (codes 4,6, and 8)
[ Nonmetro, not adjacent to metro areas (codes $7, and 9)
Source: ERS.
GANRCED-93-40FS Rural Development Page 31

Appendix III
Major Contributors to This Fact Sheet
Resources, Community, and
J. Kennel Goodmiller, Assignment Manager Eva M. Fallon, Evaluator-in-Charge
Economic Curtis S. Groves, Senior Operations Research Analyst
Development Annette Wright, Senior Evaluator Mitchell B. Karpman, Senior Operations Research Analyst
Division, Washington, D.C.
(1110(07) Page 32 GMY%ED98-49FS Rural Development

Ordering Information
The first. copy of each GAO report and tthstimony is fret?. Additional copies are $2 each. Orders should be sent to t,hc? following address, accompanied by a check or money order made out to the Superintendent of Documents, whr? TV necessary. Orders for 100 or more copies to be mailed to a single address art? discounted 25 percent.
Ordt!rs by mail:
lJ.Y. General Accounting Office I’.(). 130x so15 Gaithcrsburg, MD 20884-6015
or visit:
Room 1000 700 4th St. NW (corner of 4th and G Sts. NW) l1.S. Gt?nr!ral Accounting Office Washington, IX
Orders may also be placed by calling (202) 512~600( or by using fax number (301) 258-4066.
PRINTED ON (j$$ RECYCLED PAPER