Raymond James Quarterly Global Energy Report for … · Raymond James Quarterly Global Energy...
40
Global Research Published by Raymond James & Associates Please read domestic and foreign disclosure/risk information beginning on page 37 and Analyst Certification on page 37. © 2015 Raymond James & Associates, Inc., member New York Stock Exchange/SIPC. All rights reserved. International Headquarters: The Raymond James Financial Center | 880 Carillon Parkway | St. Petersburg, Florida 33716 | 800-248-8863 Energy July 14, 2015 Industry Brief Pavel Molchanov, RJA, (713) 278-5270, [email protected] J. Marshall Adkins, RJA, (713) 789-3551, [email protected] Andrew Bradford, CFA, RJL, 403.509.0503, [email protected] Bertrand Hodée, Research Analyst, RJEE, (33 1) 45 64 05 46, [email protected] Santiago Wesenack, CFA, RJ LatAm, (54 11) 4850-2537, [email protected] Energy: Quarterly News _________________________________________________________________________________________ Raymond James Quarterly Global Energy Report for 2Q15 This quarterly report aggregates energy research highlights from Raymond James & Associates and our affiliates: Raymond James Ltd. (Canada), Raymond James European Equities, and Raymond James Latin America. Quarterly Highlights Crude Oil After 1Q15 marked the bottom of the oil price meltdown – with both WTI and Brent averaging their lowest levels since the first half of 2009 – 2Q15 was not as bleak, albeit hardly bullish. Until the very end of the quarter, when the Greek debt crisis and Chinese equity selloff suddenly escalated, oil price volatility was subdued, with prices mostly range-bound. The 2Q averages came in at $62/Bbl for Brent (up 13% sequentially) and $58/Bbl for WTI (up 19% sequentially). The Brent-WTI price spread, $4/Bbl, was slightly narrower than in 1Q. Following the recovery since January’s trough, we anticipate prices will remain broadly on par with recent levels through year-end 2015, followed by further gains in 2016. Barring a truly major economic crisis (to be clear, “Grexit” in and of itself would not count), we don’t envision oil prices falling back to the lows of 1Q. See page 4 for details on our oil price assumptions. Natural Gas With 1Q15 being considerably warmer than the year-ago winter, the quarterly Henry Hub average came in at $2.97/Mcf – down not just year-over-year but again sequentially as well. Not surprisingly, seasonality in 2Q15 exerted further pressure on gas prices, and the quarterly average of $2.67/Mcf was the lowest since 2Q12. Production growth is still outstripping demand growth for the time being – even with collapse in liquids drilling activity and the resulting effect on gas volumes from liquids-rich resource plays. Growth in industrial gas demand has been frustratingly slow, and LNG exports will not be needle-moving until 2017 at the earliest. We project flattish prices through year-end 2015, with only modest recovery in 2016. See page 4 for details on our gas price assumptions. Stocks During most of 2Q15, similar to 1Q, broader U.S. markets were mostly range-bound, with low-volatility action in equities. At the end of June, however, volatility reared its head again, as troubling headlines from Greece and China caused a global sell-off in equities and commodities alike, with some spillover into July. Even so, the S&P 500 edged down merely 0.2% for the full quarter, essentially canceling out 1Q’s gain of 0.4%. Energy stocks were mixed – in the wake, of course, of having been the S&P 500’s worst-performing sector in 2014. The two broadest energy subsector indices, E&P and oil service, posted a 2Q loss of 6% and gain of 5%, respectively. See the chart on page 3 for details on the performance of various energy indices.
Transcript of Raymond James Quarterly Global Energy Report for … · Raymond James Quarterly Global Energy...

Global Research Published by Raymond James & Associates
Please read domestic and foreign disclosure/risk information beginning on page 37 and Analyst Certification on page 37.
© 2015 Raymond James & Associates, Inc., member New York Stock Exchange/SIPC. All rights reserved.
International Headquarters: The Raymond James Financial Center | 880 Carillon Parkway | St. Petersburg, Florida 33716 | 800-248-8863
Energy July 14, 2015
Industry Brief Pavel Molchanov, RJA, (713) 278-5270, [email protected]
J. Marshall Adkins, RJA, (713) 789-3551, [email protected]
Andrew Bradford, CFA, RJL, 403.509.0503, [email protected]
Bertrand Hodée, Research Analyst, RJEE, (33 1) 45 64 05 46, [email protected]
Santiago Wesenack, CFA, RJ LatAm, (54 11) 4850-2537, [email protected]
Energy: Quarterly News _________________________________________________________________________________________
Raymond James Quarterly Global Energy Report for 2Q15
This quarterly report aggregates energy research highlights from Raymond James & Associates and our affiliates: Raymond James Ltd. (Canada), Raymond James European Equities, and Raymond James Latin America.
Quarterly Highlights
Crude Oil
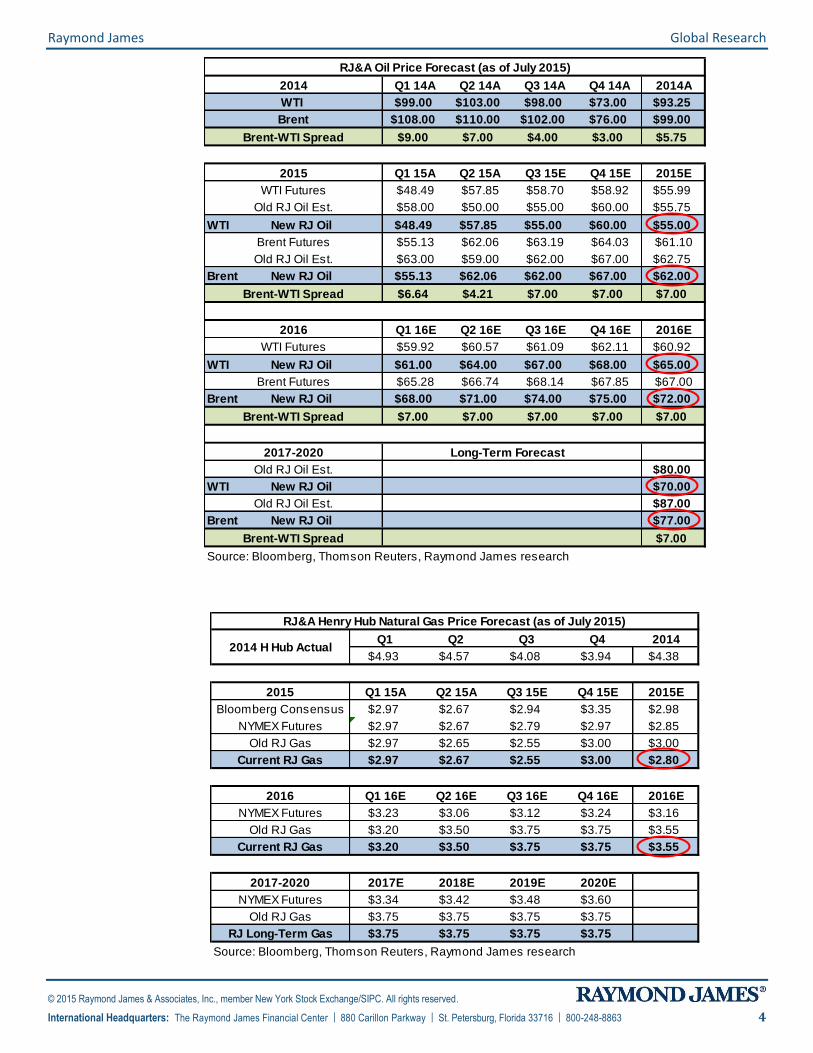
After 1Q15 marked the bottom of the oil price meltdown – with both WTI and Brent averaging their lowest levels since the first half of 2009 – 2Q15 was not as bleak, albeit hardly bullish. Until the very end of the quarter, when the Greek debt crisis and Chinese equity selloff suddenly escalated, oil price volatility was subdued, with prices mostly range-bound. The 2Q averages came in at $62/Bbl for Brent (up 13% sequentially) and $58/Bbl for WTI (up 19% sequentially). The Brent-WTI price spread, $4/Bbl, was slightly narrower than in 1Q. Following the recovery since January’s trough, we anticipate prices will remain broadly on par with recent levels through year-end 2015, followed by further gains in 2016. Barring a truly major economic crisis (to be clear, “Grexit” in and of itself would not count), we don’t envision oil prices falling back to the lows of 1Q. See page 4 for details on our oil price assumptions.
Natural Gas
With 1Q15 being considerably warmer than the year-ago winter, the quarterly Henry Hub average came in at $2.97/Mcf – down not just year-over-year but again sequentially as well. Not surprisingly, seasonality in 2Q15 exerted further pressure on gas prices, and the quarterly average of $2.67/Mcf was the lowest since 2Q12. Production growth is still outstripping demand growth for the time being – even with collapse in liquids drilling activity and the resulting effect on gas volumes from liquids-rich resource plays. Growth in industrial gas demand has been frustratingly slow, and LNG exports will not be needle-moving until 2017 at the earliest. We project flattish prices through year-end 2015, with only modest recovery in 2016. See page 4 for details on our gas price assumptions.
Stocks
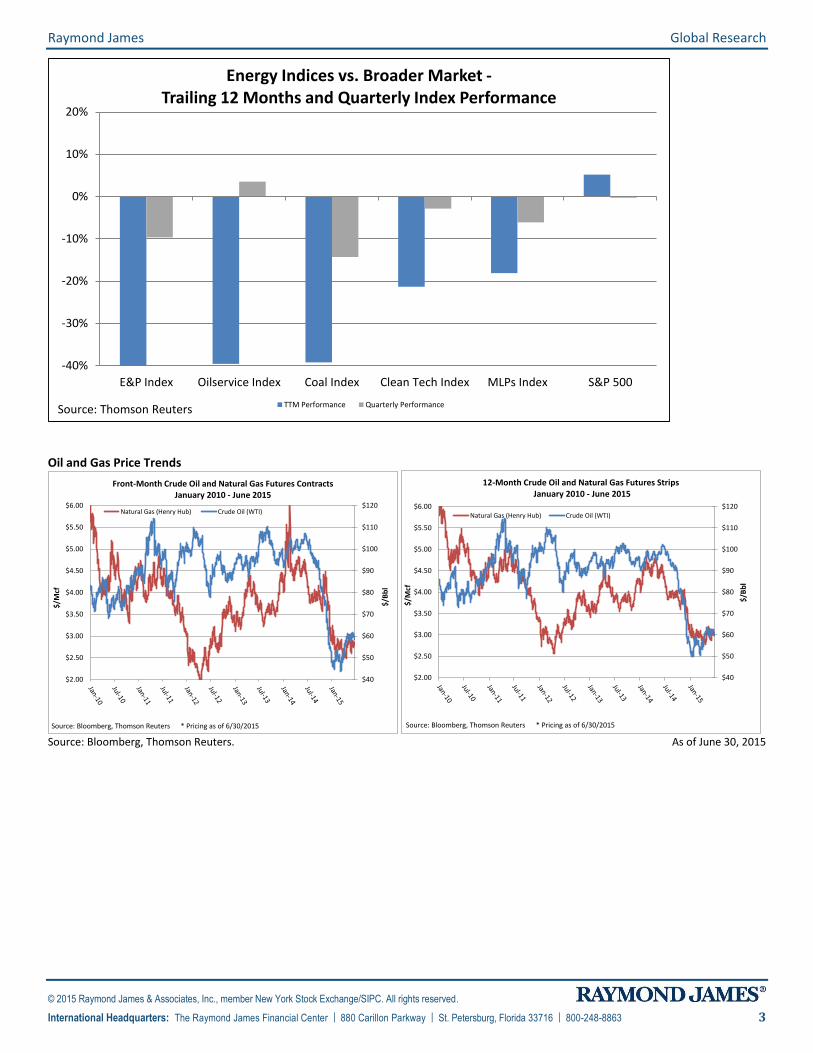
During most of 2Q15, similar to 1Q, broader U.S. markets were mostly range-bound, with low-volatility action in equities. At the end of June, however, volatility reared its head again, as troubling headlines from Greece and China caused a global sell-off in equities and commodities alike, with some spillover into July. Even so, the S&P 500 edged down merely 0.2% for the full quarter, essentially canceling out 1Q’s gain of 0.4%. Energy stocks were mixed – in the wake, of course, of having been the S&P 500’s worst-performing sector in 2014. The two broadest energy subsector indices, E&P and oil service, posted a 2Q loss of 6% and gain of 5%, respectively. See the chart on page 3 for details on the performance of various energy indices.

Raymond James Global Research
© 2015 Raymond James & Associates, Inc., member New York Stock Exchange/SIPC. All rights reserved.
International Headquarters: The Raymond James Financial Center | 880 Carillon Parkway | St. Petersburg, Florida 33716 | 800-248-8863 2
Contents
Stats of the Week .................................................................... 5
Global Research Highlights ...................................................... 6
Exploration and Production ..................................................... 7
Oilfield Services ..................................................................... 15
Integrated Oil and Gas / Independent Refiners .................... 18
Renewable Energy and Clean Technology ............................. 23
Canadian Oil and Gas............................................................. 31
European Oil and Gas ............................................................ 34
Argentinean Oil and Gas ........................................................ 36
Raymond James Global Research
© 2015 Raymond James & Associates, Inc., member New York Stock Exchange/SIPC. All rights reserved.
International Headquarters: The Raymond James Financial Center | 880 Carillon Parkway | St. Petersburg, Florida 33716 | 800-248-8863 3
-40%
-30%
-20%
-10%
0%
10%
20%
E&P Index Oilservice Index Coal Index Clean Tech Index MLPs Index S&P 500
Energy Indices vs. Broader Market -Trailing 12 Months and Quarterly Index Performance
TTM Performance Quarterly PerformanceSource: Thomson Reuters
Oil and Gas Price Trends
$40
$50
$60
$70
$80
$90
$100
$110
$120
$2.00
$2.50
$3.00
$3.50
$4.00
$4.50
$5.00
$5.50
$6.00
$/B
bl
$/M
cf
Front-Month Crude Oil and Natural Gas Futures ContractsJanuary 2010 - June 2015
Natural Gas (Henry Hub) Crude Oil (WTI)
Source: Bloomberg, Thomson Reuters * Pricing as of 6/30/2015
$40
$50
$60
$70
$80
$90
$100
$110
$120
$2.00
$2.50
$3.00
$3.50
$4.00
$4.50
$5.00
$5.50
$6.00
$/B
bl
$/M
cf
12-Month Crude Oil and Natural Gas Futures StripsJanuary 2010 - June 2015
Natural Gas (Henry Hub) Crude Oil (WTI)
Source: Bloomberg, Thomson Reuters * Pricing as of 6/30/2015
Source: Bloomberg, Thomson Reuters. As of June 30, 2015
Raymond James Global Research
© 2015 Raymond James & Associates, Inc., member New York Stock Exchange/SIPC. All rights reserved.
International Headquarters: The Raymond James Financial Center | 880 Carillon Parkway | St. Petersburg, Florida 33716 | 800-248-8863 4
Q1 14A Q2 14A Q3 14A Q4 14A 2014A
$99.00 $103.00 $98.00 $73.00 $93.25
$108.00 $110.00 $102.00 $76.00 $99.00
$9.00 $7.00 $4.00 $3.00 $5.75
Q1 15A Q2 15A Q3 15E Q4 15E 2015E
$48.49 $57.85 $58.70 $58.92 $55.99
$58.00 $50.00 $55.00 $60.00 $55.75
WTI New RJ Oil $48.49 $57.85 $55.00 $60.00 $55.00
$55.13 $62.06 $63.19 $64.03 $61.10
$63.00 $59.00 $62.00 $67.00 $62.75
Brent New RJ Oil $55.13 $62.06 $62.00 $67.00 $62.00
$6.64 $4.21 $7.00 $7.00 $7.00
Q1 16E Q2 16E Q3 16E Q4 16E 2016E
$59.92 $60.57 $61.09 $62.11 $60.92
WTI New RJ Oil $61.00 $64.00 $67.00 $68.00 $65.00
$65.28 $66.74 $68.14 $67.85 $67.00
Brent New RJ Oil $68.00 $71.00 $74.00 $75.00 $72.00
$7.00 $7.00 $7.00 $7.00 $7.00
Long-Term Forecast
$80.00
WTI New RJ Oil $70.00
$87.00
Brent New RJ Oil $77.00
$7.00
Source: Bloomberg, Thomson Reuters, Raymond James research
2017-2020
Brent-WTI Spread
Old RJ Oil Est.
Old RJ Oil Est.
Brent Futures
2016
WTI Futures
Brent-WTI Spread
WTI Futures
Old RJ Oil Est.
Old RJ Oil Est.
WTI
Brent
2015
RJ&A Oil Price Forecast (as of July 2015)
Brent-WTI Spread
2014
Brent Futures
Brent-WTI Spread
Q1 Q2 Q3 Q4 2014
$4.93 $4.57 $4.08 $3.94 $4.38
Q1 15A Q2 15A Q3 15E Q4 15E 2015E
$2.97 $2.67 $2.94 $3.35 $2.98
$2.97 $2.67 $2.79 $2.97 $2.85
$2.97 $2.65 $2.55 $3.00 $3.00
$2.97 $2.67 $2.55 $3.00 $2.80
Q1 16E Q2 16E Q3 16E Q4 16E 2016E
$3.23 $3.06 $3.12 $3.24 $3.16
$3.20 $3.50 $3.75 $3.75 $3.55
$3.20 $3.50 $3.75 $3.75 $3.55
2017E 2018E 2019E 2020E
$3.34 $3.42 $3.48 $3.60
$3.75 $3.75 $3.75 $3.75
$3.75 $3.75 $3.75 $3.75
Source: Bloomberg, Thomson Reuters, Raymond James research
2015
Current RJ Gas
Old RJ Gas
Old RJ Gas
2014 H Hub Actual
RJ&A Henry Hub Natural Gas Price Forecast (as of July 2015)
NYMEX Futures
Bloomberg Consensus
2016
2017-2020
RJ Long-Term Gas
Current RJ Gas
NYMEX Futures
Old RJ Gas
NYMEX Futures

Raymond James Global Research
© 2015 Raymond James & Associates, Inc., member New York Stock Exchange/SIPC. All rights reserved.
International Headquarters: The Raymond James Financial Center | 880 Carillon Parkway | St. Petersburg, Florida 33716 | 800-248-8863 5
Stats of the Week
In Case You Missed It… Here is a Recap of All the Energy Stats of the Week from 2Q15
April 6: Bakken Production Outlook; Estimating Timing of Roll-Over and Rebound
April 13: U.S. Rig Count - When Will It Bottom and Is There Anything to Get Excited About?
April 20: Oil's "Junk Rally" Can't Hide the Near-Term Risk; Lowering 2015, 2016, L-T Price Deck
April 27: Despite Shell/BG Record, Don't Bank on a Surge in Corporate Upstream M&A
May 4: Waiting for a Rebound in U.S. Gas Prices? Industrial Demand Will Keep You Waiting
May 11: OTC - Market Uncertainty Still Pulls Sizeable Crowd Despite Downturn
May 18: Despite Oil Meltdown, Frontier Exploration Is More Robust Than You Might Think
May 26: NAPTP MLP Conference Bolsters Confidence in Continued LT Infrastructure Development
June 1: Small-Cap Managers Do Your Homework, Benchmark Energy Weighting Set to Increase
June 8: Permian Conference Takeaways - This Basin Is Hot With 2H15 Activity Set to Climb
June 15: What Are "Missing Barrels" and What Do They Mean for Oil Prices?
June 22: Missing Barrels, Part Deux - Zeroing in on Chinese Demand and Floating Storage
June 29: When Will U.S. Crude Production Roll Over? It Already Has!

Raymond James Global Research
© 2015 Raymond James & Associates, Inc., member New York Stock Exchange/SIPC. All rights reserved.
International Headquarters: The Raymond James Financial Center | 880 Carillon Parkway | St. Petersburg, Florida 33716 | 800-248-8863 6
Global Research Highlights
In Case You Missed It… The List Below Highlights One Featured 2Q15 Report from Each RJ Energy Analyst
Marshall Adkins: Newpark: Upgrading to Strong Buy; Sell-Off on Revised Guidance Excessive
Andrew Bradford: Enerflex: Record Low Bookings Overshadow Largely In-Line 1Q15
Andrew Coleman: RRC: Upgrading to Outperform; Truing up 2Q15 on Commodity Prices
Chris Cox: Initiating Coverage on Canada's Midstream Players
John Freeman: Memorial Resource: Thoughts from the Road; Remains a Top Pick
Cory Garcia: Refining Monthly Crack Check, June 2015: Despite Margin Strength, Stocks Still Stuck in a Rut
Bertrand Hodee: Saipem: Strong deleveraging in sight, intrinsic recovery story, upgrade to Outperform
Darren Horowitz: NGL Update: Reconciling 1H15 Volatility in Attempt to Manage 2H15 Expectations
Pavel Molchanov: A Letter from Prison: Highlights from a Tour of the Alcatraz Microgrid with Princeton Power
Kurt Molnar: Boulder Energy: A Hefty Opportunity
Praveen Narra: Lack of Contracting Should Put Lid on Offshore Drilling Rally
Kevin Smith: Black Stone Minerals: Delivering 'Stone' Cold Dist. Growth; Initiating With an Outperform
Santiago Wesenack: YPF & Petronas to Invest Jointly in Shale Oil at La Amarga Chica

Raymond James Global Research
© 2015 Raymond James & Associates, Inc., member New York Stock Exchange/SIPC. All rights reserved.
International Headquarters: The Raymond James Financial Center | 880 Carillon Parkway | St. Petersburg, Florida 33716 | 800-248-8863 7
Exploration and Production
Stock Performance in 2Q15 and YTD
-80% -60% -40% -20% 0% 20% 40%
4-CRK3-GDP4-SFY4-SD2-PQ
3-CHK4-REN2-BCEI3-CNX
4-HK4-WTI4-BBG3-SGY4-DNR3-EXXI2-OAS
3-CWEI2-AR
3-SWN2-QEP
4-MUR3-UPL3-NFG3-NBL2-APA2-RRC3-COP2-TGA
2-MRO2-HES2-WLL2-PXD1-OXY2-DVN2-EOG2-APC
S&P Energy3-KOS
3-ROSE2-CLR3-CRC
2-WPX3-EGN3-XEC
3-COG3-NOG
2-IOCS&P 500
2-RSPP3-LPI3-SM
2-CXO2-FANG
YTD Stock Price Performance
-60% -40% -20% 0% 20% 40% 60% 80%
4-SD3-GDP3-EXXI
4-HK2-BCEI3-CRC3-CHK3-CNX3-UPL2-PXD
3-NOG2-PQ
3-SGY4-DNR
4-MUR3-NBL3-SM
2-QEP2-CLR2-APC4-CRK4-SFY3-LPI
3-XEC2-APA2-RRC2-EOG2-CXO2-DVN2-HES3-NFG
2-ARS&P Energy
2-FANG3-COP
3-SWN2-MRO3-NFX
S&P 5004-BBG3-EGN3-KOS1-OXY2-WLL4-WTI3-COG
2-PE2-MRD2-TGA2-OAS2-WPX2-RSPP3-CWEI
2-IOC3-ROSE
4-REN
2Q15 Stock Price Performance
RJ Ratings: 1 = Strong Buy, 2 = Outperform, 3 = Market Perform, 4 = Underperform, S = Suspended This analysis does not include transaction costs and tax considerations. If included, these costs would reduce an investor’s return. It should not be assumed that recommendations made in the future will be profitable or will equal the performance of the securities in this list. A complete record of our Exploration & Production stock recommendations for the trailing 12 months is available upon request.

Raymond James Global Research
© 2015 Raymond James & Associates, Inc., member New York Stock Exchange/SIPC. All rights reserved.
International Headquarters: The Raymond James Financial Center | 880 Carillon Parkway | St. Petersburg, Florida 33716 | 800-248-8863 8
Last Quarter’s E&P Results
In 2Q15, the EPX was down 7%, whereas oil was up 19% and S&P 500 ended up settling flat. The best performers during the quarter were Resolute Energy (REN), Rosetta Resources (ROSE), InterOil (IOC), and Clayton Williams (CWEI). The worst performers for the quarter were SandRidge (SD), Goodrich Petroleum (GDP), Energy XXI (EXXI), and Halcon (HK).
E&P Outlook and Investment Thesis
Following the oil price collapse of late 2014 to early 2015, the second quarter was witness to a strong rally in crude markets. West Texas Intermediate was up 19% on the quarter, settling around $60. While crude prices give us an understanding of where top-line levels will materialize, we believe rig count is a strong proxy for where well costs are headed in the E&P space. Watching the Baker Hughes rig count, we have seen a 55% decline in U.S. onshore rigs from the peak in October of last year. While not completely in lock-step, well costs have largely followed this decline throughout the major U.S. basins, particularly in the Permian and Bakken. Coupled with well cost reduction has been a tide of companies focused on high-grading and improving efficiency across basins. Higher IP-30’s and EURs throughout the majority of unconventional plays is largely a result of these efforts. As such, while U.S. E&P’s have cut spending nearly 40% y/y, production is expected to remain largely flat due to the dual effects of lower costs and higher well productivity.
The paradigm shift has helped differentiate acreage in terms of grading for most of the plays. We have seen the focus shift toward the Permian as companies re-structure their drilling activity toward the play because of its immense stacked pay potential and the prospective upside in the form of efficiency improvements. Accordingly, Permian-heavy names have witnessed stock outperformance relative to peers. We expect to see this play help drive a significant portion of the U.S. oil production growth in the coming years.
Oil prices have been falling for over three quarters now, and the futures curve has been forced from being backwardated to being in contango. On the hedging front, the E&P companies have not had enough time to engage in 2015 and 2016 hedges since the mid-2014 oil price collapse; however, some companies are still well hedged for 2015 (e.g., Bill Barrett-100%, Laredo-99%, Pioneer-92%, Antero-97%, and Memorial-89%). On a cumulative basis, ~22% of our E&P coverage universe’s 2015E oil production is hedged; however, large caps are not as well-hedged as SMid caps, and quite a few companies have no hedges at all. Therefore, for companies involved in hedges, on average, ~57% of their 2015E oil production is hedged. Similarly, on a cumulative basis, 23% of our coverage universe’s 2015E gas production is hedged. For companies involved in hedges, ~48% of their 2015E gas production is hedged.
During the second half of 2015, we expect oil prices to solidify around $60 and gas prices to approach $3 by year’s end. Therefore, commodity price pressure remains high in the second quarter, and the stocks should rebound once prices start firming up in the second half of the year. In our coverage universe, our only Strong Buy-rated E&P name is Occidental Petroleum (OXY). We currently have the following Outperform-rated E&P names: Anadarko Petroleum (APC), Antero (AR), Apache (APA), Cimarex (XEC), Concho Resources (CXO), Continental Resources (CLR), Devon Energy (DVN), EOG Resources (EOG), Hess Corp. (HES), Marathon Oil (MRO), Pioneer Natural Resources (PXD), QEP Resources (QEP), Range Resources (RRC), Whiting Petroleum (WLL), Bonanza Creek (BCEI), Diamondback Energy (FANG), InterOil Corp. (IOC), Memorial Resource Development (MRD), Oasis Petroleum (OAS), Parsley Energy (PE), PetroQuest Energy (PQ), RSP Permian (RSPP), TransGlobe Energy (TGA), and WPX Energy (WPX).

Raymond James Global Research
© 2015 Raymond James & Associates, Inc., member New York Stock Exchange/SIPC. All rights reserved.
International Headquarters: The Raymond James Financial Center | 880 Carillon Parkway | St. Petersburg, Florida 33716 | 800-248-8863 9
The large-cap stocks trading at the lowest 2015E EV/EBITDA multiples are Whiting (WLL), QEP Resources (QEP), Murphy (MUR), Apache Corp (APA). The small-cap stocks trading at the lowest 2015E EV/EBITDA multiples are TransGlobe Energy (TGA), SM Energy (SM), Northern Oil and Gas (NOG), and Bill Barrett (BBG).
Large Caps: EV/EBITDA Multiples vs. Reserve Life
0
4
8
12
16
20
24
28
32
36
40
44
48
0.0x
2.0x
4.0x
6.0x
8.0x
10.0x
12.0x
14.0x
16.0xW
LL
QEP
MU
R
APA
SW
N
APC
HES
MRO
RRC
NBL
CLR
DN
R
CXO
CO
P
OXY
CH
K
DVN
XEC
EO
G
PXD
CO
G
AR
Years
EV / 2015E EBITDA Reserve Life
Source: FactSet, Raymond James research. As of July 10, 2015.
Small and Mid-Caps: EV/EBITDA Multiples vs. Reserve Life
0
5
10
15
20
25
30
35
0.0x
5.0x
10.0x
15.0x
20.0x
25.0x
30.0x
35.0x
TG
A
SM
NO
G
BBG
SG
Y
NFX
OAS
BCEI
RO
SE
CRC
CRK
GD
P
SD
HK
WTI
PQ
UPL
LPI
EG
N
CW
EI
KO
S
EXXI
SFY
NFG
RSPP
REN
FAN
G
MRD PE
Years
EV / 2015E EBITDA Reserve Life
Source: FactSet, Raymond James research. As of July 10, 2015.

Raymond James Global Research
© 2015 Raymond James & Associates, Inc., member New York Stock Exchange/SIPC. All rights reserved.
International Headquarters: The Raymond James Financial Center | 880 Carillon Parkway | St. Petersburg, Florida 33716 | 800-248-8863 10
The large-cap stocks trading at the lowest proved reserve multiples are Chesapeake (CHK), QEP Resources (QEP), Denbury (DNR), and Range Resources (RRC). The small-cap stocks trading at the lowest proved reserve multiples are Swift (SFY), Resolute (REN), Energy XXI (EXXI), and Goodrich Petroleum (GDP).
Large Caps: Enterprise Value/Proved Reserves vs. Reserve Life
0
5
10
15
20
25
30
35
40
45
$0.00
$1.00
$2.00
$3.00
$4.00
$5.00
$6.00
$7.00
$8.00
CH
K
DN
R
QEP
RRC
AR
SW
N
APA
MRO
DVN
CO
P
MU
R
WLL
NBL
CLR
CO
G
HES
APC
OXY
XEC
EO
G
CXO
PXD
Years
Enterprise Value/Mcfe Reserve Life (Years)
Source: Company Reports , FactSet and RJ&A Estimates.Source: Company Reports , FactSet and RJ&A Estimates.Source: Company Reports , FactSet and RJ&A Estimates.
Source: FactSet, Raymond James research. As of July 10, 2015.
Small and Mid-Caps: Enterprise Value/Proved Reserves vs. Reserve Life
0
5
10
15
20
25
30
35
$0.00
$2.00
$4.00
$6.00
$8.00
$10.00
$12.00
SFY
EXXI
REN
GD
P
CRK
BBG
PQ
UPL
CRC
WTI
NO
G
SG
Y
HK
RO
SE
SD
OAS
SM
NFX
LPI
BCEI
CW
EI
TG
A
EG
N
NFG
MRD PE
RSPP
FAN
G
KO
S
Years
Enterprise Value/Mcfe Reserve Life (Years)
Source: Company Reports , FactSet and RJ&A Estimates.Source: Company Reports , FactSet and RJ&A Estimates.Source: Company Reports , FactSet and RJ&A Estimates.
Source: FactSet, Raymond James research. As of July 10, 2015.

Raymond James Global Research
© 2015 Raymond James & Associates, Inc., member New York Stock Exchange/SIPC. All rights reserved.
International Headquarters: The Raymond James Financial Center | 880 Carillon Parkway | St. Petersburg, Florida 33716 | 800-248-8863 11
The large-cap stocks trading at the lowest percentage of proved NAV/share are Murphy (MUR), Marathon (MRO), Hess (HES), and QEP (QEP). The small-cap stocks trading at the lowest percentage of proved NAV/share are InterOil (IOC), Northern Oil and Gas (NOG), Energy XXI (EXXI), and California Resources (CRC).
Large Caps: % of Proved NAV/Share
0%
100%
200%
300%
400%
500%
600%
700%M
UR
MRO
HES
QEP
APA
SW
N
RRC
CO
P
APC
CH
K
OXY
DVN
NBL
CO
G
EO
G
CLR
WLL
XEC
PXD
CXO
Source: FactSet, Raymond James research. As of July, 2015.
Small and Mid-Caps: % of Proved NAV/Share
0%
100%
200%
300%
400%
500%
600%
700%
IOC
NO
G
CRC
EXXI
TG
A
NFG
CW
EI
EG
N
FAN
G
BCEI
WTI
SM
KO
S
RSPP
MRD
RO
SE
PE
Source: FactSet, Raymond James research. As of July 10, 2015.

Raymond James Global Research
© 2015 Raymond James & Associates, Inc., member New York Stock Exchange/SIPC. All rights reserved.
International Headquarters: The Raymond James Financial Center | 880 Carillon Parkway | St. Petersburg, Florida 33716 | 800-248-8863 12
Production Growth per Debt-Adjusted Share
The following chart ranks our coverage universe on production growth per debt-adjusted share over the time period indicated. We suggest investors use this tool to screen for potentially top-performing stocks, in addition to other relevant factors, including: 1) absolute and relative valuations; 2) leverage to changes in commodity prices; and 3) company-specific financial and operational risk profiles.
According to our analysis, the companies with the highest projected production growth per debt-adjusted share over the 2014-2016 period are Memorial Resource Development (MRD), RSP Permian (RSPP), Antero (AR), and Diamondback (FANG).
Raymond James E&P Research Universe – Market Valuation Database
Raymond James E&P Comps Sheet - Large CapsPriced Enterprise EV / EBITDA Multiples (RJ) EV / EBITDA Multiples (Consensus) Y/Y Production Growth Debt Adjusted Production Commodity Mix Value per
Name Ticker Analyst Rating 7/10/2015 Value ($mm) 2014 2015 2016 2014 2015 2016 2014 2015 2016 Growth 2014 - 2016 Oil Gas NGLs Flowing BarrelLarge Caps
Anadarko Petroleum Corp. APC AC MO-2 $75.71 59,711 5.0x 12.0x 9.1x 5.2x 11.5x 9.3x 7% -1% 1% -10.2% 36% 49% 15% $64,390.54
Antero Resources AR JF MO-2 $30.19 12,097 10.3x 9.6x 7.4x 10.5x 10.1x 8.4x 93% 41% 28% 15.8% 2% 84% 15% $48,875.73
Apache Corporation APA JF MO-2 $52.94 29,220 3.6x 6.6x 5.6x 3.0x 6.6x 5.7x -15% -15% -12% -6.2% 50% 40% 10% $45,197.39
Cabot Oil & Gas COG AC MP-3 $29.30 13,190 9.4x 13.9x 10.0x 9.0x 13.7x 10.8x 29% 14% 14% 12.5% 6% 94% 0% $41,563.13
Chesapeake Energy CHK JF MP-3 $11.37 23,670 3.7x 11.2x 10.6x 4.7x 9.0x 10.1x 6% -9% -4% -26.0% 18% 71% 11% $34,489.65
Cimarex Energy XEC AC MP-3 $105.28 10,720 6.9x 14.3x 11.1x 6.6x 12.9x 9.5x 25% 8% -6% -4.7% 32% 47% 20% $67,941.19
Concho Resources CXO JF MO-2 $108.44 17,731 8.4x 11.5x 9.0x 8.8x 10.3x 9.6x 22% 20% 6% 5.6% 68% 32% 0% $134,136.13
ConocoPhill ips COP PM MP-3 $59.13 110,156 5.1x 8.6x 6.2x 5.4x 9.8x 6.9x 1% 2% 6% -2.1% 58% 42% 0% $68,441.28
Continental Resources CLR AC MO-2 $37.36 20,490 5.4x 9.6x 6.9x 5.7x 10.3x 7.8x 28% 22% 10% 4.4% 71% 29% 0% $105,913.94
Denbury Resources DNR AC MU-4 $5.30 5,222 3.9x 6.0x 7.6x 3.9x 5.3x 6.7x 6% 0% -1% -24.5% 95% 5% 0% $70,225.81
Devon Energy DVN AC MO-2 $55.85 48,282 4.7x 10.0x 9.6x 6.8x 9.4x 10.4x -3% -1% 0% 4.1% 40% 40% 20% $70,467.60
EOG Resources EOG AC MO-2 $84.54 51,728 5.5x 11.1x 8.9x 5.8x 11.4x 8.9x 17% -3% 8% 1.7% 51% 37% 13% $85,186.81
Hess Corp. HES PM MO-2 $64.34 26,557 3.8x 7.9x 5.7x 4.1x 8.2x 6.8x -2% 10% 4% 4.1% 73% 27% 0% $73,634.17
Marathon Oil MRO PM MO-2 $24.46 25,182 4.2x 7.7x 5.7x 4.5x 9.1x 7.1x -12% 0% 2% -4.9% 71% 29% 0% $54,861.66
Murphy Oil MUR PM MU-4 $40.06 10,572 2.7x 5.5x 4.8x 3.0x 7.0x 5.8x 10% -11% -1% -13.7% 68% 32% 0% $47,715.49
Noble Energy NBL JF MP-3 $39.06 21,353 5.8x 9.9x 6.6x 5.9x 8.2x 6.7x 0% 12% 10% -5.7% 33% 57% 10% $67,148.99
Occidental Petroleum OXY PM SB-1 $73.31 62,263 5.5x 10.5x 7.8x 4.7x 10.2x 7.6x -7% -7% 3% -2.9% 76% 24% 0% $96,582.28
Pioneer Natural Resources PXD JF MO-2 $134.46 22,451 9.0x 13.2x 10.7x 8.9x 13.1x 11.1x 9% 8% 15% 7.4% 51% 31% 18% $115,830.31
QEP Resources QEP AC MO-2 $16.18 4,830 3.1x 5.7x 4.6x 3.1x 5.4x 5.4x 4% -7% 7% -15.1% 36% 57% 8% $34,693.30
Range Resources RRC AC MO-2 $45.27 12,241 9.1x 12.5x 10.7x 9.7x 13.0x 12.1x 24% 19% 16% 8.1% 6% 67% 27% $55,321.68
*Southwestern SWN AC MP-3 $20.92 13,490 5.8x 7.3x 6.0x 5.9x 7.8x 6.7x 17% 24% 11% -4.8% 1% 94% 5% $31,282.58
Whiting Petroleum WLL JF MO-2 $30.11 11,753 5.5x 8.7x 5.5x 5.5x 8.3x 6.5x 22% 42% 5% -10.5% 81% 12% 7% $70,407.03
Median 20,922 5.4x 9.8x 7.4x 5.6x 9.6x 7.7x 8% 5% 5% -3.8% 50% 40% 7% $67,545.09
Mean 27,860 5.7x 9.6x 7.7x 5.9x 9.6x 8.2x 13% 8% 6% -3.1% 46% 45% 8% $67,468.49 Source: Thomson Reuters, Raymond James research.

Raymond James Global Research
© 2015 Raymond James & Associates, Inc., member New York Stock Exchange/SIPC. All rights reserved.
International Headquarters: The Raymond James Financial Center | 880 Carillon Parkway | St. Petersburg, Florida 33716 | 800-248-8863 13
Raymond James E&P Comps Sheet - SMID CapsPriced Enterprise EV / EBITDA Multiples (RJ) EV / EBITDA Multiples (Consensus) Y/Y Production Growth Debt Adjusted Production Commodity Mix Value per
Name Ticker Analyst Rating 7/10/2015 Value ($mm) 2014 2015 2016 2014 2015 2016 2014 2015 2016 Growth 2014 - 2016 Oil Gas NGLs Flowing Barrel0
Bill Barrett BBG JF MU-4 $7.39 1,046 5.9x 3.9x 4.3x 3.7x 4.3x 5.2x -37% -32% 13% -36.8% 71% 19% 10% $59,556.98
Bonanza Creek BCEI AC MO-2 $13.76 1,400 3.6x 5.1x 4.8x 3.6x 5.3x 5.1x 45% 23% 2% -19.7% 60% 24% 16% $50,881.36
California Resources CRC PM MP-3 $5.26 9,118 3.8x 9.1x 6.3x 3.7x 9.6x 7.1x 4% 0% -2% -8.4% 76% 24% 0% $54,816.71
Clayton Williams CWEI AC MP-3 $48.55 1,441 4.8x 13.5x 10.2x 4.8x 12.8x 9.9x 10% -6% -15% -27.4% 76% 15% 9% $83,797.75
Comstock Resources CRK JF MU-4 $2.01 1,306 3.1x 6.9x 6.6x 3.0x 7.5x 6.4x -8% 2% 4% -59.6% 43% 57% 0% $48,906.23
Diamondback Energy FANG JF MO-2 $70.89 3,438 8.5x 7.9x 6.8x 8.6x 7.8x 7.0x 166% 59% 13% 28.7% 77% 10% 13% $112,210.52
Energen Corporation EGN JF MP-3 $61.72 5,557 5.1x 8.1x 9.9x 6.2x 7.7x 8.0x 1% -14% 0% -16.7% 51% 35% 14% $79,274.84Energy XXI EXXI AC MP-3 $2.22 4,847 5.9x 10.0x 8.5x 6.7x 7.5x 10.9x 13% 14% -3% -58.7% 69% 31% 0% $80,830.65Goodrich Petroleum GDP JF MP-3 $1.57 750 6.4x 7.4x 8.9x 5.4x 6.8x 8.4x -10% -21% -20% -67.2% 56% 44% 0% $86,545.93Halcon Resources HK AC MU-4 $1.12 4,446 5.7x 6.6x 7.6x 5.8x 6.5x 8.0x 27% -3% -1% -44.1% 81% 10% 8% $96,507.98InterOil Corp. IOC PM MO-2 $50.60 1,915 N/A N/A N/A N/A N/A N/A 0% 0% 0% 0.0% N/A N/A N/A N/A
Kosmos Energy KOS PM MP-3 $7.87 3,352 5.3x 6.8x 5.4x 5.5x 10.5x 6.0x 11% 0% 21% -2.6% 100% 0% 0% $158,841.30
Laredo Petroleum LPI JF MP-3 $11.19 3,252 6.1x 6.0x 6.3x 6.2x 7.4x 8.2x 23% 14% -3% -8.6% 51% 26% 23% $68,470.76
Memorial Resource Development MRD JF MO-2 $17.62 4,076 13.3x 10.4x 6.7x 12.0x 10.2x 6.8x 84% 55% 59% 56.4% 7% 81% 12% $88,349.81
Northern Oil and Gas NOG JF MP-3 $5.82 1,133 3.7x 4.3x 5.0x 3.7x 4.2x 5.7x 29% -1% -3% -35.4% 87% 13% 0% $66,666.19
Newfield Exploration NFX AC MP-3 $35.47 7,771 5.2x 5.7x 5.5x 5.5x 6.5x 5.4x -1% 14% -7% 3.2% 48% 37% 15% $57,070.87
National Fuel Gas NFG KS MP-3 $55.19 7,207 7.6x 8.2x 7.3x 7.5x 8.7x 8.0x 33% 12% -2% -5.1% 10% 90% 0% $82,540.22
Oasis Petroleum OAS AC MO-2 $12.51 4,091 4.4x 5.4x 6.7x 4.4x 5.7x 7.1x 35% 6% -4% -29.1% 89% 11% 0% $81,588.76
Parsley Energy PE JF MO-2 $16.65 2,969 14.2x 16.4x 9.5x 14.2x 15.6x 10.1x 184% 45% 39% 21.9% 59% 23% 18% $156,922.23
PetroQuest Energy PQ AC MO-2 $1.72 686 4.8x 13.2x 11.9x 4.5x 10.8x 11.0x 14% -21% -13% -29.3% 9% 76% 15% $35,686.41
Resolute Energy REN JF MU-4 $0.74 838 6.2x 6.0x 6.9x 5.7x 7.0x 8.5x 4% -2% 3% -56.2% 72% 20% 8% $62,079.19
Rosetta Resources ROSE JF MP-3 $21.14 3,214 4.5x 7.4x 5.7x 3.9x 7.7x 8.2x 32% -9% -1% -21.1% 28% 38% 34% $48,880.43
RSP Permian RSPP JF MO-2 $26.65 2,475 11.5x 10.0x 8.2x 11.5x 9.6x 8.6x 63% 54% 29% 24.8% 48% 43% 9% $99,652.09
SandRidge Energy SD JF MU-4 $0.71 5,006 5.1x 8.0x 10.4x 5.4x 9.0x 10.9x -11% 3% -15% -60.3% 34% 50% 16% $57,075.01
SM Energy SM AC MP-3 $42.47 5,462 3.4x 4.5x 4.3x 3.3x 5.0x 4.9x 14% 17% -7% -6.5% 32% 45% 23% $31,069.68
Stone Energy SGY JF MP-3 $10.93 1,768 3.7x 5.1x 4.7x 3.8x 5.2x 6.0x -8% -4% -1% -37.6% 39% 45% 16% $38,203.62
Swift Energy SFY AC MU-4 $1.41 1,309 3.9x 11.3x 9.3x 3.7x 12.1x 9.6x 5% -7% -4% -61.4% 22% 64% 14% $38,437.66
TransGlobe Energy TGA PM MO-2 $3.62 156 0.8x 3.5x 2.2x 0.9x N/A N/A -12% -11% 3% 0.3% 100% 0% 0% $10,285.84
Ultra Petroleum UPL AC MP-3 $10.44 5,384 6.6x 8.4x 7.2x 6.6x 8.4x 8.0x 7% 15% 2% -15.6% 8% 92% 0% $41,287.68
W&T Offshore WTI JF MU-4 $4.67 1,804 3.1x 6.9x 4.6x 3.2x 8.7x 5.9x -2% -1% 0% -33.4% 43% 47% 10% $36,940.79
WPX Energy WPX AC MO-2 $11.22 4,323 3.8x 4.4x 5.4x 3.7x 4.7x 6.2x -9% -18% -7% -13.9% 20% 70% 10% $25,581.05
Median 3,214 5.1x 7.4x 6.8x 5.4x 7.7x 8.0x 11% 0% -1% -19.7% 51% 36% 9% $64,372.69
Mean 3,316 5.7x 7.9x 7.1x 5.7x 8.3x 7.8x 26% 8% 3% -19.6% 53% 38% 10% $69,779.30 Source: Thomson Reuters, Raymond James research.

Raymond James Global Research
© 2015 Raymond James & Associates, Inc., member New York Stock Exchange/SIPC. All rights reserved.
International Headquarters: The Raymond James Financial Center | 880 Carillon Parkway | St. Petersburg, Florida 33716 | 800-248-8863 14
Raymond James E&P Debt Comps - Large CapsPriced Market Net Debt Net Debt / TTM EBITDA Interest Net Debt / Boe Net Debt /
Name Ticker Analyst Rating 7/10/2015 Cap ($MM)) ($MM) Most Recent 2014 2015 2016 Coverage Proved Developed PV-10
Anadarko Petroleum Corp. APC AC MO $75.71 38,358 14,057 1.6x 0.7x 3.1x 2.6x 4.1x $4.92 $7.14 0.3x
Antero Resources AR JF MO $30.19 8,009 3,987 1.3x 3.5x 3.8x 3.5x 6.9x $1.89 $6.29 0.4x
Apache Corporation APA JF MO $52.94 19,958 9,446 0.4x 1.3x 0.7x 0.5x 61.1x $3.94 $5.72 0.2x
Cabot Oil & Gas COG AC MP $29.30 12,111 1,863 1.4x 1.2x 2.0x 1.5x 16.4x $1.51 $2.48 0.2x
Chesapeake Energy CHK JF MP $11.37 8,823 10,740 1.9x 1.6x 5.6x 5.6x 55.4x $4.01 $5.94 0.5x
Cimarex Energy XEC AC MP $105.28 9,030 1,379 1.0x 0.7x 2.0x 1.5x 31.9x $2.64 $3.44 0.2x
Concho Resources CXO JF MO $108.44 12,721 3,396 1.8x 1.7x 2.2x 2.0x 8.7x $5.33 $9.01 0.3x
ConocoPhill ips COP PM MP $59.13 73,648 19,847 1.1x 0.8x 1.8x 1.4x 26.6x $2.22 $3.47 0.1x
Continental Resources CLR AC MO $37.36 13,844 5,971 1.6x 1.6x 3.3x 2.5x 13.3x $4.42 $11.88 0.3x
Denbury Resources DNR AC MU $5.30 1,859 3,590 3.0x 2.6x 4.0x 5.0x 7.0x $8.20 $10.60 0.4x
Devon Energy DVN AC MO $55.85 23,066 9,891 1.0x 1.0x 1.4x 1.1x -18.6x $3.59 $4.79 0.4x
EOG Resources EOG AC MO $84.54 46,074 4,266 0.5x 0.4x 0.8x 0.8x 16.3x $0.85 $1.58 0.1x
Hess Corp. HES PM MO $64.34 18,240 4,474 0.8x 0.5x 1.6x 1.4x 18.0x $3.13 $5.87 0.1x
Marathon Oil MRO PM MO $24.46 16,511 5,268 1.2x 0.7x 1.6x 1.2x 19.3x $2.40 $3.58 0.2x
Murphy Oil MUR PM MU $40.06 7,140 1,633 0.5x 0.5x 1.1x 1.4x 29.1x $2.14 $3.42 0.1x
Noble Energy NBL JF MP $39.06 14,569 5,278 1.8x 1.4x 2.5x 2.2x -13.6x $4.14 $6.53 0.3x
Occidental Petroleum OXY PM SB $73.31 56,419 4,686 0.5x 0.3x 0.9x 0.8x 111.9x $1.66 $2.36 0.1x
Pioneer Natural Resources PXD JF MO $134.46 20,035 2,285 0.8x 0.7x 1.2x 1.3x 12.6x $2.86 $3.54 0.2x
QEP Resources QEP AC MO $16.18 2,851 1,718 1.2x 0.7x 2.2x 1.9x 8.5x $2.62 $4.69 0.2x
Range Resources RRC AC MO $45.27 7,518 3,261 1.0x 2.3x 3.3x 2.8x 7.2x $1.90 $5.25 0.3x
Southwestern SWN AC MP $20.92 7,857 4,646 2.1x 0.8x 2.3x 2.1x 22.8x $2.59 $4.68 0.5x
Whiting Petroleum WLL JF MO $30.11 6,242 5,130 1.2x 2.6x 3.9x 2.4x 9.7x $11.70 $22.43 0.6x
Median 13,282 4,560 1.2x 0.9x 2.1x 1.7x 14.8x $2.75 $5.02 0.3x
Mean 19,313 5,764 1.3x 1.2x 2.3x 2.1x 20.7x $3.58 $6.12 0.3x
Raymond James E&P Debt Comps - SMID CapsPriced Market Net Debt Net Debt / TTM EBITDA Interest Net Debt / Boe Net Debt /
Name Ticker Analyst Rating 7/10/2015 Cap ($MM)) ($MM) Most Recent 2014 2015 2016 Coverage Proved Developed PV-10
Bill Barrett BBG JF MU $7.39 356 769 2.5x 3.6x 3.7x 2.8x 4.4x $9.89 $20.06 0.3x
Bonanza Creek BCEI AC MO $13.76 613 737 1.9x 2.1x 2.9x 3.0x 3.1x $8.22 $15.92 0.5x
California Resources CRC PM MP $5.26 2,010 6,476 3.5x 2.7x 6.2x 4.2x 12.4x $8.44 $11.73 0.4x
Clayton Will iams CWEI AC MP $48.55 591 739 3.0x 2.3x 7.1x 5.6x 4.8x $9.80 $15.04 0.5x
Comstock Resources CRK JF MU $2.01 93 1,180 3.3x 2.5x 5.9x 6.1x 5.4x $11.41 $14.30 1.0x
Diamondback Energy FANG JF MO $70.89 4,156 579 1.3x 1.6x 1.1x 1.2x 11.2x $5.14 $8.72 0.2x
Energen Corporation EGN JF MP $61.72 4,495 1,237 1.2x 0.9x 2.0x 3.9x 24.2x $3.32 $4.68 0.2x
Energy XXI EXXI AC MP $2.22 210 3,994 5.2x 4.7x 8.3x 7.4x 2.9x $16.50 $25.38 0.8x
Goodrich Petroleum GDP JF MP $1.57 89 581 4.4x 4.9x 6.0x 7.8x 2.8x $12.75 $19.62 0.9x
Halcon Resources HK AC MU $1.12 604 3,703 4.7x 4.7x 5.8x 7.0x 5.4x $19.58 $33.15 0.8x
InterOil Corp. IOC PM MO $50.60 2,502 (221) 3.9x 12.2x 1.3x -7.2x -2.3x N/A N/A N/A
Kosmos Energy KOS PM MP $7.87 2,993 434 0.9x 0.4x 1.6x 1.6x 12.1x $5.76 $9.75 0.1x
Laredo Petroleum LPI JF MP $11.19 1,818 731 1.4x 3.3x 1.6x 1.5x 4.3x $2.96 $7.27 0.2x
Memorial Resource Development MRD JF MO $17.62 3,361 741 2.5x 2.5x 1.7x 1.0x 7.1x $2.72 $8.30 0.3x
Northern Oil and Gas NOG JF MP $5.82 352 790 2.6x 1.4x 2.9x 3.9x -7.0x $56.31 $133.56 0.5x
Newfield Exploration NFX AC MP $35.47 5,143 2,363 1.7x 1.9x 1.6x 1.4x 9.4x $3.66 $6.98 0.3x
National Fuel Gas NFG KS MP $55.19 4,698 1,605 0.8x 1.7x 2.3x 2.6x 10.7x $5.03 $5.20 0.5x
Oasis Petroleum OAS AC MO $12.51 1,248 2,654 2.8x 2.8x 3.1x 3.9x 5.9x $9.75 $18.14 0.5x
Parsley Energy PE JF MO $16.65 2,224 530 2.6x 3.0x 3.1x 2.2x 4.8x $5.83 $11.53 0.4x
PetroQuest Energy PQ AC MO $1.72 111 421 3.5x 2.9x 4.1x 3.8x 4.1x $6.36 $10.62 0.7x
Resolute Energy REN JF MU $0.74 55 766 2.0x 5.7x 5.0x 5.6x 4.3x $10.32 $18.47 0.8x
Rosetta Resources ROSE JF MP $21.14 1,355 1,831 2.8x 2.8x 4.1x 3.0x 7.9x $6.50 $13.23 0.6x
RSP Permian RSPP JF MO $26.65 2,084 397 0.7x 2.1x 2.4x 2.6x 13.0x $3.73 $9.47 0.3x
SandRidge Energy SD JF MU $0.71 392 4,470 5.1x 3.0x 5.8x 8.3x 3.5x $212.81 $336.92 0.8x
SM Energy SM AC MP $42.47 2,868 2,366 1.5x 1.5x 1.9x 1.9x 16.5x $4.32 $8.73 0.4x
Stone Energy SGY JF MP $10.93 614 883 0.6x 1.7x 3.1x 3.7x 13.3x $5.79 $10.72 0.5x
Swift Energy SFY AC MU $1.41 62 1,124 4.1x 3.2x 9.6x 8.5x 3.7x $5.80 $16.96 0.6x
TransGlobe Energy TGA PM MO $3.62 297 (61) -0.4x -0.4x -1.4x -0.8x 18.6x -$2.74 -$3.48 -0.1x
Ultra Petroleum UPL AC MP $10.44 1,626 3,345 4.5x 4.0x 5.2x 4.4x 5.2x $3.74 $8.12 0.5x
W&T Offshore WTI JF MU $4.67 354 1,256 2.4x 2.2x 4.8x 3.6x 6.5x $10.47 $17.32 0.5x
WPX Energy WPX AC MO $11.22 2,310 1,918 1.8x 2.0x 1.4x 1.6x 8.6x $2.64 $4.24 0.4x
Median 1,248 883 2.6x 2.5x 3.1x 3.7x 5.4x $6.09 $11.63 0.5x
Mean 1,621 1,574 2.6x 2.9x 3.8x 3.5x 7.4x $16.22 $28.44 0.5x Source: Thomson Reuters, Raymond James research.

Raymond James Global Research
© 2015 Raymond James & Associates, Inc., member New York Stock Exchange/SIPC. All rights reserved.
International Headquarters: The Raymond James Financial Center | 880 Carillon Parkway | St. Petersburg, Florida 33716 | 800-248-8863 15
Oilfield Services
Stock Performance in 2Q15 and TTM
-35% -25% -15% -5% 5% 15% 25%
MP3-PACD
MP3-ORIG
MP3-HLX
MO2-HCLP
SB1-NR
MO2-EXLP
SB1-CCLP
MO2-USAC
MO2-OIS
MP3-ATW
SB1-SPN
MP3-DO
MO2-NOV
MP3-UNT
SB1-BHI
SB1-HAL
MP3-KEG
DJIA
MP3-WFT
SB1-PTEN
MO2-TTI
MP3-SLB
OSX
MP3-ESV
MO2-NBR
MP3-NE
MP3-BAS
MU4-RIG
MP3-FTI
MO2-CAM
MU4-PES
MO2-RDC
MO2-CELP
RJ Oilservice Universe - 2Q15Stock Performance
Source: Thomson ReutersSource: Thomson ReutersSource: Thomson Reuters
-28%
-90% -80% -70% -60% -50% -40% -30% -20% -10% 0% 10%
MP3-KEG
MP3-BAS
MP3-ORIG
MU4-PES
MP3-PACD
MU4-RIG
MP3-UNT
MP3-ESV
MO2-HCLP
MO2-NBR
MP3-ATW
MP3-HLX
MP3-DO
MP3-NE
MP3-WFT
SB1-PTEN
MO2-NOV
MO2-TTI
SB1-SPN
MO2-OIS
SB1-HAL
OSX
MO2-RDC
MP3-FTI
SB1-CCLP
SB1-NR
MO2-CELP
MP3-SLB
MO2-CAM
MO2-USAC
MO2-EXLP
SB1-BHI
DJIA
RJ Oilservice Universe - 12 Month Trailing Stock Performance
Source: Thomson Reuters
-84%
This analysis does not include transaction costs and tax considerations. If included these costs would reduce an investor’s return. It should not be assumed that recommendations made in the future will be profitable or will equal the performance of the securities in this list. A complete record of our Oil Service stock recommendations for the trailing 12 months is available upon request.
On average, oil service stocks gained modestly in 2Q15 but have since backtracked with oil to around 52-week lows. For 2Q15, the OSX gained 5%, as oil prices grew towards a plateau of ~$60 throughout the quarter. As oil prices rose early in the quarter, oil service stocks recovered quickly; however, as oil prices hit a plateau of $60 and began to show signs of weakness, stocks dipped late in the quarter. Investors remained very selective throughout the last quarter, with some names seeing strong performances and others remaining weak. The top performer in the quarter in our coverage was CELP, up 28%. The manufacturing group held up pretty well, with CAM (+15%) and FTI (+12%) as two of the top five performers in our coverage. There were strong and weak performers across most oil service subgroups, but companies more exposed to commodity prices, such as PES, KEG, and some offshore drillers, received a boost in the quarter from the uplift in crude prices. Not surprisingly, many stocks that were the best performers in 2Q15 are some of the worst performers over the past 12 months. Valuations are less stretched since retracement; North American onshore recovery still looks like the best play. We believe a bottom has formed within North American land activity, but the upturn will be slow and largely dependent on commodity prices. There has been substantial pricing pressure and overcapacity in many business lines (drilling and pressure pumping come to mind) that will take quite some time to work though; however, robust cost reduction efforts should begin to take hold in 2Q and 3Q to relatively maintain margins, and we believe margins begin to improve in the back half of the year. While we believe most investors understand that a U.S. land recovery is a matter of time, many remain concerned that low oil prices may delay a recovery. Internationally, we expect a much less sharp but somewhat more prolonged downturn. In 1Q, we saw pricing take a larger toll than activity, but throughout the remainder of the year we expect reduced activity levels to slowly slide before a late 2016 recovery. Offshore activity, on the other hand, is unlikely to see even a moderate uptick in activity for several years without severe changes to the cost structure. While valuations aren’t quite as attractive on 2015/2016

Raymond James Global Research
© 2015 Raymond James & Associates, Inc., member New York Stock Exchange/SIPC. All rights reserved.
International Headquarters: The Raymond James Financial Center | 880 Carillon Parkway | St. Petersburg, Florida 33716 | 800-248-8863 16
numbers, investors must understand they are not only buying the land-oriented group for service recovery, but also for a commodity price recovery. Oil price movements are the single largest driver of service stock performances, and although we remain cautious in the short-term due to dollar-based movements and strong OPEC production, we are optimistic on the intermediate-/long-term outlook. Keeping these factors in mind, our key oil service themes are: 1) activity will be decidedly weak in 2015, with substantial rig count declines and price concessions across all oil service sectors; 2) cost reductions for service companies from wage/headcount reductions and supply chain optimization should counteract much of this pricing weakness; 3) we believe a recovery in U.S. onshore is inevitable and timing remains largely dependent on commodity prices; and 4) capital spending declines and an oversupplied offshore rig market are likely to put substantial downward pressure on the offshore space for several years.
What are the most attractive oil service stocks in our view?
In today’s market, we believe the top names to own are high quality, North American land-oriented names with good balance sheets. These names include: 1) Strong Buy-rated Baker Hughes/Halliburton, given leverage to the North American land recovery and positive long-term trends from the acquisition; 2) Strong Buy-rated Newpark Resources, given strong growth avenues and market share gain potential; 3) Strong Buy-rated Superior, given a strong balance sheet and its free cash flow generation; 4) Strong Buy-rated CSI Compressco Partners, given its distribution growth outlook, high yield, and stable contract compression services, and 5) other North American land-leveraged names with strong ties to commodity prices, including Strong Buy-rated Patterson-UTI.
7/10/2015 Total Thomson Estimates Thomson Estimates Enterprise Value/
7/10/2015 Fisc. Ent. Revs Cap./ -Fiscal EPS- P/E Ratio -Fiscal EBITDA- EBITDA Total Total Debt to EBITDA
Symbol Company Price Year Value LTM Revs 2014 2015E 2016E 2014 2015E 2016E 2014 2015E 2016E 2014 2015E 2016E Debt 2014 2015E 2016E
DIVERSIFIEDS
BHI BHI* BAKER HUGHES $59.71 Dec. 28,423 $23,414 1.2 3.86 (0.09) 1.11 15.4 NM 53.6 4,662 2,109 4,969.6 6.1 13.5 5.7 4,055 0.9x 1.9x 0.8x
HAL HAL* HALLIBURTON $41.33 Dec. 40,636 $32,572 1.2 3.94 1.37 1.83 10.5 30.2 22.6 7,168 4,316 10,618.9 5.7 9.4 3.8 7,841 1.1x 1.8x 0.7x
SLB SLB* SCHLUM BERGER $83.96 Dec. 112,527 $47,642 2.4 5.51 3.45 3.82 15.2 24.3 22.0 13,694 10,044 2,140.8 8.2 11.2 52.6 12,726 0.9x 1.3x 5.9x
WFT WFT* WEATHERFORD INTERNATIONAL $11.33 Dec. 16,084 $14,109 1.1 1.00 (0.17) 0.33 11.4 NM 34.8 3,005 1,673 0.0 5.4 9.6 NA 7,832 2.6x 4.7x N/A
GROUP M ean 1.5 13.1 27.2 33.2 6.3 10.9 20.7 1.4x 2.4x 2.5x
MANUFACTURERS
CAM CAM * CAM ERON INTERNATIONAL $50.86 Dec. 10,829 $10,396 1.0 4.09 3.13 2.89 12.4 16.2 17.6 1,629 1,359 40.0 6.6 8.0 271.0 2,844 1.7x 2.1x 71.2x
CRR CRR CARBO CERAM ICS $35.74 Dec. 811 $574 1.4 3.26 (2.07) (0.55) 11.0 NM NM 159 -20 444.7 5.1 NA 1.8 75 0.5x -3.8x 0.2x
DRC DRC* DRESSER RAND GROUP $85.18 Dec. 7,458 $2,630 2.8 2.42 2.47 2.63 35.2 34.5 32.4 461 446 227.3 16.2 16.7 32.8 1,019 2.2x 2.3x 4.5x
DRQ DRQ DRIL QUIP $70.43 Dec. 2,368 $953 2.5 5.02 4.80 3.88 14.0 14.7 18.2 300 278 224.1 7.9 8.5 10.6 0 0.0x 0.0x 0.0x
FET FET FORUM ENERGY TECHNOLOGIES $18.50 Dec. 2,050 $1,684 1.2 1.86 0.84 1.01 10.0 22.0 18.3 347 200 996.1 5.9 10.3 2.1 469 1.3x 2.3x 0.5x
FTI FTI* FM C TECHNOLOGIES $37.45 Dec. 9,008 $7,797 1.2 2.85 2.53 2.22 13.1 14.8 16.9 1,313 1,065 2,311.4 6.9 8.5 3.9 1,316 1.0x 1.2x 0.6x
NOV NOV* NATIONAL OILWELL VARCO $44.99 Dec. 18,945 $21,371 0.9 6.00 2.98 2.53 7.5 15.1 17.8 4,573 2,668 694.1 4.1 7.1 27.3 4,245 0.9x 1.6x 6.1x
OII OII OCEANEERING INTERNATIONAL $44.30 Dec. 4,820 $3,606 1.3 3.99 2.87 2.94 11.1 15.4 15.1 858 682 219.7 5.6 7.1 21.9 750 0.9x 1.1x 3.4x
OIS OIS* OIL STATES INTERNATIONAL $34.14 Dec. 1,896 $1,752 1.1 3.62 0.66 1.03 9.4 51.4 33.3 447 192 49.7 4.2 9.9 38.2 206 0.5x 1.1x 4.2x
TESO TESO TESCO $10.02 Dec. 314 $513 0.6 0.91 (0.18) 0.12 11.0 NM NM 99 35 25.0 3.2 8.9 NA 0 0.0x 0.0x 0.0x
TWIN TWIN TWIN DISC $17.88 Dec. 190 $272 0.7 0.43 1.08 0.92 41.6 16.6 19.4 21 27 0.0 NA 7.0 NA 12 0.6x 0.5x N/A
GROUP M ean 1.3 16.0 22.3 21.0 6.6 9.2 45.5 0.9x 0.8x 9.1x
ONSHORE DRILLERS
HP HP HELM ERICH & PAYNE $64.11 Dec. 6,755 $3,877 1.7 6.29 2.90 0.90 10.2 22.1 71.4 1,568 1,131 1,144.9 4.3 6.0 5.9 572 0.4x 0.5x 0.5x
NBR NBR* NABORS INDUSTRIES $13.36 Dec. 7,089 $6,641 1.1 1.16 (0.21) (0.12) 11.5 NM NM 1,774 1,154 102.3 4.0 6.1 69.3 3,825 2.2x 3.3x 37.4x
PES PES* PIONEER DRILLING $4.71 Dec. 697 $1,010 0.7 0.38 (0.80) (0.87) 12.4 NM NM 261 114 570.9 2.7 6.1 1.2 430 1.7x 3.8x 0.8x
PDS PDS PRECISION DRILLING $5.79 Dec. 3,256 $2,190 1.5 0.76 (0.28) (0.10) 7.7 NM NM 811 485 149.4 4.0 6.7 21.8 2,010 2.5x 4.1x 13.5x
PKD PKD PARKER DRILLING $3.03 Dec. 842 $944 0.9 0.29 (0.30) (0.14) 10.3 NM NM 256 141 532.7 3.3 6.0 1.6 585 2.3x 4.1x 1.1x
PTEN PTEN* PATTERSON UTI ENERGY $17.71 Dec. 3,387 $3,162 1.1 1.55 (0.85) (0.91) 11.4 NM NM 988 530 461.5 3.4 6.4 7.3 880 0.9x 1.7x 1.9x
UNT UNT* UNIT $24.61 Dec. 2,170 $1,440 1.5 4.31 (0.37) 0.28 5.7 NM 89.2 767 385 0.0 2.8 5.6 NA 957 1.2x 2.5x N/A
GROUP M ean 1.2 9.9 22.1 80.3 3.5 6.1 17.9 1.6x 2.9x 9.2x OFFSHORE DRILLERS
ATW ATW* ATWOOD OCEANICS $24.30 Dec. 3,079 $1,318 2.3 4.91 7.14 4.70 5.0 3.4 5.2 544 746 699.3 5.7 4.1 4.4 1,607 3.0x 2.2x 2.3x
DO DO* DIAM OND OFFSHORE DRILLING $24.32 Dec. 11,770 $2,725 4.3 3.14 1.98 0.44 7.8 12.3 55.3 1,093 926 1,618.0 10.8 12.7 7.3 2,245 2.1x 2.4x 1.4x
ESV ESV* ENSCO $20.39 Dec. 7,814 $2,980 2.6 6.00 3.95 2.69 3.4 5.2 7.6 2,376 1,916 60.2 3.3 4.1 129.7 4,138 1.7x 2.2x 68.7x
HERO HERO* HERCULES OFFSHORE $0.21 Dec. 1,026 $766 1.3 (0.15) (1.59) (1.26) NM NM NM 238 -14 1,319.9 4.3 NA 0.8 1,211 5.1x -84.5x 0.9x
NE NE* NOBLE $14.29 Dec. 8,588 $3,678 2.3 2.98 2.17 1.16 4.8 6.6 12.3 2,017 1,594 796.8 4.3 5.4 10.8 5,212 2.6x 3.3x 6.5x
ORIG ORIG* OCEAN RIG $4.71 Dec. 4,503 $12,579 0.4 2.29 1.45 0.96 2.1 3.3 4.9 933 890 437.5 4.8 5.1 10.3 4,377 4.7x 4.9x 10.0x
PACD PACD* PACIFIC DRILLING $2.61 Dec. 3,264 $919 3.6 0.84 0.54 (0.36) 3.1 4.9 NM 557 545 896.7 5.9 6.0 3.6 2,835 5.1x 5.2x 3.2x
RDC RDC* ROWAN COM PANIES $19.41 Dec. 5,172 $1,994 2.6 2.14 2.76 2.34 9.1 7.0 8.3 694 914 1,545.0 7.5 5.7 3.3 2,807 4.0x 3.1x 1.8x
RIG RIG* TRANSOCEAN $14.62 Dec. 12,650 $8,878 1.4 4.79 2.33 (0.34) 3.1 6.3 NM 3,696 2,731 2,390.7 3.4 4.6 5.3 10,020 2.7x 3.7x 4.2x
SDRL SDRL SEADRILL $9.38 Dec. 15,968 $5,020 3.2 2.68 2.33 1.99 3.5 4.0 4.7 2,685 2,512 279.9 5.9 6.4 57.0 12,558 4.7x 5.0x 44.9x
VTG VTG VANTAGE DRILLING $0.16 Dec. 2,620 $861 3.0 0.14 0.10 (0.28) NM NM NM 422 397 0.0 6.2 6.6 NA 2,650 6.3x 6.7x N/A
GROUP M ean 2.5 4.6 5.9 14.0 5.6 6.1 23.3 3.8x -4.2x 14.4x
OFFSHORE CONSTRUCTION
GIFI GIFI* GULF ISLAND FABRICATION $11.24 Dec. 113 $471 0.2 1.36 0.15 0.10 8.3 NM NM 57 29 280.4 2.0 3.9 0.4 0 0.0x 0.0x 0.0x
HLX HLX* HELIX ENERGY SOLUTIONS GROUP $12.36 Dec. 1,440 $1,043 1.4 1.95 0.67 0.87 6.3 18.4 14.2 396 218 241.9 3.6 6.6 6.0 546 1.4x 2.5x 2.3x
M DR M DR M CDERM OTT INTERNATIONAL $5.07 Dec. 1,269 $2,248 0.6 (0.48) (0.14) 0.08 NM NM NM 53 176 0.0 23.8 7.2 NA 861 16.1x 4.9x N/A
GROUP M ean 0.7 7.3 18.4 14.2 9.8 5.9 2.2 5.8x 2.5x 0.8x
OFFSHORE SUPPLY/TRANSPORT
BRS BRS BRISTOW GROUP $50.58 Dec. 2,597 $1,771 1.5 4.34 4.13 4.12 11.6 12.3 12.3 316 334 165.3 8.2 7.8 15.7 939 3.0x 2.8x 5.7x
HELI HELI* CHC GROUP $0.63 Dec. 1,713 $1,708 1.0 (1.44) (1.53) (2.19) NM NM NM 240 207 248.0 7.1 8.3 6.9 1,219 5.1x 5.9x 4.9x
CKH CKH SEACOR HOLDINGS $68.42 Dec. 1,624 $1,270 1.3 1.60 2.02 3.45 42.8 34.0 19.8 236 199 74.3 6.9 8.2 21.9 880 3.7x 4.4x 11.8x
GLF GLF GULFM ARK OFFSHORE $10.30 Dec. 765 $465 1.6 2.37 (1.40) (1.20) 4.3 NM NM 171 54 211.2 4.5 14.2 3.6 561 3.3x 10.4x 2.7x
HOS HOS HORNBECK OFFSHORE SERVICES $19.24 Dec. 1,483 $633 2.3 2.47 0.95 0.66 7.8 20.2 29.0 292 215 619.7 5.1 6.9 2.4 1,076 3.7x 5.0x 1.7x
KEX KEX KIRBY $77.26 Dec. 5,118 $2,565 2.0 4.91 4.23 4.67 15.7 18.3 16.6 640 581 N/A 8.0 8.8 NA 819 1.3x 1.4x N/A
PHII PHII PETROLEUM HELICOPTERS $30.60 Dec. 435 $843 0.5 N/A N/A N/A NA NA NA N/A N/A 247.9 NA NA 1.8 540 N/A N/A 2.2x
TDW TDW TIDEWATER $22.35 Dec. 2,462 $1,539 1.6 3.55 3.32 0.64 6.3 6.7 34.9 413 421 0.0 6.0 5.9 NA 1,491 3.6x 3.5x N/A
GROUP M ean 1.5 14.8 18.3 22.5 6.5 8.6 8.7 3.4x 4.8x 4.8x Source: Thomson Reuters, Raymond James research.
Raymond James Global Research
© 2015 Raymond James & Associates, Inc., member New York Stock Exchange/SIPC. All rights reserved.
International Headquarters: The Raymond James Financial Center | 880 Carillon Parkway | St. Petersburg, Florida 33716 | 800-248-8863 17
Source: Thomson One
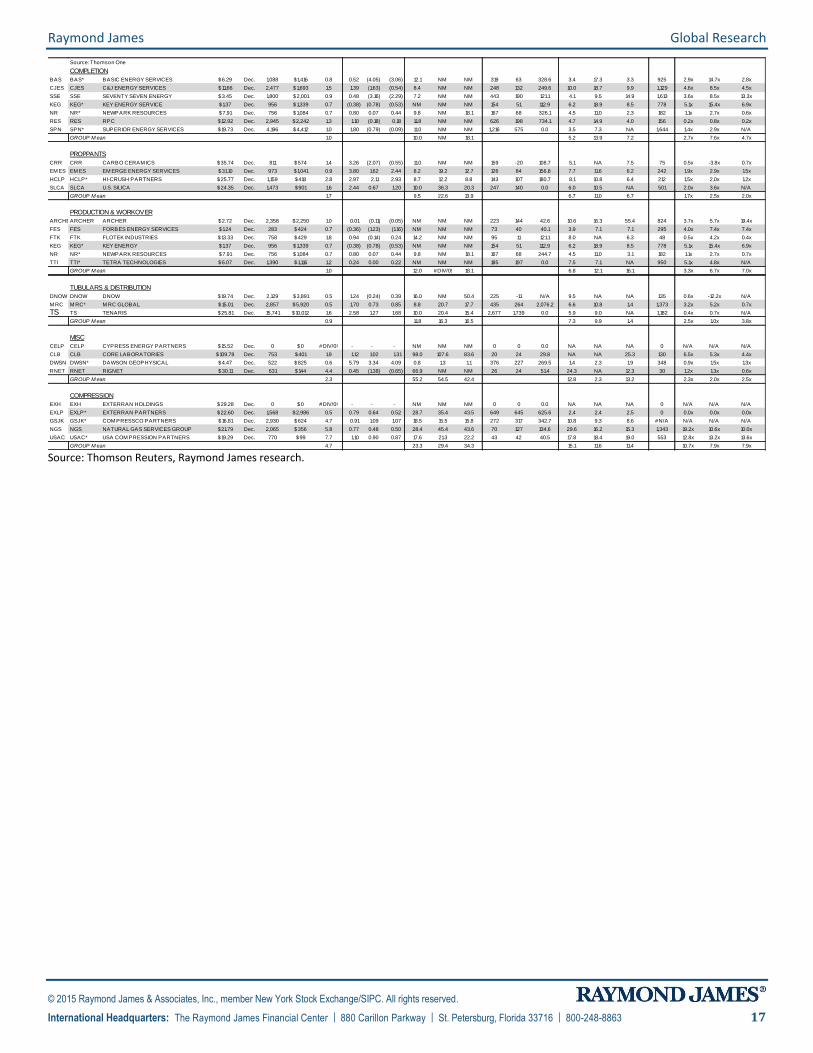
COMPLETION
BAS BAS* BASIC ENERGY SERVICES $6.29 Dec. 1,088 $1,416 0.8 0.52 (4.05) (3.06) 12.1 NM NM 319 63 328.6 3.4 17.3 3.3 925 2.9x 14.7x 2.8x
CJES CJES C&J ENERGY SERVICES $11.66 Dec. 2,477 $1,693 1.5 1.39 (1.63) (0.54) 8.4 NM NM 248 132 249.6 10.0 18.7 9.9 1,129 4.6x 8.5x 4.5x
SSE SSE SEVENTY SEVEN ENERGY $3.45 Dec. 1,800 $2,001 0.9 0.48 (3.16) (2.29) 7.2 NM NM 443 190 121.1 4.1 9.5 14.9 1,613 3.6x 8.5x 13.3x
KEG KEG* KEY ENERGY SERVICE $1.37 Dec. 956 $1,339 0.7 (0.38) (0.78) (0.53) NM NM NM 154 51 112.9 6.2 18.9 8.5 778 5.1x 15.4x 6.9x
NR NR* NEWPARK RESOURCES $7.91 Dec. 756 $1,084 0.7 0.80 0.07 0.44 9.8 NM 18.1 167 68 326.1 4.5 11.0 2.3 182 1.1x 2.7x 0.6x
RES RES RPC $12.92 Dec. 2,945 $2,242 1.3 1.10 (0.18) 0.18 11.8 NM NM 626 198 734.1 4.7 14.9 4.0 156 0.2x 0.8x 0.2x
SPN SPN* SUPERIOR ENERGY SERVICES $19.73 Dec. 4,196 $4,412 1.0 1.80 (0.79) (0.09) 11.0 NM NM 1,216 575 0.0 3.5 7.3 NA 1,644 1.4x 2.9x N/A
GROUP M ean 1.0 10.0 NM 18.1 5.2 13.9 7.2 2.7x 7.6x 4.7x
PROPPANTS
CRR CRR CARBO CERAM ICS $35.74 Dec. 811 $574 1.4 3.26 (2.07) (0.55) 11.0 NM NM 159 -20 108.7 5.1 NA 7.5 75 0.5x -3.8x 0.7x
EM ES EM ES EM ERGE ENERGY SERVICES $31.10 Dec. 973 $1,041 0.9 3.80 1.62 2.44 8.2 19.2 12.7 126 84 156.8 7.7 11.6 6.2 242 1.9x 2.9x 1.5x
HCLP HCLP* HI-CRUSH PARTNERS $25.77 Dec. 1,159 $418 2.8 2.97 2.11 2.93 8.7 12.2 8.8 143 107 180.7 8.1 10.8 6.4 212 1.5x 2.0x 1.2x
SLCA SLCA U.S. SILICA $24.35 Dec. 1,473 $901 1.6 2.44 0.67 1.20 10.0 36.3 20.3 247 140 0.0 6.0 10.5 NA 501 2.0x 3.6x N/A
GROUP M ean 1.7 9.5 22.6 13.9 6.7 11.0 6.7 1.7x 2.5x 2.0x
PRODUCTION & WORKOVER
ARCHERARCHER ARCHER $2.72 Dec. 2,358 $2,250 1.0 0.01 (0.11) (0.05) NM NM NM 223 144 42.6 10.6 16.3 55.4 824 3.7x 5.7x 19.4x
FES FES FORBES ENERGY SERVICES $1.24 Dec. 283 $424 0.7 (0.36) (1.23) (1.16) NM NM NM 73 40 40.1 3.9 7.1 7.1 295 4.0x 7.4x 7.4x
FTK FTK FLOTEK INDUSTRIES $13.33 Dec. 758 $429 1.8 0.94 (0.14) 0.24 14.2 NM NM 95 11 121.1 8.0 NA 6.3 48 0.5x 4.2x 0.4x
KEG KEG* KEY ENERGY $1.37 Dec. 956 $1,339 0.7 (0.38) (0.78) (0.53) NM NM NM 154 51 112.9 6.2 18.9 8.5 778 5.1x 15.4x 6.9x
NR NR* NEWPARK RESOURCES $7.91 Dec. 756 $1,084 0.7 0.80 0.07 0.44 9.8 NM 18.1 167 68 244.7 4.5 11.0 3.1 182 1.1x 2.7x 0.7x
TTI TTI* TETRA TECHNOLOGIES $6.07 Dec. 1,390 $1,116 1.2 0.24 0.00 0.22 NM NM NM 185 197 0.0 7.5 7.1 NA 950 5.1x 4.8x N/A
GROUP M ean 1.0 12.0 #DIV/0! 18.1 6.8 12.1 16.1 3.3x 6.7x 7.0x TUBULARS & DISTRIBUTION
DNOW DNOW DNOW $19.74 Dec. 2,129 $3,891 0.5 1.24 (0.24) 0.39 16.0 NM 50.4 225 -11 N/A 9.5 NA NA 135 0.6x -12.2x N/A
M RC M RC* M RC GLOBAL $15.01 Dec. 2,857 $5,920 0.5 1.70 0.73 0.85 8.8 20.7 17.7 435 264 2,076.2 6.6 10.8 1.4 1,373 3.2x 5.2x 0.7x
TS TS TENARIS $25.81 Dec. 15,741 $10,012 1.6 2.58 1.27 1.68 10.0 20.4 15.4 2,677 1,739 0.0 5.9 9.0 NA 1,182 0.4x 0.7x N/A
GROUP M ean 0.9 11.8 16.3 16.5 7.3 9.9 1.4 2.5x 1.0x 3.8x
MISC
CELP CELP CYPRESS ENERGY PARTNERS $15.52 Dec. 0 $0 #DIV/0! - - - NM NM NM 0 0 0.0 NA NA NA 0 N/A N/A N/A
CLB CLB CORE LABORATORIES $109.78 Dec. 753 $401 1.9 1.12 1.02 1.31 98.0 107.6 83.6 20 24 29.8 NA NA 25.3 130 6.5x 5.3x 4.4x
DWSN DWSN* DAWSON GEOPHYSICAL $4.47 Dec. 522 $825 0.6 5.79 3.34 4.09 0.8 1.3 1.1 376 227 269.5 1.4 2.3 1.9 348 0.9x 1.5x 1.3x
RNET RNET RIGNET $30.11 Dec. 631 $144 4.4 0.45 (1.38) (0.65) 66.9 NM NM 26 24 51.4 24.3 NA 12.3 30 1.2x 1.3x 0.6x
GROUP M ean 2.3 55.2 54.5 42.4 12.8 2.3 13.2 2.3x 2.0x 2.5x
COMPRESSION
EXH EXH EXTERRAN HOLDINGS $29.28 Dec. 0 $0 #DIV/0! - - - NM NM NM 0 0 0.0 NA NA NA 0 N/A N/A N/A
EXLP EXLP* EXTERRAN PARTNERS $22.60 Dec. 1,568 $2,986 0.5 0.79 0.64 0.52 28.7 35.4 43.5 649 645 625.6 2.4 2.4 2.5 0 0.0x 0.0x 0.0x
GSJK GSJK* COM PRESSCO PARTNERS $16.81 Dec. 2,930 $624 4.7 0.91 1.09 1.07 18.5 15.5 15.8 272 317 342.7 10.8 9.3 8.6 #N/A N/A N/A N/A
NGS NGS NATURAL GAS SERVICES GROUP $21.79 Dec. 2,065 $356 5.8 0.77 0.48 0.50 28.4 45.4 43.6 70 127 134.6 29.6 16.2 15.3 1,343 19.2x 10.6x 10.0x
USAC USAC* USA COM PRESSION PARTNERS $19.29 Dec. 770 $99 7.7 1.10 0.90 0.87 17.6 21.3 22.2 43 42 40.5 17.8 18.4 19.0 553 12.8x 13.2x 13.6x
GROUP M ean 4.7 23.3 29.4 34.3 15.1 11.6 11.4 10.7x 7.9x 7.9x Source: Thomson Reuters, Raymond James research.

Raymond James Global Research
© 2015 Raymond James & Associates, Inc., member New York Stock Exchange/SIPC. All rights reserved.
International Headquarters: The Raymond James Financial Center | 880 Carillon Parkway | St. Petersburg, Florida 33716 | 800-248-8863 18
Integrated Oil and Gas / Independent Refiners
Stock Performance in 2Q15 and TTM
RJ Integrated Oil & Gas and Refiners Universe
Quarterly Stock Price Performance TTM Stock Price Performance
-20% 0% 20% 40% 60%
MP3 - PBF
MP3 - EC
MP3 - WNR
MO2 - CVX
MP3 - TSO
MP3 - DK
MP3 - XOM
MO2 - VLO
S&P 500
MP3 - BP
MO2 - MPC
MO2 - PSX
MP3 - HFC
MP3 - PBR
RJ Integrateds and Refiners Universe -Quarterly Stock Price Performance
Source: Thomson Reuters
-80% -60% -40% -20% 0% 20% 40% 60%
MP3 - EC
MP3 - PBR
MO2 - CVX
MP3 - BP
MP3 - XOM
MP3 - HFC
MO2 - PSX
S&P 500
MP3 - PBF
MP3 - WNR
MO2 - VLO
MP3 - DK
MO2 - MPC
MP3 - TSO
RJ Integrateds and Refiners Universe -TTM Stock Price Performance
Source: Thomson Reuters
This analysis does not include transaction costs and tax considerations. If included these costs would reduce an investor’s return. It should not be assumed that recommendations made in the future will be profitable or will equal the performance of the securities in this list. A complete record of our stock recommendations for the trailing 12 months is available upon request.
Outlook on the Refining Industry
The U.S. refining industry has been one of the primary beneficiaries of growing domestic crude supply. As such, we are structurally constructive on the space, given the competitive advantage afforded by the discounted U.S. crude landscape, which should serve to moderate some of the industry’s cyclicality – some, not all. In the coming months, we fully expect that the WTI-Brent spread will continue to experience volatility as oil inventories continue to balloon and the dramatic fall in oil prices affects regional production characteristics. We envision WTI trading at a continued discount to seaborne international crudes, albeit to a more modest degree.
Meanwhile, global cracks priced off seaborne crudes remain relatively strong, particularly on the gasoline front. Indeed, the gasoline market has defied the typical seasonality and cracks continue to surprise to the upside, particularly against fears that the worldwide crude oil glut would soon turn into a refined product glut. A stronger-than-expected demand response (at least relative to consensus), especially in the U.S., has kept gasoline inventories from ballooning despite high refinery runs; however, lower crude oil differentials and weaker diesel cracks have reined in some – not all – of the strength in gasoline. Furthermore, the global refining arena still faces fundamental headwinds on an intermediate-term basis: structural overcapacity in weaker markets (i.e., Europe) and a wave of new refinery projects (mainly in Asia-Pacific and the Mid-East). A greater degree of refinery shutdowns, above and beyond the recent examples of rationalization and project delays (especially in Latin America), is a must to stave off the creep towards overcapacity.
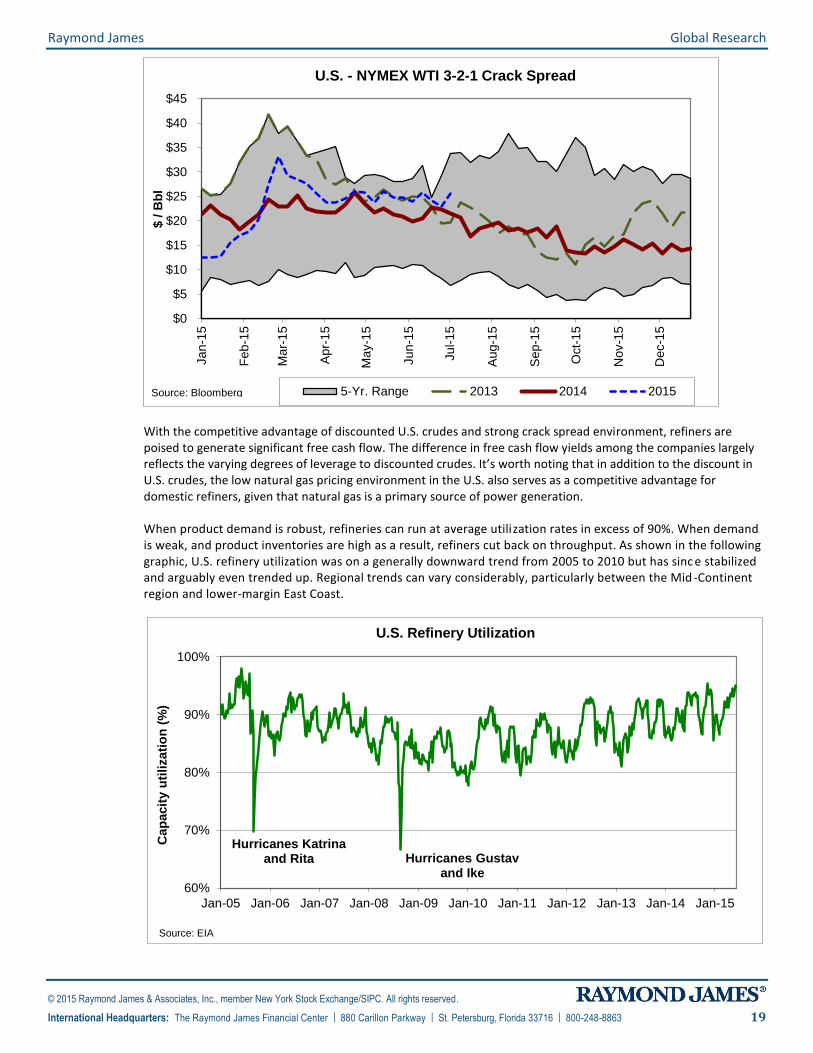
As shown in the following chart, the U.S. benchmark crack spread has tracked above historical averages for much of the past two-plus years, largely driven by the disconnect in crude pricing between WTI and Brent; however, crack spreads have recently been nicely above year-ago levels for much of 2015 (after rebounding from the January lows). We continue to expect the Brent-WTI spread to be volatile in 3Q15, particularly as the global crude oil market remains in oversupply and inventories continue to need to find a market – in other words, expect the roller coaster ride to continue.
Raymond James Global Research
© 2015 Raymond James & Associates, Inc., member New York Stock Exchange/SIPC. All rights reserved.
International Headquarters: The Raymond James Financial Center | 880 Carillon Parkway | St. Petersburg, Florida 33716 | 800-248-8863 19
$0
$5
$10
$15
$20
$25
$30
$35
$40
$45
Ja
n-1
5
Feb
-15
Ma
r-15
Apr-
15
Ma
y-1
5
Ju
n-1
5
Jul-
15
Aug-1
5
Sep-1
5
Oct-
15
Nov-1
5
Dec-1
5
$ / B
bl
U.S. - NYMEX WTI 3-2-1 Crack Spread
5-Yr. Range 2013 2014 2015Source: Bloomberg
With the competitive advantage of discounted U.S. crudes and strong crack spread environment, refiners are poised to generate significant free cash flow. The difference in free cash flow yields among the companies largely reflects the varying degrees of leverage to discounted crudes. It’s worth noting that in addition to the discount in U.S. crudes, the low natural gas pricing environment in the U.S. also serves as a competitive advantage for domestic refiners, given that natural gas is a primary source of power generation. When product demand is robust, refineries can run at average utilization rates in excess of 90%. When demand is weak, and product inventories are high as a result, refiners cut back on throughput. As shown in the following graphic, U.S. refinery utilization was on a generally downward trend from 2005 to 2010 but has sinc e stabilized and arguably even trended up. Regional trends can vary considerably, particularly between the Mid -Continent region and lower-margin East Coast.
60%
70%
80%
90%
100%
Jan-05 Jan-06 Jan-07 Jan-08 Jan-09 Jan-10 Jan-11 Jan-12 Jan-13 Jan-14 Jan-15
Ca
pa
cit
y u
tili
za
tio
n (
%)
U.S. Refinery Utilization
Source: EIA
Hurricanes Katrina and Rita Hurricanes Gustav
and Ike

Raymond James Global Research
© 2015 Raymond James & Associates, Inc., member New York Stock Exchange/SIPC. All rights reserved.
International Headquarters: The Raymond James Financial Center | 880 Carillon Parkway | St. Petersburg, Florida 33716 | 800-248-8863 20
Our benchmark crack spread assumptions are shown in the following table. We would caution that these crack spreads (left table) are based off Brent and do not represent the actual margin capture expected for any given refinery.
Q1 '02-'12 Q2 '02-'12 Q3 '02-'12 Q4 '02-'12 FY '02-'12
$7.50 $13.50 $11.00 $7.00 $9.75
Q1 13A Q2 13A Q3 13A Q4 13A 2013A
$14.33 $16.01 $14.72 $8.15 $13.30
Q1 14A Q2 14A Q3 14A Q4 14A 2014A
$12.80 $12.59 $14.27 $14.84 $13.63
Gasoline $7.45 $11.87 $13.16 $11.33 $10.95
Diesel $23.51 $14.04 $16.49 $21.86 $18.98
Q1 15A Q2 15A Q3 15E Q4 15E 2015E
Current RJ est. $14.92 $18.03 $14.50 $9.00 $14.11
Gasoline $10.68 $18.32 $13.75 $5.50 $12.06
Diesel $23.41 $17.44 $16.00 $16.00 $18.21
Q1 16E Q2 16E Q3 16E Q4 16E 2016E
Current RJ est. $10.00 $13.50 $12.00 $9.50 $11.25
Gasoline $6.50 $11.75 $9.75 $6.00 $8.50
Diesel $17.00 $17.00 $16.50 $16.50 $16.75
Source: Bloomberg, Thomson Reuters, Raymond James research
Note: Actuals are calculated by averaging w eekly closing prices
U.S. East Coast Seaborne-based 3-2-1 Crack Spread Estimates
U.S. - NYMEX WTI Europe - Spot Brent
3-2-1 Crack Spread 2-1-1 Crack Spread
($/Bbl) ($/Bbl)
2008 $10.20 $14.10
2009 $8.62 $8.48
2010 $9.96 $9.27
2011 $25.09 $9.48
2012 $29.54 $12.61
2013 $23.69 $10.82
2014 $19.21 $11.03
2015E $20.11 $15.14
Source: Bloomberg, Raymond James research
Note: Actuals are calculated by averaging w eekly closing margins
Actual and Forecasted Refining Margins
Outlook on Independent Refiners
The earnings uplift generated by the WTI discount has been a massive tailwind for the independent refining group, with the benefit extending beyond those refiners in the Mid-Continent. While we expect continued volatility in the WTI-Brent spread (currently ~$5-6/Bbl), we expect the spread to gradually widen throughout the year, with the growth in higher value cash flow streams (i.e., midstream and retail) and the associated sum of the parts valuation providing a solid backstop. Thus, we remain structurally bullish on most of the stocks. While a hazy outlook for continued global oil demand and rising refining capacity in emerging markets could present longer-term headwinds, we believe the competitive advantage afforded by the discount in onshore crudes outweighs these potential challenges.
While it is tough to wrap a precise band around the forward P/E multiples of independent refiners, given the sharp volatility of crack spreads (and hence earnings), we believe a range of about 6-10x reflects average historical valuations, as shown in the chart that follows. Currently, refiners are trading at median 2015 and 2016 EPS multiples of roughly 11.7x and 12.4x (based on consensus estimates).

Raymond James Global Research
© 2015 Raymond James & Associates, Inc., member New York Stock Exchange/SIPC. All rights reserved.
International Headquarters: The Raymond James Financial Center | 880 Carillon Parkway | St. Petersburg, Florida 33716 | 800-248-8863 21
0
4
8
12
16
20
24
Jan-00 Jan-02 Jan-04 Jan-06 Jan-08 Jan-10 Jan-12 Jan-14
P/E
mu
ltip
le
Independent Refiners: Consensus Forward-Year P/E Multiples
Valuation Range MedianSource: FactSet, Thomson Reuters Priced as of 7/10/2015
The following valuation table provides more detail on individual company multiples as well as our ratings.
Raymond James - Independent Refiners Research Universe
Market Valuation Database
Consensus Valuation Ratios
Price 3-Month Equity Ent.
Company Ticker Rating 07/10/15 Volume Value Value Capacity EDC 2015 2016 2015 2016 2015 2016 2015 2016
Alon USA Energy ALJ NC $18.77 902,930 1,320 1,713 6,851 1,124 5.1x 5.1x 21.5x 25.0x
CVR Energy CVI NC $39.65 287,842 3,443 3,078 26,763 3,253 4.6x 5.0x 14.7x 20.9x
Delek US Holdings DK MP3 $37.84 981,481 2,213 2,356 5,319 936 5.6x 4.4x 12.8x 10.8x 5.5x 4.7x 13.7x 12.3x
HollyFrontier Corp. HFC MP3 $45.26 2,527,709 8,831 8,365 18,883 3,324 4.9x 5.2x 10.7x 11.3x 5.0x 5.6x 11.1x 12.4x
Marathon Petroleum MPC MO2 $54.49 4,518,255 29,969 33,229 20,213 1,699 4.8x 5.5x 8.8x 10.9x 5.0x 5.8x 9.4x 10.9x
PBF Energy PBF MP3 $31.10 1,543,473 2,851 3,191 5,910 523 3.7x 2.9x 9.0x 6.9x 3.7x 3.6x 8.7x 7.8x
Phillips 66 PSX MO2 $81.49 3,078,495 45,010 47,644 21,656 1,900 6.3x 5.7x 11.5x 10.2x 7.0x 6.7x 12.6x 11.5x
Tesoro Corp. TSO MP3 $98.40 2,213,559 12,487 15,674 23,588 2,470 5.6x 5.4x 13.1x 12.7x 5.9x 6.1x 12.3x 13.2x
Valero Energy VLO MO2 $65.85 5,870,018 33,979 33,049 12,815 1,068 4.3x 4.5x 9.1x 9.8x 4.3x 4.8x 9.2x 10.5x
Western Refining WNR MP3 $46.54 1,369,759 4,453 5,060 33,510 6,571 4.3x 4.5x 10.2x 10.9x 4.9x 5.6x 10.6x 12.6x
Median $6,642 $6,713 19,548 1,799 4.8x 4.8x 10.4x 10.8x 5.0x 5.3x 11.7x 12.4x
Mean $14,456 $15,336 17,551 2,287 4.9x 4.8x 10.6x 10.4x 5.1x 5.3x 12.4x 13.7x
SB1 = Strong Buy; M O2 = Outperform; M P3 = M arket Perform; M U4 = Underperform; NC = Not Covered EDC = Equivalent Distillation Capacity
Source: Thomson Reuters, Oil & Gas Journal, Raymond James research Long-term debt on a GAAP basis includes non-recourse debt associated with respective M LPs
Price /
Bbl of Daily EBITDA EPS EBITDA EPS
Market Valuation Raymond James Valuation Ratios
($ MM) Enterprise Value / Price / Ent. Value /
Outlook on Integrated Oil and Gas
Integrated oil and gas companies are certainly not immune from oil price weakness, and many tend to trade in tandem with larger-cap E&Ps, though their downstream operations tend to provide a natural hedge. Furthermore, these companies – Petrobras being a notable exception – typically generate significant free cash flow (at least in less-challenged oil price environments) that supports above-average dividend yields and share buyback. These factors support relative outperformance vs. more aggressive energy stocks amid volatile markets, especially on a total return basis. On the flip side, these companies face structural challenges, including 1) constrained access to resources, especially amid resource nationalism and greater competition from state-controlled oil and gas companies, and 2) pressures on downstream divisions from a secular decline in oil demand in developed economies. Our ratings reflect mainly thematic differences between individual companies, including business segment weightings (upstream vs. downstream), commodity mix (oil/ overseas gas vs. North American gas), cash flow allocation (capital spending vs. dividends/share buyback), and balance sheet quality. We also take high-impact exploration and other potential catalysts into account.

Raymond James Global Research
© 2015 Raymond James & Associates, Inc., member New York Stock Exchange/SIPC. All rights reserved.
International Headquarters: The Raymond James Financial Center | 880 Carillon Parkway | St. Petersburg, Florida 33716 | 800-248-8863 22
While recognizing a significant amount of variance among the integrated companies, we can peg a historical average P/E multiple range of 8-12x. Currently, the group is trading at median EPS multiples of roughly 15.7x for 2015 and 13.4x for 2016 (based on consensus estimates).
0
4
8
12
16
20
24
28
32
Jan-00 Jan-02 Jan-04 Jan-06 Jan-08 Jan-10 Jan-12 Jan-14
P/E
mu
ltip
le
Integrated Oil and Gas: Consensus Forward-Year P/E Multiples
Valuation Range Median
Source: FactSet, Thomson Reuters Priced as of 7/10/2015
The following valuation table provides more detail on individual company multiples as well as our ratings.
Raymond James - Integrated Oil and Gas Research Universe
Market Valuation Database
Equity
Price 3-Month Value Price /
Company Ticker Rating 07/10/15 Volume ($ MM) 2015 2016 2015 2016 Proved NAV 2015 2016 2015 2016
BP plc ** BP MP3 $39.90 5,184,038 121,553 5.3x 4.5x 15.9x 13.6x
Cenovus Energy * CVE MO2 $14.36 2,057,391 11,896 8.7x 7.3x NM 268.8x
Chevron Corp. CVX MO2 $94.41 6,869,005 177,160 6.4x 5.4x 24.4x 17.4x 168.8% 6.3x 5.0x 23.3x 15.1x
China Petroleum & Chemical SNP NC $80.07 166,262 70,293 4.5x 3.8x 14.1x 10.8x
CNOOC Ltd. CEO NC $131.29 172,105 58,618 4.1x 3.7x 12.3x 8.3x
Ecopetrol S.A. EC MP3 $12.17 781,592 25,019 6.4x 5.0x 36.2x 13.8x 224.5% 6.0x 4.4x 12.3x 7.4x
Eni SpA * E MO2 $35.23 535,899 64,016 3.6x 3.0x 21.3x 14.2x
Exxon Mobil Corp. XOM MP3 $82.22 10,628,877 346,228 8.2x 6.8x 21.7x 17.6x 240.9% 7.7x 6.6x 18.7x 15.4x
Imperial Oil * IMO MP3 $36.71 285,617 31,115 12.5x 12.8x 23.2x 16.4x
Petrobras Argentina * PZE MP3 $6.64 108,796 1,341 - - - -
PetroChina Co. PTR NC $104.54 164,529 191,330 5.7x 5.0x 18.5x 13.4x
Petróleo Brasileiro PBR MP3 $8.38 35,260,190 54,656 6.0x 5.9x 14.0x 14.4x 90.8% 6.1x 5.5x 9.8x 7.5x
Royal Dutch Shell plc * RDS'A MO2 $56.84 2,533,390 174,184 - - - -
Statoil ASA STO NC $17.23 2,227,078 54,940 3.0x 2.7x 15.4x 11.8x
Suncor Energy * SU MO2 $26.80 3,706,093 38,752 7.4x 6.3x 43.1x 19.8x
Total S.A. * TOT MO2 $49.74 1,174,916 119,164 5.0x 4.5x 13.4x 13.0x
YPF S.A. * YPF MO2 $25.71 1,056,405 10,111 3.3x 2.8x 11.1x 8.1x
Median $58,618 6.4x 5.6x 23.1x 15.9x 196.7% 5.7x 4.5x 15.7x 13.4x
Mean $91,199 6.8x 5.7x 24.1x 15.8x 181.3% 5.9x 5.2x 18.0x 29.6x
SB1 = Strong Buy; M O2 = Outperform; M P3 = M arket Perform; M U4 = Underperform; NC = Not Covered ** BP is co-covered with RJ Euro Equities.
Source: Thomson Reuters, Raymond James research * CVE, IM O and SU are covered by RJ Ltd. PZE and YPF are covered by RJ Latin America.
*E, RDS.A and TOT are covered by RJ Euro Equities.
Raymond James Valuation Ratios Consensus Valuation Ratios
EV / EBITDA Price / EPS EV / EBITDA Price / EPS

Raymond James Global Research
© 2015 Raymond James & Associates, Inc., member New York Stock Exchange/SIPC. All rights reserved.
International Headquarters: The Raymond James Financial Center | 880 Carillon Parkway | St. Petersburg, Florida 33716 | 800-248-8863 23
Renewable Energy and Clean Technology
Stock Performance in 2Q15 and TTM
-40% -20% 0% 20% 40%
MP3 - ENPH
MP3 - FSLR
MP3 - AMRS
SB1 - ENOC
MO2 - CAFD
MO2 - EVA
MO2 - SPWR
MP3 - TSL
ECO Index
MO2 - GTLS
MO2 - SCTY
MU4 - CLNE
SB1 - AEIS
MO2 - SZYM
MP3 - WPRT
MO2 - SSNI
RJ Clean Tech Universe -Quarterly Stock Price Performance
Source: Thomson Reuters
-100% -50% 0% 50%
MP3 - WPRT
MO2 - SZYM
MO2 - GTLS
MU4 - CLNE
SB1 - ENOC
MP3 - AMRS
MP3 - FSLR
MO2 - SPWR
MO2 - SCTY
ECO Index
MO2 - CAFD
MP3 - ENPH
MO2 - EVA
MP3 - TSL
MO2 - SSNI
SB1 - AEIS
RJ Clean Tech Universe -TTM Stock Price Performance
Source: Thomson Reuters
This analysis does not include transaction costs and tax considerations. If included these costs would reduce an investor’s return. It should not be assumed that recommendations made in the future will be profitable or will equal the performance of the securities in this list. A complete record of our stock recommendations for the trailing 12 months is available upon request.
Outlook on Solar Power
The global photovoltaic (PV) industry is exhibiting secular growth in electricity market penetration, albeit with volatile margins across the value chain. While Europe has historically comprised the bulk of global PV demand, the European market has markedly slowed down, and growth is increasingly coming from China, Japan, the U.S., and other geographies. Capacity rationalization in China and elsewhere has reduced overcapacity, though import tariffs (e.g., the U.S.-China solar trade war) and other trade barriers can further complicate supply/demand dynamics.
Policy support for PV demand is evolving. The European Union and over 25 U.S. states have renewable portfolio standards, and some jurisdictions have “carve-out” mandates for PV. Tax credits or rebates, such as the federal Investment Tax Credit (ITC), provide more direct financial support. The most effective policy structure is the feed-in tariff, which is most common in Europe but has materialized elsewhere, including China and Japan. Widespread feed-in tariff reductions in Europe have forced developers and manufacturers to adapt to the lower economics.
0
20,000
40,000
60,000
2008 2009 2010 2011 2012 2013 2014 2015E 2016E
Me
ga
wa
tts
Global PV Demand
Rest of WorldChinaJapanU.S.Other EuropeItalySpainGermany
Source: SolarPower Europe, Raymond James research
0
20,000
40,000
60,000
2008 2009 2010 2011 2012 2013 2014E 2015E 2016E
Meg
aw
att
s
Global PV Supply
Rest of World
China
U.S.
Germany
Japan
Source: Earth Policy Institute, Raymond James research

Raymond James Global Research
© 2015 Raymond James & Associates, Inc., member New York Stock Exchange/SIPC. All rights reserved.
International Headquarters: The Raymond James Financial Center | 880 Carillon Parkway | St. Petersburg, Florida 33716 | 800-248-8863 24
Average levelized power prices of PV, in general, remain higher than that of conventional power (in the U.S., mainly coal and natural gas). As PV becomes a more mainstream component of the U.S. electricity market, installed system costs will need to drop from $1.75-3.50 per watt to $1.25-2.75 per watt. Cheaper polysilicon drove much of the cost reductions from 2008 to 2012, but future reductions will need to come mainly from a combination of 1) increasing conversion efficiency; 2) decreasing processing costs; and, most importantly, 3) decreasing balance of system costs. The latter includes installation, customer acquisition and financing costs (e.g., via securitization and “yieldcos”). Ahead of the continental U.S., grid parity has materialized in markets with high power prices (such as Japan and Hawaii). Cheaper and more widely available grid storage solutions are also important for PV adoption, since rising levels of PV (and wind) penetration can periodically destabilize the grid.
($/watt) c-Si CdTe c-Si CdTe
Module cost $0.48 $0.48 $0.45 $0.46
Benchmark ASP $0.56 $0.49 $0.53 $0.47
U.S. commercial systems
BoS cost $1.76 $1.83 $1.68 $1.74
All-in system cost $2.32 $2.32 $2.21 $2.21
U.S. residential systems
BoS cost $2.98 NM $2.84 NM
All-in system cost $3.54 NM $3.37 NM
20162015
Source: PVinsights, Raymond James research.
Of course, the flip side of the cost reduction curve is an ongoing decline in average selling prices (ASPs) of modules – down from ~$3.75/watt in 2008 to under $1.00 in 2012 and ~$0.55/watt currently (benchmark Chinese pricing). While inherently beneficial for PV project economics, ASP declines have pressured profitability of commodity module manufacturers in the industry. Margins tend to be higher among inverter manufacturers, though these are also affected by the industrywide trend of commoditization.
Relative to PV, concentrating solar power (CSP), which has applications for power generation and enhanced oil recovery, carries both advantages and disadvantages. Advantages include the ability to customize power output based on time-of-day pricing, as well as integrated thermal storage options. Disadvantages include a more limited addressable market, since CSP systems require very high sunlight patterns (e.g., U.S. Southwest, the Persian Gulf, and Australia).
Outlook on Wind Power
Though mainstream adoption of wind has a longer history than PV, making it a more mature industry, wind’s penetration within the overall power market remains relatively low, with the exception of a few European countries. We view the key growth drivers as the following: 1) incremental improvement in wind turbine technology, which reduces costs and facilitates more scalable systems; 2) the fact that wind power economics are already at grid parity in many markets; and 3) government support in the form of direct subsidies and other incentives, such as the U.S. Production Tax Credit (PTC). Limits on growth include: 1) constrained project financing, especially for very large projects; 2) grid interconnection bottlenecks; and 3) “not in my backyard” concerns in some areas. While offshore wind remains a small component of the overall wind market, in part due to higher costs, its growth is well above average, led by the North Sea region.

Raymond James Global Research
© 2015 Raymond James & Associates, Inc., member New York Stock Exchange/SIPC. All rights reserved.
International Headquarters: The Raymond James Financial Center | 880 Carillon Parkway | St. Petersburg, Florida 33716 | 800-248-8863 25
Global Wind Power Installations
0
20,000
40,000
60,000
2008 2009 2010 2011 2012 2013 2014 2015E 2016E
Meg
aw
att
s
Global Wind Power Installations
Offshore
Onshore
Source: WWEA, GWEC, EWEA, Raymond James research
Source: WWEA, GWEC, EWEA, and Raymond James research.
The all-in cost of wind installations has decreased over 60% since the emergence of the industry in the mid-1980s, reaching ~$2.00 per watt (for onshore wind farms). These cost reductions have been driven primarily by more efficient engineering and system designs, along with steadily greater scalability. Wind in the past has been cost-competitive with conventional generation in most regions of the U.S. (with the notable exception of the Southeast), though current natural gas pricing presents challenges. Internationally, major wind markets include China (the world’s #1 wind market), India and the North Sea region.
Outlook on Biopower
Traditional baseload generation is based on fossil fuels – coal and natural gas – along with nuclear power. Hydropower is closer to baseload than wind and solar, but it is not fully predictable either. Thus, utilities seeking to 1) maintain a high amount of baseload generation while at the same time 2) reducing environmental impact do not have many options, and biopower is perhaps the most obvious one. Biopower enables sizable reductions in all major categories of emissions. Furthermore, in the context of avoiding the shutdown of coal-fired power plants – and thus preventing associated job losses – biopower, and especially utility-grade wood pellets, can be a solution. In contrast to the older, more primitive forms of biopower, wood pellets are a relatively modern product. They are used as a substitute for coal in both converted and co-fired power generation and combined heat and power (CHP) plants. The U.K. is the world’s largest pellet market. Three other northern European countries – Denmark, Sweden, and Belgium – are also major markets. The only major market that’s not in Europe is South Korea.
Comparing the economics of utility-grade wood pellets versus coal is always a site-specific matter. Pellets by themselves are certainly more expensive than coal by itself. But from the standpoint of utilities, what matters is the cost structure on an all-in basis: that is to say, inclusive of all the added costs (sulfur credits, carbon credits, etc.) associated with burning coal. On this basis (or, put another way, looking at the levelized cost of electricity), the comparison is much more favorable to pellets. While there is variability, all-in pellet economics are comparable (within 20%) to all-in coal economics in the European market. In the U.S., pellets screen less attractively due to the lack of carbon pricing (outside California).

Raymond James Global Research
© 2015 Raymond James & Associates, Inc., member New York Stock Exchange/SIPC. All rights reserved.
International Headquarters: The Raymond James Financial Center | 880 Carillon Parkway | St. Petersburg, Florida 33716 | 800-248-8863 26
2012 2013 2014 2015E 2016E 2020E CAGR, 2014-2020
Belgium 1,500 1,300 550 1,300 1,300 2,000 24.0%
Denmark 1,000 1,300 1,500 2,000 2,500 3,500 15.2%
Sweden 1,000 1,500 1,700 2,000 2,300 2,300 5.2%
U.K. 1,300 3,450 4,600 5,100 6,900 13,000 18.9%
Other Europe 1,700 1,625 910 1,500 2,300 5,050 33.1%
U.S. and Canada 0 0 40 110 110 4,110 116.4%
Korea 100 485 1,900 2,000 2,100 3,000 7.9%
Other Asia 60 205 250 600 1,100 3,150 52.5%
TOTAL DEMAND 6,660 9,865 11,450 14,610 18,610 36,110 21.1%
U.S. 4,988 8,000
Canada 1,972 3,000
European Union 2,668 3,300
All Other 1,972 2,600
TOTAL SUPPLY 11,600 16,900
Source: Haw kins Wright, Raymond James research
on projects under construction)
Global Supply and Demand for Utility-Grade Wood Pellets (thousands of metric tons)
(2016 supply projections based
Outlook on Natural Gas Fuels
The fundamental differences between the global oil market and North American natural gas market have sustained a wide ratio between oil and gas prices, with our forecasted price ratio at 22:1 for 2015 (Brent crude vs. Henry Hub gas). While the ratio will gradually narrow – reflecting the scale-up of gas demand from the industrial and power generation sectors, as well as North American LNG exports – we expect oil and gas prices to remain disconnected for a long time.
Gas has long-term potential as a mainstream transportation fuel in North America, as is already true of several gas-rich countries in South America and Asia, and even such gas importers as Italy. China is a useful case study of how even a country with relatively high gas prices can become a major market for natural gas vehicles (NGVs), propelled by the government’s emissions policy. While NGVs make up less than 0.1% of U.S. vehicles on the road today, the adoption of compressed natural gas (CNG) and, to a lesser extent, liquefied natural gas (LNG) as fuels has been gaining traction. The low cost of gas compared to conventional fuel (gasoline and diesel) – even after the oil price meltdown – can incentivize commercial and institutional fuel users (such as bus fleets and waste truck operators) to switch to NGVs. Other advantages relative to petroleum include environmental benefits (lower carbon footprint and emissions) and higher octane. On the other hand, the domestic adoption curve has been constrained by high engine costs, which technology improvements can gradually address. It also hasn’t helped that fuel station development has tended to be disproportionately centered in states with favorable policy support (especially gas-producing states), though this is secondary to engine costs.
$1.48
$0.35
$1.00
$0.20
$1.00
$0.50
$0
$1
$2
$3
Gasoline CNG Corn Ethanol
$/g
al
Est. North American Cost Comparison:Gasoline vs. CNG vs. Corn Ethanol
Processing
Feedstock
Source: Clean Energy Fuels, Raymond James research Note: Based on RJ's 2015 price forecasts

Raymond James Global Research
© 2015 Raymond James & Associates, Inc., member New York Stock Exchange/SIPC. All rights reserved.
International Headquarters: The Raymond James Financial Center | 880 Carillon Parkway | St. Petersburg, Florida 33716 | 800-248-8863 27
Outlook on Biofuels and Bioindustrials
Conventional ethanol – produced from corn in the U.S. and sugarcane in Brazil – has long been used as a mainstream fuel component for blending into gasoline. As an oxygenate, ethanol helps reduce pollution in high-density areas. As an octane enhancer – in, fact, the lowest-cost source of octane – ethanol is used to upgrade gasoline. While ethanol has lower energy content than gasoline, it is almost invariably cheaper to produce – even after the oil price meltdown in late 2014. Typical blending levels are 10% in the U.S. (with 15% becoming more common) and 27% in Brazil.
0
5,000
10,000
15,000
20,000
2000 2002 2004 2006 2008 2010 2012 2014 2016E
Millio
ns o
f g
allo
ns
U.S. Ethanol Production
Source: RFA, Raymond James research
The main economic flaw of conventional ethanol is the systemic challenge of managing the “crush spread” between the price of ethanol (an energy commodity loosely linked to gasoline) and the cost of corn/sugarcane (an agricultural commodity). Cellulosic biofuels address this problem. Since they are produced from non-food feedstocks such as wood chips, switchgrass, or municipal waste (materials that have almost no intrinsic value), the cost side of the economic equation is immune from volatility in the agricultural market.
Scale-up of cellulosic and other advanced biofuels is progressing slowly for two reasons. First, commercialization involves significant execution risks. This is true both for companies using a biochemical process (fermentation), which involves a large element of biotech R&D, as well as for those using a thermochemical/catalytic process. Second, capacity expansion is highly capital-intensive. Venture funding can get companies to the proof-of-concept stage, but for commercial scale-up there are three main financing options: government loan guarantees, strategic partnerships (often with integrated oil companies, refiners, and chemical producers), and capital markets. Given the generally higher pricing for chemicals compared to fuels, many advanced biofuel developers are focusing on opportunities in renewable chemicals and other bioindustrial products.
Given the higher adoption rates of diesel engines in Europe vs. the U.S., biodiesel has historically been more common in Europe. Biodiesel margins are a function of the crush spread between the price of biodiesel and the cost of feedstock. The bulk of U.S. biodiesel plants use soybean oil as the principal (or sole) feedstock, though some are able to utilize and source lower-cost feedstocks. Longer term, renewable diesel can provide a “drop-in” alternative to biodiesel, with particular benefits for cold climates.
The most important U.S. policy supporting biofuels is the Renewable Fuels Standard (RFS), which provides a statutory demand floor for both conventional and advanced biofuels through 2022, although each year’s target is subject to reduction (depending on supply/demand dynamics) by the EPA. While the EPA’s annual adjustments create uncertainty from year to year, we do not envision any legislative changes to the RFS given the broad-based, bipartisan support for the overall policy. Given the slower-than-expected pace of scale-up, the cellulosic mandate of the RFS has been sharply reduced in recent years, and this is likely to continue. To clarify, the RFS and analogous policies outside the U.S. only encompass fuels – not chemicals or other specialty products.

Raymond James Global Research
© 2015 Raymond James & Associates, Inc., member New York Stock Exchange/SIPC. All rights reserved.
International Headquarters: The Raymond James Financial Center | 880 Carillon Parkway | St. Petersburg, Florida 33716 | 800-248-8863 28
U.S./Canada Advanced Biofuels (ex-Biodiesel) Production vs. RFS
0%
25%
50%
75%
0
250
500
750
2012 2013 2014 2015E 2016E 2017E
Mil
lio
ns
of
ga
llo
ns
U.S./Can. Advanced Biofuels (ex-Biodiesel) -Production vs. RFS
Est. Production
Est. Compliance with RFS Target
Source: RFA, Environmental Entrepreneurs, Raymond James research
Source: RFA, Environmental Entrepreneurs, and Raymond James research.
Outlook on Electric Vehicles
Electric vehicles – which we define as both plug-in hybrids and all-electric vehicles – remain a niche market, both in North America and most overseas geographies. That said, their sales are growing faster than their hybrid counterparts, not to mention conventional vehicles. In contrast to natural gas vehicles, this is almost entirely a consumer market. The most obvious benefit to owning an EV is the ability to forgo filling up at the gas station. The cost of energy from petroleum is almost invariably higher than the cost of an equivalent amount of energy (on a BTU basis) from electricity. At the average U.S. retail electricity price (currently ~$0.12/kWh), a typical EV’s energy cost per mile is $0.02 to $0.03, approximately one-third the level for a conventional car at $2.75/gal gasoline. This is intuitive in the U.S., where coal represents the largest component of the power generation mix, and a significant (and rising) portion of the rest comes from cheap natural gas. While perhaps not as intuitive, it is also true of Western Europe and Japan. The environmental benefit is that EVs emit no pollutants – though, of course, the vast majority of the power plants generating the electricity have a carbon footprint.
The downside is that EVs are considerably pricier than their conventional counterparts. The lithium ion batteries on which EVs generally depend remain costly, and in a broader sense, EV manufacturing has achieved only limited economies of scale. The U.S. federal tax credit of up to $7,500 and analogous policies internationally only partly cover the incremental upfront cost. In addition, an issue hindering consumer adoption is the limited number and geographic footprint of publicly accessible charging stations, in the context of cars that almost always have a shorter range compared to conventional ones.

Raymond James Global Research
© 2015 Raymond James & Associates, Inc., member New York Stock Exchange/SIPC. All rights reserved.
International Headquarters: The Raymond James Financial Center | 880 Carillon Parkway | St. Petersburg, Florida 33716 | 800-248-8863 29
0
10,000
20,000
30,000
40,000
50,000
60,000
70,000
Jan-11 Jul-11 Jan-12 Jul-12 Jan-13 Jul-13 Jan-14 Jul-14 Jan-15
U.S. Sales of Hybrids and Electric Vehicles
Traditional Hybrids
Plug-in Hybrids
All-Electric EVs
Source: Electric Drive Transportation Association
Outlook on Smart Grid
The traditional power grid has structural flaws – lack of storage, geographic constraints, and minimal monitoring and control – that diminish stability and increase the frequency of blackouts. The smart grid – an overarching framework that leverages modern communication architecture – can make the grid more efficient, stable, and economical in the long run. The smart grid value chain comprises a wide range of products and services: advanced metering infrastructure, networking equipment and software, in-home/business monitoring, smart appliances and lighting systems, and demand response (DR).
Smart meters are what many people would most closely associate with the term “smart grid,” and indeed they make much of the rest possible. Traditional electric meters have no built-in remote-reading communication capability, so they require manual reading by a utility worker. Smart meters, by contrast, initiate and respond to two-way communications with the utility to frequently collect and transmit meter data, thus supporting various applications beyond monthly billings. For example, utilities gain the ability to charge customers based on time-of-day pricing, which can stimulate more efficient consumption patterns. Key markets for smart meters have historically included the U.S., Italy, and the Scandinavian countries, but growth is increasingly coming from China, Southeast Asia, and other emerging markets. In all markets, a significant challenge for smart meter providers is the length and complexity of sales cycles with utilities.
Within the context of a congested grid, DR helps align the interests of electricity providers (utilities and grid operators) and end users (enterprises, public sector institutions, and, to a lesser extent, retail customers). The central idea is that power consumption can be temporarily curtailed in times of peak demand, but instead of doing it abruptly, as is the case with a blackout, it is done in a controlled manner. The role of DR service providers is to monitor electricity consumption and alert end users to reduce their usage during peak periods. This can take the form of simple demand reduction (e.g., by dimming lights or shutting down production lines), or the end user can self-generate electricity (e.g., by means of a backup generator or cogeneration). The service providers typically receive revenue from grid operators and utilities and pay end users for being “available” to reduce usage and for actually doing so when called upon. In the U.S., DR has historically been utilized mainly in the Northeast and Mid-Atlantic, but it is making inroads in other parts of the country, as well as internationally (e.g., Australia, Germany, and Japan).
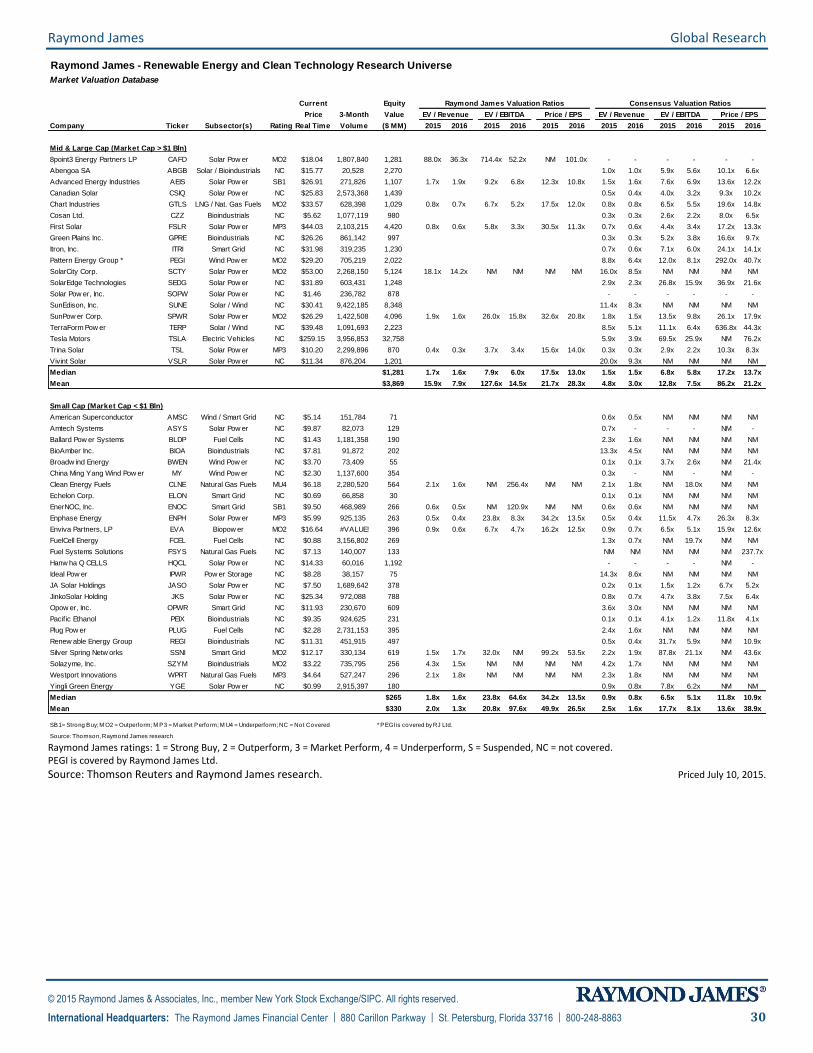
Raymond James Global Research
© 2015 Raymond James & Associates, Inc., member New York Stock Exchange/SIPC. All rights reserved.
International Headquarters: The Raymond James Financial Center | 880 Carillon Parkway | St. Petersburg, Florida 33716 | 800-248-8863 30
Raymond James - Renewable Energy and Clean Technology Research Universe
Market Valuation Database
Current Equity
Price 3-Month Value
Company Ticker Subsector(s) Rating Real Time Volume ($ MM) 2015 2016 2015 2016 2015 2016 2015 2016 2015 2016 2015 2016
Mid & Large Cap (Market Cap > $1 Bln)
8point3 Energy Partners LP CAFD Solar Pow er MO2 $18.04 1,807,840 1,281 88.0x 36.3x 714.4x 52.2x NM 101.0x - - - - - -
Abengoa SA ABGB Solar / Bioindustrials NC $15.77 20,528 2,270 1.0x 1.0x 5.9x 5.6x 10.1x 6.6x
Advanced Energy Industries AEIS Solar Pow er SB1 $26.91 271,826 1,107 1.7x 1.9x 9.2x 6.8x 12.3x 10.8x 1.5x 1.6x 7.6x 6.9x 13.6x 12.2x
Canadian Solar CSIQ Solar Pow er NC $25.83 2,573,368 1,439 0.5x 0.4x 4.0x 3.2x 9.3x 10.2x
Chart Industries GTLS LNG / Nat. Gas Fuels MO2 $33.57 628,398 1,029 0.8x 0.7x 6.7x 5.2x 17.5x 12.0x 0.8x 0.8x 6.5x 5.5x 19.6x 14.8x
Cosan Ltd. CZZ Bioindustrials NC $5.62 1,077,119 980 0.3x 0.3x 2.6x 2.2x 8.0x 6.5x
First Solar FSLR Solar Pow er MP3 $44.03 2,103,215 4,420 0.8x 0.6x 5.8x 3.3x 30.5x 11.3x 0.7x 0.6x 4.4x 3.4x 17.2x 13.3x
Green Plains Inc. GPRE Bioindustrials NC $26.26 861,142 997 0.3x 0.3x 5.2x 3.8x 16.6x 9.7x
Itron, Inc. ITRI Smart Grid NC $31.98 319,235 1,230 0.7x 0.6x 7.1x 6.0x 24.1x 14.1x
Pattern Energy Group * PEGI Wind Pow er MO2 $29.20 705,219 2,022 8.8x 6.4x 12.0x 8.1x 292.0x 40.7x
SolarCity Corp. SCTY Solar Pow er MO2 $53.00 2,268,150 5,124 18.1x 14.2x NM NM NM NM 16.0x 8.5x NM NM NM NM
SolarEdge Technologies SEDG Solar Pow er NC $31.89 603,431 1,248 2.9x 2.3x 26.8x 15.9x 36.9x 21.6x
Solar Pow er, Inc. SOPW Solar Pow er NC $1.46 236,782 878 - - - - - -
SunEdison, Inc. SUNE Solar / Wind NC $30.41 9,422,185 8,348 11.4x 8.3x NM NM NM NM
SunPow er Corp. SPWR Solar Pow er MO2 $26.29 1,422,508 4,096 1.9x 1.6x 26.0x 15.8x 32.6x 20.8x 1.8x 1.5x 13.5x 9.8x 26.1x 17.9x
TerraForm Pow er TERP Solar / Wind NC $39.48 1,091,693 2,223 8.5x 5.1x 11.1x 6.4x 636.8x 44.3x
Tesla Motors TSLA Electric Vehicles NC $259.15 3,956,853 32,758 5.9x 3.9x 69.5x 25.9x NM 76.2x
Trina Solar TSL Solar Pow er MP3 $10.20 2,299,896 870 0.4x 0.3x 3.7x 3.4x 15.6x 14.0x 0.3x 0.3x 2.9x 2.2x 10.3x 8.3x
Vivint Solar VSLR Solar Pow er NC $11.34 876,204 1,201 20.0x 9.3x NM NM NM NM
Median $1,281 1.7x 1.6x 7.9x 6.0x 17.5x 13.0x 1.5x 1.5x 6.8x 5.8x 17.2x 13.7x
Mean $3,869 15.9x 7.9x 127.6x 14.5x 21.7x 28.3x 4.8x 3.0x 12.8x 7.5x 86.2x 21.2x
Small Cap (Market Cap < $1 Bln)
American Superconductor AMSC Wind / Smart Grid NC $5.14 151,784 71 0.6x 0.5x NM NM NM NM
Amtech Systems ASYS Solar Pow er NC $9.87 82,073 129 0.7x - - - NM -
Ballard Pow er Systems BLDP Fuel Cells NC $1.43 1,181,358 190 2.3x 1.6x NM NM NM NM
BioAmber Inc. BIOA Bioindustrials NC $7.81 91,872 202 13.3x 4.5x NM NM NM NM
Broadw ind Energy BWEN Wind Pow er NC $3.70 73,409 55 0.1x 0.1x 3.7x 2.6x NM 21.4x
China Ming Yang Wind Pow er MY Wind Pow er NC $2.30 1,137,600 354 0.3x - NM - NM -
Clean Energy Fuels CLNE Natural Gas Fuels MU4 $6.18 2,280,520 564 2.1x 1.6x NM 256.4x NM NM 2.1x 1.8x NM 18.0x NM NM
Echelon Corp. ELON Smart Grid NC $0.69 66,858 30 0.1x 0.1x NM NM NM NM
EnerNOC, Inc. ENOC Smart Grid SB1 $9.50 468,989 266 0.6x 0.5x NM 120.9x NM NM 0.6x 0.6x NM NM NM NM
Enphase Energy ENPH Solar Pow er MP3 $5.99 925,135 263 0.5x 0.4x 23.8x 8.3x 34.2x 13.5x 0.5x 0.4x 11.5x 4.7x 26.3x 8.3x
Enviva Partners, LP EVA Biopow er MO2 $16.64 #VALUE! 396 0.9x 0.6x 6.7x 4.7x 16.2x 12.5x 0.9x 0.7x 6.5x 5.1x 15.9x 12.6x
FuelCell Energy FCEL Fuel Cells NC $0.88 3,156,802 269 1.3x 0.7x NM 19.7x NM NM
Fuel Systems Solutions FSYS Natural Gas Fuels NC $7.13 140,007 133 NM NM NM NM NM 237.7x
Hanw ha Q CELLS HQCL Solar Pow er NC $14.33 60,016 1,192 - - - - NM -
Ideal Pow er IPWR Pow er Storage NC $8.28 38,157 75 14.3x 8.6x NM NM NM NM
JA Solar Holdings JASO Solar Pow er NC $7.50 1,689,642 378 0.2x 0.1x 1.5x 1.2x 6.7x 5.2x
JinkoSolar Holding JKS Solar Pow er NC $25.34 972,088 788 0.8x 0.7x 4.7x 3.8x 7.5x 6.4x
Opow er, Inc. OPWR Smart Grid NC $11.93 230,670 609 3.6x 3.0x NM NM NM NM
Pacif ic Ethanol PEIX Bioindustrials NC $9.35 924,625 231 0.1x 0.1x 4.1x 1.2x 11.8x 4.1x
Plug Pow er PLUG Fuel Cells NC $2.28 2,731,153 395 2.4x 1.6x NM NM NM NM
Renew able Energy Group REGI Bioindustrials NC $11.31 451,915 497 0.5x 0.4x 31.7x 5.9x NM 10.9x
Silver Spring Netw orks SSNI Smart Grid MO2 $12.17 330,134 619 1.5x 1.7x 32.0x NM 99.2x 53.5x 2.2x 1.9x 87.8x 21.1x NM 43.6x
Solazyme, Inc. SZYM Bioindustrials MO2 $3.22 735,795 256 4.3x 1.5x NM NM NM NM 4.2x 1.7x NM NM NM NM
Westport Innovations WPRT Natural Gas Fuels MP3 $4.64 527,247 296 2.1x 1.8x NM NM NM NM 2.3x 1.8x NM NM NM NM
Yingli Green Energy YGE Solar Pow er NC $0.99 2,915,397 180 0.9x 0.8x 7.8x 6.2x NM NM
Median $265 1.8x 1.6x 23.8x 64.6x 34.2x 13.5x 0.9x 0.8x 6.5x 5.1x 11.8x 10.9x
Mean $330 2.0x 1.3x 20.8x 97.6x 49.9x 26.5x 2.5x 1.6x 17.7x 8.1x 13.6x 38.9x
SB1 = Strong Buy; M O2 = Outperform; M P3 = M arket Perform; M U4 = Underperform; NC = Not Covered * PEGI is covered by RJ Ltd.
Source: Thomson, Raymond James research
Raymond James Valuation Ratios
EV / EBITDAEV / Revenue Price / EPS
Consensus Valuation Ratios
EV / Revenue EV / EBITDA Price / EPS
Raymond James ratings: 1 = Strong Buy, 2 = Outperform, 3 = Market Perform, 4 = Underperform, S = Suspended, NC = not covered. PEGI is covered by Raymond James Ltd.
Source: Thomson Reuters and Raymond James research. Priced July 10, 2015.

Raymond James Global Research
© 2015 Raymond James & Associates, Inc., member New York Stock Exchange/SIPC. All rights reserved.
International Headquarters: The Raymond James Financial Center | 880 Carillon Parkway | St. Petersburg, Florida 33716 | 800-248-8863 31
Canadian Oil and Gas
Few clues gleaned from first Throne Speech by Alberta's new government. On June 17, the RJ Ltd. energy research team discussed the new political landscape in Alberta. The newly elected NDP government delivered its first “Speech from the Throne,” setting the tone and outlining some of the initial measures that the new government plans to implement in the coming months. With the markets keenly looking for any tea leaves or outright indications regarding the next steps the government might take regarding the fiscal regime, there were, unfortunately, few details in the speech. Instead, the speech confined itself largely on less contentious issues such as campaign reform, raising corporate taxes (from 10% to 12%, and already promised in the campaign), re-instituting a progressive personal tax system (also a key platform plank), and increased funding for public services such as healthcare and education. In fact, the only pertinent touching point relating to the oil and gas fiscal regime (aside from the aforementioned corporate taxes) was an indication that the new government would work collaboratively with the rest of the country on a national energy policy while concurrently conducting a review of the current royalty framework. Following the speech, Premier Notley indicated that a panel to review the royalty framework would not be announced until the end of summer, prolonging the uncertainty that, in our view, continues to weigh on energy shares. All in all, the much anticipated speech proved to be a non-event.
The tumultuous path towards an FID for Pacific Northwest LNG. On June 10, RJ Ltd. provided an update on LNG export projects in British Columbia, focusing on the Petronas-operated Pacific Northwest project. We have perceived a heightened level of interest from investors in LNG project probability, timelines, and potential economic impacts. We’ve noted this directly through conversations with investors and the press, as well as indirectly via movements in certain stocks, particularly certain accommodations providers. On the whole, we still envision a better than 50% chance of at least one positive final investment decision (FID), though the timing of a potential announcement has shifted toward year-end. To clarify, Pacific Northwest LNG has declared a “conditional” FID – the first B.C. project to get that far – but is not yet moving forward with actual construction.
Propane – Canada's ethane? On May 13, RJ Ltd. highlighted the depressed price environment for propane in Alberta. While no commodity has been left unscathed in this downturn, there is perhaps no other commodity that has suffered to the magnitude that propane in Alberta has. As of mid-May, propane in Alberta was trading shockingly below C$2/Bbl – a far cry from the C$64/Bbl it averaged during the first half of 2014. Certainly, the largest contributor to the fall in Alberta propane pricing has been the broader sell-off in the entire crude oil complex. Liquids of all forms in North America have seen a considerable decline, although it has been surprising to see counter-seasonal weakness in propane prices vs. other components of the NGL barrel. In this regard, an abnormally warm winter in Western Canada didn’t help, with propane inventories well above the five-year range.
Natural gas firm sales access is an issue. On April 29, RJ Ltd. discussed midstream capacity constraints in parts of Alberta and British Columbia. With the exception of newly emerging hydrocarbons basins, Canadian producers have historically had little difficulty in finding bidders for all their hydrocarbon volumes on any given day and securing access to markets/infrastructure into which to sell said volumes of production; however, gas producers in northwest Alberta and northeast B.C. may face an incremental challenge for the balance of this year and into next when it comes to accessing markets. The share of total capacity that is being taken up by firm transportation consumers is leaving less interruptible gas service capacity on the Spectra and Alliance pipeline systems. At the same time, the TCPL system in western Alberta is facing artificial constraints on operating capacity, as integrity testing and systems upgrades/improvements are also severely limiting the amount of interruptible gas transportation capacity that is available in the system.

Raymond James Global Research
© 2015 Raymond James & Associates, Inc., member New York Stock Exchange/SIPC. All rights reserved.
International Headquarters: The Raymond James Financial Center | 880 Carillon Parkway | St. Petersburg, Florida 33716 | 800-248-8863 32
Junior Producers
Company Closing Stock Mkt Cap Current
Name Symbol Price Rating ($mln) Yield NAV 15E 16E 15E 16E
Boulder BXO $7.50 OP 2 $341 0.0% NA $0.90 $2.03 8.4x 3.7x
Chinook CKE $0.85 OP 2 $183 0.0% NA $0.05 $0.11 18.3x 7.9x
Delphi DEE $1.24 SB 1 $193 0.0% NA $0.28 $0.35 4.4x 3.5x
Granite GXO $5.62 OP 2 $171 0.0% NA $1.57 $1.46 3.6x 3.8x
Leucrotta LXE $1.12 OP 2 $185 0.0% NA $0.01 $0.04 nmf 25.5x
RMP Energy RMP $2.06 OP 2 $252 0.0% NA $0.82 $0.90 2.5x 2.3x
Storm Resources SRX $4.72 OP 2 $563 0.0% NA $0.43 $0.61 11.1x 7.8x
Median 6.4x 3.8x
Intermediate Producers 2 3000 38 7 44 11 110
Company Closing Stock Mkt Cap Current
Name Symbol Price Rating ($mln) Yield NAV 15E 16E 15E 16E
ARC ARX $20.98 MP 3 $7,119 5.7% NA $1.93 $2.16 10.9x 9.7x
Athabasca ATH $1.86 OP 2 $748 0.0% $2.98 ($0.11) ($0.04) nfm nfm
Baytex BTE $17.69 MP 3 $2,990 6.8% $21.83 $2.89 $2.52 6.1x 7.0x
Birchcliff BIR $6.70 OP 2 $1,020 0.0% NA $0.92 $1.27 7.3x 5.3x
Crescent Point CPG $23.94 OP 2 $10,689 11.5% $37.26 $3.93 $3.88 6.1x 6.2x
Crew Energy CR $5.48 SB 1 $768 0.0% NA $0.62 $0.63 8.9x 8.7x
Kelt KEL $8.26 OP 2 $1,393 0.0% NA $0.58 $0.97 14.2x 8.5x
NuVista NVA $6.03 OP 2 $836 0.0% NA $0.87 $1.01 6.9x 6.0x
Paramount POU $26.29 SB 1 $2,756 0.0% NA $2.90 $5.45 9.1x 4.8x
Pengrowth PGF $2.87 MP 3 $1,572 9.8% $3.81 $0.99 $0.73 2.9x 3.9x
Peyto PEY $29.87 OP 2 $4,591 3.8% NA $3.55 $4.16 8.4x 7.2x
Seven Generations VII $15.95 OP 2 $3,912 0.0% NA $1.43 $1.92 11.2x 8.3x
Tourmaline Oil TOU $35.88 OP 2 $7,747 0.0% NA $4.17 $5.51 8.6x 6.5x
Trilogy TET $4.96 MP 3 $624 7.8% NA $0.88 $1.01 5.7x 4.9x
Median 7.9x 6.3x
Senior Producers
Company Closing Stock Mkt Cap
Name Symbol Price Rating ($mln) $/sh Yield 15E 16E 15E 16E
Canadian Natural CNQ $33.01 MP 3 $36,058 $0.92 2.8% $5.52 $6.03 6.0x 5.5x
Cenovus Energy CVE $18.19 OP 2 $14,278 $1.06 5.9% $2.94 $2.44 6.2x 7.5x
Husky Energy HSE $23.50 MP 3 $23,119 $1.20 5.1% $4.12 $4.41 5.7x 5.3x
Imperial Oil IMO $46.53 MP 3 $39,574 $0.52 1.1% $3.85 $4.96 12.1x 9.4x
Suncor SU $34.00 OP 2 $49,130 $1.12 3.3% $4.99 $5.19 6.8x 6.6x
Median 3.3% 6.2x 6.6x
Oil Sands
Company Closing Stock Mkt Cap
Name Symbol Price Rating ($mln) $/sh Yield 15E 16E 15E 16E
Canadian Oil Sands COS $8.89 UP 4 $4,308 $0.20 2.2% $1.04 $1.56 8.6x 5.7x
MEG Energy MEG $17.35 OP 2 $3,884 $0.00 0.0% $1.01 $2.40 17.3x 7.2x
Median 12.9x 6.5x
P/CFDividends CFPS
CFPS
CFPS
P/CF
P/CF
Dividends CFPS P/CF
Source: Bloomberg and Raymond James Ltd. Priced July 10, 2015.

Raymond James Global Research
© 2015 Raymond James & Associates, Inc., member New York Stock Exchange/SIPC. All rights reserved.
International Headquarters: The Raymond James Financial Center | 880 Carillon Parkway | St. Petersburg, Florida 33716 | 800-248-8863 33
Energy Services
Company Closing Stock Mkt Cap
Name Symbol Price Rating ($mln) $/sh Yield 15E 16E 15E 16E
Contract Drillers
Ensign ESI $11.50 MP 3 $1,757 $0.48 4.2% $0.40 $0.38 28.5x 30.4x
Precision PD $7.33 MP 3 $2,146 $0.28 3.8% ($0.50) $0.16 nmf 45.2x
Savanna SVY $1.39 OP 2 $125 $0.00 0.0% ($0.07) $0.14 nmf 9.7x
Trinidad TDG $3.84 R R R R R R R R
Western WRG $5.66 OP 2 $422 $0.30 5.3% $0.23 $0.53 24.9x 10.6x
Pressure Pumpers
Calfrac CFW $6.70 MP 3 $640 $0.25 3.7% ($1.13) ($0.21) nmf nmf
Canyon FRC $5.54 MP 3 $381 $0.30 5.4% ($0.35) $0.38 nmf 14.7x
Trican TCW $3.11 UP 4 $464 $0.30 9.6% ($1.29) ($0.56) nmf nmf
Well Site & Other Services
Essential ESN $1.18 OP 2 $148 $0.12 10.2% ($0.06) $0.14 nmf 8.2x
Mullen MTL $19.17 UP 4 $1,757 $1.20 6.3% $0.65 $1.12 29.6x 17.1x
Strad SDY $2.85 OP 2 $106 $0.28 9.8% ($0.19) $0.12 nmf 23.3x
Facilities & Infrastructure
Black Diamond BDI $16.93 OP 2 $695 $0.96 5.7% $0.63 $0.78 26.7x 21.8x
Enerflex EFX $13.15 MP 3 $1,035 $0.34 2.6% $1.44 $1.32 9.1x 9.9x
Horizon North HNL $3.74 MP 3 $494 $0.32 8.6% $0.07 $0.16 51.1x 23.2x
Secure SES $12.15 OP 2 $1,651 $0.24 2.0% ($0.02) $0.31 nmf 38.7x
Median ($0.02) $0.31 26.7x 17.1x
Energy InfrastructureCompany Closing Stock Mkt Cap
Name Symbol Price Rating ($mln) $/sh Yield 15E 16E 15E 16E
AltaGas ALA $37.66 OP 2 $5,098 $1.84 4.9% $3.03 $3.53 8.0% 9.4%
Gibson Energy GEI $22.01 MP 3 $2,749 $1.28 5.8% $1.77 $2.09 8.0% 9.5%
Inter Pipeline IPL $27.97 MP 3 $9,272 $1.48 5.3% $1.97 $2.05 7.0% 7.3%
Keyera KEY $40.39 OP 2 $6,822 $1.40 3.5% $2.98 $2.81 7.4% 7.0%
Pembina Pipeline PPL $39.41 OP 2 $13,399 $1.76 4.5% $2.12 $2.59 5.4% 6.6%
Veresen VSN $15.36 MP 3 $4,398 $1.00 6.5% $1.07 $1.00 7.0% 6.5%
Median 5.1% 7.2% 7.1%
P/E (fd)EPS (fd)Dividends
Dividends AFFO/sh AFFO Yield
Source: Bloomberg and Raymond James Ltd. Priced July 10, 2015

Raymond James Global Research
© 2015 Raymond James & Associates, Inc., member New York Stock Exchange/SIPC. All rights reserved.
International Headquarters: The Raymond James Financial Center | 880 Carillon Parkway | St. Petersburg, Florida 33716 | 800-248-8863 34
European Oil and Gas
Stock Performance in 2Q15 and TTM
RJEE Integrated Oil and Gas Universe
Quarterly Stock Price Performance TTM Stock Price Performance
25%
1%
-1%
-4%
-5%
-8%
-8%
-15% -5% 5% 15% 25% 35%
BG
Eni
OMV
BP
Total
Repsol
Shell
-12%
-14%
-14%
-14%
-14%
-16%
-21%
-25% -20% -15% -10% -5% 0%
Shell
Repsol
Total
BG
BP
Eni
OMV
Source: Datastream.
As 2Q15 proved to be a volatile period for major environment variables (Brent prices and €/$ forex), European Big Oils’ share price performance was flat q/q on average. BG was expectedly far ahead of its peers, with a total Shareholder return at 25% boosted by the proposed bid by Shell. On the other hand, it seems the Shell proposed premium for BG, along with its leading position on the weakened LNG market, has weighed on investors’ sentiment over the quarter. Over the last 12 months, however, the stock proved the most defensive, with total shareholder return at minus 12%, vs. our universe at minus 15%.
On April 8, 2015, the boards of Shell and BG recommended a cash and share offer to be made by Shell on BG, whereby BG shareholders will be entitled to receive 383p in cash and 0.4454 Shell B shares, a 50% premium to BG's closing price as of April 7. This deal represents a dream combination in our view, as we believe BG's meaningful exposure to Brazil Deepwater and LNG is a natural and unique fit to Shell's strategy and capabilities.
Although this is not a 2Q15 event, per se, it is worth mentioning that on July 2 BP announced a full $18.7 billion settlement (payable over 17 years) with federal, state, and local governments. Overall, BP will provision another $10 billion on top of the 1Q15 $43.8 billion Macondo provisions (excluding any further rise on the PSC settlement cost estimates). A positive settlement (sentiment wise) but slightly negative valuation-wise: the headline number obviously represents a massive payout, but it is spread over 15-18 years, making it quite manageable from a cash flow standpoint (~$1.1 billion p.a.). Most importantly, this settlement finally draws a line under the Macondo disaster, lifting the legal overhang once and for all (almost!).
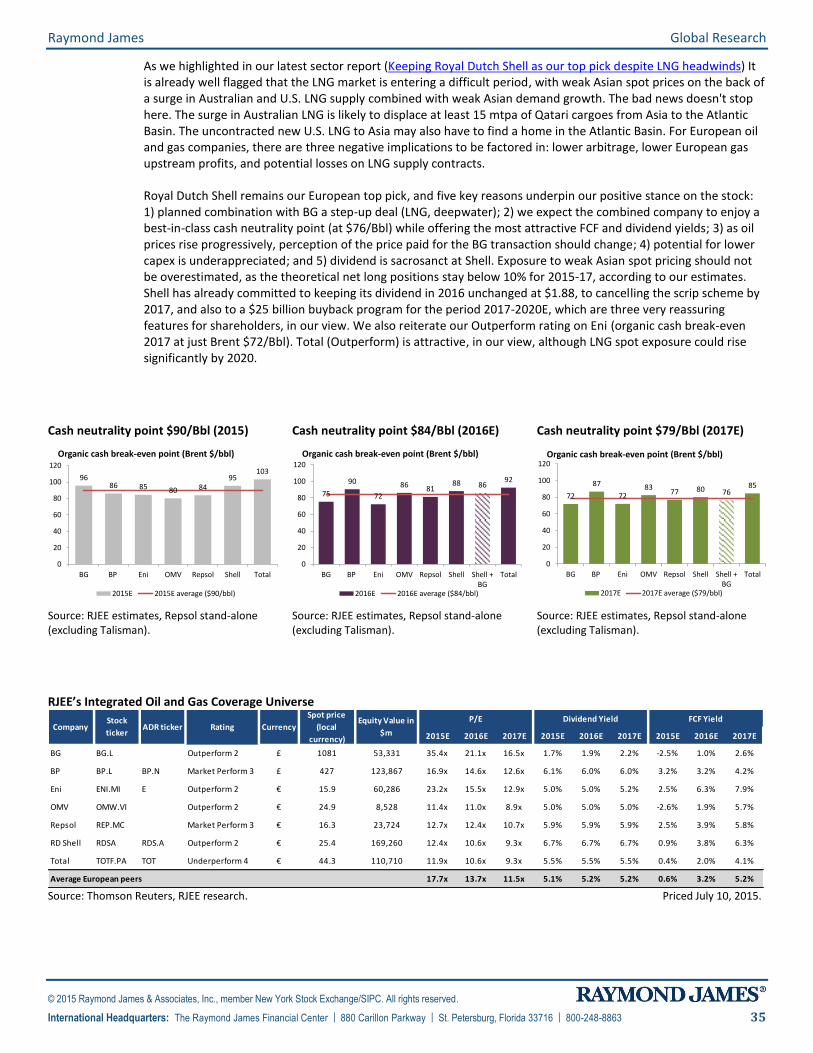
Raymond James Global Research
© 2015 Raymond James & Associates, Inc., member New York Stock Exchange/SIPC. All rights reserved.
International Headquarters: The Raymond James Financial Center | 880 Carillon Parkway | St. Petersburg, Florida 33716 | 800-248-8863 35
As we highlighted in our latest sector report (Keeping Royal Dutch Shell as our top pick despite LNG headwinds) It is already well flagged that the LNG market is entering a difficult period, with weak Asian spot prices on the back of a surge in Australian and U.S. LNG supply combined with weak Asian demand growth. The bad news doesn't stop here. The surge in Australian LNG is likely to displace at least 15 mtpa of Qatari cargoes from Asia to the Atlantic Basin. The uncontracted new U.S. LNG to Asia may also have to find a home in the Atlantic Basin. For European oil and gas companies, there are three negative implications to be factored in: lower arbitrage, lower European gas upstream profits, and potential losses on LNG supply contracts.
Royal Dutch Shell remains our European top pick, and five key reasons underpin our positive stance on the stock: 1) planned combination with BG a step-up deal (LNG, deepwater); 2) we expect the combined company to enjoy a best-in-class cash neutrality point (at $76/Bbl) while offering the most attractive FCF and dividend yields; 3) as oil prices rise progressively, perception of the price paid for the BG transaction should change; 4) potential for lower capex is underappreciated; and 5) dividend is sacrosanct at Shell. Exposure to weak Asian spot pricing should not be overestimated, as the theoretical net long positions stay below 10% for 2015-17, according to our estimates. Shell has already committed to keeping its dividend in 2016 unchanged at $1.88, to cancelling the scrip scheme by 2017, and also to a $25 billion buyback program for the period 2017-2020E, which are three very reassuring features for shareholders, in our view. We also reiterate our Outperform rating on Eni (organic cash break-even 2017 at just Brent $72/Bbl). Total (Outperform) is attractive, in our view, although LNG spot exposure could rise significantly by 2020.
Cash neutrality point $90/Bbl (2015) Cash neutrality point $84/Bbl (2016E) Cash neutrality point $79/Bbl (2017E)
9686 85 80 84
95103
0
20
40
60
80
100
120
BG BP Eni OMV Repsol Shell Total
Organic cash break-even point (Brent $/bbl)
2015E 2015E average ($90/bbl)
75
90
72
86 8188 86
92
0
20
40
60
80
100
120
BG BP Eni OMV Repsol Shell Shell +BG
Total
Organic cash break-even point (Brent $/bbl)
2016E 2016E average ($84/bbl)
72
87
7283
77 80 7685
0
20
40
60
80
100
120
BG BP Eni OMV Repsol Shell Shell +BG
Total
Organic cash break-even point (Brent $/bbl)
2017E 2017E average ($79/bbl)
Source: RJEE estimates, Repsol stand-alone (excluding Talisman).
Source: RJEE estimates, Repsol stand-alone (excluding Talisman).
Source: RJEE estimates, Repsol stand-alone (excluding Talisman).
RJEE’s Integrated Oil and Gas Coverage Universe P/E Dividend Yield FCF Yield
2015E 2016E 2017E 2015E 2016E 2017E 2015E 2016E 2017E
BG BG.L Outperform 2 £ 1081 53,331 35.4x 21.1x 16.5x 1.7% 1.9% 2.2% -2.5% 1.0% 2.6%
BP BP.L BP.N Market Perform 3 £ 427 123,867 16.9x 14.6x 12.6x 6.1% 6.0% 6.0% 3.2% 3.2% 4.2%
Eni ENI.MI E Outperform 2 € 15.9 60,286 23.2x 15.5x 12.9x 5.0% 5.0% 5.2% 2.5% 6.3% 7.9%
OMV OMW.VI Outperform 2 € 24.9 8,528 11.4x 11.0x 8.9x 5.0% 5.0% 5.0% -2.6% 1.9% 5.7%
Repsol REP.MC Market Perform 3 € 16.3 23,724 12.7x 12.4x 10.7x 5.9% 5.9% 5.9% 2.5% 3.9% 5.8%
RD Shell RDSA RDS.A Outperform 2 € 25.4 169,260 12.4x 10.6x 9.3x 6.7% 6.7% 6.7% 0.9% 3.8% 6.3%
Total TOTF.PA TOT Underperform 4 € 44.3 110,710 11.9x 10.6x 9.3x 5.5% 5.5% 5.5% 0.4% 2.0% 4.1%
Average European peers 17.7x 13.7x 11.5x 5.1% 5.2% 5.2% 0.6% 3.2% 5.2%
Equity Value in
$mCompany
Stock
tickerADR ticker Rating Currency
Spot price
(local
currency)
Source: Thomson Reuters, RJEE research. Priced July 10, 2015.

Raymond James Global Research
© 2015 Raymond James & Associates, Inc., member New York Stock Exchange/SIPC. All rights reserved.
International Headquarters: The Raymond James Financial Center | 880 Carillon Parkway | St. Petersburg, Florida 33716 | 800-248-8863 36
Argentinean Oil and Gas
According to the latest data published by Argentina’s Energy Secretariat, total hydrocarbon output in the country rose 2.8% y/y in May 2015. The country’s oil production rose 1.7% y/y, while gas output rose 3.6%. YPF’s production increased in the same period, while Petrobras Argentina’s output fell. The 1Q15 run-rate was 584 MBoe/d at YPF and 77 MBoe/d at Petrobras Argentina.
YPF (YPF/$25.40/Outperform)
YPF’s consolidated output increased 9.8% y/y in May to 14.2 MMBoe. Oil production rose 6.7% y/y, and gas output rose 13.3% y/y. On a y/y basis, May was the 26
th consecutive month in which YPF posted positive y/y growth for oil
output (and the 25th
for gas).
Petrobras Argentina (PZE/$6.40/Market Perform) (including Petrolera Entre Lomas)
Petrobras Argentina’s total output fell 24.6% y/y in May, to 2.3 MMBoe. Oil and gas production declined 23.7% and 25.0%, respectively. To clarify, April was the start of the first quarter following the sale of assets in the Austral basin, which represented close to 20% of the company’s production.
Neuquen Basin Highlights
In the Neuquen Basin (as a proxy for the Vaca Muerta resource play), YPF increased its oil output by 14.7% y/y in May, with associated gas output rising 14.0% y/y. We project year-end 2016 oil production at Vaca Muerta will reach 41 MBbls/d. Petrobras Argentina’s gas output increased 6.2% y/y but declined 8.9% for oil.
Oil Production in Argentina (May 2013 – May 2015) Gas Production in Argentina (May 2013 – May 2015)
Source: Argentina’s Energy Secretariat and Raymond James Latin America.
Raymond James Global Research
© 2015 Raymond James & Associates, Inc., member New York Stock Exchange/SIPC. All rights reserved.
International Headquarters: The Raymond James Financial Center | 880 Carillon Parkway | St. Petersburg, Florida 33716 | 800-248-8863 37
Important Investor Disclosures Raymond James & Associates (RJA) is a FINRA member firm and is responsible for the preparation and distribution of research created in the United States. Raymond James & Associates is located at The Raymond James Financial Center, 880 Carillon Parkway, St. Petersburg, FL 33716, (727) 567-1000. Non-U.S. affiliates, which are not FINRA member firms, include the following entities that are responsible for the creation and distribution of research in their respective areas: in Canada, Raymond James Ltd., Suite 2100, 925 West Georgia Street, Vancouver, BC V6C 3L2, (604) 659-8200; in Latin America, Raymond James Latin America, Ruta 8, km 17, 500, 91600 Montevideo, Uruguay, 00598 2 518 2033; in Europe, Raymond James Euro Equities SAS (also trading as Raymond James International), 40, rue La Boetie, 75008, Paris, France, +33 1 45 64 0500, and Raymond James Financial International Ltd., Broadwalk House, 5 Appold Street, London, England EC2A 2AG, +44 203 798 5600.
This document is not directed to, or intended for distribution to or use by, any person or entity that is a citizen or resident of or located in any locality, state, country, or other jurisdiction where such distribution, publication, availability or use would be contrary to law or regulation. The securities discussed in this document may not be eligible for sale in some jurisdictions. This research is not an offer to sell or the solicitation of an offer to buy any security in any jurisdiction where such an offer or solicitation would be illegal. It does not constitute a personal recommendation or take into account the particular investment objectives, financial situations, or needs of individual clients. Past performance is not a guide to future performance, future returns are not guaranteed, and a loss of original capital may occur. Investors should consider this report as only a single factor in making their investment decision.
For clients in the United States: Any foreign securities discussed in this report are generally not eligible for sale in the U.S. unless they are listed on a U.S. exchange. This report is being provided to you for informational purposes only and does not represent a solicitation for the purchase or sale of a security in any state where such a solicitation would be illegal. Investing in securities of issuers organized outside of the U.S., including ADRs, may entail certain risks. The securities of non-U.S. issuers may not be registered with, nor be subject to the reporting requirements of, the U.S. Securities and Exchange Commission. There may be limited information available on such securities. Investors who have received this report may be prohibited in certain states or other jurisdictions from purchasing the securities mentioned in this report. Please ask your Financial Advisor for additional details and to determine if a particular security is eligible for purchase in your state.
The information provided is as of the date above and subject to change, and it should not be deemed a recommendation to buy or sell any security. Certain information has been obtained from third-party sources we consider reliable, but we do not guarantee that such information is accurate or complete. Persons within the Raymond James family of companies may have information that is not available to the contributors of the information contained in this publication. Raymond James, including affiliates and employees, may execute transactions in the securities listed in this publication that may not be consistent with the ratings appearing in this publication.
Additional information is available on request.
Analyst Information
Registration of Non-U.S. Analysts: The analysts listed on the front of this report who are not employees of Raymond James & Associates, Inc., are not registered/qualified as research analysts under FINRA rules, are not associated persons of Raymond James & Associates, Inc., and are not subject to NASD Rule 2711 and NYSE Rule 472 restrictions on communications with covered companies, public companies, and trading securities held by a research analyst account.
Analyst Holdings and Compensation: Equity analysts and their staffs at Raymond James are compensated based on a salary and bonus system. Several factors enter into the bonus determination including quality and performance of research product, the analyst's success in rating stocks versus an industry index, and support effectiveness to trading and the retail and institutional sales forces. Other factors may include but are not limited to: overall ratings from internal (other than investment banking) or external parties and the general productivity and revenue generated in covered stocks.
The views expressed in this report accurately reflect the personal views of the analyst(s) covering the subject securities. No part of said person's compensation was, is, or will be directly or indirectly related to the specific recommendations or views contained in this research report. In addition, said analyst has not received compensation from any subject company in the last 12 months.
Ratings and Definitions
Raymond James & Associates (U.S.) definitions
Strong Buy (SB1) Expected to appreciate, produce a total return of at least 15%, and outperform the S&P 500 over the next six to 12 months. For higher yielding and more conservative equities, such as REITs and certain MLPs, a total return of at least 15% is expected to be realized over the next 12 months. Outperform (MO2) Expected to appreciate and outperform the S&P 500 over the next 12-18 months. For higher yielding and more conservative equities, such as REITs and certain MLPs, an Outperform rating is used for securities where we are comfortable with the relative safety of the dividend and expect a total return modestly exceeding the dividend yield over the next 12-18 months.

Raymond James Global Research
© 2015 Raymond James & Associates, Inc., member New York Stock Exchange/SIPC. All rights reserved.
International Headquarters: The Raymond James Financial Center | 880 Carillon Parkway | St. Petersburg, Florida 33716 | 800-248-8863 38
Market Perform (MP3) Expected to perform generally in line with the S&P 500 over the next 12 months. Underperform (MU4) Expected to underperform the S&P 500 or its sector over the next six to 12 months and should be sold. Suspended (S) The rating and price target have been suspended temporarily. This action may be due to market events that made coverage impracticable, or to comply with applicable regulations or firm policies in certain circumstances, including when Raymond James may be providing investment banking services to the company. The previous rating and price target are no longer in effect for this security and should not be relied upon. Raymond James Ltd. (Canada) definitions
Strong Buy (SB1) The stock is expected to appreciate and produce a total return of at least 15% and outperform the S&P/TSX Composite Index over the next six months. Outperform (MO2) The stock is expected to appreciate and outperform the S&P/TSX Composite Index over the next twelve months. Market Perform (MP3) The stock is expected to perform generally in line with the S&P/TSX Composite Index over the next twelve months and is potentially a source of funds for more highly rated securities. Underperform (MU4) The stock is expected to underperform the S&P/TSX Composite Index or its sector over the next six to twelve months and should be sold. Raymond James Latin American rating definitions
Strong Buy (SB1) Expected to appreciate and produce a total return of at least 25.0% over the next twelve months. Outperform (MO2) Expected to appreciate and produce a total return of between 15.0% and 25.0% over the next twelve months. Market Perform (MP3) Expected to perform in line with the underlying country index. Underperform (MU4) Expected to underperform the underlying country index. Suspended (S) The rating and price target have been suspended temporarily. This action may be due to market events that made coverage impracticable, or to comply with applicable regulations or firm policies in certain circumstances, including when Raymond James may be providing investment banking services to the company. The previous rating and price target are no longer in effect for this security and should not be relied upon.
Raymond James Europe (Raymond Euro Equities SAS & Raymond James Financial International Limited) rating definitions
Strong Buy (1) Expected to appreciate, produce a total return of at least 15%, and outperform the Stoxx 600 over the next 6 to 12 months. Outperform (2) Expected to appreciate and outperform the Stoxx 600 over the next 12 months. Market Perform (3) Expected to perform generally in line with the Stoxx 600 over the next 12 months. Underperform (4) Expected to underperform the Stoxx 600 or its sector over the next 6 to 12 months. Suspended (S) The rating and target price have been suspended temporarily. This action may be due to market events that made coverage impracticable, or to comply with applicable regulations or firm policies in certain circumstances, including when Raymond James may be providing investment banking services to the company. The previous rating and target price are no longer in effect for this security and should not be relied upon. In transacting in any security, investors should be aware that other securities in the Raymond James research coverage universe might carry a higher or lower rating. Investors should feel free to contact their Financial Advisor to discuss the merits of other available investments.
Rating Distributions
Coverage Universe Rating Distribution* Investment Banking Distribution
RJA RJL RJ LatAm RJ Europe RJA RJL RJ LatAm RJ Europe
Strong Buy and Outperform (Buy) 55% 66% 50% 44% 22% 44% 0% 0%
Market Perform (Hold) 40% 33% 50% 34% 9% 23% 0% 0%
Underperform (Sell) 5% 2% 0% 22% 2% 0% 0% 0%
* Columns may not add to 100% due to rounding.
Suitability Categories (SR)
Total Return (TR) Lower risk equities possessing dividend yields above that of the S&P 500 and greater stability of principal.
Growth (G) Low to average risk equities with sound financials, more consistent earnings growth, at least a small dividend, and the potential for long-term price appreciation.
Aggressive Growth (AG) Medium or higher risk equities of companies in fast growing and competitive industries, with less predictable earnings and acceptable, but possibly more leveraged balance sheets.
High Risk (HR) Companies with less predictable earnings (or losses), rapidly changing market dynamics, financial and competitive issues, higher price volatility (beta), and risk of principal.
Venture Risk (VR) Companies with a short or unprofitable operating history, limited or less predictable revenues, very high risk associated with success, and a substantial risk of principal.

Raymond James Global Research
© 2015 Raymond James & Associates, Inc., member New York Stock Exchange/SIPC. All rights reserved.
International Headquarters: The Raymond James Financial Center | 880 Carillon Parkway | St. Petersburg, Florida 33716 | 800-248-8863 39
Raymond James Relationship Disclosures
Raymond James expects to receive or intends to seek compensation for investment banking services from the subject companies in the next three months.
Stock Charts, Target Prices, and Valuation Methodologies
Valuation Methodology: The Raymond James methodology for assigning ratings and target prices includes a number of qualitative and quantitative factors including an assessment of industry size, structure, business trends and overall attractiveness; management effectiveness; competition; visibility; financial condition, and expected total return, among other factors. These factors are subject to change depending on overall economic conditions or industry- or company-specific occurrences. Only stocks rated Strong Buy (SB1) or Outperform (MO2) have target prices and thus valuation methodologies.
Risk Factors
General Risk Factors: Following are some general risk factors that pertain to the projected target prices included on Raymond James research: (1) Industry fundamentals with respect to customer demand or product / service pricing could change and adversely impact expected revenues and earnings; (2) Issues relating to major competitors or market shares or new product expectations could change investor attitudes toward the sector or this stock; (3) Unforeseen developments with respect to the management, financial condition or accounting policies or practices could alter the prospective valuation; or (4) External factors that affect the U.S. economy, interest rates, the U.S. dollar or major segments of the economy could alter investor confidence and investment prospects. International investments involve additional risks such as currency fluctuations, differing financial accounting standards, and possible political and economic instability.
Additional Risk and Disclosure information, as well as more information on the Raymond James rating system and suitability categories, is available at rjcapitalmarkets.com/Disclosures/index. Copies of research or Raymond James’ summary policies relating to research analyst independence can be obtained by contacting any Raymond James & Associates or Raymond James Financial Services office (please see raymondjames.com for office locations) or by calling 727-567-1000, toll free 800-237-5643 or sending a written request to the Equity Research Library, Raymond James & Associates, Inc., Tower 3, 6
th Floor, 880 Carillon Parkway, St. Petersburg, FL
33716.
For clients in the United Kingdom:
For clients of Raymond James & Associates (London Branch) and Raymond James Financial International Limited (RJFI): This document and any investment to which this document relates is intended for the sole use of the persons to whom it is addressed, being persons who are Eligible Counterparties or Professional Clients as described in the FCA rules or persons described in Articles 19(5) (Investment professionals) or 49(2) (High net worth companies, unincorporated associations etc) of the Financial Services and Markets Act 2000 (Financial Promotion) Order 2005 (as amended) or any other person to whom this promotion may lawfully be directed. It is not intended to be distributed or passed on, directly or indirectly, to any other class of persons and may not be relied upon by such persons and is therefore not intended for private individuals or those who would be classified as Retail Clients.
For clients of Raymond James Investment Services, Ltd.: This report is for the use of professional investment advisers and managers and is not intended for use by clients.
For purposes of the Financial Conduct Authority requirements, this research report is classified as independent with respect to conflict of interest management. RJA, RJFI, and Raymond James Investment Services, Ltd. are authorised and regulated by the Financial Conduct Authority in the United Kingdom.
For clients in France:
This document and any investment to which this document relates is intended for the sole use of the persons to whom it is addressed, being persons who are Eligible Counterparties or Professional Clients as described in “Code Monétaire et Financier” and Règlement Général de l’Autorité des Marchés Financiers. It is not intended to be distributed or passed on, directly or indirectly, to any other class of persons and may not be relied upon by such persons and is therefore not intended for private individuals or those who would be classified as Retail Clients.
For clients of Raymond James Euro Equities: Raymond James Euro Equities is authorised and regulated by the Autorité de Contrôle Prudentiel et de Résolution and the Autorité des Marchés Financiers.
For institutional clients in the European Economic Area (EEA) outside of the United Kingdom:
This document (and any attachments or exhibits hereto) is intended only for EEA institutional clients or others to whom it may lawfully be submitted.

Raymond James Global Research
© 2015 Raymond James & Associates, Inc., member New York Stock Exchange/SIPC. All rights reserved.
International Headquarters: The Raymond James Financial Center | 880 Carillon Parkway | St. Petersburg, Florida 33716 | 800-248-8863 40
For Canadian clients:
This report is not prepared subject to Canadian disclosure requirements, unless a Canadian analyst has contributed to the content of the report. In the case where there is Canadian analyst contribution, the report meets all applicable IIROC disclosure requirements.
Proprietary Rights Notice: By accepting a copy of this report, you acknowledge and agree as follows:
This report is provided to clients of Raymond James only for your personal, noncommercial use. Except as expressly authorized by Raymond James, you may not copy, reproduce, transmit, sell, display, distribute, publish, broadcast, circulate, modify, disseminate or commercially exploit the information contained in this report, in printed, electronic or any other form, in any manner, without the prior express written consent of Raymond James. You also agree not to use the information provided in this report for any unlawful purpose. This is RJA client
releasable resear ch
This report and its contents are the property of Raymond James and are protected by applicable copyright, trade secret or other intellectual property laws (of the United States and other countries). United States law, 17 U.S.C. Sec.501 et seq, provides for civil and criminal penalties for copyright infringement. No copyright claimed in incorporated U.S. government works.