Raw cow milk Chemical “Reference” Methods - icar.org · elaboration for all the ICAR interested...
53
ICAR PROFICIENCY TEST - SEPTEMBER 2017 Chemical “Reference” Methods Raw cow milk
Transcript of Raw cow milk Chemical “Reference” Methods - icar.org · elaboration for all the ICAR interested...

ICAR PROFICIENCY TEST - SEPTEMBER 2017
Chemical “Reference” Methods
Raw cow milk

FRAME OF ACTIVITY :
ICAR MILK ANALYSES SUB-COMMITTEE (MA SC)
ORGANISER: ICAR, VIA SAVOIA 78, I-00198 ROME, ITALY
Email: [email protected].: +39 06 85 237 1

Chemical “Reference” Methods
Raw cow milk
ICAR Proficiency Test (PT) Chemical “Reference” methods – March 2017
1. Introduction
2. Your performances analysis
3. Control Charts
4. ICAR Statistical Elaboration
Fat (reference-chemical methods)
Protein (reference-chemical methods)
Lactose (reference-chemical methods)
Urea (reference-chemical methods)
Somatic Cell (microscopic and fluoro-optoelectronic method)
Table of contents

ICAR Proficiency Test (PT) Chemical “Reference” methods – March 2017
Dear Participant,
Thank you for participating in the ICAR Proficiency Test (PT) September 2017 !
In this report you will find sections 2 and 3 which are dedicated to “your” quality assurance management and section 4 dedicated to the “general” statistical elaboration for each parameter.
The proficiency test is a tool to help evaluate the performance of the laboratory process and to support your laboratory quality assurance system. It’s aim is to provide independent data for you to monitor, evaluate and ultimately improve your processes as you see fit.
From the analyses of the data received we have identified some aspects that if evaluated and managed may serve to improve some control steps of your quality management ISO 17025.
When the PT samples arrive to your laboratory they can be viewed as being from a ‘customer’ that is asking you to provide timely, precise and accurate results.
In tables A,B,C,D,E,F,G,H if all the information is reported correctly from the participant, then the cells are filled in green, otherwise they are highlighted in red for your attention, so you can review and verify any causal reasons internally. The control charts H will help you to follow your performance over the time.
A) In table A you find your participation codes and the information if all the results from the samples received, have been sent to the PT provider.
B) In table B is indicated if the results have been sent on time.
C) In table C is indicated if the results have been reported in the correct unit of measurements.
D) It is the ranking of your laboratory. The values of table 1 for each parameter are reported. In table D the ranking of your lab will be green if the mean of difference and standard deviation of difference value are in the box of figure 2 of each parameter. Limits are only indicative and so far do not constitute standard values; they indicate what is normally reachable by labs for their self evaluation. According the results obtained the MA SC will decide eventually to revise. During the meeting of Milk Analyses Sub Committee held in Copenhagen in June 2016 the experts decided to update the limit of the box to evaluate the accuracy.
E) Here are reported the samples that resulted outlier for your participation code for Grubbs or Cochran test
F) The evaluation of repeatability of the results should be one of the first controls before communication of the data. In table F the absolute difference between replicates is compared with the repeatability limit of the relevant “reference” method indicated. If one or more results have a result out of the limit, the cell is in red. It may be that you have deployed a chemical method that is different from the reference method indicated. If the repeatability is bigger it will be evaluated internally with the precision of the specific method used. You can
Introduction

ICAR Proficiency Test (PT) Chemical “Reference” methods – September 2017
find all the detailed information of your data in Table II in the section Statistical elaboration for each parameter.
G) In table G the results of your Z-ScorePT (standard deviation calculated on this proficiency test) and the Z-ScoreFIX
(standard deviation of the reference method) are summarized. If you have obtained all the -2<Z-Score results<+2 the cell will be filled in green. If you have obtained one or more results in the moderate or poor performance range the cells will be filled in yellow or red respectively.
H) Your ZS Control Charts have been updated with data of the previous ICAR PT if you have participated. On the control charts the samples are ordered by concentration.
The sample preparation and statistical elaboration have been done by ICAR Sub- contractor Actalia, accreditated for ISO 17043.
In the second part of the report the statistical elaboration followed the template approved by ICAR’s Milk Analyses Sub Committee chaired by Dr. Gavin Scott (NZ). You find the statistical elaboration for all the ICAR interested parameters, fat, protein, lactose, urea and somatic cell.
We think it is important to show you, as ICAR member, the reproducibility of the ICAR laboratories, even if you have not participated in this PT round.
For each parameter the SR=standard deviation of reproducibility has been calculated after the outlier elimination. If you have participated, and your results are in the repeatability limits, you can use this value for the calculation of your uncertainty of measurement.
ICAR would like to see, in the next years, part 4 of this report, completed with the results, reference and/or routine methods, from all the ICAR countries for the parameters indicated.
We are sure with your support and contribution it will grow to benefit all!
The list of all ICAR reference laboratories and those participated in ICAR PT in September 2017 with at least one parameter is reported below and also available in ICAR website at:
http://www.icar.org/index.php/certifications/milk-analysis-laboratories-certifications/results-of-the-milk-laboratories-proficiency-test-september-2017/

ICAR Proficiency Test (PT) Chemical “Reference” methods – September 2017
Name of the laboratory Country Comité du Lait ASBL Belgium Department Valorisation des productions Agricoles Belgium ILVO Belgium Can West Canada Central Milk Testing Lab Canada Horizon Lab Ltd Canada Pacific Milk Analysis Canada Valacta - Centre d’Expertise en Production Laitière du Québec Canada COOPRINSEM Chile Dairy Cattle Research Center of Shandong Academy of Agricultural Sciences China Shangai Dairy Breeding Center Co. Ltd China Croatian Agricultural Agency, Central Laboratory for Milk Quality Control Croatia University of Zagreb Faculty of Agriculture Dept. of Dairy Science Croatia Laborator pro rozbor mléka Brno, Ceskomoravská spolecnost chovatelú a.s. Czech Republic Laborator pro rozbor mléka Bustehrad, Ceskomoravská spolecnost chovatelú a.s. Czech Republic Milkom a.s Dairy research institute Czech Republic The National laboratory for raw milk Agrovyzkum Rapotin s.r.o. Czech Republic ChemoMetec A/S Denmark Eurofins Steins Laboratory A/S Denmark

ICAR Proficiency Test (PT) Chemical “Reference” methods – September 2017
Name of the laboratory Country Cattle Information Service (CIS) England Osuuskunta Satamaito, laboratorio Finland Valio Oy/Seinajoen aluelaboratorio Finland Actalia France Milchprüfring Baden-Württemberg e.V. Germany Teagasc Food research Center Ireland Central Milk Lab ICBA Israel Laboratorio Standard Latte Italy Japan Dairy Technical Association Japan Pieno Tyrimai Lithuania Laboratorium Oceny Mleka KCHZ Laboratorium Referecyjne z/s w Parzniewie Poland Alip Portugal LRV-Laboratorio Regional de Veterinaria Portugal Holstein-Ro Breeders Association Laboratory Romania Laboratorija za ispitivanje kvaliteta mleka, Poljoprivredni fakultet Novi Sad Serbia Deltamune South Africa Merieux Nutriscience South Africa South Africa University of Pretoria, Faculty Vet Sciences, Dept. Production Animal Studies Milk Lab. Onderstepoort South Africa Lab Agroalimentario de Santander Spain LIGAL Edificio de Laboratorio Agrarios Spain Eurofins Steins Laboratory A/B Sweden Agroscope Institute for food Sciences IFS Switzerland Suisselab AG Switzerland Taiwan Livestock research Insitute Taiwan Qlip B.V., The Netherlands Direction de l' Amelioration Genetique Tunisia Eastern Lab services USA Vetlab Agricultural Showgrouds Zambia
Attached to this report you find the certificate of your participation in the ICAR PT.-
ICAR would like to stay at your side to support you in any way we can to help improve overall quality management systems for milk analyses. Your active participation in the ICAR PTs and in the Milk Analyses meetings is encouraging. We welcome any and all feedback/comments you may have on this activity, as it will help us continuously improve and to ultimately provide you a better service.
Kind Regards,
ICAR Secretariat


Chemical Reference Methods Laboratory participation codes and Performance analyses
ICAR PT RF0917
Laboratory Name
A
Your participation Codes
SubscriptionFatref Proteinref Lactoseref Urearef SCCref/alt
Yes Yes Yes Yes Yes
Participation Codes 5 5 4 3 4
Are all the sampleresults received? Yes Yes Yes Yes Yes
B Data results received on timeNo 18-09-2017
C
Have you sent the data with the correct units of measurements?
Fatref Protein*ref Lactoseref Urearef SCCref/alt
g/100g nitrogen g/100g g/100g mg/dl SCC*1000/ml
Yes Yes Yes Yes Yes
* It was requested to report the value in total nitrogen
D
Ranking of your lab
Fatref Protein*ref Lactoseref Urearef SCCref/alt
g/100g nitrogen g/100g g/100g mg/dl SCC*1000/ml
Code 5 5 4 3 4
% 69 69 80 60 45%
d -0.001 0.012 0.059 1.231 -14%
Sd 0.019 0.020 0.098 0.392 11%
D 0.019 0.023 0.115 1.292 18%
Method ISO 1211|IDF 1 ISO8968|IDF20 ISO26642|IDF214 ISO14637|IDF195 ISO13366-2|IDF148-2
Limits
d 0,020 0,025 0,10 2,5 10%
Sd 0,030 0,020 0,10 1,5 10%
E
Outliers
Fatref Protein*ref Lactoseref Urearef SCCref/alt
g/100g nitrogen g/100g g/100g mg/dl SCC*1000/ml
Sample 1 Cochran Cochran
Sample 2 Cochran
Sample 3 Cochran
Sample 4 Cochran
Sample 5 Cochran
Sample 6
Sample 7
Sample 8
Sample 9
Sample 10

Level r
150 25
300 42
450 51
750 64
1500 126
F
RepeatabilityYour "r" performance
Fat Protein Lactose Urea SCC
g/100g nitrogen g/100g g/100g mg/dl SCC*1000/ml
Sample 1 0.010 0.070 0.077 0.660 2
Sample 2 0.010 0.007 0.056 0.430 19
Sample 3 0.010 0.049 0.003 0.030 20
Sample 4 0.010 0.085 0.016 0.160 2
Sample 5 0.010 0.073 0.021 0.690 11
Sample 6 0.000 0.021 0.012 0.070 42
Sample 7 0.010 0.002 0.023 0.730 0.000
Sample 8 0.010 0.031 0.025 1.320 1
Sample 9 0.010 0.021 0.038 0.520 3
Sample 10 0.020 0.004 0.013 0.330 4
If the repeatability in smaller than the limit the cell is in green if there is a sample with a "r" bigger than the limit the cell is in red. Please check table II incorrespondence of the parameter and your lab code.
Limits
Fat Protein Lactose Urea SCC
g/100g g/100g g/100g mg/dl SCC*1000/ml
ISO 1211 IDF 1D
ISO 8968 IDF 20
ISO 22662 IDF 198
ISO 14637 IDF 195
ISO 13366-2 IDF 148-2
0,043 0,038 0,06 1,52
G
Your Z-Score PT
Fat Protein Lactose Urea SCC
Sample 1 -0.294 0.223 -1.127 1.367 -0.90
Sample 2 1.745 -1.234 -1.139 1.380 -0.56
Sample 3 -0.517 2.406 0.456 1.290 -0.73
Sample 4 -0.180 1.474 1.162 0.970 -0.62
Sample 5 -0.348 1.937 0.668 0.559 -0.62
Sample 6 1.505 0.477 1.595 1.052 -0.69
Sample 7 -2.230 0.223 1.824 0.971 -0.55
Sample 8 -0.478 0.022 0.873 1.242 -0.55
Sample 9 -0.786 -0.043 1.264 1.270 -0.79
Sample 10 -0.213 0.997 2.400 1.900 -0.68
Your Z-Score Fix
Fat Protein Lactose Urea SCC
Sample 1 -0.117 0.267 -1.250 0.912 -2.26
Sample 2 2.022 -1.333 -3.545 0.786 -1.95
Sample 3 -0.182 2.588 0.992 0.673 -1.96
Sample 4 -0.100 1.440 1.493 0.907 -1.65
Sample 5 -0.175 1.796 1.695 0.324 -1.87
Sample 6 0.729 0.437 2.620 0.814 -2.34
Sample 7 -1.711 0.190 2.686 0.404 -1.79
Sample 8 -0.268 0.034 2.600 0.880 -2.15
Sample 9 -0.411 -0.074 2.444 0.474 -2.08
Sample 10 -0.180 1.122 2.825 0.628 -2.35
If there is a sample with a "z-score" in the yellow or red area please check table VI and VII in correspondence of your lab code.
Interpretation Z-Score
Z-Score<-3 -3<Z-Score<-2 -2<Z-Score<2 2<Z-Score<3 Z-Score>3
Poor Moderate Good Moderate Poor

ZSCORE-PT - fat_ref ZSCORE-FIX - fat_ref
ZSCORE-PT - protein_ref ZSCORE-FIX - protein_ref
ZSCORE-PT - lactose_ref ZSCORE-FIX - lactose_ref
RF0917RF0317RF0916
-4
-2
0
2
4 RF0917RF0317RF0916
-4
-2
0
2
4
RF0917RF0317RF0916
-4
-2
0
2
4 RF0917RF0317RF0916
-4
-2
0
2
4
RF0917RF0317RF0916
-4
-2
0
2
4 RF0917RF0317RF0916
-4
-2
0
2
4

ZSCORE-PT - urea_ref ZSCORE-FIX - urea_ref
ZSCORE-PT - scc_ref ZSCORE-FIX - scc_ref
RF0917RF0317RF0916
-4
-2
0
2
4 RF0917RF0317RF0916
-4
-2
0
2
4
RF0917RF0317RF0916
-4
-2
0
2
4 RF0917RF0317RF0916
-4
-2
0
2
4

DETERMINATION of FAT in RAW (cow) MILK - page 1/8
ICAR
PROFICIENCY TESTING SCHEME
---------
September 2017
Raw Milk
Determination of FAT CONTENT
Röse Gottlieb method
Sending date of statistical treatment : 9th October 2017
Frame of activity : ICAR Milk Analyses Sub Committee (MA SC)
Contact : Gavin Scott [email protected]
ICAR Staff Silvia Orlandini [email protected] [email protected]
Proficiency test accreditated ISO 17043
ACCRÉDITATION
N° 1-2473
PORTÉE
DISPONIBLE SUR
WWW.COFRAC.FR

DETERMINATION of FAT in RAW (cow) MILK - page 1/8 DETERMINATION of FAT in RAW (cow) MILK - page 2/8
Table I : Ranking of the laboratories Units : g / 100 g
Nb % N° d Sd D MethodThe table should be studied in parallel with figure 1 where the
1 6 12 - 0,000 0,004 0,004 A laboratories are located according to an acceptability area (or target)
2 13 11 - 0,001 0,005 0,005 A the limits of which are :
3 19 15 + 0,003 0,004 0,005 A
4 25 2 + 0,002 0,005 0,005 A
5 31 9 - 0,003 0,005 0,006 A _
6 38 14 - 0,002 0,006 0,006 A +/- 0,020 g / 100 g for d and 0,030 g / 100 g for Sd
7 44 13 - 0,003 0,008 0,009 A
8 50 3 + 0,009 0,004 0,010 A
9 56 10 - 0,002 0,011 0,011 A REF : Assigned values are robust average values per sample according to
10 63 8 + 0,007 0,010 0,012 A algorithm A of standard ISO 13528, of 16 laboratories using the reference
11 69 5 - 0,001 0,019 0,019 A method ISO 1211│IDF 1, after outliers discarging using Grubbs test
12 75 6 - 0,006 0,021 0,022 B at 5% risk level,
13 81 4 - 0,026 0,031 0,041 A
14 88 16 - 0,037 0,023 0,044 A A ISO 1211 IDF 1D Röse Gottlieb Method
15 94 7 + 0,048 0,089 0,101 A B ISO 2446 / IDF 226 Gerber method
16 100 1 + 0,059 0,159 0,170 A
(NC : OUT of RANKING because of insufficient data number)
(Nb : laboratory rank; % : relative rank)
(N° : laboratory identification number)
(d et Sd : mean and standard deviation of the differences (laboratory -reference))
(D : Euclidian distance to YX-axis origin = SQUARE ROOT.(d² + Sd²))
Note : Limits are only indicative and so far do not constitute standard values; they indicate what is normally
reachable by labs for their self evaluation.
Repeatability standard deviation of this ICAR proficiency test (after Cochran elimination at 5 %) SrPT 0,007
Reproducibility standard deviation of this ICAR proficiency test (after Cochran and Grubbs elimination at 5 %) SRPT 0,014
ICAR Proficiency Test September 2017

DETERMINATION of FAT in RAW (cow) MILK - page 2/8 DETERMINATION of FAT in RAW (cow) MILK - page 3/8
Table II : REPEATABILITY - Absolute difference between replicates in g / 100 g
Sample Lab
code1 2 3 4 5 6 7 8 9 10 Sr NL
1 0,006 0,005 0,002 0,004 1,000 * 0,014 0,006 0,003 0,003 0,002 0,224 20
2 0,012 0,017 0,002 0,002 0,019 0,000 0,001 0,000 0,013 0,020 0,008 20
3 0,002 0,002 0,001 0,003 0,001 0,001 0,000 0,001 0,003 0,001 0,001 20
4 0,003 0,015 0,019 0,002 0,021 0,005 0,006 0,003 0,022 0,004 0,009 20
5 0,010 0,010 0,010 0,010 0,010 0,000 0,010 0,010 0,010 0,020 0,008 20
6 0,030 0,020 0,000 0,020 0,000 0,020 0,010 0,010 0,010 0,000 0,011 20
7 0,025 0,008 0,027 0,007 0,002 0,008 0,014 0,002 0,006 0,014 0,010 20
8 0,003 0,013 0,011 0,003 0,001 0,011 0,007 0,006 0,000 0,003 0,005 20
9 0,000 0,006 0,006 0,004 0,004 0,000 0,011 0,001 0,000 0,001 0,003 20
10 ** ** ** 0,013 0,011 0,009 0,002 0,015 0,012 0,004 0,007 14
11 0,013 0,012 0,018 0,002 0,007 0,010 0,006 0,003 0,013 0,000 0,007 20
12 0,000 0,003 0,001 0,001 0,010 0,016 0,013 0,013 0,006 0,007 0,006 20
13 0,014 0,013 0,006 0,010 0,006 0,014 0,007 0,007 0,000 0,005 0,007 20
14 0,005 0,005 0,006 0,006 0,002 0,003 0,006 0,002 0,002 0,005 0,003 20
15 0,008 ** 0,000 0,008 0,003 0,000 0,011 0,010 0,002 0,013 0,005 18
16 0,046 * 0,021 0,010 0,017 0,007 0,019 0,004 0,003 0,008 0,012 0,013 20
Sr 0,012 0,009 0,008 0,006 0,177 0,008 0,006 0,005 0,006 0,007 312
NE 30 28 30 32 32 32 32 32 32 32
L 0,033 0,032 0,030 0,024 0,025 0,029 0,022 0,019 0,025 0,026
Sr : repeatability standard deviation of each laboratory limit 0,016 g/100g
NL : number of measurements per laboratory
L : Limit for difference between duplicates according Cochran test at 5% level.
SE : repeatability standard deviation per sample
NE : number of measurements per sample
*: discarded data using the test of Cochran at 5 %
** : missing data
r : limit of repeatability, absolute difference betwen two replicates=0,043 according ISO 1211 IDF 1D 2010
ICAR Proficiency Test September 2017

DETERMINATION of FAT in RAW (cow) MILK - page 3/8 DETERMINATION of FAT in RAW (cow) MILK - page 4/8
Table III : Means of the replicates in g / 100 g
Sample Lab
code1 2 3 4 5 6 7 8 9 10
1 4,742 4,123 3,480 2,750 2,640 * 4,459 3,752 3,091 1,501 2,456
2 4,757 4,113 3,466 2,737 2,137 4,465 3,737 3,080 1,473 2,455
3 4,760 4,120 3,477 2,746 2,138 4,471 3,746 3,091 1,486 2,456
4 4,739 4,080 3,467 2,724 2,120 4,356 * 3,720 3,053 1,471 2,407
5 4,755 4,145 3,465 2,735 2,125 4,480 3,705 3,075 1,465 2,440
6 4,725 * 4,090 3,480 2,710 2,120 4,460 3,775 3,095 1,455 2,430
7 5,038 * 4,218 * 3,500 * 2,745 2,151 4,463 3,738 3,083 1,473 2,469
8 4,761 4,099 3,458 2,751 2,142 4,487 3,745 3,092 1,484 2,450
9 4,762 4,106 3,470 2,740 2,124 4,463 3,730 3,080 1,464 2,435
10 2,733 2,121 4,451 3,752 3,069 1,471 2,457
11 4,761 4,115 3,466 2,739 2,129 4,458 3,736 3,079 1,469 2,439
12 4,762 4,105 3,463 2,737 2,128 4,460 3,740 3,078 1,479 2,446
13 4,758 4,104 3,471 2,721 2,119 4,477 3,745 3,068 1,469 2,438
14 4,753 4,098 3,460 2,734 2,119 4,468 3,739 3,089 1,476 2,448
15 4,763 3,471 2,744 2,137 4,462 3,744 3,085 1,479 2,441
16 4,682 * 4,048 3,426 * 2,681 * 2,091 * 4,424 * 3,727 3,070 1,468 2,407
M 4,756 4,103 3,469 2,736 2,129 4,466 3,739 3,080 1,474 2,442
REF. 4,757 4,105 3,469 2,737 2,128 4,465 3,739 3,080 1,473 2,444
SD 0,008 0,023 0,007 0,011 0,010 0,010 0,015 0,011 0,010 0,017
M = mean per sample REF. = reference values
SD = standard deviation per sample *: discarded data using the test of Grubbs at 5 %
REF : Assigned values are robust average values per sample according to algorithm A of standard ISO 13528,
of 16 laboratories using the reference method ISO 1211│IDF 1, after outliers discarging using Grubbs test at 5 % risk level.
Table IV : Outlier identification
Sample 1 2 3 4 5 6 7 8 9 10
Outliers
Cochran
Outlier
Grubbs
sr 0,006 0,009 0,006 0,006 0,007 0,007 0,006 0,005 0,006 0,007
SR 0,009 0,024 0,008 0,012 0,011 0,011 0,016 0,012 0,011 0,018
ICAR Proficiency Test September 2017
16
16 4; 16
1
6; 7;
167 7; 16 7; 16

DETERMINATION of FAT in RAW (cow) MILK - page 4/8 DETERMINATION of FAT in RAW (cow) MILK - page 5/8
Table V : ACCURACY - differences (laboratory - reference) in g / 100 g
Sample Lab
code1 2 3 4 5 6 7 8 9 10 d Sdlab t
1 - 0,015 + 0,018 + 0,011 + 0,013 + 0,512 - 0,006 + 0,013 + 0,010 + 0,027 + 0,012 + 0,059 0,159 1,18
2 - 0,000 + 0,008 - 0,003 + 0,000 + 0,008 - 0,000 - 0,003 - 0,000 - 0,001 + 0,011 + 0,002 0,005 1,25
3 + 0,003 + 0,015 + 0,008 + 0,009 + 0,009 + 0,005 + 0,007 + 0,010 + 0,012 + 0,012 + 0,009 0,004 7,64
4 - 0,019 - 0,025 - 0,002 - 0,013 - 0,009 - 0,110 - 0,019 - 0,028 - 0,002 - 0,037 - 0,026 0,031 2,66
5 - 0,002 + 0,040 - 0,004 - 0,002 - 0,003 + 0,015 - 0,034 - 0,005 - 0,008 - 0,004 - 0,001 0,019 0,13
6 - 0,032 - 0,015 + 0,011 - 0,027 - 0,008 - 0,005 + 0,036 + 0,015 - 0,018 - 0,014 - 0,006 0,021 0,88
7 + 0,280 + 0,113 + 0,031 + 0,008 + 0,023 - 0,002 - 0,001 + 0,003 - 0,000 + 0,025 + 0,048 0,089 1,71
8 + 0,003 - 0,006 - 0,011 + 0,014 + 0,013 + 0,021 + 0,005 + 0,012 + 0,011 + 0,006 + 0,007 0,010 2,21
9 + 0,005 + 0,001 + 0,001 + 0,003 - 0,004 - 0,002 - 0,010 - 0,001 - 0,009 - 0,009 - 0,003 0,005 1,49
10 - 0,004 - 0,008 - 0,015 + 0,013 - 0,012 - 0,002 + 0,013 - 0,002 0,011 0,51
11 + 0,003 + 0,010 - 0,003 + 0,002 + 0,000 - 0,007 - 0,003 - 0,002 - 0,005 - 0,005 - 0,001 0,005 0,55
12 + 0,004 + 0,001 - 0,006 + 0,000 - 0,001 - 0,005 + 0,000 - 0,002 + 0,005 + 0,003 - 0,000 0,004 0,07
13 + 0,001 - 0,001 + 0,002 - 0,016 - 0,009 + 0,012 + 0,005 - 0,013 - 0,004 - 0,006 - 0,003 0,008 1,11
14 - 0,005 - 0,007 - 0,009 - 0,003 - 0,009 + 0,002 - 0,000 + 0,009 + 0,003 + 0,004 - 0,002 0,006 0,84
15 + 0,006 + 0,002 + 0,007 + 0,008 - 0,003 + 0,004 + 0,005 + 0,006 - 0,003 + 0,003 0,004 2,51
16 - 0,076 - 0,056 - 0,043 - 0,056 - 0,038 - 0,041 - 0,012 - 0,011 - 0,005 - 0,036 - 0,037 0,023 5,24
d - 0,001 - 0,001 - 0,000 - 0,001 + 0,001 + 0,000 + 0,000 - 0,001 + 0,001 - 0,002 + 0,003 0,051
Sd 0,008 0,023 0,007 0,011 0,010 0,010 0,015 0,011 0,010 0,017 0,013
d = mean of differences Sd = standard deviation of differences t = Student test - comparison to 0
_
Upper limits : d = +/- 0,02 g / 100 g Sd = 0,03 g / 100g
ISO 1211│IDF 1 : Precision of the method : Sr = 0.016 g / 100 g
SR = 0.020 g / 100 g
ICAR Proficiency Test September 2017

DETERMINATION of FAT in RAW (cow) MILK - page 5/8 DETERMINATION of FAT in RAW (cow) MILK - page 6/8
Table VI : Zscore of the different laboratories for each sample.
ZS calculated on the PT standard deviation
Sample Lab
code 1 2 3 4 5 6 7 8 9 10
1 -1,93 +0,77 +1,61 +1,17 +50,93 -0,66 +0,83 +0,90 +2,61 +0,74
2 -0,04 +0,34 -0,37 +0,00 +0,80 -0,04 -0,18 -0,03 -0,07 +0,68
3 +0,33 +0,67 +1,11 +0,77 +0,90 +0,52 +0,44 +0,90 +1,18 +0,71
4 -2,37 -1,08 -0,30 -1,17 -0,90 -11,35 -1,25 -2,49 -0,21 -2,17
5 -0,29 +1,74 -0,52 -0,18 -0,35 +1,51 -2,23 -0,48 -0,79 -0,21
6 -4,07 -0,63 +1,61 -2,43 -0,85 -0,56 +2,33 +1,31 -1,74 -0,81
7 +35,25 +4,89 +4,38 +0,68 +2,24 -0,25 -0,08 +0,24 -0,02 +1,51
8 +0,40 -0,26 -1,58 +1,22 +1,30 +2,18 +0,34 +1,04 +1,03 +0,35
9 +0,59 +0,06 +0,19 +0,27 -0,45 -0,25 -0,63 -0,08 -0,88 -0,5410 -0,41 -0,80 -1,54 +0,83 -1,06 -0,21 +0,79
11 +0,40 +0,45 -0,37 +0,18 +0,00 -0,77 -0,21 -0,17 -0,45 -0,27
12 +0,56 +0,03 -0,82 +0,01 -0,08 -0,55 +0,02 -0,21 +0,51 +0,16
13 +0,08 -0,05 +0,33 -1,44 -0,94 +1,20 +0,34 -1,15 -0,40 -0,36
14 -0,61 -0,30 -1,23 -0,27 -0,94 +0,21 -0,01 +0,77 +0,27 +0,23
15 +0,71 +0,33 +0,63 +0,80 -0,35 +0,28 +0,41 +0,55 -0,1816 -9,51 -2,43 -6,04 -5,03 -3,74 -4,26 -0,80 -0,95 -0,50 -2,15
In yellow the values bigger or smaller than 2/-2 In red the values bigger or smaller than 3/-3
Figure 2 :
Zscore of the different laboratories for each sample. ZS calculated on the PT standard deviation
ICAR Proficiency Test September 2017
-5
-4
-3
-2
-1
0
1
2
3
4
5
1 2 3 4 5 6 7 8 9 10 11 12 13 14 15 16Z sc
ore
PT
Laboratory code
sample1
sample2
sample 3
sample 4
sample 5
sample 6
sample 7
sample 8
sample 9
sample 10

DETERMINATION of FAT in RAW (cow) MILK - page 6/8 DETERMINATION of FAT in RAW (cow) MILK - page 7/8
Table VII : Zscore of the different laboratories for each sample.
ZS calculated on the standard deviation of reproducibility of the method
Sample Lab
code 1 2 3 4 5 6 7 8 9 10
1 -0,77 +0,90 +0,57 +0,65 +25,58 -0,32 +0,64 +0,51 +1,36 +0,62
2 -0,02 +0,40 -0,13 +0,00 +0,40 -0,02 -0,14 -0,02 -0,04 +0,57
3 +0,13 +0,77 +0,39 +0,43 +0,45 +0,25 +0,34 +0,51 +0,61 +0,60
4 -0,94 -1,25 -0,11 -0,65 -0,45 -5,50 -0,96 -1,39 -0,11 -1,83
5 -0,12 +2,02 -0,18 -0,10 -0,17 +0,73 -1,71 -0,27 -0,41 -0,18
6 -1,62 -0,73 +0,57 -1,35 -0,42 -0,27 +1,79 +0,73 -0,91 -0,68
7 +14,01 +5,67 +1,54 +0,38 +1,13 -0,12 -0,06 +0,13 -0,01 +1,27
8 +0,16 -0,30 -0,56 +0,68 +0,65 +1,05 +0,26 +0,58 +0,54 +0,30
9 +0,23 +0,07 +0,07 +0,15 -0,22 -0,12 -0,49 -0,04 -0,46 -0,4510 -0,22 -0,40 -0,75 +0,64 -0,59 -0,11 +0,67
11 +0,16 +0,52 -0,13 +0,10 +0,00 -0,37 -0,16 -0,09 -0,24 -0,23
12 +0,22 +0,03 -0,29 +0,00 -0,04 -0,27 +0,02 -0,12 +0,26 +0,14
13 +0,03 -0,05 +0,12 -0,80 -0,47 +0,58 +0,26 -0,64 -0,21 -0,30
14 -0,24 -0,35 -0,43 -0,15 -0,47 +0,10 -0,01 +0,43 +0,14 +0,20
15 +0,28 +0,12 +0,35 +0,40 -0,17 +0,21 +0,23 +0,29 -0,1516 -3,78 -2,81 -2,13 -2,79 -1,88 -2,06 -0,62 -0,53 -0,26 -1,81
This table will allows to compare your ZSCORE from one PT to an other because the standard deviation
has always the value of SR of the method SR=0,02
In yellow the values bigger or smaller than 2/-2 In red the values bigger or smaller than 3/-3
Figure 3 :
Zscore of the different laboratories for each sample. ZS calculated on the standard deviation of reproducibility of the method
ICAR Proficiency Test September 2017
-5
-4
-3
-2
-1
0
1
2
3
4
5
1
Z sc
ore
Fix
Laboratory code
sample1
sample2
sample 3
sample 4
sample 5
sample 6
sample 7
sample 8
sample 9
sample 10
-5
-4
-3
-2
-1
0
1
2
3
4
5
1 2 3 4 5 6 7 8 9 10 11 12 13 14 15 16
Z sc
ore
Fix
Laboratory code
sample1 sample2
sample 3 sample 4
sample 5 sample 6
sample 7 sample 8
sample 9 sample 10
DETERMINATION of FAT in RAW (cow) MILK - page 7/8 DETERMINATION of FAT in RAW (cow) MILK - page 8/8
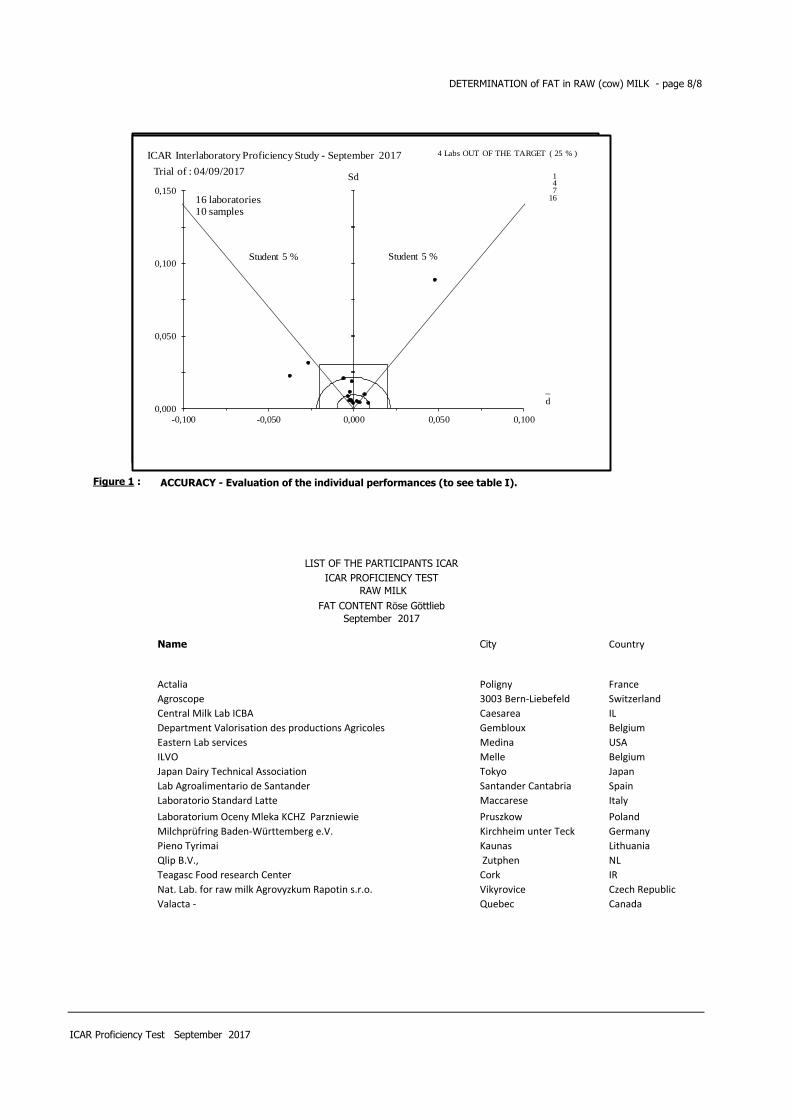
Figure 1 : ACCURACY - Evaluation of the individual performances (to see table I).
LIST OF THE PARTICIPANTS ICAR
ICAR PROFICIENCY TEST
RAW MILK
FAT CONTENT Röse Göttlieb
September 2017
Name City Country
Actalia Poligny France
Agroscope 3003 Bern-Liebefeld Switzerland
Central Milk Lab ICBA Caesarea IL
Department Valorisation des productions Agricoles Gembloux Belgium
Eastern Lab services Medina USA
ILVO Melle Belgium
Japan Dairy Technical Association Tokyo Japan
Lab Agroalimentario de Santander Santander Cantabria Spain
Laboratorio Standard Latte Maccarese Italy
Laboratorium Oceny Mleka KCHZ Parzniewie Pruszkow Poland
Milchprüfring Baden-Württemberg e.V. Kirchheim unter Teck Germany
Pieno Tyrimai Kaunas Lithuania
Qlip B.V., Zutphen NL
Teagasc Food research Center Cork IR
Nat. Lab. for raw milk Agrovyzkum Rapotin s.r.o. Vikyrovice Czech Republic
Valacta - Quebec Canada
ICAR Proficiency Test September 2017
0,000
0,050
0,100
0,150
-0,100 -0,050 0,000 0,050 0,100
Sd
Student 5 % Student 5 %
_
d
Trial of : 04/09/2017
16 laboratories
10 samples
4 Labs OUT OF THE TARGET ( 25 % )
1 4 7
16
ICAR Interlaboratory Proficiency Study - September 2017
0,000
0,050
0,100
0,150
-0,100 -0,050 0,000 0,050 0,100
Sd
Student 5 % Student 5 %
_
d
Trial of : 04/09/2017
16 laboratories 10 samples
4 Labs OUT OF THE TARGET ( 25 % )
1 4 7
16
ICAR Interlaboratory Proficiency Study - September 2017

DETERMINATION of CRUDE PROTEINin RAW (cow) MILK - page 1/8
ICAR
PROFICIENCY TESTING SCHEME
---------
September 2017
Raw Milk
Determination of CRUDE PROTEIN CONTENT
KJELDAHL Method
Sending date of statistical treatment : 9th October 2017
Frame of activity : ICAR Milk Analyses Sub Committee (MA SC)
Contact : Gavin Scott [email protected]
ICAR Staff Silvia Orlandini [email protected] [email protected]
Proficiency test accreditated ISO 17043
ACCRÉDITATION
N° 1-2473
PORTÉE
DISPONIBLE SUR
WWW.COFRAC.FR

DETERMINATION of CRUDE PROTEINin RAW (cow) MILK - page 1/8 DETERMINATION of CRUDE PROTEINin RAW (cow) MILK - page 2/8
Table I : Ranking of the laboratories Units : g / 100 g
Nb % N° d Sd DThe table should be studied in parallel with figure 1 where the
1 6 2 + 0,002 0,005 0,006 laboratories are located according to an acceptability area (or target)
2 13 7 + 0,004 0,008 0,008 the limits of which are :
3 19 9 - 0,007 0,006 0,009
4 25 10 - 0,008 0,007 0,011
5 31 8 - 0,011 0,008 0,014 _
6 38 11 + 0,010 0,013 0,016 +/- 0,025 g / 100 g for d and 0,020 g / 100 g for Sd
7 44 4 - 0,017 0,008 0,019
8 50 14 + 0,019 0,008 0,021
9 56 1 + 0,002 0,022 0,022 REF : Assigned values are robust average values per sample according to
10 63 12 - 0,017 0,014 0,022 algorithm A of standard ISO 13528, of 15 laboratories using the reference
11 69 5 + 0,012 0,020 0,023 method (ISO 8968-1│IDF 20-1), after outlier discarging using Grubbs test at
12 75 13 - 0,008 0,022 0,024 5% risk level
13 81 15 + 0,023 0,012 0,026
14 88 6 + 0,011 0,026 0,028
15 94 16 - 0,050 0,031 0,059
16 100 3 - 0,054 0,201 0,208
(NC : OUT of RANKING because of insufficient data number)
(Nb : laboratory rank; % : relative rank)
(N° : laboratory identification number)
(d et Sd : mean and standard deviation of the differences (laboratory -reference))
(D : Euclidian distance to YX-axis origin = SQUARE ROOT.(d² + Sd²))
Note : Limits are only indicative and so far do not constitute standard values; they indicate what is normally
reachable by labs for their self evaluation.
Repeatability standard deviation of this ICAR proficiency test (after Cochran elimination at 5 %) SrPT 0,007
Reproducibility standard deviation of this ICAR proficiency test (after Cochran and Grubbs elimination at 5 %) SRPT 0,021
ICAR Proficiency Test September 2017

DETERMINATION of CRUDE PROTEINin RAW (cow) MILK - page 2/8 DETERMINATION of CRUDE PROTEINin RAW (cow) MILK - page 3/8
Table II : REPEATABILITY - Absolute difference between replicates in g / 100 g
Sample Lab
code1 2 3 4 5 6 7 8 9 10 Sr NL
1 0,001 0,001 0,001 0,000 0,001 0,008 0,008 0,002 0,003 0,002 0,003 20
2 0,010 0,006 0,001 0,001 0,000 0,001 0,001 0,000 0,008 0,003 0,003 20
3 0,006 0,006 0,006 0,006 0,006 0,000 0,006 0,000 0,006 0,000 0,004 20
4 0,012 0,009 0,011 0,002 0,008 0,009 0,000 0,006 0,015 0,002 0,006 20
5 0,070 * 0,007 0,049 * 0,085 * 0,073 * 0,021 0,002 0,031 0,021 0,004 0,033 20
6 0,002 0,048 * 0,018 0,057 * 0,005 0,093 * 0,004 0,009 0,004 0,053 * 0,030 20
7 0,006 0,007 0,004 0,003 0,013 0,009 0,027 0,001 0,010 0,020 0,009 20
8 0,003 0,002 0,021 0,017 0,008 0,006 0,016 0,007 0,000 0,001 0,008 20
9 0,004 0,006 0,003 0,002 0,008 0,004 0,005 0,006 0,005 0,003 0,004 20
10 0,015 0,006 0,002 0,003 0,009 0,012 0,000 0,003 0,007 0,005 0,005 20
11 0,008 0,006 0,001 0,006 0,006 0,006 0,015 0,001 0,003 0,000 0,005 20
12 0,003 0,013 0,002 0,010 0,004 0,001 0,011 0,008 0,026 0,008 0,008 20
13 0,033 * 0,008 0,017 0,014 0,000 0,013 0,006 0,011 0,002 0,005 0,010 20
14 0,002 0,001 0,005 0,008 0,004 0,002 0,004 0,006 0,008 0,003 0,003 20
15 0,006 0,006 0,024 0,010 0,012 0,011 0,001 0,034 0,003 0,017 0,011 20
16 0,010 0,014 0,065 * 0,005 0,006 0,102 * 0,027 0,003 0,002 0,030 * 0,029 20
Sr 0,014 0,010 0,016 0,019 0,014 0,025 0,008 0,009 0,007 0,012 320
NE 32 32 32 32 32 32 32 32 32 32
L 0,020 0,020 0,030 0,021 0,019 0,024 0,032 0,034 0,028 0,021
Sr : repeatability standard deviation of each laboratory limit 0,014 g /100g
NL : number of measurements per laboratory
L : Limit for difference between duplicates according Cochran test at 5% level.
SE : repeatability standard deviation per sample
NE : number of measurements per sample
*: discarded data using the test of Cochran at 5 %
** : missing data
r : limit of repeatability, absolute difference betwen two replicates=0,040 according ISO 8968 / IDF 20
ICAR Proficiency Test September 2017

DETERMINATION of CRUDE PROTEINin RAW (cow) MILK - page 3/8 DETERMINATION of CRUDE PROTEINin RAW (cow) MILK - page 4/8
Table III : Means of the replicates in g / 100 g
(*) : Data have been modified in right units.
Sample Lab
code1 2 3 4 5 6 7 8 9 10
(*) 1 3,817 3,593 3,316 2,973 2,792 3,717 3,518 3,161 3,294 2,890
2 3,798 3,611 3,322 2,951 2,766 3,720 3,536 3,150 3,347 2,871
3 3,825 3,627 3,327 2,964 2,772 3,720 3,531 3,152 2,715 * 2,877
4 3,774 3,589 3,319 2,926 2,745 3,700 3,508 3,131 3,336 2,853
5 3,800 3,583 3,372 2,979 2,801 3,719 3,531 3,150 3,338 2,897
6 3,806 3,629 3,343 2,924 2,784 3,689 3,530 3,214 3,356 2,890
7 3,800 3,625 3,325 2,954 2,764 3,711 3,526 3,149 3,355 2,881
8 3,795 3,602 3,306 2,943 2,745 3,700 3,505 3,141 3,333 2,867
9 3,792 3,612 3,320 2,946 2,758 3,699 3,514 3,136 3,337 2,870
10 3,778 3,606 3,323 2,949 2,761 3,690 3,514 3,138 3,340 2,872
11 3,803 3,620 3,326 2,955 2,766 3,719 3,542 3,151 3,355 2,918
12 3,783 3,596 3,318 2,935 2,755 3,703 3,515 3,135 3,283 2,857
13 3,758 3,578 3,287 2,947 2,762 3,695 3,543 3,159 3,366 2,882
14 3,823 3,639 3,348 2,966 2,778 3,733 3,548 3,165 3,364 2,882
15 3,798 3,620 3,344 2,982 2,788 3,750 3,556 3,188 3,373 2,885
16 3,747 3,576 3,311 2,879 * 2,700 * 3,723 3,438 * 3,081 3,268 2,828
M 3,793 3,607 3,325 2,953 2,769 3,712 3,528 3,150 3,336 2,876
REF. 3,795 3,607 3,325 2,953 2,769 3,711 3,528 3,150 3,340 2,877
SD 0,022 0,019 0,019 0,018 0,017 0,016 0,015 0,028 0,031 0,020
M = mean per sample REF. = reference values
SD = standard deviation per sample *: discarded data using the test of Grubbs 5 %
REF : Assigned values are robust average values per sample according to algorithm A of standard ISO 13528,
of 15 laboratories using the reference method ISO 8968-1│IDF 20-1, after outliers discarging using Grubbs test at 5 % risk level.
Table IV : Outlier identification
Sample 1 2 3 4 5 6 7 8 9 10
Outliers
Cochran
Outlier
Grubbs
sr 0,005 0,005 0,008 0,006 0,005 0,007 0,007 0,009 0,007 0,006
SR 0,021 0,020 0,017 0,016 0,015 0,017 0,016 0,029 0,032 0,017
ICAR Proficiency Test September 2017
6; 165; 13 6 5; 16 5; 6 5 6; 16
16 316 16

DETERMINATION of CRUDE PROTEINin RAW (cow) MILK - page 4/8 DETERMINATION of CRUDE PROTEINin RAW (cow) MILK - page 5/8
Table V : ACCURACY - differences (laboratory - reference) in g / 100 g
Sample Lab
code1 2 3 4 5 6 7 8 9 10 d Sdlab t
1 + 0,023 - 0,013 - 0,008 + 0,020 + 0,023 + 0,006 - 0,010 + 0,011 - 0,046 + 0,013 + 0,002 0,022 0,27
2 + 0,003 + 0,004 - 0,003 - 0,002 - 0,003 + 0,009 + 0,009 + 0,000 + 0,007 - 0,006 + 0,002 0,005 1,21
3 + 0,030 + 0,020 + 0,002 + 0,011 + 0,003 + 0,009 + 0,004 + 0,002 - 0,625 + 0,001 - 0,054 0,201 0,86
4 - 0,021 - 0,018 - 0,006 - 0,027 - 0,024 - 0,010 - 0,020 - 0,019 - 0,003 - 0,024 - 0,017 0,008 6,87
5 + 0,005 - 0,024 + 0,047 + 0,026 + 0,032 + 0,008 + 0,003 + 0,001 - 0,001 + 0,020 + 0,012 0,020 1,84
6 + 0,011 + 0,022 + 0,018 - 0,029 + 0,015 - 0,022 + 0,003 + 0,065 + 0,017 + 0,013 + 0,011 0,026 1,39
7 + 0,005 + 0,019 - 0,000 + 0,001 - 0,005 - 0,000 - 0,002 - 0,000 + 0,016 + 0,004 + 0,004 0,008 1,55
8 + 0,001 - 0,005 - 0,018 - 0,009 - 0,024 - 0,011 - 0,023 - 0,008 - 0,007 - 0,010 - 0,011 0,008 4,60
9 - 0,003 + 0,006 - 0,004 - 0,007 - 0,011 - 0,012 - 0,013 - 0,013 - 0,002 - 0,007 - 0,007 0,006 3,49
10 - 0,017 - 0,001 - 0,002 - 0,004 - 0,008 - 0,021 - 0,013 - 0,012 - 0,000 - 0,005 - 0,008 0,007 3,66
11 + 0,008 + 0,014 + 0,001 + 0,002 - 0,003 + 0,009 + 0,014 + 0,001 + 0,015 + 0,041 + 0,010 0,013 2,57
12 - 0,011 - 0,010 - 0,007 - 0,018 - 0,014 - 0,008 - 0,012 - 0,014 - 0,056 - 0,020 - 0,017 0,014 3,79
13 - 0,037 - 0,029 - 0,038 - 0,006 - 0,007 - 0,016 + 0,015 + 0,010 + 0,026 + 0,006 - 0,008 0,022 1,08
14 + 0,028 + 0,032 + 0,023 + 0,013 + 0,010 + 0,023 + 0,020 + 0,015 + 0,024 + 0,006 + 0,019 0,008 7,40
15 + 0,003 + 0,014 + 0,019 + 0,029 + 0,020 + 0,039 + 0,028 + 0,039 + 0,033 + 0,009 + 0,023 0,012 5,91
16 - 0,048 - 0,030 - 0,014 - 0,074 - 0,069 + 0,012 - 0,089 - 0,069 - 0,072 - 0,049 - 0,050 0,031 5,06
d - 0,001 - 0,000 + 0,001 - 0,000 + 0,000 + 0,001 + 0,000 + 0,001 - 0,003 - 0,001 - 0,006 0,054
Sd 0,022 0,019 0,019 0,018 0,017 0,016 0,015 0,028 0,031 0,020 0,021
d = mean of differences Sd = standard deviation of differences t = Student test - comparison to 0
_
Upper limits : d = +/- 0,025 g / 100 g Sd = 0,020 g / 100 g
ISO 8968-1│IDF 20-1 : Precision of the method : Sr = 0.014 g / 100 g
SR = 0.018 g / 100 g
ICAR Proficiency Test September 2017

DETERMINATION of CRUDE PROTEINin RAW (cow) MILK - page 5/8 DETERMINATION of CRUDE PROTEINin RAW (cow) MILK - page 6/8
Table VI : Zscore of the different laboratories for each sample.
ZS calculated on the PT standard deviation
Sample Lab
code 1 2 3 4 5 6 7 8 9 10
1 +1,04 -0,69 -0,44 +1,14 +1,40 +0,35 -0,66 +0,41 -1,46 +0,64
2 +0,15 +0,23 -0,13 -0,09 -0,18 +0,54 +0,58 +0,01 +0,23 -0,28
3 +1,39 +1,05 +0,12 +0,60 +0,20 +0,54 +0,24 +0,08 -20,08 +0,04
4 -0,96 -0,92 -0,33 -1,52 -1,43 -0,63 -1,30 -0,66 -0,10 -1,18
5 +0,22 -1,23 +2,41 +1,47 +1,94 +0,48 +0,22 +0,02 -0,04 +1,00
6 +0,52 +1,15 +0,94 -1,66 +0,89 -1,34 +0,18 +2,31 +0,53 +0,65
7 +0,22 +0,97 -0,02 +0,08 -0,28 -0,01 -0,11 -0,01 +0,50 +0,19
8 +0,03 -0,25 -0,95 -0,54 -1,43 -0,65 -1,48 -0,30 -0,22 -0,50
9 -0,12 +0,29 -0,23 -0,39 -0,64 -0,70 -0,88 -0,47 -0,07 -0,33
10 -0,80 -0,04 -0,10 -0,25 -0,49 -1,27 -0,88 -0,42 -0,00 -0,25
11 +0,39 +0,70 +0,03 +0,11 -0,17 +0,52 +0,91 +0,04 +0,49 +2,02
12 -0,53 -0,54 -0,38 -1,04 -0,85 -0,46 -0,81 -0,51 -1,82 -0,98
13 -1,73 -1,48 -1,98 -0,34 -0,41 -0,98 +0,99 +0,35 +0,84 +0,29
14 +1,29 +1,64 +1,20 +0,75 +0,58 +1,37 +1,33 +0,55 +0,78 +0,27
15 +0,13 +0,70 +1,01 +1,67 +1,17 +2,36 +1,85 +1,39 +1,07 +0,4316 -2,23 -1,57 -0,72 -4,19 -4,13 +0,74 -5,84 -2,44 -2,32 -2,42
In yellow the values bigger or smaller than 2/-2 In red the values bigger or smaller than 3/-3
Figure 2 :
Zscore of the different laboratories for each sample. ZS calculated on the PT standard deviation
ICAR Proficiency Test September 2017
-5
-4
-3
-2
-1
0
1
2
3
4
5
1 2 3 4 5 6 7 8 9 10 11 12 13 14 15 16
Z sc
ore
PT
Laboratory code
sample1
sample2
sample 3
sample 4
sample 5
sample 6
sample 7
sample 8
sample 9
sample 10

DETERMINATION of CRUDE PROTEINin RAW (cow) MILK - page 6/8 DETERMINATION of CRUDE PROTEINin RAW (cow) MILK - page 7/8
Table VII : Zscore of the different laboratories for each sample.
ZS calculated on the standard deviation of reproducibility of the method
Sample Lab
code 1 2 3 4 5 6 7 8 9 10
1 +1,25 -0,75 -0,47 +1,11 +1,30 +0,32 -0,56 +0,64 -2,53 +0,72
2 +0,18 +0,24 -0,14 -0,08 -0,17 +0,49 +0,49 +0,02 +0,40 -0,31
3 +1,67 +1,13 +0,12 +0,59 +0,18 +0,49 +0,21 +0,12 -34,72 +0,04
4 -1,15 -1,00 -0,35 -1,48 -1,32 -0,57 -1,10 -1,03 -0,18 -1,32
5 +0,27 -1,33 +2,59 +1,44 +1,80 +0,44 +0,19 +0,03 -0,07 +1,12
6 +0,62 +1,24 +1,01 -1,63 +0,82 -1,23 +0,15 +3,60 +0,92 +0,73
7 +0,27 +1,04 -0,02 +0,08 -0,26 -0,01 -0,09 -0,02 +0,87 +0,22
8 +0,04 -0,27 -1,03 -0,53 -1,32 -0,59 -1,26 -0,46 -0,38 -0,56
9 -0,14 +0,32 -0,25 -0,39 -0,60 -0,64 -0,75 -0,73 -0,13 -0,37
10 -0,96 -0,04 -0,11 -0,24 -0,45 -1,16 -0,75 -0,66 -0,00 -0,28
11 +0,46 +0,76 +0,04 +0,11 -0,15 +0,47 +0,78 +0,07 +0,85 +2,27
12 -0,63 -0,58 -0,41 -1,01 -0,78 -0,42 -0,69 -0,79 -3,14 -1,11
13 -2,07 -1,60 -2,13 -0,33 -0,38 -0,89 +0,85 +0,55 +1,45 +0,32
14 +1,54 +1,77 +1,29 +0,73 +0,54 +1,25 +1,13 +0,85 +1,34 +0,31
15 +0,16 +0,76 +1,08 +1,64 +1,09 +2,16 +1,57 +2,16 +1,86 +0,4816 -2,67 -1,69 -0,78 -4,10 -3,83 +0,68 -4,97 -3,81 -4,01 -2,73
This table will allows to compare your ZSCORE from one PT to an other because the standard deviation
has always the value of SR of the method SR=0,018
In yellow the values bigger or smaller than 2/-2 In red the values bigger or smaller than 3/-3
Figure 3 :
Zscore of the different laboratories for each sample. ZS calculated on the standard deviation of reproducibility of the method
ICAR Proficiency Test September 2017
-5
-4
-3
-2
-1
0
1
2
3
4
5
1 2 3 4 5 6 7 8 9 10 11 12 13 14 15 16
Z sc
ore
Fix
Laboratory code
sample1
sample2
sample 3
sample 4
sample 5
sample 6
sample 7
sample 8
sample 9
sample 10

DETERMINATION of CRUDE PROTEINin RAW (cow) MILK - page 7/8 DETERMINATION of CRUDE PROTEINin RAW (cow) MILK - page 8/8
Figure 1 : ACCURACY - Evaluation of the individual performances (to see table I).
LIST OF THE PARTICIPANTS ICAR
ICAR PROFICIENCY TEST
RAW MILK
NITROGEN CONTENT
September 2017
Name City Country
Actalia Poligny France
Agroscope Bern-Liebefeld Switzerland
Central Milk Lab ICBA Caesarea IL
Department Valorisation des productions Agricoles Gembloux Belgium
Eastern Lab services Medina USA
ILVO Melle Belgium
Japan Dairy Technical Association Tokyo Japan
Lab Agroalimentario de Santander Santander Cantabria Spain
Laboratorio Standard Latte Maccarese Italy
Laboratorium Oceny Mleka KCHZ Laboratorium Referecyjne z/s w Parzniewie Pruszkow Poland
Milchprüfring Baden-Württemberg e.V. Kirchheim unter Teck Germany
Pieno Tyrimai Kaunas Lithuania
Qlip B.V., Zutphen NL
Teagasc Food research Center Cork IR
The National laboratory for raw milk Agrovyzkum Rapotin s.r.o. Vikyrovice Czech Republic
Valacta - Centre d’Expertise en Production Laitière du Québec Quebec Canada
ICAR Proficiency Test September 2017
0,000
0,050
0,100
0,150
-0,100 -0,050 0,000 0,050 0,100
Sd
Student 5 % Student 5 %
_
Target limits : d = +/- 0.025 g / 100 g of milk
Sd = 0.020 g / 100 g of milk
_
d
Trial of : 04/09/2017
16 laboratories
10 samples
6 Labs OUT OF THE TARGET ( 38 % )
1 3
5 6
13 16
ICAR Interlaboratory Proficiency Study - September 2017

DETERMINATION of LACTOSE in RAW (cow) MILK - page 1/8
ICAR
PROFICIENCY TESTING SCHEME
---------
September 2017
Raw Milk
Determination of LACTOSE CONTENT
Sending date of statistical treatment : 9th October 2017
Frame of activity : ICAR Milk Analyses Sub Committee (MA SC)
Contact : Gavin Scott [email protected]
ICAR Staff Silvia Orlandini [email protected] [email protected]
ACCRÉDITATION
N° 1-2473
PORTÉE
DISPONIBLE SUR
WWW.COFRAC.FR

DETERMINATION of LACTOSE in RAW (cow) MILK - page 1/8 DETERMINATION of LACTOSE in RAW (cow) MILK - page 2/8
Table I : Ranking of the laboratories Units : g / 100 g
Nb % N° d Sd D Method
1 7 13 - 0,010 0,020 0,023 IDF 214
2 13 5 + 0,011 0,021 0,024 N.C.
3 20 9 + 0,026 0,018 0,032 IDF 214
4 27 1 - 0,038 0,018 0,042 Own method
5 33 3 - 0,016 0,043 0,046 Enzymatic method
6 40 7 - 0,049 0,018 0,052 IDF 198
7 47 14 - 0,025 0,048 0,054 IDF 79B:1991
8 53 2 + 0,056 0,023 0,061 Polarimeter
9 60 6 - 0,059 0,019 0,062 IDF 198
10 67 12 - 0,066 0,028 0,072 IDF 198
11 73 8 - 0,025 0,080 0,084 IDF 214
12 80 4 + 0,059 0,098 0,115 IDF 214
13 87 10 + 0,091 0,079 0,121 Lane-Eynon
14 93 15 + 0,021 0,205 0,206 Polarimeter
15 100 11 + 0,315 0,078 0,324 analyse à flux continu
The table should be studied in parallel with figure 1 where the
laboratories are located according to an acceptability area (or target)
the limits of which are :
_
+/- 0.100 g / 100 g for d and 0.100 g / 100g for Sd
REF : Assigned values are robust average values per sample according to
algorithm A of standard ISO 13528, of 15 laboratories , after outliers discarging
using Grubbs test at 5 % risk level.
(NC : OUT of RANKING because of insufficient data number)
(Nb : laboratory rank; % : relative rank)
(N° : laboratory identification number)
(d et Sd : mean and standard deviation of the differences (laboratory -reference))
(D : Euclidian distance to YX-axis origin = SQUARE ROOT.(d² + Sd²))
Note : Limits are only indicative and so far do not constitute standard values; they indicate what is normally
reachable by labs for their self evaluation.
Repeatability standard deviation of this ICAR proficiency test (after Cochran elimination at 5 %) SrPT 0,014
Reproducibility standard deviation of this ICAR proficiency test (after Cochran and Grubbs elimination at 5 %) SRPT 0,091
ICAR Proficiency Test September 2017

DETERMINATION of LACTOSE in RAW (cow) MILK - page 2/8 DETERMINATION of LACTOSE in RAW (cow) MILK - page 3/8
Table II : REPEATABILITY - Absolute difference between replicates in g / 100 g
Sample Lab
code1 2 3 4 5 6 7 8 9 10 Sr NL
1 0,006 0,014 0,006 0,004 0,005 0,004 0,001 0,008 0,001 0,002 0,004 20
2 0,000 0,000 0,010 0,000 0,010 0,010 0,010 0,010 0,010 0,000 0,005 20
3 0,018 0,019 0,018 0,037 0,000 0,019 0,038 0,037 0,019 0,001 0,017 20
4 0,077 * 0,056 * 0,003 0,016 0,021 0,012 0,023 0,025 0,038 0,013 0,025 20
5 0,020 0,010 0,000 0,000 0,010 0,010 0,010 0,000 0,010 0,000 0,007 20
6 0,001 0,005 0,001 0,023 0,026 0,034 0,014 0,007 0,013 0,005 0,012 20
7 0,003 0,014 0,004 0,010 0,008 0,000 0,006 0,006 0,001 0,006 0,005 20
8 0,033 0,080 * 0,035 0,009 0,063 * 0,018 0,005 0,068 0,006 0,015 0,030 20
9 0,000 0,000 0,005 0,008 0,004 0,003 0,001 0,021 0,027 0,012 0,008 20
10 0,003 0,012 0,010 0,012 0,004 0,027 0,006 0,001 0,020 0,013 0,009 20
11 0,019 0,165 * 0,010 0,000 0,039 0,039 0,117 * 0,010 0,117 * 0,087 * 0,057 20
12 0,005 0,008 0,002 0,007 0,000 0,011 0,039 0,036 0,033 0,001 0,014 20
13 0,004 0,008 0,004 0,021 0,006 0,063 0,004 0,064 0,010 0,002 0,021 20
14 0,003 0,028 0,030 0,018 0,008 0,020 0,031 0,024 0,020 0,013 0,015 20
15 0,015 0,015 0,029 0,059 * 0,029 0,044 0,015 0,017 0,060 0,017 0,024 20
Sr 0,017 0,036 0,011 0,015 0,016 0,019 0,025 0,021 0,027 0,017 300
NE 30 30 30 30 30 30 30 30 30 30
L 0,035 0,034 0,042 0,041 0,044 0,072 0,051 0,080 0,065 0,024
Sr : repeatability standard deviation of each laboratory limit 0,022 g/100g
NL : number of measurements per laboratory
L : Limit for difference between duplicates according Cochran test at 5% level.
SE : repeatability standard deviation per sample
NE : number of measurements per sample
*: discarded data using the test of Cochran at 5 %
** : missing data
r : limit of repeatability, absolute difference betwen two replicates=0,061 according ISO 22662 / IDF 198
ICAR Proficiency Test September 2017

DETERMINATION of LACTOSE in RAW (cow) MILK - page 3/8 DETERMINATION of LACTOSE in RAW (cow) MILK - page 4/8
Table III : Means of the replicates in g / 100 g
(*) : Data have been modified in the right units.
Sample Lab
code1 2 3 4 5 6 7 8 9 10
1 5,109 5,043 4,960 4,861 4,742 4,676 4,610 4,553 4,486 4,643
2 5,230 5,170 5,075 4,970 4,835 4,765 4,695 4,625 4,555 4,700
3 5,163 4,995 5,010 4,904 4,757 4,749 4,608 4,519 4,530 4,670
4 5,072 4,914 5,075 4,982 4,882 4,830 4,764 4,714 4,635 4,783
5 5,180 5,115 5,010 4,910 4,795 4,725 4,655 4,590 4,515 4,670
6 5,082 5,026 5,005 4,834 4,719 4,628 4,583 4,521 4,468 4,609
7 5,102 5,031 4,945 4,852 4,730 4,668 4,599 4,545 4,474 4,623
(*) 8 5,192 5,147 5,125 4,939 4,696 4,627 4,577 4,481 4,430 4,590
9 5,159 5,116 5,024 4,941 4,811 4,729 4,672 4,618 4,538 4,713
10 5,141 5,097 5,007 5,012 4,979 4,836 4,798 4,770 4,672 4,659
11 5,534 * 5,451 5,248 5,252 * 5,117 5,117 * 5,010 * 4,879 4,718 4,879 *
12 5,116 5,008 4,917 4,826 4,705 4,641 4,596 4,530 4,464 4,594
13 5,117 5,063 5,000 4,886 4,759 4,731 4,631 4,591 4,512 4,667
14 5,048 5,011 4,960 4,868 4,739 4,715 4,666 4,647 4,505 4,655
15 5,327 * 5,403 5,265 4,982 4,940 4,566 4,572 4,259 4,375 4,576
M 5,131 5,106 5,042 4,912 4,814 4,706 4,645 4,589 4,525 4,654
REF. 5,130 5,081 5,028 4,912 4,802 4,707 4,637 4,591 4,520 4,650
SD 0,052 0,146 0,102 0,060 0,119 0,077 0,069 0,140 0,091 0,055
M = mean per sample REF. = reference values
SD = standard deviation per sample *: discarded data using the test of Grubbs 5 %
REF : Assigned values are robust average values per sample according to algorithm A of standard ISO 13528,
of 15 laboratories, after outliers discarging using Grubbs test at 5 % risk level.
Table IV : Outlier identification
Sample 1 2 3 4 5 6 7 8 9 10
Outliers
Cochran
Outlier
Grubbs
sr 0,009 0,009 0,011 0,011 0,012 0,018 0,014 0,021 0,017 0,007
SR 0,051 0,112 0,103 0,060 0,119 0,078 0,070 0,141 0,077 0,056
ICAR Proficiency Test September 2017
1111; 15 11 11
8 11
11
8 11 1144; 8;
1115

DETERMINATION of LACTOSE in RAW (cow) MILK - page 4/8 DETERMINATION of LACTOSE in RAW (cow) MILK - page 5/8
Table V : ACCURACY - differences (laboratory - reference) in g / 100 g
Sample Lab
code1 2 3 4 5 6 7 8 9 10 d Sdlab t
1 - 0,021 - 0,038 - 0,068 - 0,051 - 0,060 - 0,031 - 0,028 - 0,038 - 0,035 - 0,007 - 0,038 0,018 6,54
2 + 0,100 + 0,089 + 0,047 + 0,058 + 0,033 + 0,058 + 0,058 + 0,034 + 0,035 + 0,050 + 0,056 0,023 7,85
3 + 0,033 - 0,086 - 0,018 - 0,008 - 0,045 + 0,042 - 0,029 - 0,073 + 0,009 + 0,020 - 0,016 0,043 1,14
4 - 0,059 - 0,167 + 0,047 + 0,070 + 0,080 + 0,123 + 0,126 + 0,122 + 0,115 + 0,133 + 0,059 0,098 1,90
5 + 0,050 + 0,034 - 0,018 - 0,002 - 0,007 + 0,018 + 0,018 - 0,001 - 0,005 + 0,020 + 0,011 0,021 1,62
6 - 0,049 - 0,055 - 0,023 - 0,078 - 0,083 - 0,079 - 0,054 - 0,071 - 0,053 - 0,041 - 0,059 0,019 9,77
7 - 0,029 - 0,050 - 0,083 - 0,060 - 0,072 - 0,039 - 0,038 - 0,046 - 0,047 - 0,027 - 0,049 0,018 8,59
8 + 0,062 + 0,066 + 0,097 + 0,028 - 0,106 - 0,080 - 0,060 - 0,111 - 0,090 - 0,060 - 0,025 0,080 1,01
9 + 0,029 + 0,035 - 0,004 + 0,029 + 0,009 + 0,022 + 0,034 + 0,026 + 0,017 + 0,063 + 0,026 0,018 4,62
10 + 0,010 + 0,016 - 0,021 + 0,100 + 0,177 + 0,129 + 0,161 + 0,178 + 0,152 + 0,009 + 0,091 0,079 3,64
11 + 0,404 + 0,371 + 0,220 + 0,341 + 0,315 + 0,410 + 0,372 + 0,287 + 0,198 + 0,229 + 0,315 0,078 12,75
12 - 0,015 - 0,073 - 0,111 - 0,086 - 0,097 - 0,066 - 0,042 - 0,061 - 0,057 - 0,056 - 0,066 0,028 7,61
13 - 0,013 - 0,018 - 0,028 - 0,026 - 0,043 + 0,024 - 0,006 - 0,000 - 0,008 + 0,017 - 0,010 0,020 1,58
14 - 0,083 - 0,070 - 0,068 - 0,044 - 0,063 + 0,008 + 0,028 + 0,056 - 0,015 + 0,005 - 0,025 0,048 1,63
15 + 0,197 + 0,323 + 0,237 + 0,071 + 0,138 - 0,141 - 0,065 - 0,332 - 0,145 - 0,074 + 0,021 0,205 0,32
d + 0,001 + 0,025 + 0,014 + 0,000 + 0,012 - 0,001 + 0,007 - 0,002 + 0,005 + 0,004 + 0,019 0,114
Sd 0,052 0,146 0,102 0,060 0,119 0,077 0,069 0,140 0,091 0,055 0,097
d = mean of differences Sd = standard deviation of differences t = Student test - comparison to 0
_
Upper limits : d = +/- 0.100 g / 100g Sd = 0.100 g / 100g
ISO 22662│IDF 198 : Precision of the method : Sr = 0.022 g / 100 g
SR = 0.047 g / 100 g
ICAR Proficiency Test September 2017

DETERMINATION of LACTOSE in RAW (cow) MILK - page 5/8 DETERMINATION of LACTOSE in RAW (cow) MILK - page 6/8
Table VI : Zscore of the different laboratories for each sample.
ZS calculated on the PT standard deviation
Sample Lab
code 1 2 3 4 5 6 7 8 9 10
1 -0,41 -0,26 -0,66 -0,84 -0,51 -0,40 -0,40 -0,27 -0,38 -0,12
2 +1,91 +0,61 +0,46 +0,96 +0,28 +0,75 +0,83 +0,24 +0,38 +0,91
3 +0,63 -0,59 -0,17 -0,14 -0,38 +0,54 -0,42 -0,52 +0,10 +0,36
4 -1,13 -1,14 +0,46 +1,16 +0,67 +1,60 +1,82 +0,87 +1,26 +2,40
5 +0,95 +0,24 -0,17 -0,03 -0,06 +0,24 +0,26 -0,01 -0,06 +0,37
6 -0,94 -0,38 -0,23 -1,30 -0,69 -1,02 -0,78 -0,51 -0,58 -0,75
7 -0,55 -0,34 -0,81 -0,99 -0,60 -0,50 -0,55 -0,33 -0,51 -0,48
8 +1,19 +0,45 +0,95 +0,46 -0,89 -1,03 -0,87 -0,79 -0,99 -1,08
9 +0,55 +0,24 -0,04 +0,48 +0,08 +0,28 +0,49 +0,19 +0,19 +1,14
10 +0,20 +0,11 -0,20 +1,66 +1,49 +1,67 +2,32 +1,27 +1,67 +0,16
11 +7,75 +2,54 +2,15 +5,64 +2,64 +5,31 +5,38 +2,05 +2,18 +4,14
12 -0,28 -0,50 -1,08 -1,43 -0,81 -0,86 -0,60 -0,44 -0,62 -1,02
13 -0,25 -0,12 -0,27 -0,44 -0,36 +0,31 -0,09 -0,00 -0,09 +0,31
14 -1,59 -0,48 -0,66 -0,73 -0,53 +0,11 +0,41 +0,40 -0,17 +0,09
15 +3,78 +2,21 +2,32 +1,17 +1,16 -1,82 -0,94 -2,37 -1,60 -1,33
In yellow the values bigger or smaller than 2/-2 In red the values bigger or smaller than 3/-3
Figure 2 :
Zscore of the different laboratories for each sample. ZS calculated on the PT standard deviation
ICAR Proficiency Test September 2017
-5
-4
-3
-2
-1
0
1
2
3
4
5
1 2 3 4 5 6 7 8 9 10 11 12 13 14 15Z sc
ore
PT
Laboratory code
sample1
sample2
sample 3
sample 4
sample 5
sample 6
sample 7
sample 8
sample 9
sample 10

DETERMINATION of LACTOSE in RAW (cow) MILK - page 6/8 DETERMINATION of LACTOSE in RAW (cow) MILK - page 7/8
Table VII : Zscore of the different laboratories for each sample.
ZS calculated on the standard deviation of reproducibility of the method
Sample Lab
code 1 2 3 4 5 6 7 8 9 10
1 -0,45 -0,80 -1,44 -1,08 -1,28 -0,66 -0,59 -0,82 -0,74 -0,14
2 +2,12 +1,90 +1,00 +1,24 +0,71 +1,24 +1,23 +0,72 +0,74 +1,07
3 +0,70 -1,83 -0,38 -0,18 -0,95 +0,89 -0,62 -1,55 +0,20 +0,42
4 -1,25 -3,54 +0,99 +1,49 +1,69 +2,62 +2,69 +2,60 +2,44 +2,82
5 +1,06 +0,73 -0,38 -0,04 -0,15 +0,39 +0,38 -0,03 -0,11 +0,43
6 -1,04 -1,17 -0,50 -1,67 -1,76 -1,68 -1,15 -1,51 -1,12 -0,88
7 -0,61 -1,06 -1,76 -1,27 -1,53 -0,83 -0,81 -0,99 -0,99 -0,57
8 +1,32 +1,40 +2,07 +0,59 -2,26 -1,70 -1,28 -2,36 -1,92 -1,28
9 +0,61 +0,75 -0,09 +0,62 +0,19 +0,46 +0,73 +0,56 +0,37 +1,35
10 +0,22 +0,35 -0,44 +2,13 +3,77 +2,74 +3,42 +3,79 +3,23 +0,19
11 +8,59 +7,89 +4,67 +7,25 +6,69 +8,72 +7,92 +6,11 +4,22 +4,87
12 -0,31 -1,54 -2,36 -1,84 -2,06 -1,41 -0,89 -1,30 -1,20 -1,20
13 -0,28 -0,37 -0,59 -0,56 -0,91 +0,50 -0,13 -0,01 -0,17 +0,37
14 -1,76 -1,48 -1,44 -0,93 -1,34 +0,17 +0,60 +1,18 -0,32 +0,10
15 +4,19 +6,86 +5,05 +1,50 +2,94 -2,99 -1,38 -7,06 -3,09 -1,56
This table will allows to compare your ZSCORE from one PT to an other because the standard deviation
has always the value of SR of the method SR=0,047
In yellow the values bigger or smaller than 2/-2 In red the values bigger or smaller than 3/-3
Figure 3 :
Zscore of the different laboratories for each sample. ZS calculated on the standard deviation of reproducibility of the method
ICAR Proficiency Test September 2017
-5
-4
-3
-2
-1
0
1
2
3
4
5
1 2 3 4 5 6 7 8 9 10 11 12 13 14 15
Z sc
ore
Fix
Laboratory code
sample1 sample2
sample 3 sample 4
sample 5 sample 6
sample 7 sample 8
sample 9 sample 10

DETERMINATION of LACTOSE in RAW (cow) MILK - page 7/8 DETERMINATION of LACTOSE in RAW (cow) MILK - page 8/8
Figure 1 : ACCURACY - Evaluation of the individual performances (to see table I).
LIST OF THE PARTICIPANTS ICAR
ICAR PROFICIENCY TEST
RAW MILK
LACTOSE CONTENT
September 2017
Name City Country
Agroscope Bern-Liebefeld Switzerland
Central Milk Lab ICBA Caesarea IL
Department Valorisation des productions Agricoles Gembloux Belgium
ILVO Melle Belgium
Japan Dairy Technical Association Tokyo Japan
Lab Agroalimentario de Santander Santander Cantabria Spain
Laboratorio Standard Latte Maccarese Italy
Laboratorium Oceny Mleka KCHZ Laboratorium Referecyjne z/s w Parzniewie Pruszkow Poland
Milchprüfring Baden-Württemberg e.V. Kirchheim unter Teck Germany
Milkom a.s Dairy research institute Praha Czech Republic
Pieno Tyrimai Kaunas Lithuania
Qlip B.V., Zutphen NL
Teagasc Food research Center Cork IR
The National laboratory for raw milk Agrovyzkum Rapotin s.r.o. Vikyrovice Czech Republic
Valacta - Centre d’Expertise en Production Laitière du Québec Quebec Canada
ICAR Proficiency Test September 2017
0,000
0,150
0,300
0,450
-0,300 -0,150 0,000 0,150 0,300
Sd
Student 5 % Student 5 %
_
d
Trial of : 04/09/2017
15 laboratories
10 samples
2 Labs OUT OF THE TARGET ( 13 % )
11
15
ICAR Interlaboratory Proficiency Study - September 2017

DETERMINATION of UREA in RAW (cow) MILK - page 1/8
ICAR
PROFICIENCY TESTING SCHEME
---------
September 2017
Raw Milk
Determination of UREA CONTENT
Sending date of statistical treatment : 9th October 2017
Frame of activity : ICAR Milk Analyses Sub Committee (MA SC)
Contact : Gavin Scott [email protected]
ICAR Staff Silvia Orlandini [email protected] [email protected]
ICAR Proficiency Test September 2017
ACCRÉDITATION
N° 1-2473
PORTÉE
DISPONIBLE SUR
WWW.COFRAC.FR

DETERMINATION of UREA in RAW (cow) MILK - page 1/8 DETERMINATION of UREA in RAW (cow) MILK - page 2/8
Table I : Ranking of the laboratories Units : mg / 100 g
Nb % N° d Sd D MethodThe table should be studied in parallel with figure 1 where the
1 10 6 + 0,20 0,36 0,41 IDF 195 laboratories are located according to an acceptability area (or target)
2 20 2 + 0,49 0,50 0,70 Photometric method the limits of which are :
3 30 10 - 0,43 0,64 0,77 IDF 195
4 40 7 + 0,68 0,37 0,78 IDF 195
5 50 8 + 0,75 0,54 0,92 Continuous flow analyzer _
6 60 3 + 1,23 0,39 1,29 IDF 195 +/- 2,50 mg / 100 g for d and 1,50 mg / 100 g for Sd
7 70 4 + 0,49 1,29 1,38 IDF 195
8 80 5 + 1,47 0,79 1,67 Continuous flow analyzer REF : Assigned values are robust average values per sample according to
9 90 1 - 1,72 0,32 1,75 IDF 195 algorithm A of standard ISO 13528, of 7 laboratories using reference
10 100 9 - 0,93 11,19 11,23 IDF 195 method (ISO 14637│IDF 195), after outlier discarging using Grubbs test
at 5% risk level
(NC : OUT of RANKING because of insufficient data number)
(Nb : laboratory rank; % : relative rank)
(N° : laboratory identification number)
(d et Sd : mean and standard deviation of the differences (laboratory -reference))
(D : Euclidian distance to YX-axis origin = SQUARE ROOT.(d² + Sd²))
Note : Limits are only indicative and so far do not constitute standard values; they indicate what is normally
reachable by labs for their self evaluation.
Repeatability standard deviation of this ICAR proficiency test (after Cochran elimination at 5 %) SrPT 0,57
Reproducibility standard deviation of this ICAR proficiency test (after Cochran and Grubbs elimination at 5 %) SRPT 1,19
ICAR Proficiency Test September 2017

DETERMINATION of UREA in RAW (cow) MILK - page 2/8 DETERMINATION of UREA in RAW (cow) MILK - page 3/8
Table II : REPEATABILITY - Absolute difference between replicates in mg / 100 g
Sample Lab
code1 2 3 4 5 6 7 8 9 10 Sr NL
1 0,50 0,10 0,10 0,20 0,10 0,10 0,50 0,70 0,60 0,40 0,28 20
2 2,30 1,70 * 1,80 0,70 1,40 1,70 * 1,70 2,90 1,20 1,50 1,26 20
3 0,66 0,43 0,03 0,16 0,69 0,07 0,73 1,32 0,52 0,33 0,44 20
4 1,90 0,30 1,30 0,30 0,20 0,40 0,60 0,00 0,30 0,70 0,58 20
5 0,00 0,10 0,10 0,00 0,10 0,00 0,20 0,60 0,00 0,20 0,15 20
6 0,29 0,00 0,29 0,68 0,29 0,49 0,29 0,00 0,10 0,39 0,25 20
7 1,12 0,82 1,07 1,22 1,38 0,68 0,95 1,34 1,18 1,11 0,78 20
8 0,06 0,06 0,41 0,09 0,03 0,28 0,15 0,66 0,31 0,27 0,21 20
9 1,10 0,30 0,10 0,60 0,80 0,20 0,30 0,50 1,00 0,70 0,46 20
10 0,20 0,90 0,30 0,10 0,40 0,50 0,50 0,80 0,30 0,50 0,36 20
Sr 0,78 0,49 0,57 0,39 0,51 0,45 0,52 0,84 0,49 0,51 200
NE 20 20 20 20 20 20 20 20 20 20
L 2,71 1,09 1,97 1,34 1,78 0,89 1,81 2,92 1,69 1,78
Sr : repeatability standard deviation of each laboratory limit 0,54 mg/100g
NL : number of measurements per laboratory
L : Limit for difference between duplicates according Cochran test at 5% level.
SE : repeatability standard deviation per sample
NE : number of measurements per sample
*: discarded data using the test of Cochran at 5 %
** : missing data
r : limit of repeatability, absolute difference betwen two replicates=1,50 according ISO 14637 / IDF 195
ICAR Proficiency Test September 2017

DETERMINATION of UREA in RAW (cow) MILK - page 3/8 DETERMINATION of UREA in RAW (cow) MILK - page 4/8
Table III : Means of the replicates in mg / 100 g
(*) : Datahave been modified in the right units.
Sample Lab
code1 2 3 4 5 6 7 8 9 10
1 43,85 24,85 29,55 48,50 34,35 53,15 20,25 57,85 16,20 39,10 *
2 46,35 27,55 31,70 51,05 37,00 55,25 22,25 59,15 17,60 41,85
3 47,03 27,78 32,30 52,13 36,79 56,21 22,58 61,35 18,35 42,65
4 44,65 25,65 30,55 53,75 37,70 56,10 22,20 60,60 16,85 41,65
5 47,60 27,55 32,35 52,30 37,55 57,70 22,70 61,80 17,90 42,10 (*) 6 45,87 26,80 31,60 50,53 36,65 54,81 22,09 60,19 17,43 40,87
7 46,30 27,60 32,14 50,66 36,91 55,41 22,58 60,45 18,07 41,53
8 46,96 27,03 31,81 51,46 36,94 56,05 22,05 60,92 17,34 41,77
9 45,05 25,55 30,25 49,20 35,50 53,50 21,15 58,35 40,20 * 16,75 *
10 44,90 26,25 31,15 48,65 35,50 53,95 21,75 59,50 18,05 40,85
M 45,86 26,66 31,34 50,82 36,49 55,21 21,96 60,02 17,53 41,66
REF. 45,38 26,35 31,08 50,49 36,20 54,73 21,84 59,76 17,49 41,51
SD 1,21 1,03 0,94 1,69 1,05 1,40 0,75 1,28 0,68 0,60
M = mean per sample REF. = reference values
SD = standard deviation per sample *: discarded data using the test of Grubbs 5 %
REF : Assigned values are robust average values per sample according to algorithm A of standard ISO 13528,
of 7 laboratories using the reference method ISO 14637│IDF 195, after outliers discarging using Grubbs
test 5% risk level
Table IV : Outlier identification
Sample 1 2 3 4 5 6 7 8 9 10Outliers
Cochran
Outlier
Grubbs
sr 0,78 0,32 0,57 0,39 0,51 0,26 0,52 0,84 0,46 0,54
SR 1,33 1,07 1,03 1,71 1,11 1,50 0,84 1,41 0,75 0,71
ICAR Proficiency Test September 2017
2 2
9 1; 9

DETERMINATION of UREA in RAW (cow) MILK - page 4/8 DETERMINATION of UREA in RAW (cow) MILK - page 5/8
Table V : ACCURACY - differences (laboratory - reference) in mg / 100 g
Sample Lab
code1 2 3 4 5 6 7 8 9 10 d Sdlab t
1 - 1,53 - 1,50 - 1,53 - 1,99 - 1,85 - 1,58 - 1,59 - 1,91 - 1,29 - 2,41 - 1,72 0,32 16,82
2 + 0,97 + 1,20 + 0,62 + 0,56 + 0,80 + 0,52 + 0,41 - 0,61 + 0,11 + 0,34 + 0,49 0,50 3,13
3 + 1,65 + 1,42 + 1,22 + 1,64 + 0,59 + 1,47 + 0,73 + 1,59 + 0,86 + 1,14 + 1,23 0,39 9,92
4 - 0,73 - 0,70 - 0,53 + 3,26 + 1,50 + 1,37 + 0,36 + 0,84 - 0,64 + 0,14 + 0,49 1,29 1,19
5 + 2,22 + 1,20 + 1,27 + 1,81 + 1,35 + 2,97 + 0,86 + 2,04 + 0,41 + 0,59 + 1,47 0,79 5,87
6 + 0,49 + 0,44 + 0,53 + 0,04 + 0,45 + 0,07 + 0,24 + 0,44 - 0,06 - 0,63 + 0,20 0,36 1,76
7 + 0,92 + 1,25 + 1,06 + 0,17 + 0,71 + 0,68 + 0,73 + 0,69 + 0,58 + 0,02 + 0,68 0,37 5,81
8 + 1,58 + 0,68 + 0,73 + 0,97 + 0,74 + 1,32 + 0,20 + 1,16 - 0,16 + 0,26 + 0,75 0,54 4,40
9 - 0,33 - 0,80 - 0,83 - 1,29 - 0,70 - 1,23 - 0,69 - 1,41 + 22,71 - 24,76 - 0,93 11,19 0,26
10 - 0,48 - 0,10 + 0,07 - 1,84 - 0,70 - 0,78 - 0,09 - 0,26 + 0,56 - 0,66 - 0,43 0,64 2,11
d + 0,48 + 0,31 + 0,26 + 0,33 + 0,29 + 0,48 + 0,11 + 0,26 + 0,04 + 0,15 + 0,22 3,55
Sd 1,21 1,03 0,94 1,69 1,05 1,40 0,75 1,28 0,68 0,60 1,11
d = mean of differences Sd = standard deviation of differences t = Student test - comparison to 0
_
Upper limits : d = +/- 2,50 mg / 100 g Sd = 1,50 mg / 100 g
ISO 14637│IDF 195 : Precision of the method : Sr = 0.54 mg / 100 g
SR = 1.81 mg / 100 g
ICAR Proficiency Test September 2017

DETERMINATION of UREA in RAW (cow) MILK - page 5/8 DETERMINATION of UREA in RAW (cow) MILK - page 6/8
Table VI : Zscore of the different laboratories for each sample.
ZS calculated on the PT standard deviation
Sample Lab
code 1 2 3 4 5 6 7 8 9 10
1 -1,27 -1,46 -1,62 -1,18 -1,77 -1,13 -2,12 -1,49 -1,91 -4,03
2 +0,80 +1,16 +0,66 +0,33 +0,76 +0,37 +0,54 -0,47 +0,16 +0,57
3 +1,37 +1,38 +1,29 +0,97 +0,56 +1,05 +0,97 +1,24 +1,27 +1,90
4 -0,60 -0,68 -0,56 +1,93 +1,43 +0,98 +0,47 +0,66 -0,95 +0,24
5 +1,84 +1,16 +1,35 +1,07 +1,29 +2,12 +1,14 +1,59 +0,60 +0,99
6 +0,41 +0,43 +0,56 +0,03 +0,43 +0,05 +0,32 +0,34 -0,09 -1,06
7 +0,76 +1,21 +1,12 +0,10 +0,68 +0,48 +0,97 +0,54 +0,86 +0,03
8 +1,31 +0,66 +0,78 +0,57 +0,71 +0,94 +0,27 +0,90 -0,23 +0,43
9 -0,27 -0,78 -0,87 -0,76 -0,67 -0,88 -0,92 -1,10 +33,59 -41,4010 -0,40 -0,10 +0,08 -1,09 -0,67 -0,56 -0,13 -0,20 +0,83 -1,10
In yellow the values bigger or smaller than 2/-2 In red the values bigger or smaller than 3/-3
Figure 2 :
Zscore of the different laboratories for each sample. ZS calculated on the PT standard deviation
ICAR Proficiency Test September 2017
-5
-4
-3
-2
-1
0
1
2
3
4
5
1 2 3 4 5 6 7 8 9 10
Z sc
ore
PT
Laboratory code
sample1 sample2
sample 3 sample 4
sample 5 sample 6
sample 7 sample 8
sample 9 sample 10

DETERMINATION of UREA in RAW (cow) MILK - page 6/8 DETERMINATION of UREA in RAW (cow) MILK - page 7/8
Table VII : Zscore of the different laboratories for each sample.
ZS calculated on the standard deviation of reproducibility of the method
Sample Lab
code 1 2 3 4 5 6 7 8 9 10
1 -0,84 -0,83 -0,84 -1,10 -1,02 -0,87 -0,88 -1,05 -0,71 -1,33
2 +0,54 +0,66 +0,34 +0,31 +0,44 +0,29 +0,22 -0,33 +0,06 +0,19
3 +0,91 +0,79 +0,67 +0,91 +0,32 +0,81 +0,40 +0,88 +0,47 +0,63
4 -0,40 -0,39 -0,29 +1,80 +0,83 +0,76 +0,20 +0,47 -0,35 +0,08
5 +1,23 +0,66 +0,70 +1,00 +0,75 +1,64 +0,47 +1,13 +0,23 +0,33
6 +0,27 +0,24 +0,29 +0,02 +0,25 +0,04 +0,13 +0,24 -0,04 -0,35
7 +0,51 +0,69 +0,59 +0,09 +0,39 +0,37 +0,40 +0,38 +0,32 +0,01
8 +0,88 +0,37 +0,40 +0,54 +0,41 +0,73 +0,11 +0,64 -0,09 +0,14
9 -0,18 -0,44 -0,46 -0,71 -0,39 -0,68 -0,38 -0,78 +12,55 -13,6810 -0,26 -0,06 +0,04 -1,02 -0,39 -0,43 -0,05 -0,14 +0,31 -0,36
This table will allows to compare your ZSCORE from one PT to an other because the standard deviation
has always the value of SR of the method SR=1,81
In yellow the values bigger or smaller than 2/-2 In red the values bigger or smaller than 3/-3
Figure 3 :
Zscore of the different laboratories for each sample. ZS calculated on the standard deviation of reproducibility of the method
ICAR Proficiency Test September 2017
-5
-4
-3
-2
-1
0
1
2
3
4
5
1 2 3 4 5 6 7 8 9 10
Z sc
ore
Fix
Laboratory code
sample1 sample2
sample 3 sample 4
sample 5 sample 6
sample 7 sample 8
sample 9 sample 10

DETERMINATION of UREA in RAW (cow) MILK - page 7/8 DETERMINATION of UREA in RAW (cow) MILK - page 8/8
Figure 1 : ACCURACY - Evaluation of the individual performances (to see table I).
LIST OF THE PARTICIPANTS ICAR
ICAR PROFICIENCY TEST
RAW MILK
UREA CONTENT
September 2017
Name City Country
Actalia Poligny FranceAgroscope Bern-Liebefeld Switzerland
Central Milk Lab ICBA Caesarea IL
Department Valorisation des productions Agricoles Gembloux Belgium
Laboratorio Standard Latte Maccarese Italy
Laboratorium Oceny Mleka KCHZ Parzniewie Pruszkow Poland
Milchprüfring Baden-Württemberg e.V. Kirchheim unter Teck Germany
Pieno Tyrimai Kaunas Lithuania
Qlip B.V., Zutphen NL
Valacta - Centre d’Expertise en Production Laitière du Québec Quebec Canada
ICAR Proficiency Test September 2017
0,00
4,00
8,00
12,00
-8,00 -4,00 0,00 4,00 8,00
Sd
Student 5 % Student 5 %
_ Target limits : d = +/- 2.50 mg of urea / 100 g of milk Sd = 1.50 mg of urea / 100 g of milk
_
d
Trial of : 04/09/2017
10 laboratories
10 samples
1 Labs OUT OF THE TARGET ( 10 % )
9
ICAR Interlaboratory Proficiency Study - September 2017

ENUMERATION of SOMATIC CELLS in RAW (cow) MILK - page 1/8
ICAR
PROFICIENCY TESTING SCHEME
---------
September 2017
Raw Milk
Enumeration of SOMATIC CELLS
Sending date of statistical treatment : 9th October 2017
Frame of activity : ICAR Milk Analyses Sub Committee (MA SC)
Contact : Gavin Scott [email protected]
ICAR Staff Silvia Orlandini [email protected] [email protected]
Proficiency test accreditated ISO 17043
ACCRÉDITATION
N° 1-2473
PORTÉE
DISPONIBLE SUR
WWW.COFRAC.FR
ENUMERATION of SOMATIC CELLS in RAW (cow) MILK - page 1/8 ENUMERATION of SOMATIC CELLS in RAW (cow) MILK - page 2/8
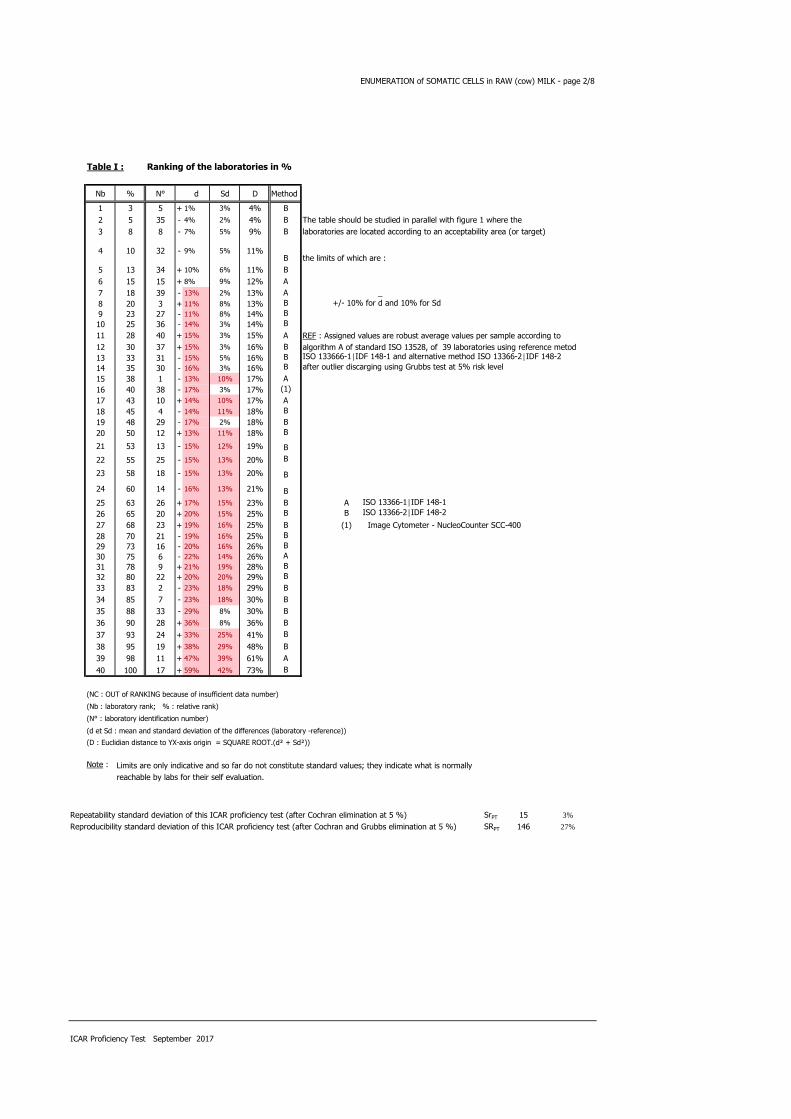
Table I : Ranking of the laboratories in %
Nb % N° d Sd D Method
1 3 5 + 1% 3% 4% B
2 5 35 - 4% 2% 4% B The table should be studied in parallel with figure 1 where the
3 8 8 - 7% 5% 9% B laboratories are located according to an acceptability area (or target)
4 10 32 - 9% 5% 11%B the limits of which are :
5 13 34 + 10% 6% 11% B
6 15 15 + 8% 9% 12% A
7 18 39 - 13% 2% 13% A _
8 20 3 + 11% 8% 13% B +/- 10% for d and 10% for Sd
9 23 27 - 11% 8% 14% B
10 25 36 - 14% 3% 14% B
11 28 40 + 15% 3% 15% A REF : Assigned values are robust average values per sample according to
12 30 37 + 15% 3% 16% B algorithm A of standard ISO 13528, of 39 laboratories using reference metod
13 33 31 - 15% 5% 16% B ISO 133666-1│IDF 148-1 and alternative method ISO 13366-2│IDF 148-2
14 35 30 - 16% 3% 16% B after outlier discarging using Grubbs test at 5% risk level
15 38 1 - 13% 10% 17% A
16 40 38 - 17% 3% 17% (1)
17 43 10 + 14% 10% 17% A
18 45 4 - 14% 11% 18% B
19 48 29 - 17% 2% 18% B
20 50 12 + 13% 11% 18% B
21 53 13 - 15% 12% 19% B
22 55 25 - 15% 13% 20% B
23 58 18 - 15% 13% 20% B
24 60 14 - 16% 13% 21% B
25 63 26 + 17% 15% 23% B A ISO 13366-1│IDF 148-1
26 65 20 + 20% 15% 25% B B ISO 13366-2│IDF 148-2
27 68 23 + 19% 16% 25% B (1) Image Cytometer - NucleoCounter SCC-400
28 70 21 - 19% 16% 25% B
29 73 16 - 20% 16% 26% B
30 75 6 - 22% 14% 26% A
31 78 9 + 21% 19% 28% B
32 80 22 + 20% 20% 29% B
33 83 2 - 23% 18% 29% B
34 85 7 - 23% 18% 30% B
35 88 33 - 29% 8% 30% B
36 90 28 + 36% 8% 36% B
37 93 24 + 33% 25% 41% B
38 95 19 + 38% 29% 48% B
39 98 11 + 47% 39% 61% A
40 100 17 + 59% 42% 73% B
(NC : OUT of RANKING because of insufficient data number)
(Nb : laboratory rank; % : relative rank)
(N° : laboratory identification number)
(d et Sd : mean and standard deviation of the differences (laboratory -reference))
(D : Euclidian distance to YX-axis origin = SQUARE ROOT.(d² + Sd²))
Note : Limits are only indicative and so far do not constitute standard values; they indicate what is normally
reachable by labs for their self evaluation.
Repeatability standard deviation of this ICAR proficiency test (after Cochran elimination at 5 %) SrPT 15 3%
Reproducibility standard deviation of this ICAR proficiency test (after Cochran and Grubbs elimination at 5 %) SRPT 146 27%
ICAR Proficiency Test September 2017

ENUMERATION of SOMATIC CELLS in RAW (cow) MILK - page 2/8 ENUMERATION of SOMATIC CELLS in RAW (cow) MILK - page 3/8
Table II : REPEATABILITY - Absolute difference between replicates in 10 3 cells / ml
Sample Lab
code1 2 3 4 5 6 7 8 9 10 Sr NL
1 0 5 5 10 20 10 10 0 10 20 8 20
2 4 14 8 4 3 5 30 3 4 20 9 20
3 1 2 20 6 9 71 34 18 2 26 20 20
4 2 19 20 2 11 42 0 1 3 4 12 20
5 9 3 11 8 12 43 5 28 7 54 17 20
6 3 46 15 29 53 * 46 25 62 3 3 25 20
7 0 29 11 15 28 18 1 22 2 26 13 20
8 6 15 24 1 2 6 9 4 2 37 11 20
9 8 3 32 26 3 25 18 33 8 98 26 20
10 1 15 3 12 5 28 16 3 8 37 12 20
11 3 7 10 5 5 ** 10 25 5 ** 8 16
12 4 11 23 2 3 16 2 8 3 8 7 20
13 1 7 4 3 6 5 13 34 16 29 11 20
14 1 0 1 0 0 6 2 0 1 2 2 20
15 1 3 3 3 2 17 10 20 2 62 15 20
16 10 10 0 10 10 10 20 40 0 30 13 20
17 2 2 7 8 2 9 21 59 5 28 16 20
18 1 0 4 5 7 23 20 7 0 28 10 20
19 7 27 20 17 7 12 41 41 4 6 16 20
20 0 5 6 5 8 38 4 24 1 1 10 20
21 0 10 10 2 10 32 11 60 8 2 16 20
22 5 4 3 3 5 44 7 71 3 3 19 20
23 2 24 16 39 18 56 4 54 6 26 22 20
24 1 23 2 23 19 91 22 111 * 13 48 35 20
25 2 34 7 10 20 2 21 19 8 16 12 20
26 17 * 9 39 13 7 9 27 7 12 86 23 20
27 1 38 5 10 3 15 12 15 4 20 11 20
28 3 11 5 20 7 31 15 35 11 18 13 20
29 2 7 4 1 1 7 4 8 2 6 3 20
30 5 6 1 3 8 20 44 2 4 15 12 20
31 3 5 2 3 4 10 5 17 5 7 5 20
32 4 2 17 22 11 30 0 27 10 21 12 20
33 13 21 3 1 17 1 8 32 2 9 10 20
34 0 55 8 23 45 * 8 36 26 7 66 25 20
35 8 34 4 29 24 3 63 23 0 38 21 20
36 2 26 7 11 6 35 40 17 29 * 10 16 20
37 0 17 21 13 6 46 16 3 0 26 14 20
38 3 9 2 10 12 20 40 9 3 8 11 20
39 1 3 3 5 9 3 5 2 4 7 3 20
40 1 9 2 4 6 20 15 35 2 21 11 20
Sr 4 14 9 10 11 22 16 24 5 24 796
r 25 63 42 42 50 126 63 126 25 126
NE 80 80 80 80 80 78 80 80 80 78
L 13 60 41 43 34 94 69 91 19 103
Sr : repeatability standard deviation of each laboratory limit : Cf up down
NL : number of measurements per laboratory
L : Limit for difference between duplicates according Cochran test at 5% level.
SE : repeatability standard deviation per sample
NE : number of measurements per sample
*: discarded data using the test of Cochran at 5 %
** : missing data
r : limit of repeatability, absolute difference betwen two replicates according ISO 13366-2│IDF 148-2 : Cf up down
Level 10.3 / ml Sr % r
150 6 25
200 5 42
450 4 50
750 3 63
1500 3 126
ICAR Proficiency Test September 2017

ENUMERATION of SOMATIC CELLS in RAW (cow) MILK - page 3/8 ENUMERATION of SOMATIC CELLS in RAW (cow) MILK - page 4/8
(*) : Data were to modify in right units.
Table III : Means of the replicates in 10 3 cells / ml
Sample Lab
code1 2 3 4 5 6 7 8 9 10
1 40 448 233 145 340 925 605 790 75 1070
2 34 402 208 129 293 819 507 698 60 959
3 48 578 304 191 433 1178 817 1017 110 1255
4 34 455 214 143 328 911 600 800 71 1054
5 42 551 264 173 390 1093 690 888 90 1260
6 42 404 160 100 304 835 560 740 54 999
7 30 417 193 133 305 855 524 678 65 927
8 39 478 231 157 346 997 630 854 81 1149
9 51 634 297 192 469 1292 793 1141 102 1513
10 52 600 302 186 449 1209 791 1030 104 1385
11 60 893 432 266 662 1141 1503 119
12 44 601 292 197 426 1204 783 1026 94 1411
13 34 438 224 152 335 904 578 758 78 1077
14 41 454 221 146 314 905 580 746 70 1022
15 40 569 264 175 400 1176 723 981 83 1359
16 25 425 210 135 315 845 540 700 70 1005
17 67 878 423 285 658 1633 1104 1452 139 1884
18 36 434 216 155 335 904 572 781 78 1026
19 83 * 752 376 239 494 1342 952 1290 134 1746
20 47 665 313 200 466 1239 845 1107 104 1448
21 36 426 218 135 309 843 565 732 79 975
22 55 581 299 194 462 1313 783 1139 98 1526
23 55 619 312 208 460 1248 819 1077 107 1498
24 55 735 350 230 510 1428 882 1232 113 1586
25 38 444 226 151 325 895 595 762 72 1040
(*) 26 50 605 308 194 450 1274 820 1033 95 1467
27 39 459 218 142 334 928 606 810 77 1145
28 67 706 352 222 523 1438 900 1249 130 1685
29 36 448 219 136 309 892 536 757 74 1023
30 35 453 221 143 321 890 567 766 79 1025
31 30 443 219 143 332 894 578 779 73 1053
32 43 470 240 144 340 977 623 825 70 1127
33 41 362 177 115 278 754 480 679 63 863
34 49 589 257 172 415 1192 705 1052 95 1369
35 42 499 250 170 368 1039 655 867 81 1183
36 34 447 221 139 321 901 617 796 71 1055
37 48 610 309 202 441 1236 766 1019 104 1441
38 39 437 220 148 320 874 572 734 77 1034
39 40 447 234 148 335 924 608 791 76 1072
40 51 576 306 185 443 1260 785 1048 101 1397
M 43 536 263 170 391 1063 695 928 88 1234
REF. 43 526 260 168 385 1060 686 918 87 1227
SD 10 128 63 40 92 214 158 214 21 254
M = mean per sample REF. = reference values
SD = standard deviation per sample *: discarded data using the test of Grubbs 5 %
REF : Assigned values are robust average values per sample according to algorithm A of standard ISO 13528,
of 39 laboratories using the reference method ISO 13366│IDF 148-1 and alternative method
ISO 13366-2│IDF 148-2, after outlier discarging using Grubbs test at 5% risk level
Table IV : Outlier identification
Sample 1 2 3 4 5 6 7 8 9 10
Outliers
Cochran
Outlier
Grubbs
sr 3 14 9 10 8 22 16 21 4 24
SR 10 128 63 41 94 215 158 212 21 254
sr % 7% 3% 4% 6% 2% 2% 2% 2% 5% 2%
SR % 23% 24% 24% 24% 24% 20% 23% 23% 24% 21%
ICAR Proficiency Test September 2017
36
19
26 6; 34 24

ENUMERATION of SOMATIC CELLS in RAW (cow) MILK - page 4/8 ENUMERATION of SOMATIC CELLS in RAW (cow) MILK - page 5/8
Table V : ACCURACY - differences (laboratory - reference) in %
Sample Lab
code1 2 3 4 5 6 7 8 9 10 d Sdlab t
1 - 6% - 15% - 10% - 14% - 12% - 13% - 12% - 14% - 14% - 13% - 13% 10% 3,92
2 - 20% - 24% - 20% - 23% - 24% - 23% - 26% - 24% - 31% - 22% - 23% 18% 4,12
3 + 11% + 10% + 17% + 14% + 12% + 11% + 19% + 11% + 27% + 2% + 11% 8% 4,15
4 - 20% - 14% - 18% - 15% - 15% - 14% - 13% - 13% - 19% - 14% - 14% 11% 4,22
5 - 3% + 5% + 1% + 3% + 1% + 3% + 1% - 3% + 3% + 3% + 1% 3% 1,34
6 - 3% - 23% - 39% - 41% - 21% - 21% - 18% - 19% - 38% - 19% - 22% 14% 4,84
7 - 30% - 21% - 26% - 21% - 21% - 19% - 24% - 26% - 25% - 24% - 23% 18% 3,94
8 - 9% - 9% - 11% - 7% - 10% - 6% - 8% - 7% - 7% - 6% - 7% 5% 4,76
9 + 20% + 20% + 14% + 14% + 22% + 22% + 16% + 24% + 18% + 23% + 21% 19% 3,53
10 + 21% + 14% + 16% + 11% + 16% + 14% + 15% + 12% + 20% + 13% + 14% 10% 4,32
11 + 39% + 70% + 66% + 58% + 72% + 66% + 64% + 37% + 47% 39% 3,42
12 + 3% + 14% + 12% + 17% + 10% + 14% + 14% + 12% + 8% + 15% + 13% 11% 3,72
13 - 21% - 17% - 14% - 10% - 13% - 15% - 16% - 17% - 10% - 12% - 15% 12% 3,98
14 - 5% - 14% - 15% - 13% - 18% - 15% - 15% - 19% - 20% - 17% - 16% 13% 3,85
15 - 7% + 8% + 1% + 4% + 4% + 11% + 5% + 7% - 4% + 11% + 8% 9% 2,63
16 - 41% - 19% - 19% - 20% - 18% - 20% - 21% - 24% - 19% - 18% - 20% 16% 4,06
17 + 57% + 67% + 63% + 70% + 71% + 54% + 61% + 58% + 60% + 54% + 59% 42% 4,42
18 - 17% - 18% - 17% - 8% - 13% - 15% - 17% - 15% - 10% - 16% - 15% 13% 3,82
19 + 93% + 43% + 45% + 42% + 28% + 27% + 39% + 40% + 54% + 42% + 38% 29% 4,10
20 + 10% + 26% + 21% + 19% + 21% + 17% + 23% + 21% + 19% + 18% + 20% 15% 4,28
21 - 16% - 19% - 16% - 20% - 20% - 20% - 18% - 20% - 9% - 21% - 19% 16% 3,73
22 + 28% + 10% + 15% + 15% + 20% + 24% + 14% + 24% + 12% + 24% + 20% 20% 3,19
23 + 29% + 18% + 20% + 24% + 19% + 18% + 19% + 17% + 23% + 22% + 19% 16% 3,97
24 + 28% + 40% + 35% + 37% + 32% + 35% + 29% + 34% + 30% + 29% + 33% 25% 4,13
25 - 11% - 16% - 13% - 10% - 16% - 16% - 13% - 17% - 17% - 15% - 15% 13% 3,81
26 + 16% + 15% + 18% + 15% + 17% + 20% + 19% + 12% + 9% + 20% + 17% 15% 3,59
27 - 10% - 13% - 16% - 15% - 13% - 12% - 12% - 12% - 11% - 7% - 11% 8% 4,57
28 + 56% + 34% + 35% + 32% + 36% + 36% + 31% + 36% + 49% + 37% + 36% 8% 14,22
29 - 16% - 15% - 16% - 19% - 20% - 16% - 22% - 18% - 15% - 17% - 17% 2% 22,94
30 - 19% - 14% - 15% - 15% - 17% - 16% - 17% - 17% - 9% - 16% - 16% 3% 18,77
31 - 31% - 16% - 16% - 15% - 14% - 16% - 16% - 15% - 16% - 14% - 15% 5% 9,70
32 + 1% - 11% - 8% - 14% - 12% - 8% - 9% - 10% - 19% - 8% - 9% 5% 5,75
33 - 5% - 31% - 32% - 32% - 28% - 29% - 30% - 26% - 27% - 30% - 29% 8% 11,50
34 + 15% + 12% - 1% + 2% + 8% + 12% + 3% + 15% + 9% + 12% + 10% 6% 5,66
35 - 2% - 5% - 4% + 1% - 4% - 2% - 5% - 6% - 7% - 4% - 4% 2% 5,50
36 - 20% - 15% - 15% - 18% - 17% - 15% - 10% - 13% - 19% - 14% - 14% 3% 15,38
37 + 13% + 16% + 19% + 20% + 15% + 17% + 12% + 11% + 20% + 17% + 15% 3% 14,47
38 - 10% - 17% - 15% - 12% - 17% - 18% - 17% - 20% - 12% - 16% - 17% 3% 16,91
39 - 7% - 15% - 10% - 12% - 13% - 13% - 11% - 14% - 12% - 13% - 13% 2% 19,03
40 + 18% + 9% + 18% + 10% + 15% + 19% + 14% + 14% + 16% + 14% + 15% 3% 14,39
d + 1% + 2% + 1% + 1% + 2% + 0% + 1% + 1% + 1% + 1% - 1% 23%
Sd 23% 24% 24% 24% 24% 20% 23% 23% 24% 21%
d = mean of differences Sd = standard deviation of differences t = Student test - comparison to 0
_
Upper limits : d = +/- 10% Sd = 10%
ISO 13366-2│IDF 148-2 : Precision of the method :
6 25 9 38
5 42 8 67
4 50 7 88
3 63 6 126
3 126 6 252
ICAR Proficiency Test September 2017
750
1500
200
450
Level SCC *103 /ml Sr % r SR % R
150

ENUMERATION of SOMATIC CELLS in RAW (cow) MILK - page 5/8 ENUMERATION of SOMATIC CELLS in RAW (cow) MILK - page 6/8
Table VI : Zscore of the different laboratories for each sample.
ZS calculated on the PT standard deviation
Sample Lab
code 1 2 3 4 5 6 7 8 9 10
1 -0,28 -0,62 -0,43 -0,57 -0,49 -0,63 -0,51 -0,60 -0,57 -0,62
2 -0,90 -0,97 -0,82 -0,97 -1,00 -1,13 -1,14 -1,03 -1,30 -1,06
3 +0,50 +0,40 +0,70 +0,57 +0,51 +0,55 +0,83 +0,46 +1,13 +0,11
4 -0,90 -0,56 -0,73 -0,62 -0,62 -0,69 -0,55 -0,55 -0,79 -0,68
5 -0,12 +0,19 +0,06 +0,12 +0,05 +0,15 +0,02 -0,14 +0,13 +0,13
6 -0,12 -0,96 -1,59 -1,71 -0,88 -1,05 -0,80 -0,83 -1,61 -0,90
7 -1,32 -0,86 -1,07 -0,89 -0,87 -0,96 -1,03 -1,12 -1,06 -1,18
8 -0,38 -0,38 -0,46 -0,29 -0,42 -0,29 -0,36 -0,30 -0,28 -0,31
9 +0,87 +0,84 +0,59 +0,60 +0,90 +1,08 +0,68 +1,04 +0,74 +1,13
10 +0,92 +0,57 +0,66 +0,45 +0,69 +0,70 +0,67 +0,52 +0,84 +0,62
11 +1,75 +2,86 +2,74 +2,43 +2,99 +2,89 +2,73 +1,54
12 +0,14 +0,58 +0,51 +0,72 +0,44 +0,67 +0,62 +0,50 +0,33 +0,73
13 -0,95 -0,69 -0,57 -0,41 -0,54 -0,73 -0,69 -0,75 -0,43 -0,59
14 -0,23 -0,57 -0,62 -0,55 -0,77 -0,72 -0,67 -0,80 -0,84 -0,81
15 -0,33 +0,33 +0,06 +0,16 +0,16 +0,54 +0,24 +0,29 -0,18 +0,52
16 -1,84 -0,79 -0,79 -0,82 -0,76 -1,00 -0,93 -1,02 -0,81 -0,87
17 +2,53 +2,75 +2,59 +2,92 +2,95 +2,67 +2,65 +2,49 +2,51 +2,59
18 -0,75 -0,72 -0,69 -0,34 -0,55 -0,73 -0,72 -0,64 -0,43 -0,79
19 +4,14 +1,76 +1,85 +1,76 +1,17 +1,32 +1,69 +1,73 +2,29 +2,05
20 +0,45 +1,08 +0,85 +0,79 +0,87 +0,84 +1,01 +0,88 +0,81 +0,87
21 -0,69 -0,78 -0,66 -0,82 -0,82 -1,01 -0,77 -0,87 -0,38 -0,99
22 +1,23 +0,43 +0,62 +0,64 +0,83 +1,18 +0,61 +1,03 +0,52 +1,18
23 +1,28 +0,72 +0,83 +0,99 +0,81 +0,88 +0,85 +0,74 +0,98 +1,07
24 +1,23 +1,63 +1,43 +1,54 +1,35 +1,72 +1,24 +1,46 +1,25 +1,42
25 -0,49 -0,64 -0,54 -0,42 -0,65 -0,77 -0,58 -0,73 -0,72 -0,74
26 +0,71 +0,61 +0,76 +0,64 +0,70 +1,00 +0,85 +0,53 +0,40 +0,95
27 -0,43 -0,53 -0,67 -0,65 -0,56 -0,62 -0,51 -0,51 -0,47 -0,32
28 +2,48 +1,40 +1,46 +1,35 +1,49 +1,76 +1,36 +1,54 +2,07 +1,81
29 -0,69 -0,62 -0,65 -0,81 -0,83 -0,79 -0,95 -0,75 -0,62 -0,80
30 -0,85 -0,57 -0,62 -0,64 -0,69 -0,79 -0,75 -0,71 -0,38 -0,80
31 -1,37 -0,66 -0,65 -0,64 -0,57 -0,77 -0,69 -0,65 -0,69 -0,69
32 +0,03 -0,44 -0,32 -0,60 -0,49 -0,39 -0,40 -0,44 -0,81 -0,39
33 -0,23 -1,29 -1,32 -1,34 -1,16 -1,43 -1,31 -1,12 -1,15 -1,44
34 +0,66 +0,49 -0,04 +0,09 +0,32 +0,62 +0,12 +0,62 +0,38 +0,56
35 -0,07 -0,21 -0,15 +0,04 -0,19 -0,10 -0,20 -0,24 -0,28 -0,17
36 -0,90 -0,62 -0,62 -0,74 -0,69 -0,74 -0,44 -0,57 -0,79 -0,68
37 +0,55 +0,65 +0,78 +0,84 +0,60 +0,82 +0,51 +0,47 +0,84 +0,85
38 -0,43 -0,70 -0,63 -0,50 -0,70 -0,87 -0,72 -0,86 -0,50 -0,76
39 -0,33 -0,62 -0,42 -0,51 -0,55 -0,64 -0,50 -0,59 -0,52 -0,61
40 +0,82 +0,38 +0,74 +0,42 +0,63 +0,93 +0,63 +0,60 +0,69 +0,67
In yellow the values bigger or smaller than 2/-2 In red the values bigger or smaller than 3/-3
Figure 2 :
Zscore of the different laboratories for each sample. ZS calculated on the PT standard deviation
ICAR Proficiency Test September 2017
-5
-4
-3
-2
-1
0
1
2
3
4
5
1 2 3 4 5 6 7 8 9 10111213141516171819202122232425262728293031323334353637383940
Z sc
ore
PT
Laboratory code
sample1 sample2
sample 3 sample 4
sample 5 sample 6
sample 7 sample 8
sample 9 sample 10

ENUMERATION of SOMATIC CELLS in RAW (cow) MILK - page 6/8 ENUMERATION of SOMATIC CELLS in RAW (cow) MILK - page 7/8
Table VII : Zscore of the different laboratories for each sample.
ZS calculated on the standard deviation of reproducibility of the method
Sample Lab
code 1 2 3 4 5 6 7 8 9 10
1 -0,69 -2,14 -1,16 -1,52 -1,46 -2,12 -1,68 -2,33 -1,51 -2,13
2 -2,26 -3,38 -2,21 -2,58 -3,01 -3,80 -3,73 -4,01 -3,43 -3,64
3 +1,26 +1,40 +1,90 +1,52 +1,54 +1,85 +2,73 +1,79 +2,98 +0,39
4 -2,26 -1,95 -1,95 -1,65 -1,87 -2,34 -1,79 -2,15 -2,08 -2,35
5 -0,30 +0,65 +0,16 +0,33 +0,16 +0,51 +0,08 -0,55 +0,35 +0,45
6 -0,30 -3,32 -4,29 -4,53 -2,65 -3,54 -2,63 -3,23 -4,26 -3,10
7 -3,30 -2,98 -2,87 -2,35 -2,60 -3,22 -3,38 -4,36 -2,79 -4,07
8 -0,95 -1,33 -1,23 -0,76 -1,27 -0,99 -1,17 -1,16 -0,74 -1,06
9 +2,17 +2,91 +1,60 +1,59 +2,71 +3,64 +2,23 +4,04 +1,95 +3,89
10 +2,30 +1,98 +1,79 +1,19 +2,06 +2,35 +2,19 +2,02 +2,21 +2,15
11 +4,38 +9,94 +7,37 +6,45 +8,97 +9,48 +10,61 +4,06
12 +0,35 +2,01 +1,36 +1,92 +1,31 +2,27 +2,02 +1,96 +0,86 +2,51
13 -2,39 -2,41 -1,53 -1,09 -1,63 -2,46 -2,26 -2,91 -1,12 -2,04
14 -0,56 -1,96 -1,68 -1,45 -2,31 -2,43 -2,21 -3,12 -2,21 -2,78
15 -0,82 +1,14 +0,16 +0,43 +0,48 +1,82 +0,77 +1,14 -0,48 +1,80
16 -4,60 -2,75 -2,13 -2,18 -2,28 -3,38 -3,04 -3,96 -2,15 -3,01
17 +6,34 +9,54 +6,97 +7,74 +8,86 +9,01 +8,70 +9,68 +6,63 +8,93
18 -1,87 -2,51 -1,87 -0,89 -1,64 -2,46 -2,37 -2,50 -1,12 -2,73
19 +10,37 +6,11 +4,98 +4,66 +3,52 +4,44 +5,53 +6,74 +6,05 +7,06
20 +1,13 +3,75 +2,28 +2,08 +2,63 +2,82 +3,31 +3,43 +2,14 +3,00
21 -1,74 -2,72 -1,78 -2,18 -2,47 -3,41 -2,53 -3,38 -0,99 -3,42
22 +3,08 +1,48 +1,66 +1,69 +2,48 +3,98 +2,01 +4,00 +1,37 +4,06
23 +3,21 +2,51 +2,24 +2,61 +2,43 +2,96 +2,77 +2,88 +2,59 +3,69
24 +3,08 +5,65 +3,86 +4,07 +4,04 +5,78 +4,09 +5,69 +3,30 +4,88
25 -1,22 -2,24 -1,46 -1,12 -1,95 -2,59 -1,90 -2,84 -1,89 -2,54
26 +1,78 +2,12 +2,05 +1,69 +2,09 +3,36 +2,78 +2,08 +1,05 +3,27
27 -1,09 -1,83 -1,80 -1,72 -1,68 -2,08 -1,66 -1,97 -1,25 -1,11
28 +6,21 +4,86 +3,93 +3,57 +4,46 +5,94 +4,45 +6,00 +5,47 +6,23
29 -1,74 -2,14 -1,74 -2,15 -2,49 -2,65 -3,12 -2,93 -1,63 -2,77
30 -2,13 -1,99 -1,68 -1,69 -2,08 -2,67 -2,48 -2,76 -0,99 -2,75
31 -3,43 -2,28 -1,74 -1,69 -1,72 -2,61 -2,26 -2,53 -1,83 -2,37
32 +0,09 -1,53 -0,86 -1,59 -1,48 -1,30 -1,31 -1,70 -2,15 -1,36
33 -0,56 -4,47 -3,56 -3,54 -3,49 -4,82 -4,29 -4,34 -3,04 -4,95
34 +1,65 +1,69 -0,11 +0,23 +0,95 +2,08 +0,40 +2,43 +0,99 +1,93
35 -0,17 -0,74 -0,41 +0,10 -0,56 -0,34 -0,65 -0,94 -0,74 -0,59
36 -2,26 -2,15 -1,68 -1,95 -2,08 -2,51 -1,43 -2,23 -2,08 -2,33
37 +1,39 +2,26 +2,09 +2,22 +1,81 +2,77 +1,67 +1,82 +2,21 +2,91
38 -1,09 -2,44 -1,70 -1,32 -2,11 -2,92 -2,37 -3,35 -1,31 -2,62
39 -0,82 -2,17 -1,12 -1,36 -1,64 -2,14 -1,63 -2,31 -1,38 -2,11
40 +2,04 +1,33 +1,98 +1,12 +1,88 +3,15 +2,05 +2,35 +1,82 +2,31
This table will allows to compare your ZSCORE from one PT to an other because the standard deviation
has always the value of SR of the method SR : Cf page 5./8
In yellow the values bigger or smaller than 2/-2 In red the values bigger or smaller than 3/-3
Figure 3 :
Zscore of the different laboratories for each sample. ZS calculated on the standard deviation of reproducibility of the method
ICAR Proficiency Test September 2017
-5
-4
-3
-2
-1
0
1
2
3
4
5
1 2 3 4 5 6 7 8 9 10 11 12 13 14 15 16 17 18 19 20 21 22 23 24 25 26 27 28 29 30 31 32 33 34 35 36 37 38 39 40
Z sc
ore
Fix
Laboratory code
sample1 sample2
sample 3 sample 4
sample 5 sample 6
sample 7 sample 8
sample 9 sample 10

ENUMERATION of SOMATIC CELLS in RAW (cow) MILK - page 7/8 ENUMERATION of SOMATIC CELLS in RAW (cow) MILK - page 8/8
Figure 1 : ACCURACY - Evaluation of the individual performances (to see table I).
Reference Method ISO 13366-1 IDF 148-1
Name City Country
Actalia Poligny FranceAgroscope 3003 Bern-Liebefeld SwitzerlandAlip Sousada Portugal Cattle Information Service (CIS) Teiford Shropshire TF3BD England
Central Milk Lab ICBA Caesarea IL
ChemoMetec A/S Allerød Denmark
Comité du Lait ASBL Battice Belgium
Dairy Cattle Res. Center Shandong Academy of Agr. Sc. Shandong China
Deltamune Centurion - Pretoria South Africa
Direction de l' Amelioration Genetique Sidi Thabet Tunisie
Eastern Lab services Medina USA
Eurofins Steins Laboratory A/B Jönköping Sweden
Eurofins Steins Laboratory A/S Vejen Denmark
Holstein-Ro Breeders Association Laboratory Bucharest Romania
Lab Agroalimentario de Santander Santander Cantabria Spain
Laborator pro rozbor mléka Brno, Brno Czech Republic
Laborator pro rozbor mléka Bustehrad, Bustehrad Czech Republic
Laboratorija mleka, Poljoprivredni fakultet Novi Sad, Novi Sad Serbia
Laboratorio Standard Latte Maccarese Italy
Laboratorium Oceny Mleka KCHZ Parzniewie Pruszkow Poland
Merieux NutriScience J Bay Cape Town South Africa
Merieux Nutriscience South Africa Cape Town South Africa
Merieux Nutriscience South Africa (Midrand) Midrand South Africa
Milchprüfring Baden-Württemberg e.V. Kirchheim unter Teck Germany
Osuuskunta Satamaito, laboratorio Pori Finland
Pieno Tyrimai Kaunas Lithuania
Qlip B.V., Zutphen NL
Shangai dairy breeding center Co.Ltd Shanghai China
Suisselab AG Zullikofen Switzerland
Taiwan Livestock Research Institute Taiwan Taiwan
Univ. of Pretoria Dept Production Animal Studies Milk Lab Pretoria South Africa
Valacta - Centre d’Expertise en Production Laitière du Québec Quebec Canada
Valio Oy/Seinajoen aluelaboratorio Seinajoki Finland
ICAR Proficiency Test September 2017
LIST OF THE PARTICIPANTS ICAR
ICAR PROFICIENCY TEST
RAW MILK
Somatic Cell Counting
Sep 17
0%
14%
28%
42%
-30% -20% -10% 0% 10% 20% 30%
Sd
Student 5 % Student 5 %
_
d
Trial of : 04/09/2017
40 laboratories
10 samples
34 Labs OUT OF THE TARGET ( 85 % )
1 2 3 4 6 7
9 10 11 12 13 14 16 17 18
19
20
21 22
23
24 25
26
27 28
29
30 31
33
36
ICAR Interlaboratory Proficiency Study - September 2017