Raturi-CDM and the Pacific Island Countries
34
CDM and the Pacific Island Countries Countries Opportunities and challenges Atul Raturi Atul Raturi USP [email protected] Presented at JICA-CDM TV seminar, Suva, October 2008
Transcript of Raturi-CDM and the Pacific Island Countries

CDM and the Pacific Island CountriesCountries
Opportunities and challenges
Atul RaturiAtul RaturiUSP
Presented at JICA-CDM TV seminar, Suva, October 2008
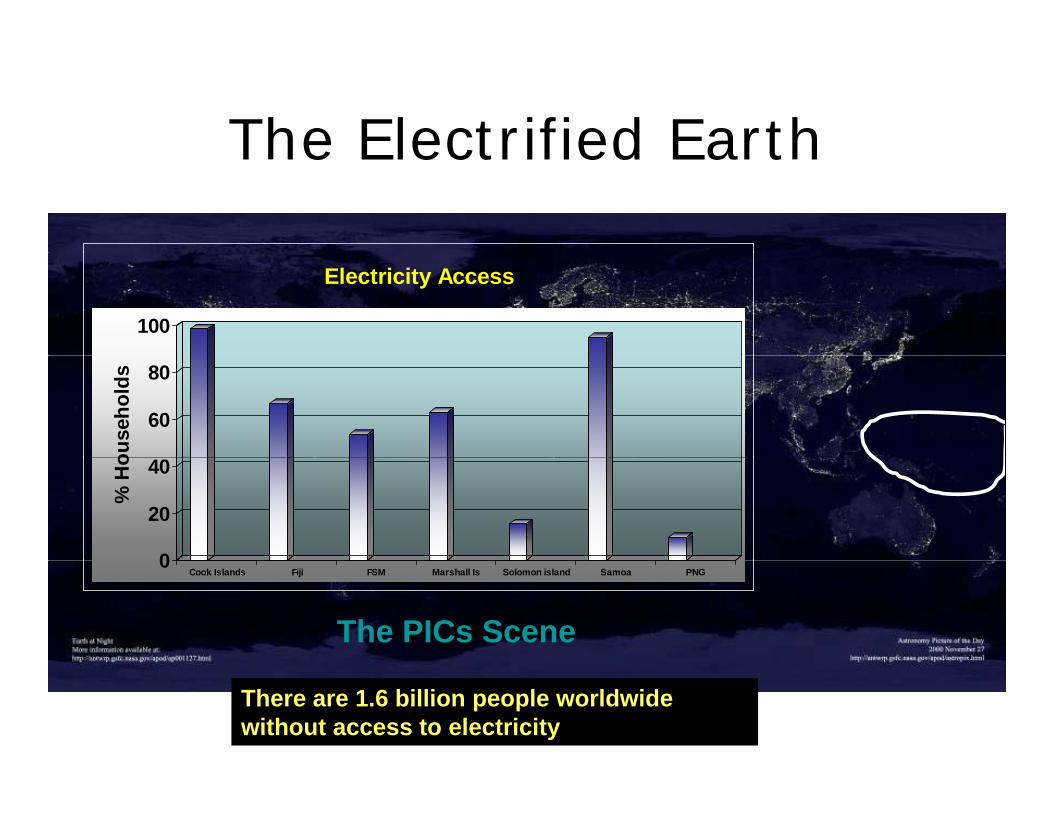
The Electrified EarthThe Electrified Earth
100
Electricity Access
60
80
ouse
hold
s
0
20
40
% H
o
0Cook Islands Fiji FSM Marshall Is Solomon island Samoa PNG
The PICs Scene
There are 1.6 billion people worldwide without access to electricity

PIC Electricity generation
Cook Islands All DieselCook Islands All Diesel
FSM All Diesel
Kiribati All Diesel
Marshall Islands All Diesel
Niue All Diesel
Palau All Diesel
Tuvalu All Diesel
Tokelau All Diesel
Tonga All DieselTonga All Diesel
Vanuatu 93% DieselSource : PIREP report
PNG 35% Hydro,39% oil,25% Natural gas

FEA Electricity generationFEA Electricity generation
Hydro
Diesel/other
1990: 94.5 % from hydropower
2003 67 3 % f h d2003: 67.3 % from hydropower
Currently almost 80% is produced using diesel

Carteret Islands, PNGClimate Change effects in PICs
By 2015: All 6 (7 now!!) Islands will beIslands will be submerged. 2000 people displaced
The sea has dissected the Huen Island intothe Huen Island into two.
Similar stories in Kiribati, Tuvalu and others
Photo: Times

Mount Jaya New Guinea IslandClimate Change effects in PICs
Mount Jaya , New Guinea Island
Photo:www.rbgkew.org.uk
Temperature increase on the Island ~ 0.3 Degrees every decade ; Among the fastest in the world
Glaciers have receded more then 300 meters in the last 30 years
Flora and fauna: waiting to be discovered ( if survive !!)g ( )Malaria cases reported at an altitude of 2,100 m.

R bl E j t Renewable Energy projects can help alleviate the two pproblems
•Energy poverty
•GHG emission
l lCDM can play a major role in this effort by providing much-this effort by providing muchneeded revenue.

Small Scale CDM ProjectsSmall Scale CDM Projects
A Small-Scale CDM project is defined as:A Small Scale CDM project is defined as:• Type 1: Renewable energy systems with
< 15MW capacity< 15MW capacity• Type 2: Energy Efficiency projects with a
i f 60 GWhsaving of < 60 GWh per year• Type 3 : Any other project emitting < 60
Kilo tonnes CO2 per year.

Type 1:
Project Categories
Type 1: • I.A. Electric generation by the user• I.B. Mechanical energy for the user• I.C. Thermal energy for the user• I.D. Renewable electricity generation for a grid.
Type 2:• II.A. Supply side energy efficiency improvements – transmission and II.A. Supply side energy efficiency improvements transmission and
distribution• II.B. Supply side energy efficiency improvements – generation• II.C. Demand-side energy efficiency programs for specific technologies• II D Energy efficiency and fuel switching measures for industrial facilities• II.D. Energy efficiency and fuel switching measures for industrial facilities• II.E. Energy efficiency and fuel switching measures for buildings
Type 3:III A A i lt• III.A Agriculture
• III.B Switching fossil fuels• III.C Emission reductions by low-greenhouse gas emitting vehicles• III.D Methane recovery and avoidance y

CDM Project CycleCDM Project Cycle
UNEP RISO E Center
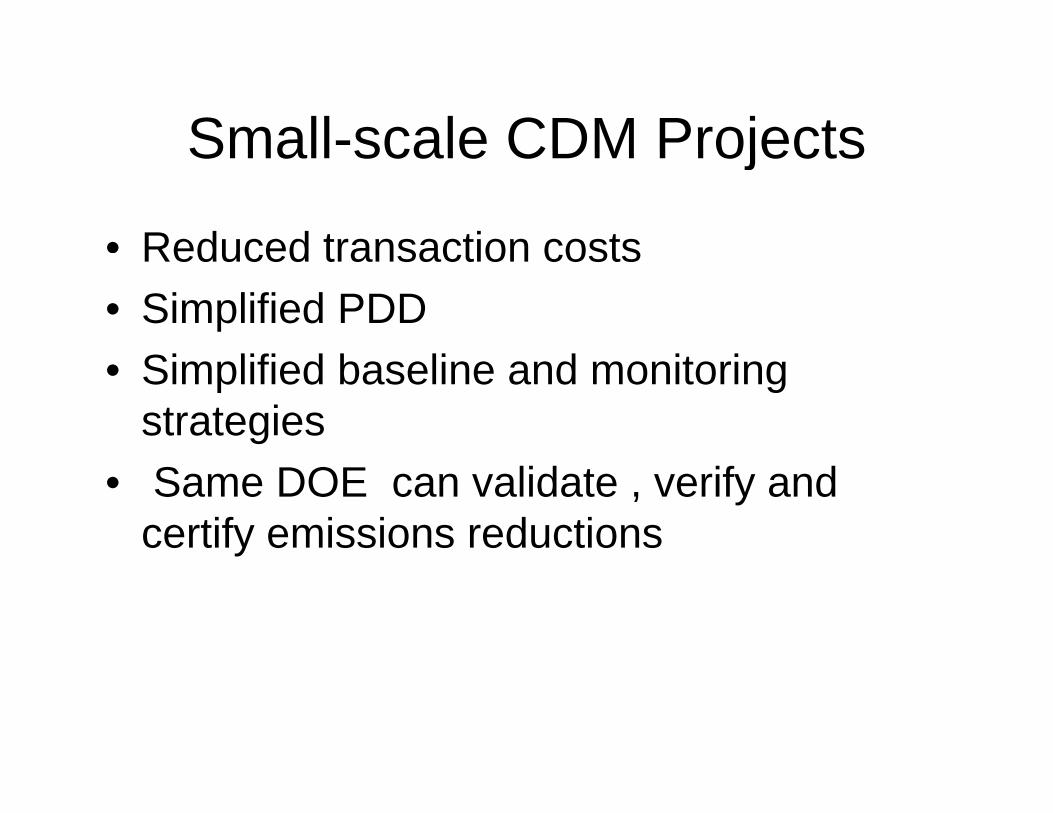
Small-scale CDM ProjectsSmall scale CDM Projects
• Reduced transaction costsReduced transaction costs• Simplified PDD
Si lifi d b li d it i• Simplified baseline and monitoring strategies
• Same DOE can validate , verify and certify emissions reductions

CDM Projects:Costs involved*Project Item Full Scale (USD) Small Scale(USD)
PIN development 20,000 15,000
PDD Preparation 45,000 25,000
Consultation and DNA l
10,000 5,000approval Validation by DOE 30,000 12,500
Registration Fee 30,000 5,000Registration Fee 30,000 5,000
Transaction negotiation 20,000 15,000
Project monitoring Variable VariableProject monitoring Variable Variable
Verifications & Certification
25,000 12,500
TOTAL (approximate) >180,000 >90,000
*Green Markets International

Carbon Revenue Estimates*Carbon Revenue EstimatesTechnology System
C itSystem cost CO2 reduced CER income
Capacity (Example)
(Example) (t CO2 )/year % of system cost
Wind Power 10MW $12,500,000 21,000 21%
Hydro Power 1.5 MW $2,000,000 6,000 38%y , , ,
Assumptions: $12.50/CER^, 0.8 tCO2/MWh emission factor, Wind Capacity factor: 30%,Hydro capacity factor 55%
*Green Markets International^Current rates: $20-25 per CER.
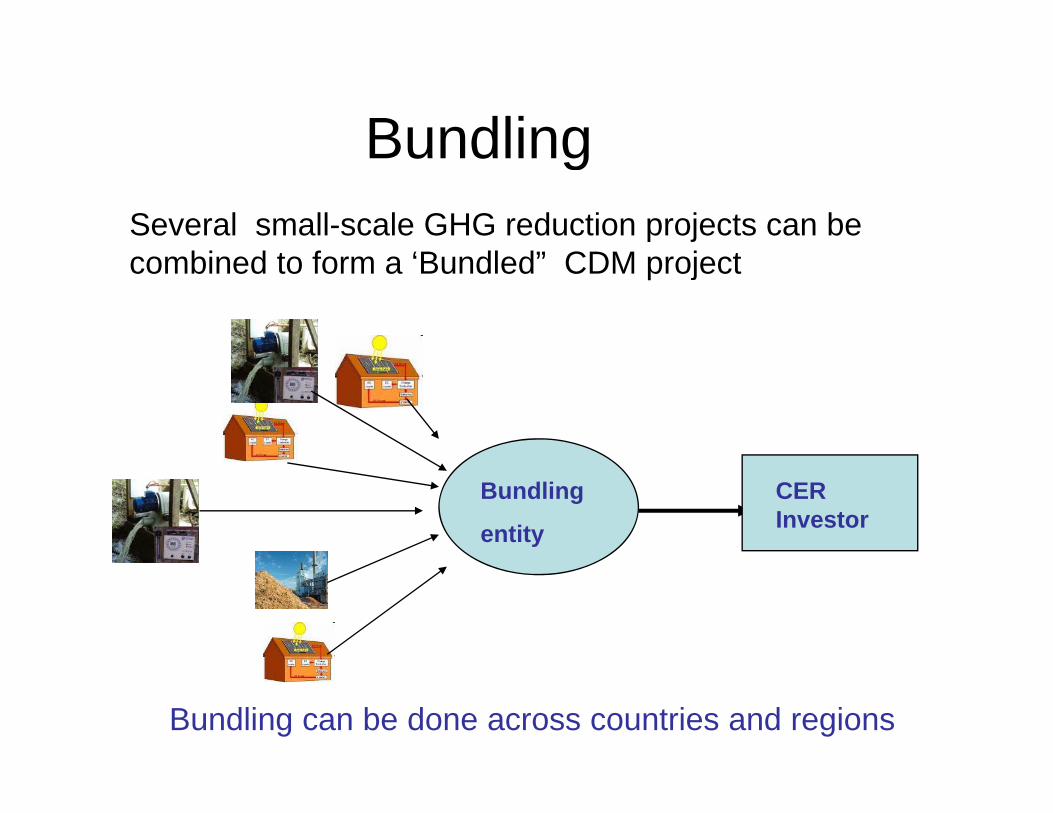
BundlingBundling Several small-scale GHG reduction projects can be
bi d t f ‘B dl d” CDM j tcombined to form a ‘Bundled” CDM project
Bundling
entity
CER Investor
Bundling can be done across countries and regions

Additionality for SS CDMAdditionality for SS CDM
It is imperative to show that a proposed projectIt is imperative to show that a proposed project is ‘additional’: sometimes a difficult condition . SS CDM projects can be shown to be additional by highlighting the barriers:
• Investment barrier• Technological barrier• Prevailing practices barrier
A th b i th t ld h t ib t d t• Any other barrier that would have contributed to higher emissions.

Programmatic CDMProgrammatic CDM
A programme of activities for GHGA programme of activities for GHG reduction. For example:
•Demand Side Management(DSM)
•Implementation of Appliances Standards and Labelling programmeStandards and Labelling programme (S&L)
•Minimum Energy Performance•Minimum Energy Performance Standards (MEPS)
•Energy efficient lightsEnergy efficient lights

Projected Energy Savings in PICs
With Energy labelling and MEPSWith Energy labelling and MEPS
Energy savings ( Refrigerators + AC)
20
25
30
5
10
15%
Source: SRCI,1995
0
5
Fiji SI Palau Samoa Tonga Kiribati Tuvalu PNG
Example- Thailand: CO2 reductions= 0.9 Million MT annually through S & L

Unilateral CDM ProjectsUnilateral CDM Projects
• No declared investor- only host countryNo declared investor only host country• Nearly half the registered projects are
unilateralunilateral• Reduced transaction costs • Increased price of CERs• Increased price of CERs• Good for small-scale projects
I t it b ildi i d• In-country capacity building required• Less technology transfer

Potential ProjectsPotential Projects
• Kadavu: Solar LightingKadavu: Solar Lighting• PNG, Solomon Islands: Kerosene lamps
replacementreplacement • Rotuma: Coconut Oil • Energy efficiency ( CFL ) • Wastewater to biogas (methane )g ( )• Landfill methane

Example: Kadavu Solar Lighting
Electricity generation using PV in place of diesel generators : 75 villages @12 4 Electricity generation using PV in place of diesel generators : 75 villages @12.4 kWh/day/village will result in a saving of ~ 375 t CO2 annually
Replacing kerosene lamps with LED lights: 2000 households x 1 liter kerosene/day x 2.8 kg CO2/L x 365 days = a saving of ~ 2,044 t CO2 annually

Rotuma Electricity : Fuel SwitchRotuma Electricity : Fuel SwitchCurrent situation:
Total demand ( including water pumping): 773.8 kWh/day
Diesel used: 360 liters/day= 132,000 L per annum
GHG t d 323 4 MTGHG generated = 323.4 MT per annumCDM Project:
SOPAC
CDM Project:
Replace diesel by Coconut Oil
CER income: 8 000 USD SOPACCER income: 8,000 USD
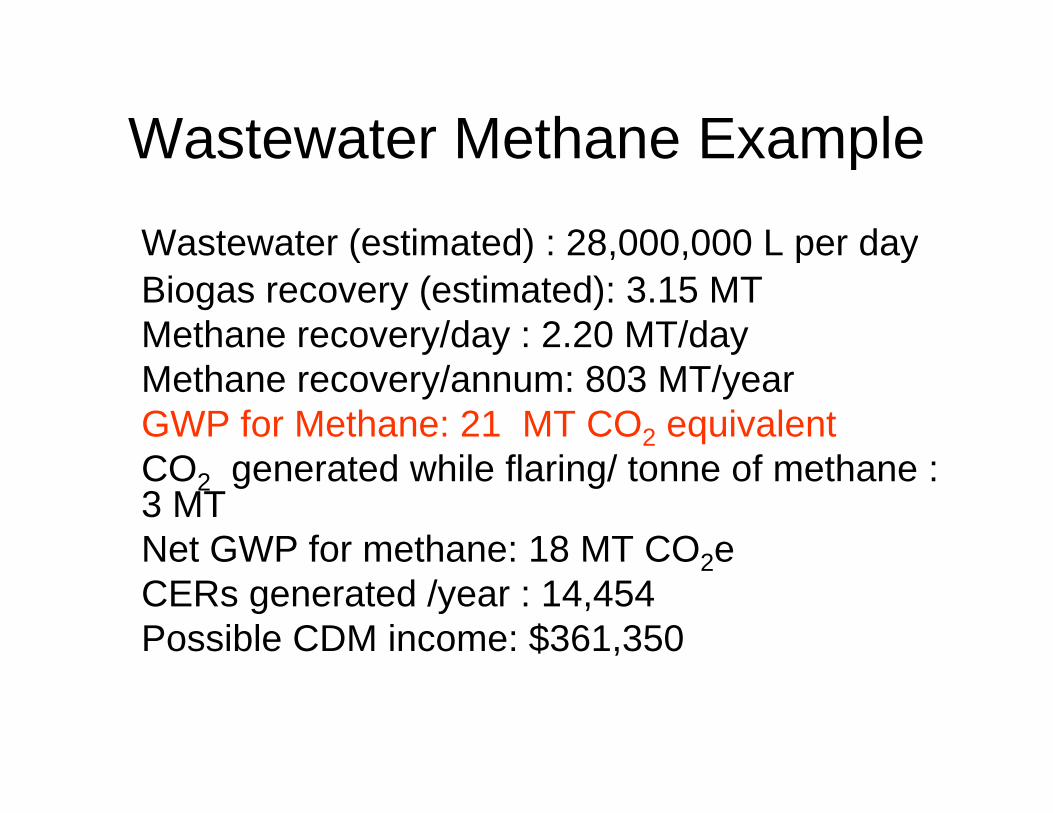
Wastewater Methane ExampleWastewater Methane ExampleWastewater (estimated) : 28,000,000 L per dayWastewater (estimated) : 28,000,000 L per dayBiogas recovery (estimated): 3.15 MTMethane recovery/day : 2.20 MT/day Methane recovery/annum: 803 MT/year GWP for Methane: 21 MT CO2 equivalentCO t d hil fl i / t f thCO2 generated while flaring/ tonne of methane : 3 MTNet GWP for methane: 18 MT CO2eNet GWP for methane: 18 MT CO2eCERs generated /year : 14,454Possible CDM income: $361,350

Kerosene based lighting
About 90% of the people in PNG use kerosene for lighting
A kerosene wick lantern produces~ 1 lux (lumen/m2) at 1 m
About 90% of the people in PNG use kerosene for lighting
~ 35 Million Liters/ year ~ 98 M kg of CO2 equivalent
A kerosene wick lantern produces 1 lux (lumen/m ) at 1 m distance
Used 4 hours/day a kerosene lamp emits 100kg of CO2 annually.
Annual light output of a kerosene lamp = light produced by a 100 W incandescent lamp in 10 hours : Highly inefficient

White Light Emitting Di d (WLED) b d WLED (5W)Diode (WLED) based lighting
WLED (5W)
• Efficiency~ 100 lumens/watt(0.1lumen/watt for kerosene)
• Solid state lighting• Solid state lighting• Indestructible, lifetime-100,000
hours,30-40 years• Very low power requirement: 1 watt • Very low power requirement: 1 watt
wled requires 80% less power than a CFL
• Connected to a rechargeable battery g ycan be used anywhere
• Recharging: solar, manual (pedal power) etc.
CDM project: Replace kerosene lamps by WLED lights
Afforestation & Reforestation B d CDM P jBased CDM Projects
Small Scale A & R project activitiesSmall Scale A & R project activities• Threshold limit of net anthropogenic
GHG removals by sinks of 16 kt CO perGHG removals by sinks of 16 kt CO2 per yearI l t d b l i iti• Implemented by low income communitiesSmall scale projects-unable to meet the minimum demand from buyers, Reduced competitiveness
Reducing Emissions from deforestation inReducing Emissions from deforestation in Developing Countries ( REDD): Post 2012
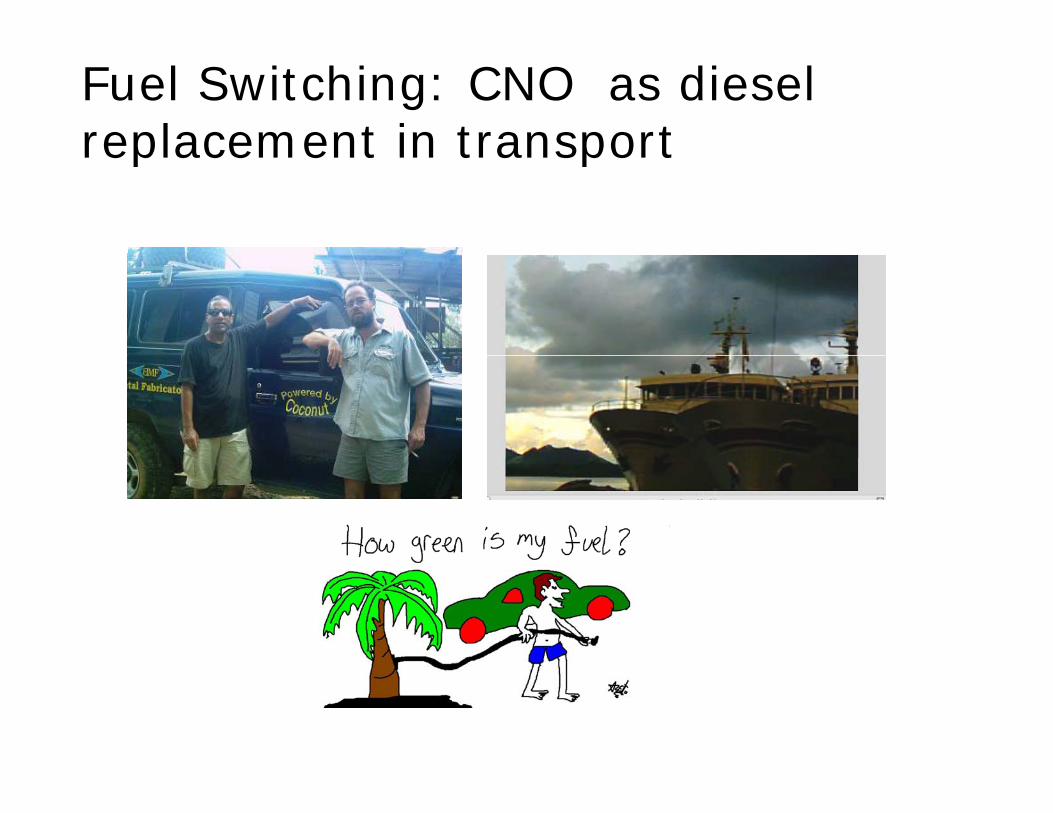
Fuel Switching: CNO as diesel replacement in transportreplacement in transport
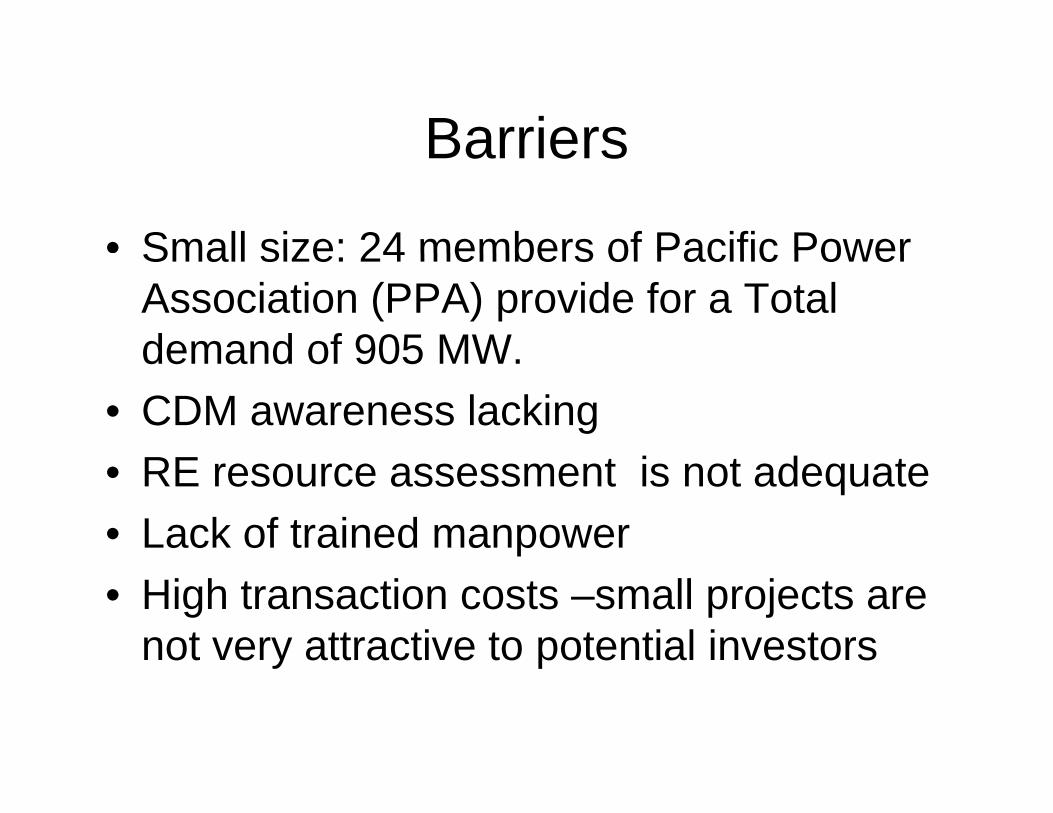
BarriersBarriers
• Small size: 24 members of Pacific PowerSmall size: 24 members of Pacific Power Association (PPA) provide for a Total demand of 905 MWdemand of 905 MW.
• CDM awareness lackingRE t i t d t• RE resource assessment is not adequate
• Lack of trained manpower• High transaction costs –small projects are
not very attractive to potential investorsy p

Fiji:CDM Projectj j
S ll S l d b dl d j t•Small Scale and bundled projects
•2 run-of-river hydro projects. Vaturu (3 MW) and Wainikasou (6.5 MW)-displace diesel generation) p g
•Developed by Pacific Hydro and FEA
•Combine output: 35 GWh/year
•CDM registration : October 2005
•24,928 tonnes of CO2 reduction per year
•Fully Bank Implemented( ABN -AMRO)

PNG CDM ProjectPNG CDM Project
•Lihir Gold Mines: Geothermal plant replacing diesel generation
•55 MW l plant. 411 GWh per year
•First and only CDM project in PNG
•Will reduce 2,789,037 tonnes of CO2 reduction over 10 years
•No annex-1 country partner
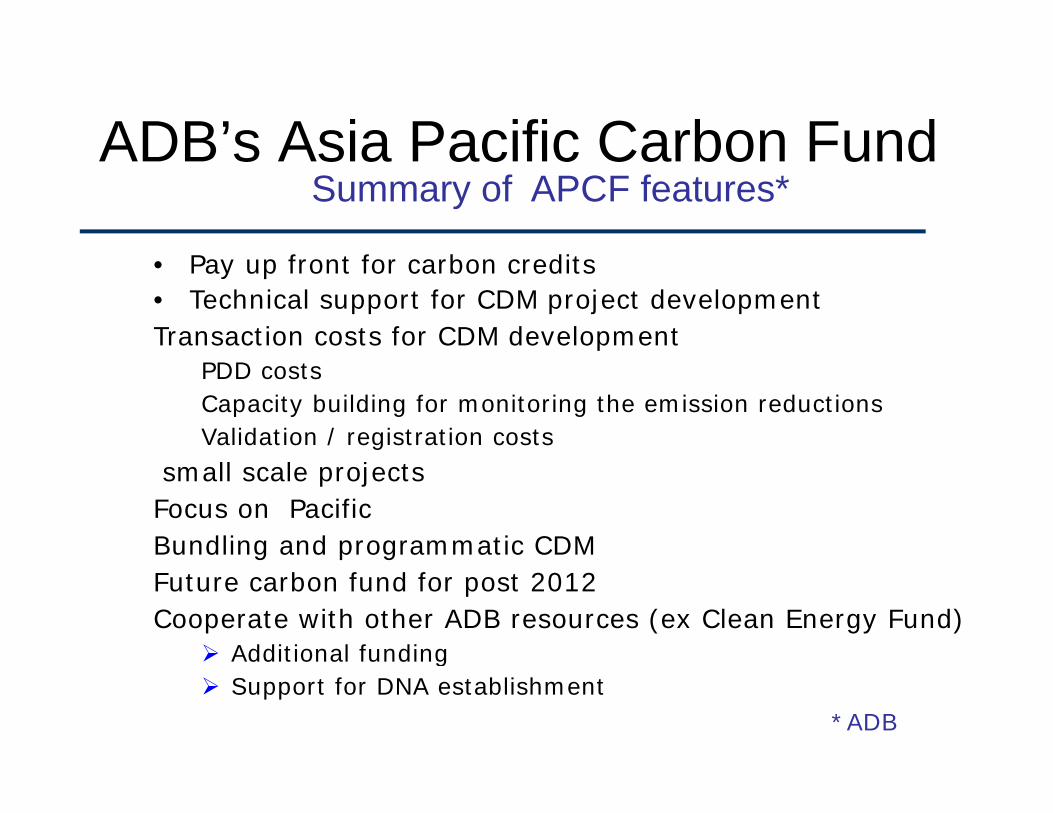
ADB’s Asia Pacific Carbon FundADB s Asia Pacific Carbon FundSummary of APCF features*
• Pay up front for carbon credits• Technical support for CDM project developmentTransaction costs for CDM development
PDD costsCapacity building for monitoring the emission reductionsValidation / registration costs
small scale projectsFocus on PacificBundling and programmatic CDMFuture carbon fund for post 2012Cooperate with other ADB resources (ex Clean Energy Fund)
Additional fundinggSupport for DNA establishment
*ADB

RETScreen- A Tool For RE d EE P F ilbili S diRE and EE Pre- Feasilbility Studies
PV3

The Way ForwardThe Way Forward
• Establish DNA in all PICsEstablish DNA in all PICs• Capacity building
M ki CDM t f th t• Making CDM as part of other government policies
• Awareness among private and public sector about the CDM possibilities
• Develop many small scale projects country/region widey g

FinallyFinally CDM provides the Developing Countries an opportunity to expand their Renewablean opportunity to expand their Renewable Energy Projects and enhance Energy Efficiency Measures. y
All stakeholders should come together toAll stakeholders should come together to take advantage of this mechanism and make Energy Access and CDM a win-win gycombination.

ReferencesReferences• Small scale CDM projects: Yuzi Mizuno, 2004
E bli PIC t ti i t ff ti l i CDM ti iti Il Mill• Enabling PICs to participate more effectively in CDM activities: Ilona Millar, FIELD,2007
• The International Carbon reduction Market: Green Markets International, 2006S ll I l d St t th CDM d C b Fi T R 2005• Small Island States, the CDM and Carbon Finance, Tom Roper,2005
• Renewable Energy and the CDM , Federal Ministry for the environment, Germany, 2007
• International CDM market :Dr. Manuel Fuentes, 2006• PDD Lihir Gold and Pacific Hydro projects• Cosbey et al: Making development work in CDM, 2006• Forests and the CDM and Developments in the dialogue on reducing
emissions from deforestation: Hooda,N., 2007, ,• Methods and guidelines for assessing afforestation and reforestation
projects under cdm: Murthy, I.