Chapter 8 Confidence Intervals 8.2 Confidence Intervals About , Unknown.
Upload
alden-greeneCategory
view
66download
4description
1
Ratio-Based Lengths of Intervals to Improve
Fuzzy Time Series Forecasting
Kunhuang Huarng, Member, IEEE, and Tiffany Hui-Kuang Yu
2
Outline
Introduction Ratio-based lengths of intervals Enrollment forecasting with ratio-based
lengths of intervals Empirical analyses Conclusion
3
Introduction
Time series forecasting is used to forecast the future based on historical observations
there are problems with multiple values for observations.
For example, there are multiple readings in the daily stock market
4
the closing price as the daily stock index are not considered to be very objective
modeling the observations found in these types of problems by using a fuzzy set or a fuzzy number seems to be more appropriate. As a result, fuzzy time series models seem to be more appropriate
5
6
In fuzzification, the determination of the lengths of intervals is critical.
In many previous models for enrollment forecasting,the lengths of the intervals were set the same and all were as arbitrary as 1000.
7
However,one recent study has demonstrated that the lengths of intervals could greatly affect the forecasting results
Including average-based and distribution-based ones
The forecasting results based on these effective lengths of intervals outperformed those arising from the arbitrary lengths in other models.
8
Three applications are used to demonstrate how ratio-based lengths of intervals improve forecasting results, namely, enrollment, stock indices, and inventory demand
enrollment has been used in many fuzzy time series studies
9
Ratio-based lengths of intervals
many time series have the momentum to oscillate more when the context is large, and less when the context is small.
For example, there is a price limit regulation The Tokyo Stock Exchange imposes daily price limits of 20% and the Taiwan Stock Exchange similar limits of 7%
10
If the lengths of the intervals are set too large, there will be no fluctuations in the fuzzy time series.
For instance, when using the time series data as 5000, 5100, , 10000, 10100, if we set the ratio too large, say 200%, the first interval will be between 5000 and 15 000 (=5000 + 5000 * 200%)
11
if the sample percentile is set too small, the fuzzy time series becomes trivial
For the same time series, if we set the ratio too small, say 0.02%, the first interval will be between 5000 and 5001 , and the second interval will be between 5001 and 5002
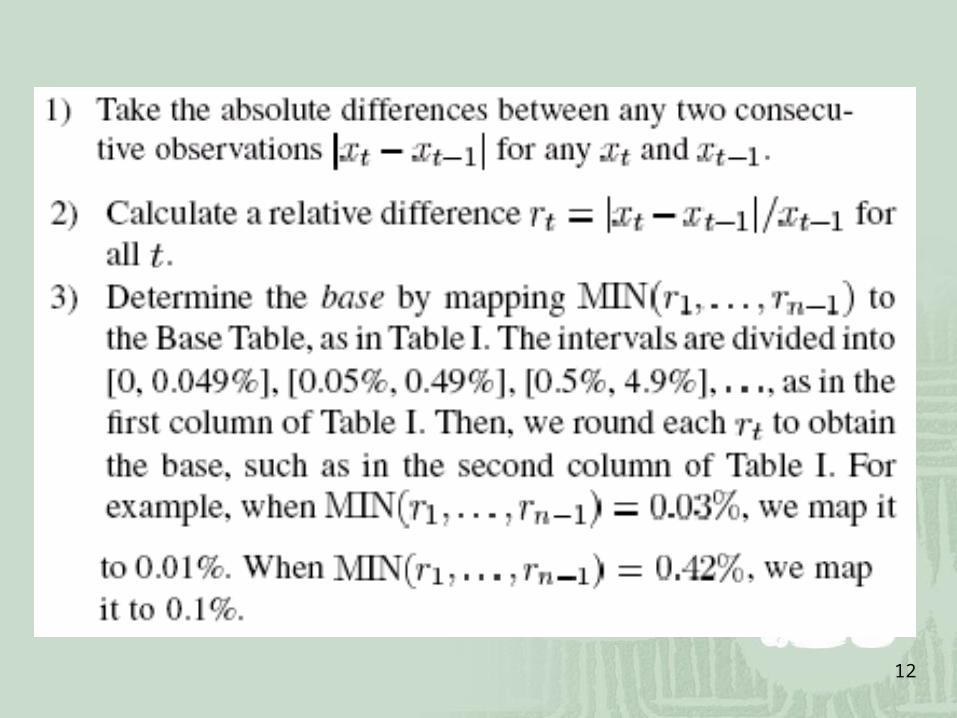
12
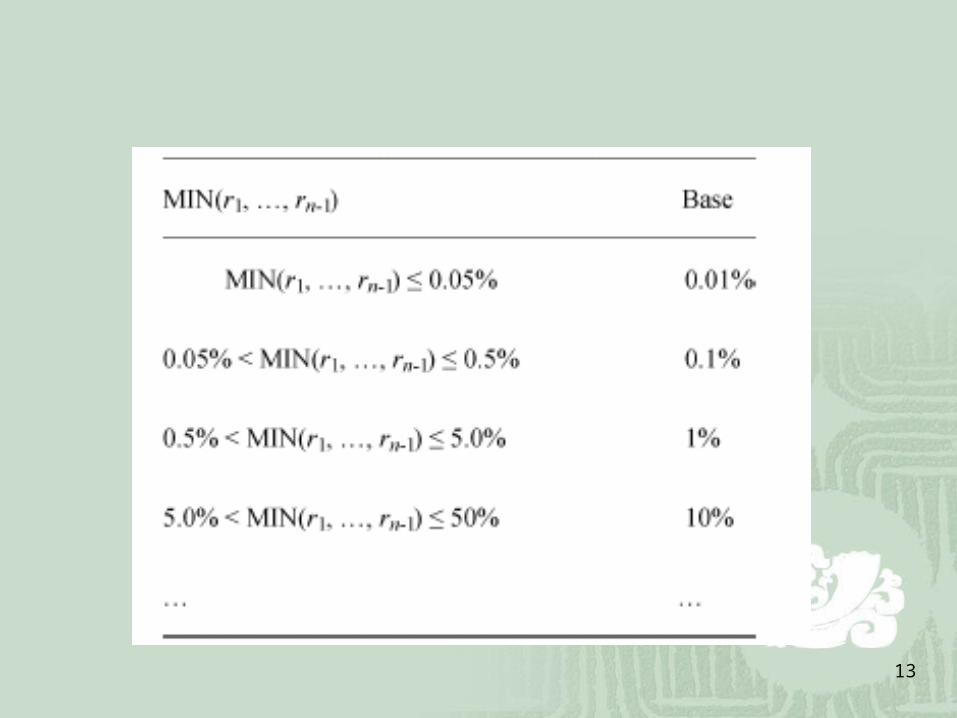
13
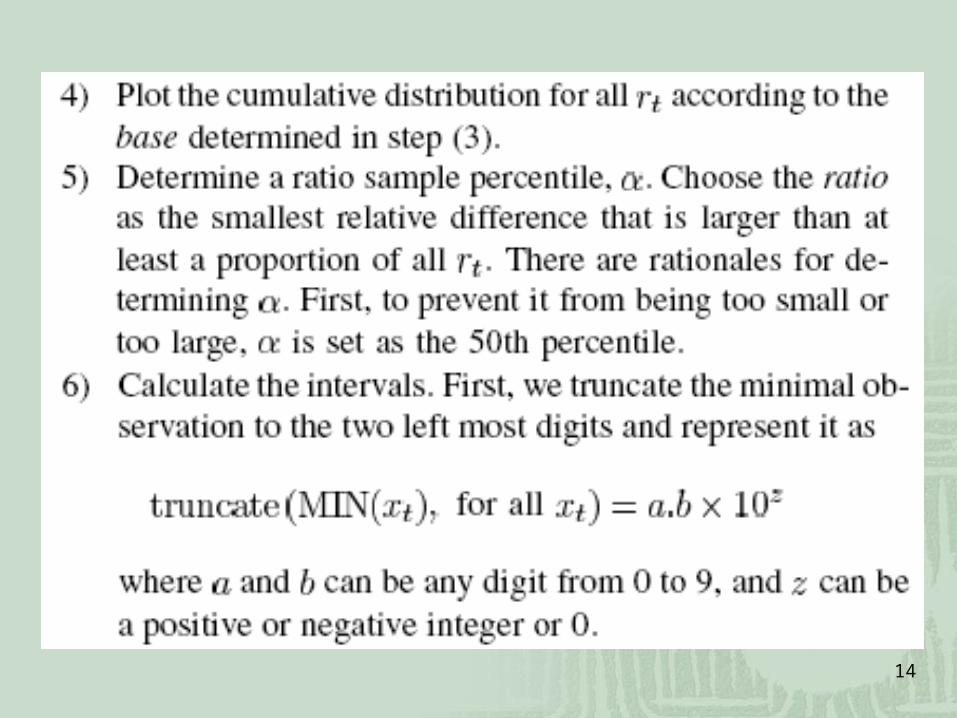
14
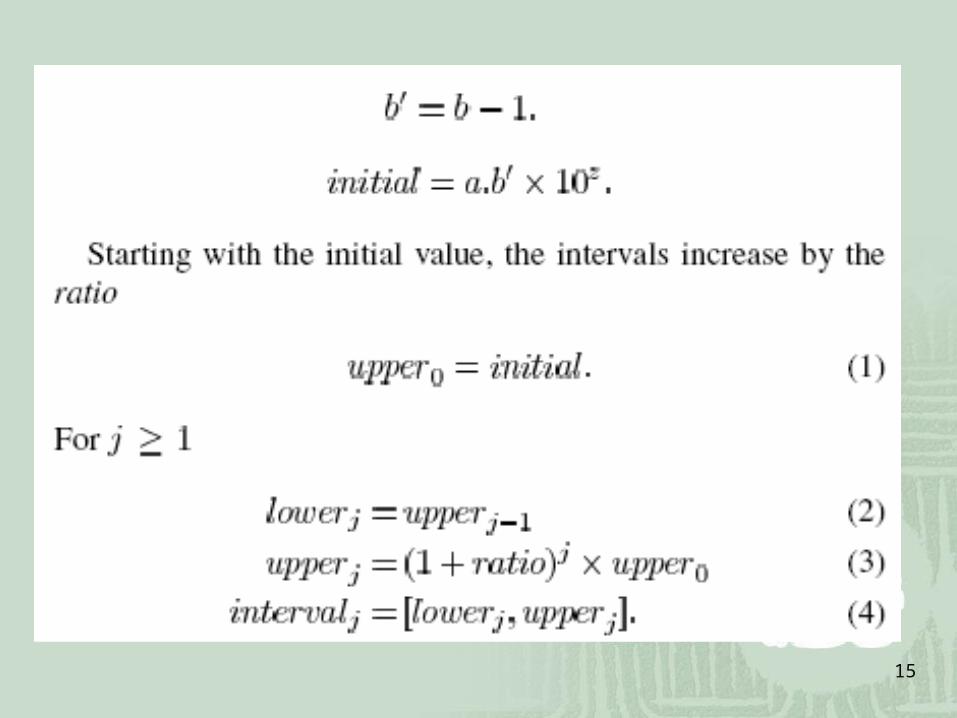
15
16
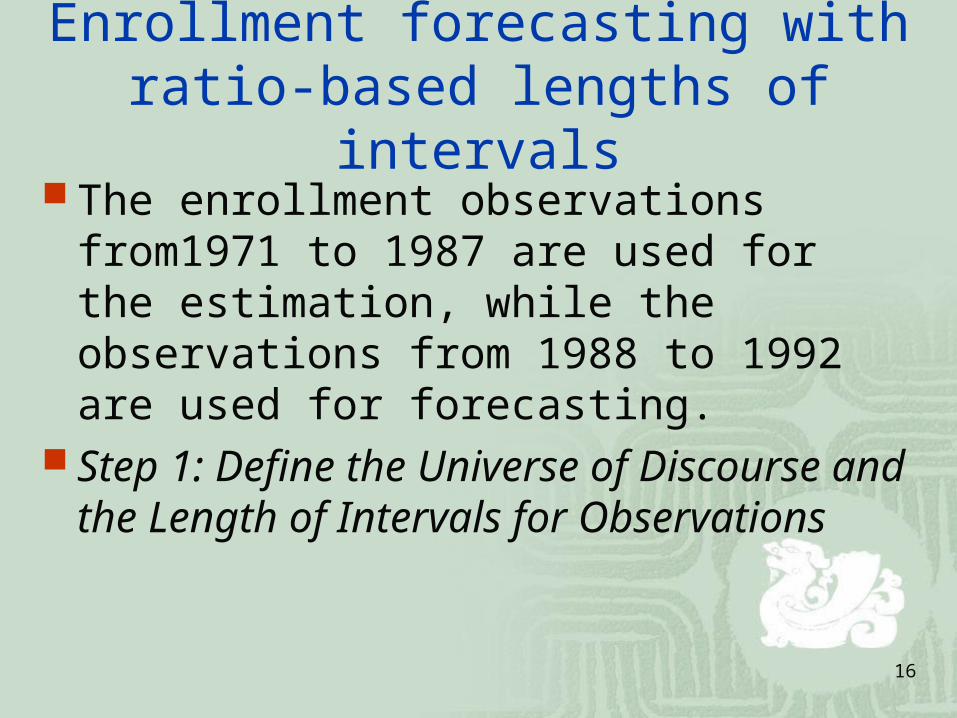
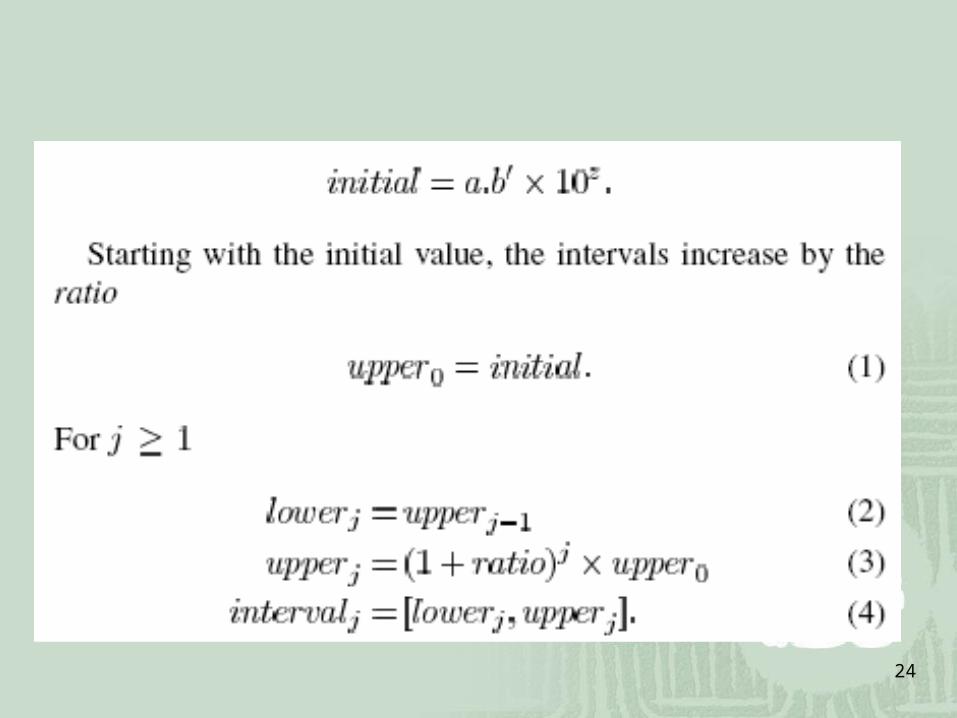
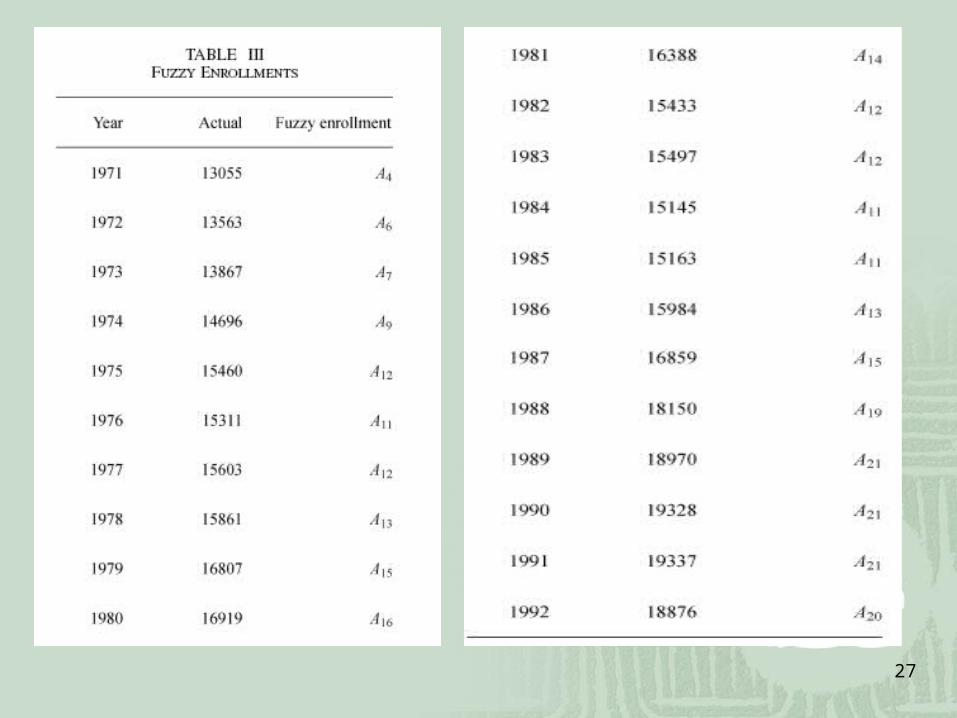
Enrollment forecasting with ratio-based lengths of intervals
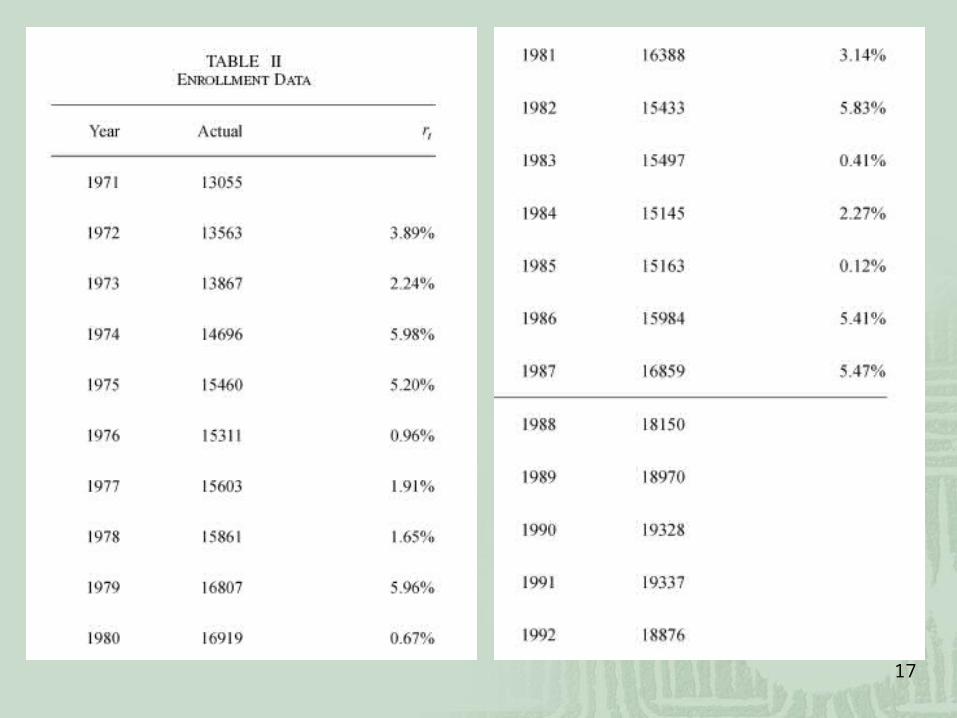
The enrollment observations from1971 to 1987 are used for the estimation, while the observations from 1988 to 1992 are used for forecasting.
Step 1: Define the Universe of Discourse and the Length of Intervals for Observations
17
18
19
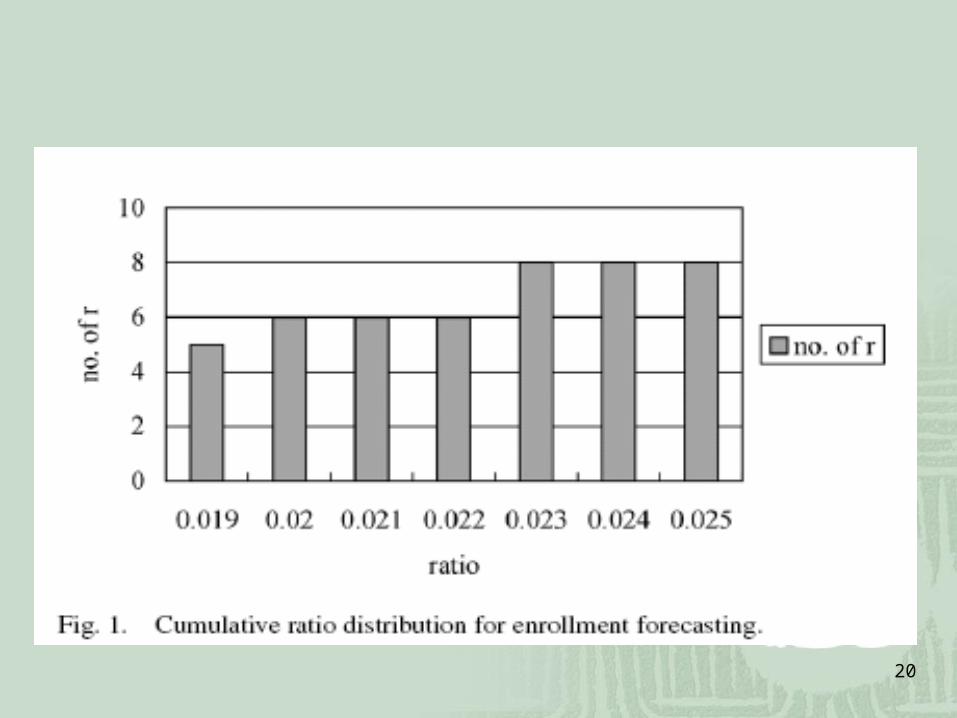
20
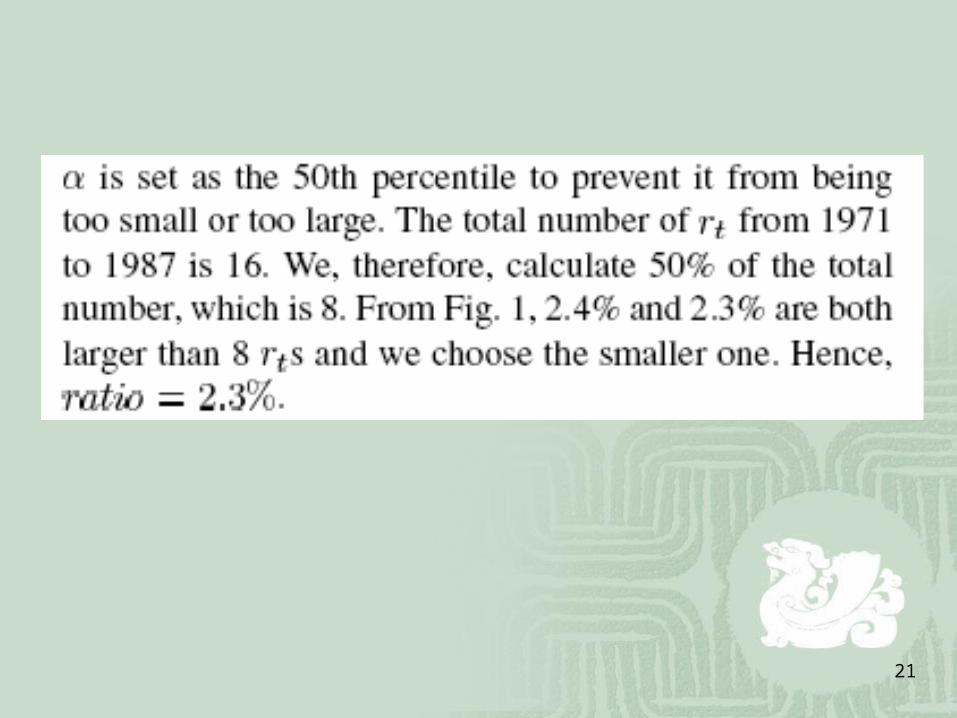
21
22
23
24
25
26
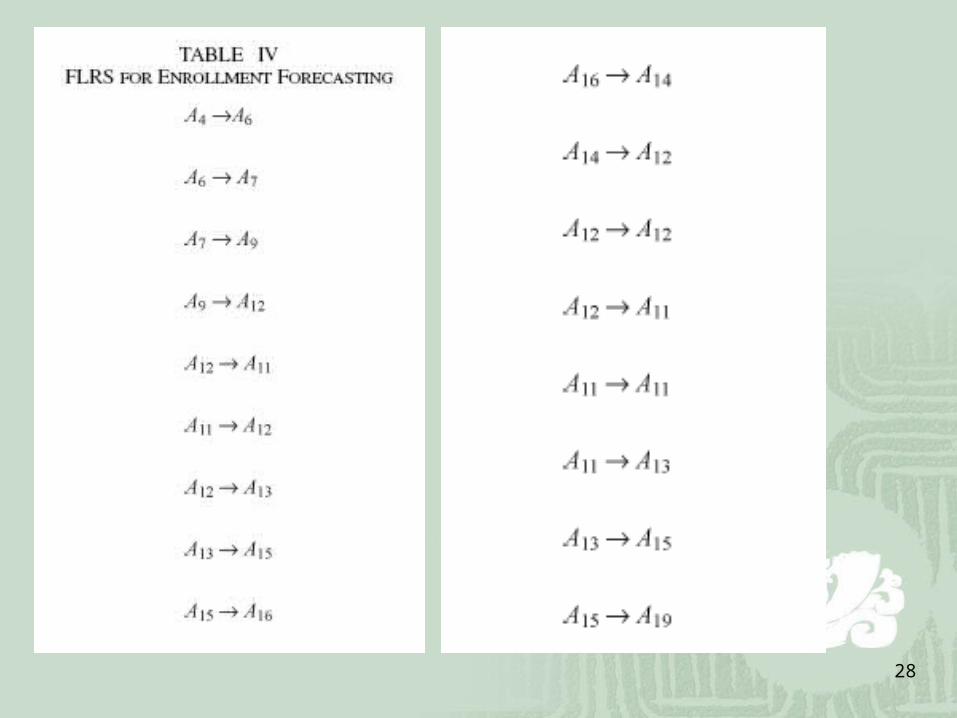
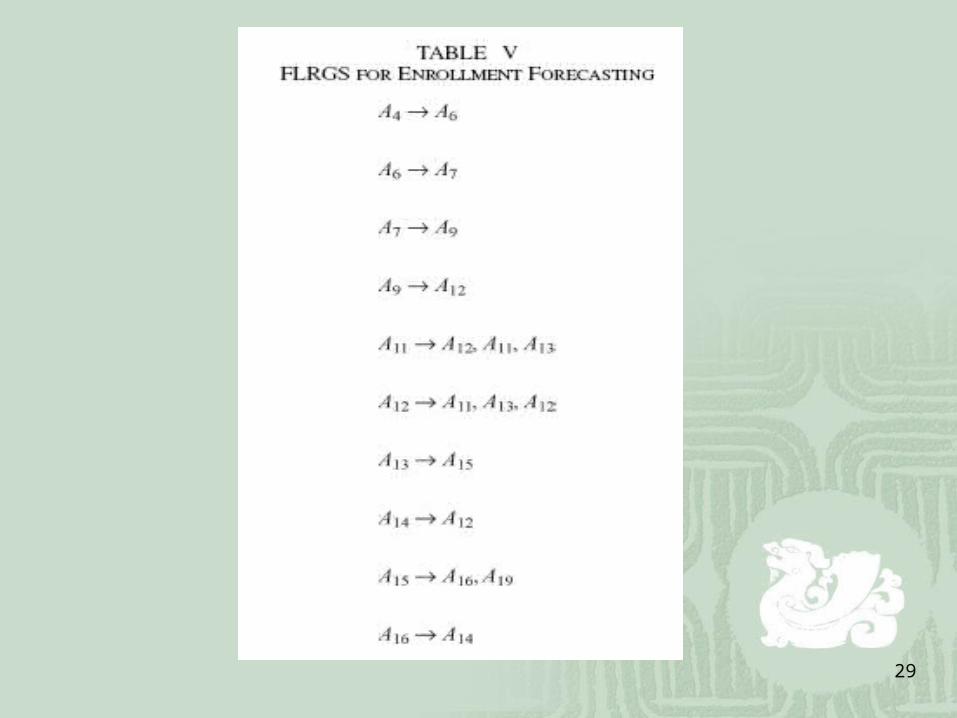
Step 4: Fuzzify the Observations Step 5: Establish the Fuzzy Relationships: F
uzzy logic relationships (FLRs) and fuzzy logic relationship groups (FLRGs) can be established
27
28
29
30
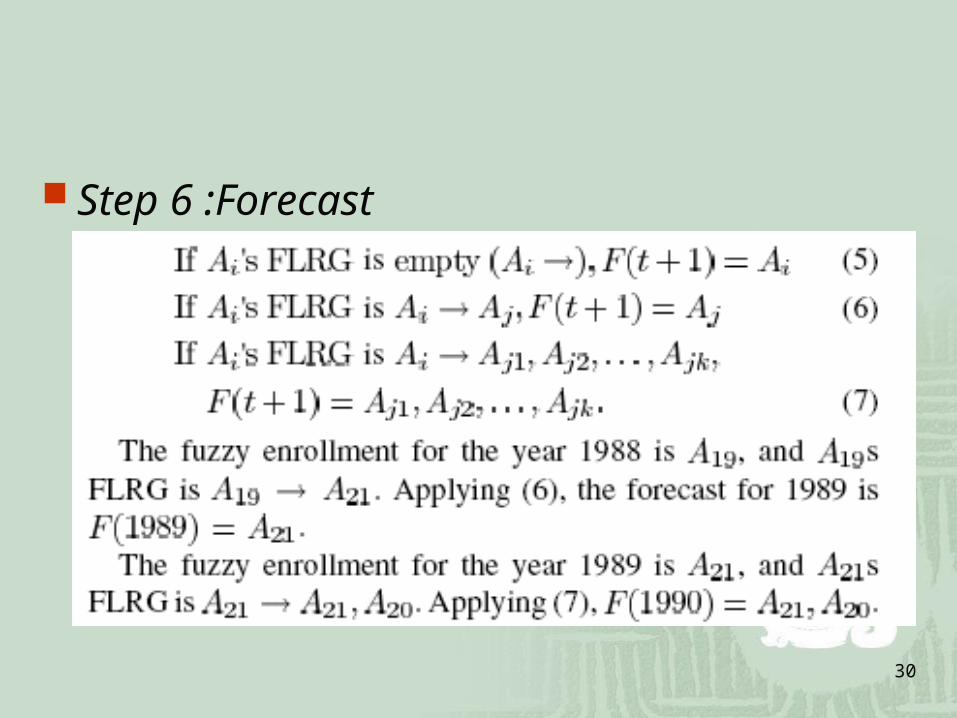
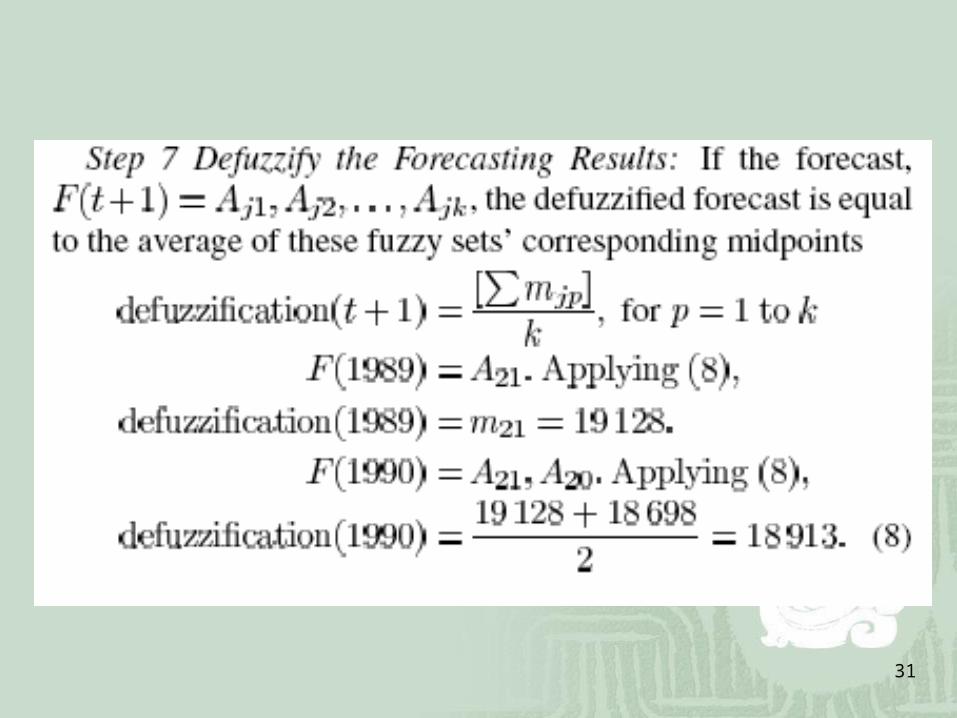
Step 6 :Forecast
31
32
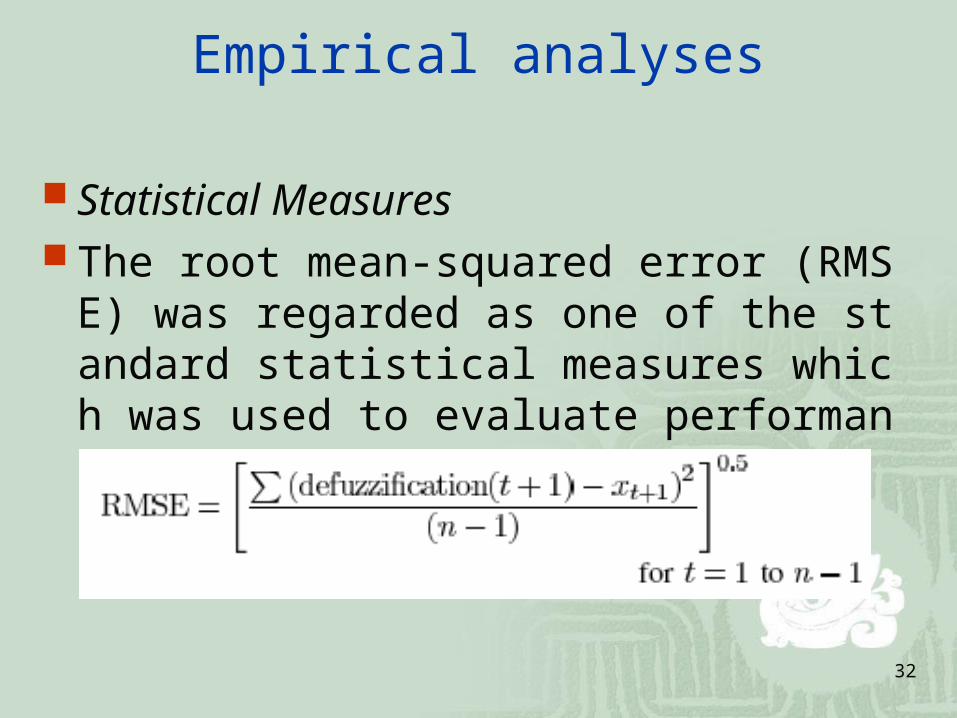
Empirical analyses
Statistical Measures The root mean-squared error (RMSE) was r
egarded as one of the standard statistical measures which was used to evaluate performance
33
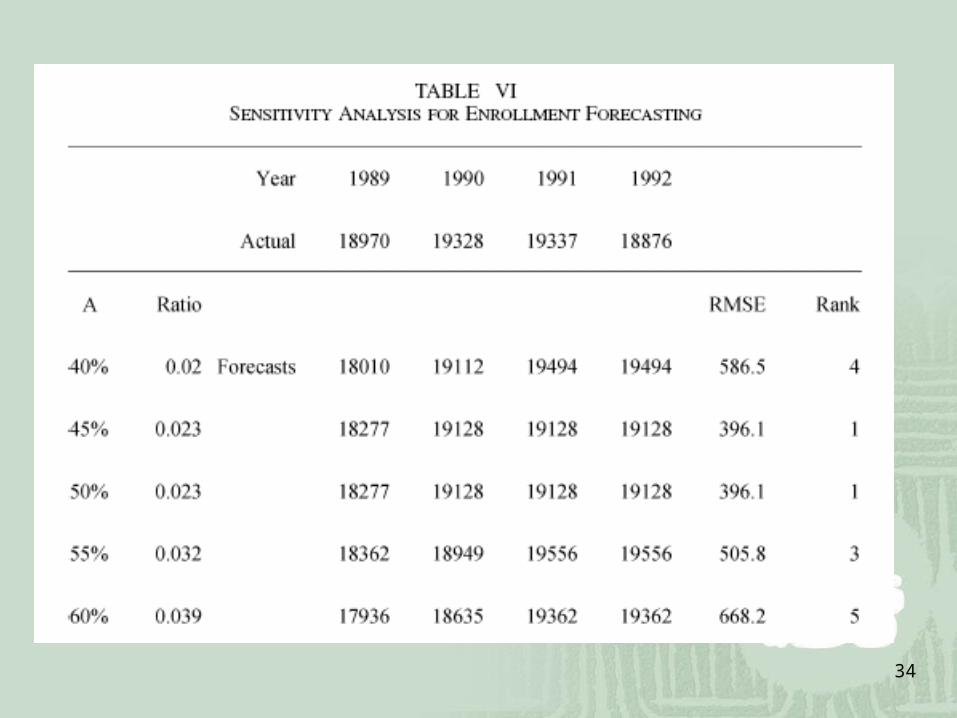
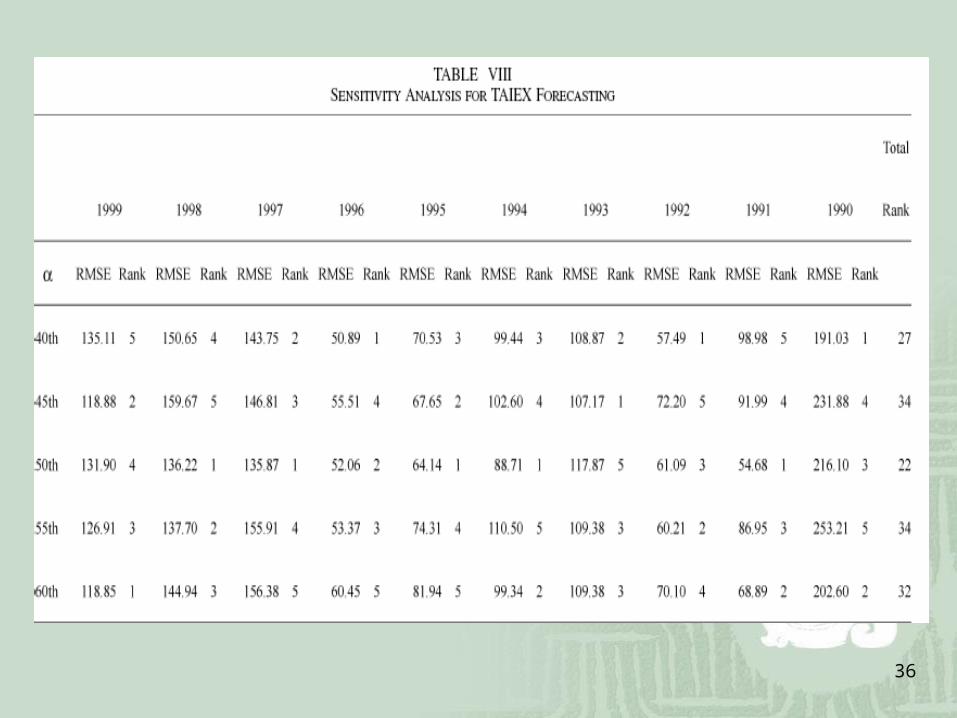
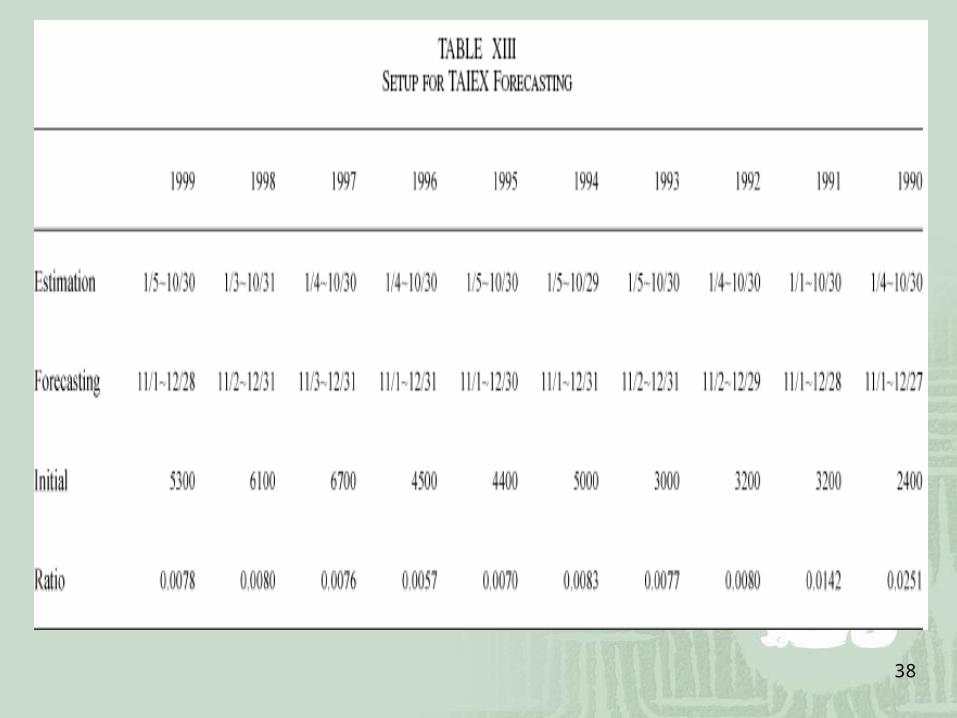
40%, 45%, 50%, 55%, to 60% for three applications.
First, the analysis for enrollment forecasting is listed in Table VI. According to the RMSE, 45% and 50% were ranked 1st.
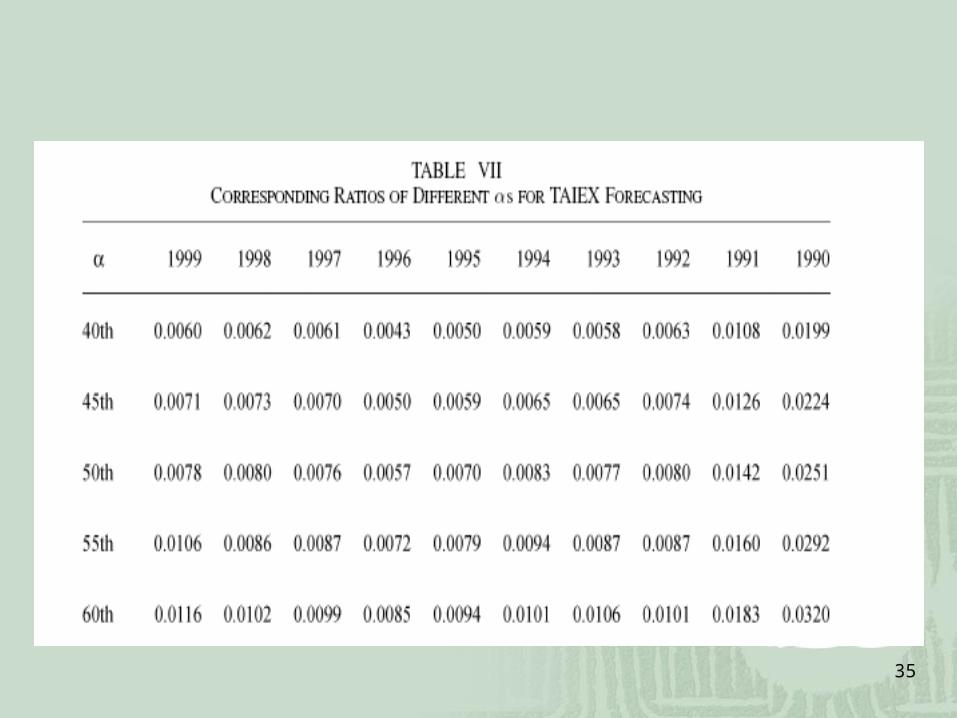
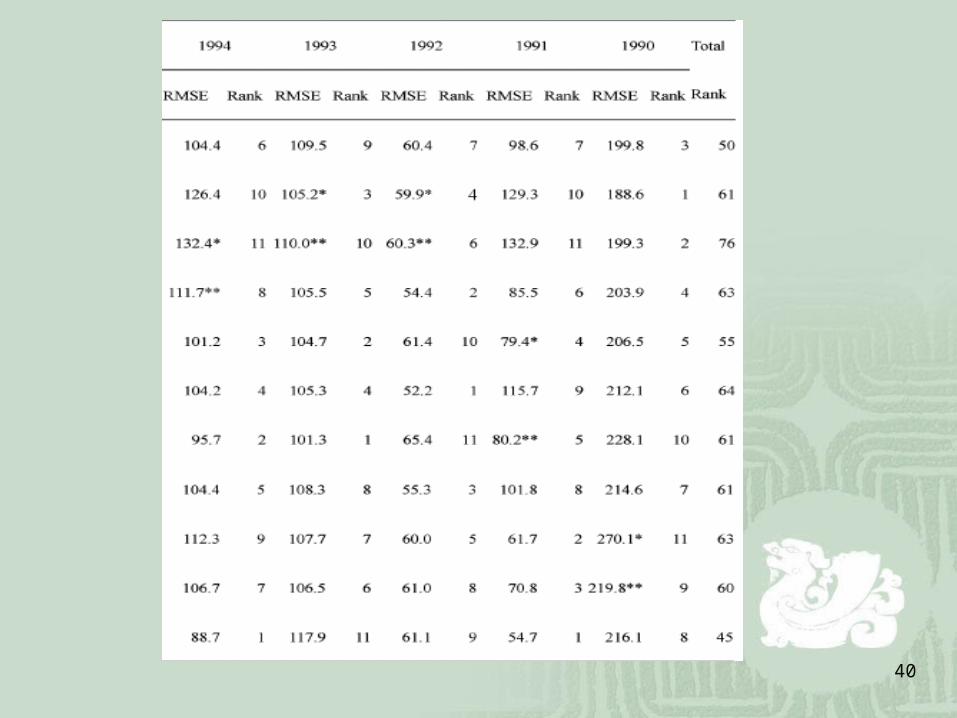
percentages for the years 1999 to 1990 are listed in Table VII. The RMSEs of these a’s are listed in Table VIII. The total rank of the RMSE for α=50% was 22, which was the smalles
34
35
36
37
38
39
40
41
Conclusion
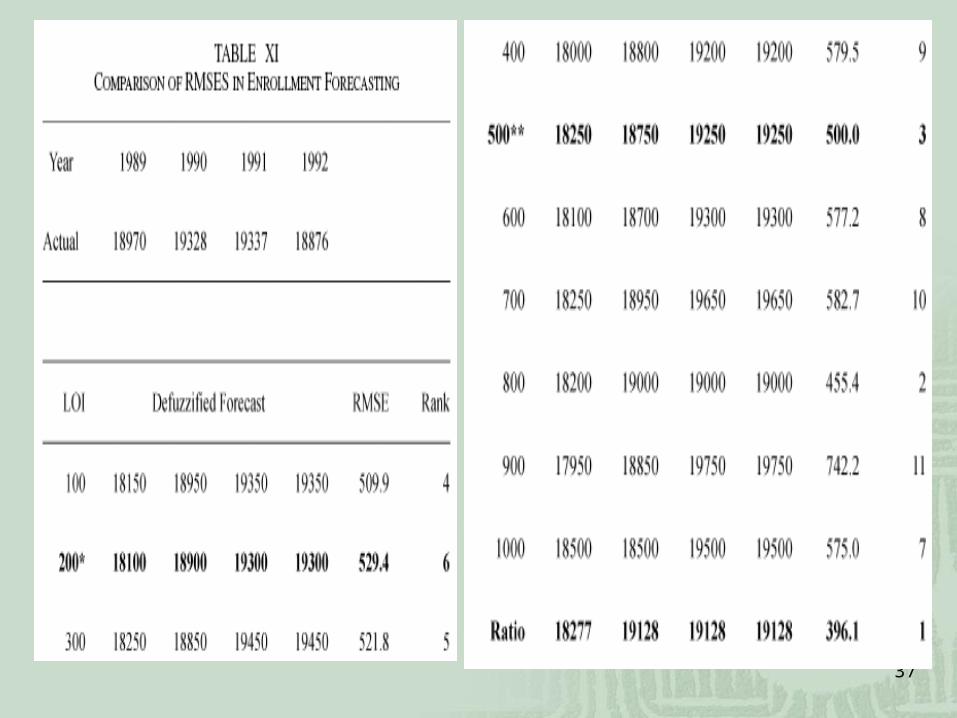
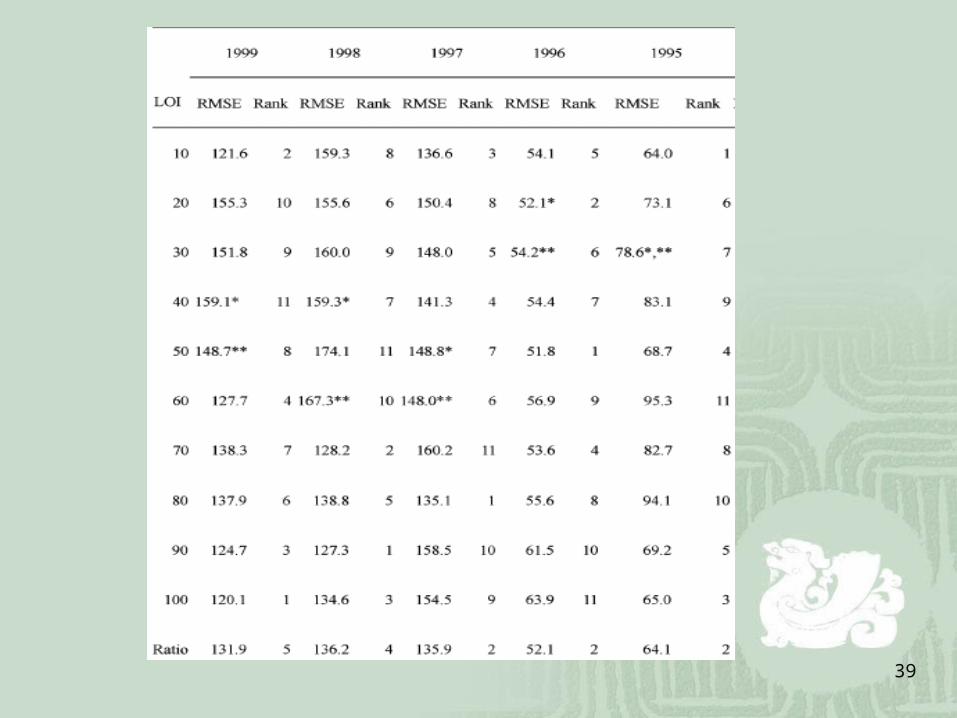
In terms of the RMSE, the ratio-based lengths of intervals were found to provide the smallest rank in the enrollment forecasting, the smallest total rank in the stock index forecasting, and the smallest rank in the inventory forecasting as well.
42
the empirical analyses for different applications showed that the ratio-based lengths of intervals outperformed most of the other lengths of intervals, including distribution-based and average-based ones.