Rating the walkability of cities: a participatory approach ...
24
Rating the walkability of cities: a participatory approach - Preliminary Research Project Rob Shields, Endowed Research Chair and Professor, University of Alberta Nathalia Osorio, UARE intern, University of Alberta April, 2017 Abstract Aiming to increase the importance of pedestrian experience in urban design, we are proposing the development of a participatory walkability rating system, consisting of a mobile application that gathers perceptual and factual data from people’s daily walks. In the first part of this paper we present a review of the existing walkability rating methods and highlight the two key issues of the approaches they use to assess pedestrian friendliness: either they focus on the wrong scale or they implement audit processes that are carried out by a staff or algorithms that are external to the place. In the second part we present the ways our proposal would improve on these approaches, and discuss the results of the pilot that we implemented to test our idea. We found that the development and use of a mobile application would be an asset for the participatory approach of the proposal, though there are several challenges to overcome in future stages of the project. Key words: Walkability, participatory approach, mobile application, walkability rating methods, pedestrians, urban design. Resumen Con el objetivo de incrementar la importancia que tienen los peatones en el diseño de las ciudades, este artículo presenta una propuesta para el desarrollo de un sistema participativo que permita calificar las condiciones de “caminabilidad” de los entornos urbanos. Esta propuesta consiste en una aplicación móvil que recolecta información objetiva y perceptual de las rutas que los peatones recorren diariamente. En la primera parte de este documento se presenta una revisión de los métodos existentes para la evaluación de la movilidad peatonal, y se resaltan los dos problemas principales que estos métodos presentan: mientras unos se enfocan en la escala equivocada, otros contienen procesos de auditoría que son ejecutados por personal o algoritmos externos al espacio que está siendo evaluado. En la segunda parte del documento se presenta la manera en que el enfoque participativo que proponemos mejoraría los métodos existentes, y se discuten los resultados de la prueba-piloto implementada. Los hallazgos sugieren que, efectivamente, el uso de aplicaciones móviles facilita el uso de la herramienta y la recolección de la información, pero existen varios retos a superar en las futuras etapas de este proyecto. Palabras clave: Caminabilidad, movilidad peatonal, enfoque participativo, aplicación móvil, peatones, diseño urbano.
Transcript of Rating the walkability of cities: a participatory approach ...

Rating the walkability of cities: a participatory approach - Preliminary
Research Project
Rob Shields, Endowed Research Chair and Professor, University of Alberta
Nathalia Osorio, UARE intern, University of Alberta
April, 2017
Abstract
Aiming to increase the importance of pedestrian experience in urban design, we are proposing the
development of a participatory walkability rating system, consisting of a mobile application that
gathers perceptual and factual data from people’s daily walks. In the first part of this paper we
present a review of the existing walkability rating methods and highlight the two key issues of the
approaches they use to assess pedestrian friendliness: either they focus on the wrong scale or
they implement audit processes that are carried out by a staff or algorithms that are external to
the place. In the second part we present the ways our proposal would improve on these
approaches, and discuss the results of the pilot that we implemented to test our idea. We found
that the development and use of a mobile application would be an asset for the participatory
approach of the proposal, though there are several challenges to overcome in future stages of the
project.
Key words: Walkability, participatory approach, mobile application, walkability rating methods,
pedestrians, urban design.
Resumen
Con el objetivo de incrementar la importancia que tienen los peatones en el diseño de las
ciudades, este artículo presenta una propuesta para el desarrollo de un sistema participativo que
permita calificar las condiciones de “caminabilidad” de los entornos urbanos. Esta propuesta
consiste en una aplicación móvil que recolecta información objetiva y perceptual de las rutas que
los peatones recorren diariamente. En la primera parte de este documento se presenta una
revisión de los métodos existentes para la evaluación de la movilidad peatonal, y se resaltan los
dos problemas principales que estos métodos presentan: mientras unos se enfocan en la escala
equivocada, otros contienen procesos de auditoría que son ejecutados por personal o algoritmos
externos al espacio que está siendo evaluado. En la segunda parte del documento se presenta la
manera en que el enfoque participativo que proponemos mejoraría los métodos existentes, y se
discuten los resultados de la prueba-piloto implementada. Los hallazgos sugieren que,
efectivamente, el uso de aplicaciones móviles facilita el uso de la herramienta y la recolección de
la información, pero existen varios retos a superar en las futuras etapas de este proyecto.
Palabras clave: Caminabilidad, movilidad peatonal, enfoque participativo, aplicación móvil,
peatones, diseño urbano.

There is no single definition for the term walkability. Whereas some approaches focus on the
micro-level characteristics of the urban design, other methods emphasize on the urban form. For
instance, walkability has been defined by urban designers as “the quality of walking environment
perceived by the walkers as measured by micro-level urban design attributes” (Park, 2008), but
also as “the extent to which walking is readily available as a safe, connected, accessible and
pleasant mode of transport” in the urban form (Transport for London, 2004). These definitions are
not mutually exclusive, though they consider different aspects that urban spaces offer to
pedestrians. There is a big difference between mere availability, safety and desirability.
Both the urban design approach and the urban form approach to understand walkability have
several advantages. Focusing in the micro-level quality of the space allows to consider aspects
such as the comfort, inclusiveness and “friendliness” (Clifton, 2007) of urban spaces, while a
geographic overview of the urban form leads to understand walkability also as related to
accessibility and connectivity.
Regardless the approach, the importance of making cities more walkable is each time better
understood by municipalities, thanks to the effort that many planners have done for a few
decades to position walkability as part of a move towards a new urbanism. Cars-oriented
metropolis not only have caused major urban mobility problems but also health and safety issues
amongst urban population, thus it is necessary to switch the way cities are being designed to more
people-oriented urban spaces that allow citizens to use and interact with the city by walking. In
addition, walking has gained more status in developed cities.
Review of walkability rating methods
Different academic fields are conducting research on walkability. Health and environmental
sciences, and social and planning studies are constantly learning about the importance of walkable
cities and its impacts on nature, people and society. As a result, it is known that the walkability of
a place impacts its sustainability (Cubukcu, 2013), people’s health (Frank, et al., 2006) (Nykiforuk,
VanSpronsen, & Schopflocher, 2014) and even the level of social capital and community
engagement (Leyden, 2003).
The impacts and importance of walkable environments is not the only focus, let alone the most
important aspect of the existing literature on this topic. The main focus has become the rating or
measure of walkability. The first rating system for a walking environment was proposed in 1971 by
Dr. John J. Fruin, who investigated walkability against pedestrian walking density and flow rates,
and condensed these two factors in a qualitative measure describing operational conditions of
pedestrian flow: Level of Service (LOS). There are several concerns that Fruin considered: the
freedom to choose a desired speed, the ability to cross streets and to walk in the reverse direction
of a major pedestrian flow, and the delay experienced by pedestrians at intersections. As a result,
six LOS were identified and designated with letters from A to F, where A represents the best
walkable conditions and F the worst (Still, n.d.).
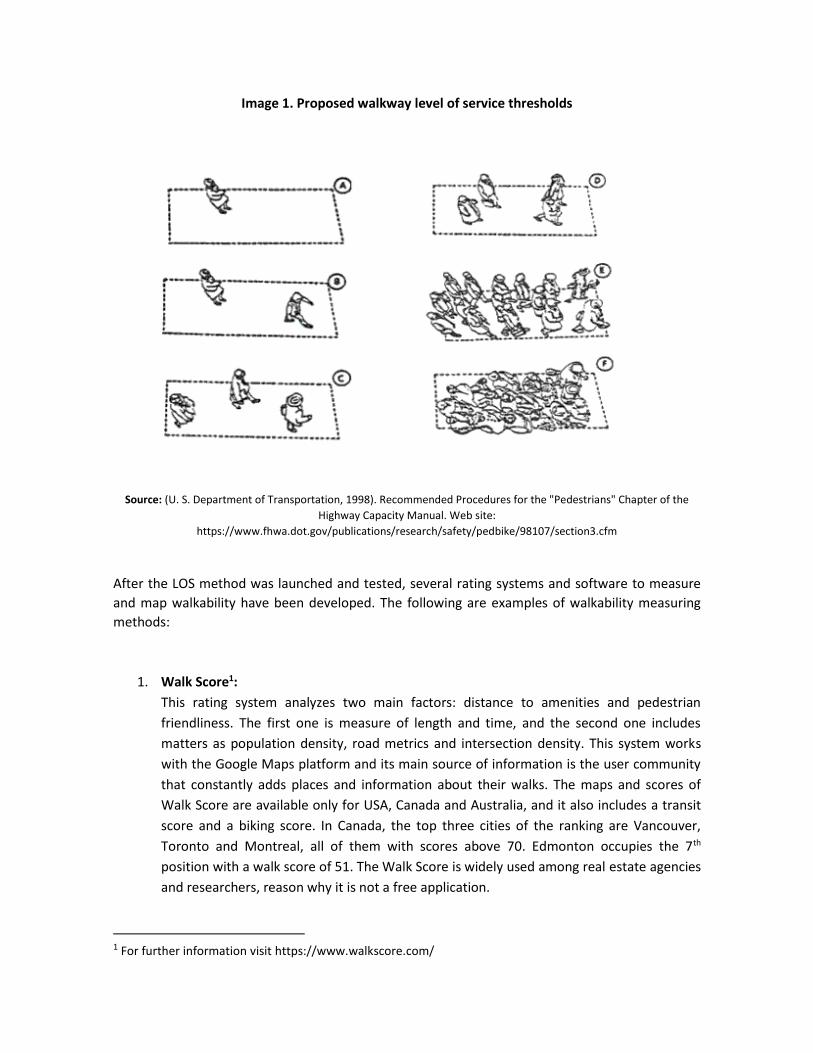
Image 1. Proposed walkway level of service thresholds
Source: (U. S. Department of Transportation, 1998). Recommended Procedures for the "Pedestrians" Chapter of the
Highway Capacity Manual. Web site:
https://www.fhwa.dot.gov/publications/research/safety/pedbike/98107/section3.cfm
After the LOS method was launched and tested, several rating systems and software to measure
and map walkability have been developed. The following are examples of walkability measuring
methods:
1. Walk Score1:
This rating system analyzes two main factors: distance to amenities and pedestrian
friendliness. The first one is measure of length and time, and the second one includes
matters as population density, road metrics and intersection density. This system works
with the Google Maps platform and its main source of information is the user community
that constantly adds places and information about their walks. The maps and scores of
Walk Score are available only for USA, Canada and Australia, and it also includes a transit
score and a biking score. In Canada, the top three cities of the ranking are Vancouver,
Toronto and Montreal, all of them with scores above 70. Edmonton occupies the 7th
position with a walk score of 51. The Walk Score is widely used among real estate agencies
and researchers, reason why it is not a free application.
1 For further information visit https://www.walkscore.com/

Image 2. Walk Score map of Vancouver and Edmonton
Source: Walk Score web site https://www.walkscore.com
2. Walkability Index2:
This tool was developed by the University of British Columbia and understands walkability
as a function of the proximity and connectivity between destinations. The four
components of walkability according to this system are residential density, commercial
density, land use mix and street connectivity. Although the product of this tool is a
walkability surface map with a simple index, the process of collecting information is
demanding as it involves an auditing tool or survey called Microscale Audit of Pedestrian
Streetcapes, which needs to be implemented by trained staff. This rating system can be
applied to any place with the correct use of the audit technique, though the University of
British Columbia developed only the walkability surface map for Metro Vancouver and the
region of Waterloo (see image 3).
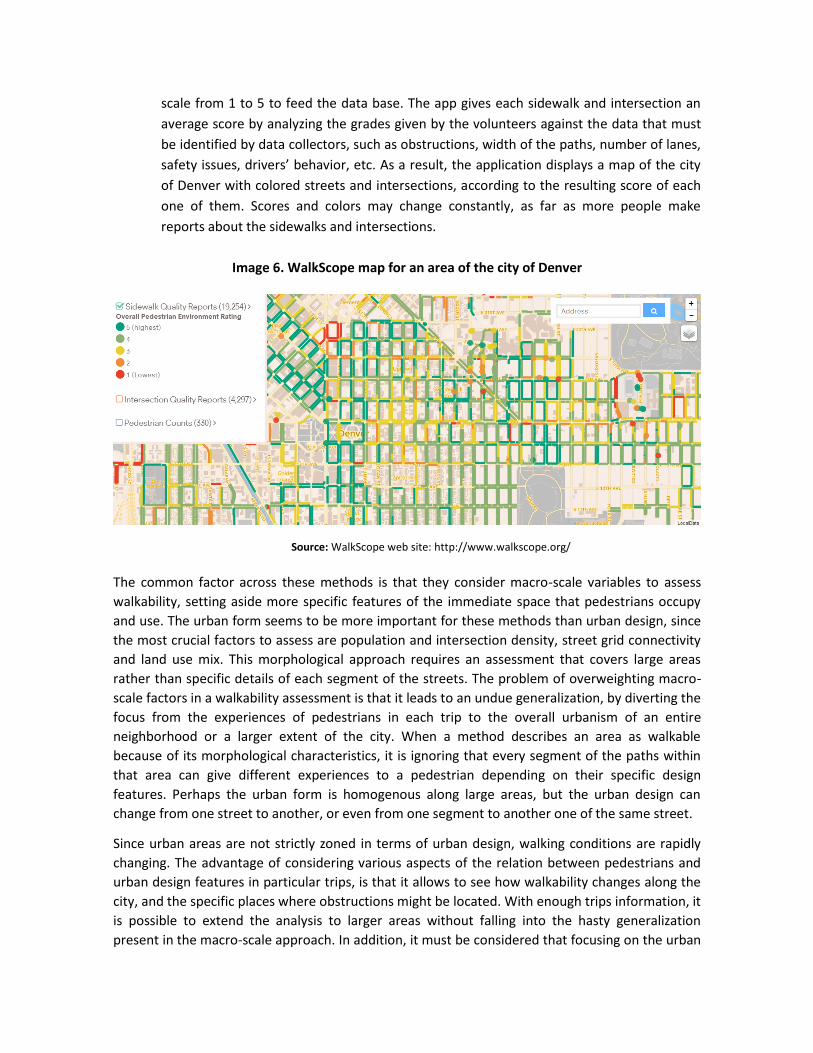
3. Metropolitan Melbourne Walkability Index3:
This tool was originally a project of the University of Melbourne to help people to decide
where to live in Melbourne. Later the research team started to apply the method to other
cities to inform them about their walkability status. The three main factors that this rating
system analyses is residential density, street networks connectivity and mix of land use
(see image 4).
2 For further information visit http://health-design.spph.ubc.ca/tools/walkability-index/ 3 For further information visit http://sustainable.unimelb.edu.au/giles-corti
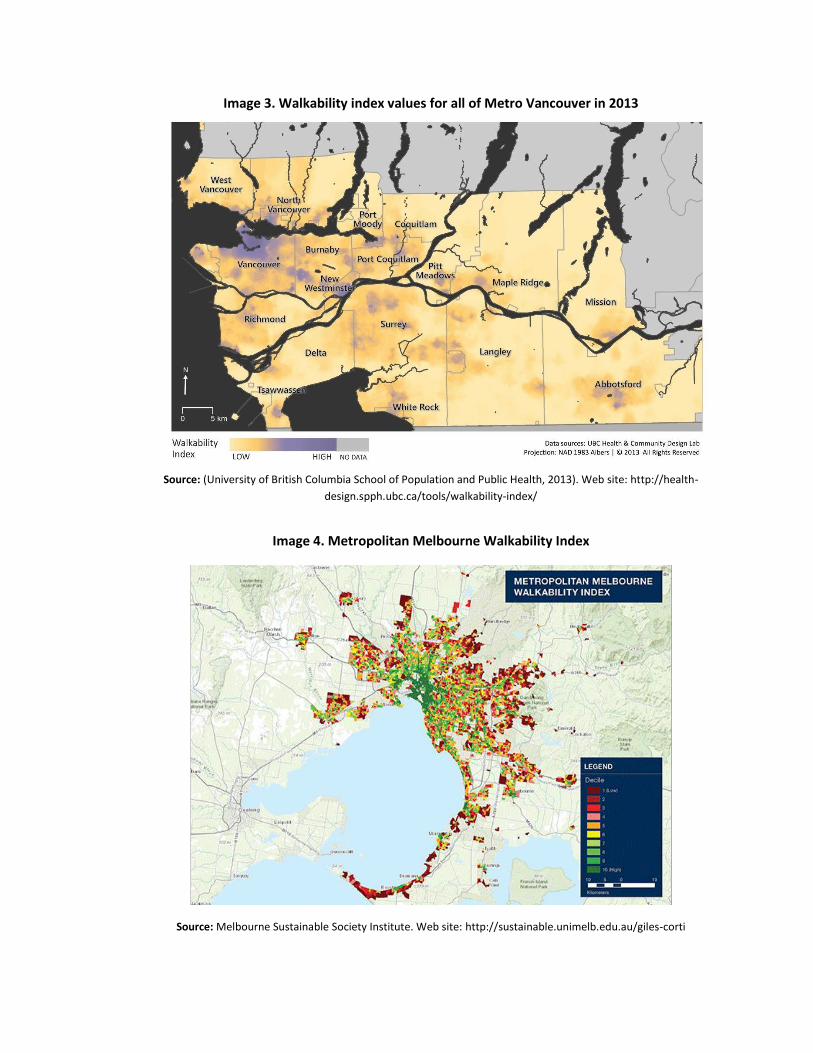
Image 3. Walkability index values for all of Metro Vancouver in 2013
Source: (University of British Columbia School of Population and Public Health, 2013). Web site: http://health-
design.spph.ubc.ca/tools/walkability-index/
Image 4. Metropolitan Melbourne Walkability Index
Source: Melbourne Sustainable Society Institute. Web site: http://sustainable.unimelb.edu.au/giles-corti

4. Walkability in the Greater Vancouver Region4:
This is also a University of British Columbia project focused on GIS. The aim was to create a
model with the ArcGIS Model Builder to calculate walkability scores. The model considers
residential density, road intersection density, street connectivity, land use mix,
topographic variation and access to public transport in a formula that outputs a walkability
score for a location. The model also assesses statistical interactions between
socioeconomic factors and walkability, realizing that the correlation goes from moderate
to null. This model has been applied only for the region of Vancouver.
Image 5. Walkability Index IV Greater Vancouver Region District
Source: University of British Columbia, Walkability in Greater Vancouver Region (2010). Web site:
http://ibis.geog.ubc.ca/courses/geob479/classof10/mwinstru/index.html
5. Walk Scope5:
This project was aimed to create an inventory of pedestrian infrastructure in Denver,
identify gaps, and build the case for improvements with an application based on
community and visitors’ contributions. Data collectors and volunteer citizens use the
WalkScope app to rate the quality of each sidewalk and intersection of a given area on a
4 For further information visit http://ibis.geog.ubc.ca/courses/geob479/classof10/mwinstru/index.html 5 For further information visit http://www.walkscope.org/
scale from 1 to 5 to feed the data base. The app gives each sidewalk and intersection an
average score by analyzing the grades given by the volunteers against the data that must
be identified by data collectors, such as obstructions, width of the paths, number of lanes,
safety issues, drivers’ behavior, etc. As a result, the application displays a map of the city
of Denver with colored streets and intersections, according to the resulting score of each
one of them. Scores and colors may change constantly, as far as more people make
reports about the sidewalks and intersections.
Image 6. WalkScope map for an area of the city of Denver
Source: WalkScope web site: http://www.walkscope.org/
The common factor across these methods is that they consider macro-scale variables to assess
walkability, setting aside more specific features of the immediate space that pedestrians occupy
and use. The urban form seems to be more important for these methods than urban design, since
the most crucial factors to assess are population and intersection density, street grid connectivity
and land use mix. This morphological approach requires an assessment that covers large areas
rather than specific details of each segment of the streets. The problem of overweighting macro-
scale factors in a walkability assessment is that it leads to an undue generalization, by diverting the
focus from the experiences of pedestrians in each trip to the overall urbanism of an entire
neighborhood or a larger extent of the city. When a method describes an area as walkable
because of its morphological characteristics, it is ignoring that every segment of the paths within
that area can give different experiences to a pedestrian depending on their specific design
features. Perhaps the urban form is homogenous along large areas, but the urban design can
change from one street to another, or even from one segment to another one of the same street.
Since urban areas are not strictly zoned in terms of urban design, walking conditions are rapidly
changing. The advantage of considering various aspects of the relation between pedestrians and
urban design features in particular trips, is that it allows to see how walkability changes along the
city, and the specific places where obstructions might be located. With enough trips information, it
is possible to extend the analysis to larger areas without falling into the hasty generalization
present in the macro-scale approach. In addition, it must be considered that focusing on the urban

design attributes allows to identify walkability issues that are easier to improve than the
neighborhood urban form (Park, 2008).
There are some methods that more thoroughly analyze micro-level spatial attributes. Robin
Mazumder’s6 work on walkability is an example of those methods. His research is about the
psychological impacts of urban design, and to collect information he has developed a survey that
he asks people to fill during walk sessions the he organizes and leads. He also uses devices to
measure the brain activity during the walk, so that the information he gets is not only the
subjective perspective of participants but also hard data. Despite the focus of this research is
limited to the psychological field, is interesting how the main interest is the way cities, in the
design level, affect people’s perspective, mood and even dignity (Mazumder, Design Thinking and
the City: Dignity Lies in the Details, 2015).
The Pedestrian Environment Data Scan (PEDS) instrument, developed by Kelly Clifton and Andrea
Livi Smith, is another example. This instrument is based in a sophisticated audit process, designed
to make and inventory of the objects that constitute the paths where people walk, and describing
them in terms of the quality that they add to the pedestrians’ experience (Clifton, 2007).
Although this instrument, as well as many other that use the same concept, overcomes the lack of
attention that form-oriented methods pay to the relation between pedestrians and urban design,
the complexity of the audit process that is needed to collect the information presents problems of
its own. The implementation of those audit instruments requires trained staff to collect
information in a specific study area. This constitutes a limitation in two senses: it is unlikely that
such an instrument can be applied to large urban areas (e. g. a city), and people who are auditing
the paths are mostly external to the space or neighborhoods. They are not local users and
therefore insiders to the “life” of the streets that they are auditing. The discussion on these two
limitations will be expanded later. In addition, the cost of implementation is too high to afford a
walkability assessment that allows a comparison of different cities and different areas within
them, which is the ultimate objective of quantitatively measuring an urban condition.
The review of existing rating methods and instruments, that was made as a preliminary step for
this proposal, shows that although walkability is being widely studied by different disciplines,
when it comes to measurement, there are many challenges to overcome. First, both the urban
form and design are important to defining how walkable an urban area is, though most of the
rating methods that have been developed use only one approach. The existing methods are either
focused on providing a thorough assessment of the design features of pedestrian paths, or
oriented to measure morphological aspects such as density, land use and connectivity of the street
grid.
Second, following Lefebvre (Social Space, 1991), since urban spaces are socially produced, one
cannot isolate the spatial conditions of cities from the social processes and agents that create
them. Walkability, as a condition of urban spaces, is closely linked to the subjective and social
experience of pedestrians. When measuring the walkability of a place, one should consider that it
cannot be accurately assessed by people other than those who regularly interact with that specific
6 Robin Mazumder is a Vanier Scholar and doctoral candidate in cognitive neuroscience at the University of
Waterloo, where he is studying the psychological impacts of urban design (Mazumder R. , 2017).

place by walking. That is the failure of most of the reviewed methods: when their focus is mainly
on the urban form, the spatial analysis is based on Geographic Information Systems tools; and
when they are assessing urban design features, the audit processes are carried out by a staff that
is external to the place. Neither approach relies on the pedestrians’ experiences to collect
information of a place.
Third, simplicity is key to a successful, affordable and scalable implementation of a walkability
rating method. This does not mean that some factors should be excluded in the assessment, but
that they must be grouped and collected in such a way that people can easily understand what
they are being asking to rate, and that it does not take too long. This is a key issue, especially when
it comes to engaging people as volunteers, both to measure walkability from users’ perspectives
and to reduce the implementation barriers and costs of the method. The simpler it is to run the
method, the easier it will be to apply it in several cities and areas within them.
A participatory approach to walkability rating
This is the basis for a new proposal that aims to increase the importance of pedestrians’
experiences in urban planning and design, by developing a participatory walkability rating method
that enables the collection and comparison of walkability data in different cities using mobile
phones. To overcome the three main problems identified above, the proposal includes the
assessment of urban design and form features, a participatory approach to the rating process, and
the development of a mobile application to make it simple, accessible and scalable.
The overall idea is to develop an application that fulfills four main functions:
1. Track the routes people walk on.
2. Measure the time that people spend walking and waiting, and assign colors to the
different segments of the route according that stop-and-go approach (e. g. green to the
segments of the routes where people were walking, and red to the spots where people
had to stop).
3. Allow people to rate their walking sessions according to the experience they have along
the routes. The factors that people will be rating are connectivity, comfort, accessibility,
safety and security.
4. Automate collection of contextual information including time of day, weather and even
the surrounding environment of buildings or open spaces.
To test this idea, we designed and implemented a pilot of the project. First we looked for existing
applications that perform similar functions to those that we are expecting our application to
develop. After a comprehensive search, we selected a fitness application called Runtastic7 to be
our pilot tool. This application tracks the routes and the speed that people keep during a walk, and
displays a map with colored traces that show the segments where people went fast and slow (see
image 7).
7 “Runtastic offers products and services that all focus on gathering and managing sports data in order to
motivate people to do sports and to link like-minded people” (Runtastic, 2017). Specifically, we use the free version of the mobile application of this company, which tracks relevant sports data and upload it to the Runtastic Fitness web site.

Runtastic also takes the total time, the average speed, the average pace and suggest a number of
calories burned during the session. Additionally, when the dashboard is accessed from a
computer, it is possible to see a chart that compares the speed against the time. This chart is
useful to know the periods when the person was waiting during the session, and summarize them
to obtain the total stop time (see image 8).
Image 7. Example of a walking colored route in Runtastic web site dashboard
Source: Runtastic web site, CRSC_Walkability dashboard. https://www.runtastic.com/en/users/9e993388-7dd7-5037-
8b81-73f9ab56bb4f/sport-sessions/58d2cc2c9ad6989148894233
Image 8. Example of a walking session chart in Runtastic web site dashboard
Source: Runtastic web site, CRSC_Walkability dashboard. https://www.runtastic.com/en/users/9e993388-7dd7-5037-
8b81-73f9ab56bb4f/sport-sessions/58d2cc2c9ad6989148894233

We asked people to download Runtastic in their smartphones and go for a walk of at least one
kilometer. They had to save their walking sessions and share them with us. We added them as
friends from our account, and we saved their sessions to have them available in our own
dashboard. After sharing their sessions with us, people were asked to answer a short survey about
their experience, which included the rating of the five walkability factors mentioned above.
Image 9. Design of the survey
Source: prepared by the authors.
When we collected enough sessions, we organized and systematized the data in a matrix, and we
downloaded the graphic information of the routes as KML8 files. The next step was spatial analysis
with ArcGIS9. First, we developed a coding system to link the data entries of the matrix with their
respective KML file. Then we converted all KML files in shapefiles10 and import them from ArcGIS.
With the help of this program we joined the matrix to the routes shapefiles with the codes we
assigned earlier. Finally, we produced a series of maps featuring the time per kilometer of each
route, the average speed, and the percentage of the total time that people spent walking and
waiting (see maps below).
8 KML files are visualizations of two-dimensional maps and three-dimensional earth browsers. 9 ArcGIS is a geographic information system software that allows working with maps using spatial and
statistical analysis tools. 10 Shapefile is a format of geospatial data for geographic information systems, particularly ArcGIS.

Map 1. Walking time per kilometer in Edmonton
Source: prepared by the authors.

Map 2. Percentage of waiting time in Edmonton
Source: prepared by the authors.

Map 3. Average speed of the walking sessions in Edmonton
Source: prepared by the authors.
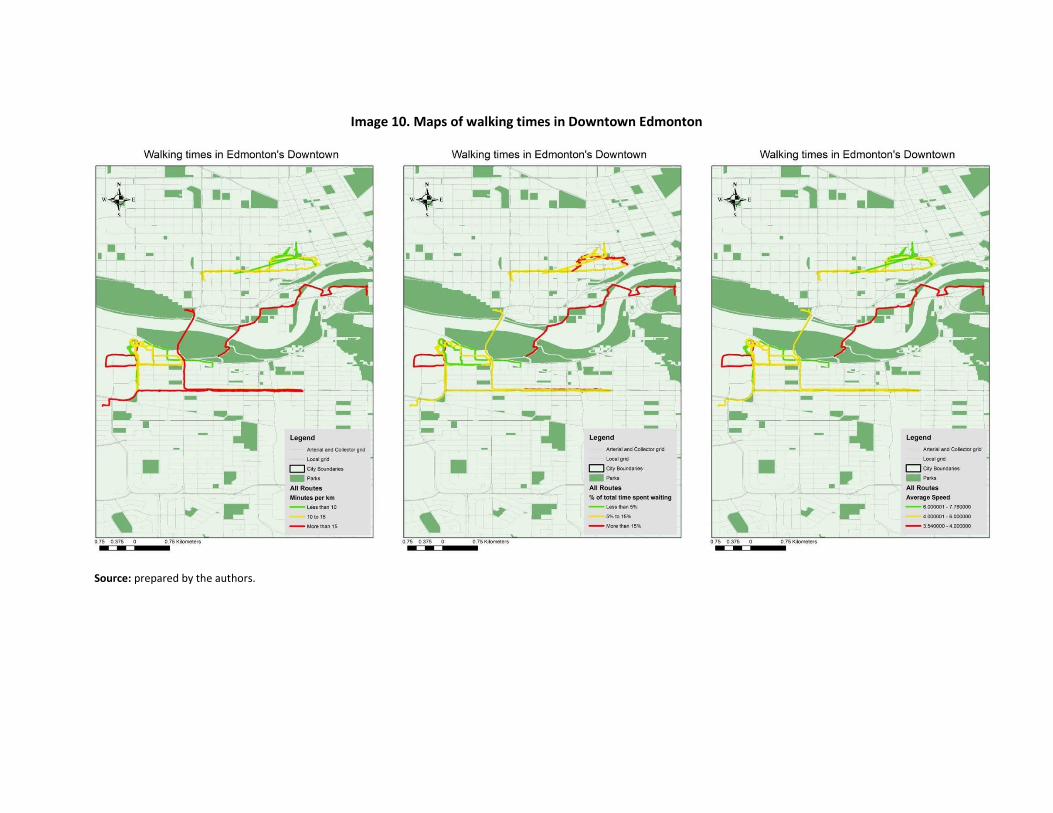
Image 10. Maps of walking times in Downtown Edmonton
Source: prepared by the authors.

Since the data inputs that we got from Edmonton are concentrated around the University of
Alberta’s North Campus and the downtown, is difficult to draw conclusions about the entire city.
What we can tell from the information we got is that commercial streets that one would think are
walkable due to the availability of several services and amenities, such as Whyte Ave and Jasper
Ave, are in fact slow to walk through. Walking on Whyte Ave takes more than 15 minutes per
kilometer, which is far more than the ideal. However, it needs to be considered that commercial
streets not only have more crowded sidewalks but also shop windows that can make pedestrians
stop for short periods on their way, lengthening the walk time. When looking at the percentage of
time that people spent waiting or standing, for Whyte Ave is between 5% and 15%, which is not
too high. That means that in this case, the delay of the walk is not entirely due to several or long
stops in the paths and intersections, but also to a low overall speed during the walk.
Walking along and across the River Valley is also slow. In this case is takes more than 15 minutes
to walk one kilometer, and when contrasting that information with the other two maps, is evident
that it is product of the combination of a huge percentage of time that the person spent waiting
and a slow overall speed. Like the Whyte Ave case, here we should consider that the river valley
offers a landscape that can affect the speed of pedestrians, especially when the walk has leisure
purposes. Since we do not have information about the kind of walk, what we can tell about this
area is that it is not an ideal route when people walk with the aim of transporting.
The pedways in downtown, although faster than sidewalks, do not guarantee a walk without
stops. In the downtown area, we can observe that whereas the pedways walks take less than 10
minutes per kilometer, the walks on the sidewalks can take between 10 and 15 minutes per
kilometer. However, if we take a closer look to the maps 2 and 3, in the pedways walks the
percentage of the total time spent waiting is between 5% and 15% while the average speed is one
of the fastest in the city. This means that pedways facilitate speed for pedestrians, but are not free
of stops, perhaps due to the number of people that walk through them, especially in winter time.
The number of intersections does not have a causal link with the time that people spent waiting
during their walks. In the University area, the only route in which the person spent more than 15%
of the walk time waiting is the one with less intersections; the River Valley does not have
intersections and yet is one of the routes in which the percentage of waiting time is higher; and in
the downtown there are two routes with the same origins and destinations, and the one with less
intersections has the higher percentage of waiting time. This could mean that there are certain
intersections that make a route extremely slow, which would be interesting to see in the map.
Therefore, we want to implement colored traces for each route, so that we can identify if people
are stopping at intersections or along the blocks for an extended period.
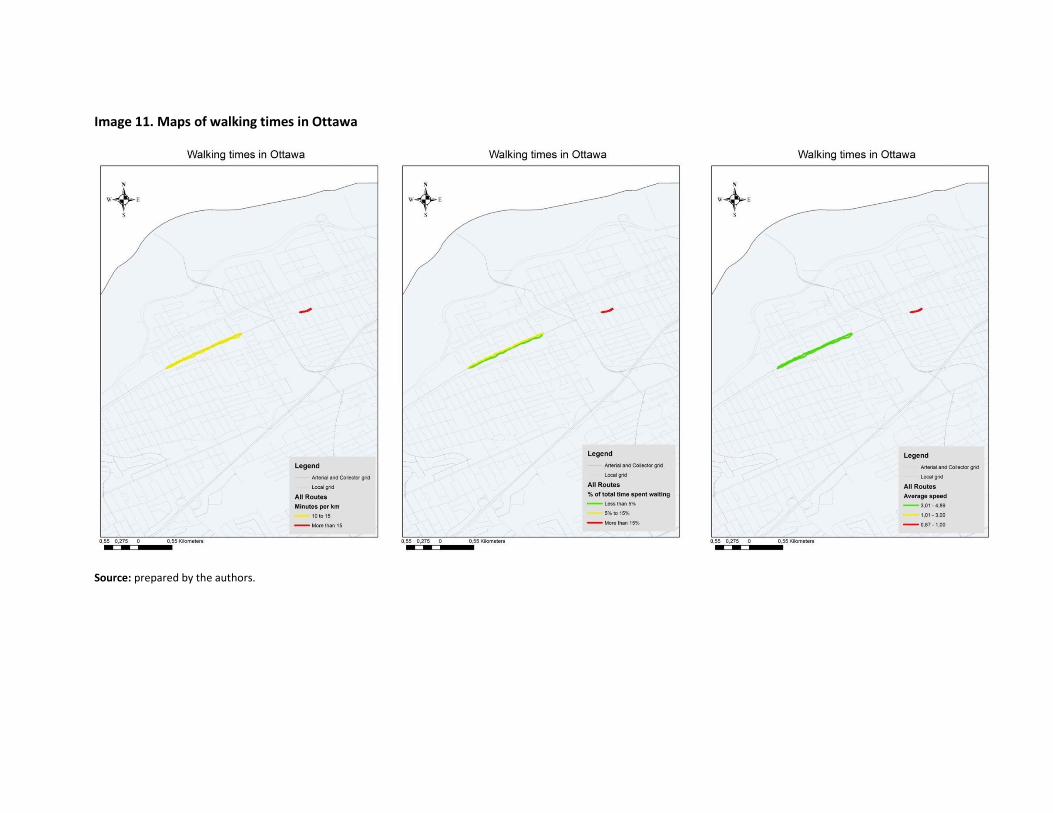
Image 11. Maps of walking times in Ottawa
Source: prepared by the authors.

Image 12. Maps of walking times in Vancouver
Source: prepared by the authors.
We only got three sessions from suburban areas, hence no absolute conclusions can be stated.
Descriptively we can say that these areas present low-speed walking conditions. One of the routes
is classified within the “10 to 15 minutes per kilometer” group, and in the other two it took more
than 15 minutes to walk a kilometer. However, the maps 2 and 3 show that whereas the
percentage of total time that people spent waiting is critical only for one of the three routes,
acceptable for another one and ideal for the third one, the average speed is not particularly fast in
the three cases. This could mean that in suburban areas people stop less at intersections, due to a
lower traffic, but they cannot walk at a desirable speed along the blocks, probably due to the car-
oriented design of these areas.
The major input that we received from the sessions that were shared with us from other cities is
the certainty that this method can be easily applied beyond a local perspective. However, we did
not receive enough information to make a conclusive analysis. All we can we say from the data
that we have from Ottawa and Vancouver walking sessions (see images 11 and 12) is that the
relation between the nature of the places and the speed of the walks seems to be similar to the
tendencies that we presented regarding walkability in Edmonton. For instance, the street where
all Ottawa walking sessions were done is comparable in form and commercial dynamics to Whyte
Ave on Edmonton, and in both cases places that one would think are favorable for pedestrians are
in fact slow, probably due to the number of people walking in the streets. However, in Whyte Ave
there is a combination of an important percentage of waiting time and a medium-low average
speed, while in Ottawa it tends to be the waiting time the factor that delays pedestrians rather
than the average speed.
The walking session in Vancouver, by the other hand, is comparable to the walking sessions across
the River Valley. Despite the fact that the walk in Vancouver has a longer segment in the urban
area than the River Valley sessions in Edmonton, in both cases the landscape and environmental
services of a large urban park play an important role in the experiences of pedestrians. In these
areas it takes more than 15 minutes to walk one kilometer, which is slow compared to other
places in the city. However, as we explained before, we are considering that in places with
aesthetic features the connotation of the walk might be determined by leisure purposes, and in
that case the speed loses relevance.
The coincidences of walking speed tendencies between areas with similar morphology and
dynamics in different cities is positive for the research, since it makes cities more comparable and
can lead us to identify generalities of walkability worldwide. However, with the information we
have now this is only an attempt that need much more information and research to be proven.
After the comparison between these three cities we could noticed that each one of them has its
own “natural speed”, which can be influenced by cultural factors. This means that according to
distinctive characteristics of the urban environment, including both tangible and intangible factors,
the speed that is consider “normal” could change from city to city. The importance of considering
the “natural” or “normal” speed of cities became evident when we were trying to compare them,
and it is reflected in the information displayed in the average speed maps. To assign colors to the
routes in these maps, we used three classes and a manual classification, but when we were trying
to equalize the breaks values for the maps of all three cities, we realized it was impossible since
the range of speeds was completely different for each case. For instance, in Edmonton the “fast

speed” goes from 6 to 7.7 km per hour, but the fastest session in Ottawa registered an average
speed of 4.89 km per hour, reason why the range of the “fast speed” category in Ottawa covers
speeds between 3.01 and 4.89, whereas that speed is only considered low-medium in Edmonton.
Therefore, it could be say that Ottawa has a slower natural speed than Edmonton. Although this
information can change as the number of received sessions increases, it would be important to
acknowledge this factor when mapping the results., perhaps by normalizing the individual data of
speed for each session with the average speed of the city.
Other mapping information, tools and processes that is worth trying in further stages include the
use of open data information in the elaboration of a suitability map of the pedestrian
infrastructure, to compare walking speeds in different areas of Edmonton with the conditions of
built environments, and determine at what level they are related. Additionally, the network
analysis tools of ArcGIS allow a thorough examination of the routes that pedestrians take from
common origins to common destinations, and this would be useful to focus the research in certain
routes and determine the inconveniences that pedestrian could find there in terms of speed or
any factor that we need to inquire. The range of options that GIS presents is wide and worth
exploring in order to enrich the research with a deeper understanding of the relations between
different factors and the role they play in pedestrians’ experiences.
The spatial results of the pilot, obtained via Runtastic and processed with GIS, were
complemented with the survey shown above in image 9. Whereas the timing assessment was
intended to provide spatial information about the speed of pedestrians in different areas of the
city, the survey is the core of the participatory rating system. Through the survey, we wanted to
identify how is the overall pedestrian experience in cities and areas within them, but in the
implementation of the pilot we had some issues that prevented us from obtain the expected
results.
We were not able to link the rates to the spatial information (Runtastic GPS routes), therefore the
rates that we got can only be understood in terms of cities but not specific areas or paths within
them. Additionally, since we did not have a single application to collect both the timing and rating
information, the survey part of the pilot was not completed by all participants, leaving us with less
information to analyze. The timing assessment became the central aspect of the pilot, diverting
the main objective of the research project, since we have not developed a method to include the
Runtastic results as part of the ratings. The main reason why that has not happened yet is because
we need more research in the topic, and a more complex system, to determine in which cases a
lower or higher speed is a positive or negative factor.
From the survey, we only received inputs from the walking sessions in Edmonton11, thus a
comparison between cities is not yet possible regarding the five aspects that we were evaluating
on the survey. In the first part of the survey, we asked contextual information about the location,
season and weather of the walking session. These features can be asked in a simpler and more
friendly way, using the example of how Runtastic asks their users about their mood, the kind of
surface and the weather during the activity (see image 9). The walks in Edmonton were done
11 There is one session from Cartagena, Colombia, but is not considered in this report since the access to
geographic information (layers) was limited and the spatial analysis could not be done. Additionally, there is a session in St. Albert, which is considered as part of Edmonton, due to their proximity.
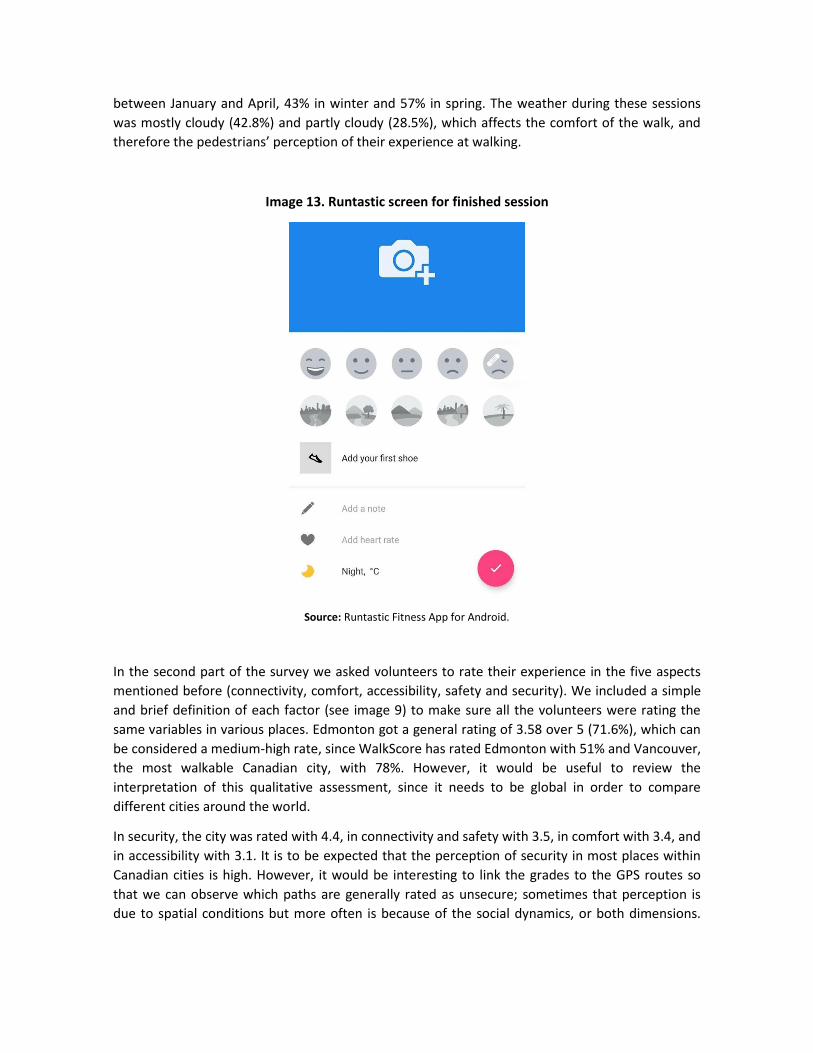
between January and April, 43% in winter and 57% in spring. The weather during these sessions
was mostly cloudy (42.8%) and partly cloudy (28.5%), which affects the comfort of the walk, and
therefore the pedestrians’ perception of their experience at walking.
Image 13. Runtastic screen for finished session
Source: Runtastic Fitness App for Android.
In the second part of the survey we asked volunteers to rate their experience in the five aspects
mentioned before (connectivity, comfort, accessibility, safety and security). We included a simple
and brief definition of each factor (see image 9) to make sure all the volunteers were rating the
same variables in various places. Edmonton got a general rating of 3.58 over 5 (71.6%), which can
be considered a medium-high rate, since WalkScore has rated Edmonton with 51% and Vancouver,
the most walkable Canadian city, with 78%. However, it would be useful to review the
interpretation of this qualitative assessment, since it needs to be global in order to compare
different cities around the world.
In security, the city was rated with 4.4, in connectivity and safety with 3.5, in comfort with 3.4, and
in accessibility with 3.1. It is to be expected that the perception of security in most places within
Canadian cities is high. However, it would be interesting to link the grades to the GPS routes so
that we can observe which paths are generally rated as unsecure; sometimes that perception is
due to spatial conditions but more often is because of the social dynamics, or both dimensions.

That would give us an idea of places that need intervention oriented to solve a social issue more
than foster physical changes.
Accessibility was the lower grade, which means people are not satisfied with the level of
inclusiveness of the city. It seems that Edmonton is not a friendly city to walk for people with
disabilities or any kind of disadvantages, and that makes the city less accessible for pedestrians.
This is aggravated by the fact that most of the walking sessions were done in the downtown and
campus areas, which are supposed to be the most accessible and inclusive places of the city since
they are expected to receive a high flow of people every day due to the agglomeration of
activities. Thus, we can assume that upon receiving more information from different areas in
Edmonton, that grade is in fact going to drop down.
In connectivity, comfort and safety Edmonton was rated with 3.5 in average. We were expecting
low and medium grades for comfort and safety in the downtown area, due to traffic congestion
that makes the environment for pedestrians dense and stressful. However, for connectivity the
grade is surprisingly low, since the downtown and University area have plenty of amenities, a
reticulate street grid and easy access to public transport. Apparently from the pedestrians’ point
of view, these features are not necessarily obvious for these areas and instead need to be
improved.
Conclusions
The process of designing and implementing this pilot was an experimental step toward the overall
proposal. We recognize the usefulness of a mobile application for the double purpose of making it
easy for people to participate, and to engage people from different cities. Although the inputs that
we received were mostly from Edmonton, the worldwide availability of Runtastic, due to its
linkage with the Google Maps base, made it possible to receive sessions from other Canadian
cities, and even from another country12.
However, the process of engaging people as volunteers was not easy. Although many people were
interested in the concept of the project, very few had the initiative to help by doing and sharing
walking sessions. Most of the data entries that we got were product of a class assignment in the
University of Alberta, the reason why the routes cover mostly campus and downtown areas.
Persuading people to volunteer, therefore, is a challenge that we must consider in the future
stages of this research project. One of the questions to solve is how to make the application more
attractive, useful and desirable for people to use it massively?
Another lesson learned is the value of simplicity. Since we needed two different kinds of
information (space-time and rates) and we did not find an application that let us put them
together, as we expect to do in our application. People successfully shared their Runtastic
information with us, but most of them forgot the step of the survey. We received 33 Runtastic
sessions and only 12 responses to the survey, which distorts the statistical information. It was also
difficult to include the information of each survey in the matrix that we linked to the routes. For
12 From 33 entries that we received, 27 where from Edmonton, 4 from Ottawa, 1 from Vancouver and 1
from Cartagena (Colombia).

this reason, we had to isolate the rating from the spatial analysis. It is essential to find a way in
which people can simply provide us with the two types of information, and (a) display both in the
maps and (b) include the time as a variable of the rate.
Additionally, there is a consideration to be made about the stop-and-go approach. After the
completion of this stage of the research, we acknowledge that walking is a complex activity, and
its meaning expands beyond transportation. People not only walk to move from one place to
another, but also to exercise or develop a leisure activity whose only purpose is the aesthetic
pleasure. In that sense, is understandable that different kinds of pedestrians have different needs
regarding the conditions of cities in which they are walking.
A slow speed does not mean something negative in all cases. For instance, walkable places have
plenty of amenities that can be attractive for pedestrians, even if that is not their destination; or
beautiful landscapes and cityscapes can capture pedestrians’ attention if they are walking for
leisure (and even if they are not), making them stop in the middle of the way. In addition, people
from all age groups have different speed, and their walking needs are diverse. This diversity is a
challenge for our proposal, and in the next step it is necessary to decide whether our target is
comprehensive, and therefore we need to design the application in terms of the different
necessities of pedestrians, or we are interested only in urban mobility. Either way the application
needs to consider a series of factors to be as accurate as possible in the walkability measure.
Where the pace of walking is significant is when the aggregate speed for one city across all types
of pedestrians and routes is different from others. A second case is when an intersection requires
pedestrians to wait for a significantly longer time than the average for other similar crossings. This
might show that specific intersections and even whole cities are more challenging for pedestrians,
or they have some specific walking culture that distinguishes the pedestrian experience.
Finally, the biggest challenge ahead is to get funding, especially to code the application. After a
quick review of the options available to develop the application, it is likely that we will need to
make it profitable in order to get funding from the private sector. Additionally, we need to put
some effort towards the identification and application for grants that are aligned with our
project’s objectives. While looking for funding opportunities, we must work on the specifications
and design of the application, based on the data that this pilot allowed us to collect.
Through the development and use of the mobile application that we are proposing, we will
increase the importance of pedestrians’ experiences in urban planning and design by reporting on
the perception of pedestrians in aspects that are crucial for walkability, and the ease with which
people can move around by foot. This combination of subjective perceptions and objective facts
about walking times and spaces is ideal to inform cities about their walkability conditions, creating
a positive impact on how these issues are considered and addressed by different stakeholders.
There are challenges to overcome, but the results of this first stage of our research are promising.

References Clifton, K. (2007). The Development and Testing of an Audit for the Pedestrian Environment.
Landscape and Urban Planning, 95-110.
Cubukcu, E. (2013, Septiembre). Walking for Sustainable Living. Procedia - Social and Behavioral
Sciences, 85, 33-42. Retrieved 2017, from
http://www.sciencedirect.com/science/article/pii/S1877042813024622
Frank, L., Sallis, J., Conway, T., Chapman, J., Saelens, B., & Bachman, W. (2006). Many Pathways
from Land Use to Health: Associations between Neighborhood Walkability and Active
Transportation, Body Mass Index, and Air Quality. Journal of the American Planning
Association, 72(1), 75-87. Retrieved 2017, from
http://www.tandfonline.com/doi/abs/10.1080/01944360608976725
Lefebvre, H. (1991). Social Space. In H. Lefebvre, The production of space (pp. 68-168). Cambridge,
Massachusetts : Basil Blackwell Inc.
Leyden, K. (2003). Social Capital and the Built Environment: The Importance of Walkable
Neighborhoods. American Journal of Public Health, 1546-1551.
Mazumder, R. (2015, November 6). Design Thinking and the City: Dignity Lies in the Details.
Retrieved from Rober Mazumder web site:
https://robinmazumder.com/2015/11/06/dignity-design-and-the-city/
Mazumder, R. (2017). About: Robin Mazumder. Retrieved from Robin Mazumder web site:
https://robinmazumder.com/about/
Nykiforuk, C., VanSpronsen, E., & Schopflocher, D. (2014, February). Relating Built Environment to
Physical Activity: Two Failures to Validate. International journal of environmental research
and public health, 11(2), 1233–1249. Retrieved from
https://www.ncbi.nlm.nih.gov/pmc/articles/PMC3945535/
Park, S. (2008). Defining, Measuring, and Evaluating Path Walkability, and Testing its Impacts on
Transit Users’ Mode Choice and Walking Distance to the Station. Berkeley, California,
United States of America: University of California. Retrieved 2017, from
http://www.uctc.net/research/diss150.pdf
Runtastic. (2017). What is Runtastic? Retrieved from Runtastic web site:
https://www.runtastic.com/en/about
Still, K. (n.d.). Crowd Risk Analysis and Crowd Safety. Retrieved 2017, from Fruin - levels of service:
http://www.gkstill.com/Support/crowd-flow/fruin/LoS.html
Transport for London. (2004). Making London a Walkable City. London: Mayor of London.