![[PPT]Slide 1 - Welcome to the NCRM EPrints Repository …eprints.ncrm.ac.uk/147/1/RMF_workshop_FINAL_10_June.ppt · Web viewAgreement among multiple raters corrected for number of](https://static.fdocuments.net/doc/165x107/5c68f7fd09d3f263648c6a6a/pptslide-1-welcome-to-the-ncrm-eprints-repository-web-viewagreement-among.jpg)
Rating Performance among Raters of Different Experience ...
16
* This research was fully supported by Universiti Kebangsaan Malaysia under the Dana Penyelidikan FPEND (GG-2019- 034). ** Graduate Student, University Kebangsaan Malaysia, Faculty of Education, Selangor-Malaysia, [email protected], ORCID ID: 0000-0002-5429-6789 *** Senior Lecturer, University Kebangsaan Malaysia, Faculty of Education, Selangor-Malaysia, [email protected], ORCID ID: 0000-0002-6369-8501 ___________________________________________________________________________________________________________________ To cite this article Mohd Noh, M. F. & Mohd Matore, M. E. E. (2020). Rating performance among raters of different experience through Multi-Facet Rasch Measurement (MFRM) Model. Journal of Measurement and Evaluation in Education and Psychology, 11(2), 147-162. doi: 10.21031/epod.662964 Received: 25.12.2019 Accepted: 09.05.2020 ISSN: 1309 – 6575 Eğitimde ve Psikolojide Ölçme ve Değerlendirme Dergisi Journal of Measurement and Evaluation in Education and Psychology 2020; 11(2); 147-162 Rating Performance among Raters of Different Experience Through Multi-Facet Rasch Measurement (MFRM) Model * Muhamad Firdaus Bin MOHD NOH ** Mohd Effendi Ewan Bin MOHD MATORE *** Abstract One’s experience can greatly contribute to a diversified rating performance in educational scoring. Heterogeneous ratings can negatively affect examinees’ results. The aim of the study is to examine raters’ rating performance in assessing oral tests among lower secondary school students using Multi-facet Rasch Measurement (MFRM) model indicated by raters’ severity. Respondents are thirty English Language teachers clustered into two groups based on their rating experience in high-stakes assessment. The respondents listened to ten examinees’ recorded answers of three oral test items and provided their ratings. Instruments include items, examinees’ answers, scoring rubric, and scoring sheet used to appraise examinees’ competence in three domains which are vocabulary, grammar, and communicative competence. MFRM analysis showed that raters exhibited diversity in their severity level with chi- square χ 2 =2.661. Raters’ severity measures ranged from 2.13 to -1.45 logits. Independent t-test indicated that there was a significant difference in ratings provided by the inexperienced and the experienced raters, t-value = -0.96, df = 28, p<0.01. The findings of this study suggest that assessment developers must ensure raters are well versed before they can rate examinees in operational settings gained through assessment practices or rater training. Further research is needed to account for the varying effects of rating experience in other assessment contexts and the effects of interaction between facets on estimates of examinees’ measures. The present study provides additional evidence with respect to the role of rating experience in inspiring raters to provide accurate ratings. Keywords: Rating performance, rater-mediated assessment, Multi-faceted Rasch Measurement model, oral test, rating experience. INTRODUCTION Rater-mediated assessment is among the types of ubiquitous assessments in the education system around the world. At a global level, rater-mediated assessment is indispensable in high-stakes assessment to appraise examinees’ competence in complex traits such as speaking skill, writing skill , and art in order to screen examinees for essential selections such as university enrolment and job interview. However, the use of raters in assessing examinees’ competence within the context of high-stakes assessment brings impact on examinees’ final marks (Engelhard & Wind, 2018). This impact, known as the rater effect, is systematically attributed to raters’ variability and results in variances in observed ratings (Scullen, Mount & Goff, 2000). Negatively, examinees receive marks deviated far from their actual proficiency in the assessed domains (Myford & Wolfe, 2003).
Transcript of Rating Performance among Raters of Different Experience ...

* This research was fully supported by Universiti Kebangsaan Malaysia under the Dana Penyelidikan FPEND (GG-2019-
034).
** Graduate Student, University Kebangsaan Malaysia, Faculty of Education, Selangor-Malaysia,
[email protected], ORCID ID: 0000-0002-5429-6789
*** Senior Lecturer, University Kebangsaan Malaysia, Faculty of Education, Selangor-Malaysia, [email protected],
ORCID ID: 0000-0002-6369-8501
___________________________________________________________________________________________________________________
To cite this article Mohd Noh, M. F. & Mohd Matore, M. E. E. (2020). Rating performance among raters of different experience through Multi-Facet Rasch Measurement (MFRM) Model. Journal of Measurement and Evaluation in Education and Psychology, 11(2), 147-162. doi: 10.21031/epod.662964
Received: 25.12.2019 Accepted: 09.05.2020
ISSN: 1309 – 6575
Eğitimde ve Psikolojide Ölçme ve Değerlendirme Dergisi
Journal of Measurement and Evaluation in Education and Psychology
2020; 11(2); 147-162
Rating Performance among Raters of Different Experience
Through Multi-Facet Rasch Measurement (MFRM) Model *
Muhamad Firdaus Bin MOHD NOH **
Mohd Effendi Ewan Bin MOHD MATORE ***
Abstract
One’s experience can greatly contribute to a diversified rating performance in educational scoring. Heterogeneous
ratings can negatively affect examinees’ results. The aim of the study is to examine raters’ rating performance in
assessing oral tests among lower secondary school students using Multi-facet Rasch Measurement (MFRM) model
indicated by raters’ severity. Respondents are thirty English Language teachers clustered into two groups based
on their rating experience in high-stakes assessment. The respondents listened to ten examinees’ recorded answers
of three oral test items and provided their ratings. Instruments include items, examinees’ answers, scoring rubric,
and scoring sheet used to appraise examinees’ competence in three domains which are vocabulary, grammar, and
communicative competence. MFRM analysis showed that raters exhibited diversity in their severity level with chi-
square χ2=2.661. Raters’ severity measures ranged from 2.13 to -1.45 logits. Independent t-test indicated that there
was a significant difference in ratings provided by the inexperienced and the experienced raters, t-value = -0.96,
df = 28, p<0.01. The findings of this study suggest that assessment developers must ensure raters are well versed
before they can rate examinees in operational settings gained through assessment practices or rater training. Further
research is needed to account for the varying effects of rating experience in other assessment contexts and the
effects of interaction between facets on estimates of examinees’ measures. The present study provides additional
evidence with respect to the role of rating experience in inspiring raters to provide accurate ratings.
Keywords: Rating performance, rater-mediated assessment, Multi-faceted Rasch Measurement model, oral test,
rating experience.
INTRODUCTION
Rater-mediated assessment is among the types of ubiquitous assessments in the education system around
the world. At a global level, rater-mediated assessment is indispensable in high-stakes assessment to
appraise examinees’ competence in complex traits such as speaking skill, writing skill, and art in order
to screen examinees for essential selections such as university enrolment and job interview. However,
the use of raters in assessing examinees’ competence within the context of high-stakes assessment brings
impact on examinees’ final marks (Engelhard & Wind, 2018). This impact, known as the rater effect, is
systematically attributed to raters’ variability and results in variances in observed ratings (Scullen,
Mount & Goff, 2000). Negatively, examinees receive marks deviated far from their actual proficiency
in the assessed domains (Myford & Wolfe, 2003).
Journal of Measurement and Evaluation in Education and Psychology
___________________________________________________________________________________
___________________________________________________________________________________________________________________
ISSN: 1309 – 6575 Eğitimde ve Psikolojide Ölçme ve Değerlendirme Dergisi Journal of Measurement and Evaluation in Education and Psychology
148
Discussion on rating performance among raters is crucial to ensure that examinees are assessed with
fairness and reliability. Rating performance can be indicated through raters’ severity. Severity is raters’
inclination to severely adhere to assessment procedures and consequently may warrant excellent
examinees marks lower than their actual ability (Myford & Wolfe, 2003). On the contrary, leniency is
raters’ tendency to be lenient and generous in awarding marks more than examinees should receive
(Wind, 2018). Raters’ failure to control their severity and leniency can contribute to variances in
awarded scores, thus negatively affect examinees’ results.
Differences in rating performance among raters depend on raters’ diverse backgrounds, also known as
rater’s variability. Rating experience is one of the significant rater variability apart from other factors
including gender, age, first language, teaching experience, the amount of training they receive, and
language proficiency (Eckes, 2015). Previous research on the effect of raters’ rating experience on rating
performance has shown contradictory findings. Ahmadi Shirazi (2019) and Alp, Epner, and Pajupuu
(2018) found out that observed ratings generated by raters with distinct rating experience were not
significantly different. However, Attali (2016), Davis (2016), Huang, Kubelec, Keng, and Hsu (2018),
Isaacs and Thomson (2013), and Kim (2015) altogether concurred that raters with distinct rating
experience showed significantly different performance.
The literature on rating performances is mostly documenting variability that exists among raters,
including their rating experience (Eckes, 2015). Appointment of raters with different rating experience
is inevitable as there are always novice raters to replace retired raters. Thus any assessment setting would
have a combination of novice and experienced raters. Relative to novice raters, experienced raters may
be more impacted by their professionalism and expertise as compared to undesired factors such as
familiarity and experience. This situation has resulted in the practice of different judgment levels
because some raters rate with generosity, and some raters are stringent in awarding marks to examinees
due to their different rating experience. Consequently, examinees are judged with varying levels of
severity, and it boils down to the extent to which raters can generate scores within the accepted standard.
Empirically, conflicting findings emerged from the literature in terms of how raters’ experience has
impacted rating quality. Raters of different experiences were reported to show distinct rating quality in
some studies (Davis 2016; Huang et al. 2018; Kim 2015), but differences were not observed in other
studies (Ahmadi Shirazi, 2019; Isaacs & Thomson, 2013; Şahan & Razı, 2020).
Apart from that, the initiative to evaluate raters’ rating quality is usually executed through moderation
procedure during which another group of raters reviewing examinees’ answer scripts after being marked
by the first group of raters. The moderation for writing assessment is carried out by reviewing students’
answer scripts, but it is not the case with oral tests as it is a hassle to record examinees’ answers.
Therefore, the moderation process for oral tests is infeasible; thus, no one can monitor if raters do not
rate with irrelevant-construct variance. In other words, raters of oral tests are given full trust to execute
the scoring procedure, and the validation of scores they award to examinees solely depends on their
professionalism and expertise. It renders examinees’ future on raters’ performance in providing ratings.
Therefore, the current study contributes to the body of knowledge by confirming the extent to which
raters’ experience can lead to different rating quality among raters within the context of oral test. This
study seeks to investigate the rating performance of oral test raters in terms of their severity levels and
responds to the question concerning whether raters of different rating experiences produce significantly
different ratings. For such purpose, the study is implemented within the context of assessment executed
by lower secondary school teachers through replication of Pentaksiran Tingkatan Tiga (PT3) oral test in
Malaysia. The specific research objectives guiding the current study are the following:
1. To identify the severity levels practiced by raters in assessing oral test.
2. To identify the difference in rating performance between experienced and inexperienced raters.
Raters’ Rating Performance
Raters are individuals appointed by an authoritative body to mark examinees’ answers. Raters are
required to attend rater training to be adept in items used in the assessment, rubric, rating scales, rating

Mohd Noh, M. F, Mohd Matore, M. E. E. / Rating Performance Among Raters of Different Experience Through
Multi-Facet Rasch Measurement (MFRM) Model
___________________________________________________________________________________
___________________________________________________________________________________________________________________
ISSN: 1309 – 6575 Eğitimde ve Psikolojide Ölçme ve Değerlendirme Dergisi Journal of Measurement and Evaluation in Education and Psychology
149
procedures, and answer keys. This process aims at preparing raters before they execute the rating process
in the operational setting. Raters must be well-trained because the rating process highly depends on their
professionalism and comprehension, especially for subjectively scored items (Kang, Rubin & Kermad,
2019).
Subjectively scored items require examinees to construct their answers without being given any answer
choices (Haladyna & Rodrigues, 2013), such as essay writing and interview. There are also subjective
items scored objectively, for instance, short-response items. A significant difference between the two
types of items lies in the freedom warranted to raters while scoring (Albano & Rodrigues, 2018).
Objectively scored items are marked with rigidity, and answers that are not provided in the answer keys
are not acceptable. However, subjectively scored items are more flexible in accepting answers from
examinees even though it is not stated in the answer keys, and raters are given the privilege to use their
conscience and expertise in judging examinees’ answers.
This situation produces construct-irrelevant variance introduced by raters. It may negatively affect the
estimates of examinees’ competency measure (Bond & Fox, 2015) because it is impossible for all
examinees to be rated by one rater in an operational assessment setting (Jones & Wind, 2018). It is also
impractical for all appointed raters to rate all examinees due to time constraints, financial and human
resources. Hence, raters’ rating performance has captured the attention of many previous researchers,
primarily in the area of educational assessment, language assessment, and psychology (Engelhard &
Wind, 2018). Rating performance is used interchangeably as ‘rater effect,’ ‘rater accuracy,’ and ‘rater
error.’ Notably, this concept refers to the variability existed among raters that hinders them from
generating a valid and reliable rating score, which may not purely represent examinees’ accurate
competence level in the assessed domains (Wu & Tan, 2016).
In analyzing the rating performance of raters, many researchers opt for securitizing severity practiced
by raters. Severity is one of the indicators used to identify the extent to which raters succeed in producing
quality ratings (Eckes, 2015). This indicator is prominent because raters who are too strict or too lenient
may precipitate examinees to be judged with injustice (Myford & Wolfe, 2003). For example, highly
proficient examinees may be awarded lower marks if they are rated by strict raters. On the contrary, low
proficient examinees may receive higher marks if lenient raters score them.
Findings from previous research have depicted that raters’ severity level is different based on how they
are grouped and assessment context. Attali (2016) contends that raters’ severity level is different when
they are clustered according to rating experience. Inexperienced raters used varying degrees of severity
as compared to experienced raters, especially before any rater training was given. However, both groups
of raters were successful in generating homogeneous ratings after training. Huang et al. (2018) found
out that raters showed different levels of severity when they are compared according to their first
language within the context of language testing. Recently, Ahmadi Shirazi (2019) assigned raters of
writing test to rate using two rating methods (holistic and analytical) and concluded that raters of writing
test displayed different levels of severity and leniency. Similarly, Kang, Rubin and Kermad (2019)
discovered that raters of different first languages applied conflicting patterns of severity. Native speaker
raters usually display a high level of severity, while non-native speaker raters rate with lower severity
levels.
However, other research studies reach different conclusions, finding the practice of homogenous ratings
among raters regardless of how they are grouped. Koizumi, Okabe and Kashimada (2017) argued that
the difference in severity levels exhibited by raters of English language oral test was not significant.
Similarly, Weilie (2018), who has tasked teachers and non-teachers to mark examinees’ answers in oral
storytelling test, concluded that both groups of raters manifested indistinguishable patterns of severities.

Journal of Measurement and Evaluation in Education and Psychology
___________________________________________________________________________________
___________________________________________________________________________________________________________________
ISSN: 1309 – 6575 Eğitimde ve Psikolojide Ölçme ve Değerlendirme Dergisi Journal of Measurement and Evaluation in Education and Psychology
150
Rating Experience
Variability among raters influences their rating performance. Variability with significant impact has
been found to include rating experience. It has been identified as a major contributing factor for how
raters rate examinees’ answer scripts. Hence, a growing body of literature has sought to investigate the
extent to which raters’ rating experience can leave an impact on the way raters score examinees.
However, contradicting findings have emerged from the studies.
Raters were reported to manifest different rating quality when compared based on their amount of rating
experience. Experienced raters were able to attain higher inter-rater agreement among them in
comparison to beginners (Isaacs & Thomson, 2013) and rate with stability and consistent throughout
many rating sessions (Kim, 2015). Novice raters, on the other hand, were found to have difficulties in
using the rating scales, produced erratic ratings, and did not understand the rating scales accurately. In
contrast, raters with little experience manifested problematic rating patterns, tended to modify ratings
but improved a lot after several rating sessions (Kim, 2015). It was further corroborated by Attali (2016),
who reported that the correlation of marks between trainee raters and experienced raters were
considerably different when the marks were compared within the same group. A comparison of marks
within trainee raters suggested that the marks are heterogeneous and have more variance as compared
to experienced raters. Such observation was a result of their inability to discriminate between good
quality answer scripts and lesser ones. Similarly, Davis (2016) observed inconsistent ratings between
experienced and new raters, especially in terms of their severity, reliability, and inter-rater agreement.
On the contrary, other studies have discovered contrasting findings. Alp, Epner, and Pajupuu (2018)
concluded that raters with different rating experience managed to achieve acceptable standards of ratings
under a condition in which raters were aware of rating procedures. Ahmadi Shirazi (2019), who
employed raters with diversified rating experience to mark 20 examinees’ answer scripts, reported that
raters could rate within an acceptable range of severity level consistently. Raters were also observed to
use similar strategies and focused on the same criteria while scoring regardless of their rating experience
(Şahan & Razı, 2020).
The contradicting findings that emerged from the literature may be due to the different contexts used in
the studies and the research designs employed. Hence, it is indecisive to claim that rating experience is
a potent determinant in raters’ rating quality. The findings from existing studies also fail to generalize
the impact of raters’ rating experience. This indicates a need for more research conducted to investigate
how their experience can differentiate raters rating quality.
Multi-Faceted Rasch Measurement (MFRM) Model
The multi-faceted Rasch Measurement (MFRM) model is an extension of the Rasch measurement
model. The basic of Rasch model allows the calibration of only two estimates, item difficulty and person
ability involved in analyzing dichotomous items. MFRM extends the basic logistic dichotomous Rasch
model by allowing analysis to include more than two facets of the assessment settings, and the data
aimed to be analysed is not necessarily dichotomous (Eckes, 2019). It is therefore probable that
additional facets are to be incorporated into the analysis depending on the interest and condition of the
assessment. Eckes (2019) elaborated that other facets may include criteria, raters, interlocutors, tasks,
and assessment occasions. In order for any study to use MFRM as its primary statistical analysis, the
involved facets need to be identified first (Wesolowski & Wind, 2019). After the relevant facets have
been presupposed, a suitable MFRM model can formally be expressed to measure the estimation of each
facet. MFRM model to calibrate facets in oral tests can be translated into expression as follows:
(P𝑛ljmk
P𝑛ljmk − 1) = 𝜃𝑛 − l − 𝛼j− m − 𝜏k
(1)
Mohd Noh, M. F, Mohd Matore, M. E. E. / Rating Performance Among Raters of Different Experience Through
Multi-Facet Rasch Measurement (MFRM) Model
___________________________________________________________________________________
___________________________________________________________________________________________________________________
ISSN: 1309 – 6575 Eğitimde ve Psikolojide Ölçme ve Değerlendirme Dergisi Journal of Measurement and Evaluation in Education and Psychology
151
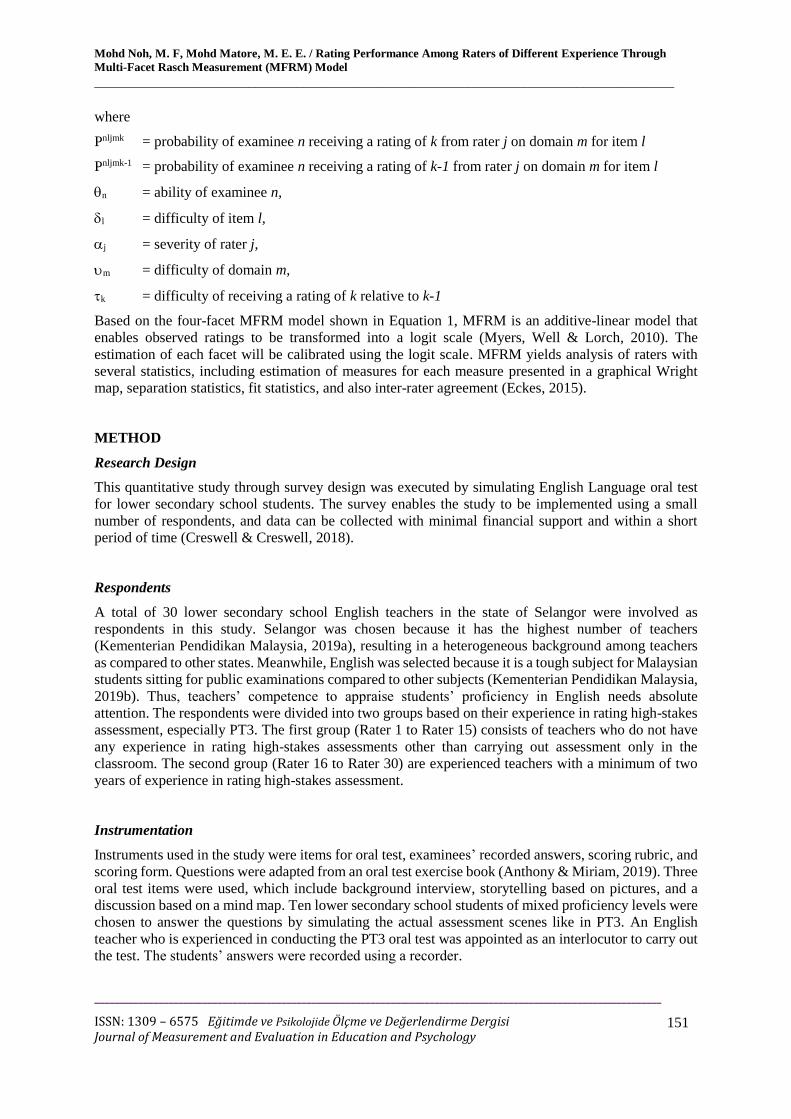
where
Pnljmk = probability of examinee n receiving a rating of k from rater j on domain m for item l
Pnljmk-1 = probability of examinee n receiving a rating of k-1 from rater j on domain m for item l
n = ability of examinee n,
l = difficulty of item l,
j = severity of rater j,
m = difficulty of domain m,
k = difficulty of receiving a rating of k relative to k-1
Based on the four-facet MFRM model shown in Equation 1, MFRM is an additive-linear model that
enables observed ratings to be transformed into a logit scale (Myers, Well & Lorch, 2010). The
estimation of each facet will be calibrated using the logit scale. MFRM yields analysis of raters with
several statistics, including estimation of measures for each measure presented in a graphical Wright
map, separation statistics, fit statistics, and also inter-rater agreement (Eckes, 2015).
METHOD
Research Design
This quantitative study through survey design was executed by simulating English Language oral test
for lower secondary school students. The survey enables the study to be implemented using a small
number of respondents, and data can be collected with minimal financial support and within a short
period of time (Creswell & Creswell, 2018).
Respondents
A total of 30 lower secondary school English teachers in the state of Selangor were involved as
respondents in this study. Selangor was chosen because it has the highest number of teachers
(Kementerian Pendidikan Malaysia, 2019a), resulting in a heterogeneous background among teachers
as compared to other states. Meanwhile, English was selected because it is a tough subject for Malaysian
students sitting for public examinations compared to other subjects (Kementerian Pendidikan Malaysia,
2019b). Thus, teachers’ competence to appraise students’ proficiency in English needs absolute
attention. The respondents were divided into two groups based on their experience in rating high-stakes
assessment, especially PT3. The first group (Rater 1 to Rater 15) consists of teachers who do not have
any experience in rating high-stakes assessments other than carrying out assessment only in the
classroom. The second group (Rater 16 to Rater 30) are experienced teachers with a minimum of two
years of experience in rating high-stakes assessment.
Instrumentation
Instruments used in the study were items for oral test, examinees’ recorded answers, scoring rubric, and
scoring form. Questions were adapted from an oral test exercise book (Anthony & Miriam, 2019). Three
oral test items were used, which include background interview, storytelling based on pictures, and a
discussion based on a mind map. Ten lower secondary school students of mixed proficiency levels were
chosen to answer the questions by simulating the actual assessment scenes like in PT3. An English
teacher who is experienced in conducting the PT3 oral test was appointed as an interlocutor to carry out
the test. The students’ answers were recorded using a recorder.

Journal of Measurement and Evaluation in Education and Psychology
___________________________________________________________________________________
___________________________________________________________________________________________________________________
ISSN: 1309 – 6575 Eğitimde ve Psikolojide Ölçme ve Değerlendirme Dergisi Journal of Measurement and Evaluation in Education and Psychology
152
The scoring rubric was adapted from lower secondary school (form one, two, and three) oral tests rubric
in the Common European Framework Reference for Language (CEFR) 2019 established by the ministry
(Lembaga Peperiksaan, 2019). Three domains were assessed, vocabulary (Domain 1), grammar
(Domain 2), and communicative competence (Domain 3). Each domain is divided into five different
mastery levels, which are level 1 (the lowest), level 2 (low), level 3 (average), level 4 (high), and level
5 (the highest). The scoring sheet is used by raters to record each examinee’s mark. All the instruments
have undergone face and content validity procedures involving nine-panel of experts. These panels are
university lecturers who are experts in language testing and educational measurement. Inter-rater
agreement was fully achieved, and their qualitative comments were considered before the instruments
were used in collecting data.
Administration
The rating process was implemented by all raters who were assigned to rate all examinees’ answers. It
was done using a fully-crossed rating design to ensure connectedness among presupposed facets
(Engelhard & Wind, 2018), as shown in Table 1. This design was used by previous research to create
sufficient linkage and enable rating performance analysis (Wind & Sebok-Syer, 2019). Each rater was
required to listen to the recordings and give ratings for item one involving domain one and two, item
two involving domain one and two and also item three involving domain one, two and three as
summarised in Table 1. Altogether, each rater has generated 70 scores (domain 1,2,1,2,1,2,3 x ten
examinees).
Table 1. Assessment Mapping Implemented by Raters
Raters Items Domains Examinees’ answer recordings
1 2 3 4 5 6 7 8 9 10
Rater 1
Rater 30
1 1,2 2 1,2 3 1,2,3
1 1,2 2 1,2 3 1,2,3
1 1,2 2 1,2 3 1,2,3
1 1,2 2 1,2 3 1,2,3
Statistical Analysis
In total, the number of ratings generated by all the raters was 2,100. The data was then analyzed using
MFRM model through FACETS software version 46.7.1 (Linacre, 2014a). This software can calibrate
more than two facets on the interval logit scale. The software is not only able to identify the interaction
between item difficulty and examinees’ ability but also raters’ severity by producing Wright map,
separation statistics, and fit statistics (Linacre, 2014b). MFRM is used because of its suitability, and
researchers of rating performance have frequently employed this approach to investigate rater effects
either in simulation or real-data studies (Wind & Guo, 2019).
The assumption of the Rasch model was met in terms of item fit and is depicted in Table 2. The findings
have revealed that the infit MNSQ of all the three items used was ranged between 0.91 to 1.05, and the
range for the outfit was between 0.87 to 1.07. Meanwhile, the Zstd values were reported to be within
±2.0 range as recommended by Bond and Fox (2015) except for one item, Storytelling (2.1). The
standard error which indicates the precision of measurement (Linacre, 2005) for all the items was ranged
between 0.7 to 0.9. The range of standard error is classified as excellent since they are under 0.25 (Fisher,

Mohd Noh, M. F, Mohd Matore, M. E. E. / Rating Performance Among Raters of Different Experience Through
Multi-Facet Rasch Measurement (MFRM) Model
___________________________________________________________________________________
___________________________________________________________________________________________________________________
ISSN: 1309 – 6575 Eğitimde ve Psikolojide Ölçme ve Değerlendirme Dergisi Journal of Measurement and Evaluation in Education and Psychology
153
2007). As for the PTMEA, positive values of more than 0.30 are desirable (Wu & Adam, 2007). All
three items managed to achieve the desired value ranged from 0.77 to 0.85. The PTMEA values indicate
that the items were able to discriminate the abilities of the candidates in assessing their speaking skills.
Overall, all three items were fit and suitable to be used in the study.
Table 2. Item Fit Report
Items Measure Model S.E. Infit Outfit Estim.
Discrm
Correlation
MnSq ZStd MnSq ZStd PtMea PtExp
Interview -1.84 0.09 1.05 0.8 1.07 1 0.95 0.77 0.82
Storytelling 1.1 0.09 0.91 -1.6 0.87 -2.1 1.09 0.81 0.81
Discussion 0.74 0.07 1.01 0.1 1.02 0.4 0.98 0.85 0.82
Mean 0 0.08 0.99 -0.2 0.99 -0.2 - 0.81 -
SD Population 1.31 0.01 0.06 1 0.09 1.4 - 0.04 -
SD Mean 1.61 0.01 0.07 1.3 0.11 1.7 - 0.04 -
To determine the functioning of each response category, Linacre’s (2002) guidelines for evaluating
rating scale category effectiveness were applied to the data. Table 3 shows the statistical report of the
scales used in the study.
Table 3. Scale Report
Data Quality Control Outfit
MnSq
Rasch-
Andrich
Threshold
Exp.
Meas. at Most
Probable
for
Rasch-
Thurstone
Threshold
Cat
Peak
Prob Category
Score Used %
Avrge.
Meas.
Exp.
Meas. Meas. S.E.
Category -
0.5
1 145 7 -6.71 -6.95 1.2 -7.95 low low 100%
2 710 34 -3.65 -3.56 1 -6.88 0.12 -4.43 -6.88 -6.88 -6.89 85%
3 865 41 -0.2 -0.23 0.9 -2.07 0.07 0.01 -2.07 -2.07 -2.08 80%
4 363 17 2.6 2.58 1 2.11 0.08 4.44 2.11 2.11 2.1 84%
5 16 1 4.51 4.73 1 6.85 0.27 -7.93 6.86 6.85 6.84 100%
For any rating scale to be considered of high quality, Linacre advocated six basic conditions to be met.
Firstly, a minimum of ten observations for each category was evident as the use of each category score
was ranged between 16 to 865. Secondly, average category measures that increase monotonically with
categories were observed as the average measures have increased in an orderly manner from -6.71 to -
3.65 to 0.2 to 2.6 to 4.51. Thirdly, outfit mean square statistics less than 2.0 was attained as the values
of all the category scores were ranged between 0.9 to 1.2. Fourthly, Rasch-Andrich category thresholds
that increase monotonically was fulfilled as the values have increased from -6.88 to -2.07 to 2.11 to
6.85. Fifthly, Rasch-Andrich category thresholds should be 1.0 to 5.0 logits apart. As shown on Table
4, the threshold between the scale categories in this study ranged between 1.0 to 5.0 except for Scale 1
and Scale 2 with difference value, 6.88. Finally, it was also observed that the shape of the probability
curves peaked for each category as presented in Figure 1. The peaks of all the category scores can be
clearly seen. Therefore, all five scales were appropriate to be used in the study.
Table 4. Threshold Change (gaps) Pair of scale Gaps Threshold results
S1-2 0.00 – (- 6.88) 6.88 (> 1.0)
S2-3 - 6.88 – (- 2.07) 4.81(> 1.0)
S3-4 - 2.07 – (2.11) 4.18 (> 1.0)
S4-5 2.11 – (6.85) 4.74 (> 1.0)

Journal of Measurement and Evaluation in Education and Psychology
___________________________________________________________________________________
___________________________________________________________________________________________________________________
ISSN: 1309 – 6575 Eğitimde ve Psikolojide Ölçme ve Değerlendirme Dergisi Journal of Measurement and Evaluation in Education and Psychology
154
Figure 1. Threshold for scale review
RESULTS
Four facets examined in this study were examinees, items, raters and domains. In addition, raters’ rating
experience was included as a dummy facet only and not to recognize its effect on estimation of other
facets but merely to see the difference of ratings generated by raters of different experience. Figure 2
presents Wright map, a graphical summary of the estimates of all facets. The first column is interval-
logit scale used to calibrate all the other facets. The second column compares the ten examinees in terms
of their ability in the oral test starting from the most able examinee at the top to the least able examinee
at the bottom of the column. Next, the third column compares all the raters based on their severity level.
The most severe rater is located at the top and the most lenient rater is positioned at the bottom. The
fourth column shows the three items used in the oral test based on difficulty level. The fifth column
displays domains assessed in the test arranged based on their difficulty levels starting from the most
difficult at the top and the least difficult at the bottom.

Mohd Noh, M. F, Mohd Matore, M. E. E. / Rating Performance Among Raters of Different Experience Through
Multi-Facet Rasch Measurement (MFRM) Model
___________________________________________________________________________________
___________________________________________________________________________________________________________________
ISSN: 1309 – 6575 Eğitimde ve Psikolojide Ölçme ve Değerlendirme Dergisi Journal of Measurement and Evaluation in Education and Psychology
155
+-----------------------------------------------------------------------------------------------+
|Measr|+Examinees |-Raters |-Items |-Domains |-Experience |Scale|
|-----+-----------+-----------------------+---------------+---------------+---------------+-----|
| 3 + + + + + + (5) |
| | 10 | | | grammar | | |
| | | 7 | | | | --- |
| 2 + + 2 + + + + |
| | 1 | | | | | |
| | | | | | | |
| | | 24 | story telling | | | |
| 1 + 2 9 + + + + + |
| | | 15 | | | | |
| | | 17 28 | discussion | | | |
| | | 18 | | | | |
| | | 21 25 | | | | |
| | 4 | 29 | | | experienced | |
* 0 * * 16 8 * * * * 3 *
| | | 26 19 23 20 1 | | | inexperienced | |
| | | 30 4 10 | | | | |
| | | 22 12 27 14 6 | | | | |
| | | 13 9 | | | | |
| | | 15 3 | | | | |
| -1 + + + + vocabulary + + |
| | | | | | | |
| | | | | | | |
| | 7 | 11 | | communicative | | |
| | 8 | | | | | |
| | 3 | | interview | | | |
| -2 + + + + + + |
| | | | | | | --- |
| | | | | | | |
| | | | | | | |
| | | | | | | |
| | | | | | | |
| -3 + + + + + + |
| | | | | | | |
| | | | | | | |
| | | | | | | |
| | | | | | | |
| | | | | | | |
| -4 + + + + + + |
| | | | | | | |
| | 6 | | | | | |
| | | | | | | 2 |
| | 5 | | | | | |
| | | | | | | |
| -5 + + + + + + (1) |
|-----+-----------+-----------------------+---------------+---------------+---------------+-----|
|Measr|+Examinee | * = 1 |-Items |-Domains |-Experience |Scale|
+-----------------------------------------------------------------------------------------------+
Figure 2. Wright Map of Examinees, Raters, Items, and Domains
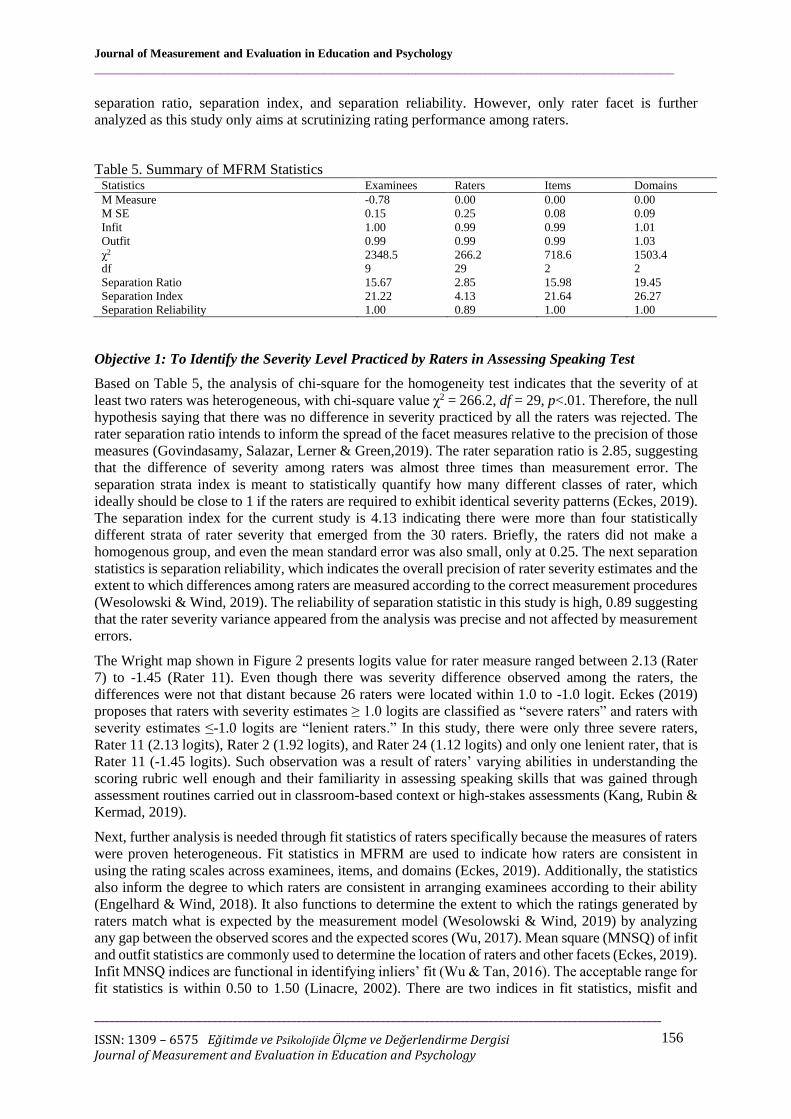
Table 5 summarizes MFRM statistics for examinees, raters, items, and domains in terms of their mean,
standard error, infit, outfit, chi-square value, and separation statistics. The separation statistics provide
Journal of Measurement and Evaluation in Education and Psychology
___________________________________________________________________________________
___________________________________________________________________________________________________________________
ISSN: 1309 – 6575 Eğitimde ve Psikolojide Ölçme ve Değerlendirme Dergisi Journal of Measurement and Evaluation in Education and Psychology
156
separation ratio, separation index, and separation reliability. However, only rater facet is further
analyzed as this study only aims at scrutinizing rating performance among raters.
Table 5. Summary of MFRM Statistics Statistics Examinees Raters Items Domains
M Measure -0.78 0.00 0.00 0.00
M SE 0.15 0.25 0.08 0.09
Infit 1.00 0.99 0.99 1.01
Outfit 0.99 0.99 0.99 1.03
χ2 2348.5 266.2 718.6 1503.4
df 9 29 2 2
Separation Ratio 15.67 2.85 15.98 19.45
Separation Index 21.22 4.13 21.64 26.27
Separation Reliability 1.00 0.89 1.00 1.00
Objective 1: To Identify the Severity Level Practiced by Raters in Assessing Speaking Test
Based on Table 5, the analysis of chi-square for the homogeneity test indicates that the severity of at
least two raters was heterogeneous, with chi-square value χ2 = 266.2, df = 29, p<.01. Therefore, the null
hypothesis saying that there was no difference in severity practiced by all the raters was rejected. The
rater separation ratio intends to inform the spread of the facet measures relative to the precision of those
measures (Govindasamy, Salazar, Lerner & Green,2019). The rater separation ratio is 2.85, suggesting
that the difference of severity among raters was almost three times than measurement error. The
separation strata index is meant to statistically quantify how many different classes of rater, which
ideally should be close to 1 if the raters are required to exhibit identical severity patterns (Eckes, 2019).
The separation index for the current study is 4.13 indicating there were more than four statistically
different strata of rater severity that emerged from the 30 raters. Briefly, the raters did not make a
homogenous group, and even the mean standard error was also small, only at 0.25. The next separation
statistics is separation reliability, which indicates the overall precision of rater severity estimates and the
extent to which differences among raters are measured according to the correct measurement procedures
(Wesolowski & Wind, 2019). The reliability of separation statistic in this study is high, 0.89 suggesting
that the rater severity variance appeared from the analysis was precise and not affected by measurement
errors.
The Wright map shown in Figure 2 presents logits value for rater measure ranged between 2.13 (Rater
7) to -1.45 (Rater 11). Even though there was severity difference observed among the raters, the
differences were not that distant because 26 raters were located within 1.0 to -1.0 logit. Eckes (2019)
proposes that raters with severity estimates ≥ 1.0 logits are classified as “severe raters” and raters with
severity estimates ≤-1.0 logits are “lenient raters.” In this study, there were only three severe raters,
Rater 11 (2.13 logits), Rater 2 (1.92 logits), and Rater 24 (1.12 logits) and only one lenient rater, that is
Rater 11 (-1.45 logits). Such observation was a result of raters’ varying abilities in understanding the
scoring rubric well enough and their familiarity in assessing speaking skills that was gained through
assessment routines carried out in classroom-based context or high-stakes assessments (Kang, Rubin &
Kermad, 2019).
Next, further analysis is needed through fit statistics of raters specifically because the measures of raters
were proven heterogeneous. Fit statistics in MFRM are used to indicate how raters are consistent in
using the rating scales across examinees, items, and domains (Eckes, 2019). Additionally, the statistics
also inform the degree to which raters are consistent in arranging examinees according to their ability
(Engelhard & Wind, 2018). It also functions to determine the extent to which the ratings generated by
raters match what is expected by the measurement model (Wesolowski & Wind, 2019) by analyzing
any gap between the observed scores and the expected scores (Wu, 2017). Mean square (MNSQ) of infit
and outfit statistics are commonly used to determine the location of raters and other facets (Eckes, 2019).
Infit MNSQ indices are functional in identifying inliers’ fit (Wu & Tan, 2016). The acceptable range for
fit statistics is within 0.50 to 1.50 (Linacre, 2002). There are two indices in fit statistics, misfit and
Mohd Noh, M. F, Mohd Matore, M. E. E. / Rating Performance Among Raters of Different Experience Through
Multi-Facet Rasch Measurement (MFRM) Model
___________________________________________________________________________________
___________________________________________________________________________________________________________________
ISSN: 1309 – 6575 Eğitimde ve Psikolojide Ölçme ve Değerlendirme Dergisi Journal of Measurement and Evaluation in Education and Psychology
157
overfit. Fit statistic less than 0.5 is considered overfit, or raters do not exhibit enough variations in their
ratings, while fit statistics greater than 1.5 indicates misfit or too much unpredictability (Wu & Tan,
2016). Eckes (2015) warned that misfit raters are more problematic than overfit raters.
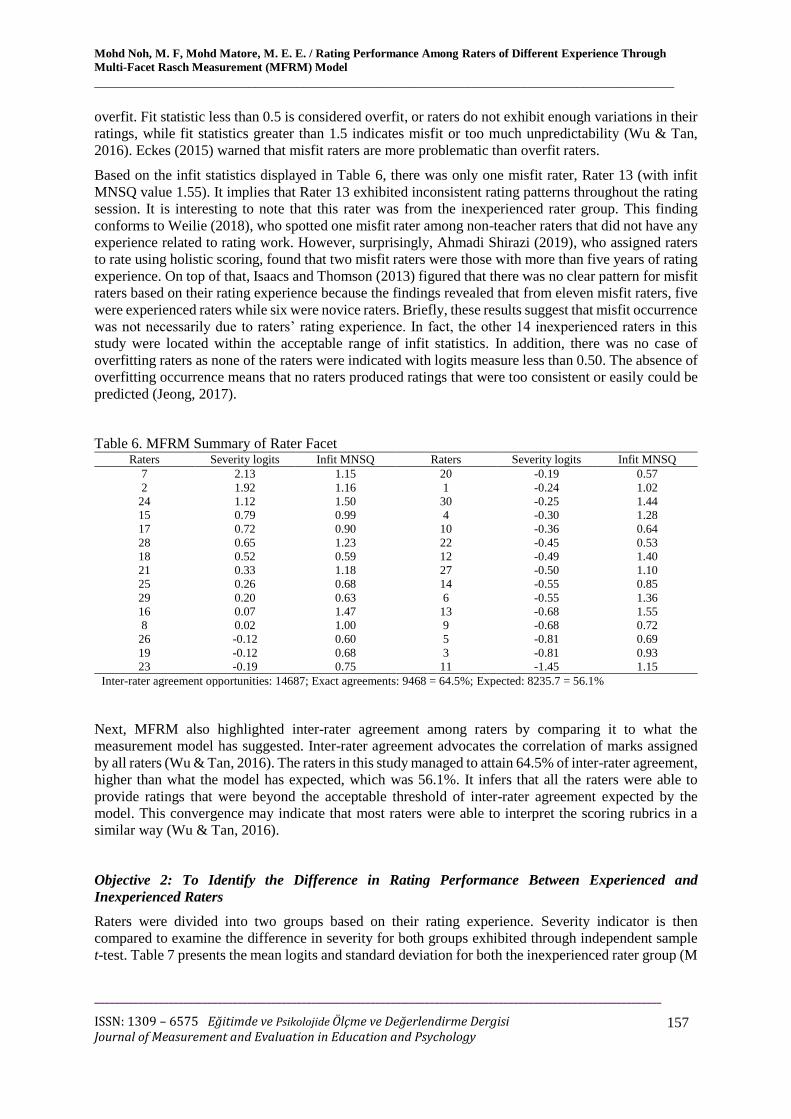
Based on the infit statistics displayed in Table 6, there was only one misfit rater, Rater 13 (with infit
MNSQ value 1.55). It implies that Rater 13 exhibited inconsistent rating patterns throughout the rating
session. It is interesting to note that this rater was from the inexperienced rater group. This finding
conforms to Weilie (2018), who spotted one misfit rater among non-teacher raters that did not have any
experience related to rating work. However, surprisingly, Ahmadi Shirazi (2019), who assigned raters
to rate using holistic scoring, found that two misfit raters were those with more than five years of rating
experience. On top of that, Isaacs and Thomson (2013) figured that there was no clear pattern for misfit
raters based on their rating experience because the findings revealed that from eleven misfit raters, five
were experienced raters while six were novice raters. Briefly, these results suggest that misfit occurrence
was not necessarily due to raters’ rating experience. In fact, the other 14 inexperienced raters in this
study were located within the acceptable range of infit statistics. In addition, there was no case of
overfitting raters as none of the raters were indicated with logits measure less than 0.50. The absence of
overfitting occurrence means that no raters produced ratings that were too consistent or easily could be
predicted (Jeong, 2017).
Table 6. MFRM Summary of Rater Facet Raters Severity logits Infit MNSQ Raters Severity logits Infit MNSQ
7 2.13 1.15 20 -0.19 0.57
2 1.92 1.16 1 -0.24 1.02
24 1.12 1.50 30 -0.25 1.44
15 0.79 0.99 4 -0.30 1.28
17 0.72 0.90 10 -0.36 0.64
28 0.65 1.23 22 -0.45 0.53
18 0.52 0.59 12 -0.49 1.40
21 0.33 1.18 27 -0.50 1.10
25 0.26 0.68 14 -0.55 0.85
29 0.20 0.63 6 -0.55 1.36
16 0.07 1.47 13 -0.68 1.55
8 0.02 1.00 9 -0.68 0.72
26 -0.12 0.60 5 -0.81 0.69
19 -0.12 0.68 3 -0.81 0.93
23 -0.19 0.75 11 -1.45 1.15
Inter-rater agreement opportunities: 14687; Exact agreements: 9468 = 64.5%; Expected: 8235.7 = 56.1%
Next, MFRM also highlighted inter-rater agreement among raters by comparing it to what the
measurement model has suggested. Inter-rater agreement advocates the correlation of marks assigned
by all raters (Wu & Tan, 2016). The raters in this study managed to attain 64.5% of inter-rater agreement,
higher than what the model has expected, which was 56.1%. It infers that all the raters were able to
provide ratings that were beyond the acceptable threshold of inter-rater agreement expected by the
model. This convergence may indicate that most raters were able to interpret the scoring rubrics in a
similar way (Wu & Tan, 2016).
Objective 2: To Identify the Difference in Rating Performance Between Experienced and
Inexperienced Raters
Raters were divided into two groups based on their rating experience. Severity indicator is then
compared to examine the difference in severity for both groups exhibited through independent sample
t-test. Table 7 presents the mean logits and standard deviation for both the inexperienced rater group (M
Journal of Measurement and Evaluation in Education and Psychology
___________________________________________________________________________________
___________________________________________________________________________________________________________________
ISSN: 1309 – 6575 Eğitimde ve Psikolojide Ölçme ve Değerlendirme Dergisi Journal of Measurement and Evaluation in Education and Psychology
158
= -0.14, SD = 1.00) and the experienced rater group (M = 0.14, SD = 0.47). The mean logits show that
the severity level of both groups did not deviate far from the total mean logits positioned at 0 logits.
Table 7. Differences of Rater Severity Based on Experience Groups N Mean
logits
Standard
Deviation
Standard
Error
Inter-rater agreement
Inexperienced raters 15 -0.14 1.00 0.26 58.9%
Experienced raters 15 0.14 0.47 0.12 70.0%
t value = -0.96; df = 28; p<0.01
The analysis of the independent sample t-test indicates that there was a statistically significant difference
between the two groups of raters with t-value = -0.96, df = 28, p<0.01. It means that the null hypothesis
that there was no difference between ratings provided by the inexperienced and the experienced raters
was rejected. It signifies that the severity practiced by the two groups was not identical. This finding is
consistent with those of Attali (2016); Davis (2016) and Huang et al. (2018), who reported that raters
with varying rating experience provided heterogeneous ratings, even though the studies were
implemented in different contexts. This consistency may be due to how rating experience among raters
was operationally defined. Raters in the aforementioned studies, including the current study, were
categorized based on whether they have rating experience in high-stakes assessment or not.
Furthermore, the two groups of raters differed in terms of inter-rater agreement. The experienced raters
were able to attain 70.0% inter-rater agreement, while the inexperienced raters only managed to achieve
58.9% inter-rater agreement. This finding is in agreement with Isaacs and Thomson’s (2013) findings,
which showed that inter-rater agreement among experienced raters was higher than among
inexperienced raters. It may be the case, therefore, that experienced raters managed to rate with a mutual
understanding of rubric and procedures. Indeed, it is desirable that raters manage to yield quality ratings,
especially in terms of inter-rater reliability, despite their variability.
CONCLUSION and DISCUSSION
The present study was designed to determine rating performance between inexperienced and
experienced raters within the context of oral tests in addition to confirming findings observed from
previous studies despite being conducted in different contexts. Through the analysis of MFRM, one of
the significant findings emerged from this study was that raters with different experiences showed non-
uniform severity level whereas, the experienced raters displayed more consistency than the
inexperienced raters. In general, therefore, the findings indicate that rating experience plays an important
role in determining the quality of ratings provided by raters. It is important to note especially by
assessment developers that raters with different rating experiences may produce distinct rating quality.
Since it is inevitable to avoid the appointment of new raters to replace retired raters, it is noteworthy to
ensure that raters undergo sufficient training sessions before engaging in operational assessment
routines. Additionally, training for raters must incorporate enough practical scoring opportunities by
simulating real situations of assessment conditions so that they can increase their ability to rate
examinees. A number of caveats need to be noted regarding the present study. While the study was
based on small sample size, the study was also carried out only within lower secondary school oral test
practicea. Research is also needed to determine how findings will be different if tested on broader
samples and contextualized in other assessment settings. Apart from that, this study has only discussed
the rater facet even though analysis of other facets (examinees, items and domains) were also generated
by MFRM. In fact, the rater facet was only analysed using the severity indicator. It would be interesting
to compare raters’ rating performance using other indicators such as halo effect and central tendency.
Future studies can also examine the effects of interaction between facets on the estimates of examinees’
measures. Additionally, it is unfortunate that the study did not include any rater training prior to scoring
sessions. Therefore, it is recommended that further research to include rater training before raters are

Mohd Noh, M. F, Mohd Matore, M. E. E. / Rating Performance Among Raters of Different Experience Through
Multi-Facet Rasch Measurement (MFRM) Model
___________________________________________________________________________________
___________________________________________________________________________________________________________________
ISSN: 1309 – 6575 Eğitimde ve Psikolojide Ölçme ve Değerlendirme Dergisi Journal of Measurement and Evaluation in Education and Psychology
159
engaged in scoring procedures so that the effects of training can be clearly identified between raters with
distinct rating experience.
ACKNOWLEDGEMENT
This research was fully supported by Universiti Kebangsaan Malaysia under the Dana Penyelidikan
FPEND (GG-2019-034). Appreciation is also given to all respondents involved in answering the survey.
Thanks to all the expert panels for assistance with instrument validation, data analysis and initial
comments on the manuscript.
REFERENCES Ahmadi Shirazi, M. (2019). For a greater good: Bias analysis in writing assessment. SAGE Open, 9(1), 1–14.
https://doi.org/10.1177/2158244018822377
Albano, A. D., & Rodrigues, M. (2018). Item development research and practice. Handbook of Accessible
Instruction and Testing Practices: Issues, Innovations, and Applications, 181–198.
https://doi.org/10.1007/978-3-319-71126-3_12
Alp, P., Epner, A., & Pajupuu, H. (2018). The influence of rater empathy, age and experience on writing
performance assessment. Linguistics Beyond And Within, 3(2017), 7–19. Retrieved from
https://www.ceeol.com/search/article-detail?id=716601
Anthony, L., & Miriam, S. (2019). Drill in English Skills Practice: CEFR-Alligned Curriculum. Selangor: Oxford
Fajar
Attali, Y. (2016). A comparison of newly-trained and experienced raters on a standardized writing assessment.
Language Testing, 33(1), 99–115. https://doi.org/10.1177/0265532215582283
Bond, T. G., & Fox, C. M. (2015). Applying the Rasch Model Fundamental Measurement in the Human Sciences.
New Jersey: Lawrence Erlbaum Associates.
Creswell, J. W., & Creswell, J. D. (2018). Research Design: Qualitative, Quantitative, And Mixed Methods
Approaches (5th ed.). California: Sage Publications.
Davis, L. (2016). The influence of training and experience on rater performance in scoring spoken language.
Language Testing, 33(1), 117–135. https://doi.org/10.1177/0265532215582282
Eckes, T. (2015). Introduction to Many-Facet Rasch Measurement: Analyzing and Evaluating Rater-Mediated
Assessments (2nd ed.). Peter Lang.
Eckes, T. (2019). Implications for rater-mediated language assessment. In Aryadoust, V., & Raquel, M. (Eds.),
Quantitative Data Analysis for Language Assessment Volume I: Fundamental Techniques (pp. 153-175).
London & New York: Routledge.
Engelhard, G., & Wind, S. A. (2018). Invariant Measurement with Raters and Rating Scales: Rasch Models for
Rater-Mediated Assessments. Routledge. New York & London: Routledge.
https://doi.org/10.1017/CBO9781107415324.004
Fisher, J. W. P. 2007. Rating scale instrument quality criteria. Rasch Measurement Transactions 21(1): 1095.
Govindasamy, P., Salazar, M. D. C., Lerner, J., & Green, K. E. (2019). Assessing the reliability of the framework
for equitable and effective teaching with the many-facet rasch model. Frontiers in Psychology, 10(June),
1–10. https://doi.org/10.3389/fpsyg.2019.01363
Haladyna, T. M., & Rodrigues, M. C. (2013). Developing and Validating Test. New York: Routledge.
Huang, L., Kubelec, S., Keng, N., & Hsu, L. (2018). Evaluating CEFR rater performance through the analysis of
spoken learner corpora. Language Testing in Asia, 8(1), 1–17.
https://doi.org/http://dx.doi.org/10.1186/s40468-018-0069-0
Isaacs, T., & Thomson, R. I. (2013). Rater experience, rating scale length, and judgments of L2 pronunciation:
Revisiting research conventions. Language Assessment Quarterly, 10(2), 135–159.
https://doi.org/10.1080/15434303.2013.769545
Jeong, H. (2017). Narrative and expository genre effects on students, raters, and performance criteria. Assessing
Writing, 31, 113–125. https://doi.org/10.1016/j.asw.2016.08.006
Jones, E., & Wind, S. A. (2018). Using Repeated Ratings to Improve Measurement Precision in Incomplete Rating
Designs. Journal of Applied Measurement, 19(2), 148–161. Retrieved from
https://www.ncbi.nlm.nih.gov/pubmed/29894984

Journal of Measurement and Evaluation in Education and Psychology
___________________________________________________________________________________
___________________________________________________________________________________________________________________
ISSN: 1309 – 6575 Eğitimde ve Psikolojide Ölçme ve Değerlendirme Dergisi Journal of Measurement and Evaluation in Education and Psychology
160
Kang, O., Rubin, D., & Kermad, A. (2019). The effect of training and rater differences on oral proficiency
assessment. Language Testing, 36(4), 481–504. https://doi.org/10.1177/0265532219849522
Kementerian Pendidikan Malaysia. (2019a). Quick Facts 2018: Malaysia Education Statistics. Retrieved from
https://www.moe.gov.my/en/muat-turun/laporan-dan-statistik/quick-facts-malaysia-education-
statistics/563-quick-facts-2018-malaysia-educational-statistics/file
Kementerian Pendidikan Malaysia. (2019b). Pengumuman Analisis Keputusan Sijil Pelajaran Malaysia (SPM)
2018. Retrieved from
http://lp.moe.gov.my/images/bahan/spm/2019/14032019/Laporan%20Analisis%20Keputusan%20SPM
%202018%20-%20Upload.pdf
Kim, H. J. (2015). A qualitative analysis of rater behavior on an L2 speaking assessment. Language Assessment
Quarterly, 12(3), 239–261. https://doi.org/10.1080/15434303.2015.1049353
Koizumi, R., Okabe, Y., & Kashimada, Y. (2017). A Multi-faceted Rasch analysis of rater reliability of the
Speaking section of the GTEC CBT. ARELE: Annual Review of English Language Education in Japan,
241–256. Retrieved from https://www.jstage.jst.go.jp/article/arele/28/0/28_241/_article/-char/ja/
Lembaga Peperiksaan. (2019). Instruction to Speaking Examiners (Pentaksiran Tingkatan 3). Retrived from
http://lp.moe.gov.my/images/bahan/pt3/2019/21082019/S1%20MES%20PT3%20Instructions%20to%20
Speaking%20%20Examiners_Revised%20version.pdf
Linacre, J. M. (2005). Standard errors: means, measures, origins and anchor values. Rasch Measurement
Transactions, 19(3), 1030.
Linacre J. M. (2002). Understanding Rasch measurement: Optimizing rating scale category effectiveness. Journal
of Applied Measurement, 3, 85–106. Retrieved from
http://citeseerx.ist.psu.edu/viewdoc/download?doi=10.1.1.424.2811&rep=rep1&type=pdf
Linacre, J. M. (2014a). Facets Rasch measurement computer program (Version 3.71.4) [Computer software].
Chicago: Winsteps.com.
Linacre, J. M. (2014b). A user’s guide to FACETS: Rasch-model computer programs. Chicago: Winsteps.com.
Retrieved from http://www.winsteps.com/facets.htm
Myers, J. L., Well, A. D., & Lorch, R. F. (2010). Research design and statistical analysis (3rd ed.). New York,
NY: Routledge
Myford, C., & Wolfe, E. W. (2003). Detecting and measuring rater effects using Many-Facet Rasch Measurement:
Part I. Journal Od Applied Measurement, 4(October 2015), 386–422. Retrieved from
https://www.researchgate.net/profile/Carol_Myford/publication/9069043_Detecting_and_Measuring_Ra
ter_Effects_Using_Many-Facet_Rasch_Measurement_Part_I/links/54cba70e0cf298d6565848ee.pdf
Şahan, Ö., & Razı, S. (2020). Do experience and text quality matter for raters’ decision-making behaviors?
Language Testing, 1-22. https://doi.org/10.1177/0265532219900228
Scullen, S. E., Mount, M. K., & Goff, M. (2000). Understanding the latent structure of job performance ratings.
Journal of Applied Psychology, 85(6), 956–970. https://doi.org/10.1037/0021-9010.85.6.956
Weilie, L. (2018). To what extent do non-teacher raters differ from teacher raters on assessing story-retelling.
Journal of Language Testing & Assessment, 1, 1–13. Retrieved from
http://clausiuspress.com/assets/default/article/2018/08/29/article_1535590233.pdf
Wesolowski, B. C., & Wind, S. A. (2019). Pedagogical considerations for examining rater variability in rater‐mediated assessments: A three‐ model framework. Journal of Educational Measurement, 56(3), 521–546.
https://doi.org/10.1111/jedm.12224
Wind, S. A., & Sebok-Syer, S. S. (2019). Examining differential rater functioning using a between-subgroup outfit
approach. Journal of Educational Measurement, 56(2), 217–250. https://doi.org/10.1111/jedm.12198
Wind, S. A. (2018). Examining the impacts of rater effects in performance assessments. Applied Psychological
Measurement, 43(2), 159–171. https://doi.org/10.1177/0146621618789391
Wind, S. A., & Guo, W. (2019). Exploring the combined effects of rater misfit and differential rater functioning
in performance assessments. Educational and Psychological Measurement, 1–26.
https://doi.org/10.1177/0013164419834613
Wu, M. (2017). Some IRT-based analyses for interpreting rater effects. Psychological Test and Assessment
Modeling, 59(4), 453–470. Retrieved from https://www.psychologie-
aktuell.com/fileadmin/download/ptam/4-2017_20171218/04_Wu.pdf
Wu, M. & Adams, R. (2007). Applying the Rasch model to psycho-social measurement: A practical approach.
Melbourne: Educational Measurement Solutions
Wu, S. M., & Tan, S. (2016). Managing rater effects through the use of FACETS analysis: The case of a university
placement test. Higher Education Research and Development, 35(2), 380–394.
https://doi.org/10.1080/07294360.2015.1087381

Mohd Noh, M. F, Mohd Matore, M. E. E. / Rating Performance Among Raters of Different Experience Through
Multi-Facet Rasch Measurement (MFRM) Model
___________________________________________________________________________________
___________________________________________________________________________________________________________________
ISSN: 1309 – 6575 Eğitimde ve Psikolojide Ölçme ve Değerlendirme Dergisi Journal of Measurement and Evaluation in Education and Psychology
161
Çok Yüzeyli Rasch Ölçümü (MFRM) Modeli ile Farklı Deneyim
Puanları Arasında Derecelendirme Performansı
Giriş
Puanlayıcı aracılı değerlendirme, eğitim ortamında birçok yerde karşılaşılabilecek ve adayların
karmaşık özelliklerini değerlendirmeye yönelik özellikle yüksek riskli değerlendirmelerde
kullanılmaktadır. Bununla birlikte puanlayıcı kullanıldığı durumda puanlayıcıların yeterliği geçerliği
doğrudan etkilemektedir. Puanlayıcılar değerlendirme prosedürlerini önemli bir şekilde takip etseler de
puanlama performanslarında önyargılı davranabilirler. Ayrıca puanlayıcıların deneyimlerine bağlı
olarak performasları da farklılık gösterebilmektedir. Bununla ilgili olarak ise alanyazında yapılmış
çalışmalar bulunmaktadır (Ahmadi Shirazi 2019; Alp, Epner ve Pajupuu 2018; Attali 2016; Davis 2016).
Bu çalışmalarda deneyimli puanlayıcıların puanlama sürecinde uzmanlıklarından daha fazla etkilendiği,
acemi puanlayıcıların ise benzer kalitede puanlama yapamadıkları iddia edilmiştir. Sonuç olarak
puanlayıcıların puanlama sürecinde birçok faktörden etkilendiği; bazılarının daha cömert bazılarının ise
puanlamada daha katı davrandığı bilinmektedir. Bu puanlama süreçleri sonucunda ise sınava giren
adayların puanları ciddi şekilde değişiklik göstermektedir. Özellikle sözlü sınavlarda puanlayıcıların
değerlendirme prosedürlerine tam olarak uygun davranamadıkları, bu nedenle de adayların puanlarına
puanlayıcısından kaynaklı hataların karışabileceği düşünülmektedir. Bu doğrultuda bu araştırma
kapsamında sözlü bir sınavda puanlayıcıların puanlama performanslarının incelenmesi ve farklı
puanlama deneyimlerine sahip değerlendiriciler ile deneyimsiz puanlayıcıların puanları arasında bir
farklılık olup olmadığını belirlemek amaçlanmıştır. Araştırmanın temel problemleri bu doğrultuda şu
şekildedir:
Sözlü sınavların değerlendirilmesinde uygulanan puanlama ciddiyetinin belirlenmesi
Deneyimli ve deneyimsiz puanlayıcıların performansları arasında bir fark olup olmadığının
belirlenmesi
Yöntem
Nicel araştırma yönteminde yürütülen bu çalışmada ortaokul öğrencilerinin İngilizce sözlü sınavları
puanlarının incelemesi gerçekleştirilmiştir. Toplam 30 ortaokulda görev yapan İngilizce öğretmeni
puanlayıcı olarak çalışmaya dâhil edilmiştir. Öğretmenler yüksek riskli testleri puanlama konusundaki
deneyimlerine dayanarak iki gruba ayrılmışardır. İlk grupta yer alan 15 öğretmen bu konuda
deneyimsizken diğer gruptaki 15 öğretmen, yüksek riski testleri değerlendirme konusunda en az iki
yıllık deneyime sahip kişilerdir. Araştırmanın verilerini öğrencilere uygulana sözlü test, sınava
katılanların cevapları, puanlama anahtarı ve puanlama formu oluşturmaktadır. Sözlü testte genel
görüşme, hikâye anlatımı ve tartışma olmak üzere üç görev bulunmaktadır. Sözlü anlatım testindeki
görevleri cevaplandırmak üzere farklı yeterlik düzeylerine sahip 10 öğrenci seçilmiş ve öğrencilerin
cevapları doğrultusunda simülasyon işlemi gerçekleştirilmitşir. Öğrencilerin üç görevdeki cevapları da
kelime bilgisi, dil bilgisi ve iletişimsel yeterlik alanlarında değerlendirilmiştir. Puanlayıcıların tamamı,
sınava katılan 10 öğrenciyi de puanlamışlardır. Verilerin analizi FACETS yazılımı kullanılarak
gerçekleştirilmiştir (Linacre, 2014a). Veriler analiz edilmeden önce analiz için kullanılan Rasch
modelinin varsayımları için MNSQ infit kullanılmış ve üç görev için de madde-uyum değerlerinin,
standart hatanın ve PTMEA değerinin kabul edilebilir değerler arasında olduğu belirlenmiştir. Puanalam
anahtarında kulanılan derecelendirme ölçeklerinin Linacre (2002) tarafından belirlenen altı temel koşulu
karşıladığı ve tüm ölçeklerin çalışmada kullanmaya uygun olduğu tespit edilmiştir.

Journal of Measurement and Evaluation in Education and Psychology
___________________________________________________________________________________
___________________________________________________________________________________________________________________
ISSN: 1309 – 6575 Eğitimde ve Psikolojide Ölçme ve Değerlendirme Dergisi Journal of Measurement and Evaluation in Education and Psychology
162
Sonuç ve Tartışma
Bu çalışmada öğrenciler, maddeler, puanlayıcılar ve alanlar olmak üzere dört facet bulunmaktadır.
MFRM analizinde her birimi parametrelerine göre düzenlemek amacıyla Wirght haritası
oluşturmaktadır. Homojenlik testi için ki-kare analizi, en az iki puanlayıcının puanlarının ciddiyetinin
ki-kare değeri χ2 = 266.2, df = 29, p <.01 ile heterojen olduğunu göstermiştir. Puanlayıcı ayırma oranı
2,85'tir ve puanlayıcılar arasındaki ciddiyet farkının ölçüm hatasından neredeyse üç kat daha fazla
olduğunu gösterir. Ayırma indeksi 4.13 olup istatistiksel olarak dörtten fazla puanlayıcı ciddeiyet
katmanı olduğunu göstermektedir. Ayırma istatistiği güvenilirliği 0.89'dur, bu da puanlayıcı ciddiyetinin
varyansının kesin olduğunu ve ölçüm hatalarından fazla etkilenmediğini göstermektedir. Bulgular,
burada üç puanlayıcı ciddiyeti ve sadece bir ılımlı puanlayıcı olduğunu ortaya koymaktadır. Bu gözlem,
puanlayıcıların puanlama anahtarını anlama konusundaki çeşitli yeteneklerinin ve konuşma becerilerini
değerlendirme konusundaki aşinalıklarının bir sonucudur (Kang, Rubin ve Kermad, 2019). Uyumsuz
sadece bir puanlayıcı vardır ve onun da puanları aşırı uyumsuz değildi. Araştırmanın ilginç olan bulgusu,
uyumsuz puanlayıcının deneyimsiz gruptan olmasıdır. Bu sonuç, deneyimsiz puanlayıcılar arasında
uyumsuz bir puanlamayı tespit eden Weilie (2018) ile benzerlik göstermektedir. Bununla birlikte,
şaşırtıcı bir şekilde, Ahmadi Shirazi (2019), iki uyumsuz puanlayıcının beş yıldan fazla puanlama
deneyimine sahip olan kişiler arasında olduğunu bulmuştur. Isaacs ve Thomson (2013), puanlama
deneyimlerine dayanarak uyumsuz puanlayıcılar için net bir model olmadığını belirtmişlerdir. Kısacası
elde edilen bu sonuçlar puanlayıcılar arasındaki uyumsuzluğun mutlaka puanlayıcıların deneyiminden
kaynaklanmadığını göstermektedir. Bu çalışmadaki puanlayıcılar %64.5 düzeyinde uyum
göstermişlerdir. Tüm puanlayıcıların, model tarafından beklenen puanlayıcılar arası uyumun kabul
edilebilir sınırının üstünde puanlar verebildiklerini göstermektedir (Wu & Tan, 2016).
Araştırmada daha sonra puanlayıcıların ciddiyeti, bağımsız örneklem t-testi ile her iki grup için
karşılaştırılmıştır. Tablo 1'deki bulgular, iki grup arasında istatistiksel olarak anlamlı bir fark olduğunu
göstermiş (t-değeri = -0.96, df = 28, p <0.01) ve deneyimli grup ile deneyimsiz grup arasında fark
olmadığını belirten yokluk hipotezinin reddedilmesini sağlamıştır. Bu sonuç Attali (2016) bulgularıyla
tutarlıdır; Davis (2016) ve Huang ve diğ. (2018), farklı puanlama deneyimine sahip değerlendiricilerin,
farklı çalışmalar bağlamında heterojen puanlama yaptıklarını ortaya koymuştur. Sonuçlar arasındaki bu
tutarlılık, puanlayıcıların puanlama deneyimlerinin nasıl tanımlandığında bağlı olarak da değişebilir.
Biz bu çalışmamızda deneyimli puanlayıcı olarak yüksek riskli testlerde puanlama deneyimine sahip
olan kişileri tanımladık.
Tablo 1. Deneyime Göre Puanlayıcı Ciddiyetinin Farklılıkları Gruplar N Ortalama
loglar
Standart
Sapma
Standart
Hata
Değerlendiriciler arası
anlaşma
Deneyimsiz değerlendiriciler 15 -0.14 1.00 0.26 58.9%
Deneyimli değerlendiriciler 15 0.14 0.47 0.12 70.0%
t değeri = -0.96; df = 28; p<0.01