Rates of Mental Illnesses, Nativity and Generational ...
163
i Rates of Mental Illnesses, Nativity and Generational Status in the U.S.: Heterogeneity Among Caribbean Born Blacks, Blacks of Caribbean Descent and U.S. Born Blacks Efua Akoma Dissertation submitted to the Faculty of the Virginia Polytechnic Institute and State University in partial fulfillment of the requirements for the degree of Doctor of Philosophy In Sociology Biko Agozino, Chair Kwame Harrison Ellington Graves Paulo Polanah February 20, 2014 Blacksburg, VA Keywords: Blacks, Caribbean descent, Caribbean Blacks, mental illness, U.S. residency, mental health, ethnic origin, generational status
Transcript of Rates of Mental Illnesses, Nativity and Generational ...

i
Rates of Mental Illnesses, Nativity and Generational Status in the U.S.: Heterogeneity Among Caribbean Born Blacks, Blacks of Caribbean Descent and U.S. Born Blacks
Efua Akoma
Dissertation submitted to the Faculty of the Virginia Polytechnic Institute and State University in partial fulfillment of the requirements for the degree of
Doctor of Philosophy In
Sociology
Biko Agozino, Chair Kwame Harrison Ellington Graves Paulo Polanah
February 20, 2014 Blacksburg, VA
Keywords: Blacks, Caribbean descent, Caribbean Blacks, mental illness, U.S. residency, mental health, ethnic origin, generational status

ii
Rates of Mental Illnesses, Nativity and Generational Status in the U.S.: Heterogeneity Among Caribbean Born Blacks, Blacks of Caribbean Descent and U.S. Born Blacks
Efua Akoma
Abstract
America has continued to be increasingly diverse in culture and ethnicities. As such, these diverse populations require those in health and mental health fields to adjust to the cultural differences that arise. Central to these conversations is the impact of the acculturation process on immigrant populations. Researchers posit the stress of immigration and the acculturation process leads to increased rates of mental illness (Lang, Munoz, Bernal & Sorenson 1982; Masten, Penland & Nayani 1994; Neff & Hoppe 1993). Assuming that the acculturation process impacts first generation immigrants most, this study investigated U.S. born Blacks with and without Caribbean descent and Caribbean born Blacks residing in the U.S. to determine if nativity status and generational status impacts rates of mental illness. Using the National Survey of American Life (NSAL) dataset which is one of three research projects conducted from 2001 to 2003 by the Program for Research on Black Americans (PBRA), as part of the Research Center for Group Dynamics project, analyses were conducted to determine if relationships existed for these groups. Results indicated that mental illness is dependent on country of origin and U.S. born Blacks do self-report mental illnesses significantly more than Caribbean Blacks. Caribbean Blacks who are first generation in the U.S. are significantly less likely to report mental illness than second generation Caribbean Blacks. Differences in gender, work, number of years living in the U.S., age at immigration and wealth and poverty indicators all show some relationships with mental illnesses.

iii
ACKNOWLEDGEMENTS
Pursuing a PhD is a big endeavor. Getting married and having two children while in your doctoral program makes it
a huge endeavor. Progressing to this point involved so much support from a number of amazing people. I have
stood upon the shoulders of many, some names I know, others I do not but to all of you I am grateful. This journey
began with three individuals, Dr. Akinyele Umoja, Dr. Makungu Akinyele and Dr. Charles Jones. Without you and
the African American Studies department at Georgia State University, my pathways would not have had such a
solid foundation. I want to thank the Sociology department and Africana Studies program at Virginia Tech for the
opportunity and support during this process. This could not have been done without the hard work and dedication
of my committee chair, Dr. Onwubiko Agozino and my other committee members, Dr. Kwame Harrison, Dr.
Ellington Graves, Dr. Carol Bailey and Dr. Paulo Polanah. My dearest Brenda Husser, what would I have done
without you? I and every other Sociology student at Virginia Tech are incredibly lucky to have you there.
There are a number of other individuals that became lifelong friends; thank you Eileen Weigand, Dr. Adrienne Trier-
Bieniek and Dr. C Rowley for your support and swift kicks when I needed them. Dr. Carla Miller, my journey at
Virginia Tech would have been a lot less interesting without you. Recently, I was fortunate to have met some
incredible people who also play important roles. Thank you for always lending an ear and infallible support and
encouragement at the times I needed it the most Dr. Nichole Boutte-Heiniluoma. Thank you for your kindness,
encouragement and positive energy Dr. Elaine Alden.
As for my incredible and loving husband Khary and amazing children Donte, Zumbi and Kiraboji, I love you all more
than I thought it possible to love another person. All of this hard work was for you and could not have been
accomplished without you and please forgive me for having to steal your time with me to see this to fruition. As for
my loving and wise cousin, Aldwyn (Berty) Carrington, thank you for always believing in me. Sarah Bobrow-
Williams, in all our ups and downs, you have been one of my biggest supporters and I appreciate it more than
words can convey. Daddy and Mommy, without you I would not be the person who could make it this far. To the
many other family members who were encouraging or served as motivation, thank you. To my extended family of
Mamas, Babas and Comrades, I relied on your strength and determination throughout this process. I would like to
acknowledge Zindzhi, Serwaa and Teri, a finer group of women could not be found. I am honored to call you my
sisters and I am forever grateful for your presence in my life. To be held accountable is the truest form of love.
I dedicate this work to all the little ones in my life. I will never ask you to do things I was not willing to do.

iv
Table of Contents
Abstract...................................................................................................................................................................... ii
Acknowledgements.................................................................................................................................................. iii
Table of Contents......................................................................................................................................................iv
List of Graphs…………………………………………………………………………………………………………………vi
List of Tables............................................................................................................................................................vii
Chapter 1 Introduction............................................................................................................................................. 1
The Problem Statement.............................................................................................................................................. 1
The Purpose of the Study........................................................................................................................................... 4
Significance of the Study............................................................................................................................................ 4
Study Format.............................................................................................................................................................. 6
Chapter 2 Patterns of Mental Illnesses, Nativity and Generational Status for
Caribbean Born Blacks, Blacks of Caribbean Descent and U.S. Born Blacks................................................... 7
Immigration............................................................................................................................................................... 12
Why Move to the United States? ............................................................................................................................. 14
Immigrant Mental Health.......................................................................................................................................... 14
Cultural Heterogeneity Among Blacks...................................................................................................................... 15
Overall Rates of Psychiatric Disorder....................................................................................................................... 16
Depression/Alcohol Related Depression.................................................................................................................. 18
Nativity/Generational Differences............................................................................................................................. 19
Schizophrenia........................................................................................................................................................... 20
Nativity/Generational Differences............................................................................................................................. 21
The Relevance of Wealth and Education to Mental Health...................................................................................... 22
My Study………………………………………………………………………………………………………………………. 25
Chapter 3 Methodology.......................................................................................................................................... 27
Theoretical Framework............................................................................................................................................. 27
Hypothesis................................................................................................................................................................ 28
Dataset..................................................................................................................................................................... 30
Dependent Variables................................................................................................................................................ 31
Independent Variables.............................................................................................................................................. 35

v
Control Variables...................................................................................................................................................... 35
Analytic Strategy....................................................................................................................................................... 36
Chapter 4 Results ...................................................................................................................................................37
Rates of Mental Illnesses U.S. Blacks vs. Caribbean Blacks....................................................................................49
Length of Residency in the U.S. among Caribbean Blacks.......................................................................................52
Generational Status and Rates of Mental Illnesses.................................................................................................. 54
Country of Origin....................................................................................................................................................... 57
Education.................................................................................................................................................................. 59
Gender...................................................................................................................................................................... 74
Employment.............................................................................................................................................................. 79
Home Ownership...................................................................................................................................................... 86
Welfare and Government Housing Assistance..........................................................................................................92
Logistic Regressions............................................................................................................................................... 101
Chapter 5 Discussion............................................................................................................................................115
U.S. Born vs. Caribbean Born Respondents.......................................................................................................... 116
Length of Residency in the U.S. among Caribbean Blacks.....................................................................................117
Generational Status and Rates of Mental Illnesses.................................................................................................118
Country of Origin..................................................................................................................................................... 119
Education ............................................................................................................................................................... 120
Gender.................................................................................................................................................................... 122
Employment............................................................................................................................................................ 123
Home Ownership.................................................................................................................................................... 125
Welfare and Government Housing Assistance....................................................................................................... 126
Logistic Regression Models.................................................................................................................................... 128
ICD Hypomania (Lifetime........................................................................................................................................ 129
DSM-IV Panic Attack & ICD Panic Attack (Lifetime) …………………......................................................……...…. 130
ICD Panic Disorder (12 months.............................................................................................................................. 130
DSM-IV Oppositional Defiant Disorder w/ Hierarchy (Lifetime).............................................................................. 131
Chapter 6 Conclusion........................................................................................................................................... 133
Limitations............................................................................................................................................................... 135

vi
Future Research..................................................................................................................................................... 136
References ............................................................................................................................................................ 138
Appendix A. DSM-IV Definition of Illnesses in Alphabetical Order.................................................................. 152
Appendix B. ICD-10 Definition of Illnesses in Alphabetical Order................................................................... 155
List of Graphs
Graph 1 Country in which you were born ............................................................................................................... 38
Graph 2 Race/Ancestry ........................................................................................................................................... 38
Graph 3 Caribbean Ethnic Origins........................................................................................................................... 39
Graph 4 Age at Immigration 5 Categories................................................................................................................ 39
Graph 5 Number of years in U.S. 5 categories........................................................................................................ 40
Graph 6 Frequency (%) of those who endorse each mental illness......................................................................... 41
Graph 7 Gender Frequency..................................................................................................................................... 42
Graph 8 Work for pay at present time...................................................................................................................... 42
Graph 9 Have HS diploma/equivalency .................................................................................................................. 43
Graph 10 Have College degree............................................................................................................................... 43
Graph 11 Highest grade of school completed.......................................................................................................... 44
Graph 12 How much time received welfare before turned 18 ................................................................................. 45
Graph 13 # of total years received welfare after turning 18 .................................................................................... 46
Graph 14 Live in public housing............................................................................................................................... 47
Graph 15 Pay low/no rent because of gov’t............................................................................................................. 47
Graph 16 Have mortgage on home ........................................................................................................................ 47
Graph 17 # hours work for pay/profit in average week ........................................................................................... 48
Graph 18 Additional Descriptive Statistics of Demographic variables..................................................................... 49
Graph 19 Endorsed Mental Illness and High School Diploma or equivalent earned............................................... 66
Graph 20 Endorsed Mental Illness and College Degree ........................................................................................ 73

vii
List of Tables
Table 1 Mental Illness by Birth in the U.S. or Not..................................................................................................... 50
Table 2 Mental Illness by the number of years residing in the U.S. for Caribbean respondents …......................... 52
Table 3 Mental Illness by Generational Status ........................................................................................................ 55
Table 4 Mental Illness by the Caribbean Ethnic Origins 5 categories respondents ................................................ 57
Table 5 Mental Illness by High School Diploma or Equivalent Earned.................................................................... 59
Table 6 Mental Illness by High School Diploma or Equivalent Earned and U.S. Born or
Caribbean Born......................................................................................................................................................... 62
Table 7 Mental Illness by College Degree Earned .................................................................................................. 67
Table 8 Mental Illness by College Degree Earned and U.S. Born or Caribbean Born ………………...…………….. 69
Table 9 Correlates of Mental Illness and Highest grade of school completed ......................................................... 74
Table 10 Mental Illness by Gender .......................................................................................................................... 75
Table 11 Mental Illness by Gender and U.S. Born or Caribbean Born .................................................................... 77
Table 12 Mental Illness by Employment .................................................................................................................. 80
Table 13 Mental Illness by employment and U.S. Born or Caribbean Born ............................................................ 81
Table 14 Correlates of Mental Illness and # of hours worked per week .................................................................. 84
Table 15 Correlates of Mental Illness and # of hours worked per week for Caribbean respondents....................... 85
Table 16 Correlates of # hours work for pay a week – U.S. born respondents ....................................................... 86
Table 17 Mental Illness by Mortgage on Home ....................................................................................................... 87
Table 18 Mental Illness by Mortgage on Home and U.S. Born vs. Caribbean Born ................................................ 88
Table 19 Mental Illness by Live in public housing .................................................................................................. 93
Table 20 Mental Illness by Pay low/no rent because of government assistance .................................................... 95
Table 21 Mental Illness by How much time received welfare before turned 18 ...................................................... 97
Table 22 Mental Illness by Received welfare/pub assistance since turning 18 ....................................................... 99
Table 23 ICD Hypomania (Lifetime) ...................................................................................................................... 102
Table 24 DSM-IV Panic Attack (Lifetime) .............................................................................................................. 103
Table 25 ICD Panic Attack (Lifetime....................................................................................................................... 104
Table 26 ICD Panic Disorder (12 month) .............................................................................................................. 105

viii
Table 27 DSM-IV Oppositional Defiant Disorder w/ hierarchy (LifeT..................................................................... 106
Table 28 DSM-IV Hypomania (Lifetime) ................................................................................................................ 107
Table 29 ICD Hypomania (12 month) .................................................................................................................... 107
Table 30 DSM-IV Hypomania (12 month................................................................................................................ 108
Table 31 DSM-IV Bi-Polar II (Lifetime) .................................................................................................................. 109
Table 32 DSM-IV Bi-polar II (12Mo) ...................................................................................................................... 109
Table 33 ICD Dysthymia w/ hierarchy (Lifetime) ................................................................................................... 110
Table 34 ICD Dysthymia with hierarchy (12 month) .............................................................................................. 111
Table 35 DSM-IV Panic Disorder (Lifetime) .......................................................................................................... 111
Table 36 ICD Panic Disorder (30 day) ................................................................................................................ 112
Table 37 DSM-IV Generalized Anxiety Disorder w/hierarchy (LifeT) .................................................................... 113
Table 38 DSM-IV Gen Anxiety Disorder w/hierarchy (12Mo) ................................................................................ 113
Table 39 ICD Conduct Disorder w/ hierarchy (12Mo) ............................................................................................ 114

1
CHAPTER 1
INTRODUCTION
The Problem Statement
The importance of race and ethnicity in mental health research continues to be of national interest
particularly due to the increasing diversity of American society and how culture contributes to differences in
behavior (Cohen, Berment and Magai 1997; Jackson, Torres, Caldwell, Neighbors, Nesse, Taylor, Trierweller and
Williams 2004; Neighbors, Caldwell, Williams, Neese, Taylor, Bullard, Torres and Jackson 2007). Culture is broadly
defined as a common heritage or set of beliefs, norms, and values (U.S.DHHS, 1999). More specifically, culture
can be defined as having fluidity that stems from traditional indigenous pasts which grows and changes in
response to experiences (Akinyela 1995). To recognize there are elements of one’s experiences that may produce
different realities does not negate the commonalities African people share. Essential to including race and ethnicity
in mental health research is to understand and acknowledge the cultural heterogeneity of Black people.
Oftentimes, medical research about Black people presents this group as culturally homogeneous. This may
result in misleading results given their heterogeneity. Ignoring the differences within this group potentially impacts
diagnosis and the care given to the members of the subgroups and investigating these differences should be
deemed priority if the primary concern is to administer the best care to the various groups (Bhugra 2004); Brent
and Callwood 1993; U.S.DHHS 2001; Govia 2012; Williams & Harris-Reed 1999). Compounding the importance of
this topic is the growing size of the Black population of Caribbean descent. The 2010 U.S. census reports Blacks
represent a sizable portion of the American population at approximately 13.6% totaling over 42 million persons
(Rastogi, Johnson, Hoeffel & Drewery 2011). Of these individuals, 3.5 million are of Caribbean descent (McCabe
2011).

2
Research has shown that inter-group differences among people of color are as likely to be significant as
they are between Blacks and Whites (Borrell, Lynch, Neighbors Burt and Gillespie 2002; Neighbors et al 2007;
Williams and Harris-Reid 1999). Blacks encompass many ethnic, class, gender, religious, sexuality, age and
nationality groups from all over the African Diaspora and on the African continent. To understand the impact of
these differences does in no way remove the commonalities of experience, struggle and origin African people
worldwide share. While researchers maintain a cultural similarity does exist among African people (Asante and
Asante 1985), we cannot negate the impact of other elements of their lives that may produce alternative realities as
it relates to mental health such as immigration, acculturation and assimilation (DHHS 2001).
Important and ever expanding groups in the U.S. are U.S. born Blacks of Caribbean descent and those born
in the Caribbean who migrated to the U.S. It is important to focus studies on these African descended groups
without contrasting them with other races so we can better understand the differences within the larger Black
population in the U.S.
While there is a plethora of mental health research that target samples of Blacks and Whites, there is little
research that attempts to look at within group differences of Blacks in the U.S. Of the existing research on within
group differences, many have been conducted in Great Britain and involve small samples (Bhui, Stanfield, Hull,
Priebe, Mole and Feder 2003; Harrison, Glazebrook, Brewin 1997; Sharpley, Hutchinson, McKensie, Murray 2001).
The few that have researched within group differences in mental health in the U.S. indicate differences between
African Americans and Caribbean Americans primarily in depression (Alegría, Chatterji, Wells, Cao, Chen,
Takeuchi, Jackson, & Meng, 2008; Lincoln, Chatters, Taylor, & Jackson, 2007; Miranda Siddique, Belin, and Kohn-
Wood 2005 and Williams, Gonzalez, Neighbors, Nesse, Abelson, Sweetman, & Jackson, 2007) Obsessive-
Compulsive Disorder (Himle , Muroff, Taylor, Baser, Abelson, Hanna, Abelson, Jackson, 2008); or substance use

3
(Gonzalez, Croghan, West, Williams, Nesse, Tarraf, Taylor, Hinton, Neighbors, & Jackson, 2008; Broman,
Neighbors, Delva, Torres, Jackson, 2008). Other types of mental illnesses have yet to be explored.
Another aspect of the lives of Blacks in America that has not been explored in depth is if the nativity and
generational status of the within groups for this population impacts rates of mental illnesses. Although sparse, two
studies illustrate differences in generational and nativity status. Both studies results have shown that first and
second generation Caribbean Blacks have lower rates of mental health than both third and fourth generation
Caribbean Blacks and U.S. born Blacks (Miranda Siddique, Belin, and Kohn-Wood 2005; Williams, Haile,
Gonzalez, Neighbors, Baser, and Jackson 2007). Researchers are recognizing the importance of this topic as a
recent article investigated the differences in ethnicity and nativity status among Blacks and mental health service
use (Doyle, Joe & Caldwell 2013).
Whereas Miranda et al (2005) and Williams et al (2007) have researched rates of Major Depressive Disorder
(MDD) and the impact of nativity and generational status among Caribbean and U.S. born Blacks, I seek to extend
this by investigating rates of DSM-IV Generalized Anxiety Disorder (GAD), DSM-IV Bi-polar II, ICD and DSM-IV
Hypomania with hierarchy, ICD Dysthymia w/ hierarchy, DSM-IV Oppositional Defiant Disorder with hierarchy, ICD
& DSM-IV Panic Attack, ICD & DSM-IV Panic Disorder (PD) and ICD Conduct Disorder with hierarchy among
Caribbean and U.S. born Blacks and the role of nativity and generational status. The study will also investigate if
rates of mental illnesses differ per country of origin, age of immigration and number of years living in the U.S. for
Caribbean Blacks.
The study will use a nationally sampled database called the National Survey of American Life (NSAL) to
determine if any differences exist and how the length of residency may be impacting these rates. This database
was collected with an emphasis on sampling Black participants who were born in the Caribbean and Blacks born in
the U.S. with and without Caribbean descent. The NSAL is one of three research projects conducted from 2001 to
2003 by the program for Research on Black Americans (PBRA), as part of the Research Center for Group

4
Dynamics. According to the researchers who collected the data, the Institute for Social Research at the University
of Michigan collected these data using methodological innovations to address three primary concerns: (a) ensuring
proportional representation among members of the target populations for sampling; (b) understanding similarities
and differences in the connotative meaning of various constructs across ethnic and racial groups, studying
efficiently the importance of familial contributions to mental disorders within; and (c) across racial and ethnic
groups. Another goal of NSAL was to examine mental health disorders in terms of social and economic contextual
stressors on prevalence rates relative to social and cultural issues that affect self-reports (Jackson, Neighbors,
Neese, Trierweiler and Torres 2004). The populations sampled were U.S. born Blacks with and without Caribbean
descent as well as Caribbean born Blacks and Whites (the White sample’s birth place was not distinguished) to
create the most comprehensive and detailed study of mental disorders and the mental health of Americans of
African descent ever compiled (Jackson et al 2004).
The Purpose of the Study
The purpose of this study was to explore the heterogeneity of Blacks relative to differences in manifestations
of mental illnesses between U.S. born Blacks with and without Caribbean descent and Caribbean born Black and
to contribute to the growing body of research for these diverse groups. Of primary concern was whether the nativity
and generational status is impacting rates of mental illnesses. Other variables such as gender, employment,
education, wealth, age of immigration, length of residency and country of origin were also explored.
Significance of the Study
The significance of this study lies in the ability to fill in the gaps and contribute to the mental health literature
as it relates to the heterogeneity of people of African descent living in the U.S. and rates of mental illnesses.
Research has revealed a few findings illustrating rates of MDD vary within the Black population based on nativity
and generational status in the U.S. and Great Britain (Williams et al 2007; Miranda et al 2005). Therefore,
5
investigating nativity and generational status as it relates to rates of other forms of mental illnesses also contribute
to the significance of the study.
Thus far, the vast majority of mental health research publications group people of African descent into one
category, Black. More often than not, these publications analyze mental health by measuring this group against
another heterogeneous group, Whites. While there is a need to investigate the heterogeneity of Whites, this study
seeks to focus on the Black population in the U.S.
It is only within the last decade that research began to address within group differences among Blacks
relative to mental health (Doyle, Joe & Caldwell 2013; Jackson et al 2004; Miranda et al 2005, Williams et al 2007).
Previously, research that did not factor in cultural heterogeneity may have resulted in findings that are not
applicable to the subgroups. The negative impact these findings may have on the diagnoses and treatment
modalities for people of African descent could be extensive and because the aim of the mental health community is
to diagnose and treat illness in a manner appropriate to the individual, research that illustrates the differences
between the subgroups will be essential to understanding appropriate diagnosis and treatment approaches.
Atdjian and Vega said it best
…the discourse on disparities is not an academic exercise but rather a matter of life and death…it is our
collective responsibility as a profession to address these disparities—it is our responsibility to our patients, to
our communities, and to the pursuit of social justice (2005).
The significance of the study can also be attributed to the ingenuity of a set of researchers who with the
foresight of considering the heterogeneity of Blacks in America, included large samples of Blacks from various
ethnicities in the NSAL database so research such as what is described here can be conducted. The NSAL
database includes a large nationally representative sample of Black participants who provided information on
mental health and ethnicity that will allow for investigating within group variation whereas most prior studies lacked
adequate sampling to conduct this type of analysis. This database also has the first nationally representative

6
sample of Caribbean Blacks which will allow identification of variation in mental health manifestations never before
identified on a national scale. This database provides a rare opportunity to investigate the heterogeneity among
people of African descent in the U.S.
Study Format
Chapter two of this study will review the history of immigration policy and how it affected the admission of
foreign born individuals, specifically Caribbean natives into the United States. The chapter will also address general
literature on the mental health of Blacks in the U.S and throughout the African Diaspora as well as literature on
specific mental illnesses and how rates were impacted by nativity or generational status in the U.S. Chapter three
of the study will provide the methodology used including specifics on the data set, the variables to be studied and
strategies for analyzing the data. I will identify gaps in the literature relative to the differences in manifestation of
mental illnesses by ethnic identity, nativity and generational status in the U.S. Chapter four of the study will include
the results while chapter five will provide a discussion of the results. Chapter 6 will provide a conclusion, address
limitations of the study and suggestions for future research endeavors.

7
CHAPTER 2
PATTERNS OF MENTAL ILLNESSES, NATIVITY AND GENERATIONAL STATUS FOR CARIBBEAN BORN BLACKS, BLACKS OF CARIBBEAN DESCENT AND U.S. BORN BLACKS
This chapter provides a review of the literature on Blacks in the U.S. and mental health. The section begins
with an overview of research involving Blacks and Whites. Immigration to the United States and specifically
immigration from the Caribbean to the United States is then addressed. A synopsis of mental health among
immigrants will be provided followed by patterns of mental illnesses for both Blacks born in the Diaspora,
specifically the Caribbean and Blacks born in the United States with and without Caribbean descent.
The U.S. Department of Health and Human Services (2001) used the National Comorbidity Survey (NCS)
data to determine if African Americans who live in various communities across the U.S. have similar rates of mental
illnesses to Whites even when controlled for income, education and other indices of social well-being however
because many African Americans live in high-need populations, their mental illnesses are evidenced in much
higher rates; they have less availability to healthcare professionals who are ethnically like them resulting in reduced
utilization of services; they have less access to mental health services and are less likely to receive evidence
based diagnosis and treatment.
Of the variables of mental illnesses researched, depression or Major Depressive Disorder (MDD) holds
prominence in mental health research. MDD is a debilitating psychiatric disorder affecting individuals in the United
States as the fourth leading cause of disability (Williams et al 2007). It is defined as a feeling of sadness and
dejection which is marked by a number of symptoms including trouble sleeping, concentrating, and acting
(Mirokowsy & Ross 1992). Researchers have extensively investigated various measures of mental illnesses but not
found consistent results for these two groups.

8
Some researchers have found the mental health of Blacks is just as good if not better than Whites (Steele
1978) with lower prevalence of affective disorders, substance abuse disorders and lifetime comorbidity (Kessler,
McGonagle, Zhao, Nelson, Hughes, Eshleman, Wittchen and Kendler 1994;) and others found minority status
alone does not account for depression rates (Mirowsky and Ross 1992). Some studies show Blacks have lower
lifetime rates of MDD and comparable or lower rates of 12-month rates as compared to non-Hispanic Whites
(Robins and Regier 1991; Blazer, Kessler, McGonagle and Swartz 1994; Kessler, Berglund, Demler, Jin, Koretz,
Merikangas, Rush, Walters and Wang 2003; Riolo, Nguyen, Greden and King 2005). George and Lynch (2003)
indicate that in studies which involve depressive disorder, African Americans exhibit no differences or lower levels
of risk of disorder than Whites, regardless of age. The latter part of 20th century brought the popularity of survey
research like the Epidemiologic Catchment Area (ECA) a major large scale epidemiology study of that indicated no
differences between Whites and African Americans in rates of schizophrenia when controlling for age, sex,
socioeconomic status (SES), and marital status (Adebimpe 1994).
There are Black-White differences in the way mental health is perceived. Blacks are more than twice as
likely as Whites to be relatively pessimistic about their health. There are also racial differences in assessments of
mental illnesses. Neighbors (1996) provided a review of literature indicating disparities in diagnoses based on
race. There is evidence based on one study that when no identifying information was given on the patient,
diagnosis was more accurate however, when African Americans were identified as such, they were given more
severe diagnosis regardless of the race of the psychiatrist. Additionally, another study found African Americans
were given a diagnosis of schizophrenia more often than other racial groups regardless of the race of the
psychiatrist.
More recent research yields varied results. Borowsky et al. (2000) found primary care physicians were less
likely to identify mental health issues specifically symptoms of major depressive disorder in African Americans than
9
White patients. In 2003, findings suggested there were no differences in the proportion of diagnosis between
Whites, African Americans (Crystal, Sambamoorthi, Walkup and Akincigil 2003).
There are also racial differences in how treatment is given. Several studies indicate treatment disparities are
evident related to race. In a study of individuals receiving Medicaid during 1989-1994, African Americans were less
likely to receive anti-depressant medication than White patients (Melfi, Croghan, Hanna and Robinson 2000). In
another study of low income Medicaid patients, researchers found African Americans were least likely to receive
drug treatment once diagnosed at 37.1% while Whites were treated at 22.4% (Strothers Rust, Minor, Fresh, Druss,
and David Satcher 2005). Other researchers found African Americans were less likely to receive adequate care,
medicine dosage or duration of treatment in relation to their White counterparts (Charbonneau, Rosen, Ash, Owen,
Kader, Iii, Hankin, Herz, Pugh, Kazis, Miller, Berlowitz 2003). Unutzer, Katon, and Callahan. (2003) found African
American patients were more likely to receive lower rates of care for depression than White patients. However,
other researchers did not find these inequitable practices. One study demonstrated no differences in prescriptions
of anti-depressant drugs based on race over a 20 month period (Rollman, Hanusa, Belnap, Gardner, Cooper, and
Schulberg 2002). Furthermore, Crystal et al. (2003) found African Americans and Whites were just as likely to
receive treatment once diagnosed.
There are a number of factors that could explain why the differences in prevalence rates, diagnosis and
treatment by race occur. Racism, discrimination and institutional inequality has resulted in equitable access to
resources and opportunities which has caused poverty among many Blacks in the U.S. Myers (1982) asserts
poverty can generate illness as a result of the excessive and continuous pressures the person faces. Brown (2003)
highlights the importance of understanding possible physical and mental health implications due to structural
obstacles. He argues these obstacles are devised to exclude certain groups of individuals and it is imperative to
understand this because of continued differential treatment between people of color and the dominant group in

10
society. He analyzes the situation by utilizing a critical race theoretical paradigm. Critical Race theorists posit laws
are written in such a way that institutionalized racism exists without the actual wording alluding to racial differences
thus giving the illusion of colorblindness when in fact disparities with how Blacks are treated in the legal system do
exist and may contribute to the overall health and mental health of Blacks.
Additionally, Ruiz posits racism, discrimination and stereotyping function such that internalization of the
resulting values leads to decreased self-esteem, a lack of self-respect and self-rejection (1990). Bruce Hare (1988)
asserts Blacks are socialized to believe negative representations of themselves and of those in the group who don’t
believe the images deem themselves the exception to the stereotypical representations. Williams, Yu and Jackson
(1997) concluded the measure of everyday discrimination is a more consistent predictor of health status than
measures of major experiences with discrimination for Blacks. Furthermore, the following study highlights how a
lack of control over experience directly affecting the individual as a result of discrimination can affect aspects of
mental health. In 1989, Hughes and Demo conducted research on a sample of African Americans evaluating levels
of self-efficacy. The findings suggest, African Americans have low personal efficacy which was more likely to be
associated with one’s position in the macro-order of institutional inequality. These findings point to the lack of
opportunity robbing Blacks of efficacious experiences that could potentially build personal efficacy. That is, feelings
of efficacy are developed through experiences which allow one to demonstrate efficaciousness thus building
confidence in his or her ability to exercise control over events.
Social class variables have been an interest of researchers for a few decades now but the results have been
less than consistent. Ruiz (1990) posits socioeconomic status is closely related to the mental health of Blacks and
because the socioeconomic status of many Blacks in this country is so poor, it is likely that the general well-being
and mental well-being will also be poor. Poussaint (1990) states poverty doesn’t result in poor mental health but is
a major contributing factor and unemployment rates are the most critical indicators of U.S. economic influence of

11
the mental health of Blacks. Myers (1982) claims poverty is an illness producing state as a result of constant
pressures from a lack of resources which mainly affects people of color.
Socioeconomic status has been shown to affect rates of mental illnesses. Williams et al (1992) found most
racial differences in mental illnesses can be accounted for by factors of socioeconomic status. Indeed, some
researchers have found Blacks with low socioeconomic status have higher rates of distress (Kessler & Neighbors
1986, Ulbrich, Warheit & Zimmerman 1989). These researchers acknowledge there are multiplicative effects of
being poor and Black which results in higher rates of distress. George & Lynch (2003) conducted a literature review
finding studies indicate socioeconomic status does play a role in the manifestation of depression. Some studies
report generally high levels of depressive symptoms at low levels of socioeconomic status with Blacks having
higher levels than Whites while other studies indicate no difference.
Other research studies indicate Whites are more negatively affected by low socioeconomic status than
Blacks. One study found Whites were more negatively affected by low socioeconomic status. Williams, Takeuchi
and Adair found Whites with low socioeconomic status had higher rates of psychiatric illness than Blacks with low
socioeconomic status (1992). Yu and Williams (1999) used the ECA data to determine those in the low
socioeconomic category were several times more likely to meet the criteria for depressive symptoms. However, as
cited in their article, depression is unrelated to socioeconomic status for African Americans but inversely related for
Whites. Riolo et al. (2005) found those living in poverty had 1.5 times the prevalence of major depressive disorder
but the results were also only significant for poverty with White participants in the study.
However, several studies indicate when the various socioeconomic status variables are controlled for there
are no differences in stress levels by race (Warheit, Holzer, Schwab 1973; Warheit, Holzer, Arey 1975). Kessler
and Neighbors (1986) found at low levels of socioeconomic status, African Americans had higher rates of distress
than Whites but this difference disappeared as the level of socioeconomic status increased. Though there are a

12
multitude of findings, a pattern does emerge. It is evident in the mental health literature; Blacks don’t fare as well as
their White counterparts due to inequitable situations and reduced access to resources which result from racism
and discrimination. However, the research also holds a great deal of promise in that when socioeconomic status is
controlled for, the disparities disappear.
While the continued assessment of race in health disparities remains an important factor, ever increasing
attention needs to be paid to the subgroups of racial categories as ethnicity is a neglected dimension of the
heterogeneity of the Black population (Williams and Jackson 2000). The 2010 U.S. census reports Blacks
represent a sizable portion of the American population at approximately 13.6% with Caribbean Blacks constituting
a sizable portion of the Black population in the U.S. at 10-15% (Neighbors et al 2007). In April 2002, the Population
Reference Bureau’s publication Population Today stated that immigration is the cause of increased heterogeneity
among Blacks and indicated an increase of 1.3% to 7.8% of foreign born Blacks between the years of 1970 to 2000
(2002). These changes suggest that as Blacks increase in population, they are also increasing in cultural
differences and nationalities (Miranda et al 2005).
Immigration
Central to understanding these complexities is looking at the process immigrants of their journey to the U.S.
The following section focuses on immigration policy and how those policies have impacted the influx of foreign-born
individuals in the United States. According to the Immigration Policy in the U.S. document requested by the
Congressional Budget Office in 2002, the history of immigration law has changed multiple times which has greatly
affected who will be admitted in the U.S. and when they were allowed to come. Immigration policy as initiated by
the Congress of the U. S. began in 1790, just fourteen years after their independence from Britain. It was in this
year that Congress created a formal process by which those not born in the U.S. could come here and become
citizens.

13
A look at Caribbean immigration may be necessary to understand the presence and importance of
Caribbean’s in the U.S. According to James (ND) there are 4 phases of Caribbean Migration that should be
recognized. The first is prior to 1900, the second is 1900 to the 1930’s, the third is 1930 to 1965 and the last is
1965 to the present. During the 18th century, the majority of enslaved Africans in the Northern states were born in
the Caribbean or of Caribbean descent but James also draws attention to the free Black population who at the time
consisted of many Caribbean and Caribbean descended people. The second phase saw exponential increases in
Black immigration with 412 in 1899 and the numbers rose each year with an astounding 12,234 in 1924. As a result
of the increased immigration, the foreign-born Black population increased from 20,000 in 1890 to about 100,000 in
1930. The economic depression in the 1930’s had a major effect with more Caribbean people leaving the United
States than entering it. During World War II, immigration picked back up as Caribbean’s took advantage of the
upward turn in the American economy. The McCaaran-Walter Act of 1952 did hinder many new immigrants from
coming to the U.S. but thousands of family members to those already here were able to immigrate. With Lyndon
Johnson taking on the presidency in 1964, a number of big changes followed like the Civil Rights Act of 1964 and
the Voting Rights Act of 1965. This was a pivotal time for Caribbean’s because many of the natives of British ruled
colonies were still migrating to Britain until they closed their doors to them in 1962. The new immigration laws in the
U.S. coupled with the rejection from Britain resulted in a stream of new immigrants from the Caribbean. The
numbers from the Caribbean jumped from 120,000 in the 1950’s to 470,000 in the 1960’s. Following the Act of
1965, over one million West Indians have been granted legal immigrant status, with over 600,000 of these arriving
between 1981 and 1996 alone (Crowder & Tedrow, 2001).
In 2004, the largest share of immigrant admission came from North America including the Caribbean but the
numbers of Caribbean immigrant from 1997 to 2004 has decreased substantially. The actual numbers admitted
and their corresponding years are as follows: 1,009-1997, 979-1998, 1,232-1999, 968-2000, 556-2001, 482-2002,
266-2003 and n/a-2004 (Caldera and Piper-Bauch 2006).

14
Why Move to the United States?
Emigration has always been a vital component of the Caribbean experience for a number of reasons.
Journeys all over the globe have been undertaken in a search for a better life for themselves and their children.
The United States has been a favorite destination due to its immigration policies and promising economy which
provides opportunities for an improved quality of life for individuals whose native lands holds limited promise
(Mahoney 2004). Another issue in Caribbean nations is the population growth.
The growth rates in Caribbean nations are very high, on average doubling every 21 years and their fledgling
economies cannot provide employment and in some cases, food resources for the rising population rates.
Therefore, they seek employment elsewhere, often in the United States primarily because of its close proximity but
also cultural and familial ties (Bouvier and Simcox 1986). In 1995, Simcox noted the high rates at which citizens of
Caribbean nations were coming to the United States. These nations have a population density that is 5 times that
of the United States and are growing by 1.8 percent every year. Of that growth, 1/6 of them move to the United
States every year. Nearly 10 percent of the immigrants coming to the U.S. each year come from a region that
comprises six-one thousandths of the population on earth.
Immigrant Mental Health
According to Lum & Vandereaa (2010) the quality of data regarding racial and ethnic groups and immigrants
has been insufficient to research large scale health disparities. This is largely based on the limited number of
participants in the studies, studies targeting only specified ethnic groups and studies conducted with participants in
small geographical areas (Ghaffarian 1987; Mui 1996). The results of some of these limited studies present an
overall picture that immigrant mental health is adversely impacted by the stress of immigrating and subsequent
social isolation (Lum & Vandereaa 2010). Although some research indicates that despite many immigrants
experiencing lower levels of socio-economic status that those born in the U.S., experience lower rates of mental
15
and substance abuse disorders (Takeuchi et al 2007). Acculturation however, has been shown to have contrasting
effects depending on the population in question. Acculturation appears to impact people differently given the
circumstances around why the individual immigrates. For instance, refugees have experienced enhanced mental
health when they have higher levels of acculturation (Nicassio 1985; Nicassio, Solomon, Guest, & McCullough
1986) whereas; non-refugee immigrants experience adverse impacts on mental health due to acculturation (Lang,
Munoz, Bernal & Sorenson 1982; Masten, Penland & Nayani 1994; Neff & Hoppe 1993). However, some research
indicated a positive association between acculturation and mental health for non-refugee immigrant populations
(Burnam, Hough, Escobar, Karno, Timbers, Telles & Locke 1987; Lum & Vandereaa 2010; Nguyen & Peterson
1993). According to the U.S. Census Bureau (2013) the number of immigrants will surpass the natural increases
(U.S. births minus deaths) in the U.S. population for the first time in almost two centuries. Given this, there will an
increased need to study these populations in detail. The following section will begin exploring the within group
differences for Blacks born the U.S. with and without Caribbean ancestry as well as Caribbean born Blacks.
Cultural Heterogeneity Among Blacks
Oftentimes, empirical research, particularly of concern in this study is mental health research that includes
samples of Blacks, represent this group as homogeneous which is far from accurate. While there are many
experiential commonalities as part of the Black experience both in the United States and throughout the African
diaspora as a result of enslavement and colonization, the ethnic variation within Black people adds a level of
differences that cannot be ignored. An outcome of research often ignoring these differences could be findings that
are misleading because what is applicable for one portion of this population may not apply to another. In fact,
research has shown people of color are likely to differ as much within their respective groups as they differ from
Whites (Borrell et al 2002). Ignoring the differences within any group impacts diagnoses and treatment plans given
to the members of the subgroups and investigating these differences should be deemed priority if the primary
concern is to administer the best care to all individuals in the mental health care system.
16
Presently, little information on mental health among immigrant Black Americans is available (Miranda et al
2005; Takeuchi, Algeria, Jackson and Williams 2007). However, a few researchers who recognized there may be
within-group differences of Blacks have conducted studies primarily in the United Kingdom where cultural
differences account for some of the inequalities in diagnosis and treatment of the Caribbean population residing
there (McLean, Campbell & Cornish 2003). Until recently, no large scale research has been conducted in the U.S.
prior to the publication of a series of articles that delineates subgroups within the U.S. Black population (Neighbors,
Caldwell, Williams, Nesse, Taylor, Bullard, Torres and Jackson 2007). The lack of research is due in part to limited
data collection that differentiates inter-group differences in terms of ethnicity and nativity status for people of
African descent. However, in 2004, a new database emerged which sampled a large number of Caribbean born
and U.S. born Blacks allowing for new research that sheds light on this important topic. Below is a review of
literature that highlights the major mental health findings for Caribbean Blacks and some studies that take into
account inter-group differences in mental health conducted both in the United Kingdom and more recently in the
U.S. through the use of the NSAL database. The studies will presented first by overall rates and then broken down
by various disorders.
Overall Rates of Psychiatric Disorder
Although little research has been conducted on Caribbean Blacks, their immigration status became a focus
of several medical researchers. It was assumed that the immigration process was difficult and therefore resulted in
mental health issues for this portion of the population (Fabrega 1989; Locke, Kramer and Pasamanick 1960). This
framework derived from the stress process model that posits repeated and prolonged exposure to stress results in
mental illnesses (Pearlin, Lieberman, Menaghan & Mullan 1981; Pearlin 1999). Since then, studies have not
shared consistent findings. In fact, more recent studies indicate immigrant populations may have lower rates of
mental illnesses than their U.S. born counterparts (Vega, Kolody, Aguilar-Gaxiola, Alderete, Catalano and
Caraveo-Anduaga 1998; Takeuchi, Chung, Lin, Kurasaki, Chun & Sue 1998).

17
In 2005, a U.S. study found in relation to nativity status, U.S. born Caribbean Blacks had higher rates of
psychiatric disorder than Caribbean born Blacks which is consistent with prior research indicating longer residency
in the U.S. is explained as a greater period of time exposed to minority status that is positively associated with
increased risks for mental illnesses (Miranda et al 2005). An even more recent U.S. study determining the risk for
mental disorders of Caribbean Blacks by ethnic origin, nativity status, duration of residence in the U.S., age at
migration and generational status focused on 12-month rates of psychiatric disorders with Caribbean men
experiencing higher rates for psychiatric disorders compared to Black American men (Williams et al 2007). The
study found the reverse was true with Caribbean women having lower rates of psychiatric disorder than Black
American women. Risks for mental health disorders not only varied by ethnic origin but also by immigration history
and generation status within the Caribbean sample. The study found differences in risk for generation status with
first-generation Caribbean Blacks experiencing lower rates of psychiatric disorder than second or third-generation
Caribbean Blacks. Third generation Blacks were experiencing markedly increased rates of psychiatric disorder in
comparison to first-generation Caribbean Blacks. So overall mental health risk profiles show 1st and 2nd generation
Caribbean Blacks are experiencing less mental health issues than 3rd and 4th generation Caribbean Blacks. No
explanations were provided for the gender differences or the generational variances in rates of mental illnesses
while the nativity and acculturation differences were accounted for by prior research. One limitation is this study did
not analyze the disorders individually, rather the researchers chose to group the disorders as follows; mood
disorders (major depressive disorder, dysthymia), anxiety disorders (panic disorder, agoraphobia, social phobia,
generalized anxiety disorder, post-traumatic stress disorder), substance disorders (alcohol abuse, alcohol
dependence, drug abuse, drug dependence). Additional studies looking at each disorder may find variations in the
findings thus further investigation is necessary.
All of the aforementioned findings are baffling to researchers because their primary way of explaining
disorders as it relates to stress is that increased stress should bring with it additional physical and psychological

18
issues (Aneshensel 1999; Pearlin 1999; and Haines and Hulbert 1992). Specifically, immigrants may have had
issues increasing wealth primarily through hardships associated with finding work in safe environments in addition
to having smaller emotional support networks (Takeuchi et al 2007). Following in line with this theory, the stress of
the immigration process in addition to the issues mentioned above, should have generated higher rates of mental
illnesses for the 1st and 2nd generation immigrants but this group seemingly has better rates of mental illnesses that
both the 3rd and 4th generation Caribbean Blacks and the U.S. born Blacks with no Caribbean ancestry. Further
investigations into literature on the two major illnesses researchers have focused on, depression and
schizophrenia, indicate mixed findings.
Depression/Alcohol Related Depression
Depression is playing a large role in the lives of those who live in America. In 1990, depressive disorders
were the leading cause of disabilities that are not fatal. When considering the impact of depressive disorders
measured by financial cost, mortality, or morbidity, these disorders are the fourth leading cause of disease
burdening the U.S. population (Ustun, Ayuso-Mateos, Chatterji, Mathers and Murray, 2004). Depression and
understanding its role in the lives of Caribbean Blacks has been an area of interest for researchers as indicated by
the number of published reports. In 1997, a study of New York City psychiatric outpatients found differences in the
symptoms patients were most likely to report. Blacks of non-Caribbean descent were more likely to report a history
of alcohol abuse and delusions while Blacks who are Caribbean born were more likely to report symptoms of
depression and aggression (Cohen, Berment and Magai 1997). Other researchers also found higher levels of
depressive symptoms in Caribbean Blacks than in African American Blacks. A more recent study on depression
found slightly higher rates of lifetime rates of Major Depressive Disorder (MDD) in Caribbean Blacks, 12.9% versus
African Americans 10.4%. However, similar 12 month MDD rates were found between the two groups, 56.0% and
56.5% respectively (Williams, Gonzalez, Neighbors, Nesse, Abelson, Sweetman and Jackson 2007). Additionally, a

19
national study illustrated US Blacks are engaging in heavier drinking patterns than English-speaking Caribbean
Blacks (Dawson 1998).
Nativity/Generational Differences
In 2005, an article interested in analyzing U.S., Caribbean and African born Black females for differences in
probable depression found those foreign born were less likely to report probable depression and that the numbers
of years living in the U.S. had a positive relationship with probable depression. The authors theorized Black women
who grew up in the U.S. may be prone to more chronic stressors but did not study risk or protective factors in their
research. The study also analyzed rates of depression after controlling for demographic differences such as age,
marital status education and housing, indicating poor U.S. born Blacks are 2.49 times more likely to experience
probable depression than poor Caribbean born Blacks. Additionally, the study determined differences between the
groups relative to the length of time residing in the U.S. Controlling for the same demographics mentioned above,
the study found an additional 10 years living in the U.S. increased rates of reporting probable depression by 1.35
times, a significant finding (Miranda et al 2005). These researchers theorized that the differences in depression
may be as a result of differential exposure to protective and risk factors but the study did not include analyses of
these factors. Furthermore, the results of the study would need to be duplicated to determine generalizability
because the study sample only included 273 Caribbean born Blacks.
Williams et al (2007) produced a study that supported the findings of Miranda et al (2004). Using the
National Survey of American Life Data, these researchers found third generation Caribbean Blacks, both men and
women had the highest prevalence of disorders than 1st and 2nd generation Caribbean Blacks (Williams et al
(2007)). However, because the illnesses were not studied individually, further investigation is necessary.
As mentioned previously, there are differing rates of mental illnesses by generation as noted by a number of
researchers (Miranda et al 2005; Vega, Kolody, Aguilar-Gaxiola, Alderete, Catalano and Caraveo-Anduaga 1998;

20
Takeuchi, Chung, Lin, Kurasaki, Chun & Sue 1998); Williams, Gonzalez, Neighbors, Nesse, Abelson, Sweetman
and Jackson 2007). However, analysis of a variety of disorders has not been completed to determine if the results
found in these studies are generalizable to other illnesses.
Schizophrenia
Another mental illness of interest to researchers is schizophrenia. Researchers Bhugra and Bhui (2001)
have identified some major issues with studying rates of schizophrenia including the lack of acknowledgement of
the heterogeneity among ethnic groups and the lack of applicability of the western conception of schizophrenia.
Prior to and since then, the identification of these studies have indicated higher rates of schizophrenia for
Caribbean Blacks.
Studies in the United Kingdom indicate that rates of schizophrenia have been consistently high for
Caribbean Blacks. After large scale migration to the United Kingdom in the 1950’s and 1960’s research was
conducted in 1965 with results showing higher rates of schizophrenia in Caribbean Blacks than Whites (Sharpley,
Hutchinson, McKensie, and Murray 2001). Another study completed in the 1980’s concluded the same finding as
above (Harrison, Owens, Holton, Nielson, and Boot 1988). Several other studies conducted all over the UK indicate
consistently elevated rates of schizophrenia for Caribbean Blacks as compared to Whites in Nottingham, UK
(Harrison, Owens, Holton, Nielson, and Boot 1988; Harrison, Glazebrook, Brewin 1997), Camberwell, South
London (Selten, Slaets, and Khan 1997) and the Netherlands (Van Os, Castle, Takei, Der, and Murray 1996).
However, it should be noted that many of the studies conducted prior to the 1980’s produced unreliable results due
to under-enumeration. Furthermore, one study has shown that Caribbean Blacks may not be the only group with
higher incidences of schizophrenia as indicated in a study where multiple minority ethnic groups were deemed
vulnerable to the disorder in comparison to Whites (King, Coker, Leavey, Hoare, and Johnson-Sabine 1994).
Furthermore, researchers are beginning to question the meaning of manifestations of schizophrenia as it relates to

21
culture in the Black Caribbean populations. Hallucinations are one symptom that is not recognized in the Western
world as a part of normal living however, evidence suggests hallucinations are not considered bizarre for
Caribbean people and they are therefore more apt to report these behaviors than Western populations (Sharpley,
et al 2001). Versola-Russo identifies non-White groups have cultural approaches to disease that are not
recognized by Western medicine (2006) which may also account for differences in how symptoms of schizophrenia
are viewed. Furthermore, Sharav acknowledges the concept of schizophrenia is one created in the White medical
community and has not been determined to be valid among Caribbean Blacks (2000). In fact, Caribbean Blacks
were more likely to attribute the symptoms associated with schizophrenia to supernatural causes (McCabe and
Priebe 2004).
Nativity/Generational Differences
One study which differentiated generational status produced results indicating higher rates of schizophrenia in both
first and second generation Caribbean immigrants when compared to Whites (Bhugra, Leff, Mallet, Der, Corridan,
and Rudge 1997). However sample sizes were small with 38 Whites, 38 African-Caribbeans and 24 Asians.
Another study found second generation British born Caribbean Blacks had higher rates of schizophrenia than those
born in the Caribbean (Harrison, Owens, Holton, Nielson, and Boot 1988).
There are also several other research projects conducted with samples of Caribbean Blacks. One took place
in the Netherlands where Caribbean Blacks versus the native Dutch population were investigated for rates of
schizophrenia. Results showed 3-4 times higher rates for Caribbean Blacks than the native Dutch population
(Selten, Slaets and Kahn 1997). This was followed by studies of Caribbean Blacks and schizophrenia in their native
countries of Barbados, Jamaica and Trinidad respectively (Mahy, Mallet, Leff, and Bhugra 1999; Hickling and
Rodgers-Johnson 1995; Bhugra, Hilwig, Hossein, Marcaeu, Neehall, Leff, Mallett and Der 1996). The results of all
of these studies indicate much higher rates of schizophrenia in the populations who are no longer living in their
native countries than those still living in their country of origin.

22
Another study indicated significant findings for second generation Caribbean Immigrants. This study illustrated
Whites and first generation Caribbean Blacks had similar levels of risk for schizophrenia but the second generation
Caribbean Blacks had seven times more risk in developing schizophrenia than Whites. The researchers posit
strong environmental factors are acting on this population however, their research does not indicate the specific
kinds of environmental factors that may be playing a role (Hutchinson et al 1996). Whether we would see
differences within Black populations among various illnesses such as this study is attempting to do remains to be
seen.
The Relevance of Wealth and Education to Mental Health
Unemployment has deleterious effects on the mental health of Blacks (Poussaint 1990). In fact, Poussaint
(1990) states poverty doesn’t directly result in poor mental health but is a major contributing factor and
unemployment rates are the most critical indicators of U.S. economic influence of the mental health of Blacks.
Myers (1982) claims poverty is an illness producing state as a result of constant pressures from a lack of resources
which mainly affects people of color. Socioeconomic status has been shown to affect rates of mental illnesses.
Williams et al (1992) found most racial differences in mental illnesses can be accounted for by factors of
socioeconomic status. Indeed, some researchers have found Blacks with low socioeconomic status have higher
rates of distress (Kessler & Neighbors 1986, Ulbrich, Warheit & Zimmerman 1989). These researchers
acknowledge there are multiplicative effects of being poor and Black which results in higher rates of distress.
George & Lynch (2003) conducted a literature review finding studies indicate socioeconomic status does play a
role in the manifestation of depression. Rates of employment for Caribbean Blacks may be impacted by factors
such as stereotyping by those who determine employment opportunities that they are different and maintain a
different work ethic that produce a more advantageous situation for this group over U.S. born Blacks.
According to Lewis Gordon (2007) some sociological texts portray Caribbean communities as a "model
minority," which has created friction with the non-Caribbean blacks who preceded them in the United States (Govia

23
2012). Some Caribbean blacks agree and see themselves as harder working than U.S. born Black populations.
They believe this mentality has thus enabled them to take advantage of what the U.S. has to offer. Caribbean
Blacks have also been referred to as the "Black success story" due to the large number of individuals who come to
the United States and realize the American dream of upward mobility by taking advantage of what the U.S, have to
offer that their native countries do not. Another explanation for the success of Caribbean Blacks is selectivity of
migration. This phrase indicates that those who migrate from the Caribbean are more talented and determined to
succeed (Model 2008). Regardless of the explanation, the resulting differences in social mobility between U.S. born
Blacks and Caribbean Blacks have been used to draw comparisons and reinforce stereotypes about foreign-born
versus U.S. born blacks (McAdoo, Younge & Getahun 2007; Govia 2012).
According to McAdoo et al (2007), Caribbean immigrant families have been historically characterized by
higher than average educational and financial resources which allow them to migrate abroad. First-generation
Caribbean immigrants differentiate themselves by presenting themselves as immigrants first and feel that this
immigrant status may protect them from the negative stereotypes associated with being a Black American,
although this attitude varies across social classes (Portes and Zhou 1993; Waters and Eschbach 1995). A study by
Waters (1999) demonstrated a link between a strong Caribbean identity and economically disadvantaged
immigrants. Waters found that a strong Caribbean identity was major component missing from economically
disadvantaged immigrant youth. She indicated the reasons behind these findings may be guided by the forces of
daily life in the American ghetto which repress the Caribbean identity. Researchers assert that for these second-
generation immigrants, they may be subject to the same levels of racism and discrimination as native African
Americans because of the salience of race in the United States (McAdoo et al. 2007). Some Caribbean immigrants
and their children have demonstrated attempts to avoid racism directed toward the African American community by
emphasizing ethnic over racial identity (Lorick-Wilmot 2010). Distinctive cultural traits and continued ties to their
homeland, for instance, have been used to emphasize differences from Black Americans. Some Caribbean

24
immigrants have felt the need to internalize positive stereotypes attributed to individuals from the Caribbean and
reject stereotypes of U.S. born Blacks such as laziness and being untrustworthy in order to become successful
(Lorick-Wilmot 2010). Thomas Sowell (1978) suggests that Caribbean immigrants’ view of work ethic operates in
favor of the newer black groups. Mary Waters (1999) reports that Caribbean immigrants tend to agree with this
thesis and that they often seek to distance themselves from an African American identity to take advantage of
whites perception of them as hardworking; however, she also finds that employers favor Immigrant Caribbean
workers, in part because they are perceived to be more compliant and more willing to accept inferior wages and
working conditions.
Without providing much in the way of explanations, John Logan (2007) provides statistics highlighting
differences between Caribbean and U.S. born Blacks as it relates to income, home ownership, unemployment,
poverty and education. Logan begins by acknowledging that the social and economic profile of Caribbean Blacks is
above that of U. S. born Blacks and even better than Hispanics. U.S. born Blacks have both lower educational
attainment and median household income while experiencing higher unemployment and impoverishment than
Caribbean Blacks. Caribbean Blacks generally compare favorably to the U.S. Hispanic population, while U.S. born
Blacks often fare worse.
According to John Logan (2007) Caribbean Blacks median incomes average $43,000 annually while U.S.
born Blacks average $30,000. Caribbean born Blacks experience unemployment at 9.4% while U.S. born Blacks
experience unemployment at 12.5%. The percentage of Caribbean Blacks that are living below poverty is 17.8 but
is almost double that for U.S. born Blacks at 32.8. Home ownership is an exception where the average
neighborhood U.S. born Blacks reside in, 53.1% of individuals own their own home. The average for Caribbean
Blacks is 49.8%. These differences can be attributed to two things: generations in the U.S. and large Caribbean
populations in New York. Home ownership for U.S. born Blacks can be attributed to the number of generations
having lived here versus the number of generations for Caribbean Blacks. Also, New York has been the place of

25
interest for relocation from their respective Caribbean nations since Caribbean Blacks began migrating to the
United States.
Kasinitiz (1993) posits the attraction of New York is due to the preceding groups of Caribbean immigrants
that have established welcoming accommodations, institutions and services for new arrivals. It is well known that
in the United States, as in other modern societies, education is the principal gateway to socioeconomic attainment
(Hirschman & Lee 2005). America's sluggish economy, a decreasing market for unskilled labor, and inadequate
educational preparation in many Black communities are multiplicative aspects that make Blacks in America
vulnerable to unemployment (Poussaint 1990). Research indicates that among Caribbean immigrants, education
does mitigate some of the race/immigrant statuses but it functions in this capacity more so for women than men
(Heron 2001; Chevalier and Feinstein 2006).
Researchers, Chevalier and Feinstein (2006) explain the potential reasons why education may have an
effect on health. Education could directly impact health outcomes by making information easier to process resulting
in more health conscious individuals and by improving the efficiency of treatment. The efficiency of treatment can
happen in two ways, by reducing the time before help is sought or by aiding the individual in following prescribed
therapy more accurately. This is in addition to the effect of education on health indirectly through income,
employment, working conditions or family relations.
My Study
Whereas Miranda et al and Williams et al have researched rates of Major Depressive Disorder (MDD) and
the impact of nativity and generational status among Caribbean and U.S. born Blacks, I seek to extend this by
investigating rates of DSM-IV Generalized Anxiety Disorder (GAD), DSM-IV Bi-polar II, ICD and DSM-IV
Hypomania with hierarchy, ICD Dysthymia w/ hierarchy, DSM-IV Oppositional Defiant Disorder with hierarchy, ICD
& DSM-IV Panic Attack, ICD & DSM-IV Panic Disorder (PD) and ICD Conduct Disorder with hierarchy among
Caribbean and U.S. born Blacks and the role of nativity and generational status. Additional demographic variables

26
will also be analyzed to provide greater detail in explaining what may be impacting the rates of mental illnesses.
The generalizability of the findings of my study are greatly increased due to the sample size differences. Miranda et
al (2005) included in total, 9,151 black women 7,965 of which were born in the U. S. and 273 were born in the
Caribbean. My study will include 3,570 African Americans and 1,621 Caribbean Blacks.

27
CHAPTER 3
METHODOLOGY
This chapter will address the methodology this study used beginning with the theoretical framework,
hypotheses and the data set. Next, the dependent, independent and control variables addressed in the study will
be discussed. The analytic strategy for the data analysis will follow.
Theoretical Framework
Deculturation or the loss of one’s ethnic group cultural traditions and knowledge has been known to have
deleterious effects such as illicit drug use (Berry & Kim 1987). If one is losing aspects of their culture, it is likely they
are replacing it with another (del Pilar & Udasco 2004). This process is referred to as acculturation and requires an
individual or group to adopt and adapt to the culture, traditions and worldview of another group (Marsella &
Yamada 2000). There are several models of acculturation present in existing literature. The first model refers to
individuals who can successfully acculturate into the dominate culture if the economic opportunities are present to
actualize the culture and lifestyle of the dominate culture. Those who do not have these opportunities may
experience deleterious effects of acculturation (Graves, 1967). Limited economic opportunities to fully integrate into
the dominate culture could result in deviance including mental illness but researchers have found the maintenance
of traditional culture results in better psychological adjustments. This is a bicultural model whereby the individual
functions in both cultures and is assumed to experience less psychological distress than those who have fully
assimilated or those who are unassimilated (Buriel, Calzada, & Vasquez, 1982). The Acculturative Stress Model is
posited by Gilbert & Cervantes,(1986) and Holck, Warren, Smith, & Rochat,(1984) whereby greater distress is
found among those who are highly acculturated than those who are not. There is also the simple acculturation
model whereby an immigrant slows acclimates to the dominate culture in a relatively stress free manner as
individuals become more like the dominant culture (Gilbert & Cervantes 1986).

28
More recently, Marsella and Yamada (2000) argue the pressures of acculturation may leave the
acculturating individual feeling as if their culture, traditions and worldview no longer have value, a process Cuellar
(2000) claims can precipitate maladaptive reactions of mental health that are significant. The Immigrant Paradigm
of Acculturation suggests the impact of acculturation occurs in first and second generation immigrants and while
third and fourth generations still experience acculturative effects, they are also influencing the culture they are
adopting and adapting to (Cuellar 2000). However, there are studies indicating findings that do not support this time
frame of acculturation effects. In fact, some research demonstrates that changes can be seen within the first
generation living in the U.S. For instance, Mexican immigrant populations have half the lifetime prevalence rates
than the rates reported for the U.S. population. Furthermore, these researchers found the longer one lived in the
U.S. the greater the prevalence of mental disorders with short-term immigrants (those living in the U.S. less than 13
years) experiencing nearly half the lifetime prevalence rates to long-term immigrants (those living in the U.S. more
than 13 years (Vega, Kolody, Aguilar-Gaxiola, Aldrete, Catalano & Caraveo-Anduaga 1998). In fact, when
investigating, long-term immigrants, short-term immigrants and native-born Mexican populations, they found
prevalence rates increased with increased acculturation to U.S. culture and the longer one lived in the U.S., the
higher prevalence rates were for depression, all affective disorders, and all psychiatric disorders (Vega et al 1998).
A decade later, researchers are supporting these findings with studies demonstrating higher rates of MDD among
Caribbean descendants who have lived in the U.S. for third and fourth generations versus first and second
generation immigrant populations (Miranda et al 2005; Williams et al 2007). It has been argued that mental
illnesses can result when Blacks attempt to construct their reality in a social reality that is foreign to them (Akbar
2003).
Hypothesis
Based on the limited research on within group analysis of mental illnesses among Blacks, the following
hypotheses are being proposed considering the variables available in the study.

29
Is there a difference in rates of mental illnesses between U.S. born Blacks and Blacks born in the Caribbean across various mental illnesses? Hypothesis 1: Caribbean born Blacks will have lower rates of mental illnesses.
Is there an association between the length of residency in the U.S. and rates of mental illnesses? Hypothesis 2: Rates of mental illnesses will increase the longer one resides in the U.S. Is there an association between the generational status of Caribbean Blacks born in the U.S. and rates of mental illnesses?
Hypothesis 3: Caribbean Blacks who are 1st generation in the U.S. will have lower rates of mental illnesses than or 2nd generation Caribbean Blacks.
Is there an association between where Blacks are born and rates of mental illnesses? Hypothesis 4: Caribbean Blacks born in Anglophone countries will have lower rates of mental illnesses.
Is there an association between educational attainment and rates of mental illnesses? Hypothesis 5: Higher levels of education will result in lower rates of mental illnesses. Because Caribbean Blacks have historically achieved higher levels of education, this group will have lower rates of mental illnesses. Is there an association between gender and rates of mental illnesses? Hypothesis 6: Females will have lower rates of mental illnesses. Is there an association between employment and rates of mental illnesses? Hypothesis 7: Higher rates of employment will correspond with lower rates of mental illnesses. Is there an association between homeownership and rates of mental health? Hypothesis 8: Higher rates of homeownership will result in lower rates of mental illnesses. Is there an association between use of public assistance indicating poverty levels and rates of mental illnesses? Hypothesis 9: Those on public assistance will have higher rates of mental illnesses.

30
Dataset
Engaging in research of this sort is possible because of a new data collection with an emphasis on obtaining
participants who are Caribbean born Blacks, U.S. born Blacks with Caribbean descent and U.S. born Blacks
without Caribbean descent called the National Survey of American Life (NSAL). NSAL is one of three research
projects conducted from 2001 to 2003 by the Program for Research on Black Americans (PBRA), as part of the
Research Center for Group Dynamics. According to Jackson et al (2004) the Institute for Social Research at the
University of Michigan collected this data using methodological innovations to address three concerns: ensuring
proportional representation among members of the target populations for sampling, understanding similarities and
differences in the connotative meaning of various constructs across ethnic and racial groups, studying efficiently
the importance of familial contributions to mental disorders within and across racial and ethnic groups. Another goal
of NSAL is to examine mental health disorders in terms of social and economic contextual stressors on prevalence
rates and in terms of social and cultural issues that affect self-reports. The populations sampled were African
Americans (3,570) as well as Blacks with Caribbean descent (1,621) and non-Hispanic Whites (891) to create the
most comprehensive and detailed study of mental disorders and the mental health of Americans of African descent
ever completed. To be considered Caribbean, participants answered affirmatively to being Black and one of the
following criteria: they were of West Indian or Caribbean descent or they were from a Caribbean area or county or
they had parents or grandparents from a Caribbean area or country. This study will use the African American and
Caribbean populations for a total of 5,191 participants. The data was obtained in interviews with individuals 18 and
over. The overall response rates were as follows: African Americans 70.7%, Caribbean Blacks 77.7% and Whites
72.3%.
The NSAL dataset provided information on a number of disorders that I will include in the study. The
questionnaire was structured to determine if a respondent would be diagnosed with an illness based on the

31
criterion appearing in the Diagnostic and Statistical Manual-IV (DSM-IV) or the International Statistical
Classification of Diseases and Related Health Problem (ICD_10). Using the World Health Composite International
Diagnostic Interview (WHO-CIDI), a number of questions were used for each illness to determine if the illness was
present within the past 30 days, 12 months or existed at least once in the course of the respondents’ lifetime. If the
participant responded with a negative response then the questions pertaining to that illness stopped, whereas, if
the participant continued to provide a positive response, questions continued until an endorsement of the illness
was reached (Kessler, R., Abelson, J., Demler, O., Escobar, J., Gibbon, M., Guyer, M., Howes, M., Jin, R., Vega,
W., Walters, E., Wang, P., Zaslavsky, A., Zheng, H. 2004). I focused on the lifetime, 12 month and 30 day rates of
the following disorders where available.
Dependent Variables
The definitions of the disorders came from the DSM-IV and ICD_10 and are detailed here. The first set of
illnesses are mood disorders which include DSM-IV and ICD Hypomania, DSM-IV Bi-Polar II, and ICD Dysthymia
w/ hierarchy.
DSM-IV Hypomania- Defined as a distinct period during which there is an abnormally and persistently elevated,
expansive, or irritable mood that lasts at least 4 days. This period of abnormal mood must be accompanied by at
least three additional symptoms from a list that includes inflated self-esteem or grandiosity (nondelusional),
decreased need for sleep, pressure of speech, flight of ideas, distractibility, increased involvement in goal-directed
activities or psychomotor agitation, and excessive involvement in pleasurable activities that have a high potential
for painful consequences. If the mood is irritable rather than elevated or expansive, at least four of the above
symptoms must be present. The mood during a Hypomanic Episode must be clearly different from the individual's
usual nondepressed mood, and there must be a clear change in functioning that is not characteristic of the

32
individual's usual functioning. A Hypomanic Episode typically begins suddenly, with a rapid escalation of symptoms
within a day or two. Episodes may last for several weeks to months (DMS-IV 1994).
ICD Hypomania- A disorder characterized by a persistent mild elevation of mood, increased energy and activity,
and usually marked feelings of well-being and both physical and mental efficiency. Increased sociability,
talkativeness, over-familiarity, increased sexual energy, and a decreased need for sleep are often present but not
to the extent that they lead to severe disruption of work or result in social rejection. Irritability, conceit, and boorish
behaviour may take the place of the more usual euphoric sociability. The disturbances of mood and behaviour are
not accompanied by hallucinations or delusions (ICD_10 2010).
DSM-IV Bipolar II- The essential feature of Bipolar II Disorder is a clinical course that is characterized by the
occurrence of one or more Major Depressive Episodes accompanied by at least one Hypomanic Episode and must
cause clinically significant distress or impairment in social, occupational, or other important areas of functioning.
DSM-IV Bipolar II has a duration of at least 4 days of mood change (distinct from the usual nondepressed mood)
and an unequivocal change in functioning that is observable by others. (DSM-IV 1994).
ICD Dysthymia w/ hierarchy- This disorder includes a depressed mood for most of the day, for more days than
not, and ongoing for at least two years. During this time, there must be two or more of the following symptoms:
under– or over eating, sleep difficulties, fatigue, low self-esteem, difficulty with concentration or decision making,
and feelings of hopelessness (ICD_10 2010).
The hierarchy distinction to this disorder adheres to a hierarchy rule where the definition is narrow such that no
other disorder can be present otherwise that disorders presence can be higher in hierarchy and would replace the
diagnosis of Dysthymia. For instance, there cannot be a diagnosis of Major Depression for the first two years of the
disorder, nor a manic or hypomanic episode otherwise these may be the official diagnoses not Dysthymia.

33
The second set of illnesses are anxiety disorders and include ICD Panic Attack, DSM-IV Panic Attack, DSM-IV
Panic Disorder and DSM-IV Generalized Anxiety Disorder.
ICD Panic Attack- The essential feature is recurrent attacks of severe anxiety (panic), which are not restricted to
any particular situation or set of circumstances and are therefore unpredictable. As with other anxiety disorders, the
dominant symptoms include sudden onset of palpitations, chest pain, choking sensations, dizziness, and feelings
of unreality (depersonalization or derealization). There is often also a secondary fear of dying, losing control, or
going mad (ICD_10 2010).
DSM-IV Panic Attack-The essential feature of a Panic Attack is a discrete period of intense fear or discomfort that
is accompanied by at least 4 of 13 somatic or cognitive symptoms. The attack has a sudden onset and builds to a
peak rapidly (usually in 10 minutes or less) and is often accompanied by a sense of imminent danger or impending
doom and an urge to escape. The 13 somatic or cognitive symptoms are palpitations, sweating, trembling or
shaking, sensations of shortness of breath or smothering, feeling of choking, chest pain or discomfort, nausea or
abdominal distress, dizziness or lightheadedness, derealization or depersonalization, fear of losing control or
"going crazy," fear of dying, paresthesias, and chills or hot flushes. Attacks that meet all other criteria but that have
fewer than 4 somatic or cognitive symptoms are referred to as limited-symptom attacks. Individuals seeking care
for unexpected Panic Attacks will usually describe the fear as intense and report that they thought they were about
to die, lose control, have a heart attack or stroke, or "go crazy" (DSM-IV 1994)
DSM-IV Panic Disorder – Characterized by recurrent unexpected Panic Attacks about which there is persistent
concern. Often the symptoms of this disorder come on rapidly and without an identifiable stressor. The individual
may have had periods of high anxiety in the past, or may have been involved in a recent stressful situation. The
underlying causes, however, are typically subtle. Panic Disorder is characterized by sudden attacks of intense fear
or anxiety, usually associated with numerous physical symptoms such as heart palpitations, rapid breathing or
34
shortness of breath, blurred vision, dizziness, and racing thoughts. Often these symptoms are thought to be a heart
attack by the individual, and many cases are diagnosed in hospital emergency rooms (DSM-IV 1994).
DSM-IV Generalized Anxiety Disorder- The essential feature of Generalized Anxiety Disorder is excessive
anxiety and worry (apprehensive expectation), occurring more days than not for a period of at least 6 months,
about a number of events or activities. The individual finds it difficult to control the worry. The anxiety and worry are
accompanied by at least three additional symptoms from a list that includes restlessness, being easily fatigued,
difficulty concentrating, irritability, muscle tension, and disturbed sleep. Although individuals with Generalized
Anxiety Disorder may not always identify the worries as "excessive," they report subjective distress due to constant
worry, have difficulty controlling the worry, or experience related impairment in social, occupational, or other
important areas of functioning. Adults with Generalized Anxiety Disorder often worry about everyday, routine life
circumstances such as possible job responsibilities, finances, the health of family members, misfortune to their
children, or minor matters such as household chores, car repairs, or being late for appointments (DSM-IV 1994).
The final two illnesses are conduct disorders related to being defiant. They are seen more often in children but
because they are included in the dataset, it is worth looking at how the illnesses are manifesting in the adult
population sampled.
ICD Conduct Disorder w/ hierarchy- Disorders characterized by a repetitive and persistent pattern of dissocial,
aggressive, or defiant conduct. Such behaviour should amount to major violations of age-appropriate social
expectations; it should therefore be more severe than ordinary childish mischief or adolescent rebelliousness and
should imply an enduring pattern of behaviour for six months or longer (ICD_10 2010).
DSM-IV Oppositional Defiant Disorder- The essential feature of Oppositional Defiant Disorder is a recurrent
pattern of negativistic, defiant, disobedient, and hostile behavior toward authority figures that persists for at least 6
months and is characterized by the frequent occurrence of at least four of the following behaviors: losing temper,

35
arguing with adults, actively defying or refusing to comply with the requests or rules of adults, deliberately doing
things that will annoy other people, blaming others for his or her own mistakes or misbehavior, being touchy or
easily annoyed by others, being angry and resentful, or being spiteful or vindictive. To qualify for Oppositional
Defiant Disorder, the behaviors must occur more frequently than is typically observed in individuals of comparable
age and developmental level and must lead to significant impairment in social, academic, or occupational
functioning (DSM-IV 1994).
The recorded responses listed after each disorder are: (1) Endorsed, (5) Not Endorsed. I recoded the responses
so for each disorder such that 0=Not Endorsed and 1= Endorsed.
Independent Variables
The following items were chosen from the NSAL dataset. Of these items, the primary independent variable
determines whether the individual is from the Caribbean or not. The responses for this item were as follows: (2)
Haiti, (3) Jamaica, (4) Trinidad and Tobago, and (5) other. The next independent variable is the age at the time of
immigration. The responses for this item are as follows: (0) US Born, (1) Less than 12 years, (2) 13-17 years, (3)
18-34 years, and (4) 35 plus years. The final independent variable is the length of residency in the U.S. This item
inquires how long the individual has been a citizen/resident in the U.S. The responses for this item are less than 5
years, 5-10 years, 10-20 years and 20 plus years.
Control Variables
Control variables were chosen to provide the most complete analysis of the relationship between origin of
birth, nativity status, length of residency in the U.S. and rates of mental illnesses. The variables included are sex,
working for pay, number of hours worked and high school diploma/equivalent earned, college diploma earned and
number of years of education completed. The responses for sex are (1) male and (2) female. The responses for
work for pay at present time are (1) yes, (5) no. The responses for number of hours worked span from 1-97 hours

36
per week in 1 hour increments. The responses for have HS diploma/equivalency are (1) yes, (5) no; have college
degree (1) yes, (5) no and highest grade of school/college completed were (4) 4 or less, (5) 5, (6) 6 …(17) 17 or
more.
Homeownership and poverty are also important aspects to analyze when they are used as indicators for
wealth and the lack thereof. There are several variables included in the dataset that will help us understand their
relationships to mental illnesses: If they have a mortgage on home (1) yes, (5) no, if they live in public housing (1)
yes, (5) no, if they pay low/no rent because of government assistance (1) yes, (5) no, received public assistance
since age 18 (1) yes, (5) no, and how much time received welfare before you turned 18 (1) Just Briefly, (2) Less
than Half the Time, (3) About Half the Time, (4) Most of the Time and (5) Almost all of the Time. Refer to the
codebook for a detailed description of the variables which may be viewed in the appendices section of this study.
Analytic Strategy
In order to determine the relationship between place of origin, nativity status, and generational status with
rates of mental illness I will conduct statistical analysis using a variety of tests. I will begin with frequencies and
measures of central tendency. Cross-tabulations can be used with several of the independent and control variables
to determine if there are differences relative to the prevalence of the disorders. Chi squares tests of independence
were used as they are more suitable when one of the variables is measured at the nominal or ordinal level whereas
ANOVA is better when dealing with interval level measurements. Correlations will be used with some of the
variables to determine if there is a relationship relative to the prevalence of the disorders. Logistic regression can
be used to examine the demographic risk factors associated with the disorders.

37
CHAPTER 4 RESULTS
The purpose of this research was to explore the heterogeneity between U.S. born Blacks with and without
Caribbean descent and Caribbean born Blacks relative to differences in manifestations of mental illnesses. Of
primary concern were whether the nativity and generational status is impacting rates of mental illnesses to better
understand diagnosis and treatment approaches. The more we know about differences between these groups, the
better prepared the medical community will be to appropriately diagnose and create treatment plans for these
diverse populations. This is particularly important as previous research is limited in investigating these differences
and of the limited research, very few illness have been the focus of their studies. To fill this gap in the literature,
several illnesses not previously analyzed were addressed. Whether an individual was born in the U.S. or not, the
participant’s country of origin if not born in the U.S., generational status for Caribbean Blacks and the number of
years one lived in the U.S. were some of the variables considered to determine these differences. Additional
variables such as gender, employment, education, wealth (using homeownership and welfare usage as wealth
indicators and age at immigration were also explored to provide a clear picture of what elements of a person’s life
may be impacting rates of mental illnesses. The results of the analysis of these variables are presented below and
the chapter following this will explore the elements that were found to be statistically significant in detail. The
following tables include bivariate and multivariate statistics to analyze the aforementioned variables.
Graphs 1-5 illustrate descriptive statistics of the participants, race/ancestry, country participants were born
in, age at immigration and number of years in the U.S. The participant sample is comprised of 3837 U.S. born
Blacks (76.6%) and 1114 Caribbean Blacks (22.2%). The race/ancestry variable reports 1438 participants for the
Black Caribbean population (28.7%) and U.S. born Blacks at 3570 (71.3%). Of the Caribbean born population, 298
are from Haiti, 510 from Jamaica, 170 from Trinidad. The majority of the Caribbean respondents (11.7%)

38
immigrated to the U.S. when they were adults between the ages of 18-34 years. Nearly 2/3 of this population
(15.3%) has lived in the U.S. 11 or more years.

39
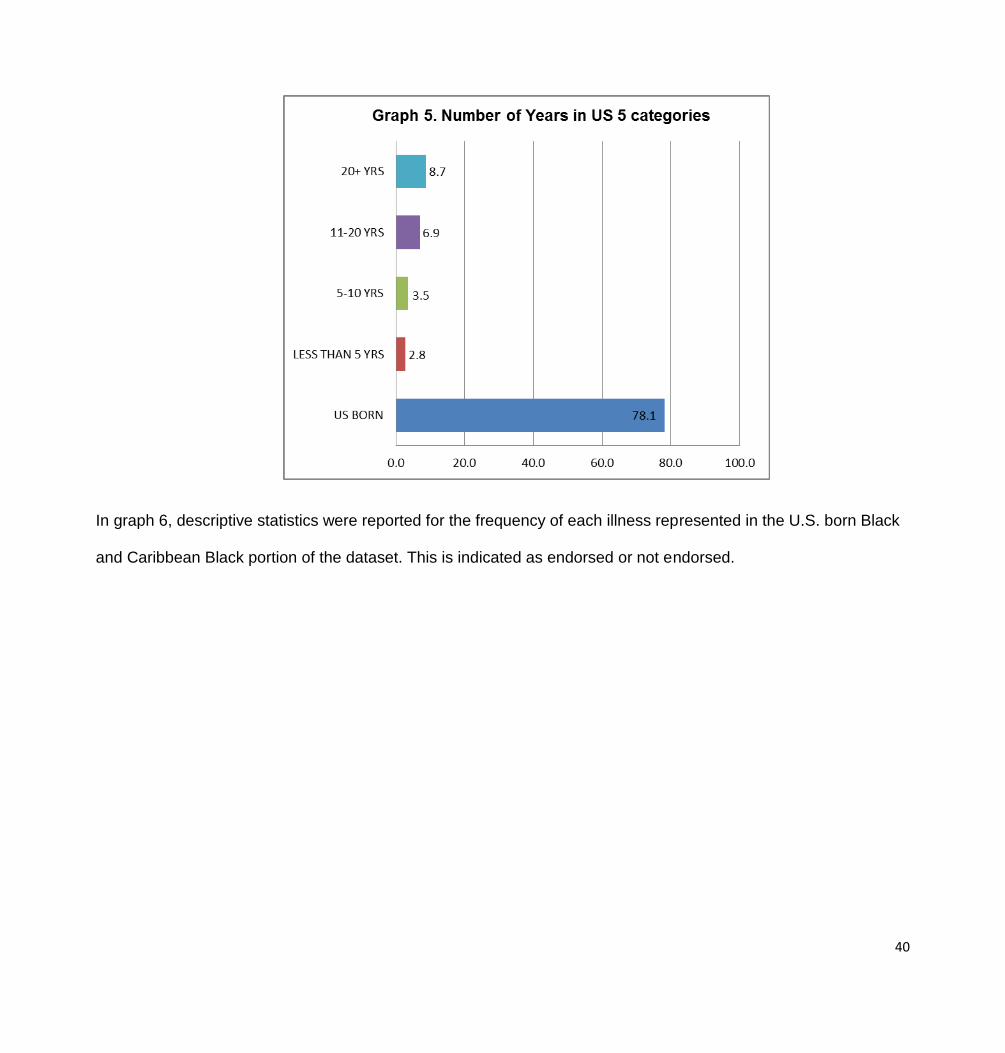
40
In graph 6, descriptive statistics were reported for the frequency of each illness represented in the U.S. born Black
and Caribbean Black portion of the dataset. This is indicated as endorsed or not endorsed.

41
Additional descriptive statistics were reported including gender, employment status, level of education,
welfare usage and home ownership in graphs 7-17. The majority of respondents were women at 63.4% while
males constituted 36.6% of the population. Employment status was varied but 65.1%, the majority of participants
did not provide if they were working or not. Of those who did provide this information, a large portion, 32.1% are not
currently working and 2.8% are working.
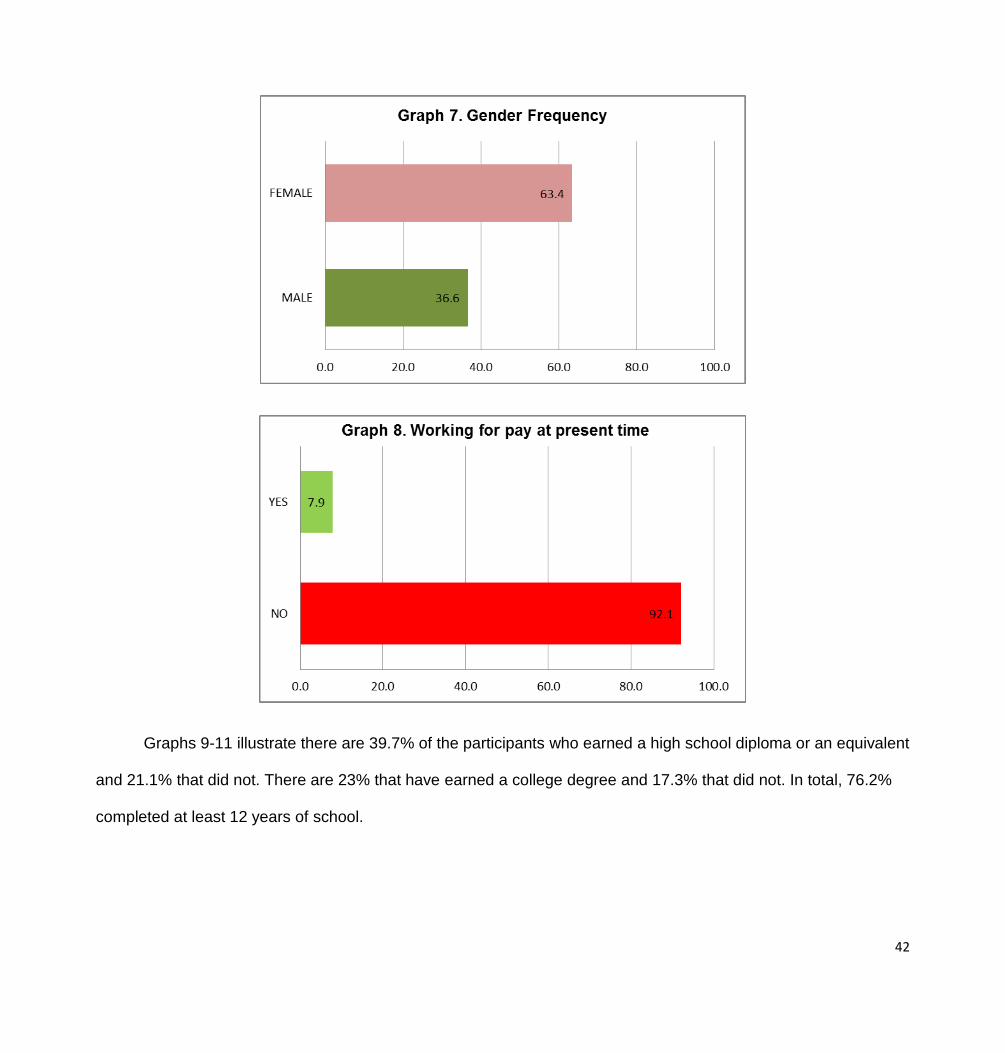
42
Graphs 9-11 illustrate there are 39.7% of the participants who earned a high school diploma or an equivalent
and 21.1% that did not. There are 23% that have earned a college degree and 17.3% that did not. In total, 76.2%
completed at least 12 years of school.

43

44
Graphs 12-17 show several results. A total of 17.3% of the population received welfare before they turned
18 with 6.2% receiving it just briefly before the age of 18. There is 23% of the population that has received welfare
since turning 18 while 75.3% have not. There are 11.7% who live in public housing and 41.7% who do not. These
numbers correspond closely to those who pay low or no rent with 11.6% who do and 41.8% who do not. Forty three
percent of respondents provided information on owning their home with 29.7% of that 43% having a mortgage on
their home. The majority of those working work a 40 hour work week.

45

46

47

48

49
As illustrated in graph 18, the mean age of those that participated in the study is 42.54 years. The average
number of years of school completed is 12.53 and of those who were working, the average number of hours
worked per week was 39.38.
Rates of Mental Illnesses U.S. Blacks vs. Caribbean Blacks
Chi-square tests of independence were used to determine whether significantly higher rates of illness
appear in U.S. Born Blacks or Caribbean Blacks depending on where they were born and the results are presented
in table 1. In all of the significant results, U.S. born Blacks are more likely to experience the illness than Caribbean
Blacks. This was evident for ICD Hypomania over the course of their lifetime and in the past 12 months (1,
N=4799) =10.42, p=.001 and (1, N=4700) =7.8, p=.005 respectively. Similarly, DSM-IV Hypomania over the lifetime

50
(1, N=4719) =8.27, p=.004, DSM-IV Hypomania for the past 12 months (1, N=4745) =5.66, p=.017 and DSM-IV
Hypomania at the 30 day mark illustrate U.S. born Blacks are significantly more likely to experience this illness than
Caribbean Blacks (1, N=4785) =4.14, p=.042. This is also true for ICD Dysthymia w/ hierarchy over their lifetime
and during the previous 12 months, (1, N=4707) =10.55, p=.001 and (1, N=4739) =8.95, p=.003 respectively and
DSM-IV Generalized Anxiety Disorder w/hierarchy over the course of one’s lifetime (1, N=4655) =12.86, p<.001
and in the previous 12 months (1, N=4739) =4.25, p=.039. DSM-IV Panic disorder yields the same results at the
lifetime mark (1, N=4629) =10.85, p=.001. ICD Panic disorder at 12 months (1, N=4673) =6.32, p=.012 and 30
days (1, N=4747) =6.79, p=.009 does as well. ICD Panic Attack at lifetime (1, N=3837) =33.11, p<.00) and DSM-IV
Panic Attack at lifetime (1, N=3843) =39.10, p<.001 demonstrate U.S. born Blacks are significantly more likely to
experience panic attacks than Caribbean Blacks. DSM-IV Oppositional Defiant Disorder w/ hierarchy over their
lifetime (1, N=2726) =5.69, p=.017 and ICD Conduct Disorder w/ hierarchy during the previous 12 months (1,
N=2839) =5.49, p=.019 also produced significantly rates for U.S. born Blacks than Caribbean Blacks.
Table 1. Mental Illness by Birth in the U.S. or Not
Illness Total
Population U.S. born frequency
Carib born frequency
χ2 P value
ICD Hypomania (Lifetime)
Not
Endorsed 4631 76.9% 23.1%
10.42 .001***
Endorsed 168 87.5% 12.5%
DSM-IV Bi-Polar II (Lifetime)
Not
Endorsed 4773 77.2% 22.8%
3.37 .066
Endorsed 26 92.3% 7.7%
DSM-IV Hypomania (Lifetime)
Not
Endorsed 4716 77.0% 23.0%
8.27 .004**
Endorsed 83 90.4% 9.6%
ICD Dysthymia w/ hierarchy (Lifetime)
Not
Endorsed 4707 77.0% 23.0%
10.55 .001***
Endorsed 92 91.3% 8.7%
DSM-IV Panic Attack (Lifetime) Not
Endorsed 3843 75.4% 24.6% 39.10 .000***

51
Endorsed 956 84.8% 15.2%
ICD Panic Attack (Lifetime)
Not
Endorsed 3837 75.5% 24.5%
33.11 .000***
Endorsed 962 84.2% 15.8%
DSM-IV Panic Disorder (Lifetime)
Not
Endorsed 4629 76.9% 23.1%
10.85 .001***
Endorsed 170 87.6% 12.4%
DSM-IV Gen Anxiety Disorder w/hierarchy
(LifeT)
Not
Endorsed 4655 76.9% 23.1%
12.86 .000***
Endorsed 144 89.6% 10.4%
DSM-IV Oppositional Defiant Disorder w/
hierarchy (LifeT)
Not
Endorsed 2726 76.4% 23.6%
5.69 .017*
Endorsed 177 84.2% 15.8%
DSM-IV Hypomania (12 month) Not
Endorsed 4745 77.1% 22.9%
5.66 .017*
Endorsed 54 90.7% 9.3%
ICD Hypomania (12 month)
Not
Endorsed 4700 77.0% 23.0%
7.80 .005**
Endorsed 99 88.9% 11.1%
DSM-IV Bi-polar II (12Mo)
Not
Endorsed 4782 77.2% 22.8%
1.17 .279
Endorsed 17 88.2% 11.8%
ICD Dysthymia with hierarchy (12 month)
Not
Endorsed 4739 77.0% 23.0%
8.95 .003**
Endorsed 60 93.3% 6.7%
ICD Conduct Disorder w/ hierarchy (12Mo)
Not
Endorsed 2839 76.6% 23.4%
5.49 .019*
Endorsed 64 89.1% 10.9%
DSM-IV Gen Anxiety Disorder w/hierarchy
(12Mo)
Not
Endorsed 4739 77.1% 22.9%
4.25 .039*
Endorsed 60 88.3% 11.7%
ICD Panic Disorder (12 month)
Not
Endorsed 4673 77.0% 23.0%
6.32 .012*
Endorsed 126 86.5% 13.5%
DSM-IV Hypomania (30 day) Not 4785 77.2% 22.8% 4.14 .042*

52
Endorsed
Endorsed 14 100.0% 0%
ICD Panic Disorder (30 day)
Not
Endorsed 4747 77.1% 22.9%
6.79 .009**
Endorsed 52 92.3% 7.7%
*p < .05, **p < .01, ***p < .001
Length of Residency in the U.S. Among Caribbean Blacks
Cross tabulations were calculated for Caribbean immigrants and the length of residency to determine if the
amount of time one lives in the U.S. has an impact on rates of mental illnesses. In table 2, there are 4 categories
for this variable: less than 5 years, 5-10 years, 11-20 years and more than 20 years. No significant results were
found for these tests across all illnesses.
Table 2. Mental Illness by the number of years residing in the U.S. for Caribbean respondents
Illness
Total
Population
< 5
years
5-10
years
11-20
years 20+ years χ2
P
value
ICD Hypomania (Lifetime)
Total Population
Not
Endorsed 1032 13.0% 15.9% 31.4% 39.7%
3.90 .273
Endorsed 19 5.3% 31.6% 26.3% 36.8%
DSM-IV Bi-Polar II (Lifetime) Not
Endorsed 1049 12.9% 16.1% 31.3% 39.8%
2.69 .441
Endorsed 2 0% .6% .3% 0%
DSM-IV Hypomania (Lifetime) Not
Endorsed 1043 12.9% 16.0% 31.3% 39.8%
3.84 .279
Endorsed 8 0% 37.5% 37.5% 25.0%
ICD Dysthymia w/ hierarchy
(Lifetime)
Not
Endorsed 1043 12.9% 16.1% 31.4% 39.5%
3.39 .335
Endorsed 8 0% 25.0% 12.5% 62.5%
DSM-IV Panic Attack (Lifetime) Not 908 13.1% 15.5% 31.3% 40.1% 2.36 .500

53
Endorsed
Endorsed 143 11.2% 20.3% 31.5% 37.1%
ICD Panic Attack (Lifetime) Not
Endorsed 901 13.3% 15.5% 31.4% 39.7%
2.71 .438
Endorsed 150 10.0% 20.0% 30.7% 39.3%
DSM-IV Panic Disorder (Lifetime) Not
Endorsed 1030 12.7% 15.9% 31.4% 40.0%
4.09 .252
Endorsed 21 19.0% 28.6% 28.6% 23.8%
DSM-IV Gen Anxiety Disorder
w/hierarchy (LifeT)
Not
Endorsed 1037 13.0% 16.0% 31.3% 39.6%
3.24 .356
Endorsed 14 0% 28.6% 28.6% 42.9%
DSM-IV Oppositional Defiant
Disorder w/ hierarchy (LifeT)
Not
Endorsed 612 18.3% 21.4% 38.2% 22.1%
2.04 .564
Endorsed 28 14.3% 28.6% 28.6% 28.6%
DSM-IV Hypomania (12 month) Not
Endorsed 1046 12.9% 16.2% 31.3% 39.7%
.81 .847
Endorsed 5 0% 20% 40% 40%
ICD Hypomania (12 month) Not
Endorsed 1041 13.0% 16.0% 31.3% 39.7%
2.50 .476
Endorsed 10 0% 30.0% 30.0% 40.0%
DSM-IV Bi-polar II (12Mo)1049 Not
Endorsed 1049 12.9% 16.1% 31.3% 39.8%
2.69 .441
Endorsed 2 0% 50.0% 50.0% 0%
ICD Dysthymia with hierarchy (12
month)
Not
Endorsed 1047 12.9% 16.0% 31.4% 39.6%
4.72 .193
Endorsed 4 0% 50.0% 0% 50.0%
ICD Conduct Disorder w/ hierarchy Not
Endorsed 633 18.2% 21.8% 37.8% 22.3% .41 .939

54
(12Mo) Endorsed 7 14.3% 14.3% 42.9% 28.6%
DSM-IV Gen Anxiety Disorder
w/hierarchy (12Mo)
Not
Endorsed 1044 12.9% 16.1% 31.4% 39.6%
2.77 .429
Endorsed 7 0% 28.6% 14.3% 57.1%
ICD Panic Disorder (12 month) Not
Endorsed 1034 12.6% 16.1% 31.4% 39.9%
5.74 .125
Endorsed 17 29.4% 23.5% 23.5% 23.5%
DSM-IV Hypomania (30 day)**** Not
Endorsed 1051 12.8% 16.2% 31.3% 39.7%
Endorsed 0 0% 0% 0% 0%
ICD Panic Disorder (30 day) Not
Endorsed 1047 12.9% 16.1% 31.2% 39.7%
1.38 .711
Endorsed 4 0% 25% 50% 25%
*p < .05, **p < .01, ***p < .001
****No respondents endorsed this disorder at the 30 day mark therefore no Chi-square computation could be completed.
Generational Status and Rates of Mental Illnesses
There are a number of significant outcomes when we examine generational status and rates of mental
illnesses. Presented in table 3, at the lifetime mark, ICD Hypomania (1, N=1345) =9.49, p=.002, DSM-IV
Hypomania (1, N=1362) =8.27, p=.004, DSM-IV Bi-polar II (1, N=1373) =7.54, p=.006, ICD Panic Attack (1,
N=1147) =14.67, p<.001, DSM-IV Panic Attack (1, N=1155) =17.90, p<.001, DSM-IV Generalized Anxiety Disorder
(1, N=1354) =5.58, p=.018, DSM-IV Panic Disorder (1, N=1342) =7.12, p=.008 were all significant. At the 12 month
mark, DSM-IV Hypomania (1, N=1368) =6.57, p=.010, ICD Hypomania (1, N=1359) =7.70, p=.006 and ICD
Conduct Disorder w/ hierarchy (1, N=867) =5.12, p=.024 were all significant. At the 30 day mark, DSM-IV
Hypomania (1, N=1378) =5.70, p=.017 and ICD Panic Disorder (1, N=1370) =6.05, p=.014 were significant.

55
Table 3. Mental Illness by Generational Status
Illness
Generational Status
Total
Population
First
Generation
1021
Second
Generation
359
χ2 P
value
ICD Hypomania (Lifetime)
Not
Endorsed 1345 74.6% 25.4%
9.49** .002
Endorsed 35 51.4% 48.6%
DSM-IV Bi-Polar II (Lifetime) Not
Endorsed 1373 74.2% 25.8%
7.54** .006
Endorsed 7 28.6% 71.4%
DSM-IV Hypomania (Lifetime) Not
Endorsed 1362 74.4% 25.6%
8.27** .004
Endorsed 18 44.4% 55.6%
ICD Dysthymia w/ hierarchy (Lifetime) Not
Endorsed 1366 74.2% 25.8%
2.09 .149
Endorsed 14 57.1% 42.9%
DSM-IV Panic Attack (Lifetime) Not
Endorsed 1155 76.2% 23.8%
17.90*** .000
Endorsed 225 62.7% 37.3%
ICD Panic Attack (Lifetime)
Not
Endorsed 1147 76.0% 24.0%
14.67*** .000
Endorsed 233 63.9% 36.1%
DSM-IV Panic Disorder (Lifetime) Not
Endorsed 1342 74.5% 25.5%
7.12** .008
Endorsed 38 55.3% 44.7%
DSM-IV Gen Anxiety Disorder w/hierarchy
(LifeT)
Not
Endorsed 1354 74.4% 25.6%
5.58** .018
Endorsed 26 53.8% 46.2%
DSM-IV Oppositional Defiant Disorder w/
hierarchy (LifeT)
Not
Endorsed 839 69.8% 30.2% .76 .383

56
Endorsed 44 63.6% 36.4%
DSM-IV Hypomania (12 month) Not
Endorsed 1368 74.3% 25.7%
6.57** .010
Endorsed 12 41.7% 58.3%
ICD Hypomania (12 month) Not
Endorsed 1359 74.4% 25.6%
7.70*** .006
Endorsed 21 47.6% 52.4%
DSM-IV Bi-polar II (12Mo) Not
Endorsed 1376 74.1% 25.9%
1.20 .274
Endorsed 4 50% 50%
ICD Dysthymia with hierarchy (12 month) Not
Endorsed 1374 74.0% 26.0%
.17 .682
Endorsed 6 66.7% 33.3%
ICD Conduct Disorder w/ hierarchy (12Mo) Not
Endorsed 867 70.0% 30.0%
5.12** .024
Endorsed 16 43.8% 56.2%
DSM-IV Gen Anxiety Disorder w/hierarchy
(12Mo)
Not
Endorsed 1368 74.1% 25.9%
1.54 .214
Endorsed 12 58.3% 41.7%
ICD Panic Disorder (12 month) Not
Endorsed 1353 74.2% 25.8%
1.74 .187
Endorsed 27 63.0% 37.0%
DSM-IV Hypomania (30 day) Not
Endorsed 1378 74.1% 25.9%
5.70** .017
Endorsed 2 0% 100%
ICD Panic Disorder (30 day) Not
Endorsed 1370 74.2% 25.8%
6.05** .014
Endorsed 10 40.0% 60.0% *p < .05, **p < .01, ***p < .001
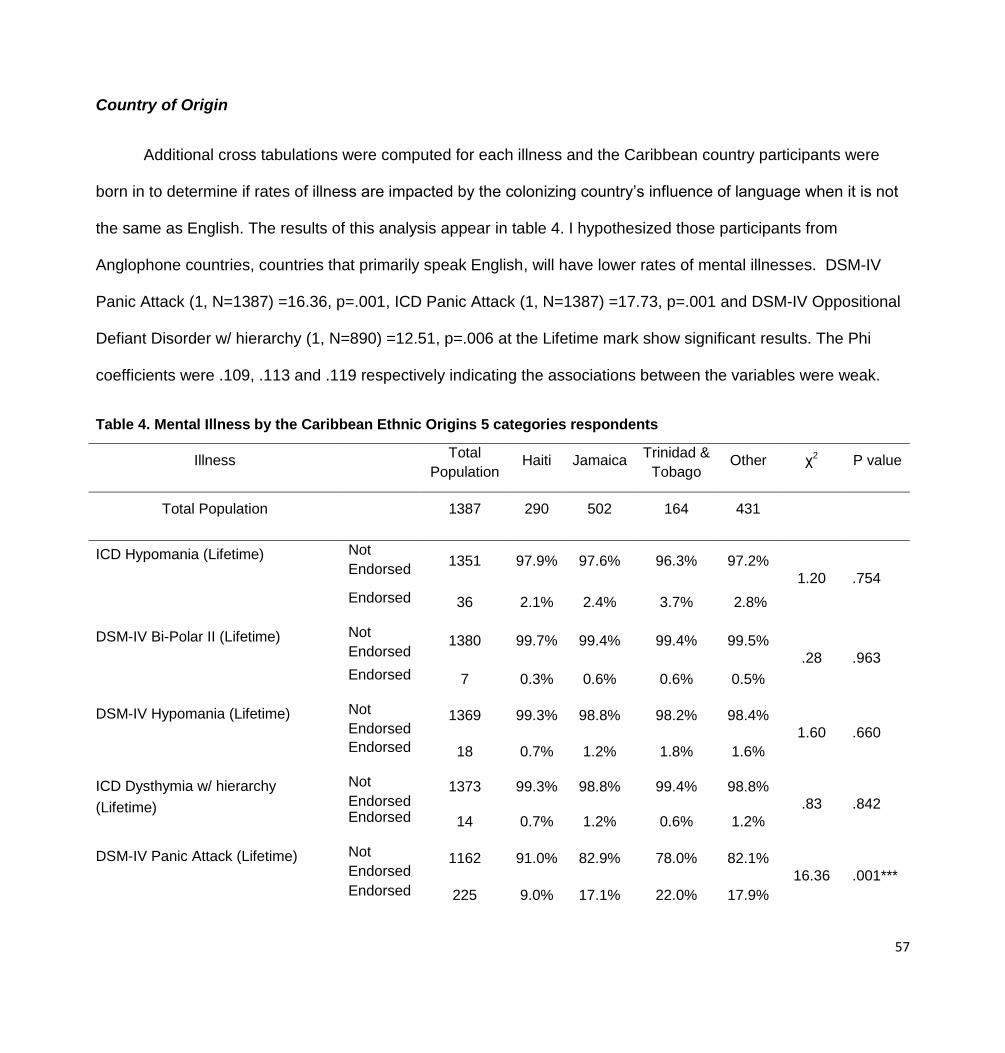
57
Country of Origin
Additional cross tabulations were computed for each illness and the Caribbean country participants were
born in to determine if rates of illness are impacted by the colonizing country’s influence of language when it is not
the same as English. The results of this analysis appear in table 4. I hypothesized those participants from
Anglophone countries, countries that primarily speak English, will have lower rates of mental illnesses. DSM-IV
Panic Attack (1, N=1387) =16.36, p=.001, ICD Panic Attack (1, N=1387) =17.73, p=.001 and DSM-IV Oppositional
Defiant Disorder w/ hierarchy (1, N=890) =12.51, p=.006 at the Lifetime mark show significant results. The Phi
coefficients were .109, .113 and .119 respectively indicating the associations between the variables were weak.
Table 4. Mental Illness by the Caribbean Ethnic Origins 5 categories respondents
Illness Total
Population Haiti Jamaica
Trinidad &
Tobago
Other χ2 P value
Total Population 1387 290 502 164 431
ICD Hypomania (Lifetime) Not
Endorsed 1351 97.9% 97.6% 96.3% 97.2%
1.20 .754
Endorsed 36 2.1% 2.4% 3.7% 2.8%
DSM-IV Bi-Polar II (Lifetime) Not
Endorsed 1380 99.7% 99.4% 99.4% 99.5%
.28 .963 Endorsed 7 0.3% 0.6% 0.6% 0.5%
DSM-IV Hypomania (Lifetime) Not
Endorsed 1369 99.3% 98.8% 98.2% 98.4%
1.60 .660 Endorsed 18 0.7% 1.2% 1.8% 1.6%
ICD Dysthymia w/ hierarchy
(Lifetime)
Not
Endorsed 1373 99.3% 98.8% 99.4% 98.8%
.83 .842 Endorsed 14 0.7% 1.2% 0.6% 1.2%
DSM-IV Panic Attack (Lifetime) Not
Endorsed 1162 91.0% 82.9% 78.0% 82.1%
16.36 .001*** Endorsed 225 9.0% 17.1% 22.0% 17.9%

58
ICD Panic Attack (Lifetime) Not
Endorsed 1154 90.7% 82.7% 76.8% 81.2%
17.73 .001***
Endorsed 233 9.3% 17.3% 23.2% 18.8%
DSM-IV Panic Disorder (Lifetime) Not
Endorsed 1349 98.3% 97.0% 97.6% 96.8%
1.71 .634 Endorsed 38 1.7% 3.0% 2.4% 3.2%
DSM-IV Gen Anxiety Disorder
w/hierarchy (LifeT)
Not
Endorsed 1361 98.6% 98.2% 97.6% 97.9%
.80 .850 Endorsed 26 1.4% 1.8% 2.4% 2.1%
DSM-IV Oppositional Defiant
Disorder w/ hierarchy (LifeT)
Not
Endorsed 846 97.7% 94.9% 88.7% 95.6%
12.51 .006** Endorsed 44 2.3% 2.1% 11.3% 4.4%
DSM-IV Hypomania (12 month) Not
Endorsed 1375 99.3% 99.4% 98.2% 99.1%
2.32 .509 Endorsed 12 0.7% 0.6% 1.8% 0.9%
ICD Hypomania (12 month) Not
Endorsed 1365 99.0% 98.8% 97.6% 97.9
2.52 .472 Endorsed 22 1.0% 1.2% 2.4% 2.1%
DSM-IV Bi-polar II (12Mo) Not
Endorsed 1383 100% 99.4% 99.4% 100%
4.34 .227 Endorsed 4 0% 0.6% 0.6% 0%
ICD Dysthymia with hierarchy (12
month)
Not
Endorsed 1381 99.7% 99.6% 100% 99.3%
1.47 .689 Endorsed 6 0.3% 0.4% 0% 0.7%
ICD Conduct Disorder w/ hierarchy
(12Mo)
Not
Endorsed 874 98.1% 99.3% 97.2% 97.4%
3.63 .304 Endorsed 16 1.9% 0.7% 2.8% 2.6%
DSM-IV Gen Anxiety Disorder
w/hierarchy (12Mo)
Not
Endorsed 1375 99.7% 99.2% 99.4$ 98.6%
2.46 .482 Endorsed 12 0.3% 0.8% 0.6% 1.4%
ICD Panic Disorder (12 month) Not
Endorsed 1360 98.6% 98.0% 98.2% 97.7%
.82 .844 Endorsed 27 1.4% 2.0% 1.8% 2.3%

59
DSM-IV Hypomania (30 day) Not
Endorsed 1385 100% 100% 99.4% 99.8%
3.84 .279 Endorsed 2 0% 0% 0.6% 0%
ICD Panic Disorder (30 day) Not
Endorsed 1377 99.7% 99.2% 100% 98.8%
3.00 .397
Endorsed 10 0.3% 0.8% 0% 0.7% *p < .05, **p < .01, ***p < .001
Education
Cross tabulations were reported for the impact of education on rates of mental illnesses. The two variables
representing education are having a high school diploma or an equivalent or having a college degree. A third
variable analyzed is the number of years of education completed. The results of these variables are represented in
the tables below. As seen in table 5, the outcomes for DSM-IV Panic Disorder (1, N=2745) =7.20, p=.007 and
DSM-IV Generalized Anxiety Disorder w/hierarchy (1, N=2777) =4.33, p=.037 illustrate that those with a high
school diploma will experience significantly less rates of these disorders than those who do not over the course of
their lifetime. These illnesses had Phi coefficients of -.050 and -0.39 respectively which indicates a very weak
association. Similar results were found with ICD Dysthymia with hierarchy (1, N=2811) =4.89, p=.027 and ICD
Panic Disorder (1, N=2773) =6.99, p=.008 in the last 12 months of respondents and ICD Panic Disorder (1,
N=2818) =6.85, p=.009 in the last 30 days. These illnesses had Phi coefficients of -.041, -.049 and -0.49
respectively which indicates a very weak association between the variables.
Table 5. Mental Illness by High School Diploma or Equivalent Earned
Illness Total Population
H.S. Diploma Earned
No Yes χ2 P value
ICD Hypomania (Lifetime)
Not
Endorsed 2755 35.8% 64.2%
.12 .731
Endorsed 96 37.5% 62.5%

60
DSM-IV Bi-Polar II (Lifetime)
Not
Endorsed 2833 35.8% 64.2%
.07 .787
Endorsed 18 38.5% 61.1%
DSM-IV Hypomania (Lifetime)
Not
Endorsed 2800 35.8% 64.2%
.64 .423
Endorsed 51 41.2% 58.8%
ICD Dysthymia w/ hierarchy
(Lifetime)
Not
Endorsed 2786 35.7% 64.3%
.94 .333
Endorsed 65 41.5% 58.5%
DSM-IV Panic Attack (Lifetime)
Not
Endorsed 2258 35.7% 64.3%
.11 .742
Endorsed 593 36.4% 63.6%
ICD Panic Attack (Lifetime)
Not
Endorsed 2256 35.8% 64.2%
.03 .869
Endorsed 595 36.1% 63.9%
DSM-IV Panic Disorder (Lifetime)**
Not
Endorsed 2745 35.4% 64.6%
7.20 .007
Endorsed 106 48.1% 51.9%
DSM-IV Gen Anxiety Disorder*
w/hierarchy (LifeT)
Not
Endorsed 2777 35.5% 64.5%
4.33 .037
Endorsed 74 47.3% 52.7%
DSM-IV Oppositional Defiant
Disorder w/ hierarchy (LifeT)
Not
Endorsed 1528 26.7% 73.3%
1.66 .197
Endorsed 108 32.4% 67.6%
DSM-IV Hypomania (12 month)
Not
Endorsed 2816 35.8% 64.2%
.26 .606
Endorsed 35 40.0% 60.0%

61
ICD Hypomania (12 month)
Not
Endorsed 2792 35.8% 64.2%
.05 .816
Endorsed 59 37.3% 62.7%
DSM-IV Bi-polar II (12Mo)
Not
Endorsed 2838 35.8% 64.2%
.04 .844
Endorsed 13 38.5% 61.5%
ICD Dysthymia with hierarchy (12
month)
Not
Endorsed 2811 35.6% 64.4%
4.89 .027
Endorsed 40 52.5% 47.5%
ICD Conduct Disorder w/ hierarchy
(12Mo)
Not
Endorsed 1584 26.9% 73.1%
.86 .355
Endorsed 52 32.7% 67.3%
DSM-IV Gen Anxiety Disorder
w/hierarchy (12Mo)
Not
Endorsed 2819 35.8% 64.2%
.04 .845
Endorsed 32 37.5% 62.5%
ICD Panic Disorder (12 month)
Not
Endorsed 2773 35.4% 64.6%
6.99 .008
Endorsed 78 50% 50%
DSM-IV Hypomania (30 day)
Not
Endorsed 2842 35.8% 64.2%
.29 .590
Endorsed 9 44.4% 55.6%
ICD Panic Disorder (30 day)
Not
Endorsed 2818 35.6% 64.4%
6.85 .009
Endorsed 33 57.6% 42.4%
*p < .05, **p < .01, ***p < .001
Per table 6, there are significant results for the U.S. born Black population as it relates to earning a high
school diploma. The results for DSM-IV Panic Disorder (1, N=2200) =7.76, p=.005 with a Phi coefficient of -.058,

62
DSM-IV Generalized Anxiety Disorder (1, N=2230) =4.90, p=.027 with a Phi coefficient of -.046, over the course of
their lifetime and ICD Dysthymia with hierarchy at 12 months (1, N=2258) =4.87, p=.027 with a Phi coefficient of -
.046,, and ICD Panic Disorder at 12 months (1, N=2225) =5.97, p=.015 with a Phi coefficient of -.051 and 30 days
(1, N=2263) =7.03, p=.008 with a Phi coefficient of -.055 all illustrate that U.S. born Blacks have significantly higher
rates of individuals not endorsing these disorders when they have a high school diploma than those who do not. All
of the associations for these variables are very weak.
Table 6. Mental Illness by High School Diploma or Equivalent Earned and U.S. Born or Caribbean Born
Illness Total
Population High School Diploma Earned
No Yes χ2 P value
ICD Hypomania (Lifetime)
U.S. born
Not Endorsed 2207 35.5% 64.5%
.27 .605
Endorsed 89 38.2% 61.8%
Caribbean born Not Endorsed 547 36.9% 63.1% .21 .649
Endorsed 7 28.6% 71.4%
DSM-IV Bi-Polar II (Lifetime)
U.S. born Not Endorsed 2280 35.6% 64.4% .46 .496
Endorsed 16 43.8% 56.2%
Caribbean born Not Endorsed 552 37.0% 63.0% 1.1
7 .28
Endorsed 2 0% 100%
DSM-IV Hypomania (Lifetime)
U.S. born Not Endorsed 2249 35.4% 64.6% 1.7
2 .190
Endorsed 47 44.7% 55.3%
Caribbean born Not Endorsed 550 37.1% 62.9% 2.3
5 .125
Endorsed 4 0% 100%

63
ICD Dysthymia w/ hierarchy (Lifetime)
‘U.S. born Not Endorsed 2235 35.5% 64.5% .78 .376
Endorsed 61 41.0% 59.0%
Caribbean born Not Endorsed 550 36.7% 63.3% .30 .583
Endorsed 4 50% 50%
DSM-IV Panic Attack (Lifetime)
U.S. born Not Endorsed 1779 35.1% 64.9% .84 .358
Endorsed 517 37.3% 62.7%
Caribbean born Not Endorsed 478 37.9% 62.1% 1.6
3 .202
Endorsed 76 30.3% 69.7%
ICD Panic Attack (Lifetime)
U.S. born Not Endorsed 1782 35.2% 64.8% .52 .472
Endorsed 514 37.0% 63.0%
Caribbean born Not Endorsed 473 37.8% 62.2% 1.4
5 .229
Endorsed 81 30.9% 69.1%
DSM-IV Panic Disorder (Lifetime)
U.S. born Not Endorsed 2200 35.0% 65.0% 7.7
6 .005**
Endorsed 96 49.0% 51.0%
Caribbean born Not Endorsed 544 36.8% 63.2% .04 .834
Endorsed 10 40.0% 60.0%
DSM-IV Gen Anxiety Disorder w/hierarchy
(LifeT)
U.S. born Not Endorsed 2230 35.2% 64.8% 4.9 .027*
Endorsed 66 48.5% 51.5%
Caribbean born Not Endorsed 546 36.8% 63.2% .00 .968
Endorsed 8 37.5% 62.5%
DSM-IV Oppositional Defiant Disorder w/
hierarchy (LifeT)

64
U.S. born Not Endorsed 1224 26.0% 74.0% 2.9
1 .088
Endorsed 94 34.0% 66.0%
Caribbean born Not Endorsed 303 29.7% 70.3% .44 .506
Endorsed 14 21.4% 78.6%
DSM-IV Hypomania (12 month)
U.S. born Not Endorsed 2264 35.5% 64.5% .93 .334
Endorsed 32 43.8% 56.2%
Caribbean born Not Endorsed 551 37.0% 63.0% 1.7
6 .185
Endorsed 3 0% 100%
ICD Hypomania (12 month)
U.S. born Not Endorsed 2242 35.5% 64.5% .26 .613
Endorsed 54 38.9% 61.1%
Caribbean born Not Endorsed 549 37.0% 63.0% .61 .433
Endorsed 5 20.0% 80.0%
DSM-IV Bi-polar II (12Mo)
U.S. born Not Endorsed 2285 35.6% 64.4% .47 .495
Endorsed 11 45.5% 54.5%
Caribbean born Not Endorsed 552 37.0% 63.0% 1.1
7 .279
Endorsed 2 0% 100.0%
ICD Dysthymia with hierarchy (12 month)
U.S. born Not Endorsed 2258 35.3% 64.7% 4.8
7 .027*
Endorsed 38 52.6% 47.4%
Caribbean born Not Endorsed 552 36.8% 63.2% .15 .699
Endorsed 2 50% 50%
ICD Conduct Disorder w/ hierarchy (12Mo)
U.S. born Not Endorsed 1272 26.4% 73.6% .37 .544
Endorsed 46 30.4% 69.6%
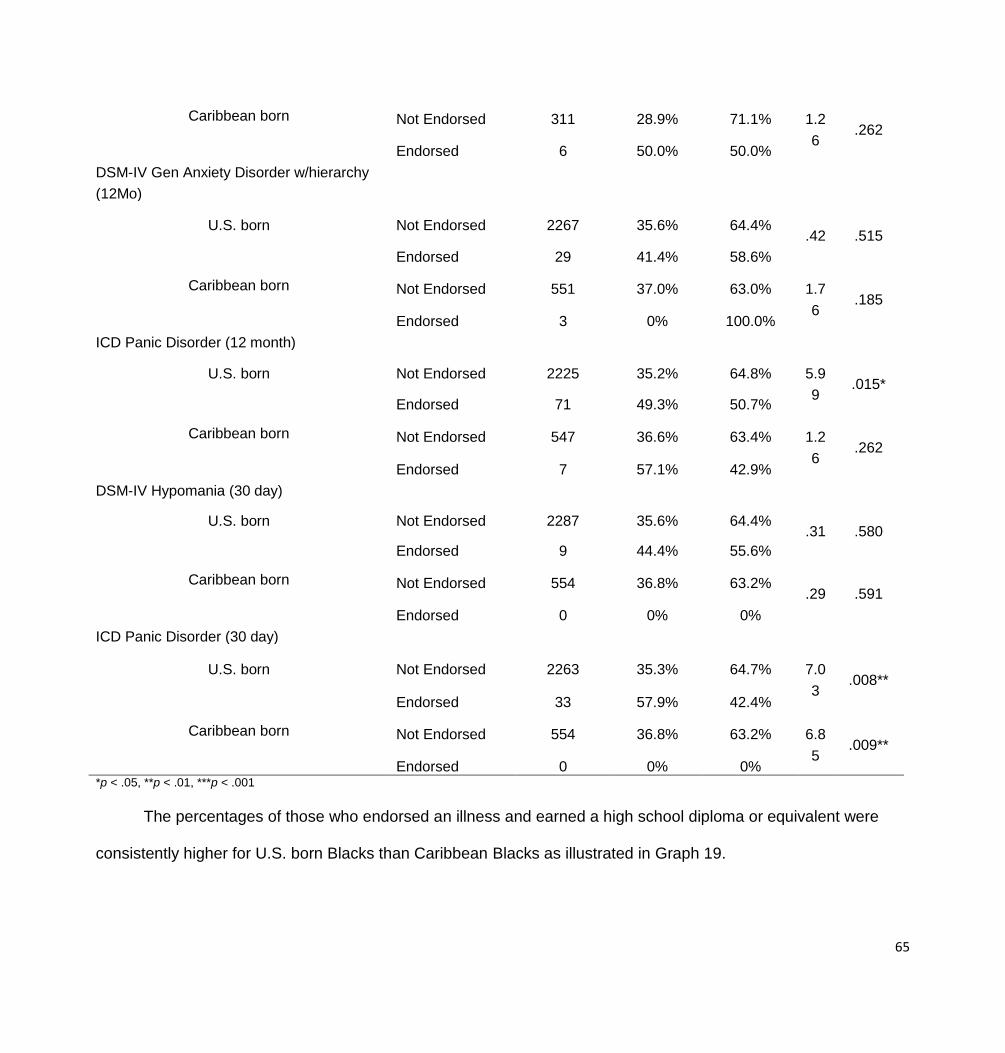
65
Caribbean born Not Endorsed 311 28.9% 71.1% 1.2
6 .262
Endorsed 6 50.0% 50.0%
DSM-IV Gen Anxiety Disorder w/hierarchy
(12Mo)
U.S. born Not Endorsed 2267 35.6% 64.4% .42 .515
Endorsed 29 41.4% 58.6%
Caribbean born Not Endorsed 551 37.0% 63.0% 1.7
6 .185
Endorsed 3 0% 100.0%
ICD Panic Disorder (12 month)
U.S. born Not Endorsed 2225 35.2% 64.8% 5.9
9 .015*
Endorsed 71 49.3% 50.7%
Caribbean born Not Endorsed 547 36.6% 63.4% 1.2
6 .262
Endorsed 7 57.1% 42.9%
DSM-IV Hypomania (30 day)
U.S. born Not Endorsed 2287 35.6% 64.4% .31 .580
Endorsed 9 44.4% 55.6%
Caribbean born Not Endorsed 554 36.8% 63.2% .29 .591
Endorsed 0 0% 0%
ICD Panic Disorder (30 day)
U.S. born Not Endorsed 2263 35.3% 64.7% 7.0
3 .008**
Endorsed 33 57.9% 42.4%
Caribbean born Not Endorsed 554 36.8% 63.2% 6.8
5 .009**
Endorsed 0 0% 0% *p < .05, **p < .01, ***p < .001
The percentages of those who endorsed an illness and earned a high school diploma or equivalent were
consistently higher for U.S. born Blacks than Caribbean Blacks as illustrated in Graph 19.

66
When looking at the impact of having a college degree, table 7 illustrated ICD Dysthymia with hierarchy at
the 12 month mark is the only illness with significant results, (1, N=1957) =4.09, p=.043 indicating that those who

67
do not have a college degree are more likely to endorse this illness in the last 12 months. This illness had a Phi
coefficient of -.043 so the association between these variables is very weak.
Table 7. Mental Illness by College Degree Earned
Illness Total Population
College Diploma Earned
Yes No χ2 P
value
ICD Hypomania (Lifetime)
Not
Endorsed
1905 42.6% 57.4%
.61 .434
Endorsed 72 47.2% 52.8%
DSM-IV Bi-Polar II (Lifetime)
Not
Endorsed
1969 42.9% 57.1%
3.00 .083
Endorsed 8 12.5% 87.5%
DSM-IV Hypomania (Lifetime)
Not
Endorsed 1945 42.8% 57.2%
.06 .807
Endorsed 32 40.6% 59.4%
ICD Dysthymia w/ hierarchy (Lifetime)
Not
Endorsed 1950 42.5% 57.5%
3.05 .081
Endorsed 27 59.3% 40.7%
DSM-IV Panic Attack (Lifetime)
Not
Endorsed 1612 42.9% 57.1%
.12 .725
Endorsed 365 41.9% 58.1%
ICD Panic Attack (Lifetime)
Not
Endorsed 1607 42.9% 57.1%
.06 .803
Endorsed 370 42.2% 57.8%
DSM-IV Panic Disorder (Lifetime)
Not
Endorsed
1912 42.7% 57.3%
.00 .956
Endorsed 65 43.1% 56.9%
DSM-IV Gen Anxiety Disorder w/hierarchy (LifeT)
Not
Endorsed
1906 42.5% 57.5%
.80 .372
Endorsed 71 47.9% 52.1%

68
DSM-IV Oppositional Defiant Disorder w/
hierarchy (LifeT)
Not
Endorsed 1214 46.0% 54.0%
2.18 .140
Endorsed 69 55.1% 44.9%
DSM-IV Hypomania (12 month)
Not
Endorsed 1958 42.8% 57.2%
.27 .601
Endorsed 19 36.8% 56.7%
ICD Hypomania (12 month)
Not
Endorsed
1937 42.7% 57.3%
.09 .771
Endorsed 40 45% 55.0%
DSM-IV Bi-polar II (12Mo)
Not
Endorsed 1973 42.8% 57.2%
.52 .473
Endorsed 4 25% 75%
ICD Dysthymia with hierarchy (12 month)
Not
Endorsed 1957 42.5% 57.5%
4.09 .043*
Endorsed 20 65% 35%
ICD Conduct Disorder w/ hierarchy (12Mo)
Not
Endorsed 1271 46.3% 53.7%
1.99 .158
Endorsed 12 66.7% 33.3%
DSM-IV Gen Anxiety Disorder w/hierarchy (12Mo)
Not
Endorsed 1949 42.7% 57.3%
.16 .691
Endorsed 28 46.4% 53.6%
ICD Panic Disorder (12 month)
Not
Endorsed 1928 42.8% 57.2%
.08 .783
Endorsed 49 40.8% 59.2%
DSM-IV Hypomania (30 day)
Not
Endorsed
1972 42.7% 57.3%
.61 .435
Endorsed 5 60.0% 40.0%
ICD Panic Disorder (30 day)
Not
Endorsed
1958 42.6% 57.4% .77 .381
Endorsed 19 52.6% 47.4%
*p < .05, **p < .01, ***p < .001

69
When we analyze the impact of a earning a college degree by ethnic origin on rates of mental illnesses,
different results are seen than when ethnic origin was not analyzed. The results are presented in table 8. ICD Panic
Disorder at the 12 month (1, N=561) =5.16, p=.023 and 30 day (1, N=561) =6.15, p=.013 levels illustrate significant
results but only for the Caribbean population. These illnesses have a Phi coefficient of -.096 and -.105 respectively
which indicates the relationship between the variables is weak.
Table 8. Mental Illness by College Degree Earned and U.S. Born or Caribbean Born
Illness Total
Population
College Degree
No Yes χ2 P
value
ICD Hypomania (Lifetime)
U.S. born Not
Endorsed 1358 43.7% 56.3%
1.47 .226
Endorsed 58 51.7% 48.3% Caribbean born Not
Endorsed 547 39.9% 60.1%
.73 .394 Endorsed 14 28.6% 71.4%
DSM-IV Bi-Polar II (Lifetime)
U.S. born Not
Endorsed 1408 44.2% 55.8%
3.24 .072
Endorsed 8 12.5% 87.5% Caribbean born Not
Endorsed 561 39.6% 60.4%
0 0 Endorsed 0 0% 0%
DSM-IV Hypomania (Lifetime)
U.S. born Not
Endorsed 1388 44.0% 56.0%
.02 .902
Endorsed 28 42.9% 57.1% Caribbean born Not
Endorsed 557 39.7% 60.3%
.36 .550 Endorsed 4 25.0% 75.0%
ICD Dysthymia w/ hierarchy (Lifetime)
U.S. born Not
Endorsed 1393 43.7% 56.3%
2.70 .100
Endorsed 23 60.9% 39.1% Caribbean born Not 557 39.5% 60.5% .18 .669

70
Endorsed Endorsed 4 50.0% 50.0%
DSM-IV Panic Attack (Lifetime)
U.S. born Not
Endorsed 1123 44.3% 55.7%
.15 .700
Endorsed 293 43.0% 57.0% Caribbean born Not
Endorsed 489 39.9% 60.1%
.15 .700 Endorsed 72 37.5% 62.5%
ICD Panic Attack (Lifetime)
U.S. born Not
Endorsed 1121 44.3% 55.7%
.25 .617
Endorsed 295 42.7% 57.3% Caribbean born Not
Endorsed 486 39.5% 60.5%
.01 .935 Endorsed 75 40.0% 60.0%
DSM-IV Panic Disorder (Lifetime)
U.S. born Not
Endorsed 1363 44.2% 55.8%
.88 .349
Endorsed 53 37.7% 62.3% Caribbean born Not
Endorsed 549 39.0% 61.0%
3.76 .052 Endorsed 12 66.7% 33.3%
DSM-IV Gen Anxiety Disorder w/hierarchy (LifeT)
U.S. born Not
Endorsed 1352 43.6% 56.4%
1.56 .212
Endorsed 64
51.6% 48.4%
Caribbean born Not
Endorsed 554 39.9% 60.1% 1.9 .169
Endorsed 7 14.3% 85.7%
DSM-IV Oppositional Defiant Disorder w/ hierarchy
(LifeT)
U.S. born Not
Endorsed 864 47.2% 52.8%
1.73 .188
Endorsed 55 56.4% 43.6% Caribbean born Not
Endorsed 350 42.9% 57.1%
.28 .597 Endorsed 14 50.0% 50.0%

71
DSM-IV Hypomania (12 month)
U.S. born Not
Endorsed 1399 44.0% 56.0%
.06 .814
Endorsed 17 41.2% 58.8% Caribbean born Not
Endorsed 559 39.7% 60.3%
1.31 .252 Endorsed 2 0% 100%
ICD Hypomania (12 month)
U.S. born Not
Endorsed 1382 43.9% 56.1%
.13 .716
Endorsed 34 47.1% 52.9% Caribbean born Not
Endorsed 555 39.6% 60.4%
.10 .753 Endorsed 6 33.3% 66.7%
DSM-IV Bi-polar II (12Mo)
U.S. born Not
Endorsed 1412 44.1% 55.9%
.59 .443
Endorsed 4 25.0% 75.0% Caribbean born Not
Endorsed 561 39.8% 60.4%
0 0 Endorsed 0 0% 0%
ICD Dysthymia with hierarchy (12 month)
U.S. born Not
Endorsed 1398 43.8% 56.2%
2.17 .141
Endorsed 18 61.1% 38.9% Caribbean born Not
Endorsed 559 39.4% 60.6%
3.07 .080 Endorsed 2 100.0% 0%
ICD Conduct Disorder w/ hierarchy (12Mo)
U.S. born Not
Endorsed 908 47.5% 52.5%
2.78 .095
Endorsed 11 72.7% 27.3% Caribbean born Not
Endorsed 363 43.3% 56.7%
.76 .383 Endorsed 1 0% 100%
DSM-IV Gen Anxiety Disorder w/hierarchy (12Mo)
U.S. born Not
Endorsed 1392 43.8% 56.2%
1.03 .311
Endorsed 24 54.2% 45.8%

72
Caribbean born Not
Endorsed 557 39.6% 60.4%
2.64 .104 Endorsed 4 25.0% 75.0%
ICD Panic Disorder (12 month)
U.S. born Not
Endorsed 1378 44.3% 55.7%
2.44 .118
Endorsed 38 31.6% 68.4% Caribbean born Not
Endorsed 550 38.9% 61.1%
5.16 .023* Endorsed 11 72.7% 27.3%
DSM-IV Hypomania (30 day)
U.S. born Not
Endorsed 1411 43.9% 56.1%
.52 .470
Endorsed 5 60.0% 40.0% Caribbean born Not
Endorsed 1972 39.6% 60.4%
0 0 Endorsed 5 0 0
ICD Panic Disorder (30 day)
U.S. born Not
Endorsed 1401 44.0% 56.0%
.10 .754
Endorsed 15 40.0% 60.0% Caribbean born Not
Endorsed 557 39.1% 60.9%
6.15 .013* Endorsed 4 100% 0%
*p < .05, **p < .01, ***p < .001
The percentages of those who endorsed an illness and earned a college diploma were consistently higher
for U.S. born Blacks than Caribbean Blacks as illustrated in Graph 20.

73
There were a number of significant results for the highest grade of school completed and mental illnesses as
demonstrated in table 9. DSM-IV Bi-Polar II, DSM-IV Hypomania, ICD Dysthymia w/ hierarchy, DSM-IV Panic

74
Attack, ICD Panic Attack, DSM-IV Panic Disorder, ICD Conduct Disorder, and DSM-IV Generalized Anxiety
Disorder at the lifetime mark are all significant. DSM-IV Bi-Polar II, DSM-IV Hypomania, ICD Conduct Disorder, ICD
Panic Disorder and DSM-IV Generalized Anxiety Disorder at the 12 month mark and ICD Panic Disorder at the 30
day mark were also significant and all are positive correlations.
Table 9. Correlates of Mental Illness and Highest grade of school completed
Pearson Correlation Sig. (2-tailed) N
ICD Hypomania (Lifetime) -.002 .872 4840
DSM-IV Bi-Polar II (Lifetime) -.016 .266 4840
DSM-IV Hypomania (Lifetime) .553** .000 4840
ICD Dysthymia w/ hierarchy (Lifetime) .381** .000 4840
DSM-IV Panic Attack (Lifetime) .124** .000 4838
ICD Panic Attack (Lifetime) .982** .000 4838
DSM-IV Panic Disorder (Lifetime) .382** .000 4838
DSM-IV Gen Anxiety Disorder w/hierarchy (LifeT) .076** .000 4836
DSM-IV Oppositional Defiant Disorder w/ hierarchy (LifeT) .113** .000 2915
DSM-IV Hypomania (12 month) -.017 .251 4840
ICD Hypomania (12 month) .628** .000 4840
DSM-IV Bi-polar II (12Mo) .261** .000 4840
ICD Dysthymia with hierarchy (12 month) -.012 .414 4840
ICD Conduct Disorder w/ hierarchy (12Mo) .045* .015 2916
DSM-IV Gen Anxiety Disorder w/hierarchy (12Mo) .040* .030 2915
ICD Panic Disorder (12 month) .071** .000 4836
DSM-IV Hypomania (30 day) -.005 .719 4829
ICD Panic Disorder (30 day) .075** .000 4838
*p < .05, **p < .01, ***p < .001
Gender
Gender and its impact on rates of mental illnesses are considered in the following cross tabulations presented in
table 10. ICD Dysthymia with hierarchy (1, N=4745) =7.47, p=.006 with a Phi coefficient of .039, DSM-IV Panic
Attack (1, N=3878) =33.94, p<.001 with a Phi coefficient of .084, ICD Panic Attack (1, N=3872) =36.61, p<.001 with
a Phi coefficient of .087, DSM-IV Panic Disorder (1, N=4668) =8.64, p=.003 with a Phi coefficient of .042, and

75
DSM-IV Generalized Anxiety Disorder with hierarchy (1, N=4687) =6.25, p=.012 with a Phi coefficient of .036 all
had significant findings with women more likely to endorse the illness than males over the course of their lifetime.
ICD Dysthymia with hierarchy (1, N=4777) =8.41, p=.004 with a Phi coefficient of .042, ICD Conduct Disorder with
hierarchy (1, N=2852) =4.07, p=.044 with a Phi coefficient of -.037, Generalized Anxiety Disorder with hierarchy (1,
N=4771) =5.16, p=.023 with a Phi coefficient of .033 and ICD Panic Disorder (1, N=4712) =10.21, p=.001 with a
Phi coefficient of .046, were all significant with females more likely to endorse the illness than males in the past 12
months. ICD Panic Disorder in the last 30 days was also significant (1, N=4786) =4.11, p=.043 with a Phi
coefficient of .029. The Phi coefficients all indicate very weak associations between the variables.
Table 10. Mental Illness by Gender
Illness Total
Population Gender
Male Female χ2 P value
ICD Hypomania (Lifetime) Not Endorsed 4671 36.5% 63.5%
.14 .712 Endorsed 169 37.9% 62.1%
DSM-IV Bi-Polar II (Lifetime) Not Endorsed 4814 36.5% 63.5%
.38 .539 Endorsed 26 42.3% 57.7%
DSM-IV Hypomania (Lifetime) Not Endorsed 4756 36.6% 63.4% 1.69 .194
Endorsed 84 29.8% 70.2%
ICD Dysthymia w/ hierarchy (Lifetime) Not Endorsed 4745 36.8% 63.2% 7.47 .006**
Endorsed 95 23.2% 76.8%
DSM-IV Panic Attack (Lifetime) Not Endorsed 3878 38.6% 61.4% 33.94 .000***
Endorsed 960 28.4% 71.6%
ICD Panic Attack (Lifetime) Not Endorsed 3872 38.6% 61.4%
36.61 .000*** Endorsed 966 28.2% 71.8%
DSM-IV Panic Disorder (Lifetime) Not Endorsed 4668 36.9% 63.1% 8.64 .003**
Endorsed 170 25.9% 74.1%
DSM-IV Gen Anxiety Disorder w/hierarchy
(LifeT) Not Endorsed 4687 36.9% 63.1%
6.25 .012**
Endorsed 149 26.8% 73.2%
DSM-IV Oppositional Defiant Disorder w/
hierarchy (LifeT) Not Endorsed 2739 35.6% 64.4%
1.36 .243
Endorsed 178 39.9% 60.1%
DSM-IV Hypomania (12 month) Not Endorsed 4785 36.6% 63.4% 1.33 .249

76
Endorsed 55 29.1% 70.9%
ICD Hypomania (12 month) Not Endorsed 4740 36.6% 63.4% .10 .748
Endorsed 100 36.0% 65.0%
DSM-IV Bi-polar II (12Mo) Not Endorsed 4823 36.5% 63.5% 1.98 .159
Endorsed 17 52.9% 47.1%
ICD Dysthymia with hierarchy (12 month) Not Endorsed 4777 36.8% 63.2% 8.41 .004**
Endorsed 63 19.0% 81.0%
ICD Conduct Disorder w/ hierarchy (12Mo) Not Endorsed 2852 35.6% 64.4% 4.07 .044*
Endorsed 65 47.7% 52.3%
DSM-IV Gen Anxiety Disorder w/hierarchy
(12Mo) Not Endorsed 4771 36.7% 63.3%
5.16 .023*
Endorsed 65 23.1% 76.9%
ICD Panic Disorder (12 month) Not Endorsed 4712 36.9% 63.1% 10.21 .001***
Endorsed 126 23.0% 77.0%
DSM-IV Hypomania (30 day) Not Endorsed 4826 36.6% 63.4% 2.30 .083
Endorsed 14 14.3% 85.7%
ICD Panic Disorder (30 day) Not Endorsed 4786 36.7% 63.3% 4.11 .043*
Endorsed 52 23.1% 76.9% *p < .05, **p < .01, ***p < .001
When considering ethnic origin and the gender, we see a number of significant results on the rates of
mental illnesses shown in table 11. ICD Dysthymia w/ hierarchy (1, N=3623) =4.12, p=.042 with a Phi coefficient of
.033, DSM-IV Panic Attack (1, N=2896) =30.67, p<.001 with a Phi coefficient of .091, ICD Panic Attack (1, N=2897)
=32.28, p<.001 with a Phi coefficient of .093, DSM-IV Panic Disorder (1, N=3558) =10.86, p=.001 with a Phi
coefficient of .054 and DSM-IV Generalized Anxiety Disorder w/hierarchy (1, N=3578) =5.71, p=017 with a Phi
coefficient of .039 were all significant for the U.S. born population with females more likely to endorse the illness
than males over the course of their lifetime. ICD Dysthymia with hierarchy (1, N=3651) =4.9, p=027 with a Phi
coefficient of .036, DSM-IV Generalized Anxiety Disorder w/hierarchy (1, N=3654) =5.09, p=024 with a Phi
coefficient of .037 and ICD Panic Disorder (1, N=3598) =12.88, p<.001 with a Phi coefficient of .059 in the past 12
months and ICD Panic Disorder (1, N=3659) =4.55, p=033 with a Phi coefficient of .035 at the 30 day mark yielded
the same interaction for females in the U.S. born population. The Phi coefficients illustrate there are very weak

77
associations between the variables analyzed. There were no significant findings for gender and the rates of mental
illnesses in the Caribbean population.
Table 11. Mental Illness by Gender and U.S. Born or Caribbean Born
Illness College Degree
Total
Population Male Female χ2
P value
ICD Hypomania (Lifetime)
U.S. born
Not Endorsed
3560 35.4% 64.6% .02 .881
Endorsed 147 36.1% 63.9%
Caribbean born Not Endorsed
1071 39.9% 60.1% .52 .473
Endorsed 21 47.6% 52.4% DSM-IV Bi-Polar II (Lifetime)
U.S. born Not Endorsed
3683 35.4% 64.6% .41 .525
Endorsed 24 41.7% 58.3% Caribbean born Not
Endorsed 1090 40.0% 60.0%
.08 .773 Endorsed 2 50.0% 50.0%
DSM-IV Hypomania (Lifetime)
U.S. born Not Endorsed
3632 35.6% 64.4% 1.87 .172
Endorsed 75 28.0% 72.0% Caribbean born Not
Endorsed 1084 40.0% 60.0%
.02 .884 Endorsed 8 37.5% 62.5%
ICD Dysthymia w/ hierarchy (Lifetime)
U.S. born Not Endorsed
3623 35.7% 64.3% 4.12 .042*
Endorsed 84 25.0% 75.0% Caribbean born Not
Endorsed 1084 40.2% 59.8%
2.54 .111 Endorsed 8 12.5% 87.5%
DSM-IV Panic Attack (LifeT)
U.S. born Not Endorsed
2896 37.8% 62.2% 30.67 .000***
Endorsed 811 27.3% 72.7% Caribbean born Not
Endorsed 947 40.7% 59.3%
1.02 .273 Endorsed 145 35.9% 64.1%
ICD Panic Attack (Lifetime)
U.S. born Not Endorsed
2897 37.8% 62.2% 32.23 .000***
Endorsed 810 27.0% 73.0%

78
Caribbean born Not Endorsed
940 40.9% 59.1% 1.95 .162
Endorsed 152 34.9% 65.1% DSM-IV Panic Disorder (LifeT)
U.S. born Not Endorsed
3558 36.0% 64.0% 10.86 .001***
Endorsed 149 22.8% 77.2% Caribbean born Not
Endorsed 1071 39.9% 60.1%
.52 .473 Endorsed 21 47.6% 52.4%
DSM-IV Gen Anxiety Disorder w/ hierarchy (LifeT)
U.S. born Not Endorsed
3578 35.8% 64.2% 5.71 .017*
Endorsed 129 25.6% 74.4% Caribbean born Not
Endorsed 1077 40.1% 59.9% .28 .595
Endorsed 15 33.3% 66.7% DSM-IV Oppositional Defiant Disorder w/ hierarchy (LifeT)
U.S. born Not Endorsed
2082 34.4% 65.6% .38 .540
Endorsed 149 36.9% 63.1% Caribbean born Not
Endorsed 644 39.0% 61.0%
2.39 .122 Endorsed 28 53.6% 46.4%
DSM-IV Hypomania (12 Mo)
U.S. born Not Endorsed
3658 35.6% 64.4% 1.73 .188
Endorsed 49 26.5% 73.5% Caribbean born Not
Endorsed 1087 40.0% 60.0%
.00 .999 Endorsed 5 40.0% 60.0%
ICD Hypomania (12 month)
U.S. born Not Endorsed
3619 35.6% 64.4% .53 .468
Endorsed 88 31.8% 68.2% Caribbean born Not
Endorsed 1081 39.9% 60.1%
.98 .323 Endorsed 11 54.5% 45.5%
DSM-IV Bi-polar II (12Mo)
U.S. born Not Endorsed
3692 35.4% 64.6% 2.10 .147
Endorsed 15 53.3% 46.7% Caribbean born Not
Endorsed 1090 40.0% 60.0%
.02 .884 Endorsed 2 50.0% 50.0%
ICD Dysthymia with hierarchy (12 month)
U.S. born Not Endorsed
3651 35.7% 64.3% 4.90 .027*

79
Endorsed 56 21.4% 78.6% Caribbean born Not
Endorsed 1088 40.2% 59.8%
2.68 .102 Endorsed 4 0% 100.0%
ICD Conduct Disorder w/ hierarchy (12Mo)
U.S. born Not Endorsed
2174 34.4% 65.6% 2.22 .137
Endorsed 57 43.9% 56.1% Caribbean born Not
Endorsed 665 39.2% 60.8%
3.00 .083 Endorsed 7 71.4% 28.6%
DSM-IV Gen Anxiety Disorder w/hierarchy (12Mo)
U.S. born Not Endorsed
3654 35.7% 64.3% 5.09 .024*
Endorsed 53 20.8% 79.2% Caribbean born Not
Endorsed 1085 40.1% 59.9%
.39 .535 Endorsed 7 28.6% 71.4%
ICD Panic Disorder (12Mo)
U.S. born Not Endorsed
3598 36.0% 64.0% 12.89 .000***
Endorsed 109 19.3% 80.7% Caribbean born Not
Endorsed 1075 39.9% 60.1%
.36 .550 Endorsed 17 47.1% 52.9%
DSM-IV Hypomania (30 day)
U.S. born Not Endorsed
3693 35.6% 64.4% 2.76 .097
Endorsed 14 14.3% 85.7% Caribbean born Not
Endorsed 1092 40.0% 60.0%
Endorsed 0 0% 0%
ICD Panic Disorder (30 day)
U.S. born Not Endorsed
3659 35.7% 64.3% 4.55 .033*
Endorsed 48 20.8% 79.2% Caribbean born Not
Endorsed 1088 40.0% 60.0%
.17 .683 Endorsed 4 50.0% 50.0%
*p < .05, **p < .01, ***p < .001
Employment
Cross tabulations were performed to determine if employment indicated by working for pay at present time
impacts rates of mental illnesses for the entire Black sample and then broken down by U.S. born and Caribbean

80
Blacks. There are no significant findings when the entire Black population sample was analyzed in relation to being
employed at the present time which is indicated in table 12.
Table 12. Mental Illness by Employment
Illness Total
Population Working for pay at present time
No Yes χ2 P value
ICD Hypomania (Lifetime) Not Endorsed 1629 92.1% 7.9%
.09 .770 Endorsed 56 91.1% 8.9%
DSM-IV Bi-Polar II (Lifetime) Not Endorsed 1678 92.1% 7.9% .60 .438
Endorsed 7 100% 0%
DSM-IV Hypomania (Lifetime) Not Endorsed 1658 92.1% 7.9% .01 .925
Endorsed 27 92.6% 7.4%
ICD Dysthymia w/ hierarchy (Lifetime) Not Endorsed 1638 91.9% 8.1% 2.21 .137
Endorsed 47 97.9% 2.1%
DSM-IV Panic Attack (Lifetime) Not Endorsed 1319 92.0% 8.0% .04 .846
Endorsed 366 92.3% 7.7%
ICD Panic Attack (Lifetime) Not Endorsed 1318 92.0% 8.0% .05 .832
Endorsed 367 92.4% 7.6%
DSM-IV Panic Disorder (LifeT) Not Endorsed 1604 92.0% 8.0% .35 .556
Endorsed 81 93.8% 6.2%
DSM-IV Gen Anxiety Disorder w/hierarchy
(LifeT) Not Endorsed 1623 92.3% 7.7%
2.22 .136
Endorsed 62 87.1% 12.9%
DSM-IV Oppositional Defiant Disorder w/
hierarchy (LifeT) Not Endorsed 693 90.0% 1.0%
.95 .329
Endorsed 57 86.0% 14.0%
DSM-IV Hypomania (12 month) Not Endorsed 1671 92.0% 8.0% 1.21 .271
Endorsed 14 100.0% 0%
ICD Hypomania (12 month) Not Endorsed 92.0% 8.0% .80 .371

81
Endorsed 29 96.6% 3.4%
DSM-IV Bi-polar II (12Mo) Not Endorsed 1680 92.1% 7.9% .43 .512
Endorsed 5 100.0% 0%
ICD Dysthymia with hierarchy (12 mo) Not Endorsed 1656 92.0% 8.0% .80 .371
Endorsed 29 96.6% 3.4%
ICD Conduct Disorder w/ hierarchy (12Mo) Not Endorsed 724 89.8% 10.2% .05 .828
Endorsed 26 88.5% 11.5%
DSM-IV Gen Anxiety Disorder w/hierarchy
(12Mo) Not Endorsed 1655 92.3% 7.7%
3.23 .072
Endorsed 30 83.3% 16.7%
ICD Panic Disorder (12 month) Not Endorsed 1621 92.0% 8.0% .25 .619
Endorsed 64 93.8% 6.2%
DSM-IV Hypomania (30 day) Not Endorsed 1680 92.1% 7.9% .43 .512
Endorsed 5 100.0% 0%
ICD Panic Disorder (30 day) Not Endorsed 1656 92.0% 8.0% .80 .371
Endorsed 29 96.6% 3.4% *p < .05, **p < .01, ***p < .001
The null hypothesis was not rejected as there are no significant findings when looking at being employed at
the present time and ethnic origin as indicated in table 13.
Table 13. Mental Illness by employment and U.S. Born or Caribbean Born
Illness Working for pay at present time
No Yes χ2 P value
ICD Hypomania (Lifetime)
U.S. born Not Endorsed 1335 91.8% 8.2%
.02 .888 Endorsed 52 92.3% 7.7%
Caribbean born Not Endorsed 283 93.6% 6.4% 2.22 .137 Endorsed 4 75.0% 25.0%
DSM-IV Bi-Polar II (LifeT)****
U.S. born Not Endorsed 1380 91.7% 8.3% .63 .427
Endorsed 7 100.0% 0% Caribbean born Not Endorsed 287 93.4% 6.6%

82
Endorsed 0 0% 0%
DSM-IV Hypomania (LifeT)****
U.S. born Not Endorsed 1360 91.8% 8.2% .02 .877
Endorsed 27 92.6% 7.4% Caribbean born Not Endorsed 287 93.4% 6.6%
Endorsed 19 0% 0%
ICD Dysthymia w/ hierarchy (Lifetime)
U.S. born Not Endorsed 1343 91.6% 8.4% 2.13 .144
Endorsed 44 97.7% 2.3% Caribbean born Not Endorsed 285 93.3% 6.7%
.14 .706 Endorsed 2 100% 0%
DSM-IV Panic Attack (Lifetime)
U.S. born Not Endorsed 1065 91.6% 8.4% .12 .734
Endorsed 322 92.2% 7.8% Caribbean born Not Endorsed 245 93.5% 6.5%
.02 .883 Endorsed 42 92.9% 7.1%
ICD Panic Attack (Lifetime)
U.S. born Not Endorsed 1067 91.7% 8.3% .09 .763
Endorsed 320 92.2% 7.8% Caribbean born Not Endorsed 242 93.4% 6.6%
.00 .989 Endorsed 45 93.3% 6.7%
DSM-IV Panic Disorder (LifeT)
U.S. born Not Endorsed 1312 91.6% 8.4% .88 .349
Endorsed 75 94.7% 5.3% Caribbean born Not Endorsed 281 93.6% 6.4%
1.00 .317 Endorsed 6 83.3% 16.7%
DSM-IV Gen Anxiety Disorder
w/hierarchy (LifeT)
U.S. born Not Endorsed 1330 92.0% 8.0% 1.30 .254
Endorsed 57 87.7% 12.3% Caribbean born Not Endorsed 283 93.6% 6.4%
2.22 .137 Endorsed 4 75.0% 25.0%
DSM-IV Oppositional Defiant Disorder
w/ hierarchy (LifeT)
U.S. born Not Endorsed 557 90.1% 9.9% .40 .528
Endorsed 47 87.2% 12.8% Caribbean born Not Endorsed 133 89.5% 10.5%
.84 .359 Endorsed 10 80.0% 20.0%

83
DSM-IV Hypomania (12Mo)****
U.S. born Not Endorsed 1373 91.7% 8.3% 1.27 .260
Endorsed 14 100.0% 0% Caribbean born Not Endorsed 287 93.4% 6.6%
Endorsed 0 0% 0%
ICD Hypomania (12 month)
U.S. born Not Endorsed 1360 91.7% 8.3% .74 .388
Endorsed 27 96.3% 3.7% Caribbean born Not Endorsed 285 93.3% 6.7%
.14 .706 Endorsed 2 100.0% 0%
DSM-IV Bi-polar II (12Mo)****
U.S. born Not Endorsed 1382 91.8% 8.2% .45 .503
Endorsed 5 100.0% 0% Caribbean born Not Endorsed 287 93.4% 6.6%
Endorsed 0 0% 0% ICD Dysthymia with hierarchy (12
month)****
U.S. born Not Endorsed 1359 91.7% 8.3% .82 .366
Endorsed 28 96.4% 3.6% Caribbean born Not Endorsed 287 93.4% 6.6%
Endorsed 0 0% 0%
ICD Conduct Disorder w/ hierarchy
(12Mo)
U.S. born Not Endorsed 581 90.0% 10.0% .23 .633
Endorsed 23 87.3% 13.0% Caribbean born Not Endorsed 140 88.6% 11.4%
.39 .534 Endorsed 3 100.0% 0%
DSM-IV Gen Anxiety Disorder
w/hierarchy (12Mo)
U.S. born Not Endorsed 1360 91.9% 8.1% 1.59 .208
Endorsed 27 85.2% 14.8% Caribbean born Not Endorsed 285 93.7% 6.3%
6.13 .013* Endorsed 2 50.0% 50.0%
ICD Panic Disorder (12 month)
U.S. born Not Endorsed 1329 91.6% 8.4% .75 .388
Endorsed 58 94.8% 5.2% Caribbean born Not Endorsed 281 93.6% 6.4%
1.00 .317 Endorsed 6 83.3% 16.7%

84
DSM-IV Hypomania (30a day)****
U.S. born Not Endorsed 1382 91.8% 8.2% .45 .503
Endorsed 5 100.0% 0% Caribbean born Not Endorsed 287 93.4% 6.6%
Endorsed 0 0% 0%
ICD Panic Disorder (30 day)****
U.S. born Not Endorsed 1358 91.7% 8.3% .89 .344
Endorsed 29 96.6% 3.4% Caribbean born Not Endorsed 287 93.4% 6.6%
Endorsed 0 0% 0% *p < .05, **p < .01, ***p < .001 ****No respondents endorsed this disorder therefore no computation could be completed.
There were a number of significant findings when looking at the number of hours for all Black respondents that
worked for pay which are illustrated in table 14. DSM-IV Hypomania, ICD Panic Attack, DSM-IV Panic Disorder,
DSM-IV Generalized Anxiety Disorder w/hierarchy, DSM-IV Oppositional Defiant Disorder w/ hierarchy all have
significant results. ICD Dysthymia w/ hierarchy and DSM-IV Panic Attack also have significant results over the
course of the lifetime. ICD Hypomania, DSM-IV Bi-polar II, ICD Conduct Disorder w/ hierarchy, DSM-IV Gen
Anxiety Disorder w/hierarchy and ICD Panic Disorder at the 12 month mark and ICD Panic Disorder at the 30 day
mark have significant results.
Table 14. Correlates of Mental Illness and # of hours worked per week
Pearson Correlation Sig. (2-tailed) N
ICD Hypomania (Lifetime) -.008 .637 3270
DSM-IV Bi-Polar II (Lifetime) -.016 .266 4840
DSM-IV Hypomania (Lifetime) .553*** .000 4840
ICD Dysthymia w/ hierarchy (LifeT) -.381*** .000 4840
DSM-IV Panic Attack (Lifetime) -.124*** .000 4838
ICD Panic Attack (Lifetime) .982*** .000 4838
DSM-IV Panic Disorder (Lifetime) .382*** .000 4838
DSM-IV Gen Anxiety Disorder w/hierarchy (LifeT) .076*** .000 4836
DSM-IV Oppositional Defiant Disorder w/ hierarchy (LifeT) .113*** .000 2915
DSM-IV Hypomania (12 month) -.017 .251 4840
ICD Hypomania (12 month) .628*** .000 4840
DSM-IV Bi-polar II (12Mo) .261*** .000 4840
ICD Dysthymia with hierarchy (12Mo) -.012 .414

85
ICD Conduct Disorder w/ hierarchy (12Mo) .045* .015 2916
DSM-IV Gen Anxiety Disorder w/ hierarchy (12Mo) .040* .030 2915
ICD Panic Disorder (12 month) .071*** .000 4836
DSM-IV Hypomania (30 day) -.005 .719 4829
ICD Panic Disorder (30 day) .075*** .000 4838
*p < .05, **p < .01, ***p < .001
Table 15 provides correlates for the number of hours worked and the relationship to the illnesses for Caribbean
respondents. DSM-IV Hypomania, ICD Panic Attack, DSM-IV Panic Attack, Dysthymia w/ hierarchy, DSM-IV Panic
Disorder, DSM-IV Generalized Anxiety Disorder, ICD Conduct Disorder w/ hierarchy and DSM-IV Oppositional
Defiant Disorder over the course of the lifetime, ICD Hypomania and DSM-IV Bi-polar II over the last 12 months
and ICD Panic Disorder for the last 30 days show significant results with a positive relationship to number of hours
worked.
Table 15. Correlates of Mental Illness and # of hours worked per week for Caribbean respondents
Pearson Correlation Sig. (2-tailed) N
ICD Hypomania (Lifetime) .039 .210 1036
DSM-IV Bi-Polar II (Lifetime) -.015 .576 1407
DSM-IV Hypomania (Lifetime) .621*** .000 1407
ICD Dysthymia w/ hierarchy (LifeT) .270*** .000 1407
DSM-IV Panic Attack (Lifetime) .153*** .000 1407
ICD Panic Attack (Lifetime) .974*** .000 1407
DSM-IV Panic Disorder (Lifetime) .371*** .000 1407
DSM-IV Gen Anxiety Disorder w/ hierarchy (LifeT) .102*** .000 1406
DSM-IV Oppositional Defiant Disorder w/ hierarchy (LifeT) .113*** .001 901
DSM-IV Hypomania (12 month) -.013 .627 1407
ICD Hypomania (12 month) .549*** .000 1407
DSM-IV Bi-polar II (12Mo) .208*** .000 1407
ICD Dysthymia with hierarchy (12Mo) -.007 .801 1407
ICD Conduct Disorder w/hierarchy (12Mo) -.011 .734 901
DSM-IV Gen Anxiety Disorder w/hierarchy (12Mo) -.015 .660 901
ICD Panic Disorder (12 month) .038 .153 1406
DSM-IV Hypomania (30 day) -.002 .948 1403
ICD Panic Disorder (30 day) .221*** .000 1407
*p < .05, **p < .01, ***p < .001

86
Table 16 presents correlates for the number of hours worked and the relationship to the illnesses for U.S. born
Black respondents. DSM-IV Hypomania, ICD Dysthymia w/ hierarchy, ICD Panic Attack, DSM-IV Panic Attack,
DSM-IV Generalized Anxiety Disorder and DSM-IV Oppositional Defiant Disorder over the course of the lifetime,
ICD Hypomania and DSM-IV Bi-polar II, ICD Conduct Disorder w/ hierarchy, DSM-IV Gen Anxiety Disorder
w/hierarchy and ICD Panic Disorder over the last 12 months and ICD Panic Disorder for the last 30 days show
significant results.
Table 16. Correlates of # hours work for pay a week – U.S. born respondents
Pearson Correlation Sig. (2-tailed) N
ICD Hypomania (Lifetime) -.027 .201 2234
DSM-IV Bi-Polar II (Lifetime) -.016 .336 3433
DSM-IV Hypomania (Lifetime) .533*** .000 3433
ICD Dysthymia w/ hierarchy (LifeT) .413*** .000 3433
DSM-IV Panic Attack (Lifetime) .115*** .000 3431
ICD Panic Attack (Lifetime) .984*** .000 3431
DSM-IV Panic Disorder (Lifetime) .385*** .000 3431
DSM-IV Gen Anxiety Disorder w/hierarchy (LifeT) .069*** .000 3430
DSM-IV Oppositional Defiant Disorder w/ hierarchy (LifeT) .112*** .000 2014
DSM-IV Hypomania (12 month) -.018 .293 3433
ICD Hypomania (12 month) .651*** .000 3433
DSM-IV Bi-polar II (12Mo) .277*** .000 3433
ICD Dysthymia with hierarchy (12Mo) -.014 .423 3433
ICD Conduct Disorder w/hierarchy (12Mo) .060** .007 2015
DSM-IV Gen Anxiety Disorder w/hierarchy (12Mo) .058** .009 204
ICD Panic Disorder (12 month) .080*** .000 3430
DSM-IV Hypomania (30 day) -.007 .703 3426
ICD Panic Disorder (30 day) .043* .011 3431
*p < .05, **p < .01, ***p < .001
Home Ownership
Cross tabs were analyzed to determine if owning one’s home impacts rates of mental illnesses, the results
of which are included in table 16. ICD Panic Attack (1, N=2115) =5.07, p=.024 with a Phi coefficient of .049 and
DSM-IV Panic Attack (1, N=2115) =5.33, p=.021 with a Phi coefficient of .050 over the course of their lifetime was

87
shown to be significant. The Phi coefficients illustrate there are very weak associations between the variables
analyzed. These results are shown in table 17.
Table 17. Mental Illness by Mortgage on Home
Illness Total Population Mortgage on Home
No Yes χ2 P
value
ICD Hypomania (Lifetime) Not Endorsed 2067 32.3% 67.7%
.02 .882 Endorsed 48 33.3% 66.7%
DSM-IV Bi-Polar II (Lifetime) Not Endorsed 2107 32.4% 67.6% .20 .657
Endorsed 8 25.0% 75.0%
DSM-IV Hypomania (Lifetime) Not Endorsed 2086 32.5% 67.5% .90 .342
Endorsed 29 24.1 75.9%
ICD Dysthymia w/ hierarchy (Lifetime) Not Endorsed 2086 32.3% 67.7% .42 .517
Endorsed 29 37.9% 62.1%
DSM-IV Panic Attack (Lifetime) Not Endorsed 1741 33.4% 66.6% 5.30
* .021
Endorsed 374 27.3% 72.7%
ICD Panic Attack (Lifetime)
Not Endorsed 1736 33.4% 66.6% 5.10
* .024 Endorsed 379 27.4% 72.6%
DSM-IV Panic Disorder (LifeT) Not Endorsed 2056 32.6% 67.4% 2.06 1.52
Endorsed 59 23.7% 76.3%
DSM-IV Gen Anxiety Disorder w/hierarchy
(LifeT) Not Endorsed 2055 32.3% 67.7%
.03 .868
Endorsed 60 33.3% 66.7%
DSM-IV Oppositional Defiant Disorder w/
hierarchy (LifeT) Not Endorsed 963 23.8% 76.2%
.12 .726
Endorsed 42 21.4% 78.0%
DSM-IV Hypomania (12 month) Not Endorsed 2095 32.5% 67.5% 2.78 .096
Endorsed 20 15.0% 85.0%
ICD Hypomania (12 month) Not Endorsed 2087 32.3% 67.7% .15 .701
Endorsed 28 35.7% 64.3%

88
DSM-IV Bi-polar II (12Mo) Not Endorsed 2108 32.4% 67.6% .05 .831
Endorsed 7 28.6% 71.4%
ICD Dysthymia with hierarchy (12 month) Not Endorsed 2097 32.2% 67.8% 1.22 .270
Endorsed 18 44.4% 55.6%
ICD Conduct Disorder w/ hierarchy (12Mo) Not Endorsed 990 23.5% 76.5% .79 .376
Endorsed 15 33.3% 66.7%
DSM-IV Gen Anxiety Disorder w/hierarchy
(12Mo) Not Endorsed 2093 32.4% 67.6%
.26 .609
Endorsed 22 27.3% 72.7%
ICD Panic Disorder (12 month) Not Endorsed 2071 32.3% 67.7% .06 .802
Endorsed 44 34.1% 65.9%
DSM-IV Hypomania (30 day) Not Endorsed 2111 32.4% 67.6% .10 .753
Endorsed 4 25.0% 75.0%
ICD Panic Disorder (30 day) Not Endorsed 2099 32.3% 67.7% .96 .327
Endorsed 16 43.8% 56.2% *p < .05, **p < .01, ***p < .001
Home ownership was analyzed considering the ethnic origin of the two groups. ICD Panic Attack (1,
N=1684) =8.47, p=.004 with a Phi coefficient of .071 and DSM-IV Panic Attack (1, N=1684) =8.97, p=.003 with a
Phi coefficient of .073 at the lifetime level were significant for U.S. born Blacks. The Phi coefficients illustrate there
are very weak associations between the variables analyzed. The results are presented in table 18.
Table 18. Mental Illness by Mortgage on Home and U.S. Born vs. Caribbean Born
Illness Total
Population Mortgage on home
No Yes χ2 P value
ICD Hypomania (Lifetime)
U.S. born Not Endorsed 1642 36.5% 63.5%
.01 .913 Endorsed 42 35.7% 64.3%
Caribbean born Not Endorsed 424 16.0% 84.0% .00 .967
Endorsed 6 16.7% 83.3%

89
DSM-IV Bi-Polar II (Lifetime)
U.S. born Not Endorsed 1677 36.4% 63.2% .19 .662
Endorsed 7 28.6% 71.4%
Caribbean born Not Endorsed 429 16.1% 83.9% .19 .662
Endorsed 1 0% 100.0%
DSM-IV Hypomania (Lifetime)
U.S. born Not Endorsed 1659 36.6% 63.4% .80 .373
Endorsed 25 28.0% 72.0%
Caribbean born Not Endorsed 426 16.2% 83.8% .77 .380
Endorsed 4 0% 100.0%
ICD Dysthymia w/ hierarchy (Lifetime)
U.S. born Not Endorsed 1658 36.5% 63.5% .04 .836
Endorsed 26 38.5% 61.5%
Caribbean born Not Endorsed 427 15.9% 84.1% .67 .413
Endorsed 3 33.3% 66.7%
DSM-IV Panic Attack (Lifetime)
U.S. born Not Endorsed 1360 38.2% 61.8% 8.97** .003
Endorsed 324 29.3% 70.7%
Caribbean born Not Endorsed 380 16.3% 83.7% .18 .675
Endorsed 50 14.0% 86.0%
ICD Panic Attack (Lifetime)
U.S. born Not Endorsed 1359 38.2% 61.8% 8.47** .004
Endorsed 325 29.5% 70.5%
Caribbean born Not Endorsed 376 16.2% 83.8% .07 .792
Endorsed 54 14.8% 85.2%

90
DSM-IV Panic Disorder (Lifetime)
U.S. born Not Endorsed 1630 36.9% 63.1% 2.70 .100
Endorsed 54 25.9% 74.1%
Caribbean born Not Endorsed 425 16.2% 83.8% .97 .325
Endorsed 5 0% 100.0%
DSM-IV Gen Anxiety Disorder
w/hierarchy (LifeT)
U.S. born Not Endorsed 1629 36.6% 63.4% .35 .553
Endorsed 55 32.7% 67.3%
Caribbean born Not Endorsed 425 15.8% 84.2% 2.16 .142
Endorsed 5 40.0% 60.0%
DSM-IV Oppositional Defiant Disorder
w/ hierarchy (LifeT)
U.S. born Not Endorsed 769 27.6% 72.4% .27 .605
Endorsed 34 23.5% 76.5%
Caribbean born Not Endorsed 193 8.8% 91.2% .13 .720
Endorsed 8 12.5% 87.5%
DSM-IV Hypomania (12 month)
U.S. born Not Endorsed 1667 36.7% 63.3% 2.64 .104
Endorsed 17 17.6% 82.4%
Caribbean born Not Endorsed 427 16.2% 83.8% .58 .447
Endorsed 3 0% 100.0%
ICD Hypomania (12 month)
U.S. born Not Endorsed 1659 36.3% 63.5% .13 .716
Endorsed 25 40.0% 60.0%
Caribbean born Not Endorsed 427 16.2% 63.5% .58 .447
Endorsed 3 0% 100.0%

91
DSM-IV Bi-polar II (12Mo)
U.S. born Not Endorsed 1678 36.5% 63.5% .03 .871
Endorsed 6 33.3% 66.7%
Caribbean born Not Endorsed 429 16.1% 83.9% .19 .662
Endorsed 1 0% 100.0%
ICD Dysthymia with hierarchy (12 month)
U.S. born Not Endorsed 1667 36.4% 63.6% .82 .364
Endorsed 17 47.1% 52.9%
Caribbean born Not Endorsed 429 16.1% 83.9% .19 .662
Endorsed 1 0% 100.0%
ICD Conduct Disorder w/ hierarchy
(12Mo)****
U.S. born Not Endorsed 788 27.3% 72.7% .27 .603
Endorsed 15 33.3% 66.7%
Caribbean born Not Endorsed 201 9.0% 91.0% 0 0
Endorsed 0 0% 0%
DSM-IV Gen Anxiety Disorder
w/hierarchy (12Mo)
U.S. born Not Endorsed 1666 36.7% 63.3% 1.60 .205
Endorsed 18 22.2% 77.8%
Caribbean born Not Endorsed 426 15.7% 84.3% 3.46 .063
Endorsed 4 50.0% 50.0%
ICD Panic Disorder (12 month)
U.S. born Not Endorsed 1643 36.5% 63.5% .00 .993
Endorsed 41 36.8% 63.4%
Caribbean born Not Endorsed 427 16.2% 83.8% .58 .447
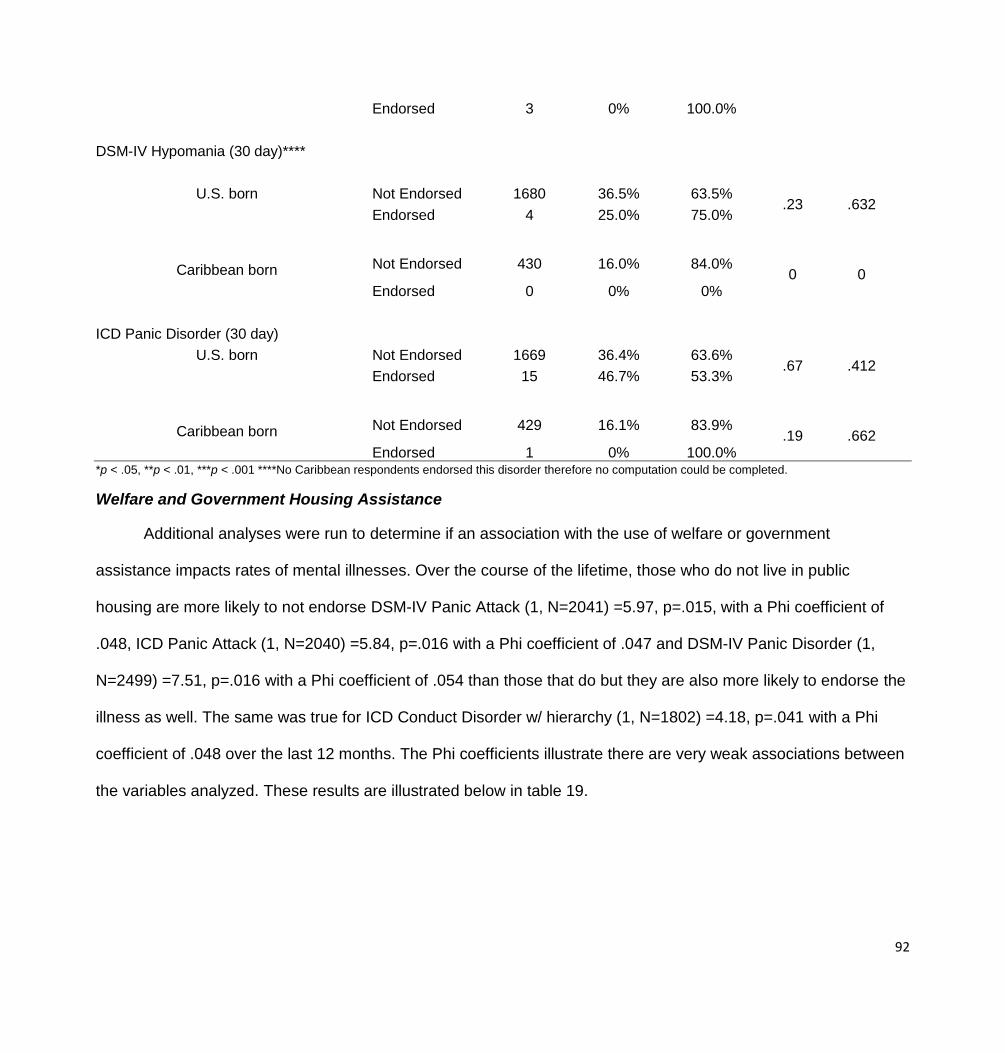
92
Endorsed 3 0% 100.0%
DSM-IV Hypomania (30 day)****
U.S. born Not Endorsed 1680 36.5% 63.5% .23 .632
Endorsed 4 25.0% 75.0%
Caribbean born Not Endorsed 430 16.0% 84.0% 0 0
Endorsed 0 0% 0%
ICD Panic Disorder (30 day)
U.S. born Not Endorsed 1669 36.4% 63.6% .67 .412
Endorsed 15 46.7% 53.3%
Caribbean born Not Endorsed 429 16.1% 83.9% .19 .662
Endorsed 1 0% 100.0% *p < .05, **p < .01, ***p < .001 ****No Caribbean respondents endorsed this disorder therefore no computation could be completed.
Welfare and Government Housing Assistance
Additional analyses were run to determine if an association with the use of welfare or government
assistance impacts rates of mental illnesses. Over the course of the lifetime, those who do not live in public
housing are more likely to not endorse DSM-IV Panic Attack (1, N=2041) =5.97, p=.015, with a Phi coefficient of
.048, ICD Panic Attack (1, N=2040) =5.84, p=.016 with a Phi coefficient of .047 and DSM-IV Panic Disorder (1,
N=2499) =7.51, p=.016 with a Phi coefficient of .054 than those that do but they are also more likely to endorse the
illness as well. The same was true for ICD Conduct Disorder w/ hierarchy (1, N=1802) =4.18, p=.041 with a Phi
coefficient of .048 over the last 12 months. The Phi coefficients illustrate there are very weak associations between
the variables analyzed. These results are illustrated below in table 19.

93
Table 19. Mental Illness by Live in public housing
Illness Total
Population Live in public housing
No Yes χ2 P value
ICD Hypomania (Lifetime)
Not
Endorsed 2491 77.8% 22.2%
.06 .803
Endorsed 118 78.8% 21.2%
DSM-IV Bi-Polar II (Lifetime) Not
Endorsed 2592 77.9% 22.1%
.20 .656
Endorsed 17 82.4% 17.6%
DSM-IV Hypomania (Lifetime) Not
Endorsed 2556 78.0% 22.0%
1.20 .273
Endorsed 53 71.7% 28.3%
ICD Dysthymia w/ hierarchy (LifeT) Not
Endorsed 2547 78.0% 22.0%
.50 .479
Endorsed 62 74.2% 25.8%
DSM-IV Panic Attack (Lifetime) Not
Endorsed 2041 78.9% 21.1%
5.97* .015
Endorsed 568 74.1% 25.9%
ICD Panic Attack (Lifetime)
Not
Endorsed 2040 78.9% 21.1%
5.84* .016
Endorsed 569 74.2% 25.8%
DSM-IV Panic Disorder (Lifetime) Not
Endorsed 2499 78.4% 21.6%
7.51* .006
Endorsed 110 67.3% 32.7%
DSM-IV Gen Anxiety Disorder w/hierarchy (LifeT) Not
Endorsed 2527 78.1% 21.9%
1.73 .188
Endorsed 82 72.0% 28.0%
DSM-IV Oppositional Defiant Disorder w/ hierarchy (LifeT) Not
Endorsed 1718 79.9% 20.1%
.02 .884
Endorsed 131 79.4% 20.6%
DSM-IV Hypomania (12 month) Not 2576 78.0% 22.0% 2.44 .118

94
Endorsed
Endorsed 33 66.7% 33.3%
ICD Hypomania (12 month) Not
Endorsed 2539 77.8% 22.2%
.53 .469
Endorsed 70 81.4% 18.6%
DSM-IV Bi-polar II (12Mo) Not
Endorsed 2599 77.9% 22.1%
.03 .872
Endorsed 10 80.0% 20.0%
ICD Dysthymia with hierarchy (12Mo) Not
Endorsed 2568 77.9% 22.1%
.13 .724
Endorsed 41 75.6% 24.4%
ICD Conduct Disorder w/ hierarchy (12Mo) Not
Endorsed 1802 80.2% 19.8%
4.18* .041
Endorsed 47 68.1% 31.9%
DSM-IV Gen Anxiety Disorder w/hierarchy (12Mo) Not
Endorsed 2571 77.9% 22.1%
.40 .530
Endorsed 38 73.7% 26.3%
ICD Panic Disorder (12 month) Not
Endorsed 2527 78.1% 21.9%
1.73 .188
Endorsed 82 72.0% 28.0%
DSM-IV Hypomania (30 day) Not
Endorsed 2599 78.0% 22.0%
1.86 .172
Endorsed 10 60.0% 40.0%
ICD Panic Disorder (30 day) Not
Endorsed 2573 78.0% 22.0%
2.67 .102
Endorsed 36 66.7% 33.3% *p < .05, **p < .01, ***p < .001
Over the course of the lifetime, those who do not pay low/no rent through government assistance are more
likely to not endorse DSM-IV Panic Attack than those that do but they are also more likely to endorse the illness as

95
well (1, N=2041) =18.29, p<.001 with a Phi coefficient of .084. The same outcome is true for ICD Panic Attack over
the course of the lifetime (1, N=2040) =18.06, p<.001 with a Phi coefficient of .083.
Those not receiving low/no rent through government assistance are significantly more likely to not endorse
the following disorders: over the course of the lifetime, DSM-IV Panic Disorder (1, N=2496) =21.93, p<.001 with a
Phi coefficient of .092 and DSM-IV Generalized Anxiety Disorder (1, N=2524) =8.83, p=.003 with a Phi coefficient
of .058, over the last 12 months ICD Panic Disorder (1, N=2525) =21.91, p< .001 with a Phi coefficient of .092 and
in the last 30 days, ICD Panic Disorder (1, N=2571) =20.73, p<.001 with a Phi coefficient of .089 and DSM-IV
Hypomania (1, N=2597) =4.73, p=.030 with a Phi coefficient of .043 were significant. These results are
demonstrated in table 20. The Phi coefficients illustrate there are very weak associations between the variables
analyzed.
Table 20. Mental Illness by Pay low/no rent because of government assistance
Illness Total
Population Pay low/no rent because of govt
No Yes χ2 P value
ICD Hypomania (Lifetime) Not Endorsed 2489 78.6% 21.4%
2.85 .092 Endorsed 118 72.0% 28.0%
DSM-IV Bi-Polar II (Lifetime) Not Endorsed 2589 78.3% 21.7% .27 .602
Endorsed 18 83.3% 16.7%
DSM-IV Hypomania (Lifetime) Not Endorsed 2553 78.5% 21.5% 2.03 .154
Endorsed 54 70.4% 29.6%
ICD Dysthymia w/ hierarchy (LifeT) Not Endorsed 2545 78.5% 21.5% 2.00 .157
Endorsed 62 71.0% 29.0%
DSM-IV Panic Attack (Lifetime) Not Endorsed 2041 80.1% 19.9% 18.29*** .000
Endorsed 566 71.7% 28.3%
ICD Panic Attack (Lifetime)
Not Endorsed 2040 80.1% 19.9%
18.06*** .000
Endorsed 567 71.8% 28.2%

96
DSM-IV Panic Disorder (Lifetime) Not Endorsed 2496 79.1% 20.9% 21.93*** .000
Endorsed 111 60.4% 39.6%
DSM-IV Gen Anxiety Disorder w/hierarchy
(LifeT) Not Endorsed 2524 78.7% 21.3%
8.83** .003
Endorsed 83 65.1% 34.9%
DSM-IV Oppositional Defiant Disorder w/
hierarchy (LifeT) Not Endorsed 1721 80.0% 20.0%
.81 .367
Endorsed 133 76.7% 23.3%
DSM-IV Hypomania (12 month) Not Endorsed 2573 78.4% 21.6% 1.20 .273
Endorsed 34 70.6% 29.4%
ICD Hypomania (12 month) Not Endorsed 2537 78.5% 21.5% 2.91 .088
Endorsed 70 70.0% 30.0%
DSM-IV Bi-polar II (12Mo) Not Endorsed 2597 78.3% 21.7% .02 .895
Endorsed 10 80.0% 20.0%
ICD Dysthymia with hierarchy (12 mo) Not Endorsed 2566 78.4% 21.6% .64 .423
Endorsed 41 73.2% 26.8%
ICD Conduct Disorder w/ hierarchy (12Mo) Not Endorsed 1805 80.0% 20.0% 3.32 .068
Endorsed 49 69.4% 30.6%
DSM-IV Gen Anxiety Disorder w/hierarchy
(12Mo) Not Endorsed 2569 78.5% 21.5%
3.55 .060
Endorsed 38 65.8% 34.2%
ICD Panic Disorder (12 month) Not Endorsed 2525 79.0% 21.0% 21.91*** .000
Endorsed 82 57.3% 42.7%
DSM-IV Hypomania (30 day) Not Endorsed 2597 78.4% 21.6% 4.73* .030
Endorsed 10 50.0% 50.0%
ICD Panic Disorder (30 day) Not Endorsed 2571 78.7% 21.3% 20.73*** .000
Endorsed 36 47.2% 52.8% *p < .05, **p < .01, ***p < .001
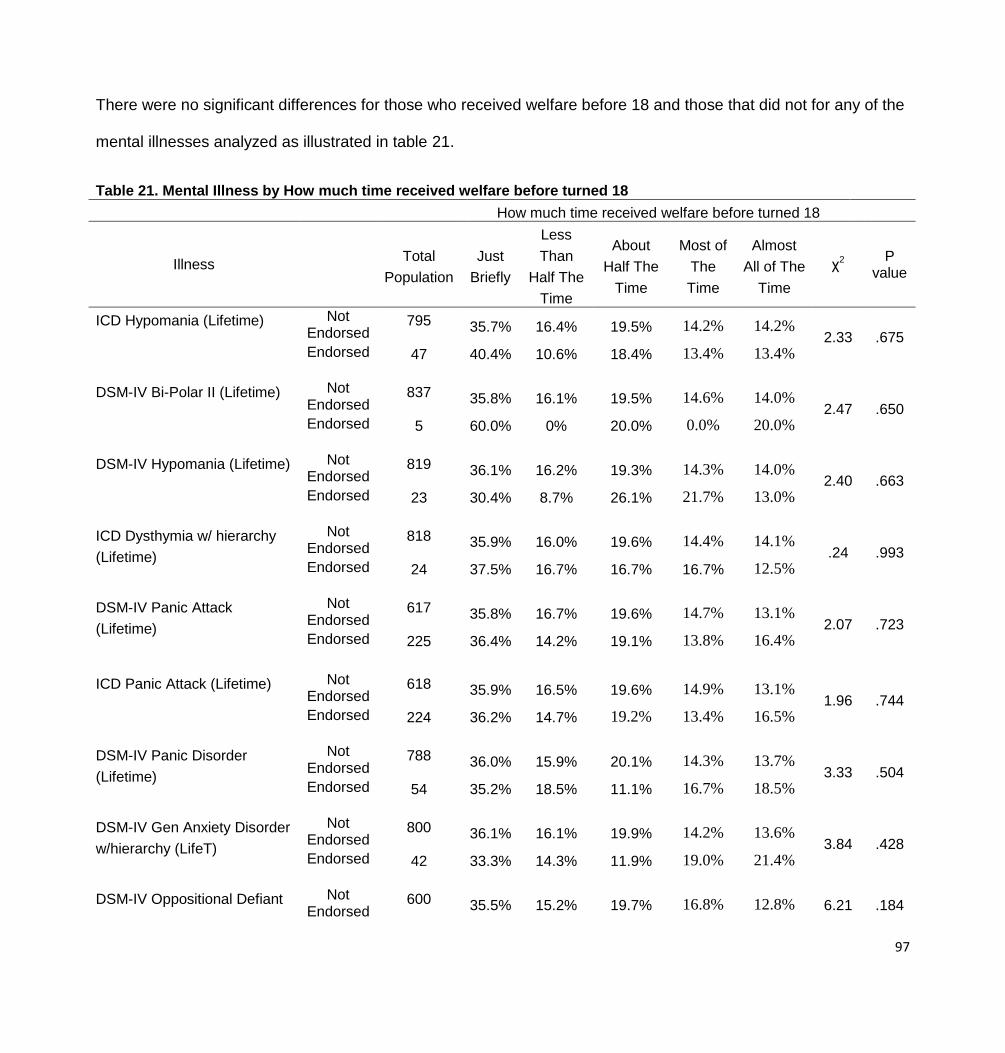
97
There were no significant differences for those who received welfare before 18 and those that did not for any of the
mental illnesses analyzed as illustrated in table 21.
Table 21. Mental Illness by How much time received welfare before turned 18
How much time received welfare before turned 18
Illness Total
Population
Just
Briefly
Less
Than
Half The
Time
About
Half The
Time
Most of
The
Time
Almost
All of The
Time
χ2 P
value
ICD Hypomania (Lifetime) Not Endorsed
795 35.7% 16.4% 19.5% 14.2% 14.2% 2.33 .675
Endorsed 47 40.4% 10.6% 18.4% 13.4% 13.4%
DSM-IV Bi-Polar II (Lifetime) Not Endorsed
837 35.8% 16.1% 19.5% 14.6% 14.0% 2.47 .650
Endorsed 5 60.0% 0% 20.0% 0.0% 20.0%
DSM-IV Hypomania (Lifetime) Not Endorsed
819 36.1% 16.2% 19.3% 14.3% 14.0% 2.40 .663
Endorsed 23 30.4% 8.7% 26.1% 21.7% 13.0%
ICD Dysthymia w/ hierarchy
(Lifetime)
Not Endorsed
818 35.9% 16.0% 19.6% 14.4% 14.1% .24 .993
Endorsed 24 37.5% 16.7% 16.7% 16.7% 12.5%
DSM-IV Panic Attack
(Lifetime)
Not Endorsed
617 35.8% 16.7% 19.6% 14.7% 13.1% 2.07 .723
Endorsed 225 36.4% 14.2% 19.1% 13.8% 16.4%
ICD Panic Attack (Lifetime) Not Endorsed
618 35.9% 16.5% 19.6% 14.9% 13.1% 1.96 .744
Endorsed 224 36.2% 14.7% 19.2% 13.4% 16.5%
DSM-IV Panic Disorder
(Lifetime)
Not Endorsed
788 36.0% 15.9% 20.1% 14.3% 13.7% 3.33 .504
Endorsed 54 35.2% 18.5% 11.1% 16.7% 18.5%
DSM-IV Gen Anxiety Disorder
w/hierarchy (LifeT)
Not Endorsed
800 36.1% 16.1% 19.9% 14.2% 13.6% 3.84 .428
Endorsed 42 33.3% 14.3% 11.9% 19.0% 21.4%
DSM-IV Oppositional Defiant Not Endorsed
600 35.5% 15.2% 19.7% 16.8% 12.8% 6.21 .184

98
Disorder w/ hierarchy (LifeT) Endorsed 57 31.6% 22.8% 21.1% 7.0% 17.5%
DSM-IV Hypomania (12
month)
Not Endorsed
825 36.1% 16.2% 19.3% 14.2% 14.2% 5.69 .224
Endorsed 17 29.4% 5.9% 29.4% 29.4% 5.9%
ICD Hypomania (12 month) Not Endorsed
806 36.0% 16.4% 19.4% 14.0% 14.3% 5.27 .261
Endorsed 36 36.1% 8.3% 22.2% 25.0% 8.3%
DSM-IV Bi-polar II (12Mo) Not Endorsed
838 35.9% 16.1% 19.5% 14.6% 14.0% 1.86 .762
Endorsed 4 50% 0% 25.0% 0.0% 25.0%
ICD Dysthymia with hierarchy
(12 month)
Not Endorsed
827 35.9% 16.0% 19.5% 14.6% 14.0% .87 .929
Endorsed 15 40.0% 20.0% 20.0% 6.7% 13.3%
ICD Conduct Disorder w/
hierarchy (12Mo)
Not Endorsed
634 35.3% 16.1% 19.9% 16.1% 12.6% 6.44 .169
Endorsed 23 30.4% 8.7% 17.4% 13.0% 30.4%
DSM-IV Gen Anxiety Disorder
w/hierarchy (12Mo)
Not Endorsed
823 36.1% 16.0% 19.6% 14.3% 14.0% .86 .930
Endorsed 19 31.6% 15.8% 15.8% 21.1% 15.8%
ICD Panic Disorder (12
month)
Not Endorsed
801 36.2% 16.0% 20.0% 14.1% 13.7% 4.93 .295
Endorsed 41 31.7% 17.1% 9.8% 22.0% 19.5%
DSM-IV Hypomania (30 day) Not Endorsed
838 35.9% 16.0% 19.6% 14.4% 14.1% 2.07 .722
Endorsed 4 50.0% 25.0% 0% 25.0% 0%
ICD Panic Disorder (30 day) Not Endorsed
825 36.1% 15.9% 19.6% 14.5% 13.8% 2.56 .635
Endorsed 17 29.4% 23.5% 11.8% 11.8% 23.5% *p < .05, **p < .01, ***p < .001
There are a number of significant results when analyzing those who have received welfare after the age of
18 as illustrated in table 22. Those who have not received welfare since the age of 18 are more likely to not
endorse the following illnesses. DSM-IV Panic Attack (1, N=3823) =137.88, p<.001 with a Phi coefficient of .170,
ICD Hypomania (1, N=4606) =42.20, p<.001 with a Phi coefficient of .094, DSM-IV Bi-Polar II(1, N=4757) =21.42,

99
p<.001 with a Phi coefficient of .067, DSM-IV Hypomania (1, N=4691) =29.45, p<.001 with a Phi coefficient of .079,
ICD Panic Attack (1, N=3817) =128.56, p<.001 with a Phi coefficient of .164, DSM-IV Panic Disorder (1, N=4604)
=45.47, p<.001 with a Phi coefficient of .098 and DSM-IV Generalized Anxiety Disorder (1, N=4631) =51.63,
p<.001 with a Phi coefficient of .104 over the course of the lifetime.
The same results are seen with ICD Hypomania (1, N=4675) =33.24, p<.001 with a Phi coefficient of .083,
DSM-IV Bi-Polar II (1, N=4757) =21.42, p<.001 with a Phi coefficient of .067, DSM-IV Hypomania (1, N=4720)
=18.97, p<.001 with a Phi coefficient of .063, ICD Dysthymia w/ hierarchy (1, N=4715) =12.24, p<.001 with a Phi
coefficient of .051, DSM-IV Generalized Anxiety Disorder (1, N=4714) =18.67, p<.001 with a Phi coefficient of .063,
ICD Conduct Disorder w/ hierarchy (1, N=2828) =4.85, p=.028 with a Phi coefficient of .041, ICD Panic Disorder (1,
N=4648) =30.18, p<.001 with a Phi coefficient of .080 at the 12 month mark and DSM-IV Hypomania (1, N=4760)
=24.08, p<.001 with a Phi coefficient of .071 and ICD Panic Disorder w/ hierarchy (1, N=4722) =21.08, p<.001 with
a Phi coefficient of .066 at the 30 day mark. All of the Phi coefficients illustrates very weak to weak associations
between the variables analyzed.
Table 22. Mental Illness by Received welfare/pub assistance since turning 18
Illness Total
Population Received welfare/pub assistance since
turning 18
No Yes χ2 P
value
ICD Hypomania (Lifetime)
Not
Endorsed 4606 77.5% 22.5%
42.20*** .000
Endorsed 168 56.0% 44.0%
DSM-IV Bi-Polar II (Lifetime) Not
Endorsed 4748 77.0% 23.0%
21.48*** .000
Endorsed 26 38.5 61.5%
DSM-IV Hypomania (Lifetime) Not
Endorsed 4691 77.2% 22.8%
29.45*** .000
Endorsed 83 51.8% 48.2%

100
ICD Dysthymia w/ hierarchy (Lifetime) Not
Endorsed 4684 77.1% 22.9%
14.42*** .000
Endorsed 90 60.0% 40.0%
DSM-IV Panic Attack (LifeT) Not
Endorsed 3823 80.3% 19.7%
137.88*** .000
Endorsed 951 62.4% 37.6%
ICD Panic Attack (Lifetime)
Not
Endorsed 3817 80.2% 19.8%
128.56*** .000
Endorsed 957 62.9% 37.1%
DSM-IV Panic Disorder (LifeT) Not
Endorsed 4604 77.5% 22.5%
45.47*** .000
Endorsed 170 55.3% 44.7%
DSM-IV Gen Anxiety Disorder w/hierarchy (LifeT) Not
Endorsed 4631 77.5% 22.5%
51.63*** .000
Endorsed 143 51.7% 48.3%
DSM-IV Oppositional Defiant Disorder w/ hierarchy
(LifeT)
Not
Endorsed 2714 74.3% 25.7%
3.06 .080
Endorsed 177 68.4% 31.6%
DSM-IV Hypomania (12 Mo) Not
Endorsed 4720 77.0% 23.0%
18.97*** .000
Endorsed 54 51.9% 48.1%
ICD Hypomania (12 month) Not
Endorsed 4675 77.3% 22.7%
33.24*** .000
Endorsed 99 52.5% 47.5%
DSM-IV Bi-polar II (12Mo) Not
Endorsed 4757 76.9% 23.1%
21.42*** .000
Endorsed 17 29.4% 70.6%
ICD Dysthymia with hierarchy (12 month) Not
Endorsed 4715 77.0% 23.0%
12.24*** .000
Endorsed 59 57.6% 42.4%
ICD Conduct Disorder w/ hierarchy (12Mo) Not 2828 74.2% 25.8% 4.85* .028

101
Endorsed
Endorsed 63 61.9% 38.1%
DSM-IV Gen Anxiety Disorder w/hierarchy (12Mo) Not
Endorsed 4714 77.0% 23.0%
18.67*** .000
Endorsed 60 53.3% 46.7%
ICD Panic Disorder (12 Mo) Not
Endorsed 4648 77.3% 22.7%
30.18*** .000
Endorsed 126 56.3% 43.7%
DSM-IV Hypomania (30 day) Not
Endorsed 4760 76.9% 23.1%
24.08*** .000
Endorsed 14 21.4% 78.6%
ICD Panic Disorder (30 day) Not
Endorsed 4722 77.0% 23.0%
21.08*** .000
Endorsed 52 50.0% 50.0% *p < .05, **p < .01, ***p < .001
Logistic Regressions
Logistic regressions were calculated to analyze predictors for gender, country of origin, age at immigration
and the number of years living in the U.S. on each illness among the Caribbean Black population in the dataset. I
attempted to weight the data but the point estimates did not change substantially. The significant outcomes will be
discussed.
The model predicting ICD Hypomania over a lifetime illustrated in table 23 is statistically significant. Being
from Trinidad and Tobago is significantly predicted the endorsement of hypomania (b= 1.737; p <.042; C.I. 1.063-
30.325) with those from that country having a higher endorsement for this disorder than Haitians. The age group
18-34 for time of immigration significantly predicted the endorsement of hypomania (b= -1.130; p <.047; C.I. .106-
.986).

102
Table 23. ICD Hypomania (Lifetime)
B S.E. Wald Sig. Exp (β)
Gender (male reference) -.177 .490 .131 .718 .838
Country (Haiti reference)
Jamaica .989 .804 1.512 .219 2.688
Trinidad & Tobago 1.737* .855 4.128 .042 5.678
Other .408 .924 .195 .659 1.504
Age of Immigration (>12 reference)
13-17 -.557 .724 .592 .442 .573
18-34 -1.130* .569 3.937 .047 .323
35+ -2.100 1.095 3.678 .055 .122
Years Living in US (<5 reference)
5-10 17.781 3633.366 .000 .996 ****
11-20 16.721 3633.366 .000 .996 ****
20+ 16.651 3633.366 .000 .996 ****
Constant -20.756 3633.366 .000 .995 .000
Model x2 18.792 (df=6: p=043)
Nagelkerke .113 *p < .05, **p < .01, ***p < .001, ****the odds ratio could not be estimated
The model predicting DSM-IV Panic Attack over a Lifetime illustrated in table 24 is statistically significant.
Being from Jamaica (b= .692; p =.014; C.I. 1.148-3.473), Trinidad and Tobago (b= 1.193; p <.001; C.I. 1.730-
6.284) and those from other Caribbean nations (b= .746; p =.012; C.I. 1.175-3.783) significantly predicted the
endorsement of DSM-IV Panic Attack with those from these countries having a higher endorsement for this
disorder than those from Haiti. There are no significant differences that exist regarding gender, age of immigration
or the number of years one has lived in the U.S.

103
Table 24. DSM-IV Panic Attack (Lifetime)
B S.E. Wald Sig. Exp (β)
Gender (male reference) .131 .191 .468 .494 1.140
Country (Haiti reference)
Jamaica .692 .282 6.005 .014* 1.997
Trinidad & Tobago 1.193 .329 13.147 .000*** 3.297
Other .746 .298 6.260 .012* 2.109
Age of Immigration (>12 reference)
13-17 -.030 .311 .009 .923 .970
18-34 -.332 .249 1.769 .184 .718
35+ -.498 .318 2.455 .117 .608
Years Living in US (<5 reference)
5-10 .463 .356 1.695 .193 1.589
11-20 .101 .335 .090 .764 1.106
20+ -.047 .333 .020 .887 .954
Constant -2.395 .444 29.046 .000 .091
Model x2 789.719 (df=10 p=.022)
Nagelkerke .037 *p < .05, **p < .01, ***p < .001
The model predicting ICD Panic Attack over a Lifetime illustrated in table 25 is statistically significant. Being
from Jamaica (b= .644; p =.020; C.I. 1.106-3.278), Trinidad and Tobago (b= 1.232; p <.001; C.I. 1.827-6.434) and
those from other Caribbean nations (b= .790; p =.006; C.I. 1.248-3.887) significantly predicted the endorsement of
ICD Panic Attack with those from these countries having a higher endorsement for this disorder than those from
Haiti. There are no significant differences that exist regarding gender, age of immigration or the number of years
one has lived in the U.S. for ICD Panic Attack over the course of a Lifetime.

104
Table 25. ICD Panic Attack (Lifetime)
B S.E. Wald Sig. Exp (β)
Gender (male reference) .200 .188 1.124 .289 1.221
Country (Haiti reference)
Jamaica .644 .277 5.405 .020* 1.904
Trinidad & Tobago 1.232 .321 14.710 .000*** 3.428
Other .790 .290 7.423 .006** 2.203
Age of Immigration (>12 reference)
13-17 .100 .302 .110 .740 1.105
18-34 -.308 .246 1.571 .210 .735
35+ -.396 .309 1.640 .200 .673
Years Living in US (<5 reference)
5-10 .515 .354 2.115 .146 1.674
11-20 .142 .335 .179 .672 1.152
20+ .099 .330 .090 .764 1.104
Constant -2.501 .440 32.257 .000 .082
Model x2 815.541 (df=10: p=.009)
Nagelkerke .041 *p < .05, **p < .01, ***p < .001
The model predicting ICD Panic Disorder for the last 12 months illustrated in table 26 is statistically
significant. Being in the U.S. for 20 or more years significantly predicted the endorsement of ICD Panic Disorder
with this group having a lower endorsement for this disorder than those living in the U.S. less than 5 years
countries. The research hypothesis for those living in the country longer experiencing higher rates of this disorder is
not supported. There are no significant differences that exist regarding gender, country of origin or age of
immigration for ICD Panic Disorder for the last 12 months.

105
Table 26. ICD Panic Disorder (12 month)
B S.E. Wald Sig. Exp (β)
Gender (male reference) -.213 .507 .177 .674 .808
Country (Haiti reference)
Jamaica 1.173 .815 2.069 .150 3.232
Trinidad & Tobago .858 1.024 .702 .402 2.359
Other .910 .857 1.127 .288 2.483
Age of Immigration (>12 reference)
13-17 2.078 1.088 3.649 .056 7.985
18-34 .204 1.124 .033 .856 1.226
35+ .597 1.190 .252 .616 1.817
Years Living in US (<5 reference)
5-10 -.544 .696 .610 .435 .581
11-20 -1.201 .704 2.912 .088 .301
20+ -1.526 .711 4.609 .032* .217
Constant -4.649 1.351 11.837 .001 .010
Model x2 152.835 (df=10: p=.035)
Nagelkerke .122 *p < .05, **p < .01, ***p < .001
The model predicting DSM-IV Oppositional Defiant Disorder w/ hierarchy over a lifetime illustrated in table
27 is statistically significant. Being from Trinidad and Tobago is significantly predicted the endorsement of DSM-IV
Oppositional Defiant Disorder w/ hierarchy (b= 1.983; p <.005; C.I. 1.814-29.118) with those from that country
having a higher outcome for this disorder than Haitians. The research hypothesis for those coming from
Anglophone countries experiencing lower rates of this disorder is not supported. The age group 18-34 for time of
immigration is significantly associated (b= -1.130; p <.047; C.I. .102-.974) and as a negative association, those who
immigrated during this time are less likely to endorse DSM-IV Oppositional Defiant Disorder w/hierarchy than who
immigrated before the age of 13. This could indicate that the age these individuals came to the U.S. means they
have not been here longer than those you came at younger ages and are therefore endorsing lower rates of DSM-

106
IV Oppositional Defiant Disorder w/hierarchy. It is important to note that those who immigrated even later, ages 35
and over have even lower odds of endorsing the illness than the reference group. The research hypothesis of living
in the U.S. longer will result in higher rates of mental illnesses is partially supported.
Table 27. DSM-IV Oppositional Defiant Disorder w/ hierarchy (LifeT)
B S.E. Wald Sig. Exp (β)
Gender (male reference) -.518 .403 1.651 .199 .596
Country (Haiti reference)
Jamaica .991 .677 2.141 .143 2.693
Trinidad & Tobago 1.983 .708 7.843 .005** 7.267
Other .933 .708 1.736 .188 2.542
Age of Immigration (>12 reference)
13-17 .255 .518 .243 .622 1.291
18-34 -1.154 .575 4.022 .045* .315
35+ -18.717 9545.483 .000 .998 .000
Years Living in US (<5 reference)
5-10 .297 .655 .206 .650 1.346
11-20 -.469 .677 .480 .488 .626
20+ -.388 .734 .279 .597 .678
Constant -3.105 .927 11.231 .001 .045
Model x2 204.010 (df=10: p=.010)
Nagelkerke .120 *p < .05, **p < .01, ***p < .001
The models predicting the following illnesses did not significantly predict the outcomes therefore, there are
no significant differences that exist regarding gender, the country of origin, age of immigration or the number of
years one has lived in the U.S. which is illustrated in tables 28-39: DSM-IV Hypomania Lifetime, ICD and DSM-IV
Hypomania over the last 12 months, DSM-IV Bi-Polar II Lifetime and 12 months, ICD Dysthymia w/ hierarchy
Lifetime and 12 months, DSM-IV Panic Disorder Lifetime and ICD Panic Disorder 30 days, DSM-IV Generalized
Anxiety Disorder w/hierarchy Lifetime and 12 months and ICD Conduct Disorder w/ hierarchy.

107
Table 28. DSM-IV Hypomania (Lifetime)
B S.E. Wald Sig. Exp (β)
Gender (male reference) .006 .742 .000 .993 1.006
Country (Haiti reference)
Jamaica 1.077 1.129 .910 .340 2.934
Trinidad & Tobago .828 1.429 .336 .562 2.288
Other .869 1.241 .490 .484 2.384
Age of Immigration (>12 reference)
13-17 16.250 2950.244 .000 .996 ****
18-34 16.874 2950.244 .000 .995 ****
35+ -.099 4150.370 .000 1.000 .906
Years Living in US (<5 reference)
5-10 17.215 3557.542 .000 .996 ****
11-20 16.578 3557.542 .000 .996 ****
20+ 16.015 3557.542 .000 .996 ****
Constant -38.365 4621.692 .000 .993 .000
Model x2 80.647 (df=10: p=.248)
Nagelkerke .140 *p < .05, **p < .01, ***p < .001, ****the odds ratio could not be estimated
Table 29. ICD Hypomania (12 month)
B S.E. Wald Sig. Exp (β)
Gender (male reference) -.456 .643 .503 .478 .634
Country (Haiti reference)
Jamaica .880 1.129 .608 .436 2.411
Trinidad & Tobago 1.830 1.168 2.454 .117 6.233
Other .674 1.235 .298 .585 1.963
Age of Immigration (>12 reference)
13-17 -1.109 1.152 .928 .336 .330
18-34 -1.058 .741 2.036 .154 .347
35+ -1.445 1.150 1.578 .209 .236

108
Years Living in US (<5 reference)
5-10 17.098 3661.162 .000 .996 ****
11-20 16.261 3661.162 .000 .996 ****
20+ 16.147 3661.162 .000 .996 ****
Constant -20.704 3661.162 .000 .995 .000
Model x2 102.388 (df=10: p=.471)
Nagelkerke .091 *p < .05, **p < .01, ***p < .001, ****the odds ratio could not be estimated
Table 30. DSM-IV Hypomania (12 month)
B S.E. Wald Sig. Exp (β)
Gender (male reference) -.058 .922 .004 .950 .944
Country (Haiti reference)
Jamaica .336 1.237 .074 .786 1.399
Trinidad & Tobago .799 1.432 .312 .577 2.224
Other .132 1.429 .008 .927 1.141
Age of Immigration (>12 reference)
13-17 .233 4446.022 .000 1.000 1.263
18-34 16.743 2984.668 .000 .996 ****
35+ .204 4203.594 .000 1.000 1.226
Years Living in US (<5 reference)
5-10 16.084 3474.845 .000 .996 ****
11-20 16.163 3474.845 .000 .996 ****
20+ 16.081 3474.845 .000 .996 ****
Constant -37.568 4580.697 .000 .993 .000
Model x2 54.307 (df=10 p=.564)
Nagelkerke .141 *p < .05, **p < .01, ***p < .001, ****the odds ratio could not be estimated

109
Table 31. DSM-IV Bi-Polar II (Lifetime)
B S.E. Wald Sig. Exp (β)
Gender (male reference) -.455 1.431 .101 .750 .634
Country (Haiti reference)
Jamaica 15.893 2252.767 .000 .994 ****
Trinidad & Tobago .296 3822.812 .000 1.000 1.344
Other .570 3071.545 .000 1.000 1.768
Age of Immigration (<12 reference)
13-17 .344 3598.623 .000 1.000 1.411
18-34 15.019 2405.224 .000 .995 ****
35+ -.568 3508.997 .000 1.000 .566
Years Living in US (<5 reference)
5-10 15.518 3101.324 .000 .996 ****
11-20 15.107 3101.324 .000 .996 ****
20+ .107 3505.870 .000 1.000 1.113
Constant -49.812 4525.292 .000 .991 .000
Model x2 19.304 (df=10: p=.480)
Nagelkerke .334 *p < .05, **p < .01, ***p < .001, ****the odds ratio could not be estimated
Table 32. DSM-IV Bi-polar II (12Mo)
B S.E. Wald Sig. Exp (β)
Gender (male reference) -.455 1.431 .101 .750 .634
Country (Haiti reference)
Jamaica 15.893 2252.767 .000 .994 ****
Trinidad & Tobago .296 3822.812 .000 1.000 1.344
Other .570 3071.545 .000 1.000 1.768
Age of Immigration (>12 reference)
13-17 .344 3598.623 .000 1.000 1.411
18-34 15.019 2405.224 .000 .995 ****
35+ -.568 3508.997 .000 1.000 .566

110
Years Living in US (<5 reference)
5-10 15.518 3101.324 .000 .996 ****
11-20 15.107 3101.324 .000 .996 ****
20+ .107 3505.870 .000 1.000 1.113
Constant -49.812 4525.292 .000 .991 .000
Model x2 19.304 (df=10: p=.480)
Nagelkerke .334 *p < .05, **p < .01, ***p < .001, ****the odds ratio could not be estimated
Table 33. ICD Dysthymia w/ hierarchy (Lifetime)
B S.E. Wald Sig. Exp (β)
Gender (male reference) 1.498 1.106 1.834 .176 4.474
Country (Haiti reference)
Jamaica 1.186 1.157 1.050 .306 3.272
Trinidad & Tobago -15.339 3305.041 .000 .996 .000
Other .627 1.243 .254 .614 1.872
Age of Immigration (>12 reference)
13-17 -.208 .945 .049 .825 .812
18-34 -1.562 .983 2.522 .112 .210
35+ -17.201 2761.568 .000 .995 .000
Years Living in US (<5 reference)
5-10 16.453 3364.373 .000 .996 ****
11-20 14.517 3364.373 .000 .997 ****
20+ 15.538 3364.373 .000 .996 ****
Constant -21.232 3364.373 .000 .995 .000
Model x2 69.384 (df=10: p=.170)
Nagelkerke .174 *p < .05, **p < .01, ***p < .001, ****the odds ratio could not be estimated

111
Table 34. ICD Dysthymia with hierarchy (12 month)
B S.E. Wald Sig. Exp (β)
Gender (male reference) 16.351 1625.468 .000 .992 ****
Country (Haiti reference)
Jamaica 1.168 1.495 .610 .435 3.215
Trinidad & Tobago -14.855 2914.373 .000 .996 .000
Other .085 1.471 .003 .954 1.088
Age of Immigration (>12 reference)
13-17 -.761 1.300 .342 .558 .467
18-34 -2.594 1.548 2.807 .094 .075
35+ -17.348 2441.083 .000 .994 .000
Years Living in US (<5 reference)
5-10 16.245 3152.077 .000 .996 ****
11-20 -1.296 3662.677 .000 1.000 .274
20+ 14.091 3152.077 .000 .996 ****
Constant -34.792 3546.511 .000 .992 .000
Model x2 36.218 (df=10: p=.101)
Nagelkerke .311
*p < .05, **p < .01, ***p <.001, ****the odds ratio could not be estimated
Table 35. DSM-IV Panic Disorder (Lifetime)
B S.E. Wald Sig. Exp (β)
Gender (male reference) -.351 .463 .572 .449 .704
Country (Haiti reference)
Jamaica .868 .688 1.592 .207 2.382
Trinidad & Tobago .860 .839 1.051 .305 2.363
Other .534 .749 .508 .476 1.705
Age of Immigration (>12 reference)
13-17 1.441 .821 3.082 .079 4.225
18-34 -.100 .829 .014 .904 .905
35+ -.010 .945 .000 .992 .990

112
Years Living in US (<5 reference)
5-10 .101 .669 .023 .880 1.106
11-20 -.564 .677 .695 .404 .569
20+ -1.295 .743 3.040 .081 .274
Constant -4.092 1.093 14.027 .000 .017
Model x2 179.827 (df=10: p=.091)
Nagelkerke .091 *p < .05, **p < .01, ***p < .001,
Table 36. ICD Panic Disorder (30 day)
B S.E. Wald Sig. Exp (β)
Gender (male reference) -.491 1.017 .233 .629 .612
Country (Haiti reference)
Jamaica 16.295 2484.044 .000 .995 ****
Trinidad & Tobago .137 4265.275 .000 1.000 1.147
Other 15.543 2484.044 .000 .995 ****
Age of Immigration (>12 reference)
13-17 .425 1.435 .088 .767 1.530
18-34 -.987 1.439 .470 .493 .373
35+ -.133 1.449 .008 .927 .875
Years Living in US (<5 reference)
5-10 15.879 3395.687 .000 .996 ****
11-20 15.802 3395.687 .000 .996 ****
20+ 14.741 3395.687 .000 .997 ****
Constant -35.893 4207.275 .000 .993 .000
Model x2 45.238 (df=10: p=.732)
Nagelkerke .007 *p < .05, **p < .01, ***p < .001, ****the odds ratio could not be estimated

113
Table 37. DSM-IV Generalized Anxiety Disorder w/hierarchy (LifeT)
B S.E. Wald Sig. Exp (β)
Gender (male reference) .431 .600 .516 .473 1.538
Country (Haiti reference)
Jamaica .427 .848 .254 .614 1.533
Trinidad & Tobago 1.077 .928 1.345 .246 2.935
Other .739 .878 .708 .400 2.093
Age of Immigration (>12 reference)
13-17 -17.549 3255.815 .000 .996 .000
18-34 -.545 .600 .823 .364 .580
35+ -1.616 1.121 2.077 .150 .199
Years Living in US (<5 reference)
5-10 17.398 3584.008 .000 .996 ****
11-20 16.479 3584.008 .000 .996 ****
20+ 16.608 3584.008 .000 .996 ****
Constant -21.033 3584.008 .000 .995 .000
Model x2 133.688 (df=10: p=.187)
Nagelkerke .099 *p < .05, **p < .01, ***p < .001, ****the odds ratio could not be estimated
Table 38. DSM-IV Gen Anxiety Disorder w/hierarchy (12Mo)
B S.E. Wald Sig. Exp (β)
Gender (male reference) .474 .854 .307 .579 1.606
Country (Haiti reference)
Jamaica .622 1.173 .281 .596 1.863
Trinidad & Tobago .598 1.432 .174 .676 1.819
Other .745 1.242 .360 .549 2.107
Age of Immigration (>12 reference)
13-17 -17.367 3229.136 .000 .996 .000
18-34 -1.332 .815 2.670 .102 .264
35+ -17.400 2891.815 .000 .995 .000

114
Years Living in US (<5 reference)
5-10 16.362 3470.335 .000 .996 ****
11-20 14.511 3470.335 .000 .997 ****
20+ 15.549 3470.335 .000 .996 ****
Constant -20.032 3470.335 .000 .995 .000
Model x2 71.094 (df=10: p=.262)
Nagelkerke .153 *p < .05, **p < .01, ***p < .001, ****the odds ratio could not be estimated
Table 39. ICD Conduct Disorder w/ hierarchy (12Mo)
B S.E. Wald Sig. Exp (β)
Gender (male reference) -1.404 .849 2.735 .098 .246
Country (Haiti reference)
Jamaica -1.094 1.243 .774 .379 .335
Trinidad & Tobago .805 1.036 .604 .437 2.236
Other -.031 1.024 .001 .976 .970
Age of Immigration (>12 reference)
13-17 -.245 1.035 .056 .813 .783
18-34 -1.205 1.072 1.262 .261 .300
35+ -17.216 9290.198 .000 .999 .000
Years Living in US (<5 reference)
5-10 -.406 1.444 .079 .779 .667
11-20 .027 1.257 .000 .983 1.027
20+ -.292 1.426 .042 .838 .747
Constant -2.993 1.563 3.666 .056 .050
Model x2 68.440 (df=10: p=.626)
Nagelkerke .111 *p < .05, **p < .01, ***p < .001

115
CHAPTER 5 DISCUSSION
The purpose of this research was to explore the heterogeneity of Blacks relative to differences in
manifestations of mental illnesses between U.S. born Blacks with and without Caribbean descent and Caribbean
born Blacks. Of primary concern were whether the nativity and generational status is impacting rates of mental
illnesses. The factors associated with mental health for Blacks in the U.S were assessed using a dataset that
included the largest sample of Caribbean Blacks compiled thus far in mental health research, the National Survey
of American Life (NSAL) obtained from the Inter-University Consortium for Political and Social Science Research
(ICPSR).
Historically, medical research about Black people presents this group as culturally homogeneous. This may
result in misleading results given their heterogeneity. Ignoring the differences within this group potentially impacts
diagnosis and the care given to the members of the subgroups and investigating these differences should be
deemed priority if the primary concern is to administer the best care to the various groups (Bhugra 2004; Brent and
Callwood 1993; Govia 2012; U.S. DHHS 2001; Williams & Harris-Reed 1999). To determine if differences exist,
several variables were analyzed including whether an individual was born in the U.S. or not, one’s country of origin
if not born in the U.S., generational status for Caribbean Blacks and the number of years one lived in the U.S. were
considered to determine these differences. Additional demographic variables such as gender, employment,
education, wealth (using homeownership and welfare usage as wealth indicators), length of residency in the U.S.,
age of immigration and country of origin were also explored to provide a clearer picture of how these variables can
impact rates of mental health.
As previously mentioned, the lack of research for the differences between groups of Blacks in America was
the impetus for this research study. The results of the study fill gaps in the literature about how groups of Blacks in
America differ as it relates to mental health. While literature has established the impact of some of the demographic

116
variables used in this study for other ethnic groups in the U.S., the limited research on the sub-groups of Blacks
has not investigated these elements at length. Furthermore, the lack of large samples of the sub-groups has
contributed to the lack of thorough research. This study seeks to fill in the gaps in the literature here as well.
Looking at Caribbean Blacks and their generational status, age at immigration, length of residency and country of
origin can now produce more generalizable results compared to previous research due in large part to the sample
size of this group in the NSAL dataset.
There are a number of significant findings that will be discussed at length in this chapter. Chi-square tests of
independence, correlations and logistic regressions were used to analyze the variables. The chi-square test is a
statistical test used to examine differences with categorical variables. A test of independence is used to determine
if observations on two variables are independent of each other. For this study, the illnesses are categorical with two
possible responses, endorsed and not endorsed. All of the selected illnesses were analyzed to see if another
categorical variable was related to the endorsement of the illness. Correlations were also used where appropriate
to determine if relationships existed between some of the variables. Lastly logistic regressions were also used to
determine the best statistical predictors of rates of mental illness.
U.S. Born vs. Caribbean Born Respondents
I hypothesized Caribbean born Blacks would have lower rates of mental illnesses than U.S. Born Blacks.
The null hypothesis was rejected and the research hypothesis was supported for all but one illness. Each illness is
dependent on where the respondents were born except for DSM-IV Bi-Polar II. All other illnesses at the lifetime, 12
month and 30 day marks illustrate significantly higher rates of endorsement for U.S. born respondents. These
findings support the research hypothesis that those born in the U.S. experience higher rates of mental illnesses.
This is in line with previous research that indicated those born in the U.S. experience higher rates of MDD than
those not born in the U.S. (Miranda et al 2005; Vega, Kolody, Aguilar-Gaxiola, Aldrete, Catalano & Caraveo-

117
Anduaga 1998; Williams et al 2007). This finding demonstrates that when considering mental illness diagnosis,
looking at where the client is born is an important consideration. Nobles states “The African-centered behavioral
change model specifically indicates that behavioral change occurs through a process of ‘culturalization’, wherein
the person minimizes negative social conditions and maximizes conditions that are pro-social and life affirming”
(2009). This could be an explanation for why Caribbean Blacks are endorsing lower rates of mental illnesses.
Looking at the length of time one resides in the U.S. when foreign born may shed further light on dynamics of
acculturation for Caribbean Blacks and how it relates to rates of mental illnesses.
Length of Residency in the U.S. Among Caribbean Blacks
I hypothesized rates of mental illnesses will increase the longer one resides in the U.S. The null hypothesis
was accepted as no significant results were found for these tests across all illnesses. However, it is important to
note that several illness did experience increases in rates of endorsement of illnesses the longer the Caribbean
population lived in the U.S. DSM-IV Bi-Polar II lifetime saw increases in percentages as follows 12.8%, 16.2%,
31.3% and 39.7% for each of the four categories, less than 5 years, 5-10 years, 11-20 years and more than 20
years respectively. ICD Dysthymia lifetime 12.8%, 16.2%, 31,3% and 62.5% and Generalized Anxiety Disorder
lifetime 12.8%, 15.8%, 30.9% and 3.1% also saw increases in percentages for the four categories. DSM-IV Panic
Attack, 11.2%, 20.3%, 31.5% and 37.1% and Panic Disorder at the lifetime mark saw increases as well 12.7%,
15.9%, 31.4% and 39.7%. DSM-IV Hypomania 12 months and DSM-IV Hypomania 30 days 12.8%, 16.2%, 31.3%
and 39.7% showed increases in a similar pattern to the aforementioned disorders. While not significant findings,
these patterns provide evidence that the longer one resides in the U.S. indicates a greater period of time exposed
to minority status and chronic stressors (Miranda et al 2005; Vega et al 1998) as well as acculturation which is
positively associated with increased risks for mental illnesses (Lang, Munoz, Bernal & Sorenson 1982; Masten,
Penland & Nayani 1994; Neff & Hoppe 1993).

118
Generational Status and Rates of Mental Illnesses
There are a number of significant outcomes when we examine generational status and rates of mental
illnesses. I hypothesized that Caribbean Blacks who are 1st generation in the U.S. will have lower rates of mental
illnesses than 2nd generation Caribbean Blacks. The first generation was significantly more likely to not endorse
the disorder than the second generation for the following illness: At the lifetime mark, ICD and DSM-IV Hypomania,
DSM-IV Bi-polar II, ICD and DSM-IV Panic Attack, DSM-IV Generalized Anxiety Disorder, DSM-IV Panic Disorder;
at the 12 month mark, ICD and DSM-IV Hypomania, and ICD Conduct Disorder w/ hierarchy; at the 30 day mark,
DSM-IV Hypomania and ICD Panic Disorder. The null hypothesis is rejected and the research hypothesis is
supported for these illnesses. These results are supported by previous research which indicated first generation
Blacks were less likely to experience Major Depressive Disorder (Miranda et al 2005 & Williams et al 2007) and
lifetime psychiatric disorders (Vega, Kolody, Aguilar-Gaxiola, Aldrete, Catalano & Caraveo-Anduaga 1998). These
findings could also support the theory of acculturation used in this research. Because those who have lived in the
U.S. and the Caribbean are experiencing lower rates of mental illnesses, the argument can be made that those
who have only lived in the U.S. have experienced more acculturation and this could be attributed to the higher rates
of mental illnesses. Waters (1999) suggest that the success of Caribbean Blacks comes from several sources.
First, they have an enthusiastic attitude toward work, they come with transferable qualifications and their
expectations of race relations allows them to navigate the American racial structures better. These elements in
addition to having high expectations of Blacks as their experiences back in their country was one where Blacks are
in high positions aids in their success which could be staving off mental illnesses to some degree. However,
Waters also notes that persistent racism creates experiences where this resiliency and attitude towards success
deteriorates leaving subsequent generations to fare much like their Black counterparts who do not have Caribbean
ancestry. Recent research supports health advantages among immigrants decreases with each generation after
immigration (Williams and Sternthal 2010).

119
Country of Origin
It was important to look at which Caribbean country participants were born in as it relates to speaking
English to determine if rates of illness are impacted when they do not speak English. The impetus being those who
do not speak English will have a more difficult time acclimating to U.S. given its official language is English. The
resulting stress could be a factor in increased rates in mental illnesses. I hypothesized those participants from
Anglophone countries, countries that primarily speak English, will have lower rates of mental illnesses. The
Anglophone countries included in the study were Jamaica and Trinidad and Tobago. The Francophone country
included is Haiti. There were a few disorders that had significant results. These are DSM-IV Panic Attack, ICD
Panic Attack and DSM-IV Oppositional Defiant Disorder w/ hierarchy at the lifetime mark. For the first two illnesses,
the significance was found with the English speaking countries of Jamaica and Trinidad as well as the fourth other
category. All of these categories were significantly more likely to endorse these illnesses than Haitians. For DSM-
IV Oppositional Defiant Disorder w/ hierarchy at the lifetime mark, the significance was found with Trinidad &
Tobago. Those from this country were more significantly more likely to endorse this illness than the other countries.
As such, the null hypothesis cannot be rejected and the research hypothesis is not supported. The idea that if one
speaks the language of the country they have migrated to, navigating the health care system, finding and
corresponding possible symptoms with doctors and following treatment plans would be easier and thus results in
better mental health. However, this is not supported given the findings. When looking at ICD and DSM-IV Panic
Attacks, the Acculturation stress model posited by Gilbert & Cervantes, Holck and Warren, Smith, & Rochat, , it is
possible that those who come from countries where they do not speak or it is not their primary or official language
do not acculturate as quickly as those who speak English. This lack of acculturation could then be serving as a
buffer or protective factor much like those who have spent less time in the U.S.

120
Education
The dataset included three variables that allowed for the exploration of the impact of education on mental
illnesses. The first is having a high school diploma or an equivalent and because I hypothesized higher levels of
education will result in lower rates of mental illnesses, I expected for those with a high school diploma or equivalent
to have endorsed the illnesses less than those that did not. The null hypothesis was rejected for some disorders
but not others. DSM-IV Panic Disorder and DSM-IV Generalized Anxiety Disorder w/hierarchy at the lifetime mark,
ICD Dysthymia with hierarchy and ICD Panic Disorder at the 12 month mark and ICD Panic Disorder at the 30 day
mark all illustrated that those with a high school diploma will experience significantly less rates of these disorders
than those who do not. When analyzing whether having a high school diploma and if the respondent was born in
the U.S. or not impacted rates of mental illnesses, we see slightly different results. The same illnesses that were
significant when looking at the entire Black population were also significant for U.S Blacks but no illnesses were
significant for Caribbean Blacks. This suggests U.S. born Blacks who have a high school diploma or equivalent are
significantly less likely to endorse these illnesses. A high school diploma or equivalent is independent of mental
illnesses for Caribbean Blacks. Despite the lack of significant results, it should be noted that Caribbean Blacks
consistently endorsed all of the illnesses less than U.S. Blacks which lends support for the research hypothesis that
Caribbean Blacks experience lower rates of mental illnesses when the same level of education is attained.
Investigating the impact of having a college degree on rates of mental illnesses resulted in only ICD
Dysthymia with hierarchy at the 12 month mark being significant for the entire Black population. The research
hypothesis that having more education will result in lower rates of mental illnesses is not supported so we cannot
reject the null hypothesis when we look at the entire Black population in the dataset. When we include ethnic origin
and earning college degrees, ICD Panic Disorder at the 12 month and 30 day levels illustrate significant results but
only for the Caribbean population. The numbers of those who did not endorse this disorder were significantly higher

121
when they had a college degree. With this disorder and this segment of the Black population, we can reject the null
hypothesis. It is also important to note similar percentages of endorsement were found when analyzing the
attainment of a college degree as we saw when endorsing the illnesses and having a high school diploma or
equivalent. Although not significant, Caribbean Blacks who earned college degrees consistently endorsed all of the
illnesses less than U.S. Blacks who earned college degrees which lends support for the research hypothesis that
Caribbean Blacks experienced lower rates of mental illnesses than their U.S. born counterparts.
Correlates for the number of years of education were able to be computed with the illnesses to determine if
there was a relationship between them. DSM-IV Bi-Polar II, DSM-IV Hypomania, ICD Dysthymia w/ hierarchy,
DSM-IV Panic Attack, ICD Panic Attack, DSM-IV Panic Disorder, ICD Conduct Disorder, and DSM-IV Generalized
Anxiety Disorder at the lifetime mark, DSM-IV Bi-Polar II, DSM-IV Hypomania, ICD Conduct Disorder, ICD Panic
Disorder and DSM-IV Generalized Anxiety Disorder at the 12 month mark and ICD Panic Disorder at the 30 day
mark are all significant and illustrated a positive correlation. However, the results were not as expected. As the
years of completed school increased so did the likelihood of endorsing these disorders. These results do not
support the research hypothesis and the null hypothesis could not be rejected. Based on prior research, the
expectation was higher levels of education could serve to impact health outcomes by making information easier to
process resulting in more health conscious individuals and by improving the efficiency of treatment. The efficiency
of treatment can happen in two ways, by reducing the time before help is sought or by aiding the individual in
following prescribed therapy more accurately (Chevalier and Feinstein 2006). This theory is not supported by the
findings of my study. It is possible that increased education allows for individuals to better understand issues of
inequitable opportunity and discrimination faced by Blacks in the U.S. which can result in additional stress and
ultimately decreased mental well-being. It is also possible that the experience of attaining higher education itself
embodies struggles that include stress and discrimination which can also lead to decreased mental well-being for
Blacks (Grasgreen 2011).

122
Gender
The first set of analysis that included gender looked at the entire Black population to determine if there were
differences in the rates of mental illnesses based on gender. I hypothesized that females will have lower rates of
mental illnesses. There were significant findings among some of the illnesses however the null hypothesis could
not be rejected as females were more likely to endorse the illness than males for each illness showing significant
results. ICD Dysthymia with hierarchy, DSM-IV Panic Attack, ICD Panic Attack, DSM-IV Panic Disorder, and DSM-
IV Generalized Anxiety Disorder with hierarchy over the course of their lifetime, ICD Dysthymia with hierarchy, ICD
Conduct Disorder with hierarchy, Generalized Anxiety Disorder with hierarchy, and ICD Panic Disorder at the 12
month mark and ICD Panic Disorder in the last 30 days were all significant. There is research indicating females
are more likely to respond to stressful situations with affective disorders like anxiety and mood disorders (Hill &
Needham 2013) which explains the majority of the significant findings here. Researchers Hill and Needham
(2013) indicate males are more likely to respond to stressful situations with conduct disorders however, the findings
for ICD Conduct Disorder do not reflect this.
When ethnic origin is included to determine if differences between genders within the two groups exist, a
number of significant findings surfaced. ICD Dysthymia w/ hierarchy, DSM-IV Panic Attack, ICD Panic Attack,
DSM-IV Panic Disorder and DSM-IV Generalized Anxiety Disorder w/hierarchy were all significant for the U.S. born
population with females more likely to endorse the illness than males. ICD Dysthymia with hierarchy, DSM-IV
Generalized Anxiety Disorder w/hierarchy and ICD Panic Disorder in the past 12 months and ICD Panic Disorder at
the 30 day mark yielded the same interaction for females in the U.S. born population. These findings are all
supported by the aforementioned research with Hill and Needham (2013) where these illnesses are more common
among females. There were no significant findings for gender and the rates of mental illnesses in the Caribbean
population which indicates the two variables are independent of each other.

123
Employment
The two employment variables analyzed to determine if employment impacts rates of mental illnesses for
U.S. born and Caribbean Blacks were working for pay at the present time and the number of hours worked for pay
in a week. The null hypothesis was not rejected as there are no significant findings when the entire Black sample
was analyzed in relation to being employed at the present time.
When analyzing being employed at the present time and ethnic origin, the null hypothesis was not rejected
as there are no significant findings for any illness. Because unemployment has been shown to adversely impact
mental well-being (Paul & Moser 2006), being employed was thought to have reduced rates of mental illness for
respondents. However, the research hypothesis is not supported in this situation. All of the illnesses are
independent of the variable employed at the present time for both groups.
There were a number of significant findings when looking at the number of hours for all Black respondents that
worked for pay. I hypothesized higher rates of employment will correspond with lower rates of mental illnesses. In
this situation, the more hours worked will result in the lower rates of mental illnesses. The research hypothesis was
not supported and the null hypothesis could not be rejected for some of the illnesses as the opposite of what I
hypothesized is indicated. DSM-IV Hypomania, ICD Panic Attack, DSM-IV Panic Disorder, DSM-IV Generalized
Anxiety Disorder w/hierarchy, DSM-IV Oppositional Defiant Disorder w/ hierarchy over the course of the lifetime,
ICD Hypomania, DSM-IV Bi-polar II, ICD Conduct Disorder w/ hierarchy, DSM-IV Gen Anxiety Disorder w/hierarchy
and ICD Panic Disorder at the 12 month mark and ICD Panic Disorder at the 30 day mark have significant results
but demonstrated a positive relationship which illustrated that as the number of hours worked per week increases,
so do the rates of mental illnesses. ICD Dysthymia w/ hierarchy and DSM-IV Panic Attack also had significant
results but there was a negative relationship such that as the hours worked increase the number of endorsements

124
for these disorders decreased over the course of the lifetime. The research hypothesis is partially supported by
these findings.
There is some support in research that stressful workplace conditions may be a causal factor in the onset of
depressive symptoms (Kivimaki, Hotoph & Hnederson 2010) however further exploration into the nature of the
workplace for the respondents would be necessary to begin investigating this relationship for the illnesses
presented in this study that illustrated a positive relationship between number of hours worked and the illness.
When including ethnic origin to determine if there are differences between the groups and the number of
hours worked and rates of mental illnesses, I hypothesized higher rates of employment will correspond with lower
rates of mental illnesses. The Caribbean population was analyzed first. DSM-IV Hypomania, ICD Panic Attack,
DSM-IV Panic Attack, Dysthymia w/ hierarchy, DSM-IV Panic Disorder, DSM-IV Generalized Anxiety Disorder, ICD
Conduct Disorder w/ hierarchy and DSM-IV Oppositional Defiant Disorder over the course of the lifetime, ICD
Hypomania and DSM-IV Bi-polar II over the last 12 months and ICD Panic Disorder for the last 30 days show
significant results with a positive relationship to number of hours worked. This again meant as the number of hours
increased, the likelihood of endorsing the disorders for the Caribbean population also increased. Based on these
results, the null hypothesis is not rejected and the research hypothesis is not supported for the Caribbean born
respondents.
The results of the correlates for the U.S. born Black population showed DSM-IV Hypomania, ICD Dysthymia
w/ hierarchy, ICD Panic Attack, DSM-IV Panic Attack, DSM-IV Generalized Anxiety Disorder and DSM-IV
Oppositional Defiant Disorder over the course of the lifetime, ICD Hypomania and DSM-IV Bi-polar II, ICD Conduct
Disorder w/ hierarchy, DSM-IV Gen Anxiety Disorder w/hierarchy and ICD Panic Disorder over the last 12 months
and ICD Panic Disorder for the last 30 days showed significant results of a positive relationship to number of hours
worked. The null hypothesis is not rejected and the research hypothesis is not supported for the U.S. born

125
respondents as the results indicate that as the number of hours worked increased so did the endorsement of the
illnesses listed above.
Further analysis should be conducted to determine how the number of hours, if broken into more meaningful
sections is related to the rates of diagnoses. For instance an analysis of part time, full-time and over-time should be
conducted to see how the number of hours worked relates to the rates of endorsement of the mental illnesses. It is
possible that what we are seeing here is hours above full time is yielding this positive relationship with mental
illnesses for the entire Black sample and for both populations.
Home Ownership
There were only a few variables that allowed for the analysis of wealth as it relates to mental illnesses. One
of these variables is if there is a mortgage on the home indicating home ownership. The idea that owning one’s
home is a positive indicator of wealth is how this variable was used. I hypothesized that higher rates of
homeownership will result in lower rates of mental illnesses. When investigating the entire Black sample, ICD Panic
Attack and DSM-IV Panic Attack over the course of the lifetime were shown to be significant but of those that
endorsed the disease the percentage was much higher for those who owned their home than those who do not.
The null hypothesis was not rejected for this variable and the research hypothesis was not supported. Home
ownership was independent of mental illnesses for the remaining illnesses.
When analyzing the role of ethnic origin and home ownership, ICD Panic Attack and DSM-IV Panic Attack at
the lifetime level were significant for U.S. born Blacks however the null hypothesis could not be rejected because
those that owned a home were significantly more likely to endorse the illness. Again the research hypothesis was
not supported and home ownership was independent of mental illnesses for the remaining illnesses for U.S. born
Blacks and for all illnesses for Caribbean Blacks. Explanations for why these results were found could be the
financial burden of caring for a home which extends beyond that of renting a home or apartment impacts rates of

126
mental illnesses. Williams et al (1992) found most racial differences in mental illness can be accounted for by
factors of socioeconomic status. Indeed, some researchers have found Blacks with low socioeconomic status have
higher rates of distress (Kessler & Neighbors 1986, Ulbrich, Warheit & Zimmerman 1989). These researchers
acknowledge there are multiplicative effects of being poor and Black which results in higher rates of distress.
Because these research studies look at Blacks as a homogeneous group versus Whites, the findings of this study
may illustrate that differences between these sub-groups do indeed exist although further investigation into
variables indicating wealth need to be conducted.
Welfare and Government Housing Assistance
Another indicator of socioeconomic status is welfare usage. Additional analyses were run to determine if an
association with the use of welfare or government assistance impacts rates of mental illnesses. The variables used
to analyze this are living in public housing, if respondents pay low/no rent, the number of total years received public
assistance since age 18 and how much time received welfare before turning 18. I hypothesized those on welfare
and government assistance would have higher rates of mental illnesses.
The results for those who do not live in public housing are more likely to not endorse DSM-IV Panic Attack,
ICD Panic Attack and DSM-IV Panic Disorder than those that do but they are also more likely to endorse the
illnesses as well over the course of the lifetime. The same was true for ICD Conduct Disorder w/ hierarchy over the
last 12 months. Researchers acknowledge violence is more prevalent in neighborhoods of low SES residents
(Buka, Stichick, Birdthistle, & Felton 2001) which could understandably result in symptoms of Panic Attacks and
Panic Disorder such as a sense of imminent danger or impending doom and an urge to escape as well a feeling of
losing control. This could explain why we are seeing lower rates of endorsement for those who do not live in public
housing. The remaining illnesses were independent of living in public housing. The research hypothesis is partially
supported by these findings.

127
Over the course of the lifetime, those who do not pay low/no rent through government assistance are more
likely to not endorse DSM-IV Panic Attack and ICD Panic Attack than those that do but they are also more likely to
endorse the illness as well. The research hypothesis is partially supported for these illnesses.
Those not receiving low/no rent through government assistance are also significantly more likely to not
endorse the following disorders: over the course of the lifetime, DSM-IV Panic Disorder and DSM-IV Generalized
Anxiety Disorder, over the last 12 months ICD Panic Disorder and in the last 30 days, ICD Panic Disorder and
DSM-IV Hypomania were significant. In addition to understanding Panic Attack and Panic Disorder among people
living in low SES neighborhoods, Generalized Anxiety Disorder also has symptoms that can be a normal part of
living in a high stress situation due to increased violence. The relevant symptoms for this illness are excessive
worry and anxiety. A lack of financial resources which can be a consistent factor for these individuals could also
play a factor in manifesting these symptoms. The persistent irritable mood symptom of Hypomania could be why
we are also seeing less endorsement among those who do not receive no/low rent through government assistance
for this illness. Irritability may very well be a normal part of life if there are unmet needs due to a lack of funds. The
null hypothesis is rejected and the research hypothesis supported for these illnesses. The remaining illnesses are
independent of paying low or no rent through government assistance.
Respondents who received welfare before the age of 18 were analyzed to see if there was an impact on
mental illnesses. The null hypothesis could not be rejected nor is the research hypothesis supported as there were
no significant differences for those who received welfare before 18 and those that did not for any of the mental
illnesses analyzed. We may be seeing these results because children are not usually a part of the decision making
when it comes to finances so they may not be fully aware of the challenges entailed with this aspect of life.
Therefore, the long lasting impact was minimal.

128
Those who have not received welfare since the age of 18 were also analyzed and are more likely to not
endorse the following illnesses: DSM-IV Panic Attack, ICD Hypomania, DSM-IV Bi-Polar II, DSM-IV Hypomania,
ICD Panic Attack, DSM-IV Panic Disorder and DSM-IV Generalized Anxiety Disorder over the course of the
lifetime, ICD Hypomania, DSM-IV Bi-Polar II, DSM-IV Hypomania, ICD Dysthymia w/ hierarchy, DSM-IV
Generalized Anxiety Disorder, ICD Conduct Disorder w/ hierarchy, ICD Panic Disorder at the 12 month mark and
DSM-IV Hypomania and ICD Panic Disorder w/ hierarchy at the 30 day mark. The null hypothesis is rejected and
the research hypothesis supported for this variable.
As a whole, those not receiving welfare or government assistance for housing has significant findings that
indicated they were endorsing mental illnesses significantly lower than those receiving these benefits. In the one
case where this was not true, those receiving welfare before the age of 18, the impact of receiving this aid prior to
becoming an adult may have had a negligible impact versus being an adult and experiencing the stress of requiring
this kind of support. The overall findings were supported by previous research as Poussaint (1990) stated while
poverty doesn’t result in poor mental health, it is a major contributing factor and unemployment rates are the most
critical indicators of U.S. economic influence of the mental health of Blacks. Since the receipt of welfare is
oftentimes contingent on the lack of employment, we may be seeing the impacts of that in these findings. Myers
(1982) claims poverty is an illness producing state as a result of constant pressures from a lack of resources which
mainly affects people of color.
Logistic Regression Models
Logistic regressions were calculated to analyze predictors for gender, country of origin, age at immigration
and the number of years living in the U.S. on each illness among the Caribbean Black population in the dataset.
The variables were recoded so males, Haitians, immigration before the age of 13 and less than 5 years living in the
U.S. are the reference categories. The Haitian population became the preferred choice for the reference category

129
given it is the only distinct category where the official language was not English. Of the other three categories, 2
were English speaking nations and the third is a mixture of unidentified Caribbean nations that may or may not be
English speaking. There were only a few significant predictors for a limited number of illnesses.
ICD Hypomania (Lifetime)
The model analyzing ICD Hypomania over a lifetime is statistically significant. Being from Trinidad and
Tobago significantly predicted the endorsement of ICD Hypomania with those from that country having a higher
endorsement for this disorder than Haitians. The research hypothesis for those coming from Anglophone countries
experiencing lower rates of this disorder is not supported. This was also the case when the analysis of country of
origin and the rates for ICD Hypomania were conducted. Those from the Anglophone country Jamaica had the
highest rates of endorsement for that analysis and now those from another English speaking nation, Trinidad and
Tobago, had significantly higher rates than those from Haiti. When considering the symptoms of the illness,
(elevated mood, an increase in energy and activity, feelings of well-being and efficiency in both mental and physical
capacity, increased sociability, talkativeness, over-familiarity, sexual energy, and a decreased need for sleep) it
would appear that one would desire this diagnosis particularly because these symptoms do not lead to severe
disruption of work or result in social rejection. The DSM-IV characteristics of Hypomania is similar but also includes
that these behaviors can lead to painful consequences however, DSM-IV Hypomania was not statistically
significant. Of these nations, Haiti is the most financially challenged. Because many immigrants work and send
money back to family members living in their country of origin, it is possible that Haitians do not allow themselves
the luxury of feeling the symptoms of Hypomania and instead keep their head down and work to send more money
to their country of origin. Because Jamaica and Trinidad and Tobago are wealthier (that is not to say they are
wealthy), family members may not feel the need to send as many resources to their country of origin and can
therefore more fully enjoy the opportunities in the U.S. for self-gain. The age group 18-34 for time of immigration
130
significantly predicted the endorsement of ICD Hypomania and suggested that those who immigrated during this
time are less likely to endorse ICD Hypomania than who immigrated before the age of 13. This could indicate that
the age these individuals came to the U.S. means they have not been here longer than those who came at younger
ages and have therefore not experienced as much effects of acculturation and are endorsing lower rates of ICD
Hypomania. It is important to note that those who immigrated even later, ages 35 and over have even lower rates
of endorsement and the results approached significance. The research hypothesis of living in the U.S. longer will
result in higher rates of mental illnesses is supported.
DSM-IV Panic Attack (Lifetime) & ICD Panic Attack (Lifetime)
The model predicting DSM-IV Panic Attack over a lifetime is statistically significant. Being from Jamaica,
Trinidad and Tobago and those from other Caribbean nations significantly predicted the endorsement of DSM-IV
Panic Attack and ICD Panic Attack over the course of the respondents’ lifetime with those from these countries
having a higher endorsement for this disorder than those from Haiti. The research hypothesis for those coming
from Anglophone countries experiencing lower rates of these disorders is not supported. When reviewing the
symptoms of the disorder, intense fear or discomfort accompanied by a sense of imminent danger or impending
doom and an urge to escape, there may be a difference in where Haitians have chosen to reside that does not
place them in precarious situations where fear or discomfort is present. Investigating this may prove useful in
understanding the differences we are seeing here. It does not appear that the native language from the country of
origin plays a role with the manifestation of the symptoms of this disorder.
ICD Panic Disorder (12 months)
The model predicting ICD Panic Disorder for the last 12 months is statistically significant. Being in the U.S.
for 20 or more years significantly predicted the endorsement of ICD Panic Disorder with this group having a lower

131
endorsement for this disorder than those living in the U.S. less than 5 years countries. Because the symptoms of
this disorder feel very much like a heart attack and the majority of the Caribbean Blacks in this study came to the
U.S between ages of 18-34, the portion of the population indicating a significant relationship with Panic Disorder
has been living here for 20 years or more, it is possible that what is being endorsed as Panic Disorder is actually
physical precursors to a heart attack. The age demographic would better fit the physical profile for medical
ailments. The research hypothesis for those living in the country longer experiencing higher rates of this disorder is
not supported.
DSM-IV Oppositional Defiant Disorder w/ Hierarchy (Lifetime)
The model predicting DSM-IV Oppositional Defiant Disorder w/ hierarchy over a lifetime is statistically
significant. Being from Trinidad and Tobago is significantly predicted the endorsement of DSM-IV Oppositional
Defiant Disorder w/ hierarchy with those from that country having a higher outcome for this disorder than Haitians.
The research hypothesis for those coming from Anglophone countries experiencing lower rates of this disorder is
not supported. Understanding when and with whom the patterns of negativistic, defiant, disobedient, and hostile
behavior toward authority figures which persists for at least 6 months would be helpful in determining why this
disorder is appearing in those from Trinidad and Tobago. Looking at family and work dynamics may prove useful.
Because this disorder does have a distinction of with hierarchy, there is no potential that other disorders are also at
play here as well. This would indicate we cannot look to another disorder to explain the symptoms so other areas of
their lives must be more fully explored. The age group 18-34 for time of immigration is significantly associated and
as a negative association. This suggests those who immigrated during this time are less likely to endorse DSM-IV
Oppositional Defiant Disorder w/hierarchy than who immigrated before the age of 13. This could indicate that the
age these individuals came to the U.S. means they have not been here longer than those you came at younger
ages and are therefore experiencing less acculturative effects thus they are endorsing lower rates of DSM-IV

132
Oppositional Defiant Disorder w/hierarchy. It is important to note that those who immigrated even later, ages 35
and over have even lower odds of endorsing the illness than the reference group. The research hypothesis of living
in the U.S. longer will result in higher rates of mental illnesses is partially supported.
Overall, the regression models only showed significance with a few illnesses. Of these illnesses, we see
patterns of those coming from Anglophone countries endorsing the illnesses more than those that came from the
Francophone country. We also see that those who immigrate to the U.S. later in life endorse illness less than those
who immigrate earlier in their lives.
Doyle et al (2013) highlights the risk of mental illnesses increases with acculturation. It is possible that
Haitians speaking French and Creole has provide a buffer from acculturative effects and even helped them
maintain cultural traditions that do the same. A similar effect may be seen with those who live in the U.S. less than
those who are here longer. Less time living in the U.S. equals less opportunity to be negatively impacted by
acculturation.

133
CHAPTER 6
CONCLUSION
The objective of this study was to contribute to the growing body of research on the mental health profiles of
U.S. born Blacks, U.S. born Blacks of Caribbean descent and Caribbean Blacks by analyzing relationships
between mental illnesses and nativity and generational status, ethnic origin, length of residency in the U.S and age
of immigration. In addition to this, several demographic variables are also analyzed which help provide a clearer
picture of how various areas of U.S. life impact rates of mental illnesses for these groups. This is particularly
important due to the growth and presence of these groups in the U.S.
The findings expand upon previous knowledge of mental illnesses among Black sub-groups. There are clear
differences in rates of mental illnesses for those born in the U.S. compared to those born in the Caribbean. Bi-Polar
II was the only illness that did not demonstrate significant results where U.S. born Blacks has higher rates mental
illnesses than Caribbean Blacks. Although no significant results were found for length of residency, results suggest
that the longer one lives in the U.S. as an immigrant, the higher the endorsement of mental illnesses. Those born in
the Caribbean are less likely to endorse mental illnesses than those of Caribbean descent born in the U.S.
Theoretically, these findings are supported by the bicultural model of acculturation where maintenance of the
traditional culture posited by Buriel et al (1982) could be yielding better psychological results for first generation
Caribbean Blacks.
I did not find support for lower rates of mental illnesses for Caribbean immigrant born in English speaking
countries. Again, the bicultural model of acculturation could explain that speaking ones native language is a part of
maintaining one culture and is acting as a buffer to yield better psychological results (Buriel, Calzada, & Vasquez,
1982). Education has a relationship with some illnesses which demonstrates that those with a high school diploma
are less likely to endorse illnesses for the general population and for U.S. Blacks but not for Caribbean Blacks.
Only one illness is significant for the entire Black population when a college degree is earned and only two are

134
significant for the Caribbean population but none are for the U.S. born Black group. Those who earned a college
degree in the Caribbean population are more likely to not endorse the illnesses. Years of school completed
indicates the more years completed the greater the likelihood to endorse the illnesses for Blacks in general. In
Merton’s (1957) Social Structure and Anomie, he theorized that issues can occur when there are discrepancies
between expectations and aspirations. Perhaps those with high school diplomas and college degrees have high
aspirations and are achieving educationally but their expectations in terms of success are not being met.
Overall, females were more likely to endorse illnesses and U.S. born females were more likely to endorse
illnesses. No significant findings were found for the Caribbean population. Only one illness was significant when
looking at home ownership for the entire sample and the results illustrated that those who owned their home were
more likely to endorse the illness. The same result was apparent for U.S. Blacks but there were no significant
results for the Caribbean group. Not receiving welfare demonstrated less likelihood to endorse mental illnesses
except for those who received welfare before turning 18. No significant findings were illustrated for that group.
Overall, the regression models only showed significance with a few illnesses and the Caribbean portion of
the sample population. Of these illnesses, we see patterns of those coming from Anglophone countries endorsing
the illnesses more than those that came from the Francophone country. We also see that those who immigrate to
the U.S. later in life endorse illness less than those who immigrate earlier in their lives. Recognizing the symptoms
required to be present for diagnosis of any of the researched illnesses to occur allowed for a deeper understanding
of how and why these particular illnesses may interact with any of the variables present in this study. A more in
depth and detailed analysis will prove useful in understanding each illness which in turn would better prepare the
mental health community to diagnose and treat the heterogeneity among groups of Blacks in the U.S. All of the
findings presented, significant or not have contributed to the body of literature investigating mental illnesses among
Blacks and the sub-groups within Blacks.

135
Limitations
There are questions of validity that were not addressed in the dataset but deserve mention. For instance,
there are high numbers of Black males incarcerated across the U.S. nation who because of budgetary restraints,
were not able to participate in the NSAL data. As a result, males between18-34 may not be as well represented in
the dataset. In an attempt to rectify this, the researchers conducted a pilot study designed to determine if
respondents would divulge information about household members who do not live at home, i.e., college students,
nursing homes and incarcerated individuals. The study found that respondents are likely to give this type of
information (Jackson, Neighbors, Neese, Trierweiler and Torres 2004). The Caribbean population had high refusal
rates after 9/11 due to fears about immigration status. To deal with this, the primary investigators spoke on talk
shows in cities where participation was anticipated to be high given the number of Caribbean Blacks located there
to increase respondent participation (Jackson et al 2004). Other limitations are threats of historical validity such that
the political and economic climate as it relates to race is not addressed. By this I mean, what are the effects of
social projects like ghettoization, gentrification, excessive incarceration, chronic unemployment and notions like the
declining significance of race (Wilson 1980) on the mental well-being of Blacks living in the U.S. Also worth
mentioning is the socialization process by which racial identity develops in the United States which includes social
projects like ghettoization (Omi and Winant 1994). The desire to conform to Eurocentric ideals such that some
participants may identify themselves as something other than an individual of African descent could also lead to
underrepresentation of the Blacks in the study. The dataset could also suffer from immigrant respondents
underreporting symptoms due to fear about their residency status.
Because the definitions of the disorders came from the Diagnostic and Statistical Manual-IV (DSM-IV) and
International Statistical Classification of Diseases and Related Health Problem (ICD_10) and the World Health
Composite International Diagnostic Interview (WHO-CIDI) we are limited in understanding disease from a viewpoint

136
that may not support Blacks in the U.S. There are African-centered psychologists who argue that the definitions of
mental health and mental illnesses for Blacks in the U.S. differ significantly from how the bodies mentioned above
define disease (Akbar 1981; Kambon 1998).
Future Research
The present study has contributed to the body of literature that explains patterns of mental health among
sub-groups of Blacks in the U.S. When we consider the findings of this study, there are a few areas where future
research would be advantageous. Further investigation into why we may be seeing increases in rates of mental
illnesses the longer an immigrant lives in the U.S. will yield insight in how to diagnose and treatment immigrant
populations residing in the U.S. for extended periods of time. Looking at elements of acculturation as it relates to
rates of mental illnesses is certain to be revealing.
The NSAL dataset has variables that would allow for further investigation in language use such as creole
where future research can offer explanations of its use possibly serving as a barrier to negative impacts of
acculturation and/or negative manifestations of mental health. Investigating this would provide some clarity on
whether this is serving foreign born Blacks as well as other foreigners who do not speak English some measure of
protection against mental illnesses. Being able to discern if language is impacting how one acculturates would also
be helpful in understanding patterns of mental illness.
Further investigation of how employment impacts rates of mental illnesses would be fruitful. One approach
could be analyzing the number of hours worked broken into categories such as part-time, full-time and longer than
full-time hours worked may allow for meaningful indicators to appear. For instance, we may see very few hours and
many hours above full-time related to higher levels of mental disorder.

137
When looking at welfare usage as a poverty indicator, we see that using welfare services as an adult does
indicate higher rates of endorsing mental illnesses. However, because an income variable was not available,
further research could determine if the subgroups are attainting different levels of wealth to ascertain if there is
more variation that what we are seeing here.
Some research indicates discrimination that took place primarily in the workplace is what contributed to
mental illnesses, specifically depression and anxiety (Pernice, 1996). As a result, future research that investigates
workplace discrimination for Blacks and the sub-groups would be enlightening.
A number of other exploratory studies can be utilized to further understand the role of various aspects of life
in the U.S. on rates of mental illnesses. Music, technology, cultural support systems along with what aside from
potentially acquiring a new language and culture is involved in the acculturation process that could be negatively or
positively impact rates of mental illnesses would be interesting and informative studies.
Finally, future studies should investigate intra-Caribbean differences if the medical community is to
adequately tap into the realities of Caribbean ethnicities in the U.S. The failure to do so could be detrimental to
advancements in health care research (Govia 2012).

138
REFERENCES
Adebimpe, V.W. (1994). Race, racism, and epidemiological surveys. Hospital & Community Psychiatry, 45, 27-31.
Akbar, N. 2003. Akbar Papers in African Psychology. Tallahassee, FL: Mind Productions & Associates.
Akbar, N. 1981. Mental disorder among African Americans. Black Books Bulletin, 7(2)
Akinyela, Makungu. 1995. Rethinking Afrocentricity: The Foundation of a Theory of Critical Afriocentricity in Culture
and Difference: Critical Perspectives on the Bicultural Experience in the United States. Westport, CT: Bergin
& Garvey.
Alegría, M., Chatterji, P., Wells, K., Cao, Z., Chen, C., Takeuchi, D., Jackson, J.S., Meng, X. 2008. Disparity in
Depression Treatment Among Racial and Ethnic Minority Populations in the United States. Psychiatric
Services, 59: 1264 - 1272.
Aneshensel, Carol. 1999. Outcomes of the Stress Process. Pp. 211-227 in Carol S. Aneshensel and Jo C. Phelan
(eds.), Handbook of the Sociology of Mental Health. New York: Kluwer Academic/ Plenum Publishers.
American Psychiatric Association. (1994). Diagnostic and statistical manual of mental disorders (4th ed.). Washington, DC: Author.Atdjian S, Vega W. 2005. Disparities in Mental Health Treatment in US Racial and Ethnic Minority Groups: Implications for Psychiatrists. Psychiatric Services. 56:12;1600-1602.
Berry, J.W., Kim, U., Minde, T., Moke, D. 1987. Comparative Studies of Acculturative Stress. International
Migration Review. 21. No 3. Special Issue: Migration and Health.
Bhugra, D., Hilwig, M., Hossein, B., Marceau, H., Neehall, J. Leff, J. Mallett, R. Der, G. 1996. First-Contact
Incidence Rates of Schizophrenia in Trinidad and One-Year Follow-Up. British Journal of Psychiatry . 169.
587- 592.
Bhugra, Dinesh 2004 Migration distress and cultural identity, Section of Cultural Psychiatry, Institute of Psychiatry,
London, UK. British Medical Bulletin 2004; 69: 129–141. British Medical Bulletin, Vol. 69 © The British
Council 2004

139
Bhugra, D., Leff, J., Mallett, R., Der, G., Corriddan, B. and Rudge, S. 1997. Incidence and outcome of
schizophrenia in Whites, African-Caribbeans and Asians in London. Psychological Medicine. 27:791-798
Cambridge University Press.
Bhugra, D. and Bhui, K. 2001. African–Caribbeans and schizophrenia: contributing factors. Advances in
Psychiatric Treatment . 7: 283-291.
Bhui K., Stansfield S., Hull S., Priebe S., Mole F., Feder G. 2003. Ethnic variation in pathways to and use of
specialist mental health services in the UK. British Journal of Psychiatry. 182:105–116.
Blazer D., Kessler R., McGonagle K. and Swartz M. 1994. The Prevalence and Distribution of Major Depression in a
National Community Sample: The National Comorbidity Survey, Am J Psychiatry, Vol. 151, 979-986
Borrell, L. N., Lynch J. W., Neighbors H., Burt B.A., Gillespie B.W. 2002. Is there homogeneity in periodontal
health between African Americans and Mexican Americans? Ethnicity Disease. 12:97–110.
Bouvier, L and Simcox, D. 1986. Many Hands, Few Jobs: Population, Unemployment and Emigration in Mexico
and the Caribbean. Center for Immigration Studies.
Brent, J. E., Callwood, G.B. 1993. Culturally Relevant Psychiatric Care: The West Indian as a Client. Journal of
Black Psychology. 19:3. 290-302.
Broman, C., Neighbors, H.W., Delva, J., Torres, M., Jackson, J.S. (2008). Prevalence of DSM-IV Substance Use
Disorders Among African Americans and Caribbean Blacks in the National Study of American Life. American
Journal of Public Health, 98:1107-1114.

140
Buka S., Stichick, T., Birdthistle, I., Felton, E. 2001. Youth Exposure to Violence: Prevalence, Risks, and
Consequences. American Journal of Orthopsychiatry. 71(3).
Buriel, R., Calzada, S., and Vasquez, R. 1982. The Relationship of Traditional Mexican American Culture to
Adjustment and Delinquency among Three Generations of Mexican American Male Adolescents. Hispanic
Journal of Behavioral Sciences. 4(41)
Burnam, M., Hough, R., Escobar, J., Karno, M., Timbers, D., Telles, B. & Locke, C. 1987. Six-Month Prevalence of
Specific Psychiatric Disorders among Mexican Americans and Non-Hispanic Whites in Los Angeles.
Archives of General Psychiatry. 44.
Caldera, S. and Piper-Bach, Paige. 2006. Immigration Policy in the United States. February. Congressional Budget
Office.
Chevalier, Arnaud & Feinstein, Leon, 2006. "Sheepskin or Prozac: The Causal Effect of Education on Mental
Health," IZA Discussion Papers 2231, Institute for the Study of Labor (IZA).
Cohen, C., F. Berment, C. Magai. 1997. A Comparison of US-born African-American and African-Caribbean
Psychiatric Outpatients. Journal of the National Medical Association. 89:117-123.
Crowder, K. & Tedrow, L. 2001. West Indians and residential landscape of New York. In: Nancy Foner, Islands in
the City: West Indian Migration to New York. Berkeley: University of California Press.
Cuellar, I. 2000. Acculturation and Mental Health: Ecological Transactional Relations of Adjustment. In Cuellar, I. &
Paniagua, F. ed. Handbook of Multicultural Mental Health. CA: Academic Press.
Dawson, Deborah 1998. Beyond Black, White and Hispanic: Race, Ethnic Origin and Drinking Patterns in the
United States. Journal of Substance Abuse. 10:4, 321-339.
del Pilar, J. A., & Udasco, J. O. (2004). Deculturation: Its Lack of Validity. Cultural Diversity And Ethnic Minority
Psychology, 10(2), 169-176.
Doyle O., Joe S., Caldwell C. 2012. Ethnic Differences in Mental Illness Mental Health Service Use Among Black
141
Fathers, American Journal of Public Health, Vol. 102,
Fabrega H. Cultural relativism and psychiatric illness. 1989. Journal of Nervous and Mental Disease. 177:415-25.
Foener, N. and Fredrickson, G.M. 2004. Not Just Black and White: Historical and Contemporary Perspectives on
Immigration, Race and Ethnicity in the United States. Russell Sage Foundation Publications.
Foreign-Born Make Up a Growing Segment of the U.S. Population. 2002. Population Today. Population Reference
Bureau Publication.
George, Linda K., and Scott M. Lynch. 2003. “Race Differences in Depressive Symptoms.” Journal of Health and
Social Behavior 44 (3):353-369.
Ghaffarian S. 1998. The Acculturation of Iranian Immigrants in the United States and the Implications for Mental
Health, The Journal of Social Psychology, Vol. 138, 5, 645-654
Gonzalez, H. M., Croghan, T., West, B., Williams, D., Nesse, R., Tarraf, W., Taylor, R., Hinton, L., Neighbors, H.,
Jackson, J. (2008) Antidepressant Use in Black and White Populations in the United States. Psychiatric
Services.; 59: p. 1131-1138.
Gordon, Lewis R. 2007. Thinking about identities: Black peoples, Race labels, and ethnic consciousness. In Yoku
Shaw-Taylor & Steven A. Tuch (eds.), The Other African Americans: Contemporary African and Caribbean
Immigrants in the United States. New York: Rowman & Littlefield Publishers.
Govia, I. 2012. Angle of View: Heterogeneity in the Caribbean Community in the U.S. 2005-2007. Social and
Economic Studies. 61:4
Ghaffrarian, S. 1987. The Acculturation of Iranians in the U.S. The Journal of Social Psychology. 127, 565-571
Gilbert, M. & Cervantes, R. 1986. Patterns and Practices of Alcohol Use among Mexican Americans: A
Comprehensive Review. Hispanic Journal of Behavioral Sciences. 8(1).
Grasgreen, A. 2011. Student Stress: Whose Is Worst? Inside Higher Ed
Graves, T. 1967. Acculturation, Access, and Alcohol in a Tri-Ethnic Community. American Anthropologist. 69(3/4).
142
Haines, V. A., and Hulbert, J. S. 1992. “Network Range and Health.” Journal of Health and Social Behavior
33:254-266.
Harrison, G., C. Glazebrook, J. Brewin, R. Cantwell, T. Dalkin, R. Fox, P. Jones, I. Medley. 1997. Increased
Incidence of Psychotic Disorders in Migrants from the Caribbean to the United Kingdom. Psychological
Medicine. 27:799-806.
Harrison G., Owens D., Holton A., Nielson D., Boot D. 1988. A prospective study of severe mental disorder in Afro-
Caribbean patients. Psychological Medicine. 18:643–657.
Heron, Melaine. 2001. The New Americans: The Occupational Attainment of Caribbean Immigrants in the United
States, Canada and England. LFB Publishing Company
Hickling, F.W., and Rodgers-Johnson, P. 1995. The incidence of first contact schizophrenia in Jamaica. British
Journal of Psychiatry. 167, 193 - 196.
Hill, T., Needham, B. 2013. Rethinking Gender and Mental Health: A Critical Analysis of Three Propositions. Social
Science & Medicine. 92.
Hirschman, Charles & Lee, Jennifer C. Race and Ethnic Inequality in Educational Attainment in the United States
in Ethnicity and Casual Mechanisms edited by Marta Tienda and Michael Rutter. New York: Cambridge
University press.
Himle , J.A., Muroff, J.R., Taylor, R.J., Baser, R.E., Abelson, J.M., Hanna, G.L., Abelson, J.L., Jackson, J.S. 2008
Obsessive-compulsive disorder among African Americans and blacks of Caribbean descent: results from
the national survey of American life. Depression and Anxiety
Holck, S., Warren, C., Smith, J. & Rochat, R. 1984. Alcohol Consumption among Mexican American and Anglo Women: Results of a Survey Along the U.S.-Mexico Border. Journal of Studies on Alcohol. 45(2).
Hutchinson, G., Takei, N., Faye, T.A., Bughra, D., Gilvarry, C., Moran, P., Mallett, R., Sham, P., Leff, J. and

143
Murray, R.M. 1996. Morbid Risk of Schizophrenia in First-Degree Relatives of White and African-
Caribbean Patients with Psychosis. British Journal of Psychiatry. 169. 776-780.
"ICD-10 Version:2010." ICD-10 Version:2010. N.p., n.d. Retrieved from
http://apps.who.int/classifications/icd10/browse/2010/en January 30, 2014.
Jackson, J. S., Torres, M., Caldwell, C. H., Neighbors, H. W., Nesse, R. M., Taylor, R. J., Trierweiler, S. J.,
Williams, D. R. (2004). The National Survey of American Life: A study of Racial, Ethnic, and
Cultural Influences on Mental Disorders and Mental Health. International Journal of Methods in
Psychiatric Research, 13(4):196-207.
Jackson, J. S., Neighbors, H. W., Nesse, R. M., Trierweiler, S. J., & Torres, M. 2004. Methodological Innovations
in the National Survey of American Life. International Journal of Methods in Psychiatric Research,
13(4):289-298.
James, Winston. ND. The History of Afro-Caribbean Migration to the United States, in The Schomburg Center, ed.,
In Motion: The African American Migration Experience. Retrieved September 23, 2010 from
http://www.inmotionaame.org/texts/index.cfm;jsessionid=f830583971285451310085?migration=10andtopic=99andtype=textandbhcp=1
Kambon, K. 1998. African psychology in the American context. Tallahassee: Nubian Nation Press.
Kasinitz, P. (1993). Caribbean New York: Black Immigrants: The Politics of Race. New York: Cornell, University
Press.
Kessler, R., Abelson, J., Demler, O., Escobar, J., Gibbon, M., Guyer, M., Howes, M., Jin, R., Vega, W.,
Walters, E., Wang, P., Zaslavsky, A., Zheng, H. (2004). Clinical Calibration of DSM-IV Diagnoses in the
World Mental Health (WMH) Version of the World Health Organization (WHO) Composite International
Diagnostic Interview (CIDI). The International Journal of Methods in Psychiatric Research.13(2).

144
Kessler, R. C., McGonagle, K. A,. Zhao, S., Nelson, C. B., Hughes, M. Eshleman, S., Wittchen, H. U. and Kendler,
K. S. 1994. “Lifetime and 12-month prevalence of DSM-III-R psychiatric disorders in the United States.
Results from the National Comorbidity Survey.” Archives of General Psychiatry. 51:1
Kessler R., Mickelson K. and Williams D. 1999. The Prevalence, Distribution, and Mental Health Correlates of
Perceived Discrimination in the United States, Journal of Health and Social Behavior, Vol. 40, No. 3. pp.
208-230.
Kessler, Ronald and Harold Neighbors. 1986. “A New Perspective on the Relationships among Race, Social Class
and Psychological Distress.”Journal of Health and Social Behavior. 27:2.
King, M., Coker, E., Leavey, G., Hoare, A., Johnson-Sabine, E. 1994. Incidence of psychotic illness in London:
comparison of ethnic groups. British Medical Journal. 309:1115-9.
Kivimäki, M., Hotopf, M. & Henderson, M. 2010. Do stressful working conditions cause psychiatric disorders?
Occupational Medicine. 60 (2).
Lang, J., Munoz, R., Bernal, G. & Sorenson, J. 1982. Quality of Life and Psychological Well-Being in a
Bicultural Latino Community. Hispanic Journal of Hispanic Sciences. 4: 433
Karen D. Lincoln, Linda M. Chatters, Robert Joseph Taylor, James S. Jackson, 2007. Profiles of depressive
symptoms among AA and CBs Social Science & Medicine 65 (2007) 200–213.
Locke, B. Z., Kramer, M., Pasamanick, B. 1960. Immigration and insanity. Public Health Rep. 75:301–306.
Logan, John R. 2007. Who Are the Other African Americans? Contemporary African and Caribbean Immigrants in
the United States. In Yoku Shaw-Taylor & Steven Tuch (eds.), The Other African Americans: Contemporary
African and Caribbean Immigrants in the United States. New York: Rowman & Littlefield Publishers.
Lorick-Wilmot, Y. S. 2010. Creating Black Caribbean ethnic identity [electronic resource] El Paso [Tex.] : LFB
Scholarly Pub., 2010.
Lum, T. & Vandereaa, J. 2010. Health Disparities among Immigrant and non-Immigrant Elders: The Association of

145
Acculturation and Education. Journal of Immigrant and Minority Health. 12: 743-753
Mahoney, Annette. M. 2004. The Health and Social Well-Being of Caribbean Immigrants in the United States. NY:
Haworth Press.
Mahy, G., Mallett, R., Leff, J., Bhugra, D. 1999. First-contact incidence rate of schizophrenia on Barbados. British
Journal of Psychiatry. 175.
Marsella, A. & Yamada, M. 2000. Culture and Mental Health: An Introduction and Overview of Foundations,
Concepts, and Issues. In Cuellar, I. & Paniagua, F. ed. Handbook of Multicultural Mental Health. CA:
Academic Press.
Masten, W., Penland, E. & Nayani, E. 1994. Depression and Acculturation in Mexican-American Women.
Psychological Reports. 75: 1499-1503.
McAdoo, H., Younge, S., Getahun, S. 2007. Marriage and Family Socialization among Black Americans and
Caribbean and African Immigrants. in Shaw-Taylor, Y., Tuch, S. ed. The Other African American:
Contemporary African and Caribbean Immigrants in the United States. New York: Rowman and Littlefield
Publishers, Inc.
McCabe, Kristen 2011 Caribbean Immigrants in the United States Migration Policy Institute Retrieved 8/13/2013
http://www.migrationinformation.org/usfocus/display.cfm?ID=834#top
McCabe, R and Priebe, S. 2004. Explanatory models of illness in schizophrenia: comparison of four ethnic groups.
British Journal of Psychiatry, 185.
McLean, Carl., Catherine Campbell, Flora Cornish. 2003. African-Caribbean interactions with mental health
services in the UK: Experiences and Expectations of Exclusion as (re)productive of Health Inequalities.
Social Science & Medicine. 34:141-149.
Melfi, C., T. Croghan, M. Hanna, and R. Robinson. 2000. "Racial Variation in Antidepressant Treatment in a
Medicaid Population." Journal of Clinical Psychiatry 61:16-21.

146
Merton, R. 1957. Social Structure and Anomie. In Social Theory and Social Structure. NY:Free Press
Miranda, J., Siddique, J., Belin, T.R. & Kohn-Wood, L.P. 2005. Depression prevalence in disadvantaged young
Black women: African and Caribbean immigrants compared to US-born African Americans. Social
Psychiatry and Psychiatric Epidemiology. 40:253–258.
Mirowsky J. and Ross C. 1992. Age and Depression, Journal of Health and Social Behavior, Vol. 33, No. 3, pp.
187-205,
Mui, A. 1996. Depression among Elderly Chinese Immigrants: An Exploratory Study.
Social Work, 41: 633-645
Model S. 2008. The Secret of West Indian Success, Springer Science & Business Media, LLC
Myers, H. F. 1982. “Stress, Ethnicity and Social Class: A Model for Research with Black Populations.” In Jones and
Korchin (Eds.), Minority Mental Health. New York: Praeger Publishers
Neff, J. & Hoppe, S. 1993. Race/Ethnicity, Acculturation and Psychological Distress: Fatalism and Religiosity as
Cultural Resources. Journal of Community Psychology. 21:3-20
Neighbors, H. W., Caldwell, C., Williams, D. R., Nesse, R., Taylor, R. J., Bullard, K. M., Torres, M., Jackson, J. S.
2007. Race, Ethnicity, and the Use of Services for Mental Disorders: Results From the National Survey of
American Life. Archives of General Psychiatry. 64.
Nguyen, L. & Peterson, C.1993. Depressive Symptoms among Vietnamese-American College Students. The
Journal of Social Psychology. 133:1. 65-71
Nicassio, P. 1985. The Psychosocial Adjustment of the Southeast Asian Refugee: An Overview of Empirical
Findings and Theoretical Models. Journal of Cross-Cultural Psychology. 16:153
Nicassio, P; Solomon, G., Guest, S. & McCullough, J. 1986. Emigrations Success and Language Proficiency as
Correlates of Depression in a Sample of Southeast Asian Refugees. International Journal of Social
Psychiatry. 32:22.

147
Nobles,W., Goddard, L., & Gilbert, D. (2009). Culturecology, women, and African-Centered HIV prevention. Journal of Black Psychology, 35, (2), 228-246.
Omi, M. & Howard Winant. 1994. Racial Formation in the United States: From the 1960’s to the 1990’s. 2nd ed.
New York: Routledge.
Paul K., Moser K. 2009. Unemployment impairs mental health: Meta-analyses. Journal Of Vocational Behavior.
74(3).
Pearlin, L. I., M. A. Lieberman, E. G. Menaghan, & J. T. Mullan. 1981. The Stress Process. Journal of Health and
Social Behavior 22: 337-356.
Pearlin, L.I., 1999. The stress process revisited: Reflections on concepts and their interrelationships, in C.S.
Aneshensel and Phelan, J., (Eds.), Handbook on The Sociology of Mental Health, New York: Plenum Press,
395-415.
Pernice, R. 1996. Refugees’ and Immigrants’ Mental Health: Association of Demographic and Post-Immigration
Factors. Journal of Social Psychology. 136(4), 511-519.
Portes, A., & Zhou, M. 1993. The new second generation: Segmented assimilation and its variants. Annals of the
American Political and Social Sciences, 530.
Poussaint, Alvin. 1990. “The Mental Health Status of Black Americans, 1983” Pp. 17-52 in Handbook of Mental
Health and Mental Disorder Among Black Americans, edited by D. Ruiz. New York, NY: Greenwood Press.
Rasgoti, S., Johnson, T., Hoeffel, E., Drewery Jr., M. 2011. The Black Population 2010: The 2010 Census Briefs.
Retrieved February 12, 2012
http://www.census.gov/prod/cen2010/briefs/c2010br-06.pdf
Riolo s., Nguyen T., Greden J., and King C. 2005. Prevalence of Depression by Race/Ethnicity: Findings From the
National Health and Nutrition Examination Survey III, Research and Practice, Peer Reviewed, American
Journal of Public Health, Vol 95, No. 6

148
Robins L. & Regier D. eds. Psychiatric Disorders in America: The Epidemiologic Catchment Area Study. New York:
The Free Press, 1991.
Rollman, B., Hanusa B., Belnap B., Gardner W., Cooper L., Schulberg H. 2002. Race, quality of depression care,
and recovery from major depression in a primary care setting, General Hospital Psychiatry 24, 381–390
Ruiz, D. 1990. “Social and Economic Profile of Black Americans, 1989” Pp. 3-15 in Handbook of Mental Health and
Mental Disorder Among Black Americans, edited by D. Ruiz. New York, NY: Greenwood Press.
Selten, JP, JP Slaets, RS. Kahn. 1997. Schizophrenia in Surinamese and Dutch Antillean Immigrants to the
Netherlands: Evidence of an Increased Incidence. Psychological Medicine. 27:807-811.
Sharav, V. H. 2000. UK life blamed for ethnic schizophrenia. Retrieved October 2, 2010 from
http://www.hartford-hwp.com/archives/28/063.html
Sharpley, M., G. Hutchinson, K. McKensie, R. M. Murray. 2001. Understanding the excess of psychosis among the
African-Caribbean population in England. British Journal of Psychiatry. 40:S60-S80.
Simcox, D. 1995. The Caribbean Immigration Centrifuge: A Portent Of Continued Immigration Growth. Retrieved
September 23, 2010 from http://www.npg.org/footnote/carribean_centrifuge.htm
Sowell, Thomas. 1978. "Three Black Histories." In Essays and Data on American Ethnic Groups, ed. Thomas
Sowell. Washington, DC: Urban Institute.
Streele R. 1978, Relationship of Race, Sex, Social Class, and Social Mobility to Depression in Normal Adults, The
Journal of Social Psychology, 104, 37-47
Takeuchi, D., Alegria, M., Jackson, J., Williams, D. (2007) "Immigration and mental health: Diverse findings in
Asian, Black, and Latino populations." American Journal of Public Health, 97, (1): 11-12.
Takeuchi, D., R. Chung, K. Lin, H. Shen, K. Kurasaki, C. Chun and S. Sue. 1998. Lifetime and twelve-month
prevalence rates of major depressive episodes and dysthymia among Chinese Americans in Los Angeles.
American Journal of Psychiatry, 115:1407-14.

149
Ulbrich P., Warheit G. and Zimmerman R. 1989. Race, Socioeconomic Status and Psychological Distress: An
Examination of Differential Vulnerability, Journal of Health and Social Behavior, Vol 30, Issue 1, 131-146
Unützer J., Katon W. and Callahan C. 2002. Collaborative Care Management of Late-Life Depression in the
Primary Care Setting: A Randomized Controlled Trial, American Medical Association, Vol. 288, No. 22:
2836-2845, http://jama.ama-assn.org/cgi/content/full/288/22/2836
U.S. Census Bureau. 2013. International Migration is Projected to Become Primary Driver of U.S. Population
Growth for First Time in Nearly Two Centuries. Retrieved from
http://www.census.gov/newsroom/releases/archives/population/-89.html October 30, 2013
U.S. Department of Health and Human Services. 2001. Mental Health: Culture, Race and Ethnicity-A Supplement
to Mental Health: A Report of the Surgeon General-Executive Summary. Rockville, MD: U.S.
Department of Health and Human Services, Public Health Service, Office of the Surgeon General.
U.S. Department of Health and Human Services. 1999. Mental Health: A Report of the Surgeon General—
Executive Summary. Rockville, MD: U.S. Department of Health and Human Services, Substance Abuse and
Mental Health Services Administration, Center for Mental Health Services, National Institutes of Health,
National Institute of Mental Health.
Üstün, T. B., Ayuso-Mateos J., Chatterji L. S., Mathers, C., and Murray, C. J. L. 2004. Global burden of depressive
disorders in the year 2000. British Journal of Psychiatry. 184: 386-392.
Van Os J., D. Castle, N. Takei, G. Der, R. M. Murray. 1996. Psychotic Illness in Ethnic Minorities: Clarification from
the 1991 census. Psychological Medicine. 27:203-208.
Vega, W.A, Kolody, B., Aguilar-Gaxiola, S., Alderete, E., Catalano, R., Caraveo-Anduaga J. 1998. Lifetime
Prevalence of DSM-lll-R Psychiatric Disorders among Urban and Rural Mexican Americans in California.
Archives of General Psychiatry. 55:771-778.
Vega W., Kolody B., Aguilar-Gaxiola S., Alderete E.Catalano R., Caraveo-Anduaga J. 1998. Lifetime Prevalence of

150
DSM-III-R Psychiatric Disorders Among Urban and Rural Mexican Americans in California. Arch Gen
Psychiatry. Vol 55, 771-778 http://archpsyc.jamanetwork.com
Vega, W.A. Kolody, B., Valle, J.R. 1987. Migration and Mental Health: An Empirical Test of Depression Risk
Factors of Immigrant Mexican Women. International Migration Review. 21. No 3. Special Issue:
Migration and Health.
Versola-Russo, J. 2006. Cultural and Demographic Factors of Schizophrenia. International Journal of
Psychosocial Rehabilitation. 10 (2), 89-103 .
Warheit G., Holzer C., Schwab J. 1973. An analysis of social class and racial differences in depressive
symptomatology: A community study. Journal of Health & Social Behavior. 14
Warheit, G.J., Holzer III, C.E., & Arey, S.A. 1975. Race and mental illness: An epidemiologic update. Journal of
Health Social Behavior, 16(3), 243-255.
Waters, Mary C. 1999. Black Identities: West Indian Immigrant Dreams and American Realities. New York and
Cambridge: Russell Sage Foundation and Harvard University Press.
Waters, Mary, and Karl Eschbach. 1995. "Immigration and Ethnic and Racial Inequality in United States." Annual
Review of Sociology 21, no. 1
Williams, David, David Takeuchi, and Russell Adair. 1992. “Socioeconomic Status and Psychiatric Disorder among
Blacks and Whites.” Social Forces. 71:1
Williams, D. R., Harris-Reid, M. 1999. Race and mental health: Emerging patterns and promising approaches. In:
A. Horwitz, and T.L. Scheid (Eds.) A Handbook for the Study of Mental Health. New York: Cambridge
University Press. 295-314.
Williams, David & James Jackson. 2000. Race/Ethnicity and the 2000 Census: Recommendations for African
American and other Black Populations in the United States. American Journal of Public Health. 90: 1728-
1730.

151
Williams, D. R., Haile, R., Gonzalez, H. M., Neighbors, H. W., Baser, R. & Jackson, J. S. 2007. The Mental Health
of Black Caribbean Immigrants: Results from the National Survey of American Life. American Journal of
Public Health, 97(1): 52-59.
Williams, D., Gonzalez, H., Neighbors, H., Neese, R., Abelson, J., Sweetman, J,. Jackson, J. 2007. Prevalence and
Distribution of Major Depressive Disorder in African Americans, Caribbean Blacks, and Non-Hispanic
Blacks: Results from the National Survey of American Life. Archives of General Psychiatry. 64.
Williams, D. & Sternthal, M. 2010. Understanding Racial-ethnic Disparities in Health: Sociological Contributions.
Journal of Health and Social Behavior. 51.
Wilson, William J. 1980. The Declining Significance of Race: Blacks and Changing Americans Institutions. Chicago,
IL:University of Chicago Press.
Yu, Y. & Williams, D. R. 1999. Socioeconomic status and mental health. In J. Phelan & C. Aneshensel (Eds.),
Handbook of the Sociology of Mental Health. Plenum; 151-166.

152
Appendix A. DSM-IV Definition of Illnesses in Alphabetical Order
Bipolar II- The essential feature of Bipolar II Disorder is a clinical course that is characterized by the occurrence of
one or more Major Depressive Episodes accompanied by at least one Hypomanic Episode and must cause
clinically significant distress or impairment in social, occupational, or other important areas of functioning. DSM-IV
Bipolar II has a duration of at least 4 days of mood change (distinct from the usual nondepressed mood) and an
unequivocal change in functioning that is observable by others.
Generalized Anxiety Disorder- The essential feature of Generalized Anxiety Disorder is excessive anxiety and
worry (apprehensive expectation), occurring more days than not for a period of at least 6 months, about a number
of events or activities. The individual finds it difficult to control the worry. The anxiety and worry are accompanied
by at least three additional symptoms from a list that includes restlessness, being easily fatigued, difficulty
concentrating, irritability, muscle tension, and disturbed sleep. Although individuals with Generalized Anxiety
Disorder may not always identify the worries as "excessive," they report subjective distress due to constant worry,
have difficulty controlling the worry, or experience related impairment in social, occupational, or other important
areas of functioning. Adults with Generalized Anxiety Disorder often worry about everyday, routine life
circumstances such as possible job responsibilities, finances, the health of family members, misfortune to their
children, or minor matters such as household chores, car repairs, or being late for appointments.
Hypomania- Defined as a distinct period during which there is an abnormally and persistently elevated, expansive,
or irritable mood that lasts at least 4 days. This period of abnormal mood must be accompanied by at least three
additional symptoms from a list that includes inflated self-esteem or grandiosity (nondelusional), decreased need
for sleep, pressure of speech, flight of ideas, distractibility, increased involvement in goal-directed activities or
psychomotor agitation, and excessive involvement in pleasurable activities that have a high potential for painful
consequences. If the mood is irritable rather than elevated or expansive, at least four of the above symptoms must

153
be present. The mood during a Hypomanic Episode must be clearly different from the individual's usual
nondepressed mood, and there must be a clear change in functioning that is not characteristic of the individual's
usual functioning. A Hypomanic Episode typically begins suddenly, with a rapid escalation of symptoms within a
day or two. Episodes may last for several weeks to months
Oppositional Defiant Disorder- The essential feature of Oppositional Defiant Disorder is a recurrent pattern of
negativistic, defiant, disobedient, and hostile behavior toward authority figures that persists for at least 6 months
and is characterized by the frequent occurrence of at least four of the following behaviors: losing temper, arguing
with adults, actively defying or refusing to comply with the requests or rules of adults, deliberately doing things that
will annoy other people, blaming others for his or her own mistakes or misbehavior, being touchy or easily annoyed
by others, being angry and resentful, or being spiteful or vindictive. To qualify for Oppositional Defiant Disorder, the
behaviors must occur more frequently than is typically observed in individuals of comparable age and
developmental level and must lead to significant impairment in social, academic, or occupational functioning.
DSM-IV Panic Attack-The essential feature of a Panic Attack is a discrete period of intense fear or discomfort that
is accompanied by at least 4 of 13 somatic or cognitive symptoms. The attack has a sudden onset and builds to a
peak rapidly (usually in 10 minutes or less) and is often accompanied by a sense of imminent danger or impending
doom and an urge to escape. The 13 somatic or cognitive symptoms are palpitations, sweating, trembling or
shaking, sensations of shortness of breath or smothering, feeling of choking, chest pain or discomfort, nausea or
abdominal distress, dizziness or lightheadedness, derealization or depersonalization, fear of losing control or
"going crazy," fear of dying, paresthesias, and chills or hot flushes. Attacks that meet all other criteria but that have
fewer than 4 somatic or cognitive symptoms are referred to as limited-symptom attacks. Individuals seeking care
for unexpected Panic Attacks will usually describe the fear as intense and report that they thought they were about
to die, lose control, have a heart attack or stroke, or "go crazy".
154
DSM-IV Panic Disorder – Characterized by recurrent unexpected Panic Attacks about which there is persistent
concern. Often the symptoms of this disorder come on rapidly and without an identifiable stressor. The individual
may have had periods of high anxiety in the past, or may have been involved in a recent stressful situation. The
underlying causes, however, are typically subtle. Panic Disorder is characterized by sudden attacks of intense fear
or anxiety, usually associated with numerous physical symptoms such as heart palpitations, rapid breathing or
shortness of breath, blurred vision, dizziness, and racing thoughts. Often these symptoms are thought to be a heart
attack by the individual, and many cases are diagnosed in hospital emergency rooms.

155
Appendix B. ICD-10 Definition of Illnesses in Alphabetical Order
Conduct Disorder w/ hierarchy- Disorders characterized by a repetitive and persistent pattern of dissocial,
aggressive, or defiant conduct. Such behaviour should amount to major violations of age-appropriate social
expectations; it should therefore be more severe than ordinary childish mischief or adolescent rebelliousness and
should imply an enduring pattern of behaviour for six months or longer
Dysthymia w/ hierarchy-Depressed mood for most of the day, for more days than not, and ongoing for at least two
years. During this time, there must be two or more of the following symptoms: under– or over eating, sleep
difficulties, fatigue, low self-esteem, difficulty with concentration or decision making, and feelings of hopelessness.
Hypomania- A disorder characterized by a persistent mild elevation of mood, increased energy and activity, and
usually marked feelings of well-being and both physical and mental efficiency. Increased sociability, talkativeness,
over-familiarity, increased sexual energy, and a decreased need for sleep are often present but not to the extent
that they lead to severe disruption of work or result in social rejection. Irritability, conceit, and boorish behaviour
may take the place of the more usual euphoric sociability. The disturbances of mood and behaviour are not
accompanied by hallucinations or delusions.
Panic Attack- The essential feature is recurrent attacks of severe anxiety (panic), which are not restricted to any
particular situation or set of circumstances and are therefore unpredictable. As with other anxiety disorders, the
dominant symptoms include sudden onset of palpitations, chest pain, choking sensations, dizziness, and feelings
of unreality (depersonalization or derealization). There is often also a secondary fear of dying, losing control, or
going mad.