
Rate Constants for the Thermal Decomposition of Ethanol ...ruscic/reprints/Sivaramakrishnan...
21
Rate Constants for the Thermal Decomposition of Ethanol and Its Bimolecular Reactions with OH and D: Reflected Shock Tube and Theoretical Studies R. Sivaramakrishnan, M.-C. Su, † J. V. Michael,* S. J. Klippenstein,* L. B. Harding, and B. Ruscic Chemical Sciences and Engineering DiVision, Argonne National Laboratory, Argonne, Illinois 60439 ReceiVed: May 24, 2010; ReVised Manuscript ReceiVed: July 15, 2010 The thermal decomposition of ethanol and its reactions with OH and D have been studied with both shock tube experiments and ab initio transition state theory-based master equation calculations. Dissociation rate constants for ethanol have been measured at high T in reflected shock waves using OH optical absorption and high-sensitivity H-atom ARAS detection. The three dissociation processes that are dominant at high T are The rate coefficient for reaction C was measured directly with high sensitivity at 308 nm using a multipass optical White cell. Meanwhile, H-atom ARAS measurements yield the overall rate coefficient and that for the sum of reactions B and C, since H-atoms are instantaneously formed from the decompositions of CH 2 OH and C 2 H 5 into CH 2 O + H and C 2 H 4 + H, respectively. By difference, rate constants for reaction 1 could be obtained. One potential complication is the scavenging of OH by unreacted ethanol in the OH experiments, and therefore, rate constants for were measured using tert-butyl hydroperoxide (tBH) as the thermal source for OH. The present experiments can be represented by the Arrhenius expression over the T range 857-1297 K. For completeness, we have also measured the rate coefficient for the reaction of D atoms with ethanol whose H analogue is another key reaction in the combustion of ethanol. Over the T range 1054-1359 K, the rate constants from the present experiments can be represented by the Arrhenius expression, The high-pressure rate coefficients for reactions B and C were studied with variable reaction coordinate transition state theory employing directly determined CASPT2/cc-pvdz interaction energies. Reactions A, D, and E were studied with conventional transition state theory employing QCISD(T)/CBS energies. For the C 2 H 5 OH f C 2 H 4 + H 2 O (A) f CH 3 + CH 2 OH (B) f C 2 H 5 + OH (C) OH + C 2 H 5 OH f products (D) k ) (2.5 ( 0.43) × 10 -11 exp(-911 ( 191 K / T) cm 3 molecule -1 s -1 D + C 2 H 5 OH f products (E) k ) (3.98 ( 0.76) × 10 -10 exp(-4494 ( 235 K / T) cm 3 molecule -1 s -1 J. Phys. Chem. A 2010, 114, 9425–9439 9425 10.1021/jp104759d 2010 American Chemical Society Published on Web 08/18/2010
Transcript of Rate Constants for the Thermal Decomposition of Ethanol ...ruscic/reprints/Sivaramakrishnan...

Rate Constants for the Thermal Decomposition of Ethanol and Its Bimolecular Reactionswith OH and D: Reflected Shock Tube and Theoretical Studies
R. Sivaramakrishnan, M.-C. Su,† J. V. Michael,* S. J. Klippenstein,* L. B. Harding, andB. Ruscic
Chemical Sciences and Engineering DiVision, Argonne National Laboratory, Argonne, Illinois 60439
ReceiVed: May 24, 2010; ReVised Manuscript ReceiVed: July 15, 2010
The thermal decomposition of ethanol and its reactions with OH and D have been studied with both shocktube experiments and ab initio transition state theory-based master equation calculations. Dissociation rateconstants for ethanol have been measured at high T in reflected shock waves using OH optical absorption andhigh-sensitivity H-atom ARAS detection. The three dissociation processes that are dominant at high T are
The rate coefficient for reaction C was measured directly with high sensitivity at 308 nm using a multipassoptical White cell. Meanwhile, H-atom ARAS measurements yield the overall rate coefficient and that forthe sum of reactions B and C, since H-atoms are instantaneously formed from the decompositions of CH2OHand C2H5 into CH2O + H and C2H4 + H, respectively. By difference, rate constants for reaction 1 could beobtained. One potential complication is the scavenging of OH by unreacted ethanol in the OH experiments,and therefore, rate constants for
were measured using tert-butyl hydroperoxide (tBH) as the thermal source for OH. The present experimentscan be represented by the Arrhenius expression
over the T range 857-1297 K. For completeness, we have also measured the rate coefficient for the reactionof D atoms with ethanol
whose H analogue is another key reaction in the combustion of ethanol. Over the T range 1054-1359 K, therate constants from the present experiments can be represented by the Arrhenius expression,
The high-pressure rate coefficients for reactions B and C were studied with variable reaction coordinatetransition state theory employing directly determined CASPT2/cc-pvdz interaction energies. Reactions A, D,and E were studied with conventional transition state theory employing QCISD(T)/CBS energies. For the
C2H5OH fC2H4 +H2O (A)
fCH3 +CH2OH (B)
fC2H5 +OH (C)
OH+C2H5OHf products (D)
k) (2.5( 0.43) × 10-11 exp(-911( 191 K ⁄ T) cm3 molecule-1 s-1
D+C2H5OHf products (E)
k) (3.98( 0.76) × 10-10 exp(-4494( 235 K ⁄ T) cm3 molecule-1 s-1
J. Phys. Chem. A 2010, 114, 9425–9439 9425
10.1021/jp104759d 2010 American Chemical SocietyPublished on Web 08/18/2010

saddle point in reaction A, additional high-level corrections are evaluated. The predicted reaction exo- andendothermicities are in good agreement with the current Active Thermochemical Tables values. The transitionstate theory predictions for the microcanonical rate coefficients in ethanol decomposition are incorporated inmaster equation calculations to yield predictions for the temperature and pressure dependences of reactionsA-C. With modest adjustments (<1 kcal/mol) to a few key barrier heights, the present experimental andadjusted theoretical results yield a consistent description of both the decomposition (1-3) and abstractionkinetics (4 and 5). The present results are compared with earlier experimental and theoretical work.
Introduction
Ethanol, C2H5OH, is an important alternative renewablecombustion fuel and is now commonly used as an additive,extender, and oxygenate for transportation energy needs. It canand already has been used as a neat fuel. It also serves as asimple prototype for more complex alcohols, such as butanol,that are being considered as next generation biofuels. Becauseof this interest, many experimental studies of both its pyrolysisand oxidation have been carried out using a variety oftechniques, and theoretical studies have been applied tounderstand these results. These early studies have been thor-oughly reviewed by Marinov,1 Park et al.,2 Li et al.,3 and Tsang.4
Using G2M theory, Park et al.2 have suggested 11 endother-mic decomposition pathways,
Using multichannel unimolecular rate theory, they narrow thesepossibilities down to four processes, reactions 1-3 and reaction8. On the basis of additional energy estimates,3,4 most otherauthors conclude that only the first three reactions are importantat high-T.
Surprisingly, there are no direct kinetics studies of the titlereactions using shock waves at the high temperatures encoun-tered in combustion. Single-pulse shock wave experiments havebeen performed on the total rate of decomposition,5 andmeasurements of [H2O]t and [CO]t by FTIR, when simulatedwith a 180 reaction step mechanism, gave decomposition rateconstants.6 Here, we make the first measurements of the OHradical formation rates due to reaction 3 using OH radical opticalabsorption at 308 nm. We then study H-atom formation ratesusing H-atom atomic resonance absorption spectrometry (ARAS),
and with the known rate constants for reaction 3 from the OHexperiments, rate constants for reaction 1 and 2 are obtained.
We have also performed a high-level theoretical analysis ofthe decomposition kinetics. This analysis builds on the earlierefforts of Lin and co-workers2 and of Dryer and co-workers3
by incorporating higher-level estimates for the transition stateenergies and employing the more accurate variable-reaction-coordinate transition-state-theory (VRC-TST) approach7,8 in thetreatment of the barrierless radical-radical channels. Further-more, the present experimental results allow for a more definitiveparametrization of the falloff effects through fits to the resultsof master equation calculations.
In this work, we have also studied experimentally theabstraction reaction,
because it is an important OH radical terminating step in thelower-T range of the present experiments. Furthermore, forcompleteness, we have also measured abstraction rate constantsfor
The H analog of this reaction is another key reaction in thepyrolysis and oxidation of ethanol.
We also make transition state theory predictions for the ratecoefficients in these two abstraction reactions, 12 and 13. Thistheoretical analysis allows for meaningful extrapolations of theexperimental data to higher and lower temperatures thanaccessible experimentally. It also provides a measure of theproduct branching in both reactions and allows us to examinethe isotope dependence for reaction 13. These predictions againbuild on the earlier work of Lin and co-workers9,10 with theincorporation of higher-level estimates of the interaction energiesand more complete considerations of the torsional motions.
Experiment
The present experiments were performed with the reflectedshock tube technique using both OH radical electronic absorp-tion and H-atom ARAS detection. The methods and theapparatus currently being used have been previously described,11,12
and only a brief description of the experiment will be presentedhere.
For the OH-radical experiments, the shock tube was fabricatedfrom 304 stainless steel in three sections; however, for theH-atom experiments, the shock tube was constructed entirelyfrom a 7-m (10.2 cm o.d.) 304 stainless steel tube. In bothconfigurations, a 10.2 cm-o.d. cylindrical section was separatedfrom the He driver chamber by a 4 mil unscored 1100-H18aluminum diaphragm, but for the OH apparatus, a 0.25 mtransition section then connected the first and third sections.The third section was of rounded corner (radius, 1.71 cm) squaredesign and was fabricated from flat stock (3 mm) with a mirror
* To whom correspondence should be addressed: E-mail: (J.V.M.)[email protected], (S.J.K.) [email protected].
† Special Term Appointment, Argonne. Permanent address: Departmentof Chemistry, Sonoma State University,1801 E. Cotati Ave., Rohnert Park,CA 94928.
C2H5OH f C2H4 + H2O (1)
f CH3 + CH2OH (2)
f C2H5 + OH (3)
f CH3CHO + H2 (4)
f C2H3OH + H2 (5)
f CH4 + H2CO (6)
f CH4 + CHOH (7)
f CH3CH + H2O (8)
f C2H5O + H (9)
f CH3CHOH + H (10)
f C2H4OH + H (11)
OH + C2H5OH f products (12)
D + C2H5OH f products (13)
9426 J. Phys. Chem. A, Vol. 114, No. 35, 2010 Sivaramakrishnan et al.

finish. In both configurations, the tubes were routinely pumpedbetween experiments to less than 10-8 Torr by an EdwardsVacuum Products model CR100P packaged pumping system.Shock wave velocities were measured with eight equally spacedpressure transducers (PCB Piezotronics, Inc., model 113A21)mounted along the downstream part of the test section andrecorded with a 4094C Nicolet digital oscilloscope. Temperatureand density in the reflected shock wave regime were calculatedfrom this velocity. This procedure has been given previously,and corrections for boundary layer perturbations have beenapplied.13-15 The oscilloscopes were triggered by a signal pulsederived from the last velocity gauge mounted on the end plate.In both cases, the photometer systems were radially located at6 cm from the end plate.
For the OH-radical experiments, a White cell, as describedpreviously,16-18 was used to increase the absorption path length.The White cell was constructed from two flat fused-silicawindows (3.81 cm), mounted on the tube across from oneanother, with broadband antireflection (BB AR) coating for UVlight. The distance between windows was 8.745 cm. The opticalconfiguration consisted of an OH resonance lamp,16,17 multipassreflectors, an interference filter at 308 nm, and a photomultipliertube (1P28), all mounted external to the shock tube. Signalswere recorded by a LeCroy model LC334A oscilloscope.
At the entrance to the multipass cell, OH resonance radiationwas collimated with a set of lenses and was focused onto thereflector on the opposite side of the shock tube through the twoAR-coated windows that were flush-mounted to the inside ofthe shock tube. The reflectors and windows were obtained fromthe CVI Laser Corporation. These reflectors were attached toadjustable mounts, and the center points of windows and mirrorswere all in a coaxial position. With this new configuration,multiple passes were used, thereby amplifying the measuredabsorbances by a factor of ∼4.5 over that used in the previouswork.17,18 This increase in sensitivity for OH-radical detectionallows for the detection of lower [OH] and therefore decreasesthe importance of secondary reaction perturbations.
For H(D)-atom detection, the lenses were crystalline MgF2,and the resonance lamp beam intensity (filtered through 6 cmof dry air (21% O2) to isolate the Lyman-RH or Lyman-RD
wavelengths at 121.6 nm), was measured by an EMR G14 solarblind photomultiplier tube, as described previously,19-21 andrecorded with a LeCroy model LC334A oscilloscope. Tomeasure the fraction of non-Lyman-RH present in the resonanceabsorption emission lamp, an H2 discharge flow system wasused to create large [H] between the lamp and shock tubewindow,19 thereby removing all of the resonance lamp emission.The H-atom experiments were then performed with the dis-charge system turned off.
The D-atom experiments required metering very smallamounts of D2 into the resonance lamp such that the lampintensity was similar to that for H-atoms. This ensures that theD-atom lamp will then be effectively unreversed; that is, aGaussian distribution.21 In this case, D-atoms in the presenceof H-atoms can be directly detected by carrying out theexperiment with the H2 discharge flow system turned on (i.e.,removing Lyman-RH) during the D-atom experiment.
Gases. High-purity He (99.995%), used as the driver gas,was from AGA Gases. Scientific grade Kr (99.999%), the diluentgas in reactant mixtures, was from Spectra Gases, Inc. The ∼10ppm impurities (N2, 2 ppm; O2, 0.5 ppm; Ar, 2 ppm; CO2, 0.5ppm; H2, 0.5 ppm; CH4, 0.5 ppm; H2O, 0.5 ppm; Xe, 5 ppm;and CF4, 0.5 ppm) are all either inert or in sufficiently lowconcentration that they do not perturb either OH-radical or
H-atom profiles. For OH detection, the microwave-driven OHlamp operated at 70 W and ∼25 Torr pressure. Distilled water,evaporated at 1 atm into ultrahigh-purity grade Ar (99.999%)from AGA Gases, was used in the resonance lamp. For H atoms,the microwave-driven resonance lamp operated at 35 W and1.9 Torr of ultrahigh-purity He (99.999%), which contains atrace of hydrogenous impurities that are sufficient to givemeasurable Lyman-R radiation.21 For the D + C2H5OH experi-ments, C2D5I was the source of D-atoms and was supplied byAldrich Chemical Inc. (reagent grade, g99.5%). Ethanol(>99.5% C2H5OH) was obtained from Pharmco-Aaper Inc. Theprincipal impurities were methanol, acetaldehyde, and benzene,amounting to <0.5%. These compounds were further purifiedby bulb-to-bulb distillation, retaining only middle thirds formixture preparation. T-HYDRO tert-butyl hydroperoxide (tBH,∼70% tBH by weight water solution; i.e., ∼32 mol % tBH and68 mol % H2O) was obtained from the Aldrich Chemical Co.Inc. and was used as the OH radical source for the OH +C2H5OH reaction studies as described previously.22 The gasmixtures were accurately prepared from pressure measurementsusing a Baratron capacitance manometer and were stored in anultrahigh-purity, all glass vacuum line.
Theory
C2H5OH Decomposition. Zero-point corrected schematicpotential energy surfaces for the decomposition of ethanol areshown in Figure 1 for the simple bond fissions to produce tworadicals and in Figure 2 for the molecular decompositions withtight transition states. The energies for these plots come fromQCISD(T)/CBS calculations23 in which the basis set extrapola-tion is based on calculations with the cc-pVTZ and cc-pVQZbasis sets of Dunning.24,25 The underlying geometries androvibrational properties for the transition state theory (TST)analyses are largely obtained with B3LYP/6-311++G** densityfunctional theory.26 However, for channel 8, there are significantdifferences in spin-restricted and unrestricted B3LYP/6-311++G** geometries. Thus, for this channel, the rovibrationalproperties are instead obtained at the CASPT2/aug-cc-pVTZlevel,27,28 where the CO and active CH bonds are included inthe 4 electron 4 orbital (4e, 4o) active space of the CAS part ofthe calculation. Notably, the T1 diagnostics29 for these channelsare all 0.027 or lower, and so one does not expect significanterrors in the QCISD(T) analysis arising from multireferenceeffects on the wave functions. For the C2H5 + OH channel, weinclude a spin-orbit correction for OH of -0.11 kcal/mol.
Figure 1. Schematic plot of the potential energy surface for the simplebond fissions in ethanol.
Decomposition, Bimolecular Reactions of Ethanol J. Phys. Chem. A, Vol. 114, No. 35, 2010 9427

This potential energy surface was previously studied inconsiderable detail by Park et al.2 at the G2M level.30 Morelimited calculations for the primary channels were reported byLi et al.3 at the G3B331 level and are supplemented withadditional calculations here. The present QCISD(T)/CBS predic-tions for the zero-point corrected stationary point energies arecompared with the corresponding G2M, G3B3, and CBS-APNO32 values in Table 1. For the stable species, ActiveThermochemical Tables (ATcT)33,34 values, developed in concertwith the current study, are also reported in Table 1. Notably,the QCISD(T)/CBS predictions for the stable species, with anrms error of only 0.3 kcal/mol, are in markedly better agreementwith the ATcT values than the G2M values, for which the rmserror is 2.6 kcal/mol. The present QCISD(T)/CBS predictionsalso provide a modest improvement in accuracy over the G3B3and CBS-APNO energies. This improvement is largely due tothe removal of various additivity approximations in the G3B3and CBS-APNO methods. Similar, if not greater, improvementsare expected for the predicted barrier heights, where theadditivity approximations may be less reliable and the structuraldeterminations are more sensitive to the method used for thegeometry optimization.
The CH3 + CH2OH channel (2), which is the lowest-energysimple bond fission channel, is taken as the zero of energy for
the plots in Figures 1 and 2. The three CH fission channels (9,10, and 11) are higher in energy than the CC (2) and CO (3)fission channels. Furthermore, fissions to produce atoms gener-ally have a lower entropy than those to produce two polyatomics.Thus, channels 9, 10, and 11 are not expected to contributesignificantly to the kinetics and are not considered further here.
The saddlepoints for the molecular fissions to produce H2 +CH3CHO (4), CH4 + H2CO (6), and CH4 + CHOH (7),respectively, are all close to (within -1.0 kcal/mol) or higherthan the CH3 + CH2OH channel (2). Furthermore, the tighttransition states for these channels have much lower entropythan that for the barrierless CC fission channel (2). Thus, thesetight transition states are also not expected to contributesignificantly to the kinetics and were not considered further here.
However, other roaming radical pathways35 should exist forthese three channels (4, 6, and 7). For example, CH4 + H2CO(6) may be produced by a near CC fission followed by areorientation of the incipient CH3 radical to an orientation thatallows for the direct abstraction of an H atom from the OHportion of the incipient CH2OH radical. Similar pathways shouldexist for channels 7 and 4. Our recent combined theory andexperiment study on the decomposition of acetaldehyde36,37
suggests, together with other work in progress for relatedreactions such as the decomposition of propane, that thecontribution from such roaming radical pathways is typically∼10-20% that for the corresponding simple bond fission. Forthe conditions of interest here, these simple bond fissions,although significant, are never dominant. Thus, for simplicity,we have chosen to neglect such roaming radical pathways inthe present analysis. For similar reasons, the correspondingroaming radical pathways to channels 1 and 5 are also neglectedhere.
The pressure-dependent kinetics is studied with ab initiotransition state theory-based master equation simulations. Themaster equation simulations were performed as described in refs38 and 39. They employ Lennard-Jones collision rates and anexponential down energy transfer model. The calculations areanalogous to those described in our recent study of the CH3OHdecomposition.40 As discussed above and illustrated in Figure3, this analysis considers only channels 1-3 and 8. Thesetheoretical calculations proceed beyond those of refs 1-4 in
Figure 2. Schematic plot of the potential energy surface for themolecular fissions in ethanol.
TABLE 1: Stationary Point Energies for the Decomposition of C2H5OHa
stationary point QCISD(T)/CBSb G2Mc G3B3b,d CBS-APNOb ATcTb
CH3 + CH2OH 85.6 87.5 84.6 85.6 85.33 ( 0.11CH3CH2 + OH 92.6e 94.8 91.5e 92.6e 92.05 ( 0.10CH3CHOH + H 93.7 93.4 93.6 93.46 ( 0.14f
CH2CH2OH + H 100.7 100.3 101.1 100.46 ( 0.14g
CH3CH2O + H 104 103.5 103.8 103.93 ( 0.11h
C2H4 + H2O 9.7 6.5 9.4 10.4 9.33 ( 0.06C2H5OHf C2H4 + H2O 66.0 66.6 66.61CH3CH + H2O 84.4 80.3 84.3 85.3 84.26 ( 0.271CH3CH.. .H2Oi 81.4 81.3C2H5OHf 1CH3CH.. .H2Oi 81.6 82.9CH4 + CHOH 63.0 65.8 62.4 63.3 62.68 ( 0.12j
C2H5OHf CH4 + CHOH 84.6 84.3CH3CHO + H2 15.1 14.7 14.1 14.7 14.79 ( 0.08C2H5OHf CH3CHO + H2 85.5 86.0CH4 + H2CO 11 9.1 10.1 10.7 10.75 ( 0.06C2H5OHf CH4 + H2CO 89.8 99.7rms Errork 0.30 2.62 0.45 0.56
a Values are in kcal/mol relative to the most stable (staggered) conformer of C2H5OH and include zero-point corrections. b Present work.ATcT values are from C(A)TN version 1.110. c From ref 2. d From ref 3 as available. Italic values are from the present work. In addition, thevalue of 84.3 kcal/mol for CH3 + CH2OH in ref 2 is corrected to 84.6 kcal/mol here. e Corrected for spin-orbit (i.e., rotational zero-pointenergy) of OH by -0.11 kcal/mol. f gauche-anti-CH3CHOH. g gauche-syn-CH2CH2OH. h X 2A′′ CH3CH2O. i van der Waals complex between1CH3CH and H2O. j trans-CHOH. k Root-mean-squared error relative to ATcT values as available.
9428 J. Phys. Chem. A, Vol. 114, No. 35, 2010 Sivaramakrishnan et al.

employing higher level ab initio estimates and more sophisti-cated transition state theory treatments within the detailed masterequation simulations.
The CH3CH product in channel 8 is expected to rapidlyisomerize to ethylene, which makes channel 8 essentiallyequivalent to channel 1. Thus, in the presentation of the results,the rate coefficients for channels 1 and 8 are summed together.The microcanonical and J-resolved rate coefficients for channel1 and 8 are evaluated with conventional transition state theory.An asymmetric Eckart tunneling correction is included forchannel 1, since it has the lowest threshold and because thelarge value for the imaginary frequency (2100 cm-1) results ina significant correction up to moderately high temperature. Thestate densities for the various species include hindered rotorpartition functions for the torsional modes as appropriate.
The saddlepoint for channel 8 is “submerged” with respectto the asymptotic energy for this channel. Correspondingly, thereare two transition states for this channel: one loose outertransition state at large separations of importance at low energyand a traditional tight inner transition state in the neighborhoodof the saddle point. Due to the much lower energy for channel1, channel 8 can be of significance only at high energies, but athigh energies, the inner transition state for channel 8 providesits dominant bottleneck. Thus, we consider only the innertransition state in evaluating the reactive flux for channel 8.
Channels 2 and 3 are studied with direct variable reactioncoordinate transition state theory.41 For the CC bond fission(channel 2) the orientation dependent energies are obtained fromCASPT2(2e,2o)/cc-pVDZ calculations. The active orbitalsconsist of the methyl and hydroxymethyl radical orbitals. A one-dimensional correction based on higher-level calculations forrelated CC bond fissions is incorporated. For the CO bond fission(channel 3), the orientation-dependent energies are obtained fromstate-averaged CASPT2(4e,3o)/cc-pVDZ calculations. The ac-tive orbitals consist of the ethyl radical orbital and the π orbitalsof OH, and the state averaging is over the two states correlatingwith the orbital degenerate states of OH. Test calculations withthe aug-cc-pVDZ basis suggest little basis set dependence. Bothfront and back side attacks were considered for each of thesechannels. The final results incorporate a dynamical correctionfactor of 0.85.41
The initial implementation of this ab initio TST based masterequation analysis yields total rate coefficients that are signifi-cantly lower than the experimental measurements. These ratecoefficients are about a factor of 3 lower than the measurementsof Li et al.3 near 1050 K. Reducing the barrier to formation ofC2H4 + H2O by 2.2 kcal/mol would reproduce these low
temperature rate coefficients as well as those of Herzler et al.,5
but such an error in the barrier height is at the limit of whatmight be expected for the present level of theory. For this reason,we have further explored this transition state with additionalhigher-level calculations. For reference purposes, we have alsoexplored C2H5OH and the CH2OH + CH3 channel with the samemethods.
This higher-level analysis starts with a reevaluation of therovibrational properties at the QCISD(T)/cc-pVTZ level oftheory. At these geometries, we have (i) obtained an improvedestimate of the CBS limit from calculations with the cc-pVQZand cc-pV5Z bases, (ii) obtained a correction for higher-orderexcitations with calculations at the CCSDT(Q)/cc-pVDZ level(employing the MRCC module of Kallay42,43), and (iii) obtaineda correction for core-valence correlation from CBS limitestimates employing the cc-pCVTZ and cc-pCVQZ bases.44 Forthe saddle point relative to C2H5OH, these three corrections are0.11, -0.53, and 0.21 kcal/mol, respectively. Meanwhile, forCH3 + CH2OH relative to C2H5OH, these corrections are -0.23,-0.08, and -0.13 kcal/mol, respectively. The net result is that,relative to C2H5OH, the saddle point energy for the dominantchannel is predicted to be lower by 0.22 kcal/mol, whereas theCH3 + CH2OH products are predicted to be lower by 0.48 kcal/mol. The latter correction changes the CH3 + CH2OH energyfrom being 0.25 kcal/mol higher than the ATcT value to being0.23 kcal/mol lower than it.
The final analysis employs these QCISD(T)/cc-pVTZ fre-quencies, since they are expected to be more reliable than theB3LYP/6-311++G(d,p) values. In reality, there is little distinc-tion between the two. The final analysis also uses these higherlevel energy estimates as a primary reference. For the C2H5 +OH channel, we employ the Active Thermochemical Tablesvalue for the energy relative to C2H5OH. The remaininguncertainty in the saddle point energy is expected to be ∼1 kcal/mol.
OH + CH3CH2OH and D + CH3CH2OH. The rovibrationalproperties of the reactants and the saddlepoints for the directabstractions of the three chemically distinct H atoms in ethanolby OH and H/D were studied at the CASPT2(3e, 3o) level,employing the aug-cc-pVTZ basis for the abstractions by H/Dand the primary channel in the abstraction by OH. For thesecondary channels in the abstraction by OH, the smaller aug-cc-pVDZ basis was instead employed. The active space for theseCASPT2 calculations consisted of the radical orbital of OH orH and the σ, σ* orbital pair for the H being abstracted. Explicitoptimizations were performed for the various torsional modesin the reactants and in the abstraction transition states. Therovibrational properties for the reactant and product van derWaals complexes in the C2H5OH + OH reaction were obtainedat the CASPT2/aug-cc-pVDZ level. For the reactant van derWaals complex, the CAS calculation involved a state-averaged(3e, 2o) active space consisting of the two π orbitals of the OHradical. For the product van der Waals complexes the (1e, 1o)active space included only the radical orbital of the product.The rovibrational properties of the products were determinedwith the B3LYP/6-311++G(d,p) density functional method.
Higher-level energies for these stationary points were obtainedfrom spin-restricted QCISD(T)/CBS calculations at these op-timized geometries and are reported in Tables 2 and 3 for theabstractions by OH and H, respectively. Related CCSD(T)/6-311+G(3df,2p)//MP2/6-311+G(3df,2p) energies from Xu andLin,9 and CCSD(T)/6-311G(d,p)//BHandHLYP/6-311G energiesfrom Galano et al.45 are also provided in Table 2, whileG2M(RCC2) calculations from Park et al.10 are also reported
Figure 3. Schematic plot of the potential energy surface for thechannels employed in the master equation treatment of the decomposi-tion of ethanol.
Decomposition, Bimolecular Reactions of Ethanol J. Phys. Chem. A, Vol. 114, No. 35, 2010 9429

in Table 3. The present CASPT2/aug-cc-pVTZ geometries areexpected to be more accurate than the MP2 and BHandHLYPgeometries of the previous studies. More importantly, the presentextrapolation to the basis set limit should provide considerablymore accurate energy predictions than in these prior works,particularly that of ref 45, where only the relatively small6-311G(d,p) basis is considered. The present predictions for thesaddle point energies differ from the previous predictions byamounts ranging from 0.3 to 2.9 kcal/mol. Such differences haveimportant kinetic effects.
For the C2H5OH + OH reaction, Galano et al.45 predict anH-bonding configuration for the saddlepoint to produceCH2CH2OH + H2O, whereas Xu and Lin9 predict a more opennon-H-bonded geometry. Our calculations find that the H-bonded saddlepoint lies 1.4 kcal/mol higher in energy than thegeometry of Xu and Lin9 and also has significantly less entropy.Thus, it is kinetically irrelevant.
The T1 diagnostics for the QCISD(T) calculations were 0.028or lower, which implies negligible multireference effects, forall but the transition state for the abstraction by OH to formCH3CH2O + H2O, where it was 0.047. The latter channel hasa relatively high endothermicity and barrier and so is notexpected to be a major channel. Thus, the moderately increaseduncertainties for this channel are of little concern.
The partition functions for the torsional motions (two modesfor C2H5OH and two or three modes as appropriate for thesaddlepoints) were evaluated with Pitzer-Gwinn-like ap-proximations for assumed separable 1-dimensional hinderedrotors as in prior studies. Tunneling corrections are small (<20%)for the temperatures of primary interest here, that is, at 1000 Kand higher. Nevertheless, for completeness and for the purposesof comparison with the low temperature experiments for the
reaction with OH, we include asymmetric Eckart tunnelingcorrections in the kinetic analysis. For the OH reaction, theasymptote energies are set to the energies of the van der Waalspre- and postreactive complexes. For the reaction with H, thesevan der Waals complexes have only small binding energies,and for simplicity, we instead employ the energies of thebimolecular products for the tunneling asymptotes.
For the abstractions by OH, we incorporate a spin-orbitlowering of 0.11 kcal/mol for the ground state of the reactantsand also include a correction to the reactant partition functionrelated to the nonseparability of the electronic and rotationalmotions. These corrections presume that the spin-orbit splittingand rotational-electronic coupling has already become negligibleat the transition state. They are of little significance at hightemperature, but do have some bearing on the comparison withroom temperature experiments for the C2H5OH + OH reaction.
For the CH3CHOH + H2O channel in the reaction with OH,the calculated barrier lies just below the reactants. Thus, wealso consider a loose phase space theory transition state for thevan der Waals complex formation with an assumed rate constantof 4 × 10⁻¹⁰ cm3 molecule-1 s-1. Incorporating this outertransition state in a two transition-state minimum flux modelreduces the rate by ∼10% at the lowest temperature (200 K)considered here. The smallness of this correction implies that amore accurate treatment of the outer transition state is notrequired.
Results
OH + CH3CH2OH. As has been pointed out in previousabsolute rate constant studies,46-58 there are three abstractableH-atoms in ethanol,
yielding distinct radical products that subsequently react inentirely different ways. In most of these studies, the total rateconstants have been determined; however, branching ratiosbetween these processes have been measured in at least two ofthese reports.48,51 There is a consensus that 12a should be thepredominant abstraction reaction at all temperatures. Theoreticalstudies of Xu and Lin9 on this reaction corroborate thisconclusion giving a branching ratio for 12a at ∼200 K of 0.98.The theoretically predicted branching ratio decreases monotoni-
TABLE 2: Stationary Point Energies for the Reaction of C2H5OH with OHa
saddle point QCISD(T)/CBSb CCSD(T)/6-311+G(3df,2p)c CCSD(T)/6-311G(d,p)d
C2H5OH · · ·OH -4.3 -5.1C2H5OH + OH f CH3CHOH + H2O -0.1 -0.6 0.4CH3CHOH · · ·H2O -28.9 -26.3CH3CHOH + H2O -24.2 -22.9C2H5OH + OH f CH2CH2OH + H2O 1.3 1.8 2.6CH2CH2OH · · ·H2O -20.6 -19.6CH2CH2OH + H2O -17.2 -15.5C2H5OH + OH f CH3CH2O + H2O 3.7 3.4 3.0CH3CH2O · · ·H2O -16.4 -17.3CH3CH2O + H2O -13.9 -13.3
a Values are in kcal/mol relative to C2H5OH + OH and include zero-point corrections. b Present QCISD(T)/CBS calculations including SOcorrection. The saddlepoint and van der Waals complex energies are obtained at CASPT2(3,3) geometries, and the products are obtained at B3LYP/6-311++G(d,p) geometries. c CCSD(T)/6-311+G(3df,2p)//MP2/6-311+G(3df,2p) from Xu and Lin.9 d CCSD(T)/6-311G(d,p)//MP2/6-311G(d,p) fromGalano et al.45
TABLE 3: Stationary Point Energies for the Reaction ofC2H5OH with H/Da
saddle point QCISD(T)/CBSb G2M(RCC2)c
C2H5OH + H f CH3CHOH + H2 6.0 (5.4) 7.2CH3CHOH + H2 -9.6 -7.7C2H5OH + H f CH2CH2OH + H2 10.4 (9.6) 13.3CH2CH2OH + H2 -2.6 -1.2C2H5OH + H f CH3CH2O + H2 13.4 (12.3) 15.0CH3CH2O + H2 0.6 2.2
a Values are in kcal/mol relative to C2H5OH + H/D and includezero-point corrections. b Present QCISD(T)/CBS calculations.Saddlepoint energies were obtained at CASPT2(3,3)/aug-cc-pvtzgeometries, while product energies were obtained at B3LYP/6-311++G(d,p) geometries. Primary entries are for H; values inparentheses are for D. c From Park et al.10
OH + CH3CH2OH f CH3CHOH + H2O (12a)
f CH2CH2OH + H2O (12b)
f CH3CH2O + H2O (12c)
9430 J. Phys. Chem. A, Vol. 114, No. 35, 2010 Sivaramakrishnan et al.

cally to 0.80 ( 0.02 over the present experimental T range.Hence, at low T, the overall rate constants refer essentially to12a, with 12b and 12c increasing in importance as temperatureincreases. The work of Hess and Tully51 clearly shows at 700Torr He between ∼500 and 650 K that the radical product of12b dissociates to C2H4 + OH. In this range, the profiles arebiexponential becoming strictly first-order again above 650 K.Under the present conditions, reaction 12b followed by C2H4OHdissociation cannot be measured, since one OH is formed forevery OH radical that reacts. Hence, the overall rate constantsthat are measured here refer to reactions 12a + 12c (withCH3CH2O from 12c in ∼5% yield9 giving CH3CHO + H), andthese constitute ∼80% of the total rate constant, with C2H4OHformation from reaction 12b being ∼20%.
Using a path length of 56 passes (4.9 m), overall rate constantswere directly measured between 857 and 1297 K by observingOH decays for the conditions shown in Table S1. Figure 4 showstwo typical profiles. Using the reaction mechanism of Table 4,these profiles were simulated giving the lines shown in thefigure. Figures 5 and 6 illustrate sensitivity analyses for theexperiments shown in Figure 4. Clearly, tBH dissociation andreaction 12 are the only important processes that determine theprofiles, with all other processes being negligible. This suggeststhat first-order analyses, at longer times after tBH has essentiallybeen depleted, would be adequate with the present highsensitivity for OH detection. This is confirmed in columns 5and 6 of Table S1, where the fitted profile results are comparedwith those from first-order analysis. The agreement is within(8%. An added result from the profile fits is that the [tBH]0
needed (column 7) for the simulations is (31.6 ( 1.0) mol %× XtBH,sol’n, in excellent agreement with the supplier’s assay.Over the T range 857-1297 K, the rate constants from simulatedfits can be represented by the Arrhenius expression,
The fitted rate constants for reaction 12 have been used toevaluate the high-T (621-1297 K) rate behavior. As argued
above, these values refer almost entirely to 12a, since 12c is atmost ∼5% of the total rate. To evaluate the rate constants for12a over this range, we have used Hess and Tully’s data above621 K51 and the present simulated results from Table S1.Between 621 and 1297 K, the rate constants can be representedby the Arrhenius expression
In the present evaluation, the data point of Bott and Cohen53
is not included. Hence we use only the values of Hess and Tullyand the present determinations, with each given the samestatistical weight. At the 1 standard deviation (SD) level, thepoints from Hess and Tully are within (1%, whereas those fromthe present study are within (5% of the line determined fromeq 15.
The present ab initio TST predictions for the rate coef-ficient for reaction 12a + 12c are compared in Figure 7 withthe present and other experimental data46-58 and the relatedtheoretical predictions of Xu and Lin9 and of Galano et al.45
The present theoretical predictions (red solid line) are onlyslightly higher (∼30%) than the present high-temperatureexperimental measurements. However, as the temperaturedecreases, the present predictions increasingly overestimatethe experimental values. Notably, simply ignoring tunneling(red dotted line) yields theoretical predictions that are in muchimproved agreement with experiment, but which are nowslightly too low at the lowest temperatures. This observationsuggests that the asymmetric Eckart formula may simply beoverestimating the effect of tunneling for this reaction, whichis reasonable. Alternatively, simply increasing each of theabstraction barriers by 0.35 kcal/mol (red dash-dot-dot-dotline) also yields a result that is in satisfactory agreement withexperiment throughout the range of experimentally studiedtemperatures. Such an error of 0.35 kcal/mol is well withinthe uncertainty in this quantity, which might be roughlyestimated as 1 kcal/mol.
The theoretical predictions of Xu and Lin9 are in betteragreement with the present high temperature measurements,but appear to be too low at low temperatures. The latter resultis somewhat surprising, given that the barrier of Xu and Lin9
for the dominant channel, 12a, is 0.5 kcal/mol lower thanthe one calculated here. However, they do not includetunneling for this channel, and they also appear to employhindered rotors for only one of the torsional modes. Both ofthese limitations appear to have a significant effect on thepredicted rate coefficients. The nonnegligible effect oftunneling, even though the saddlepoint lies below thereactants, is due to the fact that the barriers for rotationallyand vibrationally excited states are still above the thresholdfor reaction. As a result, tunneling still increases the reactiveflux. The predictions of Galano et al.45 are markedly lower,apparently due to their barrier of 0.4 kcal/mol for channel12a, which is 0.5 kcal/mol greater than predicted here. Forthe dissociation experiments to follow, the Xu and Lin9
theoretical predictions are used in the Table 4 mechanism toextrapolate rate constants for OH + CH3CH2OH to somewhathigher T.
The present theoretical predictions for the branching ratios(with each of the barrier heights adjusted up by 0.35 kcal/mol)are compared in Figure 8 with those from Xu and Lin9 andfrom Galano et al.45 All three theoretical studies predict a
Figure 4. Two [OH] profiles at 1194 and 857 K, respectively. Thesolid lines are fits over the entire time range using the reactionmechanism of Table 4 with variations in k12. The conditions for theexperiment at T5 ) 1194 K are P1 ) 15.92 Torr, Ms ) 2.145, F5 )2.583 × 10¹⁸ molecules cm-3, [tBH]0 ) 2.03 × 10¹³ molecules cm-3,[H2O]0 ) 4.52 × 10¹³ molecules cm-3, and [C2H5OH]0 ) 2.42 × 10¹⁴
molecules cm-3. The conditions for the experiment at T5 ) 857 K areP1 ) 30.98 Torr, Ms ) 1.790, F5 ) 3.838 × 10¹⁸ molecules cm-3,[tBH]0 ) 1.74 × 10¹³ molecules cm-3, [H2O]0 ) 3.61× 10¹³ moleculescm-3, and [C2H5OH]0 ) 1.87 × 10¹⁴ molecules cm-3.
k12 ) (2.5 ( 0.43) × 10-11 exp(-911 ( 191 K/T)
cm3 molecule-1 s-1 (14)
k12a ) (3.03 ( 0.16) × 10-11 exp(-1132 ( 51 K/T)
cm3 molecule-1 s-1 (15)
Decomposition, Bimolecular Reactions of Ethanol J. Phys. Chem. A, Vol. 114, No. 35, 2010 9431

Figure 5. OH radical sensitivity analysis for the 1194 K profile shownin Figure 4 using the full reaction mechanism scheme listed in Table4 and the modeled rate constants (k12) in Table 4. The four mostsensitive reactions are shown in the inset.
Figure 6. OH radical sensitivity analysis for the 857 K profile shownin Figure 4 using the full reaction mechanism scheme listed in Table4 and the modeled rate constants (k12) in Table 4. The four mostsensitive reactions are shown in the inset.
TABLE 4: Mechanism for C2H5OH Decompositiona
1. C2H5OH f C2H4 + H2O k1 ) to be fitted present
2. C2H5OH f CH3 + CH2O + H k2 ) to be fitted present
3. C2H5OH + Kr f C2H4 + OH + H k3 ) to be fitted present
4. H + O2 f OH + O k4 ) 1.62 × 10⁻¹⁰ exp(-7474 K/T) 62
5. OH + O f O2 + H k5 ) 5.42 × 10⁻¹³ T.375 exp(950 K/T) 11, 63, 64
6. OH + OH f O + H2O k6 ) 7.19 × 10⁻²¹ T2.7 exp(917 K/T) 11, 63-65
7. OH + H2 f H2O + H k7 ) 3.56 × 10⁻¹⁶ T1.52 exp(-1736 K/T) 66
8. HO2 + Kr f H + O2 + Kr k8 ) 7.614 × 10⁻¹⁰ exp(-22 520 K/T) 67
9. HO2 + OH f H2O + O2 k9 ) 5.00 × 10⁻¹¹ 68
10. OH + H f H2 + O k10 ) 3.78 × 10⁻²⁰ T2.67 exp(-2393 K/T) 11, 63, 64
11. O + H2 f OH + H k11 ) 8.44 × 10⁻²⁰ T2.67 exp(-3167 K/T) 11
12. C2H5OH + OH f CH3CHO + OH + H k12 ) 9.11 × 10⁻²⁰ T2.58 exp(748 K/T) 9
13. C2H5OH + D f CH3CHO + HD + H k13 from present adjusted theory eq 20
14. H2O + H f OH + H2 k14 ) 1.56 × 10⁻¹⁵ T1.52 exp(-9083 K/T) 11, 63, 64
15. O + H2O f OH + OH k15 ) 7.48 × 10⁻²⁰ T2.7 exp(-7323 K/T) 11, 63, 64
16 C2H5OH + H f CH3CHO + H2 + H k16 from present adjusted theory eq 20
17. C2H5OH + O f CH3CHO + OH + H k17 ) 2.89 × 10⁻¹⁶ T1.62 exp(-1210 K/T) 69
18. CH3CHO + OH f CH3 + H2O + CO k18 ) 8.36 × 10⁻¹¹ exp(-2410 K/T) + 4.34 × 10⁻¹² exp(369 K/T) 70
19. CH3CHO f CH3 + HCO k19 ) 4.29 × 10²² T-1.88 exp(-43 020 K/T) 71
20. C4H10O2 f CH3 + OH + (CH3)2CO k20 ) 2.5 × 10¹⁵ exp(-21 649 K/T) 72
21. (CH3)2CO + OH f CH2COCH3 + H2O k21 ) 4.9 × 10⁻¹¹ exp(-2297 K/T) 73
22. H2CO + Kr f HCO + H + Kr k22 ) 1.019 × 10⁻⁸ exp(-38 706 K/T) 74
23. H2CO + Kr f H2 + CO + Kr k23 ) 4.658 × 10⁻⁹ exp(-32 110 K/T) 74
24. HCO + Kr f H + CO + Kr k24 ) 6.00 × 10⁻¹¹ exp(-7722 K/T) 7525. H2CO + OH f H2O + HCO k25 ) 5.69 × 10⁻¹⁵ T1.18 exp(225 K/T) 76
26. CH3 + CH3 f C2H6 k26 ) f(F, T) 77
27. CH3 + CH3 f C2H4 + 2H k27 ) 5.26 × 10⁻¹¹ exp(-7392 K/T) 19
28. CH3 + OH f 1CH2 + H2Ok28 ) 1.80 × 10⁻¹¹ 78
29. OH + C2H4 f H2O + H + C2H2 k29 ) 1.02 × 10⁻⁹ exp(-7411 K/T) 79
30. CH3 + O f H2CO + H k30 ) 1.148 × 10⁻¹⁰ 80, 81
31. H2CO + O f OH + HCO k31 ) 6.92× 10⁻¹³ T0.57 exp(-1390 K/T) 76
32. CH3 + O f H2 + CO + H k32 ) 2.52× 10⁻¹¹ 80, 81
33. C2H6 + O f OH + H + C2H4 k33 ) 1.87 × 10⁻¹⁰ exp(-7411 K/T) 82
34. C2H6 + OH f H2O + H + C2H4 k34 ) 2.68 × 10⁻¹⁸ T2.224 exp(-373 K/T) 83
35. C2D5I f C2D4 + D + I k35 ) 2.49 × 10¹⁰ exp(-17 729 K/T) × (0.3037 + (2.744 × 10⁻⁴)T) 84
36. C2D5I f C2D4 + DI k36 ) 2.49 × 10¹⁰ exp(-17 729 K/T) × (0.6963 - (2.744 × 10⁻⁴)T) 84
37. H + C2D4 f C2D3H + D k37 ) 3.482 × 10⁻¹⁰ exp(-2784 K/T) 85, 86
38. D + CH3 f CH2D + H k38 ) 2.20 × 10⁻¹⁰ 84
a All rate constants are in cm3 molecule-1 s-1.
9432 J. Phys. Chem. A, Vol. 114, No. 35, 2010 Sivaramakrishnan et al.

branching ratio to CH3CHOH + H2O of ∼90%, which is inreasonable agreement with Meier et al.’s48 experimental resultof 75 ( 15%. However, the branching to the secondary channelsis quite different for the three studies. The present calculationspredict a higher branching to channel 12c at low temperaturedue to a greater imaginary frequency (2432i versus 1335i).
The present adjusted theoretical predictions for the total andchannel-specific rate coefficients are well reproduced over the200-2500 K T range by the expressions
The sum of these three parameter fits for k12a and k12c is within(30% of eq 15 over the T range 621-1297 K.
D + CH3CH2OH. As with H-atom abstractions by OH, atheoretical study by Park et al.10 on H + C2H5OH predictscontribution from only three channels over a wide temperaturerange,
with 17c being a minor process (∼5%) over the T range298-3000 K. If C2H5I were to be used as a thermal source forH-atoms in H + C2H5OH experiments, then the additionalproduction of H-atoms from the thermal decomposition ofC2H5OH would be a potential complication. Instead, we haveperformed D + C2H5OH experiments using C2D5I as a thermalsource for D-atoms. With this source and the observation ofD-atom time-dependent concentrations, the secondary produc-tion of H-atoms no longer interferes with the observation.Channels analogous to 17a-c are expected to occur in thedeuterated case (see below), and we have therefore utilizedtheoretical calculations to gauge the isotope effect as discussedbelow and in the preceding theory section.
Seventeen experiments were performed over the T range1054-1359 K to obtain total rate constants for reaction 18.Table S2 gives the experimental conditions and summarizes themeasured rate constants. Figure 9 is an example of a typicalD-atom profile obtained at 1159 K. The D-atom profile issimulated using the model in Table 4 to obtain the totalbimolecular rate constant for reaction 18. Both Park et al.10 andthe present ab initio TST calculations predict that >75% of theabstraction occurs through channel 17a at T < 1400 K, andtherefore, for the purpose of modeling the experiments, we haveused only reaction 18a. Figure 10 shows the sensitivity analysisfor the D-atom profile of Figure 9. Clearly, C2D5I dissociationand the title reaction are the only sensitive reactions with thelong-time D-atom tail governed by H + C2D4 f C2D3H + D.
The present ab initio TST calculations predict that the ratecoefficient for reaction 18 is within 5% of that for reaction 17over the T range 1054-1359 K (i.e., an isotope effect of ∼1.0).
Figure 7. Arrhenius plot of the experimental data (symbols) andtheoretical predictions (lines) for the OH + C2H5OH rate coefficient.The red symbols denote the present experimental measurements, andthe remaining symbols denote other experimental data.46-58 The redlines denote the present theoretical predictions, with the solid linecorresponding to the unadjusted predictions; the dotted line, thepredictions when tunneling is neglected; and the dash-dot-dot-dotline, the predictions when the saddle points are shifted up by 0.35 kcal/mol. The blue dashed and green dash-dot lines denote the ab initioTST predictions of Xu and Lin9 and Galano et al.,45 respectively.
Figure 8. Arrhenius plot of the branching fraction [k12i/(k12a + k12b +k12c)] for 12i ) channels 12a (solid), 12b (dashed), and 12c (dotted).The ab initio TST predictions from the present work with barriersadjusted up by 0.35 kcal/mol are in red, those from Xu and Lin9 are inblue, and those from Galano et al.45 are in green.
k12 ) 5.02 × 10⁻²⁰ T2.67 exp(844 K/T) cm3 molecule-1 s-1
(16)
k12a ) 1.19 × 10⁻¹⁹ T2.54 exp(772 K/T) cm3 molecule-1 s-1
(16a)
k12b ) 9.46 × 10⁻²⁴ T3.38 exp(1205 K/T) cm3 molecule-1 s-1
(16b)
k12c ) 9.64 × 10⁻²⁷ T4.28 exp(1792 K/T) cm3 molecule-1 s-1
(16c)
H + CH3CH2OH f products (17)
f CH3CHOH + H2 (17a)
f CH2CH2OH + H2 (17b)
f CH3CH2O + H2 (17c)
D + CH3CH2OH f products (18)
f CH3CHOH + HD (18a)
f CH2CH2OH + HD (18b)
f CH3CH2O + HD (18c)
Decomposition, Bimolecular Reactions of Ethanol J. Phys. Chem. A, Vol. 114, No. 35, 2010 9433

Thus, we consider the present measurement to relate directlyto reaction 17. Over the T range 1054-1359 K, the rateconstants from simulated fits can be represented by theArrhenius expression,
At the 1 SD level, the present experimental data are within(19% of eq 19. The present experiments and the lowertemperature (295-473 K) measurements of Aders and Wagner59
are the only direct measurements for this rate constant.As shown in Figure 11, the present theoretical predictions
for k16 are in reasonable agreement with the present experiments,being ∼40% higher. The prior ab initio TST calculations ofPark et al.10 differ by a similar magnitude, but are instead ∼50%lower. There are similar differences between the theoreticalpredictions and the experimental results of Aders and Wagner.59
Repeating the present TST calculations with each of the barriersincreased by 0.8 kcal/mol (which is within the uncertainty ofthe ab initio electronic structure calculations) yields results thataccurately reproduce both the present experimental results andthose from ref 59. These adjusted ab initio TST rate coefficients
are well reproduced over the 300-2250 K T range by thefollowing modified Arrhenius expressions:
The branching between the channels is similar to what waspredicted by Park et al.,10 with channel 20a being the dominantchannel. Channel 20b is predicted to be a significant secondarychannel, with a fraction that increases with increasing temper-ature, reaching 38% at 2500 K. However, channel 20c isessentially negligible with a maximum fraction of 7% at 2500K.
CH3CH2OH Dissociation. Using the same OH radicaldetection method, we have directly measured the rate offormation of OH from ethanol dissociation, and this can beattributed directly to reaction 3. Figure 12 shows a typicalexample of a profile at 1555 K. The profiles exhibit considerablescatter, but the initial slopes can be used to determine k3 bymodeling using the mechanism in Table 4. A first order risetime constant for k3 ) 100 s-1 in the Table 4 mechanismrepresents the best fit to the OH profile. Note that the level ofOH detected is ∼5-7 × 10¹² radicals cm-3 at a signal-to-noiseratio of ∼3. To our knowledge, this level of sensitivity for [OH]t
in shock wave experiments has never been exceeded before.The experimental conditions and k3 results are given in TableS3, and a first-order plot is shown in Figure 13. Because of thelimited data set and scatter, only a minor P dependence issuggested by the experiments. With the substantial data scatter,
Figure 9. [D] profile at 1159 K. The solid line is a fit over the entiretime range using the reaction mechanism of Table 4 with the k13 valuesfrom Table S2. The conditions for the experiment at 1159 K are P1 )15.94 Torr, Ms ) 2.105, F5 ) 2.520 × 10¹⁸ molecules cm-3, [C2D5I]0
) 1.28 × 10¹² molecules cm-3, and [C2H5OH]0 ) 2.18 × 10¹⁴
molecules cm-3.
Figure 10. D-atom sensitivity analysis for the 1159 K profile shownin Figure 4 using the full reaction mechanism scheme listed in Table4 with the k13 value in Table S2. The four most sensitive reactions areshown in the inset.
k16 ) (3.98 ( 0.76) × 10-10 exp(-4494 ( 235 K/T) cm3
molecule-1 s-1 (19)
Figure 11. Arrhenius plot of the experimental data (symbols) andtheoretical predictions (lines) for the H/D + C2H5OH rate coefficients.The open squares denote the present experimental measurements ofthe total rate coefficient, and the circles denote those from ref 59. Theblack solid and dashed lines denote the present theoretical predictionsbefore and after the adjustment of the barrier by 0.8 kcal/mol. Theblue dotted line denotes the theoretical predictions from Park et al.10
k16 ) 1.85 × 10⁻²¹ T3.30 exp(-1214 K/T)
cm3 molecule-1 s-1 (20)
k16a ) 1.46 × 10⁻¹⁹ T2.68 exp(-1467 K/T)
cm3 molecule-1 s-1 (20a)
k16b ) 8.82 × 10⁻²⁰ T2.81 exp(-3772 K/T)
cm3 molecule-1 s-1 (20b)
k16c ) 1.57 × 10⁻²¹ T3.14 exp(-4379 K/T)
cm3 molecule-1 s-1 (20c)
9434 J. Phys. Chem. A, Vol. 114, No. 35, 2010 Sivaramakrishnan et al.
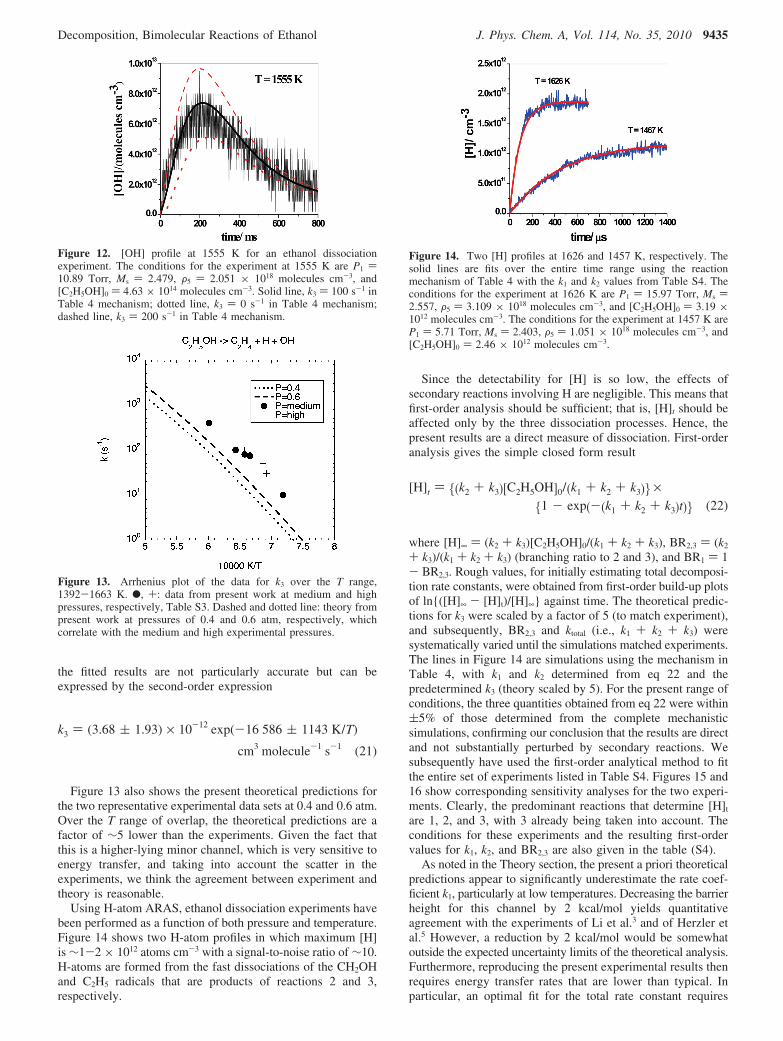
the fitted results are not particularly accurate but can beexpressed by the second-order expression
Figure 13 also shows the present theoretical predictions forthe two representative experimental data sets at 0.4 and 0.6 atm.Over the T range of overlap, the theoretical predictions are afactor of ∼5 lower than the experiments. Given the fact thatthis is a higher-lying minor channel, which is very sensitive toenergy transfer, and taking into account the scatter in theexperiments, we think the agreement between experiment andtheory is reasonable.
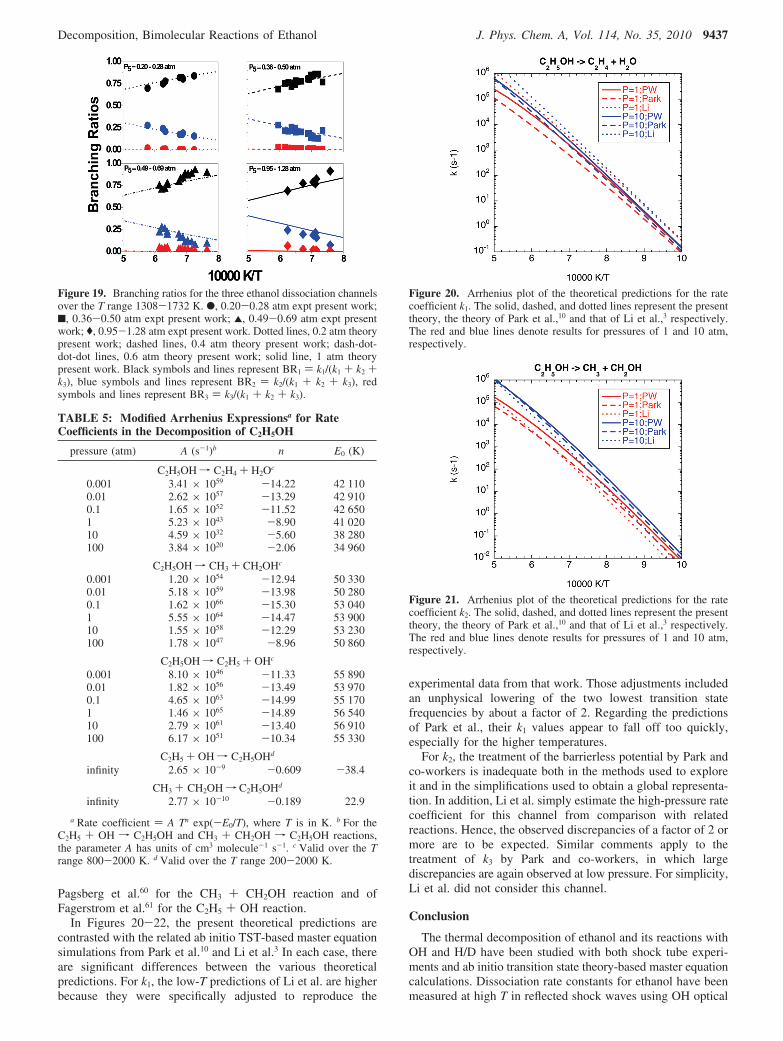
Using H-atom ARAS, ethanol dissociation experiments havebeen performed as a function of both pressure and temperature.Figure 14 shows two H-atom profiles in which maximum [H]is ∼1-2 × 10¹² atoms cm-3 with a signal-to-noise ratio of ∼10.H-atoms are formed from the fast dissociations of the CH2OHand C2H5 radicals that are products of reactions 2 and 3,respectively.
Since the detectability for [H] is so low, the effects ofsecondary reactions involving H are negligible. This means thatfirst-order analysis should be sufficient; that is, [H]t should beaffected only by the three dissociation processes. Hence, thepresent results are a direct measure of dissociation. First-orderanalysis gives the simple closed form result
where [H]∞ ) (k2 + k3)[C2H5OH]0/(k1 + k2 + k3), BR2,3 ) (k2
+ k3)/(k1 + k2 + k3) (branching ratio to 2 and 3), and BR1 ) 1- BR2,3. Rough values, for initially estimating total decomposi-tion rate constants, were obtained from first-order build-up plotsof ln{([H]∞ - [H]t)/[H]∞} against time. The theoretical predic-tions for k3 were scaled by a factor of 5 (to match experiment),and subsequently, BR2,3 and ktotal (i.e., k1 + k2 + k3) weresystematically varied until the simulations matched experiments.The lines in Figure 14 are simulations using the mechanism inTable 4, with k1 and k2 determined from eq 22 and thepredetermined k3 (theory scaled by 5). For the present range ofconditions, the three quantities obtained from eq 22 were within(5% of those determined from the complete mechanisticsimulations, confirming our conclusion that the results are directand not substantially perturbed by secondary reactions. Wesubsequently have used the first-order analytical method to fitthe entire set of experiments listed in Table S4. Figures 15 and16 show corresponding sensitivity analyses for the two experi-ments. Clearly, the predominant reactions that determine [H]t
are 1, 2, and 3, with 3 already being taken into account. Theconditions for these experiments and the resulting first-ordervalues for k1, k2, and BR2,3 are also given in the table (S4).
As noted in the Theory section, the present a priori theoreticalpredictions appear to significantly underestimate the rate coef-ficient k1, particularly at low temperatures. Decreasing the barrierheight for this channel by 2 kcal/mol yields quantitativeagreement with the experiments of Li et al.3 and of Herzler etal.5 However, a reduction by 2 kcal/mol would be somewhatoutside the expected uncertainty limits of the theoretical analysis.Furthermore, reproducing the present experimental results thenrequires energy transfer rates that are lower than typical. Inparticular, an optimal fit for the total rate constant requires
Figure 12. [OH] profile at 1555 K for an ethanol dissociationexperiment. The conditions for the experiment at 1555 K are P1 )10.89 Torr, Ms ) 2.479, F5 ) 2.051 × 10¹⁸ molecules cm-3, and[C2H5OH]0 ) 4.63 × 10¹⁴ molecules cm-3. Solid line, k3 ) 100 s-1 inTable 4 mechanism; dotted line, k3 ) 0 s-1 in Table 4 mechanism;dashed line, k3 ) 200 s-1 in Table 4 mechanism.
Figure 13. Arrhenius plot of the data for k3 over the T range,1392-1663 K. b, +: data from present work at medium and highpressures, respectively, Table S3. Dashed and dotted line: theory frompresent work at pressures of 0.4 and 0.6 atm, respectively, whichcorrelate with the medium and high experimental pressures.
k3 ) (3.68 ( 1.93) × 10-12 exp(-16 586 ( 1143 K/T)
cm3 molecule-1 s-1 (21)
Figure 14. Two [H] profiles at 1626 and 1457 K, respectively. Thesolid lines are fits over the entire time range using the reactionmechanism of Table 4 with the k1 and k2 values from Table S4. Theconditions for the experiment at 1626 K are P1 ) 15.97 Torr, Ms )2.557, F5 ) 3.109 × 10¹⁸ molecules cm-3, and [C2H5OH]0 ) 3.19 ×10¹² molecules cm-3. The conditions for the experiment at 1457 K areP1 ) 5.71 Torr, Ms ) 2.403, F5 ) 1.051 × 10¹⁸ molecules cm-3, and[C2H5OH]0 ) 2.46 × 10¹² molecules cm-3.
[H]t ) {(k2 + k3)[C2H5OH]0/(k1 + k2 + k3)} ×{1 - exp(-(k1 + k2 + k3)t)} (22)
Decomposition, Bimolecular Reactions of Ethanol J. Phys. Chem. A, Vol. 114, No. 35, 2010 9435

setting ⟨∆Edown⟩ to 50 (T/300)0.85 cm-1, whereas prefactors of100-200 cm-1 are more typical. Even more problematic is thatsuch small energy transfer rates yield rate coefficients forchannels 2 and 3 that are an order of magnitude too low.
At the temperature and pressures of the present experiments,the rate coefficients for channels 2 and 3 are very sensitive toboth the energy transfer parameters and the height of the barrierto channel 1, since their production involves a competitionbetween dissociation to channel 1 and further excitation. Acompromise fit to all the data is obtained by lowering the barrierto channel 1 by only 1.0 kcal/mol, and setting ⟨∆Edown⟩ to 125(T/300)0.85 cm-1. With this compromise, a reasonably satisfactoryreproduction of all the experimental data is obtained. Further-more, this reduced adjustment of the barrier is within theexpected uncertainty of the electronic structure evaluations, andthis expression for ⟨∆Edown⟩ is typical of those found in otherrelated studies.
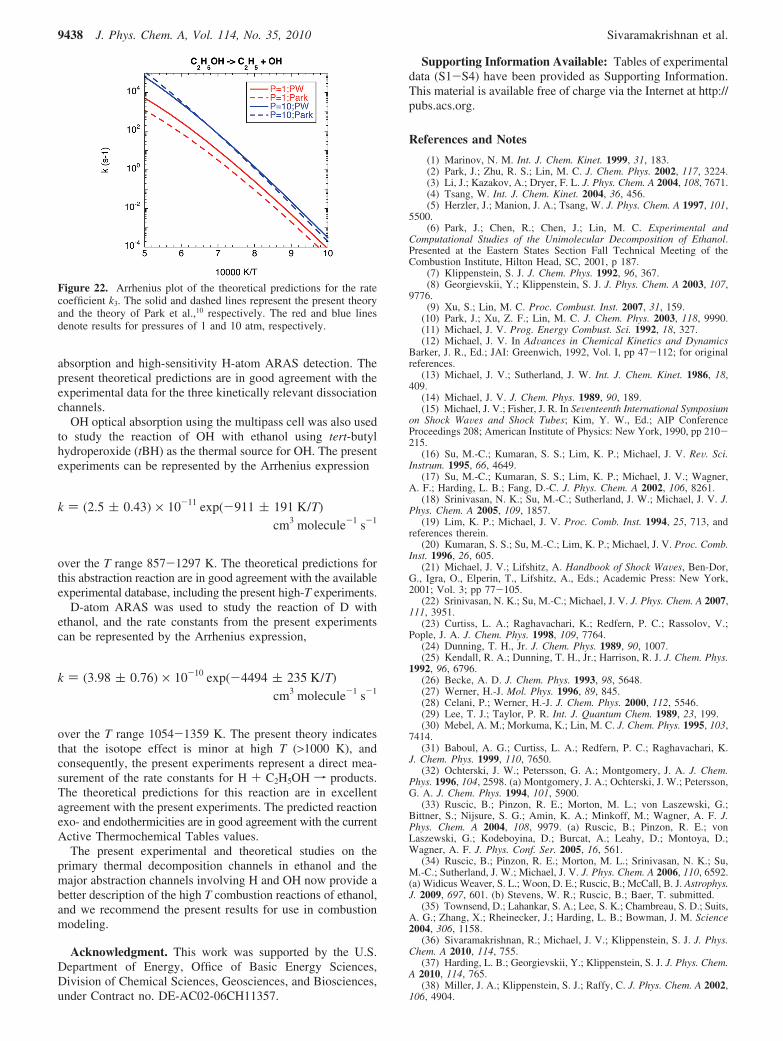
The present experimental measurements for k1, k2, and k3 areplotted as first-order rate constants together with these adjustedand optimized theoretical predictions in Figures 17, 18, and 13,respectively. The corresponding experimental and theoreticalbranching ratios are plotted in Figure 19. In each of these plots,the theoretical predictions are for pressures of 0.2, 0.4, 0.6, and1.0 atm for comparison with the experimental measurementslabeled low, medium, high, and higher, which span a small rangeof pressures centered as these values.
The theoretical predictions for k1 pass through the mean ofthe present experimental measurements, with a pressure variationthat more or less matches that observed experimentally. Theyare, however, about a factor of 1.5-2.5 lower than the
measurements of Li et al.3 and Herzler et al.5 The theoreticalpredictions for k2 also pass through the mean of the presentexperimental measurements and with a pressure variation thatmore or less matches that observed experimentally. Thetheoretical predictions for k3 are somewhat lower than theexperimental measurements, but are still generally within afactor of 4. As noted earlier, this discrepancy seems reasonable,given the difficulty of measuring the rate coefficient for the lowbranching to this channel (recall the need to fit just the rise inthe OH profiles rather than their full time dependence) and thestrong sensitivity of the theoretical predictions to the details ofthe energy transfer process (some contribution from strongcollisions might greatly enhance the rate through this pathway).
The present adjusted predictions for the temperature depen-dence of k1, k2, and k3 have been fitted with modified Arrheniusexpressions for a wide range of pressures. These expressionsare summarized in Table 5. Also included in Table 5 aremodified Arrhenius expressions for the high-pressure limits ofthe rate coefficients for the CH3 + CH2OH and C2H5 + OHrecombinations. These predictions for the high pressure recom-bination rate coefficients are each ∼1.5 times lower than thecorresponding room temperature experimental measurements of
Figure 15. H-atom sensitivity analysis for the 1626 K profile shownin Figure 14 using the full reaction mechanism scheme listed in Table4 with k1 and k2 values in Table S4. The four most sensitive reactionsare shown in the inset.
Figure 16. H-atom sensitivity analysis for the 1457 K profile shownin Figure 14 using the full reaction mechanism scheme listed in Table4 with k1 and k2 values in Table S4. The four most sensitive reactionsare shown in the inset.
Figure 17. Arrhenius plot of the data for k1 over the T range,1308-1732 K. 0, 0.20-0.28 atm expt present work; b, 0.36-0.50atm expt present work; +, 0.49-0.69 atm expt present work; ∆,0.95-1.28 atm expt present work. Dotted, dashed, dash-dot-dot-dot,and solid lines: theory from present work for pressures of 0.2, 0.4, 0.6,and 1.0 atm, respectively.
Figure 18. Arrhenius plot of the data for k2 over the T range1308-1732 K. Symbols and lines as in Figure 17.
9436 J. Phys. Chem. A, Vol. 114, No. 35, 2010 Sivaramakrishnan et al.
Pagsberg et al.60 for the CH3 + CH2OH reaction and ofFagerstrom et al.61 for the C2H5 + OH reaction.
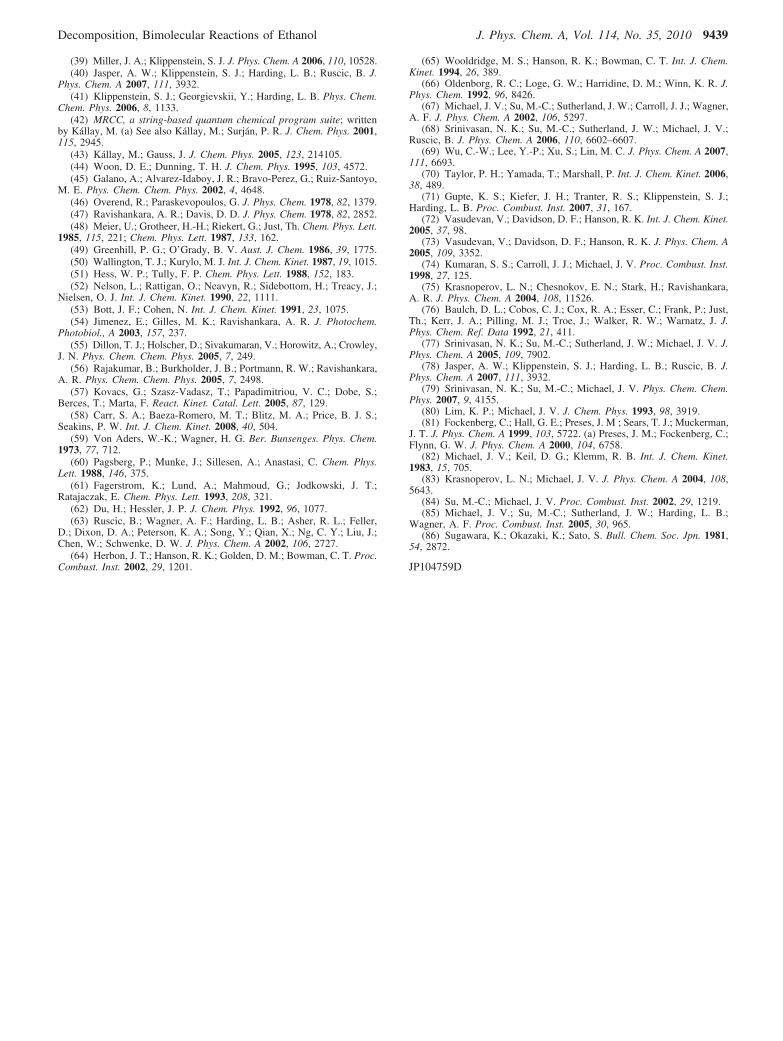
In Figures 20-22, the present theoretical predictions arecontrasted with the related ab initio TST-based master equationsimulations from Park et al.10 and Li et al.3 In each case, thereare significant differences between the various theoreticalpredictions. For k1, the low-T predictions of Li et al. are higherbecause they were specifically adjusted to reproduce the
experimental data from that work. Those adjustments includedan unphysical lowering of the two lowest transition statefrequencies by about a factor of 2. Regarding the predictionsof Park et al., their k1 values appear to fall off too quickly,especially for the higher temperatures.
For k2, the treatment of the barrierless potential by Park andco-workers is inadequate both in the methods used to exploreit and in the simplifications used to obtain a global representa-tion. In addition, Li et al. simply estimate the high-pressure ratecoefficient for this channel from comparison with relatedreactions. Hence, the observed discrepancies of a factor of 2 ormore are to be expected. Similar comments apply to thetreatment of k3 by Park and co-workers, in which largediscrepancies are again observed at low pressure. For simplicity,Li et al. did not consider this channel.
Conclusion
The thermal decomposition of ethanol and its reactions withOH and H/D have been studied with both shock tube experi-ments and ab initio transition state theory-based master equationcalculations. Dissociation rate constants for ethanol have beenmeasured at high T in reflected shock waves using OH optical
Figure 19. Branching ratios for the three ethanol dissociation channelsover the T range 1308-1732 K. b, 0.20-0.28 atm expt present work;9, 0.36-0.50 atm expt present work; 2, 0.49-0.69 atm expt presentwork; (, 0.95-1.28 atm expt present work. Dotted lines, 0.2 atm theorypresent work; dashed lines, 0.4 atm theory present work; dash-dot-dot-dot lines, 0.6 atm theory present work; solid line, 1 atm theorypresent work. Black symbols and lines represent BR1 ) k1/(k1 + k2 +k3), blue symbols and lines represent BR2 ) k2/(k1 + k2 + k3), redsymbols and lines represent BR3 ) k3/(k1 + k2 + k3).
TABLE 5: Modified Arrhenius Expressionsa for RateCoefficients in the Decomposition of C2H5OH
pressure (atm) A (s-1)b n E0 (K)
C2H5OHf C2H4 + H2Oc
0.001 3.41 × 1059 -14.22 42 1100.01 2.62 × 1057 -13.29 42 9100.1 1.65 × 1052 -11.52 42 6501 5.23 × 1043 -8.90 41 02010 4.59 × 1032 -5.60 38 280100 3.84 × 10²⁰ -2.06 34 960
C2H5OHf CH3 + CH2OHc
0.001 1.20 × 1054 -12.94 50 3300.01 5.18 × 1059 -13.98 50 2800.1 1.62 × 1066 -15.30 53 0401 5.55 × 1064 -14.47 53 90010 1.55 × 1058 -12.29 53 230100 1.78 × 1047 -8.96 50 860
C2H5OHf C2H5 + OHc
0.001 8.10 × 1046 -11.33 55 8900.01 1.82 × 1056 -13.49 53 9700.1 4.65 × 1063 -14.99 55 1701 1.46 × 1065 -14.89 56 54010 2.79 × 1061 -13.40 56 910100 6.17 × 1051 -10.34 55 330
C2H5 + OHf C2H5OHd
infinity 2.65 × 10⁻⁹ -0.609 -38.4
CH3 + CH2OHf C2H5OHd
infinity 2.77 × 10⁻¹⁰ -0.189 22.9
a Rate coefficient ) A Tn exp(-E0/T), where T is in K. b For theC2H5 + OH f C2H5OH and CH3 + CH2OH f C2H5OH reactions,the parameter A has units of cm3 molecule-1 s-1. c Valid over the Trange 800-2000 K. d Valid over the T range 200-2000 K.
Figure 20. Arrhenius plot of the theoretical predictions for the ratecoefficient k1. The solid, dashed, and dotted lines represent the presenttheory, the theory of Park et al.,10 and that of Li et al.,3 respectively.The red and blue lines denote results for pressures of 1 and 10 atm,respectively.
Figure 21. Arrhenius plot of the theoretical predictions for the ratecoefficient k2. The solid, dashed, and dotted lines represent the presenttheory, the theory of Park et al.,10 and that of Li et al.,3 respectively.The red and blue lines denote results for pressures of 1 and 10 atm,respectively.
Decomposition, Bimolecular Reactions of Ethanol J. Phys. Chem. A, Vol. 114, No. 35, 2010 9437
absorption and high-sensitivity H-atom ARAS detection. Thepresent theoretical predictions are in good agreement with theexperimental data for the three kinetically relevant dissociationchannels.
OH optical absorption using the multipass cell was also usedto study the reaction of OH with ethanol using tert-butylhydroperoxide (tBH) as the thermal source for OH. The presentexperiments can be represented by the Arrhenius expression
over the T range 857-1297 K. The theoretical predictions forthis abstraction reaction are in good agreement with the availableexperimental database, including the present high-T experiments.
D-atom ARAS was used to study the reaction of D withethanol, and the rate constants from the present experimentscan be represented by the Arrhenius expression,
over the T range 1054-1359 K. The present theory indicatesthat the isotope effect is minor at high T (>1000 K), andconsequently, the present experiments represent a direct mea-surement of the rate constants for H + C2H5OH f products.The theoretical predictions for this reaction are in excellentagreement with the present experiments. The predicted reactionexo- and endothermicities are in good agreement with the currentActive Thermochemical Tables values.
The present experimental and theoretical studies on theprimary thermal decomposition channels in ethanol and themajor abstraction channels involving H and OH now provide abetter description of the high T combustion reactions of ethanol,and we recommend the present results for use in combustionmodeling.
Acknowledgment. This work was supported by the U.S.Department of Energy, Office of Basic Energy Sciences,Division of Chemical Sciences, Geosciences, and Biosciences,under Contract no. DE-AC02-06CH11357.
Supporting Information Available: Tables of experimentaldata (S1-S4) have been provided as Supporting Information.This material is available free of charge via the Internet at http://pubs.acs.org.
References and Notes
(1) Marinov, N. M. Int. J. Chem. Kinet. 1999, 31, 183.(2) Park, J.; Zhu, R. S.; Lin, M. C. J. Chem. Phys. 2002, 117, 3224.(3) Li, J.; Kazakov, A.; Dryer, F. L. J. Phys. Chem. A 2004, 108, 7671.(4) Tsang, W. Int. J. Chem. Kinet. 2004, 36, 456.(5) Herzler, J.; Manion, J. A.; Tsang, W. J. Phys. Chem. A 1997, 101,
5500.(6) Park, J.; Chen, R.; Chen, J.; Lin, M. C. Experimental and
Computational Studies of the Unimolecular Decomposition of Ethanol.Presented at the Eastern States Section Fall Technical Meeting of theCombustion Institute, Hilton Head, SC, 2001, p 187.
(7) Klippenstein, S. J. J. Chem. Phys. 1992, 96, 367.(8) Georgievskii, Y.; Klippenstein, S. J. J. Phys. Chem. A 2003, 107,
9776.(9) Xu, S.; Lin, M. C. Proc. Combust. Inst. 2007, 31, 159.
(10) Park, J.; Xu, Z. F.; Lin, M. C. J. Chem. Phys. 2003, 118, 9990.(11) Michael, J. V. Prog. Energy Combust. Sci. 1992, 18, 327.(12) Michael, J. V. In AdVances in Chemical Kinetics and Dynamics
Barker, J. R., Ed.; JAI: Greenwich, 1992, Vol. I, pp 47-112; for originalreferences.
(13) Michael, J. V.; Sutherland, J. W. Int. J. Chem. Kinet. 1986, 18,409.
(14) Michael, J. V. J. Chem. Phys. 1989, 90, 189.(15) Michael, J. V.; Fisher, J. R. In SeVenteenth International Symposium
on Shock WaVes and Shock Tubes; Kim, Y. W., Ed.; AIP ConferenceProceedings 208; American Institute of Physics: New York, 1990, pp 210-215.
(16) Su, M.-C.; Kumaran, S. S.; Lim, K. P.; Michael, J. V. ReV. Sci.Instrum. 1995, 66, 4649.
(17) Su, M.-C.; Kumaran, S. S.; Lim, K. P.; Michael, J. V.; Wagner,A. F.; Harding, L. B.; Fang, D.-C. J. Phys. Chem. A 2002, 106, 8261.
(18) Srinivasan, N. K.; Su, M.-C.; Sutherland, J. W.; Michael, J. V. J.Phys. Chem. A 2005, 109, 1857.
(19) Lim, K. P.; Michael, J. V. Proc. Comb. Inst. 1994, 25, 713, andreferences therein.
(20) Kumaran, S. S.; Su, M.-C.; Lim, K. P.; Michael, J. V. Proc. Comb.Inst. 1996, 26, 605.
(21) Michael, J. V.; Lifshitz, A. Handbook of Shock WaVes, Ben-Dor,G., Igra, O., Elperin, T., Lifshitz, A., Eds.; Academic Press: New York,2001; Vol. 3; pp 77-105.
(22) Srinivasan, N. K.; Su, M.-C.; Michael, J. V. J. Phys. Chem. A 2007,111, 3951.
(23) Curtiss, L. A.; Raghavachari, K.; Redfern, P. C.; Rassolov, V.;Pople, J. A. J. Chem. Phys. 1998, 109, 7764.
(24) Dunning, T. H., Jr. J. Chem. Phys. 1989, 90, 1007.(25) Kendall, R. A.; Dunning, T. H., Jr.; Harrison, R. J. J. Chem. Phys.
1992, 96, 6796.(26) Becke, A. D. J. Chem. Phys. 1993, 98, 5648.(27) Werner, H.-J. Mol. Phys. 1996, 89, 845.(28) Celani, P.; Werner, H.-J. J. Chem. Phys. 2000, 112, 5546.(29) Lee, T. J.; Taylor, P. R. Int. J. Quantum Chem. 1989, 23, 199.(30) Mebel, A. M.; Morkuma, K.; Lin, M. C. J. Chem. Phys. 1995, 103,
7414.(31) Baboul, A. G.; Curtiss, L. A.; Redfern, P. C.; Raghavachari, K.
J. Chem. Phys. 1999, 110, 7650.(32) Ochterski, J. W.; Petersson, G. A.; Montgomery, J. A. J. Chem.
Phys. 1996, 104, 2598. (a) Montgomery, J. A.; Ochterski, J. W.; Petersson,G. A. J. Chem. Phys. 1994, 101, 5900.
(33) Ruscic, B.; Pinzon, R. E.; Morton, M. L.; von Laszewski, G.;Bittner, S.; Nijsure, S. G.; Amin, K. A.; Minkoff, M.; Wagner, A. F. J.Phys. Chem. A 2004, 108, 9979. (a) Ruscic, B.; Pinzon, R. E.; vonLaszewski, G.; Kodeboyina, D.; Burcat, A.; Leahy, D.; Montoya, D.;Wagner, A. F. J. Phys. Conf. Ser. 2005, 16, 561.
(34) Ruscic, B.; Pinzon, R. E.; Morton, M. L.; Srinivasan, N. K.; Su,M.-C.; Sutherland, J. W.; Michael, J. V. J. Phys. Chem. A 2006, 110, 6592.(a) Widicus Weaver, S. L.; Woon, D. E.; Ruscic, B.; McCall, B. J. Astrophys.J. 2009, 697, 601. (b) Stevens, W. R.; Ruscic, B.; Baer, T. submitted.
(35) Townsend, D.; Lahankar, S. A.; Lee, S. K.; Chambreau, S. D.; Suits,A. G.; Zhang, X.; Rheinecker, J.; Harding, L. B.; Bowman, J. M. Science2004, 306, 1158.
(36) Sivaramakrishnan, R.; Michael, J. V.; Klippenstein, S. J. J. Phys.Chem. A 2010, 114, 755.
(37) Harding, L. B.; Georgievskii, Y.; Klippenstein, S. J. J. Phys. Chem.A 2010, 114, 765.
(38) Miller, J. A.; Klippenstein, S. J.; Raffy, C. J. Phys. Chem. A 2002,106, 4904.
Figure 22. Arrhenius plot of the theoretical predictions for the ratecoefficient k3. The solid and dashed lines represent the present theoryand the theory of Park et al.,10 respectively. The red and blue linesdenote results for pressures of 1 and 10 atm, respectively.
k ) (2.5 ( 0.43) × 10-11 exp(-911 ( 191 K/T)cm3 molecule-1 s-1
k ) (3.98 ( 0.76) × 10-10 exp(-4494 ( 235 K/T)cm3 molecule-1 s-1
9438 J. Phys. Chem. A, Vol. 114, No. 35, 2010 Sivaramakrishnan et al.
(39) Miller, J. A.; Klippenstein, S. J. J. Phys. Chem. A 2006, 110, 10528.(40) Jasper, A. W.; Klippenstein, S. J.; Harding, L. B.; Ruscic, B. J.
Phys. Chem. A 2007, 111, 3932.(41) Klippenstein, S. J.; Georgievskii, Y.; Harding, L. B. Phys. Chem.
Chem. Phys. 2006, 8, 1133.(42) MRCC, a string-based quantum chemical program suite; written
by Kallay, M. (a) See also Kallay, M.; Surjan, P. R. J. Chem. Phys. 2001,115, 2945.
(43) Kallay, M.; Gauss, J. J. Chem. Phys. 2005, 123, 214105.(44) Woon, D. E.; Dunning, T. H. J. Chem. Phys. 1995, 103, 4572.(45) Galano, A.; Alvarez-Idaboy, J. R.; Bravo-Perez, G.; Ruiz-Santoyo,
M. E. Phys. Chem. Chem. Phys. 2002, 4, 4648.(46) Overend, R.; Paraskevopoulos, G. J. Phys. Chem. 1978, 82, 1379.(47) Ravishankara, A. R.; Davis, D. D. J. Phys. Chem. 1978, 82, 2852.(48) Meier, U.; Grotheer, H.-H.; Riekert, G.; Just, Th. Chem. Phys. Lett.
1985, 115, 221; Chem. Phys. Lett. 1987, 133, 162.(49) Greenhill, P. G.; O’Grady, B. V. Aust. J. Chem. 1986, 39, 1775.(50) Wallington, T. J.; Kurylo, M. J. Int. J. Chem. Kinet. 1987, 19, 1015.(51) Hess, W. P.; Tully, F. P. Chem. Phys. Lett. 1988, 152, 183.(52) Nelson, L.; Rattigan, O.; Neavyn, R.; Sidebottom, H.; Treacy, J.;
Nielsen, O. J. Int. J. Chem. Kinet. 1990, 22, 1111.(53) Bott, J. F.; Cohen, N. Int. J. Chem. Kinet. 1991, 23, 1075.(54) Jimenez, E.; Gilles, M. K.; Ravishankara, A. R. J. Photochem.
Photobiol., A 2003, 157, 237.(55) Dillon, T. J.; Holscher, D.; Sivakumaran, V.; Horowitz, A.; Crowley,
J. N. Phys. Chem. Chem. Phys. 2005, 7, 249.(56) Rajakumar, B.; Burkholder, J. B.; Portmann, R. W.; Ravishankara,
A. R. Phys. Chem. Chem. Phys. 2005, 7, 2498.(57) Kovacs, G.; Szasz-Vadasz, T.; Papadimitriou, V. C.; Dobe, S.;
Berces, T.; Marta, F. React. Kinet. Catal. Lett. 2005, 87, 129.(58) Carr, S. A.; Baeza-Romero, M. T.; Blitz, M. A.; Price, B. J. S.;
Seakins, P. W. Int. J. Chem. Kinet. 2008, 40, 504.(59) Von Aders, W.-K.; Wagner, H. G. Ber. Bunsenges. Phys. Chem.
1973, 77, 712.(60) Pagsberg, P.; Munke, J.; Sillesen, A.; Anastasi, C. Chem. Phys.
Lett. 1988, 146, 375.(61) Fagerstrom, K.; Lund, A.; Mahmoud, G.; Jodkowski, J. T.;
Ratajaczak, E. Chem. Phys. Lett. 1993, 208, 321.(62) Du, H.; Hessler, J. P. J. Chem. Phys. 1992, 96, 1077.(63) Ruscic, B.; Wagner, A. F.; Harding, L. B.; Asher, R. L.; Feller,
D.; Dixon, D. A.; Peterson, K. A.; Song, Y.; Qian, X.; Ng, C. Y.; Liu, J.;Chen, W.; Schwenke, D. W. J. Phys. Chem. A 2002, 106, 2727.
(64) Herbon, J. T.; Hanson, R. K.; Golden, D. M.; Bowman, C. T. Proc.Combust. Inst. 2002, 29, 1201.
(65) Wooldridge, M. S.; Hanson, R. K.; Bowman, C. T. Int. J. Chem.Kinet. 1994, 26, 389.
(66) Oldenborg, R. C.; Loge, G. W.; Harridine, D. M.; Winn, K. R. J.Phys. Chem. 1992, 96, 8426.
(67) Michael, J. V.; Su, M.-C.; Sutherland, J. W.; Carroll, J. J.; Wagner,A. F. J. Phys. Chem. A 2002, 106, 5297.
(68) Srinivasan, N. K.; Su, M.-C.; Sutherland, J. W.; Michael, J. V.;Ruscic, B. J. Phys. Chem. A 2006, 110, 6602–6607.
(69) Wu, C.-W.; Lee, Y.-P.; Xu, S.; Lin, M. C. J. Phys. Chem. A 2007,111, 6693.
(70) Taylor, P. H.; Yamada, T.; Marshall, P. Int. J. Chem. Kinet. 2006,38, 489.
(71) Gupte, K. S.; Kiefer, J. H.; Tranter, R. S.; Klippenstein, S. J.;Harding, L. B. Proc. Combust. Inst. 2007, 31, 167.
(72) Vasudevan, V.; Davidson, D. F.; Hanson, R. K. Int. J. Chem. Kinet.2005, 37, 98.
(73) Vasudevan, V.; Davidson, D. F.; Hanson, R. K. J. Phys. Chem. A2005, 109, 3352.
(74) Kumaran, S. S.; Carroll, J. J.; Michael, J. V. Proc. Combust. Inst.1998, 27, 125.
(75) Krasnoperov, L. N.; Chesnokov, E. N.; Stark, H.; Ravishankara,A. R. J. Phys. Chem. A 2004, 108, 11526.
(76) Baulch, D. L.; Cobos, C. J.; Cox, R. A.; Esser, C.; Frank, P.; Just,Th.; Kerr, J. A.; Pilling, M. J.; Troe, J.; Walker, R. W.; Warnatz, J. J.Phys. Chem. Ref. Data 1992, 21, 411.
(77) Srinivasan, N. K.; Su, M.-C.; Sutherland, J. W.; Michael, J. V. J.Phys. Chem. A 2005, 109, 7902.
(78) Jasper, A. W.; Klippenstein, S. J.; Harding, L. B.; Ruscic, B. J.Phys. Chem. A 2007, 111, 3932.
(79) Srinivasan, N. K.; Su, M.-C.; Michael, J. V. Phys. Chem. Chem.Phys. 2007, 9, 4155.
(80) Lim, K. P.; Michael, J. V. J. Chem. Phys. 1993, 98, 3919.(81) Fockenberg, C.; Hall, G. E.; Preses, J. M ; Sears, T. J.; Muckerman,
J. T. J. Phys. Chem. A 1999, 103, 5722. (a) Preses, J. M.; Fockenberg, C.;Flynn, G. W. J. Phys. Chem. A 2000, 104, 6758.
(82) Michael, J. V.; Keil, D. G.; Klemm, R. B. Int. J. Chem. Kinet.1983, 15, 705.
(83) Krasnoperov, L. N.; Michael, J. V. J. Phys. Chem. A 2004, 108,5643.
(84) Su, M.-C.; Michael, J. V. Proc. Combust. Inst. 2002, 29, 1219.(85) Michael, J. V.; Su, M.-C.; Sutherland, J. W.; Harding, L. B.;
Wagner, A. F. Proc. Combust. Inst. 2005, 30, 965.(86) Sugawara, K.; Okazaki, K.; Sato, S. Bull. Chem. Soc. Jpn. 1981,
54, 2872.
JP104759D
Decomposition, Bimolecular Reactions of Ethanol J. Phys. Chem. A, Vol. 114, No. 35, 2010 9439

RATE CONSTANTS FOR THE THERMAL DECOMPOSITION OF ETHANOL
AND ITS BIMOLECULAR REACTIONS WITH OH AND D: REFLECTED
SHOCK TUBE AND THEORETICAL STUDIES
by
R. Sivaramakrishnan, M.-C. Su,&
J. V. Michael,*
S. J. Klippenstein,* L. B. Harding, and B. Ruscic
Supplementary Information
The experimental data are given below in supplementary tables S1-S4.

Table S1: High-T Rate Data: C2H5OH +OH → CH3CHO + H + H2O
P1 /
Torr
Msa ρ
5 / (1018 cm–3)b T5 / K
b k12
c k12
d Φ
e
XC2H5OH.
= 9.383 x 10⁻⁵
XtBH Sol`n.
= 2.536 x 10⁻⁵
10.89 2.241 1.852 1287 1.620(-11) 1.625(-11) 0.300
10.93 2.251 1.867 1297 1.333(-11) 1.360(-11) 0.310
10.96 2.105 1.728 1150 1.150(-11) 1.100(-11) 0.320
10.92 2.103 1.719 1148 1.103(-11) 1.075(-11) 0.313
10.88 1.970 1.571 1022 1.091(-11) 1.025(-11) 0.310
10.91 2.061 1.674 1108 1.174(-11) 1.070(-11) 0.325
10.86 2.126 1.733 1171 1.244(-11) 1.125(-11) 0.305
10.88 2.059 1.661 1109 1.132(-11) 1.075(-11) 0.310
10.96 1.985 1.599 1036 9.860(-12) 9.850(-12) 0.300
XC2H5OH.
= 9.383 x 10⁻⁵
XtBH Sol`n.
= 2.536 x 10⁻⁵
15.88 1.999 2.378 1049 1.020(-11) 9.800(-12) 0.318
15.86 1.996 2.370 1045 9.834(-12) 9.800(-12) 0.320
15.97 2.091 2.531 1134 1.056(-11) 1.000(-11) 0.337
15.90 2.126 2.553 1175 1.086(-11) 1.025(-11) 0.335
15.99 2.123 2.562 1172 1.114(-11) 1.030(-11) 0.315
15.92 2.235 2.706 1283 1.118(-11) 1.250(-11) 0.310
15.93 2.183 2.637 1231 1.196(-11) 1.175(-11) 0.300
15.90 2.192 2.644 1240 1.088(-11) 1.075(-11) 0.310
15.92 2.145 2.583 1194 1.180(-11) 1.100(-11) 0.310
15.86 2.105 2.524 1151 1.280(-11) 1.225(-11) 0.308
XC2H5OH.
= 4.885 x 10⁻⁵
XtBH Sol`n.
= 1.394 x 10⁻⁵ 30.98 1.790 3.838 857 9.466(-12) 9.400(-12) 0.325
30.64 1.810 3.889 868 9.843(-12) 9.700(-12) 0.330
30.79 1.849 4.007 907 9.789(-12) 9.650(-12) 0.325
30.67 1.880 4.088 933 9.225(-12) 9.250(-12) 0.320
30.66 1.891 4.120 943 1.080(-11) 1.000(-11) 0.320
30.97 1.901 4.200 951 9.880(-12) 9.850(-12) 0.320 aThe error in measuring the Mach number, Ms, is typically 0.5-1.0 % at the one standard
deviation level. bQuantities with the subscript 5 refer to the thermodynamic state of the
gas in the reflected shock region. cRate constants: pseudo first order in units cm3
molecule-1
s-1
. dRate constants from modeling OH profiles using scheme in Table 4 in
units cm3 molecule
-1 s
-1.
e Φ = XtBH / XtBH Sol`n.

Table S2: High-T Rate Data: D + C2H5OH → Products
P1 /
Torr
Msa ρ
5 / (1018 cm–3)b T5 / K
b k13
c
XC2H5OH.
= 8.652 x 10⁻⁵
XC2D5I
= 5.092 x 10⁻⁷ 15.92 2.180 2.615 1236 9.961(-12)
15.92 2.217 2.663 1273 1.162(-11)
15.86 2.300 2.761 1359 1.494(-11)
15.94 2.256 2.719 1314 1.328(-11)
15.88 2.261 2.715 1319 1.370(-11)
15.95 2.174 2.610 1230 9.961(-12)
15.89 2.135 2.545 1192 8.716(-12)
15.88 2.145 2.567 1198 9.131(-12)
15.94 2.105 2.520 1159 8.301(-12)
XC2H5OH.
= 8.652 x 10⁻⁵
XC2D5I
= 5.092 x 10⁻⁷
30.78 2.188 4.977 1222 9.546(-12)
30.92 2.154 4.908 1188 7.969(-12)
30.83 2.087 4.710 1124 7.471(-12)
30.83 2.023 4.528 1064 5.728(-12)
30.82 2.052 4.595 1095 7.139(-12)
XC2H5OH.
= 8.349 x 10⁻⁵
XC2D5I
= 4.997 x 10⁻⁷ 30.90 2.012 4.506 1054 6.641(-12)
30.75 2.123 4.797 1158 8.301(-12)
30.70 2.100 4.726 1136 7.886(-12) aThe error in measuring the Mach number, Ms, is typically 0.5-1.0 % at the one standard
deviation level. bQuantities with the subscript 5 refer to the thermodynamic state of the
gas in the reflected shock region. cRate constants from modeling D profiles using
scheme in Table 4 in units cm3 molecule
-1 s
-1.

Table S3: High-T Rate Data: C2H5OH + M → C2H4 + H + OH + M
P1 /
Torr
Msa ρ
5 / (1018 cm–3)b T5 / K
b k3
c
XC2H5OH.
= 1.155 x 10⁻⁴
10.95 2.340 1.954 1392 5.117(-18)
XC2H5OH.
= 2.257 x 10⁻⁴
10.89 2.479 2.051 1555 4.875(-17)
XC2H5OH.
= 3.736x 10⁻⁴
10.89 2.442 2.037 1502 3.683(-17)
10.92 2.582 2.157 1663 1.855(-16)
10.88 2.459 2.049 1521 3.904(-17)
XC2H5OH.
= 2.341 x 10⁻⁴
15.94 2.391 2.909 1445 1.031(-17)
15.83 2.470 2.981 1530 3.355(-17)
15.88 2.461 2.981 1521 3.355(-17)
15.91 2.402 2.917 1456 1.714(-17) aThe error in measuring the Mach number, Ms, is typically 0.5-1.0 % at the one standard
deviation level. bQuantities with the subscript 5 refer to the thermodynamic state of the
gas in the reflected shock region. cRate constants: bimolecular in units cm3molecule
-1 s
-1.

Table S4: High-T Rate Data: C2H5OH → C2H4 + H2O, C2H5OH → CH3 + CH2O + H
P1 /
Torr
Msa ρ
5 / (1018 cm–3)b T5 / K
b k1
c k2
c BR2,3
d
XC2H5OH.
= 2.339 x 10⁻⁶
5.94 2.636 1.192 1732 10500 4184 0.300
5.93 2.522 1.142 1597 6750 2178 0.250
5.94 2.507 1.137 1579 4290 1153 0.220
5.92 2.394 1.082 1451 1691 400 0.195
5.94 2.333 1.060 1381 840 157 0.160
5.71 2.403 1.051 1457 3075 665 0.180
5.97 2.418 1.106 1473 2460 527 0.180
XC2H5OH.
= 1.025 x 10⁻⁶
10.96 2.306 1.917 1361 424 121 0.230
10.87 2.500 2.076 1571 5040 1822 0.280
10.87 2.471 2.052 1538 5181 1331 0.215
10.93 2.483 2.073 1551 3876 1119 0.240
10.98 2.377 1.991 1433 1615 267 0.150
10.89 2.387 1.984 1444 1200 279 0.200
10.90 2.478 2.070 1540 3420 989 0.240
10.89 2.391 1.987 1448 2187 490 0.190
10.94 2.435 2.034 1497 2340 611 0.220
10.94 2.352 1.962 1406 1290 199 0.140
10.90 2.475 2.061 1542 6105 2052 0.260
10.94 2.594 2.164 1681 12420 5068 0.310
XC2H5OH.
= 2.339 x 10⁻⁶
10.89 2.339 1.947 1386 731 111 0.140
10.9 2.549 2.128 1623 7097 2039 0.245
10.94 2.395 2.000 1452 2053 473 0.195
10.77 2.521 2.074 1596 6503 1808 0.235
10.84 2.458 2.035 1523 3100 829 0.225
10.87 2.371 1.970 1421 1260 226 0.160
10.91 2.367 1.980 1417 850 137 0.150
XC2H5OH.
= 1.025x 10⁻⁶
15.89 2.420 2.930 1479 1884 455 0.215
15.90 2.414 2.935 1467 1774 326 0.175
15.78 2.328 2.809 1375 1104 86 0.08
15.91 2.348 2.856 1396 792 93 0.12
15.87 2.387 2.897 1438 1408 160 0.12
15.90 2.401 2.919 1453 1868 342 0.17
15.89 2.502 3.033 1563 3850 943 0.23
15.97 2.557 3.109 1626 8195 2343 0.255
XC2H5OH.
= 6.470x 10⁻⁷
15.89 2.503 3.034 1564 4575 1315 0.250

15.90 2.519 3.054 1583 5325 1906 0.290
15.94 2.541 3.586 1607 8750 3384 0.300
XC2H5OH.
= 2.339 x 10⁻⁶
15.99 2.263 2.763 1308 107 11 0.110
15.99 2.368 2.900 1418 1050 128 0.125
15.84 2.371 2.870 1421 860 116 0.140
XC2H5OH.
= 6.470 x 10⁻⁷
30.86 2.450 5.663 1486 3488 884 0.225
30.8 2.368 5.463 1398 1485 286 0.175
30.97 2.374 5.507 1404 1733 485 0.230
30.84 2.554 5.885 1601 6900 2450 0.310
30.8 2.387 5.507 1418 1501 358 0.210
30.86 2.291 5.286 1318 595 49 0.085 aThe error in measuring the Mach number, Ms, is typically 0.5-1.0 % at the one standard
deviation level. bQuantities with the subscript 5 refer to the thermodynamic state of the
gas in the reflected shock region. cRate constants: First order in s
-1.
d BR2,3 = k2+k3 /
(k1+k2+k3).