RussiaPower 2012_Moscow_Paper Siemens_SGT5-2000E_Richter-Rev.pdf

by
Judith Chegwidden &Suzanne Shaw
Roskill Information Services Ltd
“Rare Earths: The Uncertainties of Supply”

DISCLAIMER
2
The statements in this presentation represent the considered views of Roskill InformationServices Ltd (Roskill). It includes certain statements that may be deemed "forward-lookingstatements." All statements in this presentation, other than statements of historical facts,that address future market developments, government actions and events, are forward-looking statements. Although Roskill believe the outcomes expressed in such forward-looking statements are based on reasonable assumptions, such statements are notguarantees of future performance and actual results or developments may differmaterially from those in forward-looking statements. Factors that could cause actualresults to differ materially from those in forward-looking statements include new rareearth applications, the development of economic rare earth substitutes and generaleconomic, market or business conditions.While, Roskill has made every reasonable effort to ensure the veracity of the informationpresented it cannot expressly guarantee the accuracy and reliability of the estimates,forecasts and conclusions contained herein. Accordingly, the statements in thepresentation should be used for general guidance only.

What are the Rare Earths?
Why are they important?
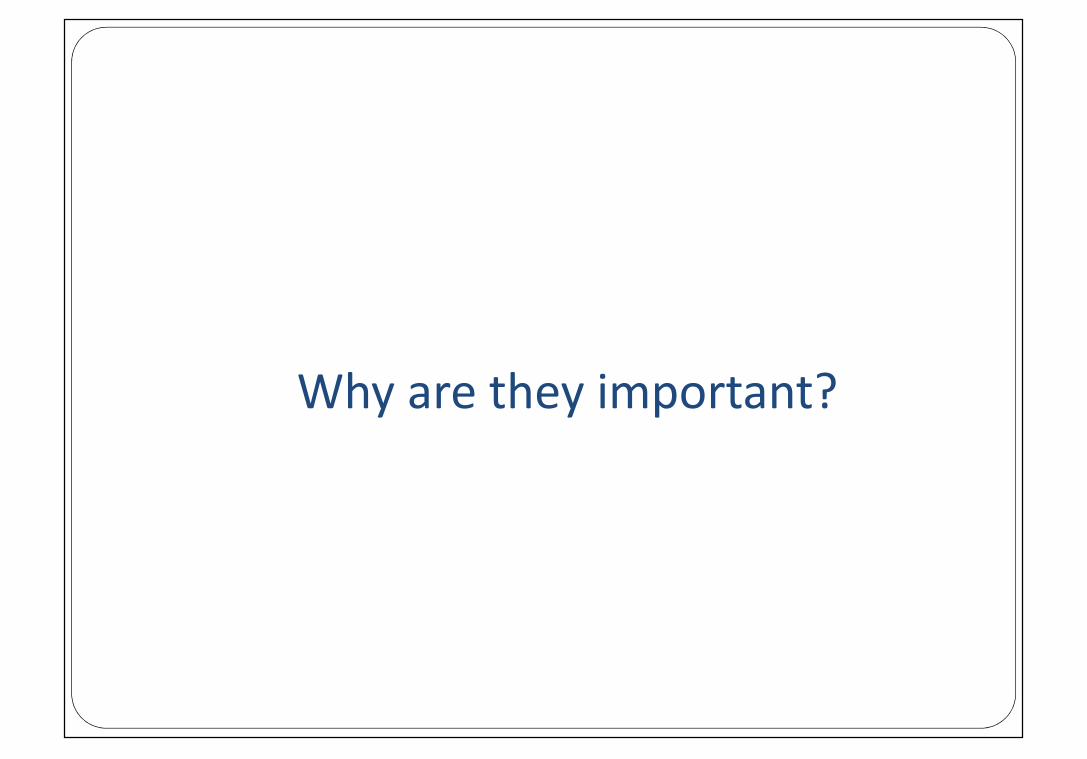
Main applications of rare earth elementsElement Symbol Atomic Wt. Main sectors of useLanthanum La 138.92 FCC catalysts, alloys/mischmetal (for NiMH batteries, hydrogen absorption, and creep
resistant magnesium), optical glass, additive to produce nodular cast iron, lighter flints,phosphors
Cerium Ce 140.13 Catalytic converters, glass, ceramic and plastic pigments, polishing, de-oxidant anddesulphuriser in the steel industry, self-cleaning ovens, carbon-arc lighting, mischmetal
Praseodymium Pr 140.92 NdFeB magnet corrosion resistance, high-strength metals, yellow glass and ceramicpigment
Neodymium Nd 144.27 NdFeB magnets, glass and ceramics, autocatalysts, lasers
Samarium Sm 150.43 Magnets, carbon arc lighting, lasers, biofuel catalysts, mischmetal, geological dating, nuclearapplications, medical uses, optical glass
Europium Eu 152.00 Phosphors, lighting, neutron absorbers
Gadolinium Gd 156.90 Contrast agents to enhance MRI imaging, GdY garnets, phosphors, superconductors, glassand ceramics
Terbium Tb 159.20 Phosphors, fuel cells, lighting, magnets
Dysprosium Dy 162.46 NdFeB magnets, lasers, chalcogenide sources of infrared radiation, ceramics, nuclearapplications, phosphors, lighting, catalysts
Holmium Ho 163.50 High strength magnets, nuclear (control rods, medical uses), lasers, red and yellowpigments in glass and zirconia, calibration of gamma ray spectrometers
Erbium Er 167.20 Colourant in glassware and ceramics, metal alloys, repeaters in fibre optic cables, nuclearapplications (medical)
Thulium Tm 169.40 Possible use in ferrites for microwaves, medical imaging, phosphors, lasers
Ytterbium Yb 173.04 Fibre optics, radiation source for x-ray machines, stress gauges, lasers, doping of stainlesssteel, doping of optical materials
Lutetium Lu 174.99 Specialist X-ray phosphor, catalysts (rarely used), single crystal scintillators (baggagescanners, oil exploration)
Yttrium Y 88.92 Phosphors, stabilised zirconia, metal alloys, garnets, lasers, catalyst for ethylenepolymerisation, ceramics, radar technology, superconductors
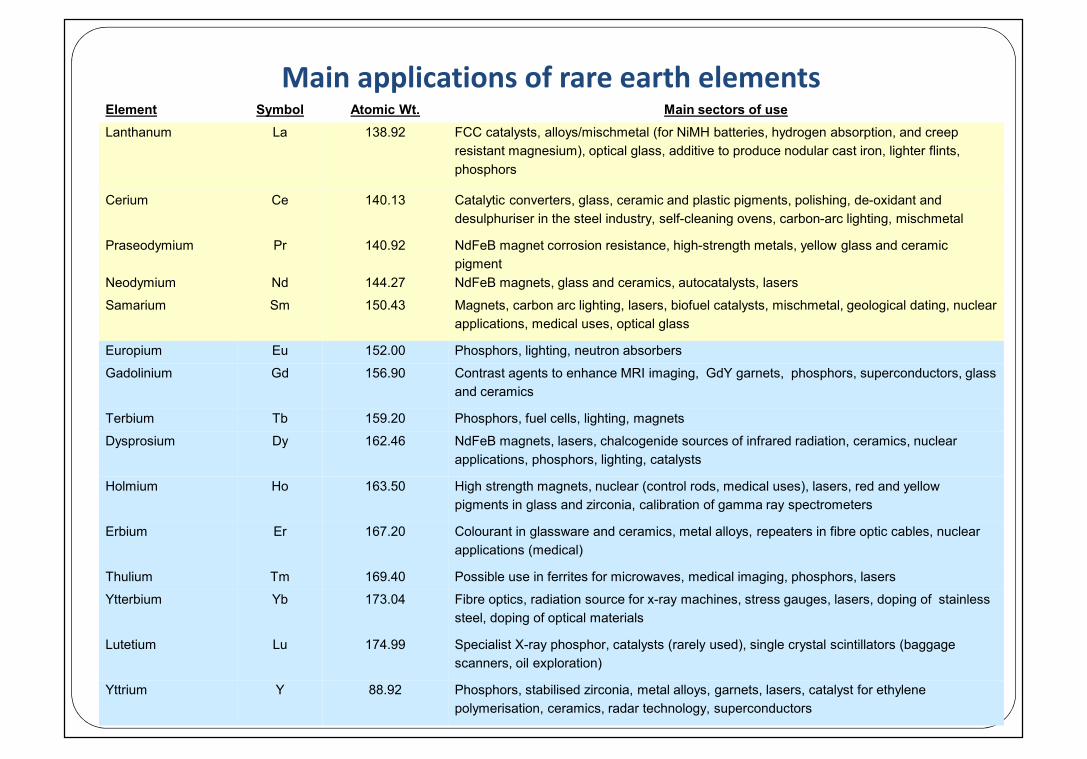
At least 95% of all supply of REEscurrently originate in China
0
20,000
40,000
60,000
80,000
100,000
120,000
140,000
160,000
China ROW

Why have they hit the headlines in thelast 18 Months?
7
China unofficially temporarily suspends shipments ofrare earths to Japan (September and October 2010)
Chinese export quotas reduced significantly in July2010 and further reduced in January 2011
China declares ‘heavy’ rare earths resources arefinite (approximately 15-20 years)
Chinese rare earths industry consolidation New western producers -Mt Weld & Mountain Pass –
establishing production capacity of at least20,000tpa REO each

China: Export Quota HistoryChinese Export Quota History 2005-2010 (Tonnes Product)
YearRare Earth Quotas ROW
DemandDomestic
CompaniesForeign
CompaniesTotal Change
2005 48,040t 17,659t 65,609t 0% 46,000t
2006 45,752t 16,069t 61,821t -6% 50,000t
2007 43,574t 16,069t 59,643t -4% 50,000t
2008 Actual: 34,156tAdjusted: 40,987t*
Actual:13,293tAdjusted: 15,834t*
Actual: 47,449tAdjusted: 56,939t* -5½%* 50,000t
2009 33,300t 16,845t 50,145t -12% 25,000t
2010 22,512t 7,746t 30,258t -40% 53-58,000t
2011 H1 10,726 3,684 n/a n/a 55-60,000tNote: * Quotas adjusted to an equivalent 12 month quota as there was a change in the dates for which they were issued;so that now they are for a calendar year

Global Rare Earths Consumption in 2010
Estimated Global Rare Earths Demand in 2010 (t REO ±15%)
Application China Japan &NE Asia
USA Others Total MarketShare
Catalysts 9,000 3,000 9,000 3,500 24,500 20%
Glass 7,000 1,500 1,000 1,500 11,000 9%
Polishing 10,500 6,000 1,000 1,500 19,000 15%
Metal Alloys 15,500 4,500 1,000 1,000 22,000 18%
Magnets 21,000 3,500 500 1,000 26,000 21%
Phosphors 5,500 2,000 500 500 8,500 7%
Ceramics 2,500 2,500 1,500 500 7,000 5%
Other 4,000 2,000 500 500 7,000 5%
Total 75,000 25,000 15,000 10,000 125,000 100%
Market Share 60% 20% 12% 8% 100% -
Source: Roskill, IMCOA, Industry sources

Rare Earths Growth in Consumption2010 to 2015
Global Rare Earths Demand in 2010 & 2015 (tpa REO)± 15%
ApplicationConsumption tpa REO Rate of
Growth2010-15
MarketShare20152010f 2015f
Catalysts 24,500 28,500 3-5%pa 15½%Glass 11,000 11,000 Negligible 6%Polishing 19,000 30,500 8-10% 16½%Metal Alloys 22,000 35,000 8-12% 19%Magnets 26,000 48,000 10-15% 26%Phosphors 8,500 13,000 6-10% 6%Ceramics 7,000 9,500 6-8% 5½%Other 7,000 9,500 6-8% 5½%Totals 125,000 185,000 6-10% 100%
Source: IMCOA
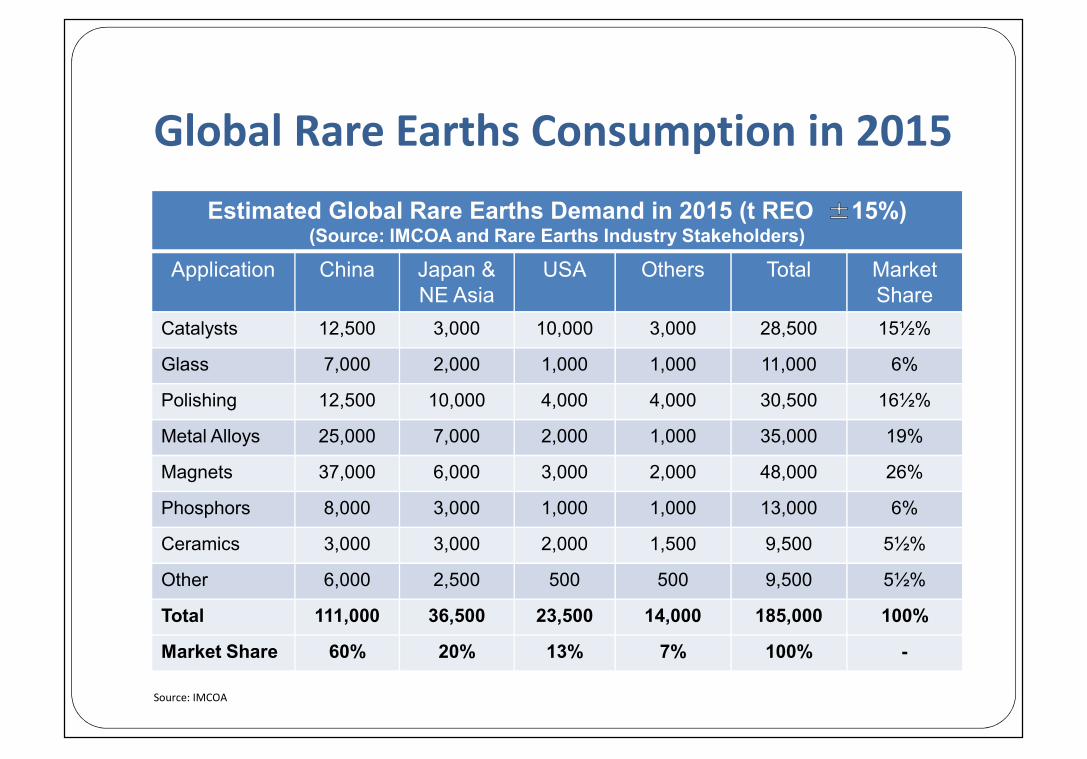
Global Rare Earths Consumption in 2015Estimated Global Rare Earths Demand in 2015 (t REO ±15%)
(Source: IMCOA and Rare Earths Industry Stakeholders)
Application China Japan &NE Asia
USA Others Total MarketShare
Catalysts 12,500 3,000 10,000 3,000 28,500 15½%
Glass 7,000 2,000 1,000 1,000 11,000 6%
Polishing 12,500 10,000 4,000 4,000 30,500 16½%
Metal Alloys 25,000 7,000 2,000 1,000 35,000 19%
Magnets 37,000 6,000 3,000 2,000 48,000 26%
Phosphors 8,000 3,000 1,000 1,000 13,000 6%
Ceramics 3,000 3,000 2,000 1,500 9,500 5½%
Other 6,000 2,500 500 500 9,500 5½%
Total 111,000 36,500 23,500 14,000 185,000 100%
Market Share 60% 20% 13% 7% 100% -
Source: IMCOA

Will supply meet demand?

Components of rare earth supply in 2008/2009 China
o 124,800t REO in chemical concentrates in 2008, falling to 120,000t in 2009
o Mainly from bastnaesite from Baotou and ion adsorption clay from southernprovinces
o Circa 10,000-20,000t REO from “unofficial” sources
Russiao 2,470t REO in chemical concentrates from mine output, falling to 1,898t in
2009
Indiao Circa 50t REO in chemical concentrates from tailings, possibly 75t REO in 2009
USAo 1,700t REO in chemical concentrates from stockpiled ore arising from mining in
the 1990s
Otherso Small amounts of monazite and xenotime from south east Asia

Facets of Chinese supply to R-O-W• Positive impact on supply:
o Reserves >50Mt REO (but mainly LREEs)
o Excess secondary processing capacity
o Access to relatively low cost processing chemicals
o Heavy investment in research and technology
• Negative impact on supply of REO and RE metals to R-O-W:
o Finite heavy rare earth resources (15-20 year mine life) but some recentdiscoveries
o Increasingly rigorous environmental legislation (plus clean–up costs)
o Policies to encourage downstream processing
o No new exploration and mining licences until 2011 (at the earliest)
o Export taxes
o Tighter mining and export quotas
o Uncertainty over future availability – very mixed messages in Q4 2010

Measuring the impact of diminishingquotas – 40% decline in 2010

China: Exports of selected rare earths,2001-2010 (t)
Source: Global Trade Atlas
-
5,000
10,000
15,000
20,000
25,000
2001 2002 2003 2004 2005 2006 2007 2008 2009 2010 Jan-Nov
Cerium oxide Rare earth oxides other than of cerium Cerium Compounds, Nes Lamthanum oxide

Comparison of Chinese domestic price and FOBprice 2007-2010
Source: Roskill, Metal Pages
0
200
400
600
800
1,000
1,200
1,400
0
10
20
30
40
50
60
70
80
90
100
La, Ce and Y
Pr,
Nd,
Eu,
Dya
nd T
b
Rare earth oxides: Percentage differential between China internal and FOB prices (%)
Praeseodymium Oxide Neodymium oxide Europium oxide Dysprosium oxide
Terbium oxide Lanthanum oxide Cerium oxide Yttrium oxide
How has this affected users in theUK?
Manufacturers of: Advanced magnet alloys Advanced ceramics Autocatalysts Metal alloys Polishing powders

UK Imports of rare earth compounds and metals –around 1% of world demand in 2010
0
50
100
150
200
250
300
350
400
0
500
1,000
1,500
2,000
2,500
3,000
3,500
1999 2000 2001 2002 2003 2004 2005 2006 2007 2008 2009 2010
Met
al &
allo
ys (t
)
Com
poun
ds (t
)
Cerium Compounds Compounds of rare earthss O/T cerium
Rare earth metals and alloys Linear (Cerium Compounds)
Linear (Compounds of rare earthss O/T cerium)
Source: GTA

But the UK imports rare earths in many otherforms
Fluid cracking catalysts for oil refining Wash coats for automotive emission control catalysts Diesel additives – for emission control NdFeB magnets for a wide range of consumer and
industrial applications Polishing compounds for glass and electronic
components Fluorescent lamps containing RE phosphors And many more ……….

Looking to the future -Existing and potential supply from
the Rest of the World

Rare earth operations under development – Lynas Corp - Mount Weld deposit, Western Australia, and a processing plant
in Gebeng, Malaysia Resource of 17.49Mt at 8.1% REO (equivalent to 1.42Mt REO) Concentrator will produce 35ktpy of concentrate grading 40% REO Phase 1 plant in Malaysia has 10,500tpy REO capacity with possible expansion
to 21,000tpy REO Start up planned for late 2011, full production by 2012 – sales contracts in
place Molycorp Minerals LLC - Over 50 years of production history at Mountain Pass,
California, USA Mining re-started on 23rd December 2010, mine life of 30 years Forecast production of 3-5,000tREO in 2011 rising to 19,090tpy by 2012/2013
and probably 40,000t REO by 2014/15 Plans for conversion of REOs to metal and alloys and then magnet
manufacture Sales contracts in place, Japanese companies taking stake in company

Other potential rare earth operations Japanese investments in potential producers of REEs
Sumitomo/Kazatomprom in Kazakhstan Toyota/Sojitz/Govt. of Vietnam at Dong Pao Toyota/Indian Rare Earths jv - new monazite processing plant in Orissa Mitsubishi/Neo Material Technologies in Brazil
Searching for sources of heavy rare earths – projects include Alkane Resources - proposed production of HREEs as by-product of zirconium production in
Australia Avalon Rare Metals Inc - feasibility study on producing HREEs in northern Canada Quest Rare Metals and Matamec exploring for HREEs in Quebec and Labrador Ucore exploring for HREEs in Alaska
Deposits of light rare earths are more common – those under investigation include Rareco (Great Western Minerals Group), Steenkramskaal, South Africa Arafura, Nolan’s project, Australia. Great Western Minerals Group, Hoidas Lake, Canada Rare Element Resources, Bear Lodge, Wyoming, USA

The search continues: Over 250 rareearth projects identified by early 2011

But commercial considerations are key:
Rare earths are not commodities – in many cases they are customerspecific
The rare earth projects that have emerged in the west are singleproject companies (debt has to be non-recourse project funded)
Developing a rare earth mine and processing plant is capital intensive(>US$40,000/t capacity)
History shows that the development time can be very long (10-15years)
Limited technical expertise on mining, cracking and separating outsideChina
Percentage REO content is only half the story – REO distribution andamenable mineralogy are important
Most deposits contain radioactive material that has to be containedand stored – a cost rather than a benefit for the moment
Projects that rely on shipping low grade concentrate over 100s of kmare going to be costly

Will production from the rest of the world plug theforecast supply gap?
0
10,000
20,000
30,000
40,000
50,000
60,000
70,000
2004 2005 2006 2007 2008 2009 2010f 2011f 2012f 2013f 2014f 2015f
Rest of the World: Mine production of REOs, 2004-2015 (t)
Source: Roskill

Evaluating the supply/demandbalance to 2015

2015 – Surplus or Deficit ?
0
50
100
150
200
250
2005 2006 2007 2008 2009 2010f 2011f 2012f 2013f 2014f 2015f
(000
t REO
)
ROW Supply China Supply Global demand China Demand
Source: IMCOA, Roskill

The Issue of ‘Balance’ in 2015
Forecast Supply and Demand for Selected Rare Earths in 2015
Rare Earth OxideDemand @
180,000tpa REOSupply @
208,500tpa REO
Cerium 63-68,000t REO 80-85,000t REO
Neodymium 35-40,000t REO 30-35,000t REO
Europium 725-775t REO 575-625t REO
Terbium 450-500t REO 375-425t REO
Dysprosium 2,500-3,000t REO 1,600-2,000t REO
Source: IMCOA