Rare Earth Metals - ASX · Government Audit Office report on Rare Earth materials in the defense...
32
Rare Earth Metals The Key to 21 st Century Technologies June 2010 Lynas Corporation Limited ACN: 009 066 648 For personal use only
Transcript of Rare Earth Metals - ASX · Government Audit Office report on Rare Earth materials in the defense...

Rare Earth MetalsThe Key to 21st Century Technologies
June 2010
Lynas Corporation Limited ACN: 009 066 648
For
per
sona
l use
onl
y

-2-
Disclaimer
► The release, publication or distribution of this presentation in certain jurisdictions may be restricted by law and therefore persons in such jurisdictions into which this presentation is released, published or distributed should inform themselves about and observe such restrictions.
► This presentation does not constitute, or form part of, an offer to sell or the solicitation of an offer to subscribe for or buy any securities, nor the solicitation of any vote or approval in any jurisdiction, nor shall there be any sale, issue or transfer of the securities referred to in this presentation in any jurisdiction in contravention of applicable law. This presentation is not an offer of securities for sale in the United States, nor does this presentation constitute a prospectus or other offering document in the United States or any other jurisdiction in which it is being used. Securities may not be offered or sold in the United States absent registration under the U.S. Securities Act of 1933, as amended, or an exemption from registration therefrom.
► Lynas Corporation Ltd is making this presentation available solely to persons that are either (A) “qualified institutional buyers” as defined in Rule 144A under the United States Securities Act of 1933 (the “Securities Act”) or (B) not US persons (as defined in Regulation S under the Securities Act) (“U.S. Person”) that are outside the United States. Any securities referred to herein have not been registered under the Securities Act, and may not be offered or sold in the United States or to, or for the account or benefit of, U.S. Persons unless the shares are registered under the Securities Act or an exemption from the registration requirements of the Securities Act is available. Any offer or sale of securities will be made pursuant to definitive documentation, including an offering memorandum, which describes the terms of the offering and the selling and transfer restrictions applicable to the offering.
► In providing this presentation, Lynas has not considered the financial position or needs of the recipient. Persons needing advice should consult their stockbroker, bank manager, solicitor, attorney, accountant or other independent financial and legal advisors. This presentation includes some forward-looking statements. These forward-looking statements are not historical facts but rather are based on Lynas’ current expectations, estimates and projections about the industry in which Lynas operates, and beliefs and assumptions regarding Lynas’ future performance. Words such as “scenario”, “anticipates”, “expects”, “intends”, “plans”, “believes”, “seeks”, “estimates”, “forecasts” and similar expressions are intended to identify forward-looking statements.
► These statements are not guarantees of future performance and are subject to known and unknown risks, uncertainties and other factors, some of which are beyond the control of Lynas, are difficult to predict and could cause actual results to differ materially from those expressed or forecasted in the forward-looking statements. Lynas cautions shareholders and prospective shareholders not to place undue reliance on these forward-looking statements, which reflect the view of Lynas only as of the date of this presentation. The forward-looking statements made in this presentation relate only to events as of the date on which the statements are made. Lynas will not undertake any obligation to release publicly any revisions or updates to these forward-looking statements to reflect events, circumstances or unanticipated events occurring after the date of this presentation except as required by law or by any appropriate regulatory authority.
For
per
sona
l use
onl
y

-3-
Rare Earths underpin new materials technology required to sustain the needs of today’s society
Environmental ProtectionEnergy Efficiency
Wind turbine Auto catalytic converter Diesel additives
Compact fluorescent lights Hybrid vehicleWeight reduction in cars
Smaller yet more powerful
Flat panel displays Disk Drives Digital cameras
through lower consumption through lower emissions digital technology
For
per
sona
l use
onl
y

-4-
The consumer electronics industry uses Rare Earths in many applications
GLASS ADDITIVESGLASS ADDITIVESCRT screens to stabilise
glass from cathode raySmall optical lenses with
excellent optical properties
POLISHING POWDERSPOLISHING POWDERSTV and computer screens LCD Plasma CRT
Optical lensesPrecision optical and
electronic components
PHOSPHORSPHOSPHORSREDRED GREENGREEN BLUEBLUETV and computer screens CRT Plasma LCD
HIGH POWER NEO MAGNETSHIGH POWER NEO MAGNETSDisk drives Computers Data storage Ipods Video recorders Gaming consoles Video cameras
Speakers
For
per
sona
l use
onl
y

-5-
Hybrid vehicle technology is dependent upon Rare Earths
HYBRID electric motor and generator Neodymium Praseodymium Dysprosium Terbium
Lanthanum Neodymium Cerium
Enabling better emission standards and lower energy consumption
HYBRID NiMH battery
For
per
sona
l use
onl
y

-6-
Weight reduction in the automotive industry with Rare Earths magnets improves fuel consumption
Weight Reduction Through New MagnetsWeight Reduction Through New Magnets Electric motor with Neo magnets is half the weight of
traditional ferrite motor Electric seats, windows and mirrors Sunroof and tail gate Windscreen wipers and washer jets Starter motor and alternator ABS braking plus many more
Replacing hydraulic systems for steering reduces significant weight and reduces power consumption
Reducing weight reduces energy consumption
For
per
sona
l use
onl
y

-7-
Clean Diesel TechnologyClean Diesel TechnologyRare Earths compound added to diesel
fuel in the carDiesel soot trapped in filterRare Earths allow soot to be burnt at
low temperature, thereby regenerating the filter
Rare Earths play a pivotal emissions control role in automotive catalytic converters and clean dieselAutoAuto--cats In Every New Carcats In Every New Car Autocats convert harmful gases to inert
gases Rare Earths enable
Improved performance Increased thermal stability Extended durability Reduced precious metals
Improving emission control technology
For
per
sona
l use
onl
y

-8-
New generation wind turbines are moving to permanent magnet turbines – a high growth market
Wind Turbine Power Wind Turbine Power
120GW global wind generation in 2008
18% annual growth forecast to 2020 to 700GW
Turbines scaling to 3MW plus, key differentiator
Generator technology moving to permanent magnets (PM) for larger turbines and offshore
Lighter, smaller, lower maintenance
400 units p.a. in 2008 (2% market)
Growing to 4,300 units p.a. in 2020 (16% market)
Each 3MW PM turbine uses 1 ton of neodymium
For
per
sona
l use
onl
y

-9-
Chemical▫ Unique electron configuration
Catalytic▫ Oxygen storage and release
Magnetic▫ High magnetic anisotropy and large
magnetic moment Optical▫ Fluorescence, high refractive index
Electrical▫ High conductivity
Metallurgical▫ Efficient hydrogen storage in
rare earths alloys
Lanthanides Plus Yttrium Are Rare EarthsLanthanides Plus Yttrium Are Rare Earths Properties Of Rare EarthsProperties Of Rare Earths
Rare Earths have unique properties which make them un-substitutable in many of the applications
For
per
sona
l use
onl
y

-10-
Demand for Rare Earths is driven by the underlying applications
Battery Alloy, 12%
Metallurgy ex battery, 9%
FCC, 16%
Polishing Powder, 15%
Glass Additive, 8%
Auto Cat, 7%
Ceramics, 1%Other, 3%Phosphors,
6%
Magnets, 24%
Total = 134,000 tonnes REO
Source: Non China market = aggregate of estimated manufacturer demand by application, China Market = IMCOA and China Rare Earths Information Centre. Note : Totals may not add due to rounding
Application Demand 2010 demand% tonnes
• Magnets 24% 32,000• Battery Alloy 12% 16,000• Metallurgy ex batt 9% 12,000 • Auto catalysts 7% 9,500• FCC 16% 21,500• Polishing Powder 15% 20,000• Glass Additives 8% 11,000• Phosphors 6% 8,000• Ceramics 1% 1,500• Others 3% 4,000• Total 100% 134,000
2010 Demand Forecast by Application
For
per
sona
l use
onl
y

-11-
Magnets and battery alloy are forecast to be the growth drivers for Rare Earths demand to 2014
2014 Demand Forecast by Application
Total = 182,000 tonnes
Battery Alloy, 16%
Metallurgy ex battery, 7%
FCC, 14%
Polishing Powder, 15%
Glass Additive, 5%
Auto Cat, 7%
Ceramics, 1%Other, 2%Phosphors,
6%
Magnets, 28%
Growth Forecast by Application
Application Growth rate 2014 demand% p.a. tonnes
• Magnets 12% 50,000• Battery Alloy 15% 28,000• Metallurgy ex batt 2% 13,000 • Auto catalysts 8% 12,000• FCC 4% 25,000• Polishing Powder 8% 26,000• Glass Additives -1% 10,000• Phosphors 8% 11,000• Ceramics 4% 2,000• Others 2% 4,000• Total 8% 182,000
Source: Growth rates from industry participants and RoskillNote: Totals may not add due to rounding
For
per
sona
l use
onl
y

-12-
The global chemical companies who purchase Rare Earths include…
Environmental ProtectionEnable Digital Technology Improve Energy Efficiency
For
per
sona
l use
onl
y
-13-
The sustainability of Rare Earths supply is becoming more fragile
Chinese Policy IssuesChinese Policy Issues
2009 Production Quota is 82,320t Baotou & Sichuan: 72,300t Southern Ionic clays: 10,020t No prospecting or mining licences for
Rare Earths until July 2010
2009 Export Quota is 50,145t Domestic companies – 33,300t Foreign JVs – 16,845t 2010 H1 up 8% Recognition by Government of grey
exports without quota; 20,000t in 2008
2009 Export Taxes Light Rare Earths & Nd metal: 15% Heavy Rare Earths & other metals: 25%
Source: Chinese Government announcements, Asian Metal, Metal Pages
Rare Earths Supply SourcesRare Earths Supply Sources(2010 capacity, REO)(2010 capacity, REO)
Baotou 55,000t Relocation of iron ore mining Tailing facilities near capacity
Sichuan 10,000t Target to increase separation Low value distribution
Ionic clay regions 45,000t Large amount of illegal mining
Others 15,000t Recycling ~5,000t Russia ~ 4,000t India ~ 3,000t Mountain Pass ~ 3,000t
Total 125,000t
Source: Asian Metal, Metal Pages, Lynas research
For
per
sona
l use
onl
y
-14-
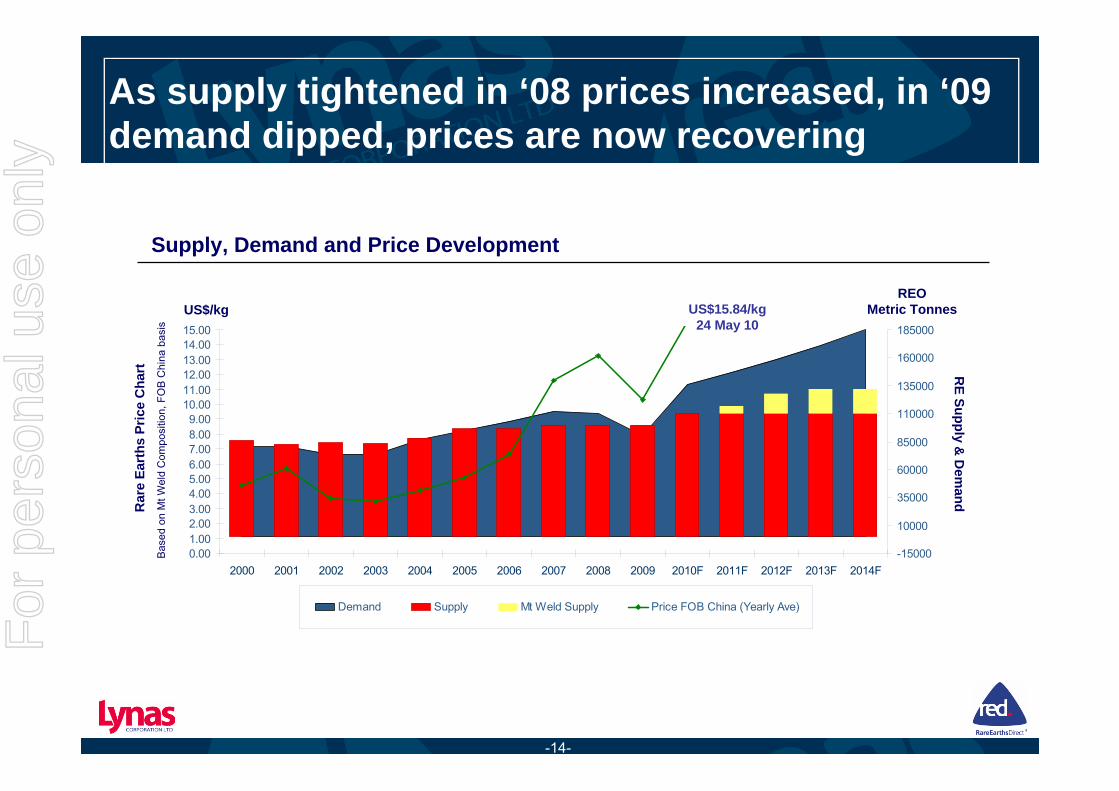
0.001.002.003.004.005.006.007.008.009.00
10.0011.0012.0013.0014.0015.00
2000 2001 2002 2003 2004 2005 2006 2007 2008 2009 2010F 2011F 2012F 2013F 2014F-15000
10000
35000
60000
85000
110000
135000
160000
185000
Demand Supply Mt Weld Supply Price FOB China (Yearly Ave)
As supply tightened in ‘08 prices increased, in ‘09 demand dipped, prices are now recovering
REO Metric TonnesUS$15.84/kg
24 May 10US$/kg
Rar
e Ea
rths
Pric
e C
hart
Bas
ed o
n M
t Wel
d C
ompo
sitio
n, F
OB
Chi
na b
asis
RE Supply &
Dem
and
Supply, Demand and Price Development
For
per
sona
l use
onl
y

-15-
US Government searching for solutions
Government Audit Office report on Rare Earth materials in the defense supply chain
► Current sources of Rare Earths► Future Availability► Associated National Security Risks
RESTART Act of 2010► Re-establish competitive domestic Rare Earths mineral
production, processing, refining, purification, and metals production industries
► Support growth of green job technology and manufacturing, and US defense industry
DOE released a Request For Information:► Demand growth► Supply constraints► Technology applications and processes► Costs and Availability► Intellectual Property constraints
For
per
sona
l use
onl
y

-16-
Chinese supply is tightening causing a ripple effect globallyChina’s export restrictions under examination against WTO guidelines
For
per
sona
l use
onl
y

-17-
Mineral scarcity – it not about size of resource, it is about production!
Source: Lynas research
Shortages occur when supply as a function of time can no longer keep up with demand as a function of time
The ultimate recoverable resource in the ground is irrelevant in this respect
We have reached this point in the Rare Earths industry Current resources are struggling to maintain production Growth forecasts are greater than new supply coming to market
Mineral scarcity is expected to be an aspect of this industry for at least the next five years There are insufficient well advanced new projects in the pipeline
Lynas – Mount Weld
For
per
sona
l use
onl
y

-18-
Lynas is the leader among defined Rare Earths resources under development outside China
JORC
ResourceProcess
test work
Pre-feas.
study Site
SelectionBasic
EngineeringBankable
Feas.studyFunding +
Customer
Contracts Detailed Eng
+ ApprovalsConstruction
Start -up
Source: The data for non-Mt Weld deposits is based on public statements by the relevant resource holders except for Dong Pao which is based on a company interview, and has not been separately verified by Lynas. * Represents a polymetallic resource.
Rare Earth Development Projects Bubble Size Represents Stated Production Volume
Mountain Pass(private equity)
Mt Weld (Lynas)
Nechalacho*(Avalon) Nolans Bore*
(Arafura)
Dong Pao (private)
Kangankunde(Lynas option)
Zandkopsdrift(Frontier Minerals)
Hoidas Lake(GWG)
Bear Lodge(Rare Element
Resources)
Steenkampskraal(GWG option)
DZP* (Alkane)
$-
$500.00
$1,000.00
$1,500.00
$2,000.00
$2,500.00
$3,000.00
0 1 2 3 4 5 6 7 8 9 10
Insi
tuR
EO V
alue
(U
S $
/ Ton
neof
Ore
, pric
es F
eb '1
0)
For
per
sona
l use
onl
y

-19-
Raising funds for Rare Earth projects take time
► Lynas had over US$200 million of debt finance arranged in 2008
► GFC resulted in loss of bank finance
► In May ’09 Lynas announced a deal with China NonFerrous Metal Mining Corporation to invest in the company and provide finance for the project
► On 24 September 2009, Lynas announced that CNMC had terminated its proposed equity investment in Lynas because of additional undertakings sought by the Australian Government’s Foreign Investment Review Board
► Following the termination of the CNMC deal, Lynas entered into discussions with JP Morgan to raise funds via an equity placement to existing and new shareholders
► A$450 million has been received by the company and is being used to fund the completion of Phase 1 of the Rare Earths Project
For
per
sona
l use
onl
y

-20-
Mount Weld will be a major fully integrated source of Rare Earths supply outside of China
Mount Weld Mine – Western Australia
Concentration Plant – Mount Weld, WA
Advanced Materials Plant – Malaysia
About Lynas CorporationVision : Be a global leader in Rare Earths
for a sustainable future
Exchange: Australian Stock ExchangeASX 200 Company, code LYC
Shares : 1,655m on issue
Options : 64,100,000 strike range 16c -$1.09
Mkt Cap : A$827m as at 24th February
Assets for Integrated Source of Supply
Cash : A$417m as at 31 March
Debt : NilFor
per
sona
l use
onl
y

-21-
The Lynas strategy is to build and expand our processing hub in Malaysia
Mount Weld Malawi *
Processing hub with exceptional infrastructure
Processing hub with exceptional infrastructure
Gebeng Industrial EstateEast Coast Malaysia
Industrial InfrastructureChemical industrial landGas, Water, ElectricityRe-agents from local suppliersPort – container, chemical, bulk
Knowledge InfrastructureTechnical and trade skillsChemical industry experienceEnglish language skills
Government InfrastructureAccountable regulatorsClear legal frameworksFDI incentives
* : The Malawi deposit is currently under a purchase agreement, not yet completed
For
per
sona
l use
onl
y

-22-
The current mining operation is within the Central Zone Pit
Central Lanthanide Deposit SectorMount Weld Tenements
Category Tonnes (Mt)
Grade (%REO)
Tonnes (kt) REO
Measured 2.21 14.7 324
Indicated 5.26 10.7 563
Inferred 4.77 6.2 287
Total 12.24 9.7 1,184
Two defined zones: Central and the new Southern zone (Heavy REO)
Current mine plan (within Central Zone Pit)
– 4.47 Mt @ 13.6% REO for 608kt REO
Within Southern Zone
– 2.78Mt @ 4% REO for 111kt REO
Low Thorium content, 44ppm ThO2/1% REO
The Total CLD Sector Mineral Resource (2.5% REO cut-off)
For
per
sona
l use
onl
y
-23-
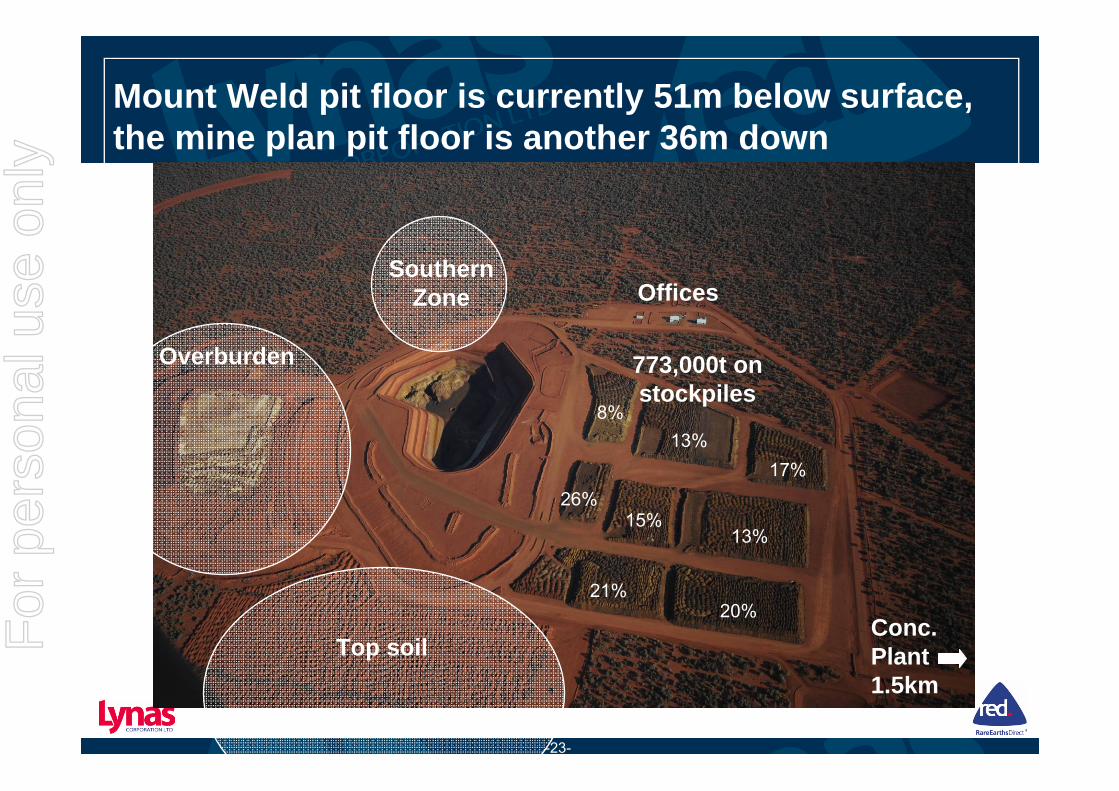
Mount Weld pit floor is currently 51m below surface, the mine plan pit floor is another 36m down
Overburden
Top soil
Offices
Conc.Plant1.5km
SouthernZone
773,000t on stockpiles
8%13%
17%26%
15%13%
20%21%
For
per
sona
l use
onl
y

-24-
The Concentration Plant is scheduled to commence operations by the end of 2010
► All approvals in place
► Mechanical Engineering Design complete
► All major equipment procured
► Construction work recommenced onsite in April 2010, with progress on schedule
For
per
sona
l use
onl
y

-25-
Containers of Rare Earths concentrate will be trucked to Fremantle for shipping to Malaysia
GEBENGGEBENG
Mount Weld to Fremantle = 1,000km
Transportation approx 9% of total costs
GEBENGGEBENG
For
per
sona
l use
onl
y

-26-
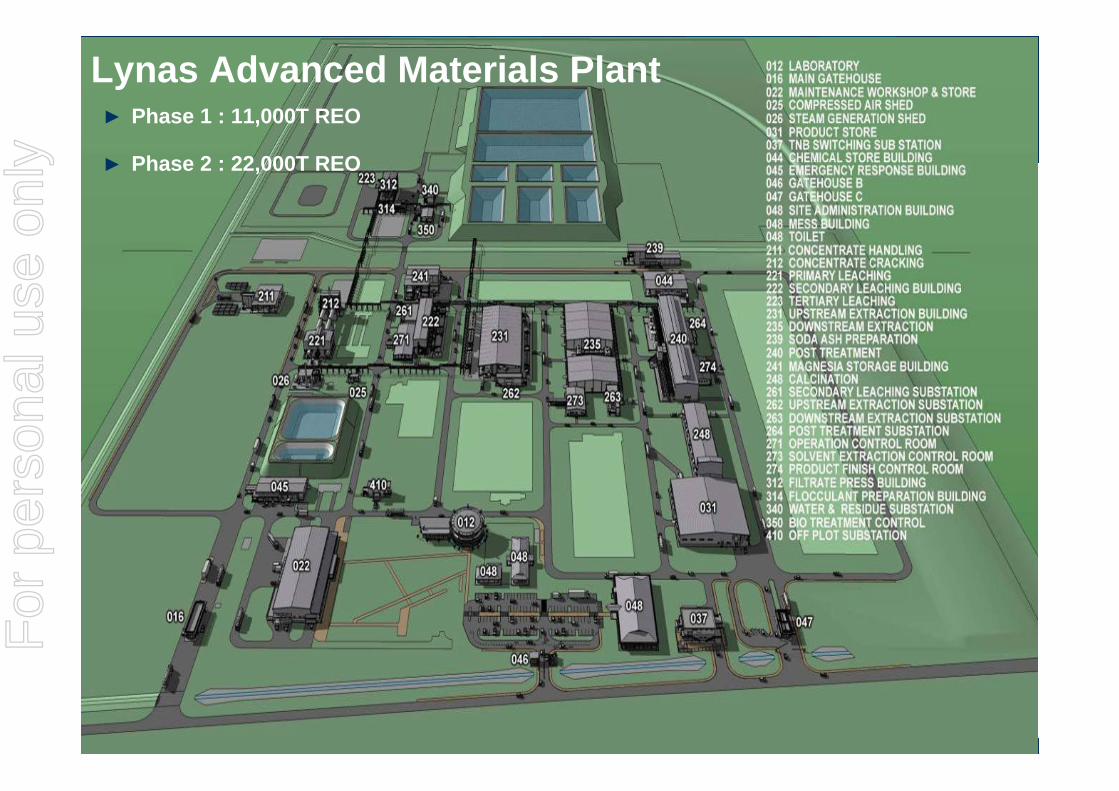
The Advanced Materials Plant is scheduled to be completed in Q3 2011
►► Engineering Design to be completedEngineering Design to be completed
United Group engaged as the Engineering and Construction United Group engaged as the Engineering and Construction Contractor Contractor
►► All Approvals for construction in placeAll Approvals for construction in place
►► Contract Status onContract Status on--sitesite
Bulk earth worksBulk earth works Substantially completedSubstantially completed
Piling Piling Substantially completedSubstantially completed
Concreting worksConcreting works To be reTo be re--initiatedinitiated
Other construction contractsOther construction contracts To be letTo be let
For
per
sona
l use
onl
y
-27-
Malaysia site construction: Piling for post treatment workshop
Lynas Advanced Materials Plant► Phase 1 : 11,000T REO
► Phase 2 : 22,000T REO
For
per
sona
l use
onl
y

-28-
Operational expenses are dominated by reagent and energy costs
Current Budget assumes cash costs of USD 5.65 per kilo ± 10%
2/3 of the costs are generated in Malaysia
Reagents account for nearly 50% of total cash costs
Followed by energy costs at nearly 30%
6% 4%6%
42%
9%
20%
0%
10%
20%
30%
40%
50%
60%
70%
Mining Concentration Shipping Processing
3rd Party Labour Reagents Energy
WA = Western Australia MY = Malaysia
9%4%
Cash Cost per tonne of finished REO by expense type and region
21%
66%
WA WA WA - MY MYFor
per
sona
l use
onl
y

-29-
Summary of estimated capital and operating costs to fund Phase 1 of the Rare Earths Project
16.44
45.10
70.69
58.88
0.0
$191.11
Capex spent to date A$mm
61.49
232.40
136.40
74.30
25.71
$530.30
Total A$mm
45.05
187.30
65.71
15.42
25.71
$339.19
WA Concentration Plant
Gebeng Cracker & Separator Plant
Engineering & Project Management Costs
Other Capex including Land at Gebeng
Contingency
Total¹
Future capex A$mm
Construction & Other Capital Costs
28.10
22.42
17.61
$68.13
Future spend A$mm
Western Australia
Gebeng
Finance, Admin, Marketing, Technical & Corporate Overheads (incl. suspension costs)
Total¹
Production Ramp-up Costs
$407.32Total Cash Requirement as at 31 Dec 2009¹
Significant proportion of equipment and procurement capital costs are contracted1 Totals may not add up to sum of individual line items due to rounding
For
per
sona
l use
onl
y

-30-
Six customer agreements have been signedRhodia Supply Contract• >US$200M¹• Long term 10 year contract• Cerium, Europium, Terbium &
Lanthanum
2nd Customer Agreement -Supply Contract
• ~US$200M¹• Long term 5 year contract• Neodymium &
Praseodymium
3rd Customer Agreement - Supply Contract
• ~US$20M¹• Long term multiple year contract• Product from Phase I & Phase II of
final separation and product finishing plant in Malaysia
4th Customer Agreement – Letter of Intent
• ~US$80M¹• Long term multiple year contract• Product from Phase I & Phase II of final
separation and product finishing plant in Malaysia
6th Customer Agreement – Supply Contract
• Long term multiple year contract• Product from Phase I & Phase II of
final separation and product finishing plant in Malaysia
5th Customer Agreement – Letter of Intent
• ~US$80M¹• Long term multiple year contract• Product from Phase I &
Phase II of final separation and product finishing plant in Malaysia
Four supply contracts and two letters of intent signed
1 Values reflect market prices at signing of contract
For
per
sona
l use
onl
y

-31-
Lynas – building a stable supply chain for vital raw materials to a sustainable world
Applications Raw Material Supply Lynas
The growth drivers are : 1. More efficient use of
energy2. Reduction of
greenhouse gas 3. Digitisation
Substitutes are not available for most applications
Continuous growth 8% CAGR is forecast
China dominates the market with 95% supply
China cannot meet growing world demand
Mount Weld is the only alternative source to China under construction
Funds raised for the completion of Phase 1, 11,000t REO pa.
Construction underway with completion due in Q2 2011
Infrastructure and utilities have been scaled for 22,000t REO
Supply contracts have been signedF
or p
erso
nal u
se o
nly

-32-
NOTE
The information in this report that relates to Exploration Results, Mineral Resources or Ore Reserves is based on information compiled by Brendan Shand, who is a member of The Australasian Institute of Mining and Metallurgy. Brendan Shand is an employee of Lynas Corporation Limited. Brendan Shand has sufficient experience which is relevant to the style of mineralisation and type of deposit under consideration and to the activity which he is undertaking to qualify as a Competent Person as defined in the 2004 Edition of the ‘Australasian Code for Reporting of Exploration Results, Mineral Resources and Ore Reserves’. Brendan Shand consents to the inclusion in the report of the matters based on his information in the form and context in which it appears.
For
per
sona
l use
onl
y


![Yangibana Rare Earths Project Environmental Review ... · Yangibana Rare Earths Project Environmental Review Document [1] Yangibana Rare Earths Project Environmental Review Document](https://static.fdocuments.net/doc/165x107/5e4823f9e96f8107dc434563/yangibana-rare-earths-project-environmental-review-yangibana-rare-earths-project.jpg)