Rare earth elements and yttrium in geothermal fluids Rare earth elements and yttrium in geothermal...
31
1 Rare earth elements and yttrium in geothermal fluids Peter Möller Geoforschungszentrum Potsdam, D-14473-Potsdam, Germany Email: [email protected] Contents Abstract 1. Introduction 2. Principles of rare earth element distribution 3. Sampling of water 4. Analysis of REY 5. Presentation of data 6. Anomalous behaviour of Ce, Eu and Y 7. Application of REY patterns as a geochemical probe 7.1 Thermal waters 7.2 High-temperature fluids 7.2.1 Geological background 7.2.2 REY in liquid and vapour 7.2.3 Selection of best analyses 7.2.4 Element partition between vapour and liquid 7.2.5 Element partition between scale and liquid 7.2.6 Ca and REY contents in original fluid under bottom-hole condition 7.2.7 Apparent distribution factors of REY between HTF and source rocks 8. Conclusions
Transcript of Rare earth elements and yttrium in geothermal fluids Rare earth elements and yttrium in geothermal...
1
Rare earth elements and yttrium in geothermal fluids
Peter MöllerGeoforschungszentrum Potsdam, D-14473-Potsdam, Germany
Email: [email protected]
Contents
Abstract
1. Introduction
2. Principles of rare earth element distribution
3. Sampling of water
4. Analysis of REY
5. Presentation of data
6. Anomalous behaviour of Ce, Eu and Y
7. Application of REY patterns as a geochemical probe
7.1 Thermal waters
7.2 High-temperature fluids
7.2.1 Geological background
7.2.2 REY in liquid and vapour
7.2.3 Selection of best analyses
7.2.4 Element partition between vapour and liquid
7.2.5 Element partition between scale and liquid
7.2.6 Ca and REY contents in original fluid under bottom-hole condition
7.2.7 Apparent distribution factors of REY between HTF and source rocks
8. Conclusions
2
Rare earth elements and yttrium in geothermal fluids
AbstractThe series of rare earth elements and yttrium (REY) is a useful tool in tracing the originof fluids, which is fundamental in understanding any fluid-rock system. The suite ofREY enables to study the source of fluids, the state of equilibrium in water-rockinteraction, and changes of fluid composition by both precipitation of scale duringascent and by dissolution of scale particles during sampling of liquids and vapours.Knowing the amount of scale formation and the distribution of REY between liquid andscale, the REY abundance in the original fluid under bottom hole conditions can beback-calculated. Partition factors of elements between vapour and liquid increase fromalkalis to earth alkaline elements to REY. Significant fractions of REY are transportedby CO2 rich vapour.
1. Introduction
Studies of the distribution of REY in high-temperature water-rock interaction ishampered by difficulties in sampling (i) the thermal water under source conditions anduncontaminated by surface- or groundwater, and (ii) the altered host rock in equilibriumwith the fluid. One can only attempt to make the best choice with respect to the alteredaquifer rocks (Möller, 2002).Most groundwater sampling is done at 1 bar and discharge temperatures, i.e., conditionsdifferent from those at depth. For example, CO2 degassing increases pH and leads tocarbonate precipitation. Due to cooling, silica, sulphides, and/or various oxihydroxidesflocculate, and many trace elements are sorbed or co-precipitated. Furthermore, changeof pressure and temperature during ascent of water induces formation of metastablecomponents and surface coatings, and ion exchange as a function of fluid flow.Sampling aquifer rocks is even more complicated. Most aquifers are petrologicallyinhomogeneous and the residence time of water is locally variable. Therefore, the rareearth elements (REE) and yttrium (henceforth combined to REY) abundance in watersnever represents equilibrium sensu stricto with any sampled piece of rock suspected torepresent the source rock (Möller, 2002).The group of REY yield information on fractionation mechanisms during alteration ofrocks and fluid transport, the history of rock alteration, and the state of equilibrium inwater-rock interaction. Different from major components of thermal waters highfractions of many trace element such as REE and Y originate from dissolution andalteration of accessory minerals (Möller et al., 1997a; Möller, 2000; Hannigan andSholkovitz, 2001). Only the REY patterns of waters from limestones and dolostonesresemble those of the source rocks (Möller, 2002).Distribution of REY is studied for two main purposes: (i) theoretical understanding ofthe systematic changes within a set of elements that are mainly trivalent and (ii)application of their fractionation as a geochemical probe to study minero-chemicalprocesses in water-rock interaction in the Earth’s crust. The first topic is dealt with by

3
theoretical chemists and physicists, whereas the latter is the unique domain ofgeochemistry. Since it has become an easy task to determine the abundance of REY,geochemical literature is flooded by papers using REE to characterise the source anddifferentiation of melts and fluids. The study of REY in geothermal waters contribute tothe understanding of water-rock interaction at enhanced temperatures. The knowledgeof the composition of fluids and their sources is mandatory for their usage in geothermalpower generation and in ore deposit research. Of particular interest are the anomalousbehaving lanthanides (Ce, Eu) and Y that yield further information on process-controlling parameters.
2. Principles of rare earth element distribution
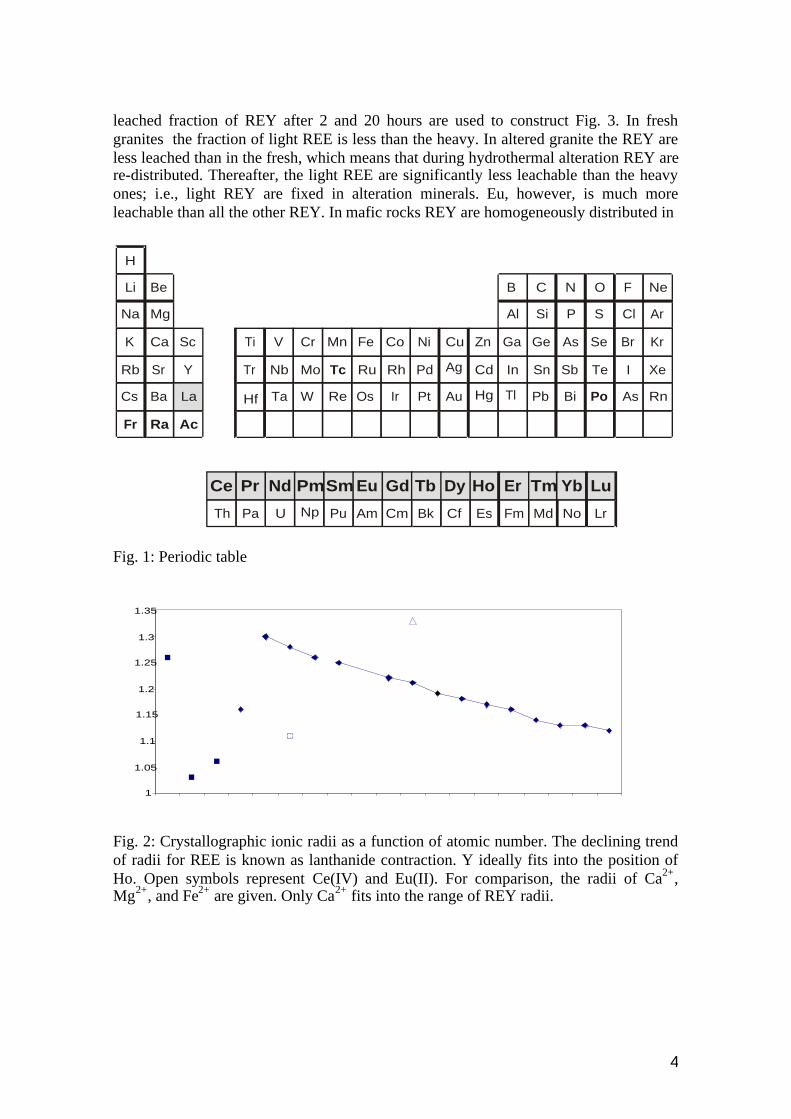
Rare earth elements and yttrium were discovered latest due to their similarity inchemical behaviour and difficulties in separating them. They represent a suite ofelements of the third group in the periodic table (Fig. 1). This suite is unique in naturebecause• REY are omnipresent in nature at low abundance,• Ionic radii decrease systematically from La to Lu; this lanthanide contraction (Fig.
2) is the result of increasing number of 4f electrons;• They are coprecipitated with almost all minerals except those with very small major
ions in minerals like Mg2+ and Fe2+;• They rarely form visible own minerals except in rare metal pegmatites and
hydrothermal mineralisations associated with carbonatites.Various processes control REY abundance in solutions:• Solubility of REY hosting minerals and this includes REY distribution among
minerals;• Chemical complexation in solution and on surfaces;• Distribution in the electric double layer attached to mineral surfaces;• Processes across mineral surface.In solution, REY undergo chemical complexation of variable strength with OH-, F-,HCO3
-, H2PO4- etc. (Haas et al., 1995). These complexes enhance REY abundance in
solution. In contrast, surface complexation reduces REY abundance in solution. In CO2rich geothermal waters, the solubility of many minerals depends on the partial pressureof CO2.Ion distribution in the electric double layer is controlled by the surface charge of themineral. If the surfaces are negatively charged, positively charged free and complexedREY are attracted and their concentration is enhanced compared with their abundance insolution far away from the surface. Due to positively charged surfaces positivelycharged free and complexed REY are consequently impoverished in the electric doublelayer. Thus, coprecipitation with alteration minerals is less than in case of a negativelycharged surface.The distribution of REY is not homogeneous in rocks. It depends on the mineralogicalcomposition of rocks and their state of alteration. This is shown by acidic leaching atabout pH 3 (Möller and Giese, 1997). For fresh and altered felsic and mafic rocks the
4
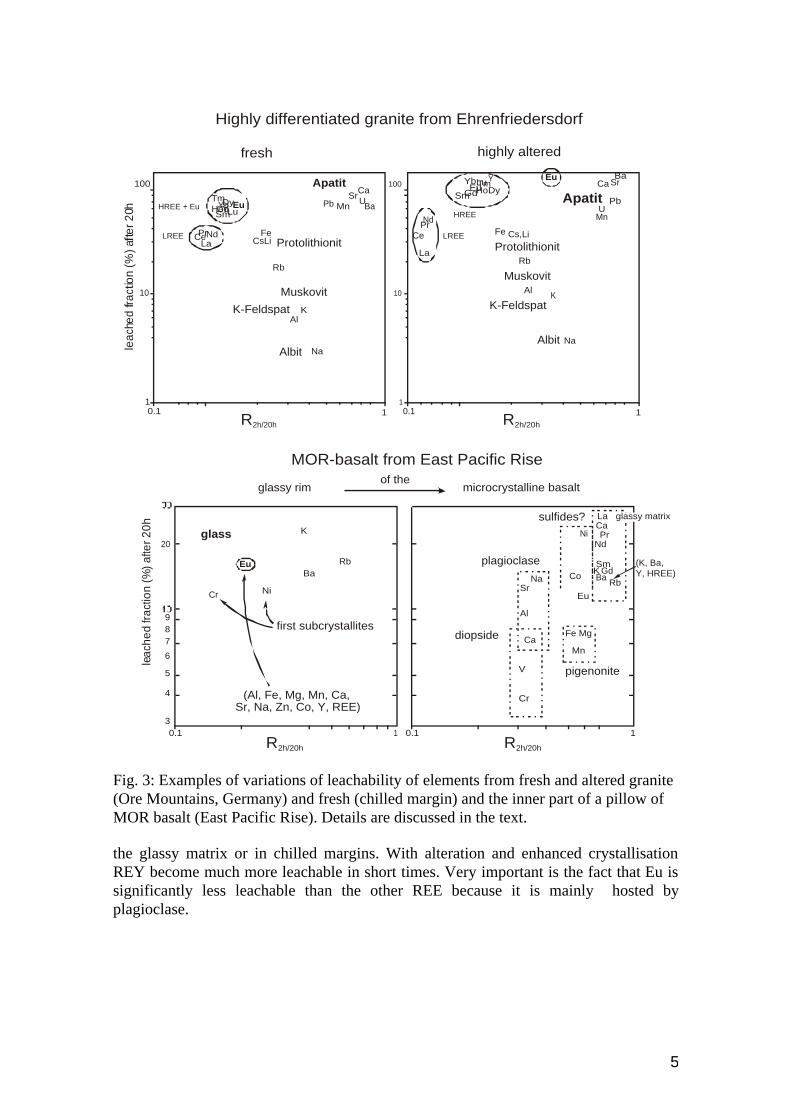
leached fraction of REY after 2 and 20 hours are used to construct Fig. 3. In freshgranites the fraction of light REE is less than the heavy. In altered granite the REY areless leached than in the fresh, which means that during hydrothermal alteration REY arere-distributed. Thereafter, the light REE are significantly less leachable than the heavyones; i.e., light REY are fixed in alteration minerals. Eu, however, is much moreleachable than all the other REY. In mafic rocks REY are homogeneously distributed in
Fig. 1: Periodic table
Fig. 2: Crystallographic ionic radii as a function of atomic number. The declining trendof radii for REE is known as lanthanide contraction. Y ideally fits into the position ofHo. Open symbols represent Ce(IV) and Eu(II). For comparison, the radii of Ca2+,Mg2+, and Fe2+ are given. Only Ca2+ fits into the range of REY radii.
H
Li Be
Na Mg
K Ca Sc
Rb Sr Y
Cs Ba La
Fr Ra Ac
Ti
Tr
Hf
V Cr Mn
Nb
Ta
Mo
W
Tc
Re
Fe
Ru
Os
Co
Rh
Ir Pt Au Hg Tl Pb Bi As Rn
Pd Ag Cd In Sn Sb Te I Xe
Ni Cu Zn Ga Ge As Se Br Kr
ArClSPSiAl
B C N O F Ne
Po
Ce Pr Nd PmSm Eu Gd Tb Dy Ho Er Yb LuTm
Th Pa U Np Pu Am Cm Bk Cf Es Fm Md No Lr
1
1.05
1.1
1.15
1.2
1.25
1.3
1.35
5
Highly differentiated granite from Ehrenfriedersdorf
MOR-basalt from East Pacific Rise
fresh highly altered
ApatitApatit
HREE + EuTm
Tm
HoSm
SmYb
Yb
DyDy
Lu
Lu
Eu
EuEu
Ce CeNd
Nd
LaLa
PrPr
LREE
Gd
Gd
Fe FeCsLi
Cs,LiProtolithionit Protolithionit
RbRb
MuskovitMuskovit
K-Feldspat K-Feldspat
AlbitAlbit
K
K
Al
Al
CaCa
Sr
Sr
Pb PbMn
Mn
UUBa
Ba
NaNa
Y
YHo
HREE
LREE
leac
hed
fract
ion
(%) a
fter 2
0h
100
10
1
100
10
1
20
987
6
5
4
30.1 0.11 1
glass
first subcrystallites
Ni
Ba Ba
K
KRb
RbCr
Cr
Eu
(Al, Fe, Mg, Mn, Ca,Sr, Na, Zn, Co, Y, REE)
V
Ca
Al
SrNa
Ni
Co
Eu
LaCaPr
Nd
SmGd
(K, Ba,Y, HREE)
Fe Mg
sulfides?
plagioclase
diopside
pigenonite
glassy matrix
leac
hed
fract
ion
(%) a
fter 2
0h
R2h/20h R2h/20h
glassy rim microcrystalline basaltof the
0.1 0.11 1R2h/20h R2h/20h
Mn
Fig. 3: Examples of variations of leachability of elements from fresh and altered granite(Ore Mountains, Germany) and fresh (chilled margin) and the inner part of a pillow ofMOR basalt (East Pacific Rise). Details are discussed in the text.
the glassy matrix or in chilled margins. With alteration and enhanced crystallisationREY become much more leachable in short times. Very important is the fact that Eu issignificantly less leachable than the other REE because it is mainly hosted byplagioclase.

6
2. Sampling of water
Thermal waters below 100°C are sampled directly, whereas the high-temperature fluidshad to be sampled with the help of a cooling device in order to condensate the steam.The cooling device (Fig. 4) is made of stainless steel and is connected to the productionlines by a flexible metal-mantled rubber tube. The liquid-steam mixture at the well headand the liquid from the cyclone separators is guided through a steel spiral which iscooled in a water tank, whereas the steam from the subsequent cyclone separator passesan additional small separator made of stainless steel and containing a package ofstainless steel wool at which small droplets are forced to precipitate before cooling andcondensing water from the vapour. The non-condensable gases are released to theatmosphere.Ten litres of water or condensate are collected in polyethylene carboys under a CO2
atmosphere of about 1 bar. Thereafter, the samples pass a 0.2 µm filter in order tominimise the potential dissolution of carbonate scale particles dragged along with thefluids. During filtration, 1 ml of 100 ng/g Tm spike solution and 6 M sub-boiled HClare added to the filtrate. The Tm spike is necessary for later efficiency control of REYin the following preconcentration treatment. The acid is needed to adjust the waters topH 2.
Liquid + condensed steam
condensatefrom vapour
to waste waterchannel
to turbine
Fig. 4: Sampling device for high-temperature fluids.
3. Analysis of REY
REY abundance in natural waters is in the range of nmol/kg to even below pmol/kg.Therefore, REY have to be preconcentrated prior to analysis (Shabani et al., 1992; Bauand Dulski, 1996; Möller et al., 1998). In brief, the filtered waters are adjusted to pH 2,and, after few hours waiting, passed over a preconditioned C18 Sep pak cartridge (Water

7
Corp. USA) at a rate of 1 litre per hour. The preconditioning of the cartridgescomprises: cleaning with 10 ml 6 M sub-boiled HCl, washing with 7 ml ultra-purewater, freeing from water and loading with a liquid ion exchanger consisting of amixture of ethylhexylphosphates.In the laboratory, the REY loaded cartridges from the field are washed with 50 ml 0.01M sub-boiled HCl. Thereafter, the REY are eluted by 40 ml 6 M sub-boiled HCl at arate of 3 ml/min. The eluates are evaporated to incipient dryness and the residuesdissolved in 1 ml of 5 M sub-boiled HCl and spiked with a Ru-Re mixture which is laterused for corrections of the internal drift of response factors in inductively coupledplasma mass spectrometry (ICP-MS) measurements if necessary. REY are notfractionated by the applied preconcentration conditions.The spectra are routine corrected for interferences of molecular ions with the wantedmono-charged ions of the REY (Dulski 1994).- In addition, 139La+ had to be correctedfor the interference by 123Sb16O+ because Sb is not quantitatively separated from REYby the described ion exchange procedure (Möller et al., 2003).High REY abundances are precise within ±5 %, whereas the lowest ones may vary by afactor of two due to the uncertainties related to interferences and nearness of limits ofdetection. All reported data are 3 times above the limits of detection.
5. Presentation of data
When plotting the abundance of REE towards the atomic number a zigzag or saw-teethlike curve is obtained (Fig. 5a). Such abundance curves are difficult to compare, inparticular, if individual elements behave anomalously. For that reason, Coryell et al.(1963) suggested to normalise the REY abundance by that in C1-chondrite (Table 1;Anders and Grevesse, 1989), which represented the least fractionated REY abundancein matter known at that time (Fig. 5b). Normalisation yields smooth REY patterns. Inthe meantime different other materials have been proposed for normalising REYabundances such as the Post-Achaean-Australian-Shale, PAAS (Table 1; McLennan,
Fig. 5: Normalisation of REE and Y abundance. In (a) REY abundances of C1-chondrite (Anders and Grevesse, 1989) and Post-Achaean-Australian Shale (PAAS;McLennan 1989) are given. In (b) PAAS is normalised by C1-chondrite.
0.01
0.1
1
10
100
Log
[RE
Y]
C1 chondrite
PAAS
0
1
2
3
Log
REY
, C1-
chon
drite
nor
mal
ised
PAAS

8
1989), or even the source rocks of waters. Normalisation does not alter the abundance, itonly visualises changes of trends with respect to the normalisation matter and depictsanomalously enriched or depleted elements. Of course, the patterns look different whennormalised to different materials (Fig. 6). If we normalise all waters with respect to onereference material, the resulting curves are easier to compare than the correspondingtabulated data.As shown in Fig. 7, REY patterns show a variety of trends: they increase or decreasefrom La to Lu or can even show a maximum or minimum. The deviation from a flattrend is termed fractionation with respect to the normalisation material. Fractionationalways occurs, if either light or heavy REE show a special affinity to minerals by which
Fig. 6: Normalisation of Kizildere high-enthalpy fluid by C1-chondrite and PAAS.
Table 1: Rare Earth and Y abundance in C1-chondritesand Post Achaean Australian Shale (PAAS)
Element C1-chondrite PAAS C1-chondrite PAAS
pmol/kg pmol/kg µg/g µg/g
La 1.69E+06 2.75E+08 0.235 38.2
Ce 4.30E+06 5.68E+08 0.603 79.6
Pr 6.32E+05 6.27E+07 0.089 8.83
Nd 3.13E+06 2.35E+08 0.452 33.9
Sm 9.77E+05 3.69E+07 0.147 5.55
Eu 3.68E+05 7.11E+06 0.056 1.08
Gd 1.25E+06 2.96E+07 0.197 4.66
Tb 2.27E+05 4.87E+06 0.036 0.774
Dy 1.50E+06 2.88E+07 0.243 4.68
Y 1.75E+07 3.04E+08 1.56 27.0
Ho 3.40E+05 6.01E+06 0.056 0.991
Er 9.50E+05 1.70E+07 0.159 2.85
Tm 1.42E+05 2.40E+06 0.024 0.405
Yb 9.42E+05 1.63E+07 0.163 2.82
Lu 1.37E+05 2.47E+06 0.024 0.433
-9
-8
-7
-6
-5
Log
RE
Y, n
orm
alis
ed
C1-chondrite normalised
PAAS normalised
9
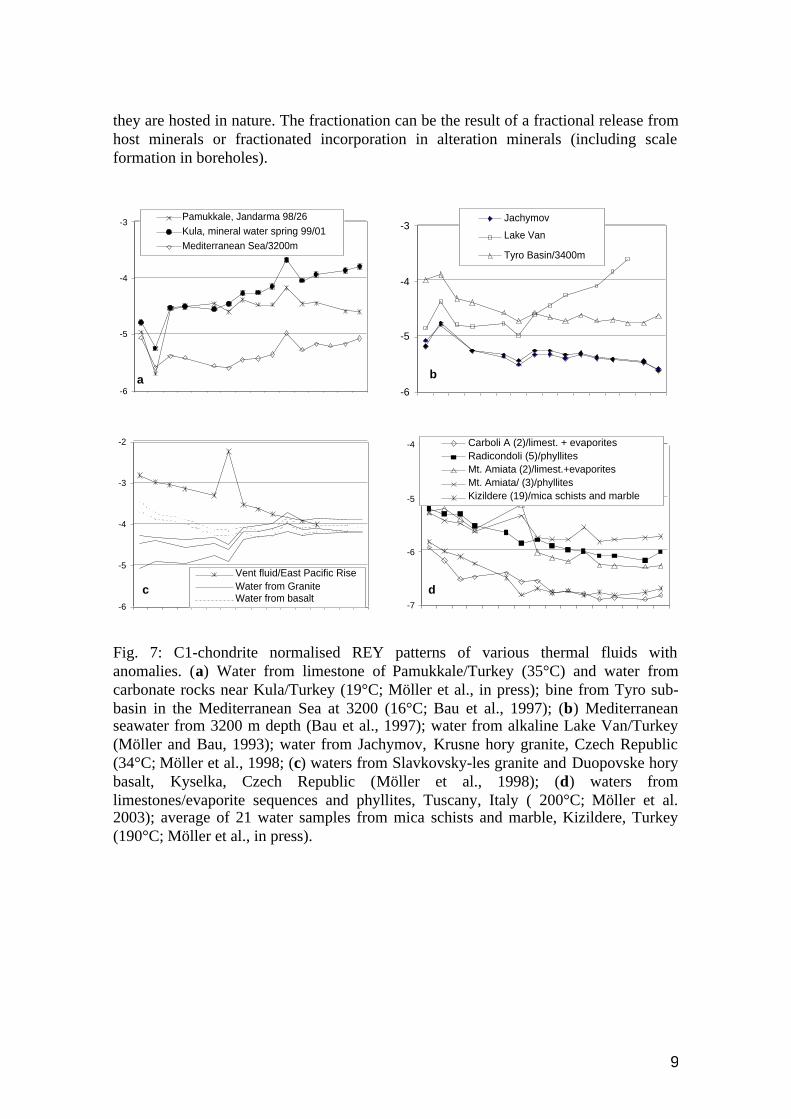
they are hosted in nature. The fractionation can be the result of a fractional release fromhost minerals or fractionated incorporation in alteration minerals (including scaleformation in boreholes).
Fig. 7: C1-chondrite normalised REY patterns of various thermal fluids withanomalies. (a) Water from limestone of Pamukkale/Turkey (35°C) and water fromcarbonate rocks near Kula/Turkey (19°C; Möller et al., in press); bine from Tyro sub-basin in the Mediterranean Sea at 3200 (16°C; Bau et al., 1997); (b) Mediterraneanseawater from 3200 m depth (Bau et al., 1997); water from alkaline Lake Van/Turkey(Möller and Bau, 1993); water from Jachymov, Krusne hory granite, Czech Republic(34°C; Möller et al., 1998; (c) waters from Slavkovsky-les granite and Duopovske horybasalt, Kyselka, Czech Republic (Möller et al., 1998); (d) waters fromlimestones/evaporite sequences and phyllites, Tuscany, Italy ( 200°C; Möller et al.2003); average of 21 water samples from mica schists and marble, Kizildere, Turkey(190°C; Möller et al., in press).
-6
-5
-4
-3Pamukkale, Jandarma 98/26Kula, mineral water spring 99/01Mediterranean Sea/3200m
a
-7
-6
-5
-4 Carboli A (2)/limest. + evaporitesRadicondoli (5)/phyllitesMt. Amiata (2)/limest.+evaporitesMt. Amiata/ (3)/phyllitesKizildere (19)/mica schists and marble
d-6
-5
-4
-3
-2
Vent fluid/East Pacific RiseWater from GraniteWater from basalt
c
-6
-5
-4
-3Jachymov
Lake Van
Tyro Basin/3400m
b

10
6. Anomalous behaviour of Ce, Eu and Y
Conventional definition of anomalies are
N
NNCe
LaCe
Ce2
)Pr(*
+= (1)
N
NNEu
GdSmEu
Eu2
)(*
+= (2)
Here * indicates the geogene abundance interpolated between the two adjacentelements in the series. The index N denotes normalisation.
On a logarithmic scale as used for presentation of REY patterns (Fig. 7), deficits of Ceor Eu show up as negative anomalies (logarithms of Ce/Ce* or Eu/Eu* ratios <1 arenegative). Excess of Eu or Ce yield positive anomalies.Negative Ce anomalies are quite common in oxygen rich surface waters. For instance,seawater, oxygen-rich river- and karst waters are characterised world-wide by negativeCe anomalies (Fig. 7a). Bau (1999) and Kawabe et al. (1999) showed experimentallythat Ce anomalies develop during aging of FeOOH precipitates. Starting withundifferentiated scavenging of all REE and Y, most of these elements are releasedduring aging, only Ce is retained as Ce(IV) leading to the positive Ce anomaly in thefinal precipitate and a corresponding negative one in waters. For instance, the stronglynegative Ce anomaly of the thermal water of Pamukkale (Fig. 7a) with Eh values ofabout +400 mV may be due to long residence time of this water in the karst aquifer, inwhich FeOOH precipitation occurs along with dissolution of Fe-bearing carbonates. Incontrast, waters from most igneous and metamorphic rocks yield low Eh values and,therefore, FeOOH does not precipitate and negative Ce anomalies cannot develop.Positive Ce anomalies are achieved, if Ce-enriched FeOOH coatings come into contactwith chemically reducing fluids. At various places in marine and lacustrine systemsstrongly reducing environments exist in the lower water column, in which sedimentingparticles coated by FeOOH are re-dissolved such as in the high-salinity brine of theTyro sub-basin in the Mediterranean Sea (Fig. 7b) (Bau et al., 1997).Another process is carbonate complexation of Ce(VI) in alkaline lakes such as LakeVan, Turkey, with pH of 9.5 (Fig. 7b) (Möller and Bau, 1983).Among the studied waters from felsic rocks, positive Ce anomalies were found in thethermal water from Jachymov, Krusne hory, Czech Republic (Fig. 7b). The granite ofJachymov has been altered along with the formation of post-Variscan uraniummineralization. Since U is only mobilised by oxidising fluids, it is plausible that also Cewas partially oxidised and fixed at mineral surfaces of the altered granite. The present-day water from the bleached Jachymov granite is chemically reducing and containsFe2+. Thus, the once fixed Ce(VI) is leached in addition to the Ce fraction fromdissolving minerals.Strongly positive Eu anomalies are observed in the high-temperature, acidic vent fluidsof black smokers (Fig. 7c) and the high-temperature fluids (HTF) of the Monte Amiatageothermal field (Fig. 7d). Significantly positive anomalies always occur at

11
temperatures above 250°C (Möller, 2000). This coincides with two features: (i) all high-temperature fluids are chemically reducing, and (ii) calculation (Sverjenski, 1984) andexperiments (Bilal, 1991) showed that Eu is increasingly present in the divalent state attemperatures above about 250°C. In alteration reactions, Eu(II) behaves different fromEu(III) and all the other REY. The trivalent REE are coprecipitated with alterationminerals, whereas the big Eu(II) (Fig. 2) is rejected and, therefore, mainly sorbed ontomineral surfaces. This fraction of “loosely-bound” Eu onto mineral surfaces, oftenreferred to as “excess Eu”, is more easily leached from rocks by percolating water thanthe lattice-bound REE, although at low temperatures all leached Eu is trivalent. Thus,the either positive or negative Eu anomalies of fluids inherited from their source rocksare either enhanced or diminished by the excess Eu, respectively.The most important source of an inherited Eu anomaly is the alteration of feldspars,particularly plagioclase. Since most igneous feldspars show a positive Eu anomaly, theirdissolution or alteration yields fluids with positive Eu anomalies. For instance, the hightemperature alteration of plagioclase (>250°C) is considered as the source of thestrongly positive Eu anomalies in black smoker fluids (e.g., Klinkhammer et al., 1994).In contrast to plagioclase, alkali feldspars are much more stable in contact withhydrothermal fluids and, therefore, their contribution of Eu is less than that ofplagioclase. Separated biotite from felsic rocks, which normally hosts numerous tinysolid inclusions of accessory minerals, shows strongly negative Eu anomalies, whichresult from the many solid inclusions. Pure biotite is low in REY and shows negligibleEu anomalies (Bea et al., 1994). When biotite in felsic rocks is chloritised, the fluidinherits the abundance distribution of REY in “biotite” and its negative Eu anomaly.Because the excess Eu from the intergranular space of rocks is leached faster than REYfrom minerals, the source-rock-normalised REY patterns of water loose the initiallypositive Eu anomaly with time. This is the reason, why many thermal and high-temperature waters only show insignificant Eu anomalies (Fig. 7d). This is expected insystems that reached static equilibrium. The superheated steam from Larderello/Italy(about 200°C) does not show a positive Eu anomaly, whereas fluids from the youngMonte Amiata geothermal field/Italy (about 300°C) are marked by Eu and Y anomalies.These young boreholes produce from an aquifer which has not yet reached staticequilibrium under conditions of steam production.The Y anomaly is defined by the Y/Ho ratio. Under igneous conditions Y behavesprecisely like Ho (Bau and Dulski, 1965). In aqueous systems, Y displays a differentbehaviour, which may be related to small differences in solubility products of thehydroxides (Diakonov et al., 1998). In migrating fluids, however, the small dissimilarityof sorption onto mineral surfaces, controlled by surface complexation yields Y-Hofractionation. Different from anomalous Eu, the Y/Ho ratio is not dependent ontemperature. In some groundwaters and thermal waters Y is enriched compared to Ho(see Y and Ho in Fig. 7). This anomaly is only acquired, whilst the rock is not inequilibrium with the migrating water. If such a process lasts long enough, staticequilibrium is reached and Y anomalies (like Eu anomalies) vanish. Most waters,however, exhibit acquired Y anomalies. Y in the steam of the long-time exploitedLarderello geothermal field (Tuscany, Italy) behaves not anomalously, whereas in the

12
new production field of Monte Amiata (Tuscany, Italy) Y is leached in excessindicating that static equilibrium is not established.
7. Applications of REY patterns as a geochemical probe
7.1 THERMAL WATERS
Thermal waters show variable chemical composition because they originate fromvarious types of aquifer rocks with different suites of REY-bearing accessory minerals.Therefore, thermal waters from felsic and mafic rocks show different types of REYpatterns normally with positive Y anomalies (Fig. 7c). In particular, thermal watersfrom granites show negative Eu anomalies.
Fig. 8: Survey of C1-chondrite normalised thermal waters along the Lake Kinneret -Jordan Valley - Dead Sea – Arava Valley transform fault (Möller et al., 2003). Thethermal groundwaters are grouped according to their REY patterns, which characterisethe replenishment areas. Irrespective other rocks or sediments in contact withgroundwater, the original REY patterns are not changed significantly. They can be usedfor establishing a regional hydrostratigraphy.
-7
-6
-5
-4
Log R
EY
/C1
Dead Sea
REE stratigraphy
© Möller, January 16, 2002
C1-chondrite-normalisedREY patternsof thermal waters Möller [2002]
-7
-6
-5
-4
-7
-6
-5
-4Eocenelimestone
Neogenebasalt
UpperCretaceous
limestone
LowerCretaceoussandstone
Jurassic-Triassicsandstone
Paleozoicsandstone
x
Log R
EY
/C1
Log R
EY
/C1
La Pr
Pm Eu
Tb Y Er
Yb
La
Pr
Pm Eu
Tb Y Er
Yb
-7
-6
-5
-4
Log R
EY
/C1
La Pr
Pm Eu Tb Y Er
Yb
-7
-6
-5
-4
Log R
EY
/C1
La Pr
Pm Eu
Tb Y Er
Yb
-7
-6
-5
-4
Log R
EY
/C1
La Pr
Pm Eu
Tb Y Er
Yb
La Pr
Pm Eu
Tb Y Er
Yb-7
-6
-5
-4
Log R
EY
/C1
Dead Sea
REE stratigraphy
© Möller, January 16, 2002
C1-chondrite-normalisedREY patternsof thermal waters Möller [2002]
-7
-6
-5
-4
-7
-6
-5
-4Eocenelimestone
Neogenebasalt
UpperCretaceous
limestone
LowerCretaceoussandstone
Jurassic-Triassicsandstone
Paleozoicsandstone
x
Log R
EY
/C1
Log R
EY
/C1
La Pr
Pm Eu
Tb Y Er
Yb
La
Pr
Pm Eu
Tb Y Er
Yb
-7
-6
-5
-4
Log R
EY
/C1
La Pr
Pm Eu Tb Y Er
Yb
-7
-6
-5
-4
Log R
EY
/C1
La Pr
Pm Eu
Tb Y Er
Yb
-7
-6
-5
-4
Log R
EY
/C1
La Pr
Pm Eu
Tb Y Er
Yb
La Pr
Pm Eu
Tb Y Er
Yb
13
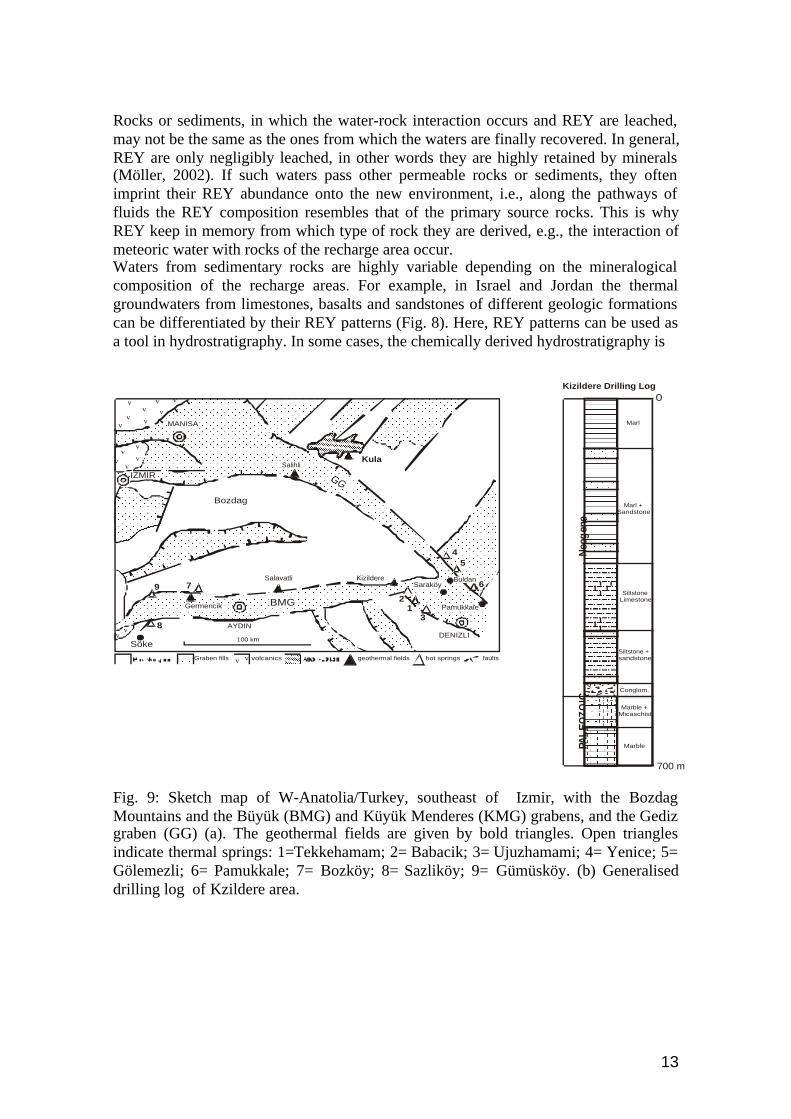
Rocks or sediments, in which the water-rock interaction occurs and REY are leached,may not be the same as the ones from which the waters are finally recovered. In general,REY are only negligibly leached, in other words they are highly retained by minerals(Möller, 2002). If such waters pass other permeable rocks or sediments, they oftenimprint their REY abundance onto the new environment, i.e., along the pathways offluids the REY composition resembles that of the primary source rocks. This is whyREY keep in memory from which type of rock they are derived, e.g., the interaction ofmeteoric water with rocks of the recharge area occur.Waters from sedimentary rocks are highly variable depending on the mineralogicalcomposition of the recharge areas. For example, in Israel and Jordan the thermalgroundwaters from limestones, basalts and sandstones of different geologic formationscan be differentiated by their REY patterns (Fig. 8). Here, REY patterns can be used asa tool in hydrostratigraphy. In some cases, the chemically derived hydrostratigraphy is
Fig. 9: Sketch map of W-Anatolia/Turkey, southeast of Izmir, with the BozdagMountains and the Büyük (BMG) and Küyük Menderes (KMG) grabens, and the Gedizgraben (GG) (a). The geothermal fields are given by bold triangles. Open trianglesindicate thermal springs: 1=Tekkehamam; 2= Babacik; 3= Ujuzhamami; 4= Yenice; 5=Gölemezli; 6= Pamukkale; 7= Bozköy; 8= Sazliköy; 9= Gümüsköy. (b) Generaliseddrilling log of Kzildere area.
v
vv
v
vv
v
v
vv
vv
v
vv
4
2
7
5
6Buldan
Pamukkale
Bozdag
13
DENIZLI
MANISA
Salavatli
Germencik
KizildereSaraköy
AYDIN
9
8
Söke
IZMIR
BMG
GG
SalihliKula
faultsgeothermal fields hot springsv v volcanicsGraben fills
100 km
Neo
gen
ePA
LE
OZ
OIC
Marble
Marble +Micaschist
Conglom.
Siltstone +sandstone
SiltstoneLimestone
Marl +Sandstone
Marl
700 m
0Kizildere Drilling Log

14
Fig. 10: C1-chondrite normalised REY patterns of thermal spring waters W Anatolia.Localities are given in Fig. 9. Figures attached to names indicate year/sampling number.
not identical with the assumed source lithology or aquifer according to geologicknowledge (Möller et al., 2003).The Na-HCO3 type of waters from the thermal springs of Gölemezli, Tekkehamam,Babacik, and Yenicekent in Turkey occur in the Neogene sediments and are locatedalong faults of the northern and southern flanks of the Büyük Menderes graben, WAnatolia (Fig. 9). These waters are carbonate-rich and travertine forms at naturaldischarges. The REY patterns (Fig. 10b) prove that the waters originate from Palaeozoicmica schist intercalated with marble which is evident by comparison of their patternswith those of the fluids from the Kizildere boreholes (Fig. 7d). The waters from Yenice(Fig. 10a), Gümüsköy and Bosköy (Fig. 10c) are different from those near Kizildere(Fig. 10b). They are strongly affected by REY exchange with clay minerals. Although
-6
-5
-4
-3
La Ce Pr Nd Pm Sm Eu Gd Tb Dy Y Ho Er Tm Yb Lu
Log
REY,
C1-
cond
rite
norm
alise
d
Gümüsköy well 96/11
Gümüsköy well 98/31
Gümüsköy bath 98/32
Bosköy spring 96/12
Bosköy well 96/13
c-6
-5
-4
-3
La Ce Pr Nd Pm Sm Eu Gd Tb Dy Y Ho Er Tm Yb Lu
Pamukkale, hotel 97/28
Pamukkale, hotel 95/04
Pamukkale, Jandarma 97/26
Pamukkale, Jandarma 96/42
Pamukkale, Jandarma 98/26
Pamukkale, Jandarma 99/29
Kula, mineral water spring 99/01d
-7
-6
-5
-4
La Ce Pr Nd Pm Sm Eu Gd Tb Dy Y Ho Er Tm Yb Lu
Tekkehamam 97/01
Babacik 97/03
Ujuzhamani 95/8
Gölemezli 95/2
Sazliköy spring 96/10
Thermal spring waters :
b-7
-6
-5
-4
-3
La Ce Pr Nd Pm Sm Eu Gd Tb Dy Y Ho Er Tm Yb Lu
Log
REY,
C1-
chon
drite
nor
mali
sed
Yenice bath 96/38
Yenice bath 97/29
Yenice bath 98/24
Yenice ridge 96/39
Yenice ridge 97/30
Yenice well 3 98/25
aa
a

15
discharging along the same fault as the Yenice, the water from Pamukkale is fromanother source. It originates from Tertiary limestone and is high in oxygen, i.e., it doesnot deeply percolate rocks before discharging (Möller et al., in press).
7.2 HIGH-TEMPERATURE FLUIDSThe high-temperature areas of Kizildere/Turkey, Monte Amiata/Italy and Larderello-Travale/Italy produce steam has a very high initial gas/liquid ratio and is characterisedby high CO2 contents. These geothermal fields are exploited for electric powergeneration.
7.2.1 Geological backgroundW Anatolia/Turkey: The Menderes Massif (Fig. 9) is the oldest rock assemblage of theAnatolian Continent and comprises high-grade gneisses and schists overlain by low-grade schist, marble, phyllite, metaplutonites and metasedimentary rocks associatedwith recrystallised limestones. The Miocene sedimentary rocks are succeeded by mega-sequences of clastic, carbonate- and organic-rich sedimentary rocks. The sedimentaryfacies mainly occur as alluvial fans, fluvial carbonate mudflats and ephemeral shallowfreshwater carbonate lake deposits. Volcanic facies and borate deposits interfinger thesesedimentary sequences. The Pliocene sedimentary succession resembles in compositionthe underlying Miocene.Grabens developed to the N and S of the Bozdag Horst (Fig. 9). Due to rapid uplift,high seismicity, and erosion very thick and coarse-grained alluvial and fluvial Plioceneto Quaternary sediments accumulated in the Gediz-, Kücük Menderes-, and BüyükMenderes grabens. In W Anatolia, the Early-Middle Miocene shoshonitic andultrapotassic-lamproitic volcanism is considered to be related to the oceanic subductionthat developed in the Aegean area after the Cretaceous–Eocene collision of the Sakaryaand Anatolian continents (Francalanci et. al., 2000). A second alkaline volcanic phasestarted in the Middle Miocene and increased volumetrically with time.Most of the geothermal systems are bound to intersections of the youngest E-Wtrending grabens and older NW-SE and NE-SW striking faults. The KizildereGeothermal Field is part of the enormous Denizli-Buldan-Sarayköy geothermal areanear the junction of the Gediz- and the Büyük Menderes grabens (Fig. 9). At thegeothermal plant of Kizildere, eight wells, cased to depths of 500 to 1000 m, produceextremely CO2-rich fluids from the crystalline basement with bottom hole temperaturesup to 240°C and pressures ranging from 50 to 90 bar. Under bottom hole conditions thefluids contain about 0.2 to 0.4 mol of dissolved CO2 per kg fluid (Satman et al., 1999).The exsolution of CO2 starts at approximately 500 m below surface and a Sr-richcarbonate- silica scale precipitates. Numerous thermal springs occur in the KizildereGeothermal Field.In the Büyük Menderes graben there are two other geothermal fields in the state ofexploration: Salavatli and Germencik. Exploration wells have been drilled in the SalihliGeothermal Field, Gediz graben, through the Miocene-Pliocene conglomerate,
16
20km
Lago Trasi-meno
Tolfa
Roccastrada
Grosseto
Montepulciano
Scansano
M. Argentario
N
L. di Bols-ena
.
11° 00’ E 11° 30’ E 12° 00’ E
42° 3
0’ N
42°
00’ N
43° 0
0’ N
Tyrrhenian Sea
Siena
200
150
50100
100
200
2 50
150
150
150
50
150
200
100
600
300
500
150
150
100
100
100
150
150
200Travale
Boccheggiano
Larderello
M. AMIATAPIANCASTAGNAIO
250
Magmatic, metamorphic andsedimentary rocks, undefined
Tuscan magmatic province
Heat flow (mWm)-2
Hg mineralisation and minesSb mineralisation and mines
Roman magmatic province
Viterbo
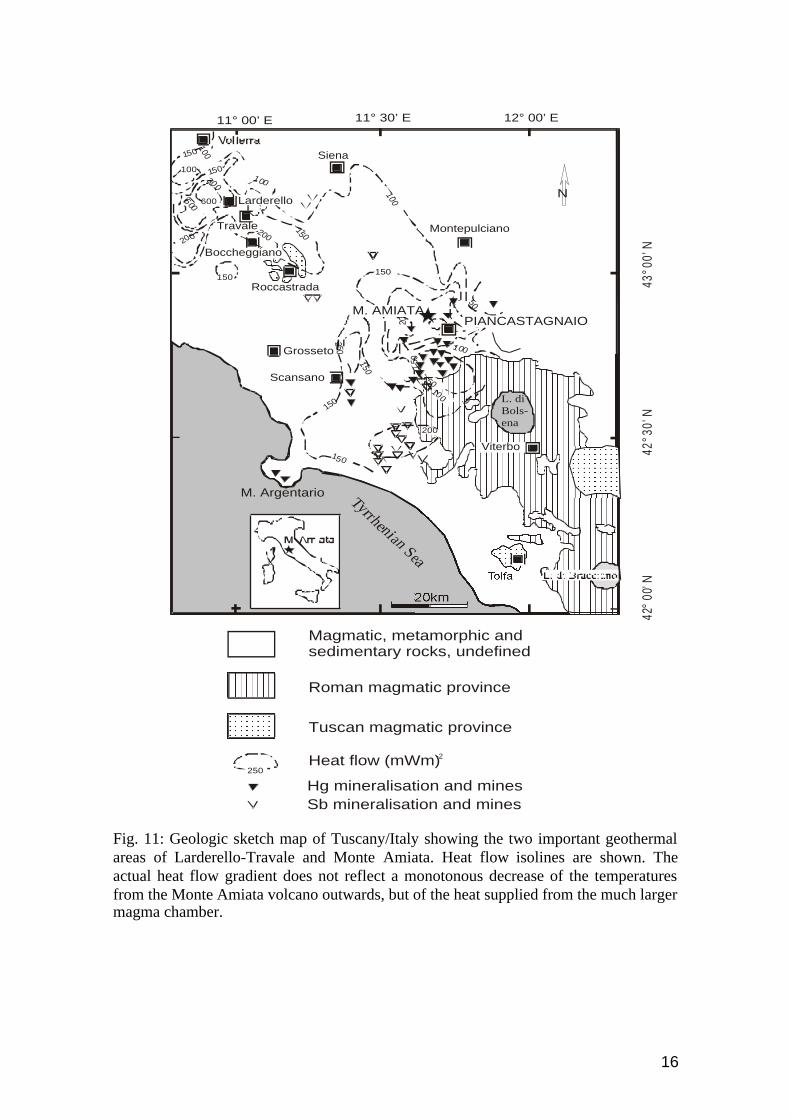
Fig. 11: Geologic sketch map of Tuscany/Italy showing the two important geothermalareas of Larderello-Travale and Monte Amiata. Heat flow isolines are shown. Theactual heat flow gradient does not reflect a monotonous decrease of the temperaturesfrom the Monte Amiata volcano outwards, but of the heat supplied from the much largermagma chamber.
17
sandstone, mudstone, limestone and tuff into the Paleozoic schists, quartz schists,micaschists and marbles of the Menderes Massif. The thermal water is supplied to spas.The Kula geothermal field is located on a block of crystalline rocks east of the Gedizgraben. As the youngest volcanics of Western Anatolia, the Kula volcanics are Na-dominant in character, while all the former volcanic series of Western Anatolia are K-dominant.
Tuscany/Italy: The geothermal area of Larderello-Travale and Monte Amiata (bothCentral Italy, Fig. 11), are well known for their many fumaroles and for the use of thehigh-temperature fluids (HTF) for electricity generation and domestic heating. The areaof Larderello is the largest geothermal anomaly in Italy with a maximum thermal heatflow of more than 600 mW/m2 (Fig. 11). The large geothermal anomalies of Tuscanyare produced by a granitic batholith which intruded 3.5 Ma ago (Batini et al., 1985). Theroof of the pluton is defined by the so called K horizon at about 3 to 6 km depth. Thishorizon is characterized by a very low acoustic impedance. The petrologic interpretationof the geophysical data suggests that it is a strongly fractured basement unit of somehundreds of meters in thickness impregnated with high-temperature and high-pressurefluids.HTF is produced from drill holes over a large depth interval that tap more than onelithology. The geothermal wells penetrate both the Upper Triassic evaporites of theTuscan nappes and the Carboniferous phyllitic series. Thus, two types of fluids areproduced with different REY abundances and chemical composition.Until 1930, the high boron contents of the hot springs has been the basis for boric acidproduction by a company founded in 1808 by the industrialist Francesco Larderel. AtMonte Amiata numerous Hg mineralisations cluster, whereas the Sb mineralisations arelocated at greater distance. A zonal distribution of the mineralisation centred around theMonte Amiata volcano is not observed. It is supposed that both types of mineralisationare related to the Monte Amiata volcanism. Until the 1960ties, the Monte Amiatamining district was the world’s second important mercury producer (Möller et al., inprep.).
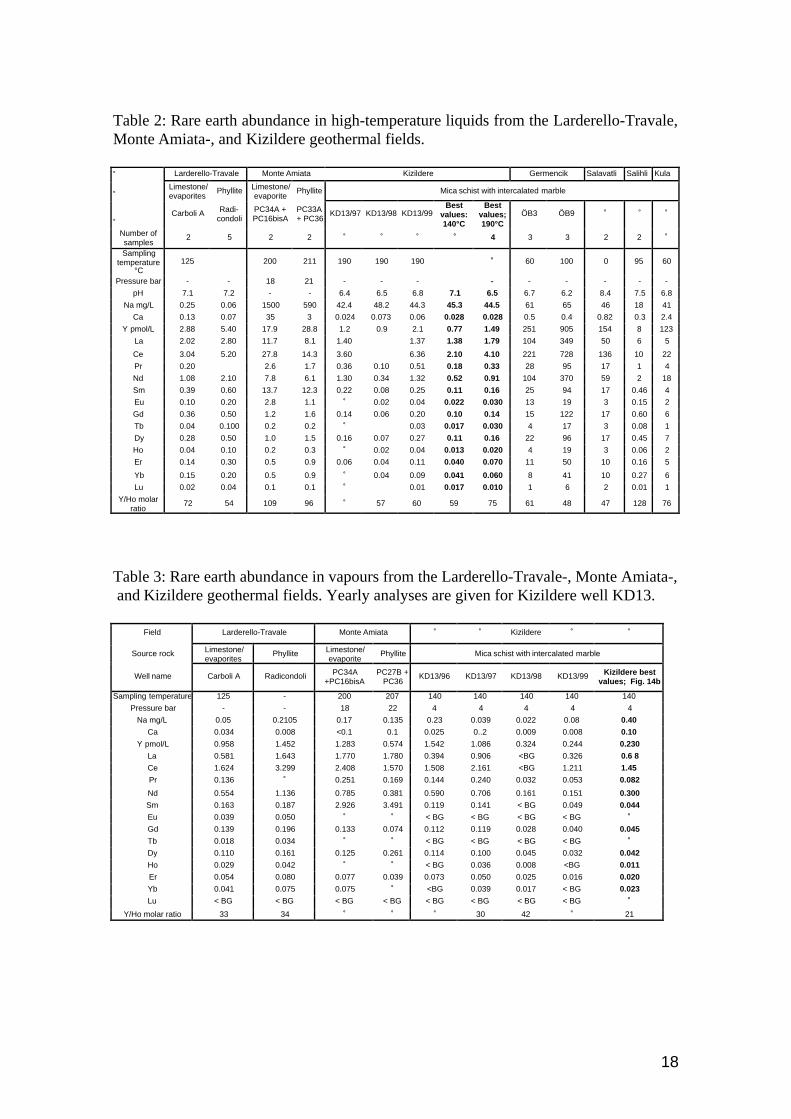
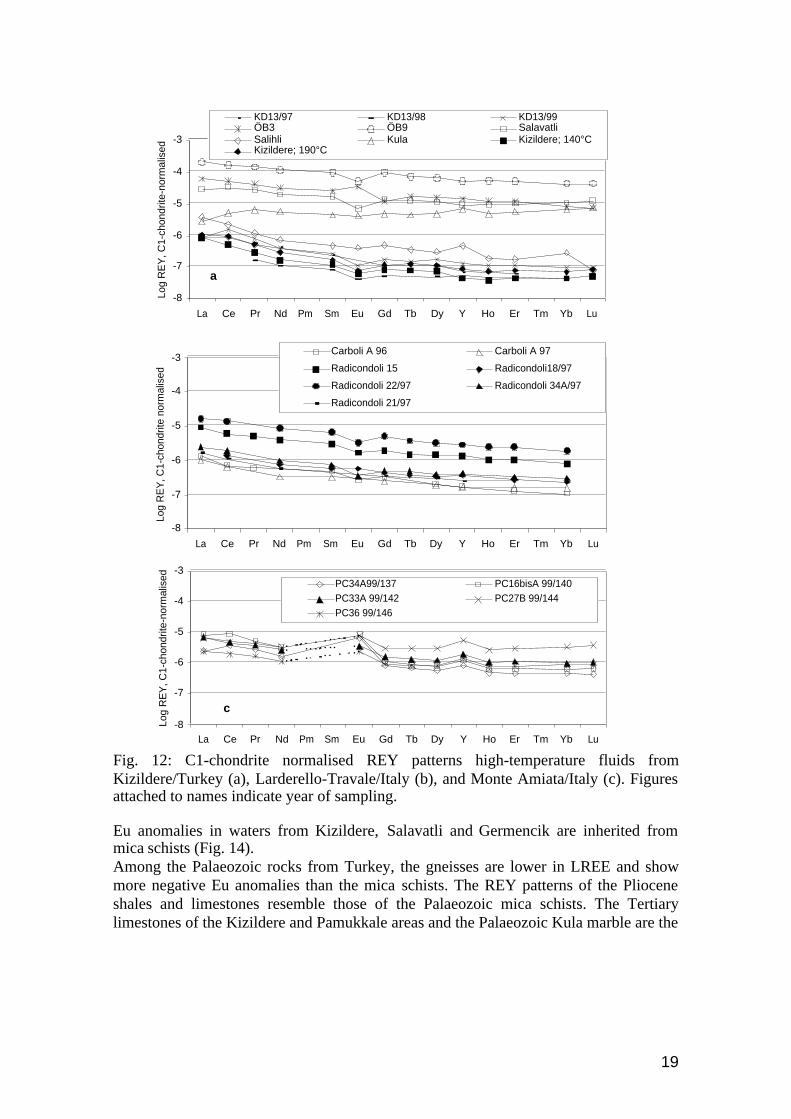
7.2.2 REY in liquid and vapour.Liquids and steam coexist in high-temperature fluids. Steam is an aerosol consisting offine droplets of liquid and water-saturated vapour containing besides H 2O non-condensable gases under surface conditions. On a H2O-free basis, the non-condensablefraction consists mainly of CO2. The rather large variability in the non-condensable gascomposition of the HTF is considered to be typical of gases originating from differentsources at shallow depth (Gianelli and Calore, 1996).The REY patterns of liquids and vapours from the Anatolian and Tuscan geothermalfields are shown in Figs. 12 and 13, respectively. For each of the geothermal fields mostof the patterns are subparallel. In Fig. 12 individual REY patterns for wellKD13/Kizildere are given in thin lines in order to visualise the high scatter of patterns ata given locality during the years of sampling. The REY patterns of liquids fromKizildere and Larderello show small negative Eu anomalies but no Ce and Y anomalies.Only the liquids from Monte Amiata show Eu and Y anomalies. The small negative
18
Table 2: Rare earth abundance in high-temperature liquids from the Larderello-Travale,Monte Amiata-, and Kizildere geothermal fields.
Larderello-Travale Monte Amiata Kizildere Germencik Salavatli Salihli Kula
Limestone/evaporites
Phyllite Limestone/evaporite
Phyllite Mica schist with intercalated marble
Carboli A Radi-
condoliPC34A +PC16bisA
PC33A+ PC36
KD13/97 KD13/98 KD13/99Best
values:140°C
Bestvalues;190°C
ÖB3 ÖB9
Number ofsamples
2 5 2 2 4 3 3 2 2
Samplingtemperature
°C125 200 211 190 190 190 60 100 0 95 60
Pressure bar - - 18 21 - - - - - - - - -
pH 7.1 7.2 - - 6.4 6.5 6.8 7.1 6.5 6.7 6.2 8.4 7.5 6.8
Na mg/L 0.25 0.06 1500 590 42.4 48.2 44.3 45.3 44.5 61 65 46 18 41
Ca 0.13 0.07 35 3 0.024 0.073 0.06 0.028 0.028 0.5 0.4 0.82 0.3 2.4
Y pmol/L 2.88 5.40 17.9 28.8 1.2 0.9 2.1 0.77 1.49 251 905 154 8 123
La 2.02 2.80 11.7 8.1 1.40 1.37 1.38 1.79 104 349 50 6 5
Ce 3.04 5.20 27.8 14.3 3.60 6.36 2.10 4.10 221 728 136 10 22
Pr 0.20 2.6 1.7 0.36 0.10 0.51 0.18 0.33 28 95 17 1 4
Nd 1.08 2.10 7.8 6.1 1.30 0.34 1.32 0.52 0.91 104 370 59 2 18
Sm 0.39 0.60 13.7 12.3 0.22 0.08 0.25 0.11 0.16 25 94 17 0.46 4
Eu 0.10 0.20 2.8 1.1 0.02 0.04 0.022 0.030 13 19 3 0.15 2
Gd 0.36 0.50 1.2 1.6 0.14 0.06 0.20 0.10 0.14 15 122 17 0.60 6
Tb 0.04 0.100 0.2 0.2 0.03 0.017 0.030 4 17 3 0.08 1
Dy 0.28 0.50 1.0 1.5 0.16 0.07 0.27 0.11 0.16 22 96 17 0.45 7
Ho 0.04 0.10 0.2 0.3 0.02 0.04 0.013 0.020 4 19 3 0.06 2
Er 0.14 0.30 0.5 0.9 0.06 0.04 0.11 0.040 0.070 11 50 10 0.16 5
Yb 0.15 0.20 0.5 0.9 0.04 0.09 0.041 0.060 8 41 10 0.27 6
Lu 0.02 0.04 0.1 0.1 0.01 0.017 0.010 1 6 2 0.01 1
Y/Ho molarratio
72 54 109 96 57 60 59 75 61 48 47 128 76
Table 3: Rare earth abundance in vapours from the Larderello-Travale-, Monte Amiata-, and Kizildere geothermal fields. Yearly analyses are given for Kizildere well KD13.
Field Larderello-Travale Monte Amiata Kizildere
Source rock Limestone/evaporites
Phyllite Limestone/evaporite
Phyllite Mica schist with intercalated marble
Well name Carboli A Radicondoli PC34A+PC16bisA
PC27B +PC36
KD13/96 KD13/97 KD13/98 KD13/99 Kizildere bestvalues; Fig. 14b
Sampling temperature 125 - 200 207 140 140 140 140 140
Pressure bar - - 18 22 4 4 4 4 4
Na mg/L 0.05 0.2105 0.17 0.135 0.23 0.039 0.022 0.08 0.40
Ca 0.034 0.008 <0.1 0.1 0.025 0..2 0.009 0.008 0.10
Y pmol/L 0.958 1.452 1.283 0.574 1.542 1.086 0.324 0.244 0.230
La 0.581 1.643 1.770 1.780 0.394 0.906 <BG 0.326 0.6 8
Ce 1.624 3.299 2.408 1.570 1.508 2.161 <BG 1.211 1.45
Pr 0.136 0.251 0.169 0.144 0.240 0.032 0.053 0.082
Nd 0.554 1.136 0.785 0.381 0.590 0.706 0.161 0.151 0.300
Sm 0.163 0.187 2.926 3.491 0.119 0.141 < BG 0.049 0.044
Eu 0.039 0.050 < BG < BG < BG < BG
Gd 0.139 0.196 0.133 0.074 0.112 0.119 0.028 0.040 0.045
Tb 0.018 0.034 < BG < BG < BG < BG
Dy 0.110 0.161 0.125 0.261 0.114 0.100 0.045 0.032 0.042
Ho 0.029 0.042 < BG 0.036 0.008 <BG 0.011
Er 0.054 0.080 0.077 0.039 0.073 0.050 0.025 0.016 0.020
Yb 0.041 0.075 0.075 <BG 0.039 0.017 < BG 0.023
Lu < BG < BG < BG < BG < BG < BG < BG < BG
Y/Ho molar ratio 33 34 30 42 21
19
Fig. 12: C1-chondrite normalised REY patterns high-temperature fluids fromKizildere/Turkey (a), Larderello-Travale/Italy (b), and Monte Amiata/Italy (c). Figuresattached to names indicate year of sampling.
Eu anomalies in waters from Kizildere, Salavatli and Germencik are inherited frommica schists (Fig. 14).Among the Palaeozoic rocks from Turkey, the gneisses are lower in LREE and showmore negative Eu anomalies than the mica schists. The REY patterns of the Plioceneshales and limestones resemble those of the Palaeozoic mica schists. The Tertiarylimestones of the Kizildere and Pamukkale areas and the Palaeozoic Kula marble are the
-8
-7
-6
-5
-4
-3
La Ce Pr Nd Pm Sm Eu Gd Tb Dy Y Ho Er Tm Yb Lu
Log
RE
Y, C
1-ch
ondr
ite-n
orm
alis
ed
KD13/97 KD13/98 KD13/99ÖB3 ÖB9 SalavatliSalihli Kula Kizildere; 140°CKizildere; 190°C
a
-8
-7
-6
-5
-4
-3
La Ce Pr Nd Pm Sm Eu Gd Tb Dy Y Ho Er Tm Yb Lu
Log
RE
Y, C
1-ch
ondr
ite-n
orm
alis
ed
PC34A99/137 PC16bisA 99/140PC33A 99/142 PC27B 99/144PC36 99/146
c
-8
-7
-6
-5
-4
-3
La Ce Pr Nd Pm Sm Eu Gd Tb Dy Y Ho Er Tm Yb Lu
Log
RE
Y, C
1-ch
ondr
ite n
orm
alis
ed
Carboli A 96 Carboli A 97
Radicondoli 15 Radicondoli18/97
Radicondoli 22/97 Radicondoli 34A/97
Radicondoli 21/97
20
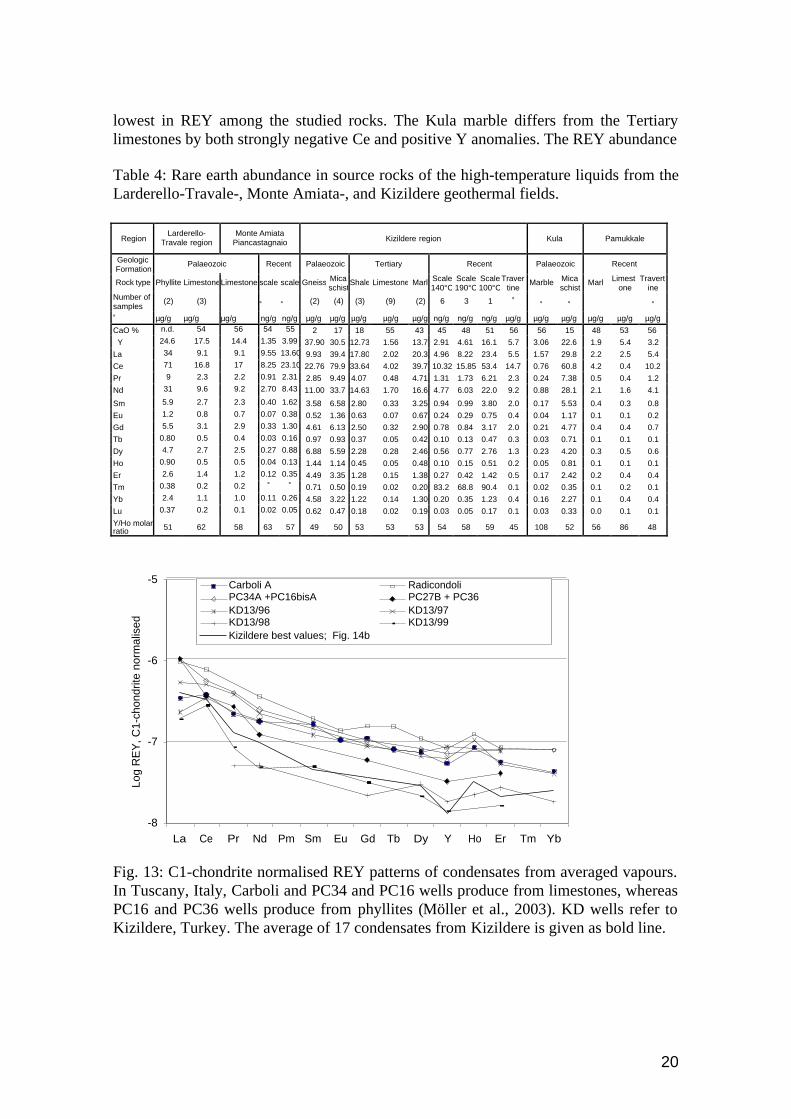
lowest in REY among the studied rocks. The Kula marble differs from the Tertiarylimestones by both strongly negative Ce and positive Y anomalies. The REY abundance
Table 4: Rare earth abundance in source rocks of the high-temperature liquids from theLarderello-Travale-, Monte Amiata-, and Kizildere geothermal fields.
RegionLarderello-
Travale regionMonte Amiata
Piancastagnaio Kizildere region Kula Pamukkale
GeologicFormation
Palaeozoic Recent Palaeozoic Tertiary Recent Palaeozoic Recent
Rock type Phyllite LimestoneLimestone scale scale Gneiss Micaschist
Shale Limestone Marl Scale140°C
Scale190°C
Scale100°C
Travertine
Marble Micaschist
Marl Limestone
Travertine
Number ofsamples
(2) (3) (2) (4) (3) (9) (2) 6 3 1
µg/g µg/g µg/g ng/g ng/g µg/g µg/g µg/g µg/g µg/g ng/g ng/g ng/g µg/g µg/g µg/g µg/g µg/g µg/g
CaO % n.d. 54 56 54 55 2 17 18 55 43 45 48 51 56 56 15 48 53 56
Y 24.6 17.5 14.4 1.35 3.99 37.90 30.5 12.73 1.56 13.7 2.91 4.61 16.1 5.7 3.06 22.6 1.9 5.4 3.2
La 34 9.1 9.1 9.55 13.60 9.93 39.4 17.80 2.02 20.3 4.96 8.22 23.4 5.5 1.57 29.8 2.2 2.5 5.4
Ce 71 16.8 17 8.25 23.10 22.76 79.9 33.64 4.02 39.7 10.32 15.85 53.4 14.7 0.76 60.8 4.2 0.4 10.2
Pr 9 2.3 2.2 0.91 2.31 2.85 9.49 4.07 0.48 4.71 1.31 1.73 6.21 2.3 0.24 7.38 0.5 0.4 1.2
Nd 31 9.6 9.2 2.70 8.43 11.00 33.7 14.63 1.70 16.6 4.77 6.03 22.0 9.2 0.88 28.1 2.1 1.6 4.1
Sm 5.9 2.7 2.3 0.40 1.62 3.58 6.58 2.80 0.33 3.25 0.94 0.99 3.80 2.0 0.17 5.53 0.4 0.3 0.8
Eu 1.2 0.8 0.7 0.07 0.38 0.52 1.36 0.63 0.07 0.67 0.24 0.29 0.75 0.4 0.04 1.17 0.1 0.1 0.2
Gd 5.5 3.1 2.9 0.33 1.30 4.61 6.13 2.50 0.32 2.90 0.78 0.84 3.17 2.0 0.21 4.77 0.4 0.4 0.7
Tb 0.80 0.5 0.4 0.03 0.16 0.97 0.93 0.37 0.05 0.42 0.10 0.13 0.47 0.3 0.03 0.71 0.1 0.1 0.1
Dy 4.7 2.7 2.5 0.27 0.88 6.88 5.59 2.28 0.28 2.46 0.56 0.77 2.76 1.3 0.23 4.20 0.3 0.5 0.6
Ho 0.90 0.5 0.5 0.04 0.13 1.44 1.14 0.45 0.05 0.48 0.10 0.15 0.51 0.2 0.05 0.81 0.1 0.1 0.1
Er 2.6 1.4 1.2 0.12 0.35 4.49 3.35 1.28 0.15 1.38 0.27 0.42 1.42 0.5 0.17 2.42 0.2 0.4 0.4
Tm 0.38 0.2 0.2 0.71 0.50 0.19 0.02 0.20 83.2 68.8 90.4 0.1 0.02 0.35 0.1 0.2 0.1
Yb 2.4 1.1 1.0 0.11 0.26 4.58 3.22 1.22 0.14 1.30 0.20 0.35 1.23 0.4 0.16 2.27 0.1 0.4 0.4
Lu 0.37 0.2 0.1 0.02 0.05 0.62 0.47 0.18 0.02 0.19 0.03 0.05 0.17 0.1 0.03 0.33 0.0 0.1 0.1
Y/Ho molarratio 51 62 58 63 57 49 50 53 53 53 54 58 59 45 108 52 56 86 48
-8
-7
-6
-5
La Ce Pr Nd Pm Sm Eu Gd Tb Dy Y Ho Er Tm Yb
Log
RE
Y, C
1-ch
ondr
ite n
orm
alis
ed
Carboli A Radicondoli PC34A +PC16bisA PC27B + PC36KD13/96 KD13/97KD13/98 KD13/99Kizildere best values; Fig. 14b
Fig. 13: C1-chondrite normalised REY patterns of condensates from averaged vapours.In Tuscany, Italy, Carboli and PC34 and PC16 wells produce from limestones, whereasPC16 and PC36 wells produce from phyllites (Möller et al., 2003). KD wells refer toKizildere, Turkey. The average of 17 condensates from Kizildere is given as bold line.

21
of the ubiquitous travertines are similar to those of the local limestones. The REYpatterns of the various high-temperature carbonate scales from Kizildere show muchlower REY abundances than sedimentary carbonates and rarely anomalies. The absence
Fig. 14: C1-chondrite normalised REY patterns of representative host rocks of thereported high-temperature fluids, travertines and scales.
-1
0
1
2
3
La Ce Pr Nd Pm Sm Eu Gd Tb Dy Y Ho Er Tm Yb Lu
LOG
RE
Y, C
1-ch
ondr
ote-
norm
alis
ed
Pyllite; Larderello Pyllite; LarderelloPyllite; Larderello Limestone; LarderelloLimestone; Larderello Limestone; Larderello
Limestone; Mt. Amiata Gneiss; KizildereSchist; Kizildere Shale; Kizildere
Limestone; Kizildere Limestone; KizildereMarl; Kizildere Marble; KulaSchist; Kula Marl; PamukkaleLimestone; Pamukkale
-4
-3
-2
-1
0
1
2
La Ce Pr Nd Pm Sm Eu Gd Tb Dy Y Ho Er Tm Yb Lu
Lo
g R
EY
, C
1-c
ho
nd
rite
-no
rma
lise
d
Scale; Monte Amiata Scale; Monte Amiata Scale, Kizildere; 140°C
Scale, Kizildere; 190°C Scale, Kizildere; 100°C Travertine; Kizildere
Travertine; Pamukkale

22
of significant Y anomalies in the waters indicates that sorption of REE and Y is either instatic equilibrium with the leached rocks or the waters migrate on fractures and not inpores. Both arguments are consistent with the high discharge rates at Kizildere of about2.105 kg/h of each well. Some of the scatter of the Y/Ho atomic ratios (Table 3) isattributed to uncertainties of the low Ho abundance. For the well head fluids the atomicY/Ho ratios are 61±8. The Y/Ho ratios of 55±2 of the condensates (Table 4) arecomparable with those of liquids and the scales (Table 5). All ratios are similar withintheir uncertainties and comparable with the chondritic atomic ratio of 52±5 (Bau 1996),i.e. no fractionation. The Y enrichment in the fluid and their source rocks (Table 5) isminor, i.e. REY contribution from marble (Table 4) is negligible.
7.2.3 Selection of best analysesREY abundance in waters from each geothermal water is highly variable with time(Table 2, Fig. 12). Although the efficiency of REY preconcentration is between 95 and106%, the REY abundances in water from each well possibly varies due to:
(i) Compositional variations in the original fluid resulting from leaching ofinhomogeneously distributed REY-bearing components;(ii) Variability of scale formation and associated coprecipitation of REY;(iii) Uncontrollable liquid/steam ratio during sampling;(iv) Contamination by dissolution of scale particles dragged along with the flashingfluids.
As a consequence of variable REY abundance in liquids, the REY abundance invapours must also be variable (Table 3; Fig. 13).Plots of the REY/Ca ratios vs. Ca contents of all Kizildere liquids indicate two differenttrends and a wide spread of Ca contents (Fig. 15a). The extrapolated lowest Ca contentis 0.024 mmol/kg at 190°C in agreement with Table 2. This content is considered to benearest to calcite equilibrium at flashing temperature, whereas higher Ca contents areproduced by dissolution of scale particles dragged along with the flashing fluid, whichdissolve at low temperature in the sampled liquids. The trend to high REY/Ca ratios
Fig. 15: allows to find the least contaminated values for Sm and Gd in liquid andvapour. These data are used to select the best analyses among all performed. ForKizildere these data sets are given in Table 3 and 4 as “best values”, respectively.
0
20
40
60
80
100
120
140
160
0.00 0.02 0.04 0.06 0.08
Ca mmol/L
Sm
/Ca
and
Gd/
Ca
mol
ar r
atio
*10
^9
Sm/Ca
Gd/Ca
0.04 pmol/kg
0.1 pmol/kg
0
10
20
30
0.01 0.06 0.11 0.16
Ca mmol/L
Sm
/Ca
and
Gd/
Ca
mol
ar r
atio
(*
10^9
)
Sm/CaGd/Caß=2.7*10^-9ß=3*10^-6

23
results from local involvement of minerals with enhanced REY abundance. Water-rockinteraction does not yield constant composition of fluids with time (Middlesworth andWood, 1998) as can be seen from well Carboli A in the Larderello- and well KD13 inthe Kizildere geothermal field (Table 2). The trend to high REE/Ca ratios is alsosuperimposed bydissolution of scale particles. The trend of slightly declining REY/Ca ratios, caused bydissolution of scale particles in the sampled fluid, results from eqs. (3-6) when insertingß=2.7.10-9 which characterises scale carbonates (Table 4). The steep trend is caused byß=3.10-6 which is characteristic for dissolution of limestones and marbles (Table 4).
[ ][ ] solidsolution
solidsolution
measured CaCa
REYREY
Ca
REY
++=
(3)
[ ] [ ] ( )ε+= 1CaCa solutionmeasured (4)
with solidsolid ßCaREY = (5)
{ }[ ]
( ) ( )( ) ßCaREY
CaREY
CaREY
Ca
Ca
measured
measuredsolution
solution
L/dissolved
−
−==ε (6)
The data points of the condensates follow a hyperbolic trend (Fig. 15b). High REY/Caratios are obtained when Ca is low and vice versa. This is simply a plot of 1/Ca vs. Camultiplied by an abundance of Sm and Gd in vapours ranging from 0.04 to 0.10pmol/kg. If only few analyses are available, the described method cannot be applied.The intersections of the vertical and horizontal trends define the best analyses, lowest inboth Ca and REE. With the help of Sm and Gd the best REY analyses are selectedamong the measured ones.
7.2.3 Element partition between liquid and vapour
Apparent partition factors between vapour and liquid, VL
appD , are estimated according toeq.(8) and are shown in Fig. 16.
liquidvapourVL
app ElElD /= (7)
Although the patterns of ( )REYDVL
app are “noisy”, they show a slight tendency todecrease from light to heavy REY in these CO2 dominated systems at temperaturesranging from 140 to 200°C and pressures from 4 to 20 bar. In contrast to REY, Na+ andK+ yield partition coefficients below 0.005, Cl- about 0.03. Ca2+ is highly varying andranges from 0.01 to 0.3. The apparent vapour-liquid partition coefficients of mono-, di-,
24
0.0
0.1
0.2
0.3
0.4
0.5
0.6
0.7
0.8
La Ce Pr Nd Pm Sm Eu Gd Tb Dy Y Ho Er Tm Yb Lu
Ave
rage
of ap
p DV
L
Carboli A (2)/LimestoneRadicondoli (5)/PhylliteMt.Amiata/limestsone (2)Mt.Amiata/phyllite (3)Kizildere; 140°C
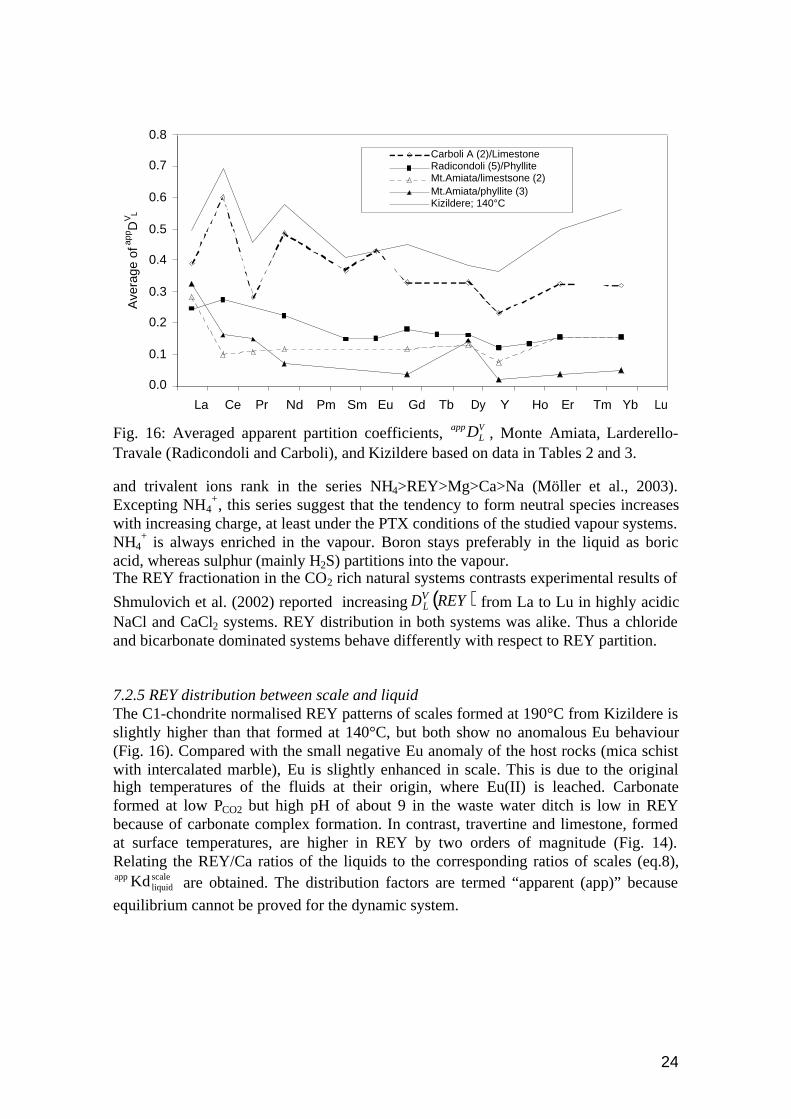
Fig. 16: Averaged apparent partition coefficients, VL
appD , Monte Amiata, Larderello-Travale (Radicondoli and Carboli), and Kizildere based on data in Tables 2 and 3.
and trivalent ions rank in the series NH4>REY>Mg>Ca>Na (Möller et al., 2003).Excepting NH4
+, this series suggest that the tendency to form neutral species increaseswith increasing charge, at least under the PTX conditions of the studied vapour systems.NH4
+ is always enriched in the vapour. Boron stays preferably in the liquid as boric
acid, whereas sulphur (mainly H2S) partitions into the vapour.The REY fractionation in the CO2 rich natural systems contrasts experimental results of
Shmulovich et al. (2002) reported increasing ( )REYDVL from La to Lu in highly acidic
NaCl and CaCl2 systems. REY distribution in both systems was alike. Thus a chlorideand bicarbonate dominated systems behave differently with respect to REY partition.
7.2.5 REY distribution between scale and liquidThe C1-chondrite normalised REY patterns of scales formed at 190°C from Kizildere isslightly higher than that formed at 140°C, but both show no anomalous Eu behaviour(Fig. 16). Compared with the small negative Eu anomaly of the host rocks (mica schistwith intercalated marble), Eu is slightly enhanced in scale. This is due to the originalhigh temperatures of the fluids at their origin, where Eu(II) is leached. Carbonateformed at low PCO2 but high pH of about 9 in the waste water ditch is low in REYbecause of carbonate complex formation. In contrast, travertine and limestone, formedat surface temperatures, are higher in REY by two orders of magnitude (Fig. 14).Relating the REY/Ca ratios of the liquids to the corresponding ratios of scales (eq.8),
scaleliquid
app Kd are obtained. The distribution factors are termed “apparent (app)” because
equilibrium cannot be proved for the dynamic system.
25
{ } [ ]liquidscale
scalefluid
app Ca/REYCa/REYKd = (8)
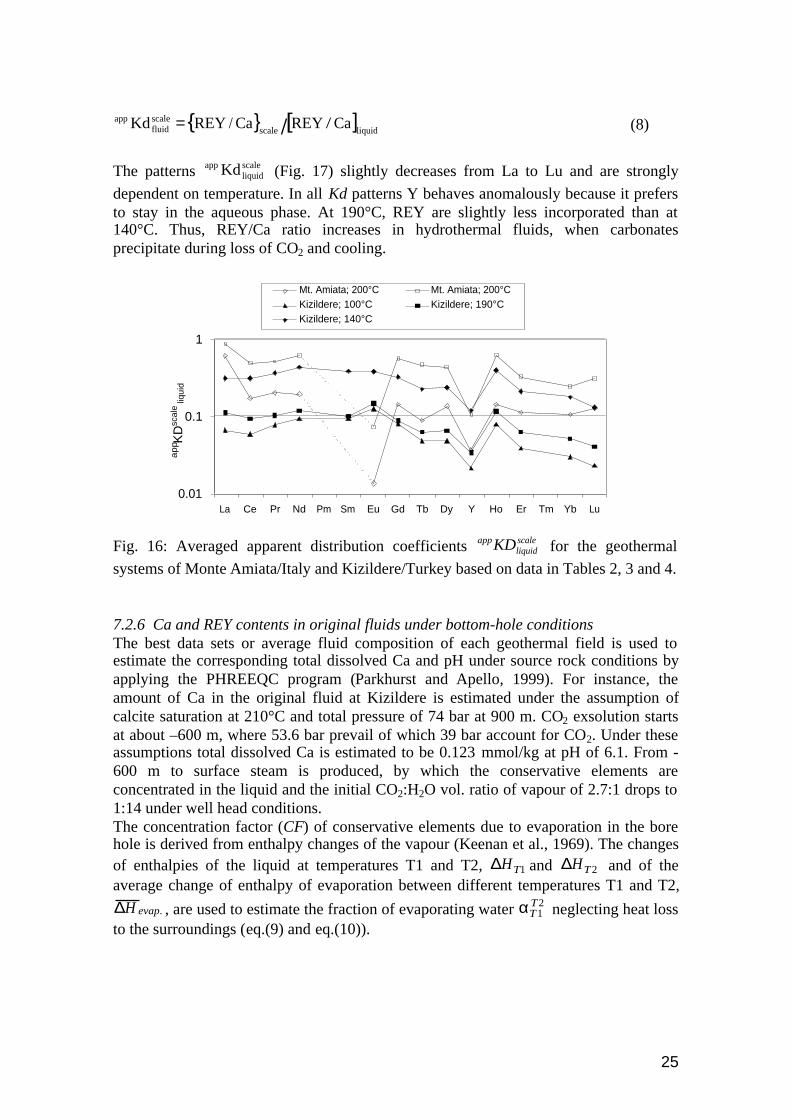
The patterns scaleliquid
app Kd (Fig. 17) slightly decreases from La to Lu and are strongly
dependent on temperature. In all Kd patterns Y behaves anomalously because it prefersto stay in the aqueous phase. At 190°C, REY are slightly less incorporated than at140°C. Thus, REY/Ca ratio increases in hydrothermal fluids, when carbonatesprecipitate during loss of CO2 and cooling.
Fig. 16: Averaged apparent distribution coefficients scaleliquid
appKD for the geothermal
systems of Monte Amiata/Italy and Kizildere/Turkey based on data in Tables 2, 3 and 4.
7.2.6 Ca and REY contents in original fluids under bottom-hole conditionsThe best data sets or average fluid composition of each geothermal field is used toestimate the corresponding total dissolved Ca and pH under source rock conditions byapplying the PHREEQC program (Parkhurst and Apello, 1999). For instance, theamount of Ca in the original fluid at Kizildere is estimated under the assumption ofcalcite saturation at 210°C and total pressure of 74 bar at 900 m. CO2 exsolution startsat about –600 m, where 53.6 bar prevail of which 39 bar account for CO2. Under theseassumptions total dissolved Ca is estimated to be 0.123 mmol/kg at pH of 6.1. From -600 m to surface steam is produced, by which the conservative elements areconcentrated in the liquid and the initial CO2:H2O vol. ratio of vapour of 2.7:1 drops to1:14 under well head conditions.The concentration factor (CF) of conservative elements due to evaporation in the borehole is derived from enthalpy changes of the vapour (Keenan et al., 1969). The changesof enthalpies of the liquid at temperatures T1 and T2, 1TH∆ and 2TH∆ and of theaverage change of enthalpy of evaporation between different temperatures T1 and T2,
.evapH∆ , are used to estimate the fraction of evaporating water 21
TTα neglecting heat loss
to the surroundings (eq.(9) and eq.(10)).
0.01
0.1
1
La Ce Pr Nd Pm Sm Eu Gd Tb Dy Y Ho Er Tm Yb Lu
ap
p KD
scal
eliq
uid
Mt. Amiata; 200°C Mt. Amiata; 200°CKizildere; 100°C Kizildere; 190°CKizildere; 140°C

26
.
1221
evap
TTTT
H
HH
∆∆−∆=α (9)
21
21 1(1 T
TT
TappCF α−= ) (10)
During ascent from depth to surface, paralleled by cooling from 210 to 190 °C, about5% of the primary liquid evaporates which corresponds to an enrichment ofconservative elements in the liquid by a factor of 1.05. With a minimum of dissolved Caof 0.024 mg/kg in well head fluids (Table 3), 0.123-0.024/1.05= 0.10 mmol/kg-fluid areprecipitated in the borehole, which is equal to 10 mg carbonate-scale/kg-fluid. Thisamounts to an average of about 16 tons per 11 month, which is the normal productionperiod of each well at Kizildere.The saturation indexes of minerals (SI) indicate that the well head fluids are mostlysupersaturated with respect to calcite. Their cooled equivalents, however, are stronglyundersaturated with respect to calcite at 50°C and 1 bar. Particularly, the condensates ofvapours are strongly undersaturated with respect to carbonates at samplingtemperatures.
7.2.5 Apparent distribution factor of REY between HTF and source rockThe analysed Palaeozoic and Mesozoic rocks of W Anatolia and Tuscany (Table 5)show REY patterns with rather similar trends and negative Eu anomalies (Fig. 17).The ratio of REY/Ca ratio in HTF and REY/Ca ratio of the corresponding source rocksyield apparent distribution factors, app
source rockHEFKd − (Fig. 17). In the long-time producing
geothermal system of Larderello-Travale and Kizildere the apparent distribution factorsare about 0.1 without depicting any anomalous behaviour of Eu or Y. Those determinedfor Monte Amiata are 1 – 2 orders less with strong Eu and Y anomalies. The reasons forthe considerable spread of app
source rockHEFKd − is not known yet.
( )( )rocksource
HTFHTFrocksource
app
)Ca/REY
Ca/REYKD = 11
Using the derived distribution factors (eq.11) and [Ca]original = 0.024 mmol/kg (thelowest Ca concentration determined in Fig. 15), REY are back-calculated according toeq(12). The factor 1.05 refers to evaporation of water during ascent.
[ ] [ ][ ] [ ]
[ ][ ]1SP
1SPscalefluid
app
1SPoriginal
1SPoriginal
Ca
REYKd
Ca05.1Ca
REY05.1REY=⋅
−⋅−⋅
(12)
27
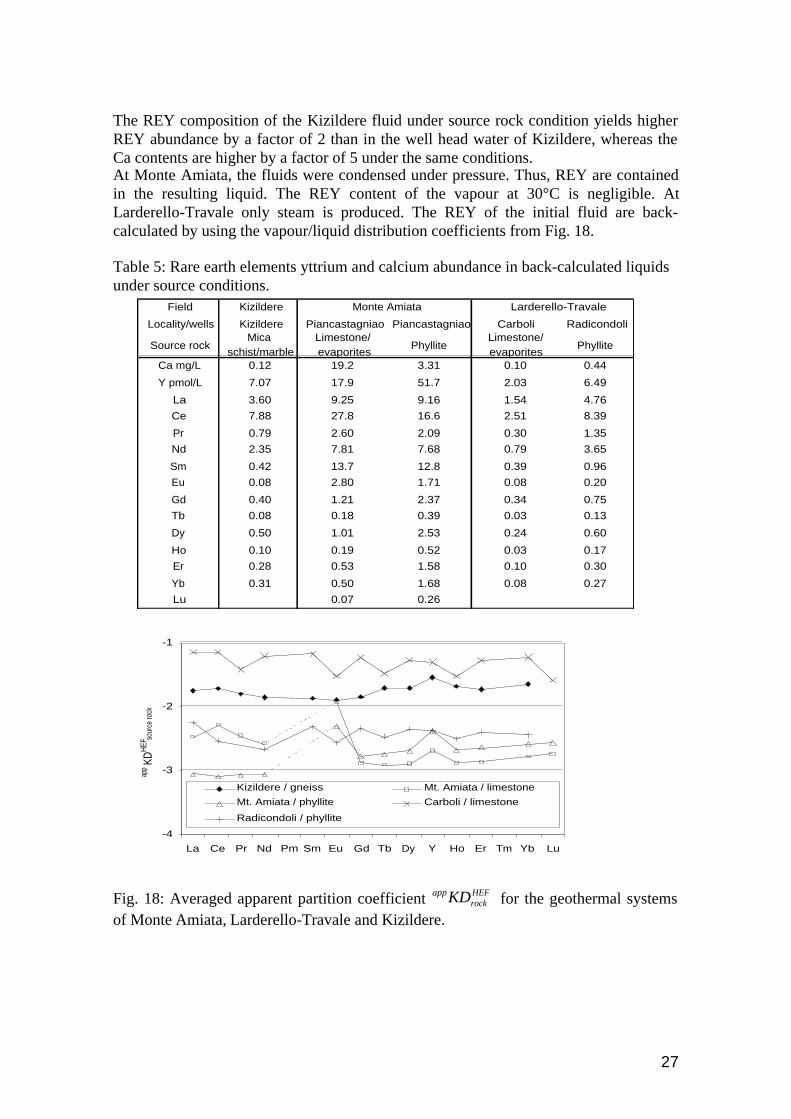
The REY composition of the Kizildere fluid under source rock condition yields higherREY abundance by a factor of 2 than in the well head water of Kizildere, whereas theCa contents are higher by a factor of 5 under the same conditions.At Monte Amiata, the fluids were condensed under pressure. Thus, REY are containedin the resulting liquid. The REY content of the vapour at 30°C is negligible. AtLarderello-Travale only steam is produced. The REY of the initial fluid are back-calculated by using the vapour/liquid distribution coefficients from Fig. 18.
Table 5: Rare earth elements yttrium and calcium abundance in back-calculated liquidsunder source conditions.
Fig. 18: Averaged apparent partition coefficient HEFrock
appKD for the geothermal systemsof Monte Amiata, Larderello-Travale and Kizildere.
-4
-3
-2
-1
La Ce Pr Nd Pm Sm Eu Gd Tb Dy Y Ho Er Tm Yb Lu
app
KDH
EFso
urce
rock
Kizildere / gneiss Mt. Amiata / limestone
Mt. Amiata / phyllite Carboli / limestone
Radicondoli / phyllite
Field Kizildere
Locality/wells Kizildere Piancastagniao Piancastagniao Carboli Radicondoli
Source rockMica
schist/marbleLimestone/ evaporites
PhylliteLimestone/ evaporites
Phyllite
Ca mg/L 0.12 19.2 3.31 0.10 0.44
Y pmol/L 7.07 17.9 51.7 2.03 6.49
La 3.60 9.25 9.16 1.54 4.76
Ce 7.88 27.8 16.6 2.51 8.39
Pr 0.79 2.60 2.09 0.30 1.35
Nd 2.35 7.81 7.68 0.79 3.65
Sm 0.42 13.7 12.8 0.39 0.96
Eu 0.08 2.80 1.71 0.08 0.20
Gd 0.40 1.21 2.37 0.34 0.75
Tb 0.08 0.18 0.39 0.03 0.13
Dy 0.50 1.01 2.53 0.24 0.60
Ho 0.10 0.19 0.52 0.03 0.17
Er 0.28 0.53 1.58 0.10 0.30
Yb 0.31 0.50 1.68 0.08 0.27
Lu 0.07 0.26
Monte Amiata Larderello-Travale

28
8. Conclusions
Rare earth elements (REE) and Y abundances in aqueous, low- to high-temperaturefluids cover 6 orders of magnitudes. REY abundance in the exploited CO2 richgeothermal liquids with pH values of about 6.5 (50°C) and well head temperaturesexceeding 190°C are below 1 pmol/kg, excepting La, Ce and Y. The REY abundancesin these waters originate from metamorphic rock sequences and are about two orders ofmagnitude lower than those reported for Icelandic circum-neutral (Aggarwal et al. 1996)water from basalts, or acidic waters from rhyolites of the Yellowstone National Park(Lewis et al. 1998) and Japanese crater lakes (Kikawada et al. 1993). REY areomnipresent in minerals and fluids. Considerable fractions of REY are hosted byaccessory minerals in rocks and sediments. Some of them are leachable especially byCO2 rich waters. Accessory minerals are typical for each type of sediment REY patternsof groundwaters differ from those of the aquifer rocks. REY patterns of groundwatersare characteristic for the types of rocks at least on a regional scale. Anomalousbehaviour of Ce, Eu, and Y are indicative for water-rock interaction processes.Anomalies inherited from source rocks can be distinguished from those acquired duringfluid migration. The absence of acquired anomalies indicate steady state conditions.REY patterns yield information on the source of geothermal fluids, temperature range(Eu), and redox values (Ce), intensity of adsorption during migration (Y). The strongrelation to Ca couples the distribution of Ca and REY in all kinds of processes such asfluid rock interaction, and scale formation. Only in vapours these elements aredecoupled. It has been found:• Evaporation and depressurisation during ascent is accompanied by little REY
fractionation enforced by coprecipitation of REY with carbonates.
• The fluids - scale formation distribution coefficients of REY scalefluid
app Kd at about
190°C are less than 1, but vary within 1 order of magnitude.• The REE abundance in the high-temperature fluid ranges from 0.01 to about 10
pmol/kg. The REY/Ca ratios of the HTF related to the corresponding ratios of thesource rocks yield distribution factors ranging from 0.01 to 0.1, independent onsource rock composition. REY are largely retained by alteration minerals in rocksand sorption on mineral surfaces.
• The partition factors defined by the abundance ratio in vapour and liquid are in therange of 0.05 to 0.4. These factors are higher than those of earth alkaline andalkaline elements.
Knowing REY partition coefficients with scales and Ca contents of the original fluid, itis possible to back-calculate the REY abundance under bottom hole conditions.The variability of Ca concentration in the well head water is dependent on the state ofequilibration with carbonate precipitation. Under optimal conditions four-fifth of theprimary Ca concentration in the original fluid is precipitated in boreholes at Kizildere.Together with calcite REY are coprecipitated. Thus, the REY abundance in the originalfluids is higher than determined in the well head fluids.

29
8. References
Aggarwal, J.K., Shabani, M.B., Palmer, M. and Ragnarsdottir, K.V. (1996):Determination of the rare earth elements in aqueous samples at sub-ppt levels byinductively coupled plasma mass spectrometry and flow injection ICPMS. Anal.Chem., 68, 4418-4423.
Anders E., Grevesse N. (1989) Abundance of elements: Meteoritic and solar. Geochim.Cosmochim. Acta 53, 197-214
Basharina, L.A. (1965) Gases of Kamchatka volcanoes. Bull. Vulkanol. 28, 95-105Batini, F., Bertini, G., Giannelli, G., Pandeli, E., Puxeddu, M. and Villa, I. (1985) Deep
structure, age and evolution of the Larderello-Travale geothermal field. InternationalSymposium on Geothermal Energy, Transactions, Geothermal Resources Council,Davies, USA 6, 253-259.
Bau M., Möller P., Dulski P. (1997) Yttrium and lanthanides in eastern Mediterraneanseawater and their fractionation during redox-cycling. Mar. Chem. 56, 123-131.
Bau, M. (1996) Controls on the fractionation of isovalent trace elements in magmaticand aqueous systems: Evidence from Y/Ho, Zr/Hf, and lanthanide tetrad effect.Contrib. Mineral. Petrol. 123, 323-333.
Bau, M. (1999) Scavenging of dissolved yttrium and rare earths by precipitating ironoxyhydroxides: Experimental evidence for Ce oxidation, Y-Ho fractionation, andlanthanide tetrad effect. Geochim. Cosmochim. Acta, 63, 67-77.
Bau, M. and Dulski, P. (1996): Anthropogenic origin of positive gadolinium anomaliesin river waters. Earth Planet. Sci. Lett., 143, 245-255.
Bau, M. and Dulski, P. (1999) Comparing yttrium and rare earths in hydrothermal fluidsfrom the Mid-Atlantic-Ridge: Implications for Y and REE fractionation during near-vent mixing and for the Y/Ho ratio of Proterozoic seawater. Chem. Geol. 155, 77-90
Bea, F., Pereira, M.D., Corretge, L.G. and Fershitater, G.B. (1994) Differentiation ofstrongly peraluminous, perphosporous granites: The Pedrobernardo pluton, CentralSpain. Geochim. Cosmochim. Acta 58, 2609-2627.
Bilal, B.A. (1991) Thermodynamic study of Eu3+/Eu2+ redox reaction in aqueoussolutions at elevated temperatures and pressures by means of cyclic voltametry. Z.Naturforsch. 46a, 1108-1116.
Coryell, C.D., Chase, J.W., and Winchester, J.W. (1963) A procedure for geochemicalinterpretation of terrestrial rare earth abundance patterns, J. Geophys. Res. 68, 559-566.
Dulski, P. (1994) Interferences of oxide, hydroxide and chloride analyte species in thedetermination of rare earth elements in geological samples by inductively coupledplasma-mass spectrometry. Fresenius´ J. Anal. Chem. 350, 194-203.
Francalanci, L., Innocenti, F., Manetti, P., Savascin, M.Y. (2000) Neogene alkalinevolcanism of the Afyon-Isparta area, Turkey: Petrogenesis and geodynamicimplications. J. Mineral. Petrol. 70, 285 – 312.
Gemmel, J.B. (1987) Geochemistry of metallic trace elements in fumarolic condensatesfrom Nicaraguan and Costa Rica volcanoes. J. Volcanol. Geotherm. Res. 33, 161-181.
30
Gianelli, G., Calore, C. (1996) Models for the origin of carbon dioxide in the Larderellogeothermal field. Bull. Soc. Geol. It. 115, 75-84
Haas, J. R., Shock, E.L. and Sassani, D.C. (1995) Rare earth elements in hydrothermalsystems, estimates of standard partial molal thermodynamic properties of aqueouscomplexes of the rare earth elements at high pressures and temperatures.- Geochim.et Cosmochim. Acta 59, 4329-4350.
Hannigan, R.E., Sholkovitz, E.R., 2001. The development of middle rare earth elementsin freshwaters: weathering of phosphate minerals. Chem. Geol. 175, 495-508.
Kawabe, I., Ohta, A., Miura, N. ( 1999) Distribution coefficients of REE between Feoxyhydroxide precipitates and NaCl solutions affected by REE-carbonatecomplexation. Geochem. J. 33, 181-197.
Kikawada, Y., Oi, T., Honda, T., Ossaka, T. and Kakihana, H. (1993): Lanthanoidabundances of acidic hot spring and crater lake waters in the Kusatsu-shiranevolcano region, Japan.- Geochem. J. 27, 19-33.
Lewis, A.J., Komninou, A., Yardley, B.W.D. and Palmer, M.R. (1998) Rare earthspeciation in geothermal fluids from Yellowstone National Park, Wyoming, USA.Geochim. Cosmochim. Acta 62, 657-663.
McLennan S.M. (1989) Rare earth elements in sedimentary rocks: Influence ofprovenance and sedimentary processes. In. B.R. Lippin and G.A. McKray (eds)Geochemistry and mineralogy of rare earth elements. Mineral. Soc. Amer. 169-200.
McLennan, S.M. (1989) Rare earth elements in sedimentary rocks: Influence ofprovenance and sedimentary processes. In: Lipin BR, McKay GA (eds)Geochemistry and mineralogy of rare earth elements. Mineral. Soc. Am. 21, 169-200
Middlesworth, P.E. and Wood, S.A. (1998) The aqueous geochemistry of the rare earthelements and yttrium. Part 7. REE, Th and U contents in thermal springs associatedwith the Idaho batholith. J. Appl. Geochem. 13, 861-884.
Möller P., Bau M. (1993) Rare earth patterns with positive cerium anomaly in alkalinewaters from Lake Van, Turkey. Earth Planet. Sci Lett. 117, 671-676.
Möller P., Dulski P., Gerstenberger H. (1998) Rare earth elements, yttrium and H, O, C,Sr, Nd and Pb isotope studies in mineral waters and corresponding rocks from NW-Bohemia, Czech Republic. Appl. Geochem. 13, 975-994.
Möller, P. (2000): Rare earth elements and yttrium as geochemical indicators of thesource of mineral and thermal waters. In I. Stober and K. Bucher (eds): Hydrology ofcrystalline rocks. Kluwer Acad. Press, 227-246.
Möller, P., Dulski, P., Morteani, G. (2003) Partitioning of rare earth elements, yttriumand selected major elements among source rocks, liquid and steam of the Larderello-Travale Geothermal Field (Tuscany, Central Italy) Geochim. Cosmochim. Acta 67171-183
Möller, P., Dulski, P., Savascin, Y. and Conrad, M. (subm.) Rare earth elements,yttrium and Pb isotope ratios in thermal spring- and well waters of West Anatolia,Turkey: A hydrochemical study of their origin. Chem. Geol.
Möller, P., Giese, U. (1997) Determination of easily accessible metal fractions in rocksby batch leaching with acid cation-exchange resin. Chem. Geol. 137, 41-55.
31
Möller, P., Rosenthal, E., Dulski, P., Geyer S., Guttman, Y. (2003) Rare earths andyttrium hydrostratigraphy along the Lake Kinneret – Dead Sea – Arava transformfault, Israel and adjoining territories. Appl. Geochem. 18, 1613-1628.
Möller, P., Stober, I., and Dulski, P. (1997) Seltenerdelement-, Yittrium-Gehalte undBleiisotope in Thermal- und Mineralwässern des Schwarzwaldes. Grundwasser 2,118-132.
Parkhurst, D.L. and Apello C.A.J. (1999) User’s guide to PHREEQC (version 2) – Acomputer program for speciation, batch-reaction, one-dimesional transport, andinverse geochemical calculations. US. Geol. Surv. Water-Resources investigationreport 99-2459.
Poliyachonok, O.G. (1972) The problems of energetic and stability of vaporizedhalegonides. PhD thesis, Faculty of Inorganic Chemistry Univ. Leningrad
Satman, A., Ugur, Z. and Onur, M. (1999) The effect of calcite deposition ongeothermal well inflow performance. Geotherm. 28:425-444
Shabani, M.B., Agaki, T. and Masuda, A. (1992) Preconcentration of trace rare- earthelements in seawater by complexation with bis(2-ethylhexyl) hydrogen phosphateand 2-ethylhexyl dihydrogen phosphate adsorbed on a C18 cartridge anddetermination by inductively coupled plasma mass spectrometry. Anal. Chem. 64,737-743.
Shannon, R.D. (1976) Revised ionic radii and systematic studies of interatomicdistances in halides and chalcogenides. Acta Crystallogr. A32:751-767
Shmulovich, K.I., Heinrich, W., Möller, P. and Dulski, P. (2002) Experimentaldetermination of REE fractionation between liquid and vapor in the systems NaCl-H2O and CaCl2-H2O up to 450°C. Contrib. Mineral. Petrol. 144, 257-273
Stoiber, R.E. and Rose, W.I. (1970) The geochemistry of Central American volcanicgas condensates. Geol. Soc. Am. Bull. 81, 2891-2912.
Sverjensky, D.A. (1984) Europium redox equilibria in aqueous solution. Earth PlanetSci. Lett. 67:70-78
Symonds, R.B., Reed, M.H. and Rose, W.I. (1992) Origin, speciation, and fluxes oftrace-element gases at Augustine volcano, Alaska: Insight into magma degassing andfumarolic processes. Geochim. Cosmochim. Acta 56, 833-657.
Symonds, R.B., Rose, W.I., Reed, M.H., Lichte, F.E. and Finnegan, D.L. (1987)Volatilization, transport and sublimation of metallic and non-metallic elements inhigh temperature gases at Mirapi Volcano, Indonesia. Geochim. Cosmochim. Acta51, 2083-2101.
Uematzu, M. and Franck, E.U. (1980) Static dielectric constant of water and steam. J.Phys. Chem. Ref. Data 9:1291-1306