Rapid SPF country assessments & SPF national dialogues Celine, Valerie, Ji Un (remote support from...
22
Rapid SPF country assessments & SPF national dialogues Celine, Valerie, Ji Un (remote support from Florence) Tuesday 16 November 2010
-
Upload
benjamin-lewis -
Category
Documents
-
view
215 -
download
1
Transcript of Rapid SPF country assessments & SPF national dialogues Celine, Valerie, Ji Un (remote support from...

Rapid SPF country assessments & SPF national
dialoguesCeline, Valerie, Ji Un
(remote support from Florence)
Tuesday 16 November 2010

Chronogram AWARENESS RAISING
NATIONAL SPF TASKFORCE, UN SPF TEAM SET UP
SP STOCKTACKING & MAPPINGPRELIMINARY ANALYSISPRIORITY AREAS FOR INTERVENTION
IDENTIFICATION OF POLICY OPTIONSDESIGN & COSTING
FISCAL SPACE ANALYSIS – LT FINANCIAL SUSTAINABILITYRECONSIDER DESIGN IN LIGHT OF FISCAL SPACE
LEGISLATION
IMPLEMENTATION
MONITORING, EVALUATION, COST-BENEFIT ANALYSIS, IMPACT
ASSESSMENT
TIM
E

What is the assessment?
SP STOCKTACKING & MAPPINGPRELIMINARY ANALYSISPRIORITY AREAS FOR INTERVENTION
INVENTORY & DESCRIPTION OF SPF components already in place
ANALYSIS OF THE SPFIdentify coverage gaps & other issues:1) Level/gaps of population coverage 2) Adequacy of the benefit to ensure
effective access3) Level and quality of services
available4) Management & Delivery issues,
coordination, M&E
PRIORITIES SETTINGHow to further build a SPF tailored to the needs and capacities of the country?-Implement new SPF components?-Scale up SPF schemes?-Improve delivery of existing SPF components?

Two outputs
THE NATIONAL DIALOGUE IS ENHANCED & COORDINATEDBetween national stakeholders (SPF task force) Between international stakeholders (UN SPF team & donors group)Between national & international stakeholders
A TECHNICAL ASSESSMENT REPORT IS DEVELOPED AND DISCUSSEDStocktaking of social protection schemes and programs Analysis of the schemesPotential priorities of Government actionState of the national dialogueList of potential follow-up activities
DIALOGUEDIALOGUE
REPORTREPORT

Main steps1. BEFORE STARTING: AGREEMENT, SOURCES & ACTORS
NATIONAL SPF TASK-FORCE & UN SPF TEAM
2. QUALITATIVE DESCRIPTION OF THE SP SITUATION
3. FINALIZATION / ADAPTATION OF METHODOLOGY & TOOLS3bis. QUANTITATIVE ANALYSIS OF THE SPF SITUATION
SOCIAL SECURITY EXPERTS OF GOVT & UN AGENCIES (+CONSULTANTS)
4. DISCUSION OF THE MAIN RESULTS OF THE ANALYSIS AND IDENTIFICATION OF POLICY PRIORITIES
5. IDENTIFICATION OF FOLLOW-UP ACTIVITIES
XX
XX
XX
XX
XX
DIALOGUEDIALOGUE
REPORTREPORT
TO
OL
TO
OL
SS

1. BEFORE STARTING CHECK LISTCHECK LIST
Have an agreement with the government for full collaborationIdentify & inform the key players who will be involved in conducting the SPF assessment
Government institutions, Academia, Statistical offices, UN agencies, Donors, Civil society organizations, NGOs, social partners, social security schemes, social protection programs …
Make sure that the social protection experts responsible to conduct the SPF country assessments understand well the methodology guidelines & tools (training !!!)
Identify & inform all valuable sources of information to be consulted with when conducting the assessment
Gather all existing reports, assessments and studies conducted by any of the above actors during the past 5 years
Social security inquiries, household surveys, poverty and social impact analysis, child poverty analysis, Country policy and institutional assessments etc

Background information which impacts on the design and implementation of social protection:
National Social Protection Strategies, and social security legal frameworks
2. QUALITATIVE DESCRIPTION CHECKLISTCHECKLIST
Total populationPopulation distribution (rural/urban, informal economy/formal sector …)GDP / capita and evolutionGini coefficient and its evolutionPoverty rates and evolutionPolitical organizationDecentralization
Description of social protection schemes (demand side) including challenges and coverage gaps
Description of social services (supply side)
ILO CHECKLIST (word doct)
SERVICE AVAILABILITY MAPPING (Health, Education, Nutrition)

Annex 1: STOCKTAKING OF EXISTING SCHEMES AND PROGRAMMES Detailed tables per program / scheme
Name of the programme / scheme:
Name of implementing organization (ministry, social security institution …):
Name of technical and financial partners (if applicable):
UN agencies, NGOs, World Bank, …
Type of organization Regional government, district government, central government, NGO, …
Starting date of the scheme / program:
Legislation #, Decree # (if any):
Source of funding Donor, national (taxes), contributions, …
If contributions: what is the level of contributions?
Amount, state currency, time unit, affiliation by individual/household?
Benefit provided:(May be a combination of one or more services and / or one or more transfers)
e.g. food vouchers, health insurance premium subsidy, conditional cash transfer etc.Indicate: in cash or in kind benefit (or both) and amount (cash value of in kind benefits if possible)
WORD DOCUMENT TO BE DISTRIBUTED
SERVICE AVAILABILITY MAPPING (Health) : tool to collect and present basic information on health services: health infrastructure, human resources and services offered

SERVICE AVAILABILITY MAPPING (Nutrition) from WFP: 3 ways to measure hunger:
Undernourished1)Food Balance Sheet: + Agricultural production: e.g. MT rice + maize + wheat + Imports - Exports - Consumption by population 2)Household budget survey: hhs Income budget survey, living standard measurement surveyUnderweight: (3) Anthropometric measurement, children 5 years of age, - Weight for Age, compared to reference standard, from Demographic Health Survey (DHS) Multiple Indicator Cluster Survey (MICS)
Undernourished vs UnderweightUndernourished rate is low but malnutrition rate in children remains high: - Lao PDR 19% undernourished vs 37 % underweight- Indonesia: 16% undernourished vs 28 % underweight - Cambodia 25 % undernourished vs 36 % underweight
From 2004-2005 surveys, Age class: 0-59 months


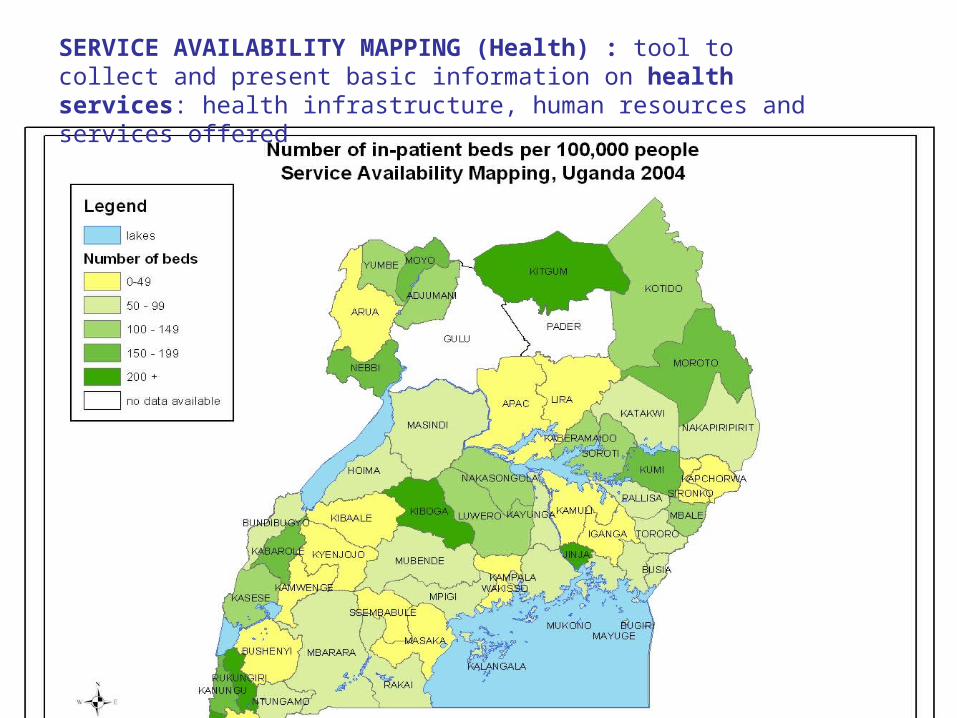
Choice of indicators to describe:•Level/gaps of population coverage •Adequacy of the benefit •Level and quality of services
How to calculate each indicator … problem of lack of information chose another indicator
How to interpret the results and present them in a synthetic way (“spider”) Have a clear picture of the situation …
Prepare the “political tool” to facilitate prioritization and decision taking
PPT, presentation of EXCEL SHEET & TOOLKIT
EXERCISE
EXERCISE (continued)CROSS CUTTING ISSUES:-Normalization-Benchmarking-Poverty line-Disaggregation
3. FINALIZATION OF METHODOLOGY& QUANTITATIVE ANALYSIS
MAIN STEPSMAIN STEPS

A first very general methodology was developed by the ILO and UN agencies part of the SPF inter-agency working group.
The ILO will support the conduct of “rapid assessments” in 4 countries in Asia (+ Cambodia).
We are therefore the precursors of the use of the Rapid assessment methodology. (only one example: China)
It is our responsibility (and freedom) to propose a methodology which is feasible and that will then be replicated in other countries. In addition we may raise some key issues that we will report next week to the SPF inter-agency working group (meeting in Geneva).
3. FINALIZATION OF METHODOLOGY& QUANTITATIVE ANALYSIS
BE CREATIVE!BE CREATIVE!
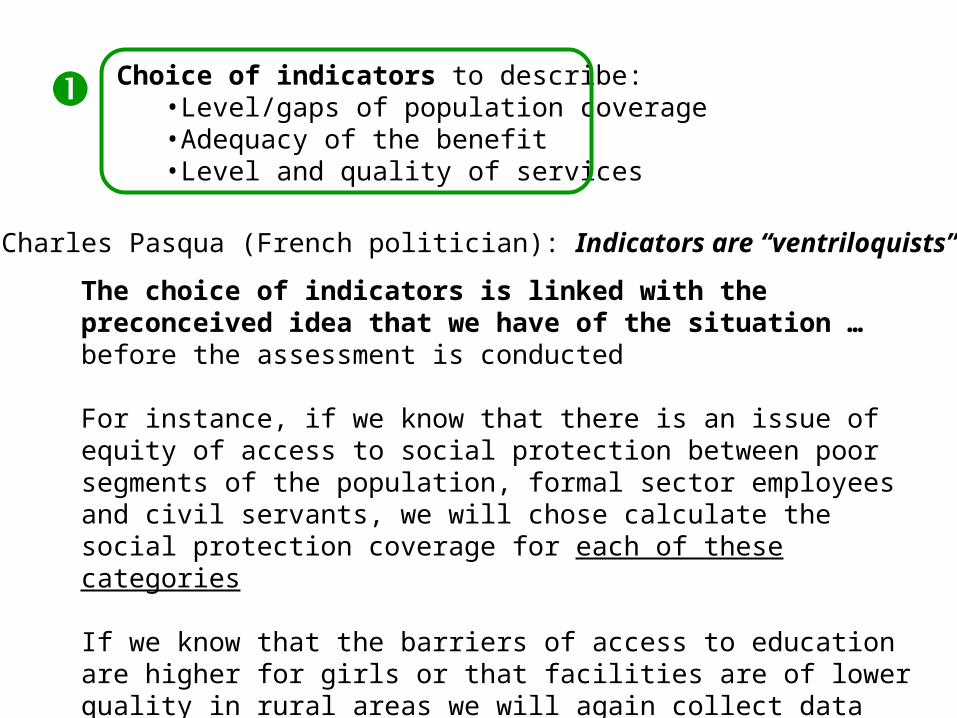
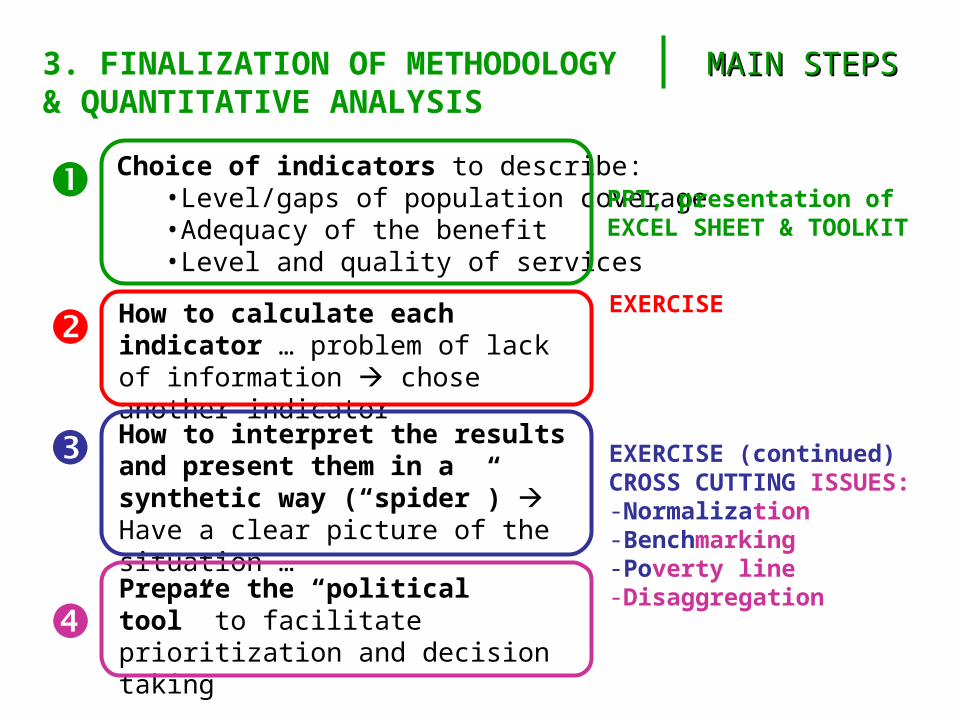
Choice of indicators to describe:•Level/gaps of population coverage •Adequacy of the benefit •Level and quality of services
Charles Pasqua (French politician): Indicators are “ventriloquists”
The choice of indicators is linked with the preconceived idea that we have of the situation … before the assessment is conducted
For instance, if we know that there is an issue of equity of access to social protection between poor segments of the population, formal sector employees and civil servants, we will chose calculate the social protection coverage for each of these categories
If we know that the barriers of access to education are higher for girls or that facilities are of lower quality in rural areas we will again collect data for girls and boys, or rural/urban areas separately in order to be able to calculate the indicators for these different categories…

Choice of indicators to describe:•Level/gaps of population coverage •Adequacy of the benefit •Level and quality of services
POLITICAL IDEAWhat we want to proveHow we want to influence the present situation
TECHNICAL WORK

Choice of indicators to describe:•Level/gaps of population coverage •Adequacy of the benefit •Level and quality of services
Field & target groups
Legal coverage
Effective coverage
Adequacy of the benefit
A1 A2 A3
Level and quality of services available
B1
HEALTH
EDUCATION & TRAINING
MINIMUM INCOME
NUTRITION
WATER SANITATION HOUSING
These indicators describe the social protection benefits (accessibility)
This column describes the supply of social services

Choice of indicators to describe:•Level/gaps of population coverage •Adequacy of the benefit •Level and quality of services
Legal coverage
Effective coverage
Adequacy of the benefit
A1 A2 A3
Level and quality of services available
B1
HEALTH Number of persons covered by law / Target population
Number of beneficiaries / Target population
???
Out of pocket payment as a percentage of total health expenditure
One optionMany other indicatorsNeed for normalization!?!?!Be careful with definitions of indicators
Births attended by skilled health staff (%) Number of medical doctors (physicians) per 10 000 population

Choice of indicators to describe:•Level/gaps of population coverage •Adequacy of the benefit •Level and quality of services
EXCEL SHEET (Valerie)
TOOLKIT (Celine, UNICEF, UNESCO)

How to calculate each indicator … problem of lack of information chose another indicator
PRACTICAL EXERCISE: CALCULATION OF INDICATORS FOR HEALTH, EDUCATION, CASH TRANSFERS (Ji Un)
How to interpret the results and present them in a synthetic way (“spider”) Have a clear picture of the situation …

CROSS CUTTING ISSUES:-Normalization-Benchmarking-Poverty line-Disaggregation
How to interpret the results and present them in a synthetic way (“spider”) Have a clear picture of the situation …
Prepare the “political tool” to facilitate prioritization and decision taking
GROUP DISCUSSION ON CROSS CUTTING ISSUESThe need for normalizationThe choice of benchmarksDiscussion on poverty lineDisaggregation(Celine)

As you understood the rapid assessment can be used in different country situations, with or without SPF componentsHow will you use the country assessment methodology in your country?
FILLING THE NATIONAL ROAD MAPContext (homework)
Rapid assessment
1. What we need to know about your country that has a impact on the design and implementation of the social protection floor
2. National Social Protection Strategy, Social security legal framework (law & regulation …)
3. Main schemes and progress made in terms of coverage (per contingency and per target group)
4. Promotion of the SPF concept and inclusion (to date) of the SPF in the National Social Protection Strategy
5. Main challenges in developing and implementing a national social protection strategy
Additional question: what can you learn from other countries?