RAPID SPECIATION FOLLOWING RECENT HOST SHIFTS … · 2014-10-13 · RAPID SPECIATION FOLLOWING...
19
ORIGINAL ARTICLE doi:10.1111/j.1558-5646.2008.00390.x RAPID SPECIATION FOLLOWING RECENT HOST SHIFTS IN THE PLANT PATHOGENIC FUNGUS RHYNCHOSPORIUM Pascal L. Zaffarano, 1,2,3 Bruce A. McDonald, 1 and Celeste C. Linde 4 1 Plant Pathology, Institute of Integrative Biology, ETH-Zurich, LFW, CH-8092 Z¨ urich, Switzerland 2 E-mail: [email protected] 4 School of Botany and Zoology, Building 116, Daley Rd, Australian National University, Canberra ACT 0200, Australia Received July 6, 2007 Accepted March 11, 2008 Agriculture played a significant role in increasing the number of pathogen species and in expanding their geographic range during the last 10,000 years. We tested the hypothesis that a fungal pathogen of cereals and grasses emerged at the time of domestication of cereals in the Fertile Crescent and subsequently speciated after adaptation to its hosts. Rhynchosporium secalis, originally described from rye, causes an important disease on barley called scald, although it also infects other species of Hordeum and Agropyron. Phylogenetic analyses based on four DNA sequence loci identified three host-associated lineages that were confirmed by cross-pathogenicity tests. Bayesian analyses of divergence time suggested that the three lineages emerged between ∼1200 to 3600 years before present (B.P.) with a 95% highest posterior density ranging from 100 to 12,000 years B.P. depending on the implemented clock models. The coalescent inference of demographic history revealed a very recent population expansion for all three pathogens. We propose that Rhynchosporium on barley, rye, and Agropyron host species represent three cryptic pathogen species that underwent independent evolution and ecological divergence by host-specialization. We postulate that the recent emergence of these pathogens followed host shifts. The subsequent population expansions followed the expansion of the cultivated host populations and accompanying expansion of the weedy Agropyron spp. found in fields of cultivated cereals. Hence, agriculture played a major role in the emergence of the scald diseases, the adaptation of the pathogens to new hosts and their worldwide dissemination. KEY WORDS: Barley, coevolution, crop domestication, host shift, plant pathogens, TMRCA. Agriculture began with the domestication of the plants and ani- mals that enabled the rapid human population expansion of the last 10,000 years (Cavalli-Sforza et al. 1994; Diamond 1997). As agriculture spread, populations of pathogens on humans and their domesticated animals and plants expanded. Agriculture may also have contributed to the number of pathogen species and their current geographic ranges through the anthropogenic modifica- tion of the environment (Schrag and Wiener 1995; Kolar and Lodge 2001; Diamond 2002; Anderson et al. 2004; Armelagos and Harper 2005). The expansion of human pathogens follow- ing the shift of human societies to agriculture has been explained 3 Corresponding author. by the corresponding increase in human population density that allowed (1) the maintenance of stable pathogen populations, (2) the increase of interspecies transmission from domesticated ani- mals, and (3) the expansion of human populations into novel en- vironments and resulting exposure to novel pathogens (Diamond 2002; Armelagos and Harper 2005). A similar process affected the pathogens colonizing agricultural crops. The high host densities and genetic uniformity of host populations coupled with cultiva- tion practices and trade created more uniform environments that maintained stable pathogen populations and were conducive for disease development and transmission. The movement of domes- ticated plants and their respective pathogens into new areas could simultaneously introduce “domesticated” pathogens into new 1418 C 2008 The Author(s) . Journal compilation C 2008 The Society for the Study of Evolution. Evolution 62-6: 1418–1436
Transcript of RAPID SPECIATION FOLLOWING RECENT HOST SHIFTS … · 2014-10-13 · RAPID SPECIATION FOLLOWING...

ORIGINAL ARTICLE
doi:10.1111/j.1558-5646.2008.00390.x
RAPID SPECIATION FOLLOWING RECENT HOSTSHIFTS IN THE PLANT PATHOGENIC FUNGUSRHYNCHOSPORIUMPascal L. Zaffarano,1,2,3 Bruce A. McDonald,1 and Celeste C. Linde4
1Plant Pathology, Institute of Integrative Biology, ETH-Zurich, LFW, CH-8092 Zurich, Switzerland2E-mail: [email protected]
4School of Botany and Zoology, Building 116, Daley Rd, Australian National University, Canberra ACT 0200, Australia
Received July 6, 2007
Accepted March 11, 2008
Agriculture played a significant role in increasing the number of pathogen species and in expanding their geographic range during
the last 10,000 years. We tested the hypothesis that a fungal pathogen of cereals and grasses emerged at the time of domestication
of cereals in the Fertile Crescent and subsequently speciated after adaptation to its hosts. Rhynchosporium secalis, originally
described from rye, causes an important disease on barley called scald, although it also infects other species of Hordeum and
Agropyron. Phylogenetic analyses based on four DNA sequence loci identified three host-associated lineages that were confirmed
by cross-pathogenicity tests. Bayesian analyses of divergence time suggested that the three lineages emerged between ∼1200
to 3600 years before present (B.P.) with a 95% highest posterior density ranging from 100 to 12,000 years B.P. depending on
the implemented clock models. The coalescent inference of demographic history revealed a very recent population expansion
for all three pathogens. We propose that Rhynchosporium on barley, rye, and Agropyron host species represent three cryptic
pathogen species that underwent independent evolution and ecological divergence by host-specialization. We postulate that the
recent emergence of these pathogens followed host shifts. The subsequent population expansions followed the expansion of the
cultivated host populations and accompanying expansion of the weedy Agropyron spp. found in fields of cultivated cereals. Hence,
agriculture played a major role in the emergence of the scald diseases, the adaptation of the pathogens to new hosts and their
worldwide dissemination.
KEY WORDS: Barley, coevolution, crop domestication, host shift, plant pathogens, TMRCA.
Agriculture began with the domestication of the plants and ani-
mals that enabled the rapid human population expansion of the
last 10,000 years (Cavalli-Sforza et al. 1994; Diamond 1997).
As agriculture spread, populations of pathogens on humans and
their domesticated animals and plants expanded. Agriculture may
also have contributed to the number of pathogen species and their
current geographic ranges through the anthropogenic modifica-
tion of the environment (Schrag and Wiener 1995; Kolar and
Lodge 2001; Diamond 2002; Anderson et al. 2004; Armelagos
and Harper 2005). The expansion of human pathogens follow-
ing the shift of human societies to agriculture has been explained
3Corresponding author.
by the corresponding increase in human population density that
allowed (1) the maintenance of stable pathogen populations, (2)
the increase of interspecies transmission from domesticated ani-
mals, and (3) the expansion of human populations into novel en-
vironments and resulting exposure to novel pathogens (Diamond
2002; Armelagos and Harper 2005). A similar process affected the
pathogens colonizing agricultural crops. The high host densities
and genetic uniformity of host populations coupled with cultiva-
tion practices and trade created more uniform environments that
maintained stable pathogen populations and were conducive for
disease development and transmission. The movement of domes-
ticated plants and their respective pathogens into new areas could
simultaneously introduce “domesticated” pathogens into new
1418C© 2008 The Author(s) . Journal compilation C© 2008 The Society for the Study of Evolution.Evolution 62-6: 1418–1436
RECENT PATHOGEN ORIGINS
areas in which they could colonize “wild” hosts and expose the
domesticated crops to new pathogens that could shift from wild
to domesticated hosts. Anthropogenic influences on the environ-
ment such as intensification of crop production and global trade
or other factors such as climate change are thought to promote
the emergence of new plant diseases (Anderson et al. 2004; Slip-
pers et al. 2005; Woolhouse et al. 2005; Money 2007). However,
the history and the processes that led wild pathogens to become
domesticated and vice versa have been poorly studied.
Many human pathogens may have originated since the rise
of agriculture as a result of host shifts from domestic animals
(Pearce-Duvet 2006; Wolfe et al. 2007). Although this hypothesis
has been widely proposed for many human diseases, unequivo-
cal evidence based on phylogenetics and estimates of divergence
times are rarely presented (Pearce-Duvet 2006 for review). For the
tuberculosis bacterium Mycobacterium tuberculosis, tapeworms
of the genus Taenia, and the protozoan Plasmodium falciparum
causing falciparal malaria, there is evidence that their progenitors
predate the rise of agriculture and may have already been hu-
man pathogens before animal domestication (Pearce-Duvet 2006
for review). In a similar way, the progenitors of modern plant
pathogens may have been present already on the progenitors of
crop plants and diverged with them after domestication (Munkacsi
et al. 2007). Alternatively, domestication might have strongly in-
fluenced host shifts leading to the emergence of new diseases on
crops (Couch et al. 2005). Agricultural practices might have sub-
sequently favored host specialization, reproductive isolation, and
speciation of plant pathogens on new hosts (Hansen 1987; Kohn
2005). The role that agriculture has played in the emergence of
a plant disease can be evaluated by dating the divergence of the
causal agent. For the most important group of plant pathogens, the
fungi, few studies have attempted to date divergence from their
progenitors (Couch et al. 2005; Munkacsi et al. 2007; Stukenbrock
et al. 2007), mainly due to the lack of fossil records and large er-
rors associated with molecular clocks. In contrast, the evolutionary
history and time of domestication has been well studied for most
of the important staple crops infected by these fungal pathogens.
The origins of the fungal pathogens Mycosphaerella gramini-
cola causing septoria leaf blotch on wheat and Magnaporthe
oryzae causing rice blast coincided with the domestication of their
current hosts (Couch et al. 2005; Stukenbrock et al. 2007), start-
ing ∼10,000 years before present (B.P.) for wheat in the Fertile
Crescent (Flannery 1973; Lev-Yadun et al. 2000; Salamini et al.
2002) and ∼7000 years B.P. for rice in East Asia (Flannery 1973;
Crawford and Shen 1998; Higman and Lu 1998). Domestication,
agricultural practices, and trade strongly influenced the pathogen’s
evolution and the diseases they cause on these crops (Couch et al.
2005; Stukenbrock et al. 2007). We refer to this very recent origin
of the pathogens associated with the domestication of the host
as the “domestication hypothesis.” The domestication hypothesis
was not supported for fungal pathogens of the genera Ustilago and
Sporisorium causing smut on Poaceae such as maize, sorghum,
and sugarcane. Divergence time estimates for these species were
millions of years, indicating that speciation occurred long be-
fore their hosts were domesticated less than 10,000 years ago
(Munkacsi et al. 2007).
Rhynchosporium secalis (Oudem.) J.J. Davis. causes an im-
portant disease called scald on barley, rye, and other grasses.
Analyses of nucleotide sequences of NIP1, a gene encoding a
toxin involved in pathogenicity, indicated that R. secalis started
to colonize barley ∼5000–7500 years after the domestication of
barley (Brunner et al. 2007) that occurred ∼10,000 B.P. (Badr
et al. 2000). This led to the hypothesis that domestication and
agricultural practices affected the emergence and global spread of
this barley pathogen. In this study we investigate how agriculture
shaped the demography of the pathogen through time and deter-
mine whether the emergence of the pathogen fits the domestication
hypothesis. The evolutionary history of R. secalis was investigated
using nucleotide sequences of several housekeeping genes not in-
volved in pathogenicity, in contrast to NIP1. We included 316
isolates from barley, rye, and uncultivated grasses from different
continents. Population genetic analysis, multiple gene genealo-
gies, coalescent-based approaches, and analyses of pathogenicity
were combined to determine if cryptic species exist on cultivated
and wild hosts of the pathogen. We then determined whether the
fungal populations on uncultivated grasses were ancestral to pop-
ulations on cereal hosts or originated from the same or different
ancestors. Divergence time between and within host-associated
populations was estimated and the demographic history of the
pathogen reconstructed. We present evidence that agriculture has
driven the evolution of R. secalis since the Neolithic through a
host shift from wild grasses to cultivated barley, falsifying the
domestication hypothesis for this plant pathogen.
Material and MethodsFUNGAL ISOLATES
Isolates of R. secalis from nine different hosts including culti-
vated barley (Hordeum vulgare), rye (Secale cereale) and triticale
(× Triticosecale Wittmack), as well as six wild grasses; Agropy-
ron caninum, Agropyron repens, Bromus diandrus, Hordeum lep-
orinum, Hordeum murinum and Hordeum spontaneum, were in-
cluded in this study. Isolates of Rhynchosporium orthosporum (the
only other described Rhynchosporium species) infecting Dactylis
glomerata were included as outgroup. The R. secalis isolates orig-
inated from 21 countries representing five continents. Many of
these isolates were representatives of a collection of R. secalis that
was characterized previously (McDermott et al. 1989; McDonald
et al. 1999; Salamati et al. 2000; Linde et al. 2003; Zaffarano
et al. 2006). Detailed descriptions of the isolates are found in
Table 1. Each isolate had a unique multilocus genotype based on
EVOLUTION JUNE 2008 1419

PASCAL L. ZAFFARANO ET AL.
Table 1. Origin of the Rhynchosporium isolates used in the study.
Host Geographic No. of Previous publication or source andorigin isolates year of collection (in parentheses)
Agropyron caninum Switzerland 1 C.C. Linde (2002)Agropyron repens Switzerland 50 P. L. Zaffarano, M. Zala, C.C. Linde (2004–2005)Barley Australia 7 McDonald et al. (1999)Barley Azerbaijan 2 A. Yahyaoui (2003)Barley Ethiopia 13 A. Yahyaoui (2003), Zaffarano et al. (2006)Barley Eritrea 6 A. Yahyaoui (2003)Barley Finland 8 Salamati et al. (2000)Barley France 5 Zaffarano et al. (2006)Barley Germany 7 Zaffarano et al. (2006)Barley Jordan 4 Zaffarano et al. (2006)Barley Kyrgistan 2 A. Yahyaoui (2003)Barley New Zealand 8 M. Cromey (2004)Barley Norway 16 Salamati et al. (2000)Barley South Africa 3 Linde et al. (2003)Barley Sweden 1 S. Salamati (1996)Barley Switzerland 45 Linde et al. (2003)Barley Syria 5 Linde et al. (2003)Barley Tunisia 3 A. Yahyaoui (2003)Barley Turkey 2 Zaffarano et al. (2006)Barley United Kingdom 3 Zaffarano et al. (2006)Barley USA 6 McDermott et al. (1989)Bromus diandrus Australia 2 McDonald et al. (1999)Dactylis glomerata Italy 7 C.C. Linde (2004)Dactylis glomerata Switzerland 6 P. L. Zaffarano, M. Zala, C.C. Linde (2004–2005)Hordeum leporinum Australia 18 McDonald et al. (1999)Hordeum murinum Switzerland 4 C.C. Linde, P. L. Zaffarano (2004)Hordeum murinum USA 3 C.C. Linde (2003)Hordeum spontaneum Syria 5 M. Abang (2003)Rye Russia 25 L. Lebedeva (2003)Rye Switzerland 27 C.C. Linde (2002), Zaffarano et al. (2006)Triticale Switzerland 6 C.C. Linde (2002)Triticale France 16 A. Bouguennec, L. Jestin (2002)
Total 316
RFLP loci, RAPD fingerprints, mating types (Linde et al. 2003;
Zaffarano et al. 2006), and microsatellites (Linde et al. 2005).
DNA EXTRACTION, AMPLIFICATION, AND
SEQUENCING
Isolation and culturing of fungal isolates were as described in
McDonald et al. (1999). DNA was extracted from lyophilized tis-
sue with either the method described in McDonald et al. (1999)
or the DNeasy Plant Mini DNA extraction kit (Qiagen GmbH,
Hilden, Germany) according to the manufacturer’s instructions.
Four nuclear DNA loci were analyzed. Sequences of the ITS
region (ITS1, 5.8S rRNA gene, ITS2) were obtained by PCR
amplification of genomic DNA of isolates using the primers
ITS4 and ITS5 (White et al. 1990). The translation elonga-
tion factor 1 alpha (EF-1�) was amplified with primers EF1-
728F and EF1-986R (Carbone and Kohn 1999). Portions of �-
tubulin were amplified in three steps. The first primer set used
was ATUB-25F (5′-GAGAAGCTATTAGCATCAACG-3′) and
ATUB-649R (5′-CTCCTTTCCAACAGTGTAGTGAC-3′), the
second ATUB-540F (5′-TCCCTAGAACCATCTACTGCG-3′)and ATUB-1206R (5′-CTTTGGCGGCAGACAACTG-3′), and
the third ATUB-1103F (5′-ACAGTTGTCTCCTCCATTACCG-
3′) and ATUB-1603R (5′-TGGACGAAGGCACGCTTAGAG-
3′). Part of the �-tubulin gene was amplified with the
primers BTUB-21F (5′-ATGCGTGAAATCGTACGTCAC-3′)and BTUB-615R (5′-TGACCGAAAGGACCAGCACG-3′). PCR
reactions were carried out in 20 �l volumes containing 2 �l 10×PCR buffer, 0.1 mM of each dNTP, 0.5 �M of each primer,
0.5 U of Taq polymerase (New England BioLabs, Allschwil,
Switzerland), and 5 �l of genomic DNA (5–20 ng final DNA
1420 EVOLUTION JUNE 2008

RECENT PATHOGEN ORIGINS
concentration). PCR conditions for ITS included a denaturing
step at 96◦C for 2 min, followed by 35 cycles at 96◦C for 1
min, 55◦C for 1 min, and 72◦C for 1 min. Finally, a 5-min
PCR extension was carried out at 72◦C. PCR amplifications for
the other three genes were the same as for ITS except that an-
nealing cycles were carried out at 50◦C for EF-1�, at 56◦C for
�-tubulin and at 65◦C for �-tubulin. For the R. orthosporum
isolates the annealing temperature had to be lowered to 53◦C to
amplify �-tubulin and �-tubulin.
Amplification products were electrophoresed on 1% agarose
gels to verify the amplification of a single fragment of the appro-
priate length. Amplified products were purified using a Millipore
multiscreen PCR plate (MANU 030 PCR) following the manufac-
turer’s instructions. The purified PCR products were resuspended
in 20 �l of water and sequenced bidirectionally with ABI PRISM
BigDye Terminator v3.0 and 3.1 ready reaction cycle sequencing
kit (Applied Biosystems, Foster City, CA). The sequencing reac-
tion was conducted in a final volume of 10 �l containing 0.4 �l
ready reaction mix, 1.6 �l 5× reaction buffer (400 mM Tris-HCL,
pH 9.0, 10 mM MgCl2), 1 �M primer, and 5 �l of the purified
PCR product. The DNA samples were sequenced with an ABI-
3100 automated sequencer.
PHYLOGENETIC ANALYSES
DNA sequences were aligned and edited manually with Se-
quencher 4.5 (Gene Codes Corporation, Ann Arbor, MI). Iso-
lates were assigned to haplotypes, that is, to unique DNA
sequences at each sequence locus. Haplotypes and their frequen-
cies were obtained with the program MAP (Aylor et al. 2006)
and SITES version 1.1 (Hey and Wakeley 1997) by recoding
insertions or deletions (indels) and removing infinite site vi-
olations, as implemented in the SNAP Workbench (Price and
Carbone 2005). Redundant sequences were removed from the
datasets by choosing only one individual for each sequence
haplotype.
Two tree-building methods were used, namely maximum par-
simony (MP) and Bayesian maximum likelihood (BML), which
were performed in PAUP∗ version 4.0b10 (Swofford 2002) and
MrBayes 3.0b4 (Ronquist and Huelsenbeck 2003), respectively.
The program Modeltest 3.7 (Posada and Crandall 1998) was used
to assess which model of nucleotide substitution best fit the data
of each locus for BML under the Akaike information criterion
(AIC). The trees were rooted with sequences from the only other
described Rhynchosporium species, R. orthosporum. For MP anal-
ysis, gaps were treated as fifth character states in heuristic searches
that were conducted following 100 replicates of random step-
wise addition and tree bisection-reconnection (TBR) for branch-
swapping. Branch support for all parsimony analyses was esti-
mated by performing 1000 bootstrap replicates with a heuris-
tic search consisting of 100 random-addition replicates for each
bootstrap replicate. All characters were equally weighted and un-
ordered.
Combining several independent loci can increase the accu-
racy and confidence of phylogenetic inference (Pamilo and Nei
1988; Takahata 1989; Rosenberg 2002). To test whether the data
of individual loci might be combined, that is, whether the gene
genealogies from the four loci were significantly different from
each other, the partition homogeneity test (PHT) (Farris et al.
1995) was used. The PHT used only informative characters and
100 replicates of simple stepwise-addition MP heuristic searches
(TBR; maxtrees = 500). However, methods to detect conflicts
among data partitions, such as the incongruence length difference
(ILD) test (implemented as the PHT in PAUP) could be poor indi-
cators of dataset combinability (e.g., Cunningham 1997; Dolphin
et al. 2000; Barker and Lutzoni 2002; Darlu and Lecointre 2002;
Dowton and Austin 2002). Therefore, congruence between gene
phylogenies was also estimated by visual inspection of topologies
and statistical support (Mason-Gamer and Kellogg 1996; Wiens
1998).
For BML analyses the optimal model selected under the AIC
implemented in Modeltest was specified as the prior for each
gene. MrBayes allowed different data partitions to be modeled
separately for the combined dataset (Ronquist and Huelsenbeck
2003). One cold and three incrementally heated Markov chains
were run simultaneously starting from random trees for 5,000,000
generations for the single loci, and for 10,000,000 generations for
the combined dataset. Trees were sampled every 500th generation
for the single loci and every 1000th generation for the combined
dataset, resulting in 10,000 trees of which 1000 were discarded
as the “burn-in.” At least two independent runs were performed
to ensure analyses were not converging on a local optimum. The
replicate runs were compared to confirm that the analyses reached
stationarity at similar likelihood scores by plotting the −lnL per
generation in the program Tracer 1.3 (Rambaut and Drummond
2003). After confirming that the replicate runs reached stationarity
at similar likelihood scores and that the topologies were similar,
the remaining trees of the separate runs were pooled together and
used for calculating the posterior probabilities in the 50% majority
rule consensus tree in PAUP.
COALESCENT ANALYSES
The ancestral history of the host-associated populations of the
fungus was inferred by coalescent-based gene genealogies. The
analysis was conducted in the SNAP Workbench (Price and Car-
bone 2005) that contains a series of programs described below
to reconstruct the history of haplotypes. Guidelines in Carbone
et el. (2004) were followed for each analysis. Sequences were
collapsed into unique haplotypes using SNAP MAP (Aylor et al.
2006) and SITES version 1.1 (Hey and Wakeley 1997) by recoding
indels and removing infinite site violations. Prior to the application
EVOLUTION JUNE 2008 1421
PASCAL L. ZAFFARANO ET AL.
of coalescent methods, the absence of selection and recombina-
tion had to be verified. Therefore, deviation from neutrality was
measured by Fu and Li’s D∗ and Fu and Li’s F∗ (Fu and Li 1993)
and Tajima’s D (Tajima 1989) with DnaSP version 4.0 (Rozas
et al. 2003). Incompatibility matrices were generated to detect in-
compatibility among segregating sites in SNAP Clade (Markwordt
et al. 2004) and SNAP Matrix (Markwordt et al. 2004).
Migration matrices indicating the number and direction of
migrants exchanged between populations were constructed in
the program MIGRATE (Beerli and Felsenstein 1999, 2001).
MIGRATE estimates the product of effective population size and
mutation rate, and the amount and direction of gene flow between
the host-associated populations. The analysis included 20 short
chains with 500 sampled genealogies each and 5 long chains with
5000 sampled genealogies each. Chain heating was adaptive, with
four different temperatures. The migration matrices were used as
starting backward migration matrices for coalescent analysis with
population subdivision in the program GENETREE version 9.0
(Griffiths and Tavare 1994; Bahlo and Griffiths 2000) as incor-
porated in the SNAP workbench. GENETREE reconstructs the
ancestral history of haplotypes showing a coalescence tree with
relative time of divergence between host-associated pathogen pop-
ulations. The genealogy with the highest root probability was de-
termined by performing 500,000 simulations of the coalescent
with five different starting random number seeds. From these runs,
the tree with the highest root probability was selected showing
the distribution of mutations along the branches of the pathogen
populations.
DIVERGENCE TIME ESTIMATES AND DEMOGRAPHIC
ANALYSIS
The Bayesian Markov Chain Monte Carlo (MCMC) method im-
plemented in the program BEAST version 1.4.1 (Drummond and
Rambaut 2005) was used to estimate time of divergence between
host-associated populations of the pathogen, that is the time to
the most recent common ancestor (TMRCA), and past popula-
tion dynamics. Kasuga et al. (2002) proposed a range of mutation
rates for the Eurotiomycetes, a monophyletic class of Ascomycota.
We applied these mutation rates representing the lower end, the
mean, and the upper end of the range, that is, 0.9 × 10⁻⁹, 8.8 ×10⁻⁹, and 16.7 × 10⁻⁹ mutations per site and per year. The anal-
ysis was conducted with the multilocus dataset as the program
allows partitioning the combined datasets. Different evolutionary
substitution models can be included for each partition and ap-
plied simultaneously. The substitution models specified for each
gene were the same as obtained under the AIC in Modeltest. Esti-
mates assuming a strict molecular clock were compared to those
performed using the relaxed molecular clock option with uncor-
related, branch-specific rates following lognormal or exponen-
tial distribution (Drummond et al. 2006). BEAST also infers the
demographic history of lineages in a Bayesian coalescent-based
framework. The Bayesian skyline plot (BSP) (Drummond et al.
2005) was specified as demographic model because it can fit a
wide range of demographic scenarios. The MCMC analyses were
first performed with short runs with chain length of 106 to op-
timize the scale factors of the priors. The analysis was then run
for 108 generations sampling every 1000th iteration after an ini-
tial burn-in of 10%. The performance of the MCMC process was
checked for stationarity and large effective sample sizes in Tracer.
The mean and corresponding credibility intervals of the estimated
parameters and the BSP were depicted using Tracer.
PATHOGENICITY ASSAYS
To determine whether Rhynchosporium isolates from each phy-
logenetic lineage (see Results) could infect hosts of other phy-
logenetic lineages, barley, rye, and H. murinum were inoculated
with representative isolates from each lineage originating from the
same geographical region, in this case Switzerland. Pathogenic-
ity is here defined as the ability of a fungal isolate to infect a
host species. In this case pathogenicity was used as a phenotypic
marker to assess species boundaries and host specialization.
The isolates for the pathogenicity tests were a representa-
tive sample including different Swiss locations, collection years,
and genotypes. Two trials were undertaken. In the first trial,
only isolates from cultivated grasses were used. The 16 selected
isolates originated from fields planted to barley, rye, and triti-
cale. The seven barley-infecting isolates 99CH2A2B, 99CH5E4A,
99CH5E6B, 99CH5H10A, 99CH6C3A, 99CH6E3B, and 00A1B,
originated from collections of 1999 and 2000 that were de-
scribed previously (Linde et al. 2003; Zaffarano et al. 2006).
Four of the eight rye-infecting isolates (99CH1E7A, 99CH1B8,
99CH1H10B, and 99CH1D4A) were collected in 1999 as de-
scribed earlier (Zaffarano et al. 2006). The remaining isolates
(02CH4-14a.1, 02CH4-9a.2, 02CH4-5a.1, and 02CH4-6a.1) were
collected in 2002 from a rye field near Maur in the canton of
Zurich, whereas the isolate 02CH2-3c.1 was collected from triti-
cale at the experimental station of Changins in the canton of Vaud
in 2002.
To produce inoculum, all isolates were grown from sil-
ica gel storage onto Difco lima bean agar (Becton, Dickinson
and Co., Sparks, MD) amended with kanamycin (50 mg/L).
Plates were incubated for 14 days at 18◦C in the dark. Colonies
were then transferred to fresh lima bean agar plates and in-
cubated under the same conditions as above. After 14 days
spores were harvested by adding 2 mL of sterile water to each
plate and scraping spores off the agar surface with a steril-
ized microscope slide. A portion of the spores from each iso-
late was transferred into 1.8 mL CryoTubes (Nunc Cryoline Sys-
tems, Roskilde, Denmark) containing anhydrous silica gel (Fluka
Chemie GmbH, Steinheim, Germany) for long-term storage at
1422 EVOLUTION JUNE 2008

RECENT PATHOGEN ORIGINS
−80◦C. The rest of the spore suspension was spread across
the surface of 20–50 fresh lima bean agar plates. The plates
were incubated at 18◦C and after 14 days spores were harvested
as above and filtered through two layers of cheesecloth. Spore
concentrations were adjusted to 2 × 10⁵ spores/mL with a hema-
cytometer (Thoma cell, 0.1-mm depth, 0.0025 mm2) in a spore
solution of 150 mL per isolate.
Inoculations were conducted on four barley (Chariot, Julia,
Pasadena, and Plaisant) and four rye varieties (Avanti, Born,
Danko, and Picasso). These varieties ranged from moderately to
highly susceptible to scald. All host varieties were grown in pots
with a diameter of 13 cm filled with soil mixture Rasenerde Top
Dressing (containing sand, compost, perlite, white peat, and min-
eral fertilizer; Ricoter AG, Aarberg, Switzerland). Seeds of each
host variety were sown separately in pots and thinned to five plants
per pot.
The plants were grown in a single greenhouse chamber with
a photoperiod of 14 h-day at 18◦C and a 10 h-night period at 15◦C.
Relative humidity was set at 60%. The seedlings were inoculated
when they had two to three fully emerged leaves. Two drops of
Tween 20 (Sigma-Aldrich, Buchs, Switzerland) were added to 150
mL of spore suspension. For each isolate, three pots of each variety
were inoculated. For inoculation, all 24 pots were placed onto a
rotating table in a semiautomatic inoculation chamber and the
leaves were sprayed with a fine mist until run-off. An additional
set of 96 pots, that is, 6 pots per each inoculated isolate, containing
all host varieties, was sprayed with sterilized water amended with
two drops of Tween 20 as a negative control. The inoculated pots
were kept for 48 h at a relative humidity of 90–100%.
After 14 days disease was assessed on the second and third
leaves following the scale described in Ali and Boyd (1973). The
ratings were 0 = no visible lesion or symptoms, 1 = small lesions
at the tip or on the margin and base of the leaf blades, 2 = nar-
row band of lesions extending down the length of the leaf blade,
3 = broad well-developed lesions covering large areas across leaf
blade, 4 = leaves wilted, no evidence of discrete lesions. Reac-
tion 0 was considered highly resistant, reaction 1 was resistant,
reaction 2 was intermediate, and reactions 3 and 4 susceptible
and highly susceptible, respectively. This inoculation trial was re-
peated one month later using a higher inoculum concentration of
106 spores/mL.
In the second trial, Rhynchosporium isolates from uncul-
tivated grasses were included for pathogenicity testing. Six
Rhynchosporium isolates from A. repens (Danikon-1.1.1, WPK-
5b.1A3.1, K2B-2C1.1, Brutten-3.1.2, RAC-2-A9.1, and SEG
A3.2.1.1) and two from H. murinum (WPK-2.1 and WPK-A8.4)
that were inoculated onto two of the previously used barley (Char-
iot and Pasadena) and rye varieties (Danko and Picasso), as well as
on H. murinum. The isolates from A. repens were collected at the
borders of cereal fields in the canton of Zurich and at the experi-
mental station of Changins in the canton of Vaude in Switzerland,
except SEG-A3.2.1.1 which was collected from A. repens plants
bordering the road on the Sattelegg pass in canton Schwyz in
Switzerland. The isolates from H. murinum were collected from
weedy plants growing alongside streets in Zurich. Seed was har-
vested from these plants for inoculation trials. Two previously used
isolates, one each from barley (00CHA1B) and rye (99CH1E7a),
were included as control isolates. The barley and rye varieties as
well as H. murinum were represented by three pots each with five
seedlings per pot. In total 10 inoculations were applied for a total
of 150 pots. The negative control, sprayed with water and Tween,
was represented by 60 pots, that is, six pots containing all host va-
rieties and H. murinum per inoculated isolate. The second trial was
repeated once. Procedures for the isolate culturing, inoculation,
and disease assessment were the same as for the first inoculation
trial, except that the spore concentration was 106 spores/mL for
both the first experiment and the repetition.
ResultsNUCLEOTIDE SEQUENCES AND PHYLOGENETIC
ANALYSES
The ITS region (848 bp), portions of the �-tubulin (1609 bp), �-
tubulin (609 bp), and the EF-1� (365 bp) (sizes including gaps)
were amplified for all isolates. Summaries of the phylogenetic in-
formation for the four loci are shown in Table 2. There were 24, 20,
15, and 11 parsimony informative characters, respectively for each
locus (Table 2). Haplotypes representing one of each set of iden-
tical sequences were used for analysis. The haplotypes defined by
the variable sites of the datasets are reported in the online Supple-
mentary Table S1. Haplotypes were shared only between either
populations from rye and triticale, or between populations from
barley, H. leporinum, H. murinum, and H. spontaneum (Hordeum
spp.) and B. diandrus for all loci. The single isolate from A. can-
inum always grouped with the haplotypes formed by the A. repens
isolates. Haplotype H1 occurred most frequently for each respec-
tive locus, and was represented in most of the sampled geograph-
ical populations originating from barley, as well as in Hordeum
spp. and B. diandrus. Conversely, many haplotypes were unique
to one population or host species (see online Supplementary
Table S1).
The MP and BML analyses were used to infer genealogies
of the haplotypes from the four single-locus alignments (Table 2,
Fig. 1, and see online Supplementary Figs. S1–S4). BML analysis
of the four loci followed an optimal evolutionary model selected
under the AIC in Modeltest. These models were different for each
gene (Table 2). All repeated runs of the BML analyses converged
on the same topology. The topological patterns were consistent
across the MP and BML estimations of the phylogeny for all loci
except for minor differences as described below.
EVOLUTION JUNE 2008 1423
PASCAL L. ZAFFARANO ET AL.
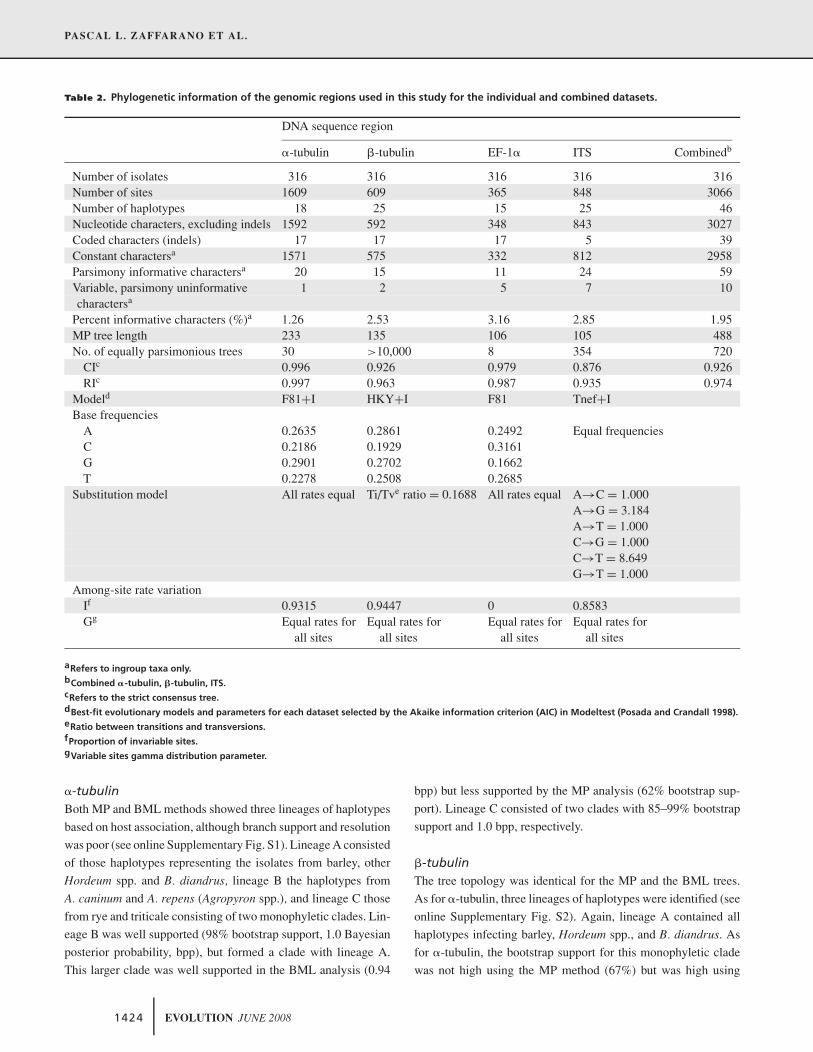
Table 2. Phylogenetic information of the genomic regions used in this study for the individual and combined datasets.
DNA sequence region
�-tubulin �-tubulin EF-1� ITS Combinedb
Number of isolates 316 316 316 316 316Number of sites 1609 609 365 848 3066Number of haplotypes 18 25 15 25 46Nucleotide characters, excluding indels 1592 592 348 843 3027Coded characters (indels) 17 17 17 5 39Constant charactersa 1571 575 332 812 2958Parsimony informative charactersa 20 15 11 24 59Variable, parsimony uninformative 1 2 5 7 10charactersa
Percent informative characters (%)a 1.26 2.53 3.16 2.85 1.95MP tree length 233 135 106 105 488No. of equally parsimonious trees 30 >10,000 8 354 720
CIc 0.996 0.926 0.979 0.876 0.926RIc 0.997 0.963 0.987 0.935 0.974
Modeld F81+I HKY+I F81 Tnef+IBase frequencies
A 0.2635 0.2861 0.2492 Equal frequenciesC 0.2186 0.1929 0.3161G 0.2901 0.2702 0.1662T 0.2278 0.2508 0.2685
Substitution model All rates equal Ti/Tve ratio = 0.1688 All rates equal A→C = 1.000A→G = 3.184A→T = 1.000C→G = 1.000C→T = 8.649G→T = 1.000
Among-site rate variationIf 0.9315 0.9447 0 0.8583Gg Equal rates for Equal rates for Equal rates for Equal rates for
all sites all sites all sites all sites
aRefers to ingroup taxa only.bCombined �-tubulin, �-tubulin, ITS.cRefers to the strict consensus tree.dBest-fit evolutionary models and parameters for each dataset selected by the Akaike information criterion (AIC) in Modeltest (Posada and Crandall 1998).eRatio between transitions and transversions.fProportion of invariable sites.gVariable sites gamma distribution parameter.
�-tubulinBoth MP and BML methods showed three lineages of haplotypes
based on host association, although branch support and resolution
was poor (see online Supplementary Fig. S1). Lineage A consisted
of those haplotypes representing the isolates from barley, other
Hordeum spp. and B. diandrus, lineage B the haplotypes from
A. caninum and A. repens (Agropyron spp.), and lineage C those
from rye and triticale consisting of two monophyletic clades. Lin-
eage B was well supported (98% bootstrap support, 1.0 Bayesian
posterior probability, bpp), but formed a clade with lineage A.
This larger clade was well supported in the BML analysis (0.94
bpp) but less supported by the MP analysis (62% bootstrap sup-
port). Lineage C consisted of two clades with 85–99% bootstrap
support and 1.0 bpp, respectively.
�-tubulinThe tree topology was identical for the MP and the BML trees.
As for �-tubulin, three lineages of haplotypes were identified (see
online Supplementary Fig. S2). Again, lineage A contained all
haplotypes infecting barley, Hordeum spp., and B. diandrus. As
for �-tubulin, the bootstrap support for this monophyletic clade
was not high using the MP method (67%) but was high using
1424 EVOLUTION JUNE 2008

RECENT PATHOGEN ORIGINS
Figure 1. Phylogeny inferred by maximum parsimony from the combined �-tubulin, �-tubulin, and ITS DNA sequence loci. The 50%
majority-rule consensus tree is shown. Bayesian maximum-likelihood analysis recovered the same topology. The numbers above branches
are bootstrap frequencies of 1000 replicates and those below are Bayesian posterior probabilities. Branch lengths are proportional to
the number of steps (character changes) along the branch. Labels on the phylogeny are: H1–H45 haplotypes obtained from 316 DNA
sequences of 3066 bp representing Rhynchosporium isolates from different hosts (Agropyron spp., barley, Bromus diandrus, Dactylis
glomerata, Hordeum spp., rye and triticale). Haplotypes H2–H4 representing Rhynchosporium orthosporum were used as outgroup.
EVOLUTION JUNE 2008 1425

PASCAL L. ZAFFARANO ET AL.
the BML method (0.97 bpp). The monophyletic lineage B in-
cluded haplotypes infecting Agropyron spp. (69% bootstrap
support, 1.0 bpp). Lineage C contained the haplotypes infect-
ing rye and triticale. This lineage could be distinguished from
lineages A and B, but resolution was poor and did not form a
monophyly.
EF-1�
Both MP and BML showed a tree topology consisting of host-
associated lineages A and B (see online Supplementary Fig. S3).
Resolution and branch support for the lineages were low (see
online Supplementary Fig. S3). Lineage A contained isolates in-
fecting barley, Hordeum spp., B. diandrus, rye, and triticale. The
support for this monophyletic lineage A was weak (bootstrap sup-
port 63% and 0.62 bpp).
ITSThe phylogeny of the ITS region (see online Supplementary Fig.
S4) showed the same host-associated lineages as �- and �-tubulin
for both the MP analysis and the BML analysis. However, the
rye- and triticale-infecting haplotypes(lineage C) formed a mono-
phyletic clade that was well supported (99% bootstrap support;
1.00 bpp). Similar tree topologies were obtained with MP and
BML. The BML analysis gave higher support, and in contrast to
the MP method, lineage C was placed into a larger clade with
lineage A. Furthermore, in the BML analysis not all haplotypes
from lineage B formed a unique monophyly.
Combined datasetPHTs were performed in pairwise comparisons and globally
to determine which datasets could be combined for phyloge-
netic analyses. The PHT of the full dataset, combining all four
loci, indicated that the datasets could not to be combined (P <
0.01). Although EF-1� had the highest percentage of informa-
tive characters (Table 2), these differences were mostly confined
to haplotypes associated with A. repens. When EF-1� was re-
moved from the dataset, the P-value increased to 0.18. The host-
associated haplotype distinctions were the same for all four in-
dividual loci (see online Supplementary Table S1). Therefore,
we believe that the short sequence length of the EF-1� gene
led to a low phylogenetic resolution detected by the PHT rather
than representing a different evolutionary history compared to
other genes. The P-value testing congruency between ITS and
�-tubulin was lower (0.35) than between ITS and �-tubulin
(P = 0.87). Compatibility between the �-tubulin and �-tubulin
datasets was low (P < 0.05), although the three sequence loci
could still be combined according to the PHT. The �-tubulin,
�-tubulin, and ITS datasets were combined despite the minor dif-
ferences in tree topologies because the PHT was not significant
and the associations between haplotypes and different hosts were
consistent.
The phylogeny of the combined �-tubulin, �-tubulin, and ITS
datasets resulted in three well-supported distinct monophyletic
lineages (Fig. 1) using both BML and MP analyses. Lineage A
consisted of haplotypes present on barley, Hordeum spp., and
B. diandrus. In contrast to the phylogenies of the single loci, this
lineage was well supported by the MP method (83% bootstrap
support) and by the BML analysis (1.0 bpp). Lineage B contained
all Agropyron spp. infecting haplotypes. Lineage C contained all
rye- and triticale-infecting haplotypes and was highly supported
(100% bootstrap support) in MP and BML trees (1.0 bpp). The
phylogenetic analyses thus support that R. secalis should be split
into three Rhynchosporium species, corresponding to isolates from
lineages A–C.
COALESCENT ANALYSES
Incompatible sites due to recombination or homoplasy were iden-
tified in the incompatibility matrix for all four loci and removed
from the datasets as follows: one site was removed for �-tubulin,
six sites for �-tubulin, two sites for EF-1�, and seven sites for ITS.
Both Fu and Li’s D∗ and F∗ tests, as well as Tajima’s D were not
significantly different from 0 (P > 0.10; see online Supplementary
Table S2). Therefore, the hypothesis of selective neutrality could
not be rejected for any of the four loci. The datasets from which
the incompatible segregating sites were removed were then used
for coalescent analysis. Independent estimates of gene flow for the
four single loci gave similar results (data not shown). Migration
matrices calculated by MIGRATE indicated low gene flow be-
tween the different Rhynchosporium host-associated populations
(i.e., Nm < 1) except between the populations on rye and triti-
cale (Nm = 1.46-7.85) and between populations on barley and
Hordeum spp. (Nm = 0.45-4.60).
Simulations in GENETREE provided coalescent-based ge-
nealogies for each locus showing the ancestral distribution of mu-
tations and coalescence events (Figures not shown). These results
were congruent with the phylogenetic trees inferred by MP and
BML. All four loci showed three distinct lineages as inferred by
the phylogenetic analysis. When included as an outgroup, the R.
orthosporum population branched at the deepest point of the ge-
nealogies for separate as well as combined sequence loci (Figures
not shown). All three lineages coalesced to a single common an-
cestor. To provide an enhanced resolution of the ancestral history
of these fungal populations, �-tubulin, �-tubulin, and ITS were
combined in another coalescent analysis. In this analysis, 26 in-
compatible sites had to be removed from the combined dataset
resulting in 27 haplotypes. The two distinct lineages A (on barley,
B. diandrus and Hordeum spp.), and B (on Agropyron spp.) were
derived from the same common ancestor (Fig. 2), with coales-
cence at a relative coalescent time of approximately 0.7. Most of
the mutations separating the three distinct lineages emerged re-
cently, that is, between the relative coalescent times of 0 to 0.2.
1426 EVOLUTION JUNE 2008

RECENT PATHOGEN ORIGINS
Figure 2. Coalescent-based gene genealogy of the combined �-tubulin, �-tubulin, and ITS DNA sequence loci showing the distribution
of mutations in Rhynchosporium populations on different hosts (barley; Hordeum spp. = H. leporinum, H. murinum, H. spontaneum; ∗ =
includes two isolates from Bromus diandrus; Agropyron spp. = Agropyron repens and Agropyron caninum; triticale, rye) that correspond
to the three phylogenetic lineages as shown in Figure 1. The numbers below the tree branches describe the different haplotypes and the
number of occurrences in total and on the different hosts. The temporal scale of divergence is given on the right. The scale is in coalescent
units of effective population size. The direction of the appearance of mutations and bifurcations is from the top (past) to the bottom
(present).
EVOLUTION JUNE 2008 1427

PASCAL L. ZAFFARANO ET AL.
DIVERGENCE TIME ESTIMATES AND DEMOGRAPHIC
ANALYSIS
The Bayesian MCMC sampling procedures implemented in
BEAST allowed estimating the posterior distribution of the TM-
RCA and effective population size through time. The analysis
included credibility intervals [highest posterior density (HPD)]
representing both phylogenetic and coalescent uncertainty. The
posterior mean estimates of the TMRCAs and corresponding
95% HPDs are shown in Table 3. Estimates assuming a strict
molecular clock were similar to those based on a relaxed clock
with exponential distribution. Under the relaxed clock model with
log-normal distribution the majority of the divergence time esti-
mates were higher. No fossil ages were available for R. secalis
to be specified as node priors to estimate the mutation rates for
the three loci used. To compensate, three mutation rates span-
ning the entire range of mutation rates suggested for other fungi
(Kasuga et al. 2002) were chosen in the analysis. The posterior
mean estimate for the TMRCAs and corresponding HPDs that
were obtained using these three mutation rates were combined
and averaged in the program Tracer. Thus, we here refer to the av-
eraged posterior mean estimates of the TMRCA and 95% HPDs.
Depending on the clock model implemented, the posterior mean
estimates of the TMRCA of all isolates, including R. orthosporum,
were between 14,443 to 35,199 years B.P. (95% HPD, 1246 to
101,891) (Table 3) suggesting an older split from the ancestor
of the lineages A–C. The posterior mean estimates of the TM-
RCA of all three lineages A–C were between 1281 to 3627 years
B.P. (95% HPD, 113 to 12,431). The diversification within the
three lineages began more recently and started during a similar
time frame for all three lineages with posterior means of the TM-
RCA between 459 and 1139 years B.P. (95% HPD, 21 to 3,853)
(Table 3 and Fig. 3).
The historical demographic reconstructions (BSP) shown in
Figure 4 depict similar demographic histories for all three muta-
tion rates and clock options used (data not shown). The population
size of the three lineages started to decline almost simultaneously
with the split of the three lineages ∼ 1200 to 3600 years ago (Fig.
4) until they reached a maximum decline between ∼ 250 and
500 years ago, followed by a rapid expansion that recovered the
prebottleneck population sizes (Fig. 4).
PATHOGENICITY ASSAYS
A total of 24 isolates from different hosts were inoculated onto
barley and rye cultivars, and a subset of these isolates was inocu-
lated onto H. murinum. Isolate 02CH2-3c.1 from triticale was able
to infect the four rye cultivars and isolates WPK-2.1 and WPK-
A8.4 from H. murinum were able to infect two barley cultivars in
addition to H. murinum plants. All other isolates infected only the
host from which they were originally isolated. Thus there was no
cross pathogenicity on hosts of isolates from different phyloge-
netic lineages. Due to difficulties in propagating A. repens plants,
this host could not be included in the trial as a positive control for
isolates from A. repens. Disease severity on infected plants ranged
from 1 to 4 based on the disease assessment scale of Ali and Boyd
(1973) (Table 4).
DiscussionIn a previous population study on R. secalis using RFLP markers,
high population subdivision and a low number of shared alleles
among barley- and rye-infecting populations were interpreted as
evidence for genetic isolation between the host populations de-
spite the geographical proximity of the two hosts in Switzerland
(Zaffarano et al. 2006). In this study additional isolates infect-
ing rye and other uncultivated grasses were included to further
investigate genetic isolation between host-associated populations
of the pathogen. Our analyses assigned R. secalis isolates to three
distinct lineages: Lineage A infecting cultivated barley, Hordeum
spp. and B. diandrus; Lineage B infecting rye and triticale, and;
Lineage C infecting Agropyron spp. We propose that these lin-
eages should be defined as three species of Rhynchosporium in
addition to R. orthosporum infecting D. glomerata.
Several lines of evidence support the proposed species split:
(1) population genetic data (Zaffarano et al. 2006) demonstrated
the absence of gene flow between populations of Rhynchosporium
from rye and Hordeum spp., (2) sequences from four independent
loci indicated that three evolutionary lineages could be assigned
to unique haplotypes according to their hosts, showing ecological
specialization, (3) the phylogeny of the combined loci showed a
highly supported monophyletic grouping of these haplotypes, (4)
coalescence analysis revealed independent evolution of the three
lineages, and (5) host-association for the three lineages was con-
firmed with pathogenicity tests. Because R. secalis was first de-
scribed on rye (Oudemans 1897), this name should be retained for
Rhynchosporium isolates infecting rye and triticale. Rhynchospo-
rium isolates infecting cultivated barley and other Hordeum spp.
and B. diandrus, belong to a different species that should be given
a new name. Similarly, isolates infecting Agropyron spp. should
also be described as a new species of Rhynchosporium.
The genetic isolation and subsequent speciation among these
lineages is likely due to host specialization, which is common
in pathogenic fungi (Leppik 1965; Parlevliet 1986; Wyand and
Brown 2003). Domestication of plant hosts can be a factor driv-
ing host specialization and subsequent fungal speciation (Kohn
2005). As the evolutionary history of a pathogen is often tightly
linked to that of its host (Fisher et al. 2001; Falush et al. 2003), re-
constructing the population history of one component of the host-
pathogen association may be useful to reconstruct the evolutionary
history of the other component if they have coevolved (Wirth et al.
2005; Blaser 2006; Nieberding and Olivieri 2006). We therefore
1428 EVOLUTION JUNE 2008

RECENT PATHOGEN ORIGINS
Table 3. Bayesian estimates of the time (in thousands of years) to the most recent common ancestor (TMRCA) of Rhynchosporium populations
on different hosts corresponding to three phylogenetic lineages A–C. Values in parentheses are 95% highest posterior densities intervals.
The divergence time estimates were calculated under the assumption of three mutation rates adopting different molecular clock models
as implemented in BEAST version 1.4.1 (Drummond and Rambaut 2005). The mean values of the three analyses were estimated with the
program TRACER 1.3 (Rambaut and Drummond 2003).
Mutation rates per site per year
TMRCA Clock model Combined 0.9×10⁻⁹ 8.8×10⁻⁹ 16.7×10⁻⁹
ClockAll sequences including Rhynchosporiumorthosporum
35.199 90.837 9.509 5.010orthosporum (3.628–101.891) (71.093–112.121) (7.407–11.773) (4.965–3.876)
Lineage A on barley/Hordeum spp./ 0.510 1.322 0.137 0.072Bromus diandrus (0.036–1.638) (0.775–1.952) (0.080–0.201) (0.042–0.106)Lineage B on Agropyron spp. 0.459 1.194 0.120 0.063
(0.021–1.636) (0.491–2.023) (0.052–0.206) (0.026–0.107)Lineage C on rye/triticale 0.463 1.194 0.127 0.067
(0.027–1.560) (0.566–1.922) (0.061–0.203) (0.032–0.106)Lineages A+B on barley/Hordeum 1.291 3.347 0.345 0.181spp./Bromus diandrus and onAgropyron spp.
(0.095–4.028) (2.127–4.632) (0.218–0.475) (0.116–0.252)
All three lineages A+B+C 1.399 3.625 0.375 0.198(0.120–4.247) (2.487–4.791) (0.260–0.498) (0.136–0.262)
Relaxed exponentialAll sequences including 14.443 37.800 3.577 1.953Rhynchosporium orthosporum (1.246–43.732) (25.419–48.987) (2.450–4.751) (1.376–2.570)Lineage A on barley/Hordeum spp./ 0.811 2.111 0.214 0.108Bromus diandrus (0.063–2.499) (1.398–2.878) (0.142–0.294) (0.072–0.148)Lineage B on Agropyron spp. 0.685 1.772 0.184 0.098
(0.050–2.179) (1.082–2.558) (0.111–0.268) (0.058–0.145)Lineage C on rye/triticale 0.568 1.474 0.152 0.077
(0.043–1.761) (0.955–2.030) (0.098–0.208) (0.050–0.104)Lineages A+B on barley/Hordeum 1.211 3.142 0.321 0.169spp./Bromus diandrus and onAgropyron spp.
(0.104–3.669) (2.192–4.144) (0.226–0.426) (0.119–0.225)
All three lineages A+B+C 1.281 3.319 0.343 0.180(0.113–3.846) (2.371–4.360) (0.241–0.454) (0.126–0.241)
Relaxed lognormalAll sequences including Rhynchosporiumorthosporum
26.853 69.562 7.281 3.715(1.685–89.040) (37.060–120.359) (3.844–12.519) (2.006–6.355)
Lineage A on barley/Hordeum spp./ 1.139 2.958 0.299 0.158Bromus diandrus (0.069–3.853) 1.411–4.855) (0.142–0.488) (0.079–0.258)Lineage B on Agropyron spp. 1.015 2.633 0.269 0.141
(0.046–3.576) (1.054–4.733) (0.103–0.493) (0.057–0.257)Lineage C on rye/triticale 0.614 1.594 0.161 0.088
(0.029–2.151) (0.633–2.905) (0.064–0.300) (0.035–0.161)Lineages A+B on barley/Hordeum 3.359 8.725 0.887 0.465spp./Bromus diandrus and onAgropyron spp.
(0.101–12.019) (2.797–15.468) (0.257–1.551) (0.146–0.819)
All three lineages A+B+C 3.627 9.410 0.967 0.502(0.187–12.431) (4.073–15.942) (0.419–1.637) (0.220–0.842)
evaluated what role the history of barley and rye cultivation played
in promoting genetic isolation of Rhynchosporium populations on
different hosts. Plant pathogens are usually assumed to have origi-
nated on the direct ancestors of their modern hosts and to have co-
evolved with them during domestication at the place of domestica-
tion (the domestication hypothesis). It was shown that M. oryzae,
an important pathogen on rice, originated from a host shift from
Setaria millet (Couch and Kohn 2002; Couch et al. 2005). This
EVOLUTION JUNE 2008 1429

PASCAL L. ZAFFARANO ET AL.
Figure 3. Bayesian posterior probability densities (bppds) of the TMRCA of Rhynchosporium on different hosts corresponding to three
phylogenetic lineages A–C as shown in Figure 1. These bppds assumed a strict molecular clock model and a mutation rate of 0.9 × 10⁻⁹
per site per year. Higher mutation rates and relaxed molecular clock models gave similar values.
host shift was possibly associated with rice domestication and was
brought about by the loss of an avirulence gene that allowed the
fungus to adapt to rice and diverge from other ancestral lineages
(Couch et al. 2005). In another study (Stukenbrock et al. 2007),
the wheat pathogen M. graminicola was shown to be derived from
an ancestral population of Mycosphaerella species present on wild
grasses in the Middle East. Coalescent analysis indicated that the
pathogen started to infect wheat around 10,000 years ago, during
the same time frame when the progenitors of wheat began to be do-
mesticated in the Middle East. Gradual adaptation of the fungus to
domesticated wheat and a gradual decrease in gene flow between
the Mycosphaerella population infecting wheat and the population
on wild grasses led to today’s host-specialized M. graminicola,
which has spread to cultivated wheat populations around the
world. In both cases the pathogen species fit the domestica-
tion hypothesis, rapidly adapting to their modern host during
the process of host domestication, not longer than 10,000 years
ago.
Divergence time estimates were calculated for the three Rhyn-
chosporium lineages A–C in this study. The means of the com-
bined estimates calculated in BEAST indicated that the split
of the three lineages occurred recently, between ∼ 1200 and
∼ 3600 years B.P. with a 95% HPD ranging from ∼ 100
to ∼ 12,000 years B.P. depending on the implemented clock
models. These dates suggest that the emergence of the scald
pathogen was associated with the onset of agriculture. The up-
per ends of the HPD intervals indicate that the adaptation of
the pathogens to their hosts coincides with the beginning of the
domestication of barley around 10,000 years B.P. (Badr et al.
2000; Salamini et al. 2002) thus supporting the domestication
hypothesis. Similar to the Mycosphaerella pathogen on wheat,
the Rhynchosporium pathogen could have shifted and adapted
1430 EVOLUTION JUNE 2008
RECENT PATHOGEN ORIGINS
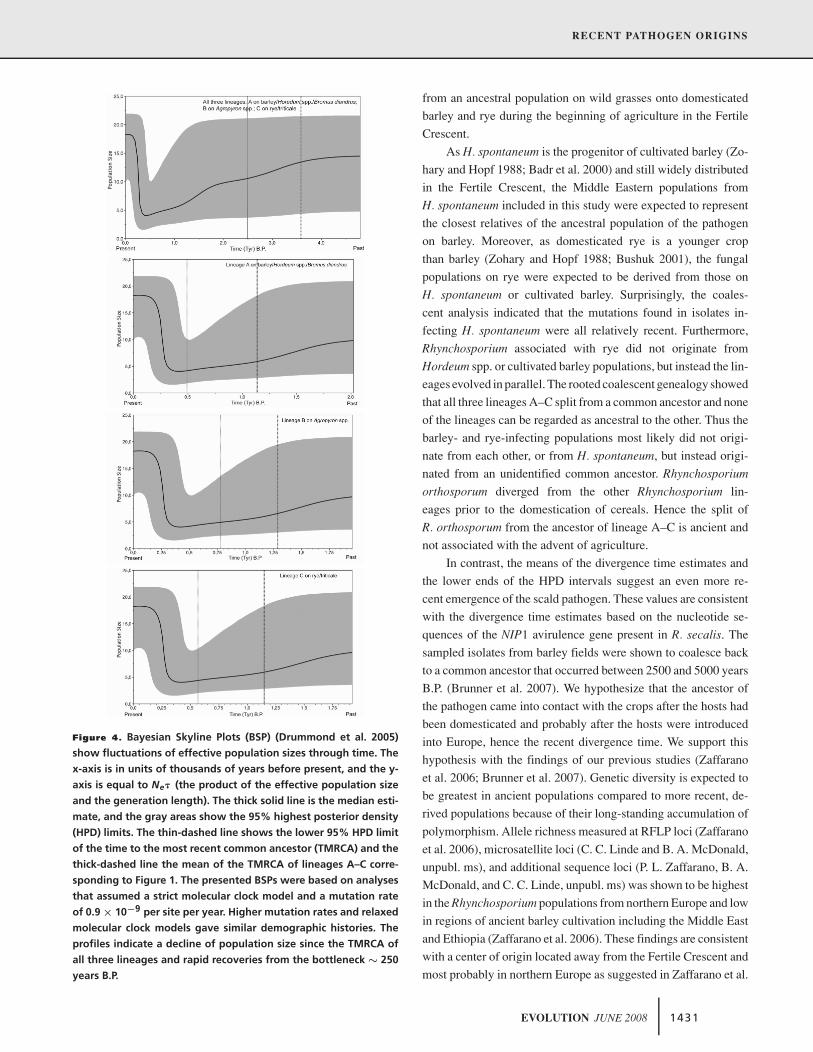
Figure 4. Bayesian Skyline Plots (BSP) (Drummond et al. 2005)
show fluctuations of effective population sizes through time. The
x-axis is in units of thousands of years before present, and the y-
axis is equal to Ne� (the product of the effective population size
and the generation length). The thick solid line is the median esti-
mate, and the gray areas show the 95% highest posterior density
(HPD) limits. The thin-dashed line shows the lower 95% HPD limit
of the time to the most recent common ancestor (TMRCA) and the
thick-dashed line the mean of the TMRCA of lineages A–C corre-
sponding to Figure 1. The presented BSPs were based on analyses
that assumed a strict molecular clock model and a mutation rate
of 0.9 × 10⁻⁹ per site per year. Higher mutation rates and relaxed
molecular clock models gave similar demographic histories. The
profiles indicate a decline of population size since the TMRCA of
all three lineages and rapid recoveries from the bottleneck ∼ 250
years B.P.
from an ancestral population on wild grasses onto domesticated
barley and rye during the beginning of agriculture in the Fertile
Crescent.
As H. spontaneum is the progenitor of cultivated barley (Zo-
hary and Hopf 1988; Badr et al. 2000) and still widely distributed
in the Fertile Crescent, the Middle Eastern populations from
H. spontaneum included in this study were expected to represent
the closest relatives of the ancestral population of the pathogen
on barley. Moreover, as domesticated rye is a younger crop
than barley (Zohary and Hopf 1988; Bushuk 2001), the fungal
populations on rye were expected to be derived from those on
H. spontaneum or cultivated barley. Surprisingly, the coales-
cent analysis indicated that the mutations found in isolates in-
fecting H. spontaneum were all relatively recent. Furthermore,
Rhynchosporium associated with rye did not originate from
Hordeum spp. or cultivated barley populations, but instead the lin-
eages evolved in parallel. The rooted coalescent genealogy showed
that all three lineages A–C split from a common ancestor and none
of the lineages can be regarded as ancestral to the other. Thus the
barley- and rye-infecting populations most likely did not origi-
nate from each other, or from H. spontaneum, but instead origi-
nated from an unidentified common ancestor. Rhynchosporium
orthosporum diverged from the other Rhynchosporium lin-
eages prior to the domestication of cereals. Hence the split of
R. orthosporum from the ancestor of lineage A–C is ancient and
not associated with the advent of agriculture.
In contrast, the means of the divergence time estimates and
the lower ends of the HPD intervals suggest an even more re-
cent emergence of the scald pathogen. These values are consistent
with the divergence time estimates based on the nucleotide se-
quences of the NIP1 avirulence gene present in R. secalis. The
sampled isolates from barley fields were shown to coalesce back
to a common ancestor that occurred between 2500 and 5000 years
B.P. (Brunner et al. 2007). We hypothesize that the ancestor of
the pathogen came into contact with the crops after the hosts had
been domesticated and probably after the hosts were introduced
into Europe, hence the recent divergence time. We support this
hypothesis with the findings of our previous studies (Zaffarano
et al. 2006; Brunner et al. 2007). Genetic diversity is expected to
be greatest in ancient populations compared to more recent, de-
rived populations because of their long-standing accumulation of
polymorphism. Allele richness measured at RFLP loci (Zaffarano
et al. 2006), microsatellite loci (C. C. Linde and B. A. McDonald,
unpubl. ms), and additional sequence loci (P. L. Zaffarano, B. A.
McDonald, and C. C. Linde, unpubl. ms) was shown to be highest
in the Rhynchosporium populations from northern Europe and low
in regions of ancient barley cultivation including the Middle East
and Ethiopia (Zaffarano et al. 2006). These findings are consistent
with a center of origin located away from the Fertile Crescent and
most probably in northern Europe as suggested in Zaffarano et al.
EVOLUTION JUNE 2008 1431

PASCAL L. ZAFFARANO ET AL.
Table 4. Reaction of Rhynchosporium secalis isolates from different hosts on barley and rye varieties, and on Hordeum murinum.
Source of Isolate Disease reactiona
isolateBarley cultivars Rye cultivars H. murinum Control
plantsChariot Julia Pasadena Plaisant Avanti Born Danko Picasso seedlings
Barley 99CH2A2b 3–4 1–4 3–4 3–4 0 0 0 0 0 099CH5E4a 2–4 2–4 3–4 2–4 0 0 0 0 − 099CH5E6b 4 2–4 3–4 4 0 0 0 0 − 099CH5H10a 3–4 3–4 4 3–4 0 0 0 0 − 099CH6C3a 2–4 1–3 3–4 4 0 0 0 0 − 099CH6E3b 3–4 1–4 3–4 2–3 0 0 0 0 − 000CHA1b 2–4 1–4 1–4 1–4 0 0 0 0 − 0
Rye 99CH1E7a 0 0 0 0 3–4 3–4 2–4 1–4 0 099CH1B8 0 0 0 0 2–4 2–4 3–4 2–4 − 099CH1H10b 0 0 0 0 1–4 3–4 2–4 3–4 − 099CH1D4a 0 0 0 0 2–4 3–4 1–4 3–4 − 002CH4-5a.1 0 0 0 0 1–4 1–4 3–4 2–4 − 002CH4-6a.1 0 0 0 0 2–4 2–3 2 1–4 − 002CH4-9a.2 0 0 0 0 3–4 3–4 3–4 1–4 − 002CH4-14a.1 0 0 0 0 2–4 2–4 3–4 2–4 − 0
Triticale 02CH2-3c.1 0 0 0 0 3–4 2–4 1–4 1–4 − 0A. repens Brutten-3.1.2 0 − 0 − − − 0 0 0 0
Danikon-1.1.1 0 − 0 − − − 0 0 0 0K2B-2C1.1 0 − 0 − − − 0 0 0 0RAC-2-A9.1 0 − 0 − − − 0 0 0 0SEG-A3.2.1.1 0 − 0 − − − 0 0 0 0WPK-5b.1A3.1 0 − 0 − − − 0 0 0 0
H. murinum WPK-2.1 0–3 − 3 − − − 0 0 2–3 0WPK-A8.4 2–4 − 3–4 − − − 0 0 3–4 0
aDisease assessment was according to the scale described in Ali and Boyd (1973). Host-isolate combinations marked with ”-”were not tested.
(2006). Archeological remains of barley grains suggest that bar-
ley was first domesticated around 10,000 years B.P. (Badr et al.
2000; Salamini et al. 2002) in the Fertile Crescent. As a result of
Neolithic migrations, agriculture was brought to Europe ∼ 7500
B.P. (Salamini et al. 2002; Haak et al. 2005). The emergence of
the pathogen lineages coincides with the introduction of barley
and rye cultivation into northern Europe which has been dated to
∼5000 to 3000 B.P. (Price 1996; Bushuk 2001). Given that the
highest diversity for all genetic markers is in northern Europe pop-
ulations and that there is a decreasing gradient of genetic diversity
running from northern Europe to the Middle East (Brunner et al.
2007), we consider it most likely that Rhynchosporium emerged
recently as a barley and rye disease via a host shift that occurred
in northern Europe ∼ 1200 to 3600 years ago. Under this scenario
we falsify the domestication hypothesis, although the spread of
agriculture played a significant role in bringing a host into contact
with a new pathogen.
For other plant pathogens it was suggested that their center
of origin does not necessarily coincide with the center of origin
of their hosts. For example, the oomycete Phytophthora infestans
causing late blight on potatoes and the fungus Colletotrichum lin-
demuthianum causing anthracnose in common bean both have
their highest levels of genetic diversity in Mesoamerica whereas
their hosts originated in the Andes (Fry et al. 1992; Sicard et al.
1997; Grunwald and Flier 2005). However, coalescent analy-
ses showed that ancestral mutations in P. infestans originated
from the Andes, suggesting a South American origin of the
pathogen (Gomez-Alpizar et al. 2007). For C. lindemuthianum,
incongruence between the geographical origin of the pathogen
and its hosts is not completely confirmed because the com-
mon bean experienced independent domestication events in both
Mesoamerica and the Andes, and both areas developed into cen-
ters of diversity (Debouck 1986; Kami et al. 1995; Pickersgill
2007). It is important to note that general conclusions regard-
ing geographical origins of pathogens based solely on compar-
isons of genetic diversity are problematic. In this study, how-
ever, a combination of genetic diversity studies and divergence
time estimates for Rhynchosporium populations provide support
for a recent origin of the pathogen outside the host’s center of
origin.
1432 EVOLUTION JUNE 2008
RECENT PATHOGEN ORIGINS
An alternative scenario considers the possible loss of genetic
diversity in Rhynchosporium through a series of selective sweeps
associated with adaptation to its domesticated hosts. The BSPs
indicate a decline in population size for all three lineages after
they started diverging from each other. This could reflect a bottle-
neck that was experienced after the host shift from the ancestral
population onto the domesticated hosts through a combination of
selection for host specialization and genetic drift. Under this alter-
native scenario, the pathogen populations currently present on the
sampled hosts would have lost most of their ancient diversity, lead-
ing to an inability to reconstruct the true lines of descent among
the host-specialized lineages through the last 10,000 years. In this
case a divergence time coinciding with the beginning of barley
domestication would favor an origin of the pathogen in the Fertile
Crescent (i.e., supporting the domestication hypothesis). We con-
sider this alternative scenario to be less likely because it suggests
that selective sweeps occurred independently in all three lineages
and affected all the genes used in this study and in Brunner et al.
(2007). Moreover, although the sexual stage of the fungus has not
been observed in the field or induced in vitro, there is strong in-
direct evidence for regular sexual reproduction in the field (Linde
et al. 2003; Zaffarano et al. 2006). A recombining genome would
prevent single haplotypes from becoming fixed in field popula-
tions of the pathogen. The selective sweep scenario is therefore
considered less likely.
The diversification within lineages started between ∼ 460 and
1100 years B.P. with the 95% HPDs ranging from ∼ 20 to 3800
years B.P. The accumulation of polymorphism in the pathogen
populations likely increased with the expansion of the host popu-
lations in Eurasia and later in other continents. The demographic
growth reconstructions shown by the BSPs point to a recent re-
covery of the pathogen populations from the bottleneck that was
experienced after the host shift onto domesticated hosts. The rapid
increase in pathogen population sizes occurred during the last ∼250 years, coinciding with the global expansion and industrializa-
tion of agriculture and the Green Revolution. Recent population
expansion and diversification is also supported by the finding that
the majority of the mutations present in all three lineages were lo-
cated at the tips of the coalescent-based genealogies. As a result of
intensified cereal production, changed cultivation practices, and
increased global seed trade, populations of the fungus reached a
magnitude that allowed scald to become one of the most impor-
tant diseases on barley. The scald disease was first described at
the end of the 19th century (Frank 1897; Oudemans 1897; Hein-
sen 1901). It is not known whether the scald disease was already
present before that time. However, it is possible that the disease
was perceived only about 100 years ago after the pathogen popu-
lations increased and began to cause significant yield losses.
Although Agropyron spp. are weeds and not cultivated, Rhyn-
chosporium on these host species experienced a similar demo-
graphic history as on the other domesticated hosts. Agropyron spp.
are commonly found in cereal fields and pastures. Their close as-
sociation with cereal crops might have allowed this host species
to increase in population size and spread globally as a weed while
the barley and rye populations increased. The coalescent genealo-
gies showed that lineages A and C infecting barley and Agropyron
spp., respectively, share a common ancestor from which they di-
verged soon after their ancestor split from lineage B infecting rye.
It is probable that lineage C mirrored the demographic develop-
ment of lineage A and was spread globally through barley cultiva-
tion and trade. Interestingly, the geographic area from which iso-
lates infecting Agropyron spp. were obtained is small (only from
Switzerland) compared to that of rye-infecting isolates (Russia,
Switzerland, France) or barley-infecting isolates (many fields on
five continents). However, lineage C contained more than half of
the haplotype diversity present in lineage A and more haplotype
diversity than present in lineage B. It is possible that the genotypic
diversity of the scald pathogen on Agropyron spp. is higher than
on cultivated hosts because of a higher genetic diversity in mainly
outbreeding Agropyron hosts, compared to genetically uniform
cultivated crops.
Agriculture played a crucial role in the evolution of the scald
pathogen by first bringing the new hosts and the pathogen together
and then by driving the pathogen adaptation and transmission on a
global scale. The expansion of agriculture and resulting increase
in host population size allowed these new pathogens to diverge
rapidly into new species with large population sizes. This study
highlights the importance of agriculture in the emergence of fungal
pathogens of crops and illustrates how the introduction of a crop
to new areas can select for new pathogens that emerge through
host shifts. A short time frame was sufficient to allow the scald
pathogens to adapt to new hosts and to evolve into new species.
Although this study has focused on Rhynchosporium pathogens
of cereals, it is likely that many other plant pathogens with life
histories similar to Rhynchosporium have emerged in the same
way. It also is likely that more pathogens will emerge via host shifts
in the future as old crops are introduced into newly developed
agricultural areas around the world.
Further evidence that agriculture is driving the adaptation of
fungal pathogens to their hosts can be found in the rye/triticale-
infecting populations. The genealogies suggest that rye- and
triticale-infecting isolates belong to the same gene pool and
thus share a common origin. The crop triticale (× Triticosecale
Wittmack) is a man-made crop derived from hybridizing wheat
(Triticum aestivum L.) with rye (S. cereale L.). Triticale is of very
recent origin and was commercialized at the end of the 1960s
(Ammar et al. 2004; Oettler 2005). Although the disease was first
recorded on rye in the late 19th century (Oudemans 1897), it was
only noticed on triticale in the 1990s, 30 years after the introduc-
tion of triticale as a crop (Welty and Metzger 1996). This recent
EVOLUTION JUNE 2008 1433

PASCAL L. ZAFFARANO ET AL.
host shift from rye to triticale may have occurred due to the loss of
scald resistance in the genome supplied by the wheat parent or be-
cause new pathogenic forms of Rhynchosporium recently emerged
from the rye-infecting population (Welty and Metzger 1996). In
the latter case, 30 years were sufficient to allow the rye-infecting
population to adapt to triticale. By breeding a new host species
and expanding its population size in the field, a new disease might
have emerged that may expand to become a significant disease on
triticale in the future.
ACKNOWLEDGMENTSThis work was funded by grant TH-23/02-4 from the Swiss Federal Insti-tute of Technology (ETH Zurich). The Genetic Diversity Center Zurichprovided facilities for data collection. We thank the collaborators listed inTable 1 involved in collecting infected leaves. We also thank two anony-mous reviewers, who offered many helpful suggestions to improve themanuscript.
LITERATURE CITEDAli, S. M., and W. J. R. Boyd. 1973. Host range and physiologic specialization
in Rhynchosporium secalis. Aust. J. Agric. Res. 25:21–31.Ammar, K., M. Mergoum, and S. Rajaram 2004. The history and evolution
of triticale. Pp. 1–9 in Triticale improvement and production. FAO PlantProduction and Protection Paper. No. 179.
Anderson, P. K., A. A. Cunningham, N. G. Patel, F. J. Morales, P. R. Epstein,and P. Daszak. 2004. Emerging infectious diseases of plants: pathogenpollution, climate change and agrotechnology drivers. Trends Ecol. Evol.19:535–544.
Armelagos, G. J., and K. N. Harper. 2005. Genomics at the origins of agricul-ture, part two. Evol. Anthropol. 14:109–121.
Aylor, D. L., E. W. Price, and I. Carbone. 2006. SNAP: combine and map mod-ules for multilocus population genetic analysis. Bioinformatics 22:1399–1401.
Badr, A., K. Muller, R. Schafer-Pregl, H. El Rabey, S. Effgen, H. H. Ibrahim, C.Pozzi, W. Rohde, and F. Salamini. 2000. On the origin and domesticationhistory of barley (Hordeum vulgare). Mol. Biol. Evol. 17:499–510.
Bahlo, M., and R. C. Griffiths. 2000. Inference from gene trees in a subdividedpopulation. Theor. Pop. Biol. 57:79–95.
Barker, F. K., and F. Lutzoni. 2002. The utility of the incongruence lengthdifference test. Syst. Biol. 51:625–637.
Beerli, P., and J. Felsenstein. 1999. Maximum-likelihood estimation of migra-tion rates and effective population numbers in two populations using acoalescent approach. Genetics 152:763–773.
———. 2001. Maximum likelihood estimation of a migration matrix andeffective population sizes in n subpopulations by using a coalescentapproach. Proc. Natl. Acad. Sci. USA 98:4563–4568.
Blaser, M. J. 2006. Who are we? Indigenous microbes and the ecology ofhuman diseases. EMBO Rep. 7:956–960.
Brunner, P. C., S. Schurch, and B. A. McDonald. 2007. The origin and col-onization history of the barley scald pathogen Rhynchosporium secalis.J. Evol. Biol. 20:1311–1321.
Bushuk, W. 2001. Rye production and uses worldwide. Cereal Foods World46:70–73.
Carbone, I., and L. M. Kohn. 1999. A method for designing primer sets forspeciation studies in filamentous ascomycetes. Mycologia 91:553–556.
Carbone, I., Y. C. Liu, B. I. Hillman, and M. G. Milgroom. 2004. Recombina-tion and migration of Cryphonectria hypovirus 1 as inferred from genegenealogies and the coalescent. Genetics 166:1611–1629.
Cavalli-Sforza, L. L, P. Menozzi, and A. Piazza. 1994. The history and geog-raphy of human genes. Princeton Univ. Press, Princeton, NJ.
Couch, B. C., and L. M. Kohn. 2002. A multilocus gene genealogy concor-dant with host preference indicates segregation of a new species, Mag-naporthe oryzae, from M. grisea. Mycologia 94:683–693.
Couch, B. C., I. Fudal, M-H. Lebrun, D. Tharreau, B. Valent, P. van Kim, J-L.Notteghem, and L. M. Kohn. 2005. Origins of host-specific populationsof the blast pathogen Magnaporthe oryzae in crop domestication withsubsequent expansion of pandemic clones on rice and weeds of rice.Genetics 170:613–630.
Crawford, G. W., and C. Shen. 1998. The origins of rice agriculture: recentprogress in East Asia. Antiquity 72:858–866.
Cunningham, C. W. 1997. Can three incongruence tests predict when datashould be combined? Mol. Biol. Evol. 14:733–740.
Darlu, P., and G. Lecointre. 2002. When does the incongruence length differ-ence test fail? Mol. Biol. Evol. 19:432–437.
Debouck, D. G. 1986. Primary diversification of Phaseolus in the Americas:Three centers? FAO/IBPGR Plant. Genet. Res. Newsl. 67:2–8.
Diamond, J. 1997. Guns, germs, and steel: the fates of human societies. Norton,New York.
———. 2002. Evolution, consequences and future of plant and animal do-mestication. Nature 418:700–707.
Dolphin, K., R. Belshaw, C. D. L. Orme, and D. L. J. Quicke 2000. Noise andincongruence: interpreting results of the incongruence length differencetest. Mol. Phylogenet. Evol. 17:401–406.
Dowton, M., and A. D. Austin. 2002. Increased congruence does not nec-essarily indicate increased phylogenetic accuracy-the behaviour of theincongruence length difference test in mixed-model analyses. Syst. Biol.51:19–31.
Drummond, A. J., and A. Rambaut. 2005. BEAST, version 1.4.1. Univ. ofOxford, Oxford, UK.
Drummond, A. J., B. Rambaut, B. Saphiro, and O. G. Pybus. 2005. Bayesiancoalescent inference of past population dynamics from molecular se-quences. Mol. Biol. Evol. 22:1185–1192.
Drummond, A. J., S. Y. W. Ho, M. J. Phillips, and A. Rambaut 2006. Relaxedphylogenetics and dating with confidence. PLoS Biol. 4:699–710.
Falush, D., T. Wirth, B. Linz, J. K. Pritchard, M. Stephens, M. Kidd,M. J. Blaser, D.Y. Graham, S. Vacher, G.I. Perez-Perez, et al. 2003.Traces of human migrations in Helicobacter pylori populations. Science299:1582–1585.
Farris, J. S., M. Kallersjo, A. G. Kluge, and C. Bult. 1995. Testing for signifi-cance of incongruence. Cladistics 10:315–319.
Fisher, M. C., G. L. Koenig, T. J. White, G. San-Blas, R. Negroni, I. GutierrezAlvarez, B. Wanke, and J. W. Taylor. 2001. Biogeographic range expan-sion into South America by Coccidioides immitis mirrors New Worldpatterns of human migration. Proc. Natl. Acad. Sci. USA 98:4558–4562.
Flannery, K. V. 1973. The origins of agriculture. Annu. Rev. Anthropol. 2:271–310.
Frank, B. 1897. Uber die Zerstorung der Gerste durch einen neuen Getreide-pilz. Wochenschrift fur Brauerei 14:518–520.
Fry, W. E., S. B. Goodwin, J. M. Matuszak, L. J. Spielmann, M.G. Milgroom,and M. A. Drenth. 1992. Population genetics and intercontinental mi-grations of Phytophthora infestans. Annu. Rev. Phytopathol. 30:107–129.
Fu, Y. X., and W. H. Li. 1993. Statistical tests of neutrality of mutations.Genetics 133:693–709.
Gomez-Alpizar, L., I. Carbone, and J. B. Ristaino. 2007. An Andean originof Phytophthora infestans inferred from mitochondrial and nuclear genegenealogies. Proc. Natl. Acad. Sci. USA 104:3306–3311.
Griffiths, R. C., and S. Tavare. 1994. Ancestral inference in population genet-ics. Stat. Sci. 9:307–319.
1434 EVOLUTION JUNE 2008
RECENT PATHOGEN ORIGINS
Grunwald, N. J., and W. G. Flier. 2005. The biology of Phytophthora infestansat its center of origin. Annu. Rev. Phytopathol. 43:171–190.
Haak, W., P. Forster, B. Bramanti, S. Matsumura, G. Brandt, M. Tanzer, R.Villems, C. Renfrew, D. Gronenborn, K. W. Alt, and J. Brunger. 2005.Ancient DNA from the first European farmers in 7500-year-old Neolithicsites. Science 310:1016–1018.
Hansen, E. M. 1987. Speciation in plant pathogenic fungi. The influence ofagricultural practice. Can. J. Plant. Pathol. 9:403–410.
Heinsen, E. 1901. Beobachtungen uber den neuen Getreidepilz Rhynchospo-rium graminicola. Jahrb. Hamburg Wiss. Anst. 18:43–55.
Hey, J., and J. Wakeley. 1997. A coalescent estimator of the population re-combination rate. Genetics 145:833–864.
Higman, C., and L. LU. 1998. The origins and dispersal of rice cultivation.Antiquity 72:867–877.
Kami, J., V. B. Velasquez, D. G. Debouck, and P. Gepts 1995. Identification ofpresumed ancestral DNA sequences of phaseolin in Phaseolus vulgaris.Proc. Natl. Acad. Sci. USA 92:1101–1104.
Kasuga, T., T. J. White, and J. W. Taylor. 2002. Estimation of nucleotide sub-stitution rates in eurotiomycete fungi. Mol. Biol. Evol. 19:2318–2324.
Kohn, L. M. 2005. Mechanisms of fungal speciation. Annu. Rev. Phytopathol.43:279–308.
Kolar, C. S., and Lodge, D. M. 2001. Progress in invasion biology: predictinginvaders. Trends Ecol. Evol. 16:199–204.
Leppik, E. E. 1965. Some viewpoints on the phylogeny of rust fungi V. Evo-lution of biological specialization. Mycologia 57:6–22
Lev-Yadun S., A. Gopher, and S. Abbo. 2000. The cradle of agriculture. Sci-ence 288:1602–1603.
Linde, C. C., M. Zala, S. Ceccarelli, and B. A. McDonald. 2003. Furtherevidence for sexual reproduction in Rhynchosporium secalis based ondistribution and frequency of mating-type alleles. Fungal Genet. Biol.40:115–125.
Linde, C. C., M. Zala, and B. A. McDonald. 2005. Isolation and characteriza-tion of microsatellite loci from the barley scald pathogen, Rhynchospo-rium secalis. Mol. Ecol. Notes 5:546–548.
Markwordt, J. D., R. Doshi, and I. Carbone. 2004. SNAP clade and matrix.Distributed over the internet, http://snap.cifr.ncsu. Department of PlantPathology, North Carolina Univ.
Mason-Gamer, R. J., and E. A. Kellogg. 1996. Testing for phylogenetic conflictamong molecular data sets in the tribe Tritceae (Gramineae). Syst. Biol.45:524–545.
McDermott, J. M., B. A. McDonald, R. W. Allard, and R. K. Webster. 1989.Genetic variability for pathogenicity, isozyme, ribosomal DNA andcolony color variants in populations of Rhynchosporium secalis. Ge-netics 122:561–565.
McDonald, B. A., J. Zhan, and J. J. Burdon. 1999. Genetic structure of Rhyn-chosporium secalis in Australia. Phytopathology 89:639–645.
Money, N. 2007. The triumph of the fungi: a rotten history. Oxford Univ.Press, New York.
Munkacsi, A. B., S. Stoxen, and G. May. 2007. Domestication of maize,sorghum, and sugarcane did not drive the divergence of their smutpathogens. Evolution 61:388–403.
Nieberding, C. M., and I. Olivieri. 2006. Parasites: proxies for host genealogyand ecology? Trends Ecol. Evol. 22:156–165.
Oettler, G. 2005. The fortune of a botanical curiosity—Triticale: past, presentand future. J. Agr. Sci. 143:329–346.
Oudemans, C. A. J. A. 1897. Observations mycologiques. K. Akad. Wetensch.Amsterdam Verslag. Wis en Natuurk. Afd. 6:86–92.
Pamilo, P., and M. Nei. 1988. Relationships between gene trees and speciestrees. Mol. Biol. Evol. 5:568–583.
Parlevliet, J. E. 1986. Coevolution of host resistance and pathogen virulence:possible implications for taxonomy Pp. 19–34 in A. R. Stone, and D. L.
Hawksworth, eds. Coevolution and systematics. Claredon Press, Oxford,UK.
Pearce-Duvet, J. M. C. 2006. The origin of human pathogens: evaluating therole of agriculture and domestic animals in the evolution of human dis-ease. Biol. Rev. 81:369–382.
Pickersgill, B. 2007. Domestication of plants in the Americas: insights fromMendelian and molecular genetics. Ann. Bot. 100:925–940.
Posada, D., and K. A. Crandall. 1998. Modeltest: testing the model of DNAsubstitution. Bioinformatics 14:817–818.
Price, D. T. 1996. The first farmers of southern Scandinavia. Pp. 346–362 inD. R. Harris, ed. The origins and spread of agriculture and pastoralismin Eurasia. UCL Press Limited, Univ. College London, London.
Price, E. W, and I. Carbone. 2005. SNAP: workbench management tool forevolutionary population genetic analysis. Bioinformatics 21:402–404.
Rambaut, A., and A. J. Drummond. 2003. Tracer v1.3, available from:http://evolve.zoo.ox.acuk.
Ronquist, F., and J. P. Huelsenbeck. 2003. MrBayes 3: Bayesian phylogeneticinference under mixed models. Bioinformatics 19:1572–1574.
Rosenberg, N. A. 2002. The probability of topological concordance of genetrees and species trees, a new method of phylogenetic inference. J. Mol.Evol. 43:304–311.
Rozas, J., J. C. Sanchez-DelBarrio, X. Messeguer, and R. Rozas. 2003. DnaSP,DNA polymorphism analyses by the coalescent and other methods.Bioinformatics 19:2496–2497.
Salamati, S., J. Zhan, J. J. Burdon, and B. A. McDonald. 2000. The geneticstructure of field populations of Rhynchosporium secalis from three con-tinents suggests moderate gene flow and regular recombination. Phy-topathology 90:901–908.
Salamini, F., H. Ozkan, A. Brandolini, R. Schafer-Pregl, and W. Martin. 2002.Genetics and geography of wild cereal domestication in the near east.Nat. Rev. Genet. 3:429–441.
Schrag, S. J., and P. Wiener. 1995. Emerging infectious disease: what arethe relative roles of ecology and evolution? Trends Ecol. Evol. 10:319–324.
Sicard, D., Y. Michalakis, M. Dron, and C. Neema. 1997. Genetic diversity andpathogenic variation of Colletotrichum lindemuthianum in the three cen-ters of diversity of its host, Phaseolus vulgaris. Phytopathology 87:807–813.
Slippers, B., J. Stenlid, and M. J. Wingfield 2005. Emerging pathogens: fungalhost jumps following anthropogenic introduction. Trends Ecol. Evol.20:420–421.
Stukenbrock, E. H., S. Banke, M. Javan-Nikkhah, and B. A. McDonald. 2007.Origin and domestication of the fungal wheat pathogen Mycosphaerellagraminicola via sympatric speciation. Mol. Biol. Evol. 24:398–411.
Swofford, D. L. 2002. PAUP∗. Phylogenetic analysis using parsimony (∗andother methods). Version 4. Sunderland, MA: Sinauer Associates.
Tajima, F. 1989. Statistical method for testing the natural mutation hypothesisby DNA polymorphism. Genetics 123:585–595.
Takahata, N. 1989. Gene genealogy in three related populations, consistencyprobability between gene and population trees. Genetics 122:957–966.
Welty, R. E., and R. J. Metzger. 1996. First report of scald of triticale caused byRhynchosporium secalis in North America. Plant. Dis. 80:1220–1223.
White, T. J., T. Bruns, S. Lee, and J. Taylor. 1990. Amplification and directsequencing of fungal ribosomal RNA genes for phylogenetics. Pp. 315–322 in M. A. Innis, D. H. Gelfand, J. J. Sninsky, T. J. White, eds. PCRprotocols: a guide to methods and applications. Academic press, SanDiego.
Wiens, J. J. 1998. Combining data sets with different phylogenetic histories.Syst. Biol. 47:568–581.
Wirth, T., A. Meyer, and M. Achtman. 2005. Deciphering host migrations andorigins by means of their microbes. Mol. Ecol. 14:3289–3306.
EVOLUTION JUNE 2008 1435

PASCAL L. ZAFFARANO ET AL.
Wolfe, N. D., C. P. Dunavan, and J. Diamond 2007. Origins of major humaninfectious diseases. Nature 447:279–283.
Woolhouse, M. E. J., D. T. Haydon, and R. Antia. 2005. Emerging pathogens:the epidemiology and evolution of species jumps. Trends Ecol. Evol.20:238–244.
Wyand, R. A. and J. K. M. Brown 2003. Genetic and forma specialis diversityin Blumeria graminis of cereals and its implications for host-pathogenco-evolution. Mol. Plant Pathol. 4:187–198.
Zaffarano, P. L., B. A. McDonald, M. Zala, and C. C. Linde 2006. Globalhierarchical gene diversity analysis suggests the fertile crescent is notthe center of origin of the barley scald pathogen Rhynchosporium secalis.Phytopathology 96:941–950.
Zohary, D., and M. Hopf. 1988. Domestication of plants in the old world.Oxford Univ., UK.
Associate Editor: J. Bergelson
Supplementary MaterialThe following supplementary material is available for this article:
Figure S1. Phylogeny inferred by maximum parsimony from the �-tubulin DNA sequence locus. The 50% majority-rule
consensus tree is shown. Bayesian maximum likelihood analysis recovered the same topology. The numbers above branches are
bootstrap frequencies of 1000 replicates and those below are Bayesian posterior probabilities. Branch lengths are proportional
to the number of steps (character changes) along the branch. Labels on the phylogeny are: H1-H18 haplotypes obtained from
316 DNA sequences of 1609 bp representing Rhynchosporium isolates from different hosts (Agropyron spp., barley, Bromus
diandrus, Dactylis glomerata, Hordeum spp., rye and triticale). Haplotypes H2-H4 representing Rhynchosporium orthosporum
were used as outgroup.
Figure S2. Phylogeny inferred by maximum parsimony from the �-tubulin DNA sequence locus. The 50% majority-rule
consensus tree is shown. Bayesian maximum likelihood analysis recovered the same topology. The numbers above branches are
bootstrap frequencies of 1000 replicates and those below are Bayesian posterior probabilities. Branch lengths are proportional to
the number of steps (character changes) along the branch. Labels on the phylogeny are: H1-H25 haplotypes obtained from 316
DNA sequences of 609 bp representing Rhynchosporium isolates from different hosts (Agropyron spp., barley, Bromus diandrus,
Dactylis glomerata, Hordeum spp., rye and triticale). Haplotypes H2-H4 representing Rhynchosporium orthosporum were used
as outgroup.
Figure S3. Phylogeny inferred by maximum parsimony from the EF-1� DNA sequence locus. The 50% majority-rule consensus
tree is shown. Bayesian maximum likelihood analysis recovered a similar topology. The numbers above branches are bootstrap
frequencies of 1000 replicates and those below are Bayesian posterior probabilities. Branch lengths are proportional to the
number of steps (character changes) along the branch. Labels on the phylogeny are: H1-H15 haplotypes obtained from 316
DNA sequences of 365 bp representing Rhynchosporium isolates from different hosts (Agropyron spp., barley, Bromus diandrus,
Dactylis glomerata, Hordeum spp., rye and triticale). Haplotypes H2-H4 representing Rhynchosporium orthosporum were used
as outgroup.
Figure S4. Phylogeny inferred by maximum parsimony from the ITS DNA sequence locus. The 50% majority-rule consensus
tree is shown. Bayesian maximum likelihood analysis recovered a similar topology. The numbers above branches are bootstrap
frequencies of 1000 replicates and those below are Bayesian posterior probabilities. Branch lengths are proportional to the
number of steps (character changes) along the branch. Labels on the phylogeny are: H1-H25 haplotypes obtained from 316
DNA sequences of 848 bp representing Rhynchosporium isolates from different hosts (Agropyron spp., barley, Bromus diandrus,
Dactylis glomerata, Hordeum spp., rye and triticale). Haplotypes H2-H4 representing Rhynchosporium orthosporum were used
as outgroup.
Table S1. Distribution of the different haplotypes of Rhynchosporium species on different hosts corresponding to three phylo-
genetic lineages A–C and Rhynchosporium orthosporum based on four DNA sequence loci.
Table S2. Results from neutrality tests [Tajima’s D (Tajima 1989) and Fu and Li’s D∗ and Fu and Li’s F∗ (Fu and Li 1993)].
This material is available as part of the online article from:
http://www.blackwell-synergy.com/doi/abs/10.1111/j.1558-5646.2008.00390.x
(This link will take you to the article abstract).
Please note: Blackwell Publishing is not responsible for the content or functionality of any supplementary materials supplied by
the authors. Any queries (other than missing material) should be directed to the corresponding author for the article.
1436 EVOLUTION JUNE 2008