Rangeland Burning Overview
7
Day 1 – 10:00a PHASE I WRAP-UP PHASE I WRAP-UP -- Rangeland Burning on Private Lands – Technical Approach and EI Development
-
Upload
cally-lowe -
Category
Documents
-
view
57 -
download
0
description
Day 1 – 10:00a PHASE I WRAP-UP -- Rangeland Burning on Private Lands – Technical Approach and EI Development. Rangeland Burning Overview. Quantify rangeland burning on federal, state, and private land Develop “strawman” document that defines emission inventory procedure - PowerPoint PPT Presentation
Transcript of Rangeland Burning Overview

Day 1 – 10:00a
PHASE I WRAP-UPPHASE I WRAP-UP-- Rangeland Burning on Private Lands – Technical Approach and EI Development
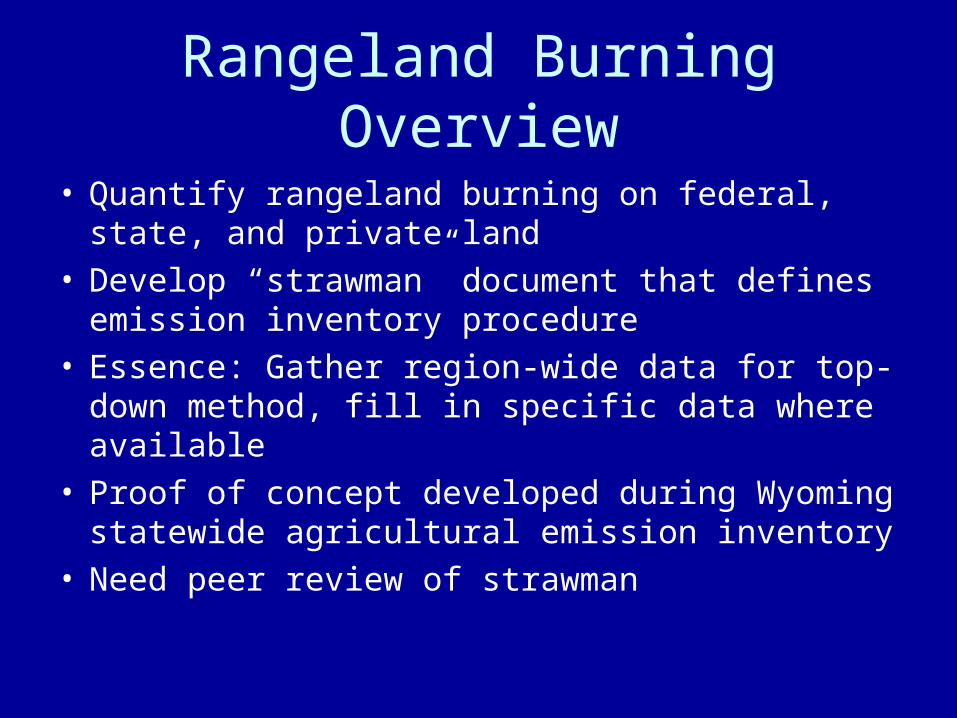
Rangeland Burning Overview
• Quantify rangeland burning on federal, state, and private land
• Develop “strawman” document that defines emission inventory procedure
• Essence: Gather region-wide data for top-down method, fill in specific data where available
• Proof of concept developed during Wyoming statewide agricultural emission inventory
• Need peer review of strawman

Rangeland EI Calculation
BurnedRangelandofPercentRangelandinAcresBurnedAcres
lbs
Tons
BiomassTons
Emissionslbs
BurnedAcres
BiomassTonsBurnedAcresEmissionsTons
2000
Rangeland Activity: Layers
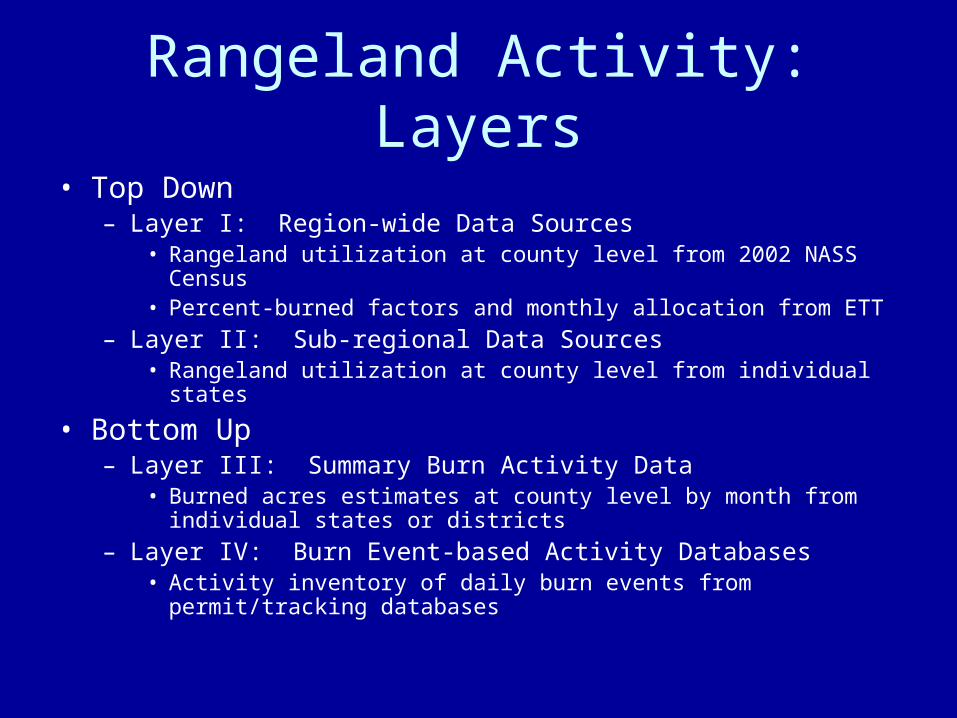
• Top Down– Layer I: Region-wide Data Sources
• Rangeland utilization at county level from 2002 NASS Census• Percent-burned factors and monthly allocation from ETT
– Layer II: Sub-regional Data Sources• Rangeland utilization at county level from individual states
• Bottom Up– Layer III: Summary Burn Activity Data
• Burned acres estimates at county level by month from individual states or districts
– Layer IV: Burn Event-based Activity Databases• Activity inventory of daily burn events from permit/tracking
databases

Rangeland EI Steps
• Collect NASS annual rangeland utilization by county
• Apply most specific percent-burned factor available
• Allocate burn activity to month of year• Allocate monthly subtotals to rangeland burning
events• Assign event to specific day of month• Assign event to specific USGS LCC rangeland
pixel in county

WRAP StateRangeland
Acres %Burned
Alaska 6,880 5
Arizona 1,757,314 5
California 13,858,480 5
Colorado 16,772,175 5
Hawaii 852,626 5
Idaho 4,401,716 5
Montana 37,471,835 5
Nevada 4,022,036 5
New Mexico 32,836,861 5
North Dakota 10,984,441 5
Oregon 8,430,687 5
South Dakota 22,025,971 5
Utah 6,575,897 5
Washington 4,629,034 5
Wyoming 30,247,024 5
Rangeland Activity Compilation
Monthly Allocation
0
5
10
15
20
25
1 2 3 4 5 6 7 8 9 10 11 12
Perc
en
t B
urn
ed
Percent Burned

Rangeland Burning Allocation
Month Holiday
January New Year’s Day
July Fourth of July
August Harvesting period
November Thanksgiving
December Christmas
Date Blackout
Spatial Allocation
PlumeClass
Size Range Probability
Packet (tons PM2.5)
1 0 – 1 0.975 0.064
2 1 - 10 0.024 2.202
3 10 - 100 0.0007 16.641
Event Allocation