Randomized delivery paths for secure data transmission in ad hoc network NS2 ( MANET)
47
1 By Arvind Pande M.E Electronics ,MCTS http://arvindpandeblog.blogspot.in http://www.facebook.com/digitalpadm Randomized Delivery Paths for Secure data Transmission in Ad-hoc Network
-
Upload
arvind-pande -
Category
Engineering
-
view
140 -
download
0
Transcript of Randomized delivery paths for secure data transmission in ad hoc network NS2 ( MANET)

1
By
Arvind Pande M.E Electronics ,MCTS
http://arvindpandeblog.blogspot.in
http://www.facebook.com/digitalpadm
Randomized Delivery Paths for Secure data Transmission in Ad-hoc Network

INDEX
2 What is MANET ?
Routing protocols ?
Need of security
Randomize delivery path algorithm ?
Algorithm Comparison Technique?
Network simulator?
Implementation details & Demo ?
Experimental Results
conclusion
References

3
Infrastructure Network: A network with fixed and wired gateways. When a mobile unit goes out of range of one base station, it connects with new base station.
Infrastructure-less (ad hoc) Networks: All nodes of these networks behave as routers and take part in discovery and maintenance of routes to other nodes.
Types of Network

Infrastructure less network
The network’s wireless topology may dynamically change in an unpredictable manner since nodes are free to move.
Information is transmitted in a store-and forward manner using multi hop routing.
4
• A collection of wireless mobile hosts forming a temporary network without the aid of any established infrastructure or centralized administration.
What is MANET ?

5
M3
M2
M4
M1
M5
M6
M7
MANET: Mobile Ad hoc Network
M8
What is MANET ?

Security in mobile ad hoc networks is very important because of
6
the vulnerability of wireless links
lack of a centralized monitoring or management point.
the dynamically changing topology
NEED OF SECURITY

NEED OF SECURITY
The core functionalities of routing is packet forwarding
Received packets from node to node until they reach their final
destination, the routes selected and maintained by the routing
protocol.
can be exploited by malicious nodes to eavesdropping packets in
transit, and then analyze them to obtain confidential and sensitive
information.
7

Routing Protocol
The Routing protocols can be classified as,
Proactive:
when a packet needs to be forwarded, the route is already known.
Table Driven protocols
Reactive:
Determine a route only when there is data to send.
Source Initiated (on demand) protocols
8

Routing Protocol
9
Routing Protocol for MANET
Table-Driven/
Proactive
On-Demand-
driven/Reactive
Distance-
Vector
DSDV
RDSDV
AODV

Routing Protocol
10
Example of DSDV in operation
DESTINATION
NEXT HOP
COST
MH4 MH4 0
MH1 MH2 2
MH2 MH2 1
MH3 MH2 2
MH5 MH6 2
MH6 MH6 1
MH7 MH6 2
MH8 MH6 3
MH3
MH6 MH2
MH1 MH7
MH4
MH8
MH5
Routing Table at
M4

NEED OF SECURITY
The preventive solution to protect information is to encrypt
packets, but data encryption does not prevent malicious nodes
from eavesdropping
it require more processor time to encryption and decryption
process.
Since packets follow multi-hop routes and pass through mobile
nodes, a malicious node can participate in routing, include itself in
routes, and drop all packets it gets to forward.
11

Randomize delivery path algorithm
This protocol is based on DSDV and designed mainly to overcome
Dropping data packets attack caused by malicious nodes.
Security attacks such as DoS (Denial of service)
Resource consumption attack
12

Randomize delivery path algorithm
In Proposed algorithm ,
a randomization process for packet deliveries
In this process,
It randomly picks up a neighboring node as the next hop for the current packet transmission.
The exclusion for the next hop selection avoids transmitting two consecutive packets in the
same link,
The randomized pickup prevents attackers from easily predicting routing paths for the coming
transmitted packets.
13

Routing Table
14 An Example of the Routing Table for the Node N4

Randomize delivery path algorithm
15

Network Simulator -NS2
NS2 components:
Tcl (Tool command language) is open script language which is used to program NS2;
Tk is a development tool of graphical interface which can help users to develop graphical
interface in graphic environment;
OTcl is an object oriented extension based on Tcl/Tk and it has its own class hierarchy;
NS is the core of this software package, and also object-oriented simulator programming with
C++, with OTcl interpreter to be front end;
To observe and analyze the simulation results NS2 provides selectable Xgraph.
For Animation of network ,the component Tool Nam (Network animator).
16

Network Simulator -NS2
flags:
[......]: [
source node ip : port_number
destination node ip (-1 means broadcast) : port_number
ip header ttl
ip of next hop (0 means node 0 or broadcast)
]
Ex.
s 76.0 _98_ AGT --- 1812 cbr 32 [0 0 0 0] ------- [98:0 0:0 32 0]
As Application 0 (port number) on node 98 sent a CBR packet whose ID is 1812 and size is 32
bytes, at time 76.0 second, to application 0 on node 0 with TTL is 32 hops. The next hop is not
decided yet.
17

NS2 Simulation Process
18
NS USER
Extend to
add new
module
recompile NS2
program
OTCL Test
script
Run
NS2
simulatio
n
analyze
of NS2
simulation
end
modify
otcl script
modify
c++
script
Add c++ class modify object properties and
approaches associate otcl class and c++ class variable
bind
Topological definition
parameter set data flow
Analyze
Trace File

How NS works
19

20
1. Tcl script which define a sample wireless network scenario, will find out the
results in trace file for existing routing protocol DSDV which uses shortest
path routing algorithm.
2. We developed new protocol based on DSDV using randomized path delivery
algorithm and find out results for same Otcl script and collect results in trace
file.
(Trace file is a formatted textual record of the process of simulation)
3. Plot & compare graphs for PDR and avg delay ratio, jitter(the variation of
single-trip times between the transmitted packets) using xgraph or
Microsoft excel tool.
NS2 Simulation Process

Algorithm comparison techniques
We will compare algorithms on following performance metrics
1. Packet Delivery Ratio (PDR): It shows how successful a protocol is in delivering
packets from source to destination.
PDR[%] = 𝑅𝑒𝑐𝑒𝑖𝑣𝑒𝑑𝑁1 𝑝𝑎𝑐𝑘𝑒𝑡𝑠
𝑆𝑒𝑛𝑡 𝑝𝑎𝑐𝑘𝑒𝑡𝑠𝑛1
𝑥 100
2. Average End to End delay: This is the average end to end delay of all successfully
transmitted data packets from source to destination.
Avg_end_end_delay = (𝑝𝑎𝑐𝑘𝑒𝑡𝑠𝑒𝑛𝑡𝑇𝑖𝑚𝑒−𝑃𝑎𝑐𝑘𝑒𝑡𝑅𝑒𝑐𝑒𝑖𝑣𝑒𝑇𝑖𝑚𝑒)𝑛𝑖
𝑃𝑎𝑐𝑘𝑒𝑡𝑅𝑒𝑐𝑒𝑖𝑣𝑒𝑑𝑛1
The calculated result will be in the form of trace file and will be plotted with the help
of Microsoft Excel 2007 tool or Xgraph.
21

We find out experimental results on above performance metric in following scenario as
for Random position and random node movement.
We had written tcl script for topologies with 10 to 50 nodes and performance is measured
for DSDV and RDSDV protocol
Results of performance metric are plotted and compared using xgraph tool.
Because of path variation, jitter value is larger for this protocol as compared DSDV
protocol and as increases as number of nodes increases.
PERFORMANCE EVALUATION
22

Network Simulation Parameter
Sr.no Parameters Values
1 Network interface/channel type Wireless
2 Radio-propagation model TwoRayGround
3 Network interface type Phy/ WirelessPhy
4 packet size 512 bytes
5 Interface queue type Queue/DropTail / PriQueue
6 Max packet in IFQ 50
7 Number of mobile Nodes 10, 30, 50, 70, 90, 110
8 Simulation area size 500 x 500 , 1000 x 1000
9 Simulation duration 150 second
10 Transmission range of each node 250 m
11 Mobility model Random
12 Routing protocols RDSDV ,DSDV
23

24
For Recent Technology , inventions , innovation To Download slides, programs, tutorials , assignments and more visit http://arvindpandeblog.blogspot.in http://www.facebook.com/digitalpadm
continue watching..

Scenario 1 Network dimension : 500 x 500 m JITTER VARIATION
Number of
Nodes
Jitter of DSDV
Protocol
Jitter of Randomized
DSDV
30 0.001883 0.002108
50 0.002121 0.004522
70 0.002130 0.003985
90 0.001875 0.005734
110 0.002143 0.003625
0
0.002
0.004
0.006
0.008
0.01
0.012
30 50 70 90 110
JITT
ER
VA
LUES
NUMBER OF NODES
Jitter variation
Jitter of DSDV Protocol
Jitter of Randomized DSDV
Above figure shows the jitter variation for network size 500 X 500 m for nodes 30 to 110.
It shows the jitter values of RDSDV protocol are more than the values of DSDV. Hence the path variation more than existing DSDV protocol.
25
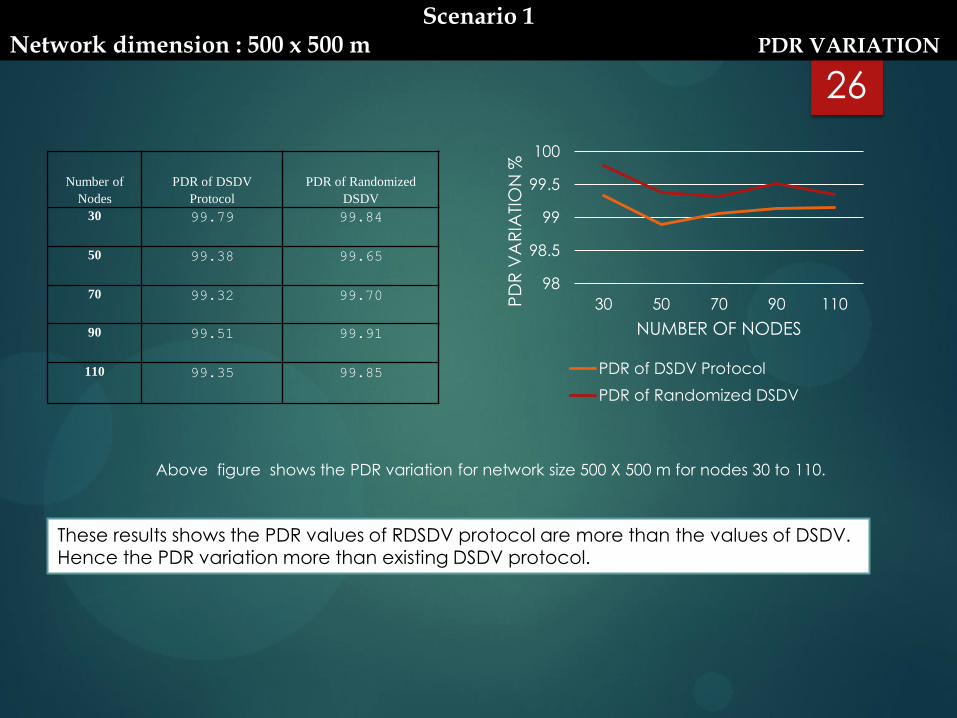
Scenario 1 Network dimension : 500 x 500 m PDR VARIATION
Number of
Nodes
PDR of DSDV
Protocol
PDR of Randomized
DSDV
30 99.79 99.84
50 99.38 99.65
70 99.32 99.70
90 99.51 99.91
110 99.35 99.85
Above figure shows the PDR variation for network size 500 X 500 m for nodes 30 to 110.
These results shows the PDR values of RDSDV protocol are more than the values of DSDV. Hence the PDR variation more than existing DSDV protocol.
98
98.5
99
99.5
100
30 50 70 90 110PD
R V
AR
IATI
ON
%
NUMBER OF NODES
PDR of DSDV Protocol
PDR of Randomized DSDV
26

Scenario 1 Network dimension : 500 x 500 m AVERAGE END-END DELAY VARIATION
Number of
Nodes
AVERAGE
DELAYOF DSDV
Protocol
AVERAGE DELAYof
Randomized DSDV
30 140.14 112.81
50 123.88 126.11
70 152.92 150.33
90 132.98 116.54
110 143.35 118.68
Above figure shows the average end to end delay variation for network size 500 X 500 m for nodes 30 to 110.
These results shows the average end to end delay values of RDSDV protocol are less than the values of DSDV. Hence the average end to end delay variation of RDSDV protocol is
less than existing DSDV protocol
0
50
100
150
200
30 50 70 90 110
Average End to end delay variation (ms)
AVERAGE DELAY OF DSDV Protocol
AVERAGE DELAY of Randomized DSDV
27

Scenario 2 Network Dimension : 800 x 800 m JITTER VARIATION
Number of
Nodes
Jitter of DSDV
Protocol
Jitter of Randomized
DSDV 30 0.0022 0.003835
50 0.0031 0.005409
70 0.0022 0.006259
90 0.0012 0.003178
110 0.0024 0.010487
Above figure shows the jitter variation for network size 800 X 800 m for nodes 30 to 110.
These results shows the jitter values of RDSDV protocol are more than the values of DSDV. Hence the path variation of RDSDV protocol is more than existing DSDV protocol.
0
0.002
0.004
0.006
0.008
0.01
0.012
30 50 70 90 110
JIT
TER
VA
LUES
NUMBER OF NODES
Jitter variation
Jitter of DSDV Protocol
Jitter of Randomized DSDV
28

Scenario 2 Network dimension : 800 x 800 m PDR VARIATION
Number of
Nodes
PDR of DSDV
Protocol
PDR of Randomized
DSDV
30 99.22 99.72
50 98.02 99.8
70 97.91 99.38
90 95.68 97.12
110 98.66 98.55
Above figure shows the PDR variation for network size 800 X 800 m for nodes 30 to 110.
These results shows the PDR values of RDSDV protocol are more than the values of DSDV. Hence the PDR variation of RDSDV protocol is more than existing DSDV protocol for
nodes 50,70 and 90 and nearly equal for 30 and 110 nodes.
93
94
95
96
97
98
99
100
101
30 50 70 90 110
PD
R V
AR
IATI
ON
%
NUMBER OF NODES
PDR Variation %
PDR of DSDV Protocol PDR of Randomized DSDV
29

Scenario 2 Network dimension : 800 x 800 m AVERAGE END-END DELAY VARIATION
Number of
Nodes
AVERAGE
DELAYOF DSDV
Protocol
AVERAGE DELAY of
Randomized DSDV
30 138.24 129.41
50 163.12 127.03
70 158.24 152.17
90 191.92 192.92
110 144.05 133.78
Above figure shows the average end to end delay variation for network size 800 X 800 m for nodes 30 to 110.
. These results shows the average end to end delay values of RDSDV protocol are less than the values of DSDV for 30 to 90 nodes but delay is more for nodes 110.
0
50
100
150
200
250
300
350
400
30 50 70 90 110
Average End to end delay variation
AVERAGE DELAY OF DSDV Protocol
AVERAGE DELAY of Randomized DSDV
30

Scenario 3 Network dimension : 1000 x 1000 m JITTER VARIATION
Number of
Nodes
Jitter of DSDV
Protocol
Jitter of Randomized
DSDV
30 0.002867 0.002997
50 0.002820 0.003928
70 0.002720 0.004069
90 0.003141 0.003969
110 0.003462 0.0168
Above figure shows the jitter variation for network size 1000 X 1000 m for nodes 30 to 110.
.These results shows the jitter values of RDSDV protocol are more than the values of DSDV. Hence the path variation of RDSDV protocol is more than existing DSDV protocol
0
0.002
0.004
0.006
0.008
0.01
0.012
0.014
0.016
0.018
30 50 70 90 110
JIT
TER
VA
LUES
NUMBER OF NODES
Jitter variation
Jitter of DSDV Protocol Jitter of Randomized DSDV
31

Scenario 3 Network dimension : 1000 x 1000 m PDR VARIATION
Number of
Nodes
PDR of DSDV
Protocol
PDR of Randomized
DSDV
30 98.82 99.39
50 99.47 98.17
70 99.91 99.91
90 97.10 96.12
110 97.90 88.84
Above figure shows the PDR variation for network size 1000 X 1000 m for nodes 30 to 110.
These results shows the PDR values of RDSDV protocol are more than the values of DSDV. Hence the PDR variation of RDSDV protocol is more than existing DSDV protocol for
nodes 30.for nodes 50 and 70 it is equal and 90 and less for nodes 90 ,110 nodes.
93
94
95
96
97
98
99
100
101
30 50 70 90 110
PD
R V
AR
IATI
ON
%
NUMBER OF NODES
PDR Variation %
PDR of DSDV Protocol PDR of Randomized DSDV
32

Scenario 3 Network dimension : 1000 x 1000 m AVERAGE END-END DELAY VARIATION
Number of
Nodes
AVERAGE
DELAYOF DSDV
Protocol
AVERAGE DELAY of
Randomized DSDV
30 172.91 151.30
50 203.81 181.16
70 153.44 183.93
90 191.92 170.56
110 267.16 358.27
Above figure shows the average end to end delay variation for network size 1000 X 1000 m for nodes 30 to 110.
These results shows the average end to end delay values of RDSDV protocol are less than the values of DSDV for 30 to 90 nodes but delay is more for nodes 110
0
50
100
150
200
250
300
350
400
30 50 70 90 110
Average end to end delay variation
AVERAGE DELAY OF DSDV Protocol
AVERAGE DELAY of Randomized DSDV
33

Scenario 4 Network dimension : 1000 x 1000 m SPEED 10 m/s JITTER VARIATION
Number of
Nodes
Jitter of DSDV
Protocol
Jitter of Randomized
DSDV
30 0.002867 0.002997
50 0.002820 0.003928
70 0.002720 0.004069
90 0.003141 0.003969
110 0.003462 0.0168
Above figure shows the jitter variation for speed 10 m/s for nodes 30 to 110.
These results shows the jitter values of RDSDV protocol are more than the values of DSDV. Hence the path variation of RDSDV protocol is more than existing DSDV protocol.
0
0.002
0.004
0.006
0.008
0.01
0.012
0.014
0.016
0.018
30 50 70 90 110
JIT
TER
VA
LUES
NUMBER OF NODES
Jitter Variation
Jitter of DSDV Protocol Jitter of Randomized DSDV
Scenario 3 Network dimension : 1000 x 1000 m JITTER VARIATION
34

Scenario 4 Network dimension : 1000 x 1000 m speed 10 m/s PDR VARIATION
Number of
Nodes
PDR of DSDV
Protocol
PDR of Randomized
DSDV
30 98.84 99.19
50 98.15 98.88
70 99.01 99.12
90 98.22 98.56
110 99.85 99.53
Above figure shows the PDR variation for speed 10 m/s for nodes 30 to 110.
These results shows the PDR values of RDSDV protocol are more than the values of DSDV. Hence the PDR variation of RDSDV protocol is more than existing DSDV protocol for
nodes 30 and 90. Nodes 110 it is slightly more than less than DSDV protocol.
97
97.5
98
98.5
99
99.5
100
30 50 70 90 110
PD
R V
AR
IATI
ON
%
NUMBER OF NODES
PDR Variation %
PDR of DSDV Protocol PDR of Randomized DSDV
Scenario 4 Network dimension : 1000 x 1000 m PDR VARIATION
35

Scenario 4 Network dimension : 1000 x 1000 m speed 10 m/s AVERAGE END-END DELAY VARIATION
Number of
Nodes
Average Delay of
DSDV Protocol
Average Delay of
Randomized DSDV
30 140.14 112.81
50 132.88 126.11
70 158.92 150.33
90 132.98 116.54
110 143.35 118.68
Above figure shows the average end to end delay variation for network size 1000 X 1000 m for nodes 30 to 110.
These results shows the average end to end delay values of RDSDV protocol are less than the values of DSDV for 30 to 110 nodes.
0
20
40
60
80
100
120
140
160
180
30 50 70 90 110
Average End to end delay variation %
AVERAGE DELAY OF DSDV Protocol
AVERAGE DELAY of Randomized DSDV
Scenario 3 Network dimension : 1000 x 1000 m AVG END END VARIATION
36
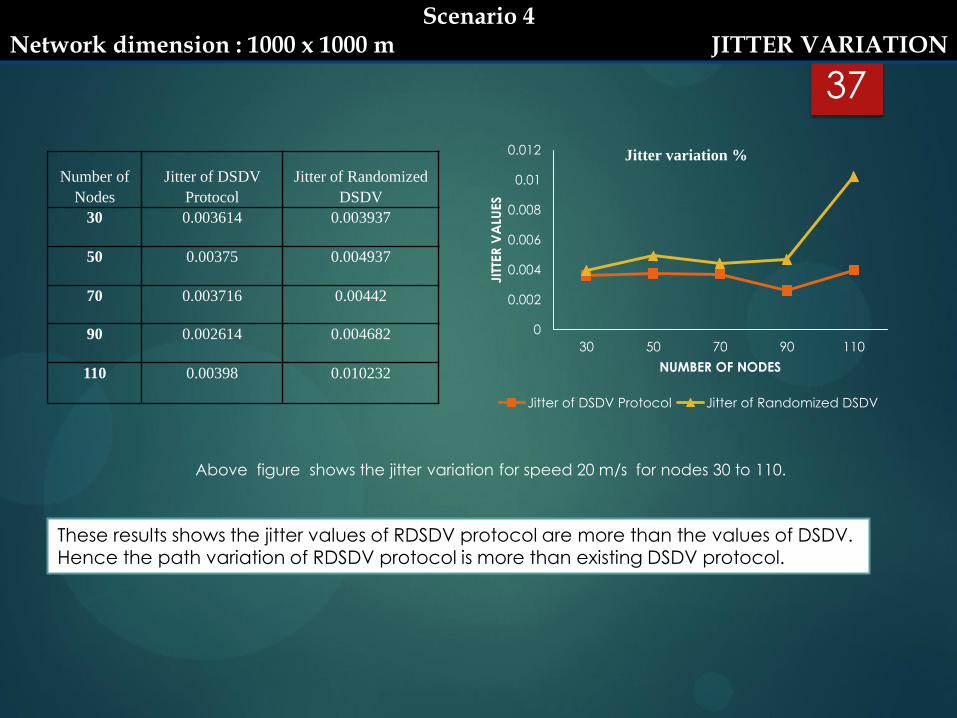
Scenario 5 Network dimension : 1000 x 1000 m SPEED 20 m/s JITTER VARIATION
Number of
Nodes
Jitter of DSDV
Protocol
Jitter of Randomized
DSDV
30 0.003614 0.003937
50 0.00375 0.004937
70 0.003716 0.00442
90 0.002614 0.004682
110 0.00398 0.010232
Above figure shows the jitter variation for speed 20 m/s for nodes 30 to 110.
These results shows the jitter values of RDSDV protocol are more than the values of DSDV. Hence the path variation of RDSDV protocol is more than existing DSDV protocol.
0
0.002
0.004
0.006
0.008
0.01
0.012
30 50 70 90 110
JIT
TER
VA
LUES
NUMBER OF NODES
Jitter variation %
Jitter of DSDV Protocol Jitter of Randomized DSDV
Scenario 4 Network dimension : 1000 x 1000 m JITTER VARIATION
37

Scenario 5 Network dimension : 1000 x 1000 m speed 20 m/s PDR VARIATION
Number of
Nodes
PDR of DSDV
Protocol
PDR of Randomized
DSDV
30 98.07 98.16
50 99.21 99.74
70 98.89 99.32
90 98.29 99.51
110 98.15 99.35
Above figure shows the PDR variation for speed 20 m/s for nodes 30 to 110.
These results shows the PDR values of RDSDV protocol are more than the values of DSDV. Hence the PDR variation of RDSDV protocol is more than existing DSDV protocol for
nodes 50 and 110. For Nodes 30 it is equal to DSDV protocol.
97
97.5
98
98.5
99
99.5
100
30 50 70 90 110
PD
R V
AR
IATI
ON
%
NUMBER OF NODES
PDR variation %
PDR of DSDV Protocol PDR of Randomized DSDV
Scenario 5 Network dimension : 1000 x 1000 m PDR VARIATION
38

Scenario 5 Network dimension : 1000 x 1000 m speed 20 m/s AVERAGE END-END DELAY VARIATION
Number of
Nodes
Average Delay of
DSDV Protocol
Average Delay of
Randomized DSDV
30 172.91 151.30
50 203.81 181.16
70 153.44 183.93
90 191.92 170.56
110 267.16 358.27
Above figure shows the average end to end delay variation for speed 20 m/s for nodes 30 to 110.
These results shows the average end to end delay values of RDSDV protocol are less than the values of DSDV for 30 to 90 nodes. But for nodes 110 it s more than DSDV.
0
50
100
150
200
250
300
350
400
30 50 70 90 110
Average End to end delay variation %
AVERAGE DELAY OF DSDV Protocol
AVERAGE DELAY of Randomized DSDV
Scenario 5 Network dimension : 1000 x 1000 m AVG END END VARIATION
39

Scenario 6 Network dimension : 1000 x 1000 m SPEED 30 m/s JITTER VARIATION
Number of
Nodes
Jitter of DSDV
Protocol
Jitter of Randomized
DSDV
30 0.004014 0.004251
50 0.00315 0.006272
70 0.003636 0.00442
90 0.001902 0.002182
110 0.00338 0.011232
Above figure shows the jitter variation for speed 30 m/s for nodes 30 to 110.
These results shows the jitter values of RDSDV protocol are more than the values of DSDV. Hence the path variation of RDSDV protocol is more than existing DSDV protocol.
0
0.002
0.004
0.006
0.008
0.01
0.012
30 50 70 90 110
JIT
TER
VA
LUES
NUMBER OF NODES
Jitter variation
Jitter of DSDV Protocol Jitter of Randomized DSDV
Scenario 6 Network dimension : 1000 x 1000 m JITTER VARIATION
40

Scenario 6 Network dimension : 1000 x 1000 m speed 30 m/s PDR VARIATION
Number of
Nodes
PDR of DSDV
Protocol
PDR of Randomized
DSDV
30 98.82 99.39
50 99.47 98.17
70 99.91 99.91
90 97.10 96.12
110 97.90 88.84
Above figure shows the PDR variation for speed 30 m/s for nodes 30 to 110.
These results shows the PDR values of RDSDV protocol are more than the values of DSDV. Hence the PDR variation of RDSDV protocol is more than existing DSDV protocol for
nodes 30 70, 110. For Nodes 50 and 90 it is equal to DSDV protocol.
84
86
88
90
92
94
96
98
100
102
30 50 70 90 110
PD
R V
AR
IATI
ON
%
NUMBER OF NODES
PDR Variation %
PDR of DSDV Protocol PDR of Randomized DSDV
Scenario 6 Network dimension : 1000 x 1000 m PDR VARIATION
41

Scenario 6 Network dimension : 1000 x 1000 m speed 30 m/s AVERAGE END-END DELAY VARIATION
Number of
Nodes
Average Delay of
DSDV Protocol
Average Delay Of
Randomized DSDV
30 135.63 126.81
50 139.88 136.11
70 142.16 139.33
90 129.18 166.54
110 138.52 211.68
Above figure shows the average end to end delay variation for speed 30 m/s for nodes 30 to 110.
These results shows the average end to end delay values of RDSDV protocol are less than the values of DSDV for 30 to 70 nodes. For nodes 90 and 110 it is more than DSDV
protocol
0
50
100
150
200
250
30 50 70 90 110
Average End to end delay variation (ms)
AVERAGE DELAY OF DSDV Protocol
AVERAGE DELAY of Randomized DSDV
Scenario 6 Network dimension : 1000 x 1000 m AVG END END DELAY VARIATION
42

Number of Nodes Jitter of DSDV Protocol Jitter of Randomized DSDV
10 0.002326 0.004419
20 0.002079 0.003297
30 0.002049 0.017927
40 0.002118 0.022340
50 0.001920 0.033860
Table 1 show that, the jitter value is greater for randomized DSDV protocol as compared to DSDV protocol
for topologies with different number of nodes.
Figure 1: Jitter values variation for DSDV and R-DSDV protocol
Table 1: Jitter value variation under Random Movement
43

Number of Nodes PDR (%) End to End Delay (ms)
DSDV R-DSDV DSDV R-DSDV
10 99.70 98.41 131.72 137.89
20 99.89 99.55 145.897 138.13
30 99.67 98.69 128.168 140.31
40 99.43 99.31 146.926 149.69
50 98.56 98.76 135.226 120.90
Figure 2: PDR, End to End Delay values variation for DSDV and R-DSDV protocol
Table 2: PDR & End To End Delay Variation under Random Node Movement
Table 2 shows PDR, End to End Delay values variation for DSDV and R-DSDV protocol
44

To protect information and resources from attacks and misbehavior. We have proposed randomized delivery path protocol.
In order to minimize the probability that packets are eavesdropped over a specific link, a randomization process for packet deliveries.
In this process, randomly picks up a neighboring node as the next hop for the current packet transmission.
The exclusion for the next hop selection avoids transmitting two consecutive packets in the same link, and the randomized pickup prevents attackers from easily predicting routing paths for the coming transmitted packets.
Experimental results shows that jitter value is greater and increases as number of nodes increases hence prove that each packet transmitted at different path to destination.
The PDR and End to End Delay metrics of R-DSDV protocol are closer to the metrics for DSDV protocol under same topology.
We conclude that security attacks can be avoided by this process without reducing the performance.
CONCLUSION
45

46 Chin-Fu Kuo, Member, IEEE, Ai-Chun Pang, Member, IEEE, and Sheng-Kun Chan Dynamic Routing with Security Considerations IEEE TRANSACTIONS ON PARALLEL AND DISTRIBUTED SYSTEMS, VOL. 20, NO. 1,
Shrikant Upadhyay and Aditi Kumari “Comparison and performance analysis of reactive type AODV and proactive type DSDV routing protocol for wireless mobile ad-hoc network, using NS-2 simulator” JOURNAL OF ENGINEERING AND COMPUTER INNOVATIONS Vol. 2(10), pp. 36-47, March 2012 Nitish pathak, neelam sharma “Mobile ad-hoc network: optimization of routing algorithms for mobility model” INTERNATIONAL JOURNAL OF REVIEWS IN COMPUTING 10th april 2012. vol. 9 A Survey of Secure Mobile Ad Hoc Routing Protocols Loay Abusalah, Ashfaq Khokhar, and Mohsen
Guizani IEEE COMMUNICATIONS SURVEYS & TUTORIALS, VOL. 10, NO. 4, FOURTH QUARTER 2008 G. Apostolopoulos, V. Peris, P. Pradhan, and D. Saha, “Securing Electronic Commerce: Reducing the
SSL Overhead,”IEEE Network, 2000. S. Bohacek, J.P. Hespanha, K. Obraczka, J. Lee, and C. Lim, “Enhancing Security via Stochastic Routing,” Proc. 11th Int’l Conf.Computer Comm. and Networks (ICCCN), 2002.
D. Collins, Carrier Grade Voice over IP. McGraw-Hill, 2003.P. Papadimitratos and Z.J. Haas, “Secure
Routing for Mobile Ad Hoc Networks,” in Proceedings of the SCS Communication Networks and Distributed Systems Modeling and Simulation Conference (CNDS 2002), San Antonio, TX, Jan. 27-31, 2002 FreeS/WAN, http://www.freeswan.org, 2008.
Gojmerac, T. Ziegler, F. Ricciato, and P. Reichl, “Adaptive Multipath Routing for Dynamic Traffic Engineering,” Proc. IEEE Global Telecommunications Conf. (GLOBECOM), 2003.

47
For Recent Technology , inventions , innovation To Download slides, programs, tutorials , assignments and more visit http://arvindpandeblog.blogspot.in http://www.facebook.com/digitalpadm
Thanks for watching