Ramp Signaling Design: Bridge Between Planning and ... · Ramp Signaling Design: Bridge Between...
41
Ramp Signaling Design: Bridge Between Planning and Implementation Alex Zhu P.E., PhD., Jillian Scholler P.E.
Transcript of Ramp Signaling Design: Bridge Between Planning and ... · Ramp Signaling Design: Bridge Between...

Ramp Signaling Design:Bridge Between Planning and
ImplementationAlex Zhu P.E., PhD., Jillian Scholler P.E.

Objectives Provide all attendees a better understanding of the process from planning to design and implementation.
The major goals include:
Understanding the Ramp Signal System Warrant Analysis
Understanding the Ramp Signal System Design Process
Understanding Ramp Signal System Operations

Outline Introduction
Overview of Ramp Signaling System (RSS) Deployment
RSS in FL
RSS Project Development
RSS Planning
RSS Design
RSS Implementation
RSS Operations
Lessons learned

IntroductionWhat is Ramp Metering Red/Green traffic signals at
freeway on-ramps
Control the rate at which vehicles enter the freeway
Regulate traffic flow
Benefits Reduce Crashes
Break up Platoons
Divert Traffic
Increase Vehicle Throughput
Cost-Effective

Overview of Deployment
Fort Lauderdale

Ramp Signaling in FL CO –RSS Warrant Study (2012); TSM&O Strategic Plan (2013);
RSS Implementation Guide (2017);
D4 - I-95 Managed Lane Phase 3 (54 RS) • Phase 3A (29 RS)– design/construction, Operation 2019• Phase 3B (15 RS)– design, Operation 2023• Phase 3C (10 RS)– Procurement, Operation 2024
D5 - I-4 Managed Lanes (11 RS) - under construction, Operation 2021
D6 - I-95 Managed Lane Phase 1 (22 RS) - Operation since 2009
SR-826 Managed Lanes (19 RS) – construction, Operation 2019
D7 - TBX is evaluating RSS feasibility
FTE – Completed evaluation and future deployment

RSS Project Development

RSS Plan - Warrant Analysis
• The FDOT technical report titled “Integrated Database and Analysis System for the Evaluation of Freeway Corridors for Potential Ramp Signaling” provides an outline for Ramp Metering Warrant Analysis.
• This recommends seven warrants to identify potential locations for ramp metering. Which can be grouped into three general categories:
Traffic Data
(1,2,3,&4)
Roadway Geometry
(5&6)
Crash Data
(7)

RSS Plan – Data Collection
Geometry
• Ramp Storage
• Acceleration Distance
Traffic Data
• ML Volume & Speed
• Ramp Volume Crash Data
• Crash Rate

RSS Plan - Warrant Analysis
• Warrant 1 – Mainline Peak Period Volume > 1200 vphpl.
• Warrant 2 – Mainline Peak Period Speed < 50 mph
• Warrant 3 – Ramp Volume• Single lane Ramp: Peak hour on-ramp volume is 240 to 1,200 vph.
• Multi- lane Ramp: Peak hour onramp volume is 400 to 1,700 vph.
• Warrant 4 – Total Mainline and Ramp Volume• Condition 1: The sum of peak hour mainline volume and ramp volume
exceeds specific threshold values.
• Condition 2: Peak hour volume of the rightmost mainline lane exceeds 2,050 vph.

Warrant Analysis
• Warrant 5 – Ramp Storage is greater than Queue Length
Where,
L = the required single-lane storage distance in feet, and
V = the peak hour ramp demand in vph.
• Warrant 6 – Acceleration Distance is longer than the safe mergingDistance
Where,
L = the required minimum acceleration distance in feet, and
V = the freeway mainline prevailing speed in mph.

Warrant Analysis
• Warrant 7 – Crash Rate of facility of roadway segment is greater than 80 crashes per hundred million vehicle miles (RHMVM
Where,
RHMVM = Crash rate per hundred million vehicle-miles,
AADT = Average Annual Daily Traffic on the facility, and
Length = Length of roadway segment (miles).

RSS Plan - Warrant Analysis

RSS Design - Component
Controller
Signal
Detectors
Cabinet
Flashers
Signing
CCTV
TMC
Power
Communication

RSS Design – Cabinet Cabinet Components
• Controller
• UPS/Battery
• Detector Card
• Load Switch
• Communication (Layer 2 Switch, FOC patch panel)
• Power Panel
• CCTV Device (Media Convertor, decoder, etc.)
Cabinet Design Concerns• Typically dedicated and ground mounted
• Placement - Ensure maintenance accessibility
• Orientation – Ensure view of Signal head, Queue, detector and ramp operations
• Safety – behind Guardrail or Barrier

RSS Design – CCTV
Dedicated per Ramp Signal
HD with PTZ function
100% coverage of entire ramp, signal head, queue and adjacent intersection
Typically sharing cabinet with RSS
Preset views in SunGuide
Avoid obstruction from Landscaping

RSS Design – Signal
Two/Three Section Signal
Located next to Stop bar
Two Signals Per Pole • Top for Coming Vehicles
• Bottom for Stopping Vehicles
Type of Ramp
• One Lane – Type 1 signal pole
• Two Lane - Type 1 pole both sides
• Three Lane- Mast Arm or pole
• With HOV Preferential Lane

RSS Design – Signal

RSS Design – Signal

RSS Design – Signal

RSS Design – Signal

RSS Design – Detectors Freeway Detection
• Upstream detector – MVDS, configurable, existing or new
• Downstream detector – MVDS, configurable, existing or new, depending on bottleneck locations
• Mainline – MVDS, immediate downstream of gore, fed to controller directly
Ramp Detection• Demand – typically loop, presence detection
Dual loops 6’ from Stop Bar
• Passage – typically loop, presence detection Dual loops 8’ from Stop Bar
• Queue loop – typically dual loops, queue detection < 50 ft from intersection, if ramp <1320 ft,
< 1200 ft from signal ,if ramp > 1320 ft
• Intermediate Loop – Optional
• Bridge ramp – MVDS or video, no loop
• Vehicle classification

RSS Design –Warning Signs Flasher Beacon
• Located prior to ramp entrance for each movement
• Accompanied by Sign W3-8
• Flashes when RSS is on - warning
• Divert Traffic
Advanced Sign• W3-4/W 3-7
• Optional
• Located prior to ramp entrance
Advanced warning for signal• W3-3
• Optional
• Located on both side of ramp

RSS Design – Stop Bar and Regulatory Signs
Stop Bar – must be properly located• Meet acceleration length requirement
• Provide adequate storage on ramp
Stop Bar Sign• R10-6x
• Mounted on signal pole
X Vehicles Per Green• R10-28/R10-29
• Flow control strategy determined by ramp volume analysis
• Post mounted adjacent to signal pole

RSS Design – Signs

RSS Design – One Lane Ramp

RSS Design – Two Lane Ramp

RSS Design – Two Lane Merge Ramp

RSS Design – One Lane Loop Ramp

RSS Implementation - Public Outreach
Start Early - End of Feasibility Study
Continue through Operational Start up
Focus Groups • Local Motorists
• Local Elected Officials
• Neighborhood/Community Associations
• Media
Tactics
• Brochures/Advertisements
• Public Meeting & Mail-outs
• TV/Radio/Newspaper interviews
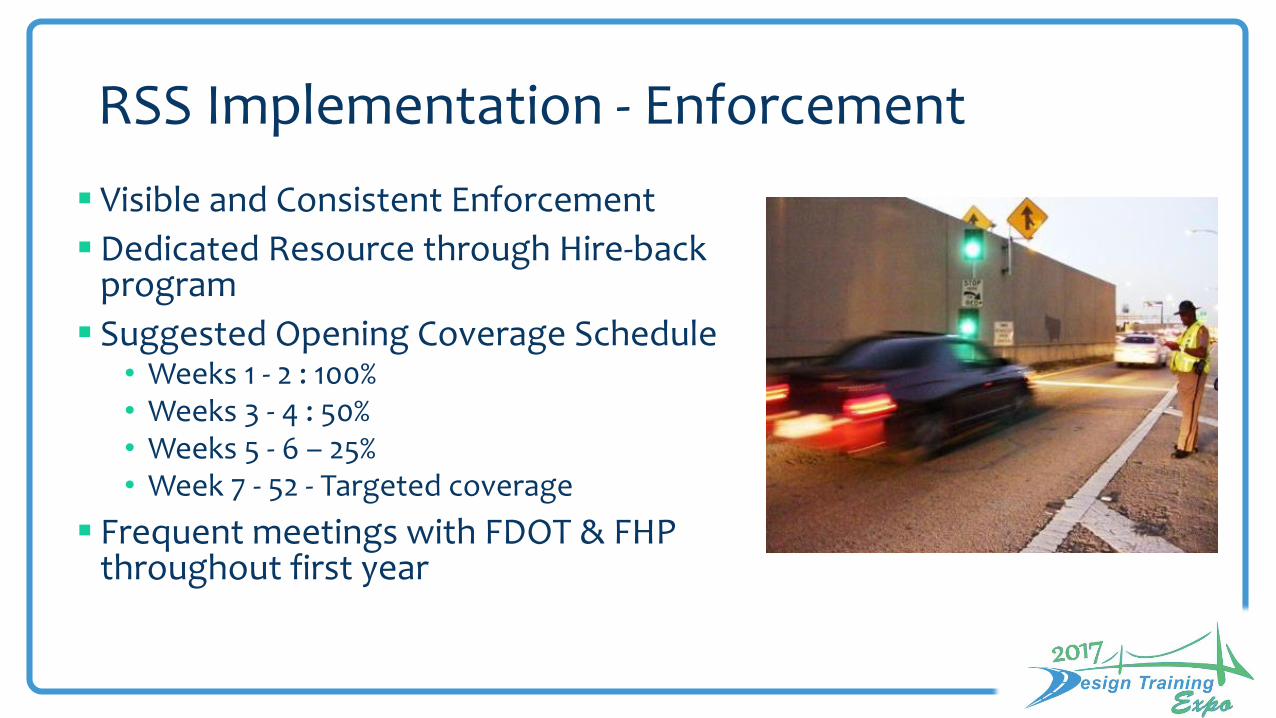
RSS Implementation - Enforcement
Visible and Consistent Enforcement
Dedicated Resource through Hire-back program
Suggested Opening Coverage Schedule• Weeks 1 - 2 : 100%• Weeks 3 - 4 : 50%• Weeks 5 - 6 – 25%• Week 7 - 52 - Targeted coverage
Frequent meetings with FDOT & FHP throughout first year

RSS Implementation - TMC Readiness
Software development acquisition
Hardware Acquisition
SOG Development
Operations Staff Training
Maintenance Staff Training
Workstation Configuration & Set up

RSS Operation – Operation Mode
Pre-Timed Traffic Responsive
Local • No real-time data is needed• Requires periodic manual update• Appropriate for localized issues• Less effective for non-static conditions
• Vehicle detection is needed• Appropriate for localized issues• Higher capital and maintenance costs
than pre-timed systems• Greater benefits
System-Wide • Appropriate for widespread issues• Vehicle detection is not needed• Rarely used, as compared to system-wide
traffic responsive systems
• Vehicle detection is needed• Appropriate for localized issues• Most useful for corridor, system-wide
applications• Greatest capital and maintenance costs,
but yields most benefits

RSS Operation – Metering Rate Calculation
Rate is calculated as the # of vehicles allowed to enter the freeway every minute. For example: 10 Vehicles per Minute (6 sec cycle length)• Green Time: 1.5 Sec (fixed)• Red Time: Cycle Length - Green Time; Minimum 1 Sec
The algorithm calculates Rate based on real time traffic
Vm - Speed from MainlineOm- Occupancy from MainlineOr - Occupancy from Ramp
Metering Rate Calculated based on one-minute moving average

RSS Operation – SunGuide RSS Module
Manual On/Off
Local Traffic Responsive
Local Time of Day
Uses Fuzzy logic to calculate metering Rates
Compatible with 170 Controllers • 2070 compatibility currently
under development

RSS Operation – D4 Operations Plan Fully Automated Activation/Deactivation Process
Traffic Data Triggered SunGuide Event Creation Triggered
Minimal Operator interaction required Freight Bypass

RSS Operation – D4 Operations Plan Strategic Ramp Grouping
• Ramp Volume and Geometry
• Incident severity
• Time of Day / Day of Week

RSS Operation – D4 Operations Plan Strategic Ramp Grouping
• Ramp Volume and Geometry
• Incident severity
• Time of Day / Day of Week

RSS Operation – D4 Operations Plan Strategic Ramp Grouping
• Ramp Volume and Geometry
• Incident severity
• Time of Day / Day of Week

Lessons Learned Corridor implementation vs. per ramp
Warrant study reflects individual ramp issue – impact design, operation process
Storage/acceleration
Enforcement (learning curve for motorists)
PIO
ConOps readiness
Dedicated CCTV (view)
Conflict with Landscaping
Detector type (presence vs. data collection) and placement (queue)
Design for maintenance concern (cabinet location, accessibility, reduce lane closure)
Technology evolution (controller/software update)

Alex Zhu, PhD, PEITS EngineerHDR3250 W. Commercial Blvd., Suite 100Fort Lauderdale, FL [email protected]
Jillian Scholler, PEManaged Lanes CoordinatorAECOMSMART SunGuide RTMC2300 West Commercial Blvd.Fort Lauderdale, FL [email protected]
Questions?