Ramp Metering Design and Evaluation using Micro-simulation
76
ISSN 1055-1425 January 2009 This work was performed as part of the California PATH Program of the University of California, in cooperation with the State of California Business, Transportation, and Housing Agency, Department of Transportation, and the United States Department of Transportation, Federal Highway Administration. The contents of this report reflect the views of the authors who are responsible for the facts and the accuracy of the data presented herein. The contents do not necessarily reflect the official views or policies of the State of California. This report does not constitute a standard, specification, or regulation. Final Report for Task Order 5305 CALIFORNIA PATH PROGRAM INSTITUTE OF TRANSPORTATION STUDIES UNIVERSITY OF CALIFORNIA, BERKELEY Integrated Ramp Metering Design and Evaluation Platform with Paramics UCB-ITS-PRR-2009-10 California PATH Research Report Lianyu Chu, Will Recker, Guizhen Yu CALIFORNIA PARTNERS FOR ADVANCED TRANSIT AND HIGHWAYS
Transcript of Ramp Metering Design and Evaluation using Micro-simulation

ISSN 1055-1425
January 2009
This work was performed as part of the California PATH Program of the University of California, in cooperation with the State of California Business, Transportation, and Housing Agency, Department of Transportation, and the United States Department of Transportation, Federal Highway Administration.
The contents of this report reflect the views of the authors who are responsible for the facts and the accuracy of the data presented herein. The contents do not necessarily reflect the official views or policies of the State of California. This report does not constitute a standard, specification, or regulation.
Final Report for Task Order 5305
CALIFORNIA PATH PROGRAMINSTITUTE OF TRANSPORTATION STUDIESUNIVERSITY OF CALIFORNIA, BERKELEY
Integrated Ramp Metering Design and Evaluation Platform with Paramics
UCB-ITS-PRR-2009-10California PATH Research Report
Lianyu Chu, Will Recker, Guizhen Yu
CALIFORNIA PARTNERS FOR ADVANCED TRANSIT AND HIGHWAYS


Integrated Ramp Metering Design and Evaluation Platform with Paramics
Lianyu Chu
California Center for Innovative Transportation (CCIT) University of California Berkeley
Will Recker
Institute of Transportation Studies University of California, Irvine
Guizhen Yu
School of Transportation Science and Engineering Beihang University
Draft Final Report for PATH Task Order 5305

ii

Abstract Ramp metering has been recognized as an effective freeway management strategy to either avoid or ameliorate freeway traffic congestion by limiting access to the freeway. California has applied ramp metering widely in major metropolitan areas. Currently, California has three major ramp metering systems: San Diego Ramp Metering System (SDRMS), Semi-Actuated Traffic Management System (SATMS), and Traffic Operations System (TOS). Although the ramp metering algorithms that underlay these systems are based on relatively simple theoretical concepts, these real-world ramp metering systems are significantly complicated by the need to tailor their deployment to handle a variety of conditions. Keywords: Ramp Metering, Paramics
iii

iv
Table of Contents Executive Summary ...................................................................................................... vii
Acknowledgements ................................................................................................... ix
Chapter 1 Introduction ............................................................................................... 1 1.1 Ramp metering overview ...................................................................................... 1 1.2 Ramp metering deployment in CA ....................................................................... 2 1.3 Problem and solution ............................................................................................ 3 1.4 Organization of the report ..................................................................................... 5
Chapter 2 System Framework .................................................................................... 6
Chapter 3 Detector requirement for ramp metering in California ............................. 7
Chapter 4 SATMS ..................................................................................................... 9 4.1 Introduction ........................................................................................................... 9 4.2 SATMS logic overview ........................................................................................ 9 4.3 Algorithm Description ........................................................................................ 10
Chapter 5 SDRMS ................................................................................................... 16 5.1 Introduction ......................................................................................................... 16 5.2 SDRMS logic overview ...................................................................................... 16 5.3 Algorithm Description ........................................................................................ 17
Chapter 6 TOS ......................................................................................................... 26 6.1 Introduction ......................................................................................................... 26 6.2 TOS logic overview ............................................................................................ 26 6.3. Algorithm Description ....................................................................................... 27
Chapter 7 Algorithms in IRMP ................................................................................ 36 7.1 Comparison of SDRMS, TOS and SATMS ....................................................... 36 7.2 Other ramp metering algorithms ......................................................................... 39
Chapter 8 IRMP implementation ............................................................................. 42 8.1 Introduction ......................................................................................................... 42 8.2 ParamicsNET ...................................................................................................... 43 8.3 ParamicsNET Plugin Manager ........................................................................... 44 8.4 Various Plugins ................................................................................................... 45 8.5 Integrated Ramp Metering Platform (IRMP) ...................................................... 45
Chapter 9 IRMP user guide ..................................................................................... 46 9.1 Installation........................................................................................................... 46 9.2 How IRMP works ............................................................................................... 48 9.3 Error control feature ............................................................................................ 60
Chapter 10 Conclusions and future work ................................................................ 62
References ................................................................................................................ 63
v

vi

Executive Summary Ramp metering has been recognized as an effective freeway management strategy to either avoid or ameliorate freeway traffic congestion by limiting access to the freeway. California has applied ramp metering widely in major metropolitan areas. Currently, California has three major ramp metering systems: San Diego Ramp Metering System (SDRMS), Semi-Actuated Traffic Management System (SATMS), and Traffic Operations System (TOS). Although the ramp metering algorithms that underlay these systems are based on relatively simple theoretical concepts, these real-world ramp metering systems are significantly complicated by the need to tailor their deployment to handle a variety of conditions. With the advancement of computer technologies and traffic modeling capabilities, microscopic simulation modeling has become an increasingly popular and effective tool for analyzing a wide variety of dynamic problems not amenable to study by other means. There is a need to emulate these systems in microscopic simulation models. The objective of the project is to develop a user-friendly Integrated Ramp Metering design and evaluation Platform (IRMP) that utilizes the Paramics simulator. IRMP is implemented as a Paramics plugin tool that allows users to quickly configure and test ramp metering in the Paramics traffic simulator. IRMP utilizes a user friendly GUI, which is implemented using the latest C# and .NET technology, to make the configuration and testing of ramp metering more intuitive. The platform incorporates the existing metering systems deployed in California and a suite of performance measures for various evaluation studies. IRMP has two major functions: ramp metering design and evaluation. It can be used by Paramics modelers to model the existing ramp metering control in their simulation models. It can also be used by traffic engineers both to gain familiarity with different metering algorithms and to evaluate various ramp metering settings.
vii

viii

Acknowledgements The research was supported, in part, by funding from the Division of Research Innovation (DRI), California Department of Transportation (Caltrans); their support is gratefully acknowledged. This is a project that involves many people’s efforts and help. The authors would like to thank Steve Hague of Caltrans Headquarter and Tony Blade of Caltrans District 11 who provided documents and sample metering charts for SDRMS. The authors would like to thank Tadeo Lau of District 7 who, along with Steve Hague provided documents for SATMS and answered many technical questions about SATMS. The authors would like to thank Sean Coughlin, Adrian Levy, Mehran Lajevardi, and Larry Hall from District 4. Sean Coughlin provided TOS documents, source code, and answers to many technical questions. Mehran Lajevardi, Adrian Levy, and Larry Hall provided sample metering charts and their practices on how to setup metering. Mehran also showed the authors the real controllers and ramp metering operation in the field. The authors would like to thank Herasmo Iniguez of Caltrans Headquarters for providing various ramp metering documents and the final report of Universal Ramp Metering System (URMS). He also provided his insights on ramp metering control. The authors would like to thank Ravi Chodavarapu and Blake La Pierre who are Computer Science undergraduate students and served as programmers to design and develop ParamicsNET and IRMP. We also would like to thank Alber Chung who helped prepare some ramp metering documents for this report. The authors would like to thank Jeff Ban, an assistant professor at RPI and a past assistant research engineer at CCIT. He reverse engineered the SATMS V1.0 machine code and developed the draft version of the SATMS plugin.
ix

x

Chapter 1 Introduction
1.1 Ramp metering overview Ramp metering has been recognized as an effective freeway management strategy to avoid or ameliorate freeway traffic congestion by limiting access to the freeway. California has widely applied ramp metering in major metropolitan areas. The Caltrans Ramp Meter Design Manual has the following statement: “Caltrans is committed to using ramp metering as an effective traffic management strategy to maintain an efficient freeway system and protect the investment made in constructing freeways by keeping them operating at or near capacity. Ramp Metering is an integral part of the Traffic Operations Program Strategic Plan which outlines the program’s commitment to focus first on implementing operational strategies to reduce congestion and increase safety on California’s state highway system.” As the major traffic control strategy of the freeway traffic management agency, the benefits of ramp metering are:
(1) Restrict the total flow entering the freeway by temporarily storing some traffic on the ramps in order to ensure that mainline freeway is operated within the freeway's capacity and prevent congestion.
(2) Break up platoons of vehicles entering freeways in order for vehicles from onramps to merge more easily and provide safety.
(3) Divert some vehicles to other routes due to the waiting time and thus reduce demand going to the freeway.
A variety of ramp metering algorithms have been proposed based on approaches that include: optimization techniques (Chen et al. 1974), automatic control (Papageorgiou et al. 1991), optimal control theory (Zhang et al. 1996) or artificial intelligence methods (Taylor et al. 1998 and Zhang et al. 1997). Although there have been significant theoretical developments in formulating ramp-metering policies, implementations based on such developments have been slow in coming. Current practical ramp metering algorithms can be divided into two categories: pre-timed (fixed-time, time-of-day) control and traffic-responsive (adaptive) control. Pre-timed control systems utilize Time-of-Day (TOD) metering rates that are pre-determined to best manage “expected” conditions based on an analysis of historical data. Traffic-responsive metering algorithms dynamically modify metering rates based on real-time traffic data, conceptually allowing for better response to variations in traffic conditions. Traffic responsive metering control can be further classified into local and coordinated traffic-responsive control. Both need traffic sensors to provide data for operation. Local traffic responsive control determines metering rates based on current prevailing traffic conditions in the vicinity of the ramp. Coordinated traffic responsive control determines
1

metering rates based on the prevailing traffic conditions of an extended section of roadway. Most meters deployed in the field are under local traffic-responsive control. Examples of local traffic responsive control algorithms include: demand-capacity control, occupancy control, and feedback control. Demand-capacity control determines metering rates based on real-time comparisons of mainline upstream traffic volume against downstream capacity. Occupancy control determines metering rates based on the measured mainline occupancy data and an occupancy-metering rate lookup table, prepared based on historical traffic data. An example of typical feedback control is ALINEA, which maximizes the mainline throughput by maintaining a desired occupancy on the downstream mainline freeway. A set of ALINEA algorithms have been further developed in order to work with different real-world detector configurations and different input data (Smaragdis and Papageorgiou, 2003). A few coordinated traffic responsive control algorithms have been deployed recently in the field. These strategies seek to optimize a multiple-ramp section of a highway, often with the control of flow through a bottleneck as the ultimate goal. Notable instances of coordinated ramp-metering systems include ZONE in Minneapolis / St. Paul, Minnesota (Lau, 1997), BOTTLENECK in Seattle, Washington (Jacobsen et al. 1989), and SWARM in Los Angeles and Orange County, California (Paesani et al. 1997).
1.2 Ramp metering deployment in CA The California Department of Transportation (Caltrans) has employed ramp-metering operations since its initial deployment in 1968 in Chula Vista. Currently, there are three major ramp metering systems, including:
• San Diego Ramp Metering System (SDRMS), deployed in Sacramento, Fresno, San Bernardino and Riverside, and San Diego areas (i.e. Caltrans Districts 3, 6, 8, and 11)
• Semi-Actuated Traffic Management System (SATMS), deployed in Los Angeles and Orange County (i.e. Caltrans Districts 7 and 12)
• Traffic Operations System (TOS), deployed in the Bay Area (i.e. Caltrans District 4)
The metering algorithms in these systems are local traffic responsive control operated according to real-time detector data and pre-set metering plans. SATMS is based on demand capacity control. Both SDRMS and TOS are based on occupancy control. Since the late 1990s, Caltrans has started testing System-wide Adaptive Ramp Metering (SWARM), developed by NET (parent company Delcan) (NET, 1996, NET, 2000, and NET, 2003). SWARM is a central ramp metering algorithm embedded in Caltrans’ TMC software Advanced Transportation Management System (ATMS) and operated based on the SATMS ramp metering system. SWARM has four algorithms:
2

(1) SWARM 2a: Point detector based algorithm
(2) SWARM 2b: Segment wide algorithm
(3) SWARM 2c: Mainline detector based algorithm
(4) SWARM 1: System wide algorithm A meter operated under SWARM can be set up to use either one of these or a combination of them; in all cases, operation is constrained by the local SATMS ramp metering control setup, such as queue override strategy. SWARM was first tested in the late 1990s in Orange County with largely unsatisfactory results. Since 2000, it has been under continuous evaluation by Los Angeles County. A SWARM system has been deployed in the Portland area in Oregon. An evaluation study did not find that it had better performance than the previous fixed-time control. Currently, SWARM is still under development and refinement by Delcan; hence, we did not include SWARM in this study. Another ramp metering effort initiated by Caltrans in 1998 is the Universal Ramp Metering System (URMS) Program. URMS aims to be run on Type 2070 controllers and can simulate both SATMS and SDRMS at the data communication level Powell, 2003). Thus, from the control logic perspective, URMS does not do anything more than SDRMS and SATMS.
1.3 Problem and solution As an effective freeway congestion management strategy, an increasing number of traffic agencies are planning to apply ramp metering. Although ramp metering algorithms themselves are relatively simple, real-world ramp metering systems are more complicated due to the need to handle various conditions. For example, SDRMS is very complicated with respect to the preparation of the metering plans and associated parameters. The details of these systems are not widely known. There is a need to emulate these systems in microscopic simulation models. With the advancement of computer technologies and traffic modeling capabilities, microscopic simulation modeling has become an increasingly popular and effective tool for analyzing a wide variety of dynamic problems not amendable to study by other means. Microscopic traffic simulators offer much more detailed descriptions of both road and traffic characteristics (acceleration lanes, merging, lane-changing, etc.) that are critical to ramp metering, micro-simulation is deemed more appropriate to evaluate ramp metering control. There have been a number of simulation studies on ramp metering algorithms; examples of such have used INTEGRATION and CORSIM for testing time-of-day control (Hellinga et al, 1995), METANET and CORSIM for testing ALINEA and METALINE algorithms (Papageorgiou et al, 1991, Oh et al, 2001), MITSIM for testing ALINEA and FLOW algorithms (Hasan et al, 2002), and PARAMICS for evaluating ALINEA, BOTTLENECK, and ZONE algorithm (Chu et al, 2003, 2004).
3

There are a number of available microscopic traffic simulation models, including Aimsun, Paramics, TransModeler and Vissim. Comparing all them, Paramics is the most appropriate one for this study due to its powerful Application Programming Interface (API) capabilities. The objective of the project is to develop a user-friendly ramp metering design and evaluation platform that incorporates all of the metering algorithms currently used in California and provides a comprehensive set of performance measures for evaluation studies with Paramics simulator. Traffic control affects the traffic system. Some improper metering designs may actually negatively influence the freeway traffic, such as by creating new bottlenecks, bringing more delays to some on-ramps, etc. Studies show that significant benefits can be obtained from ramp metering only when implemented correctly and operated effectively (Pearce, 2000), raising questions related to whether the existing meters are operated correctly or efficiently and how traffic engineers evaluate and optimize metering operations. Based on the information gathered from traffic engineers in District 4, 8, 11, and 12 of Caltrans, it is found that:
• There is no standard method for engineers to follow to obtain the metering plan they apply to a specific location.
• All Districts have limited number of traffic engineers to work on ramp metering.
• Caltrans staff have limited resources to re-evaluate and improve the metering operation. However, the original metering design seldom, if ever, remains optimal with the passing of time due to the changes in the traffic pattern.
• Some Districts (e.g., District 12) change a meter’s plan when they obtain complaints regarding the queue backup to the arterials.
• Some Districts (e.g., District 4) evaluate ramp metering performance by performing tach runs before and after metering the ramp.
• Some engineers experience difficulty in preparing the parameters and timing plan for the metering algorithm in use in their respective districts.
Therefore, there is a need to help traffic engineers understand the metering algorithms, design or prepare a better rate based on comprehensive data analysis, and evaluate the metering operation in the laboratory level. The tool developed herein is designed to meet this need. Moreover, the tool can be used by the Paramics modelers to model the existing ramp metering control in their simulation models. It can also be used by traffic engineers to become familiar with different metering algorithms and evaluate various ramp metering settings.
4

5
1.4 Organization of the report This report is organized as follows. Chapter 2 introduces the framework of the Integrated Ramp Metering Platform (IRMP). Chapter 3 summarizes the detector placement in California for ramp metering application. Chapter 4 through 6 explains SATMS, SDRMS, and TOS ramp metering systems respectively. Chapter 7 summarizes and compares these existing ramp metering systems and also introduces those potential metering algorithms such as ALINEA and SWARM. Chapter 8 describes how to implement IRMP. Chapter 9 serves as the user manual for IRMP. Chapter 10 concludes the report.

Chapter 2 System Framework The Integrated Ramp Metering Platform (IRMP) is developed to provide a ramp metering design and evaluation tool. IRMP is implemented using the latest C# programming language with .NET framework, which allows the user to create a complicated Graphical User Interface (GUI). The design tool is used to setup a meter and display collected data. The evaluation tool is used to evaluate the performance of the selected algorithm. These tools are supported by a set of Paramics plugins, which are developed based on a hierarchical framework, as shown in Figure 2.1. The basic modules are developed based on the provided API functions from Paramics. These basic modules include three major plugins: performance measures, detector data aggregator, and ramp metering signal control. The performance measures plugin includes all necessary performance measures that are needed to evaluate various aspects of ramp metering. The detector data aggregator plugin serves as a data collection server to collect aggregated detector data within a specified time interval. The ramp metering signal control plugin is employed to operate metering control signal, based on the metering rate calculated by ramp metering algorithms. Ramp metering algorithms, including SDRMS, SATMS and TOS, are developed as the advanced modules in IRMP. At each certain time period (which is different for different metering systems), these algorithms obtain detector data from the Detector Data Aggregator plugin and then calculate the metering rate for the next control interval. The new metering rate is executed through the Ramp Metering Signal Control plugin.
Paramics Simulator
Detector Data Aggregator
Performance Measures
Ramp Metering Signal Control
Metering Algorithms SATMS, SDRMS, TOS
Design tool Evaluation tool
Paramics API Functions Paramics: Provided API library
Basic modules
Advanced modules
GUI
Figure 2.1 System framework of IRMP
6

Chapter 3 Detector requirement for ramp metering in California Ramp metering control relies on detectors installed on the freeway mainline and ramps. Table 3.1 summarizes the detector placement requirement based on Caltrans Ramp Meter Design Manual. Figure 3.1 shows the requirement.
Detector Placement requirement Mainline Detector
(1) Two loops per lane should be installed on the mainline. (2) Spacing shall be 6.1 m from leading edge to leading edge (3) Located upstream of the entrance ramp nose, opposite the limit line.
Ramp Detector
(1) Ramp loops (demand and passage) should be installed for each entrance lane near the limit line. (2) The number and spacing of ramp loops should be determined by the District Operations Branch responsible for ramp metering - District 11: typically 4 demand loops - Districts 3, 4, and 8: typically 3 demand loops - Districts 7 and 12: typically 2 demand loops
Exit Ramp Detector
One loop per exit ramp lane should be installed for count information and loop calibration.
Queue Detector
One loop per entrance ramp lane should be installed for queue detection near the connection of the surface street.
Table 3.1 Detector placement requirement based on Ramp Meter Design Manual
- District 3, 4, 6, 8 typically uses 3 demand loops
- District 11: typically uses 4 demand loops
Ramp Meter
US
Upstream Mainline Detectors
Passage Loop
Demand Loop
Queue Loop
US
US
- District 7 12 typically uses 2 demand loops
Figure 3.1 Detector placement around a meter According to current detector placement practice, in addition to the upstream mainline detectors (US), Caltrans usually installs one more detector (called an on-ramp detector)
7

8
downstream of the passage detector. For those areas with HOV bypass on-ramp lanes (such as in Districts 7 and 12), there is a HOV detector placed on the bypass lane. Both detectors are placed for count information and loop calibration. Figure 3.2, which is copied from District 7’s ATMS Traffic Engineer’s Manual, shows the typical detector placement around a ramp in Districts 7 and 12.
Figure 3.2 Typical detector placement with HOV bypass lane in District 7 and 12 The roles of these detectors associated with ramp metering are explained below.
• Demand detector (corresponding to check-in detector) is used for the operation of on-ramp signals. It is employed to detect if there is vehicle stopping before the stop line. The demand detector is employed to initiate green.
• Passage detector (corresponding to check-out detector) is used for the operation of on-ramp signals. It is employed to detect the passage of the vehicle waiting for signal. If yes, signal will be set to red.
• On-ramp detector is used for counting total number of vehicles entering freeway from entrance ramps.
• Queue detector is located at the upstream end of the entrance ramp, used for detecting the excessive queue length in order to avoid interference with the arterial traffic.
• Ramp HOV detector is used for counting the number of carpool vehicles entering freeway from entrance ramps.
• Mainline detector in California is located on mainline freeway immediately upstream of an entrance ramp. Traffic data from the detector are used in determining the metering rate.
It is noted that different districts in California have different demand detector configurations due to the requirements of the metering systems deployed and local policy. In addition, there are different policies regarding HOV on-ramps. Districts 3, 7 and 12 don’t meter HOV on-ramps; Districts 4, 6 and 11 meter HOV on-ramps.

Chapter 4 SATMS
4.1 Introduction The Semi Actuated Traffic Metering System (SATMS) is one of the ramp metering system used in California. It is currently deployed in District 7 (Los Angeles) and in District 12 (Orange County). SATMS can be operated under traffic-responsive metering control or pre-timed metering control. It has two TOD tables and each TOD table has 48 TOD entries, and 16 holiday tables provided to control by time-of-day and day-of-week. The theory behind the traffic-responsive metering control of SATMS is demand-capacity control. SATMS provides two sets of metering control parameters, which are referred to in the documentation as "plan A" and "plan B". The plan in use at any given time is selectable via time-of-day table entries or via communications. Each controller can control up to 3 meters.
4.2 SATMS logic overview The SATMS’ metering rate logic is shown in Figure 4.1. Every 30 sec, SATMS runs its TOD selection routine once to determine the active metering plan and associated parameters. Then, mainline loop detector data are collected and 1-min occupancy data and 3-min flow data are updated. If pre-timed control is enabled, the TOD rate is applied. Otherwise, traffic responsive rate is applied based on the following formulas.
[ ]max ( 1), _ , ( ( 1) _ )( )
_ ,Capacity vol t TOD RATE if occ t occ threshold
RATE tTOD RATE otherwise⎧ − − − <
= ⎨⎩
If the mainline 1-minute occupancy is smaller than a pre-defined threshold, the maximum of the pre-time TOD rate (TODRATE) and the calculated demand-capacity rate is applied; otherwise, TOD rate is applied. If the queue detector is continuously occupied for a predefined length of time, the metering cycle length is set to 4 seconds per minute per lane.
9

Figure 4.1 SATMS logic
4.3 Algorithm Description 4.3.1 Metering mode and TOD table The basic settings for SATMS metering control are:
(1) if a meter is enabled
(2) if a meter is operated under traffic-responsive control or pre-timed control
(3) if queue override control is enabled These settings can be set via the first three bits of COMM1 (memory location 0F4) of the actual controller. If a meter is enabled, it is operated based on the current metering mode (pre-time or traffic-responsive) and time-of-day (TOD) entries in the TOD table. Each TOD entry associates a time period with a minimum metering rate and some necessary metering
no
no
yes
noyes
yes
Obtain 30-sec occupancy occ30(t) and volume vol30(t)
1-min occupancy: occ(t) = occ(t-1) / 2 + occ30(t) / 2 3-min volume: vol(t) = vol(t-1) * 5 / 6 + vol30(t)
Occ(t) < CROCC?
RATE(t) = max {TRRATE, TOD_Rate} RATE(t) = TOD_Rate
Queue override?
Metering Cycle = 4 sec Metering Cycle = 3600 / (RATE * # of ramp lanes *
Pre-timed control?
Every 30 sec
Obtain current TOD_Rate and parameters for traffic-responsive control
Startup and shutdown logic
10

settings. During metering, if a queue is detected on the ramp, queue override control will be applied. For example, based on D12’s metering practice, most meters are operated under traffic-responsive control with enabled queue override. SATMS has two TOD tables and each TOD table has 48 TOD entries. Usually, the first TOD table is active. The second TOD table can only be enabled via communication and is very rarely used. Each TOD entry has four items: HOUR, MINUTE, RATE, DAY_OF_WEEK, with one byte per item. Please note that when a metering controller is set up through controller panel,
(1) the highest two bits (bit 7 and 6) for HOUR are reserved for device selection while displaying meter signal faces
(2) bit 7 of MINUTE is reserved to enable/disable Plan B (1 for enabling and 0 for not) for critical volume and occupancy (CRVOL and CROCC)
(3) bit 7 of DAY_OF_WEEK is reserved to enable/disable Plan B for vehicles_per_cycle (PSEL) and maximum green (MXGRN)
As a result, the following information can be obtained from SATMS TOD metering plans:
(1) time period
(2) TOD metering rate, which acts as the minimum rate of the meter
(3) the metering plan’s “number of vehicles per cycle” and “maximum green” used
(4) the metering plan’s traffic responsive parameters (i.e., “critical occupancy” and “critical volume”) used
Figure 4.2 shows a sample TOD table. For the time period starting at 5:30 am, the metering rate is 8 vehicles per minute and critical volume and occupancy of Plan A are used by default.
11

Figure 4.2 A sample TOD table
Every 30 seconds, SATMS runs its TOD selection routine once. It determines the proper metering rate, if any (including consideration of host priorities); updates the cycle length and green ball flag (GRNFLG), if necessary; and chooses appropriate vehicles/cycle (PSEL), critical volume (3 minute) and occupancy (1 minute), and maximum green (MXGRN) from either Plan A or B, depending on time of day and current traffic conditions. 4.3.2 Traffic responsive plans Four of the user definable parameters can be set to two values, which are referred to in the documentation as "Plan A" and "Plan B" values. These four parameters include:
(1) Number of vehicles per cycle (referred to as PSEL)
(2) Maximum green (referred to as MAXGRN)
(3) Critical occupancy (referred to as CROCC)
(4) Critical volume (referred to as CRVOL) 4.3.3 Metering rate priority
Ramp metering is operated based on data obtained from the TOD table and traffic responsive metering parameters. SATMS can be setup either as demand-capacity based traffic responsive control or as pre-timed control. Metering rates are updated every 30 seconds. For traffic responsive metering, metering rates vary according to different times of a day, traffic conditions, and priority setups.
There are six priority options for determining the metering rate, namely (from high priority to low): metering controlled in field at controller (FMNL), TOC requested rate (TMNL), rate requested from PSO (PMNL), rates requested from TMC subject to
12

time-of-day (TOD) minimums (CORM), local mainline traffic responsive rate (LMRATE), and TOD table rate (TDRATE). The TOC requested rate (TMNL) may be set up as the SWARM rate. Obviously, whenever a higher priority option is valid, it will be taken as the actual metering rate. However, there are also some exceptions.
For any SATMS-controlled meter, the TOD rates need to be set up indicating the lower-bound metering rates that are used at a given period of time. The first four priorities (FMNL, TMNL, PMNL, and CORM) are optional. Normally, meters are operated under traffic responsive control with enabled queue override control. 4.3.4 Traffic responsive running parameters The mainline traffic condition is represented by two running parameters:
(1) Average 1-minute occupancy
(2) Average 3-minute lane-based volume These two parameters are updated every 30 seconds for demand-capacity-based traffic responsive control. 1-minute occupancy count is actually used to update 1-minute occupancy. Since the traffic controller checks if a detector is occupied by vehicles 30 times a second, the occupancy count is defined as how many times a detector is occupied; correspondingly, its maximum value is 900 if the study interval is 30 seconds and 1800 if the study interval is 1 minute. The equations for the calculation of these two parameters are:
3-minVolume (t) = 3-minVolume (t-1) * 5 / 6 + 30-secVolume (t) 1-minOccCount (t) = 1-minOcc (t-1) /2 + 30-secOccCount (t) One-minute occupancy count is converted to 1-minute occupancy (i.e. percent) using the following formula:
1-minOcc (t) = 1-minOccCount (t) / 1800 * 100; These data are based on all valid mainline detectors. As a result,
(1) If there is a HOV lane, the detector on the HOV lane will not be considered in the calculation of 1-min occ and 3-min volume
(2) If one mainline detector has a problem in reporting valid data, its data will be excluded from the calculation of 1-min occ and 3-min volume
4.3.5 Traffic responsive control logic
To compute the traffic responsive metering rate, 1-minute mainline occupancy and 3-minute mainline volume data are used and compared (against the critical values). The computation procedure can be described as follows:
13

If (1-minOcc (t) < CROCC) { LMRATE = (# of active mainline lanes)*[CRVOL – 3-minVol (t)]/3 If (LMRATE >255) LMRATE = 1;
else if (LMRATE < 0) LMRATE = 0;
} Else
LMRATE = 0; Here, CROCC is the critical 1-minute mainline occupancy and CRVOL is the critical 3-minute mainline volume. Note that the units of LMRATE are vehicles/minute. According to Figure 3, the traffic responsive metering rate (LMRATE) will need to be compared to the TOD rate (TDRATE). If LMRATE is higher, LMRATE is the applied; otherwise, TDRATE is applied. It is noted that:
(1) if a meter has several metered lanes, the same rate will be applied to all metered lanes
(2) TDRATE is actually the lower bound of metering rate that can apply to a meter
If there is no queue override, the above active metering rate will be applied to the meter. 4.3.6 Startup and shutdown metering The parameters needed for startup and shutdown control include:
(1) Minimum greenball GRNHLD (default 0 sec)
(2) Greenball blackout time GRNOUT (default 5 minutes) When SATMS’s TOD selection routine finds the corresponding TOD rate of the current time period is higher than 0, metering starts immediately. If the metering mode is pre-time metering, metering starts immediately with the TOD rate of the corresponding time period. If the metering mode is traffic responsive, the active metering rate determined based on LMRATE and TDRATE is used for metering. The meter may show greenball, meaning that the active rate is equal to 1, or higher than 15 vehicles per lane per minute. There is a simple startup control logic. It has one parameter, GRNHLD (i.e. minimum greenball), whose default value is 0 seconds. If GRNHLD is set to a value higher than 0 seconds, normal metering can only start after showing green for a time length equal to the value of GRNHLD. Similarly, when SATMS’ TOD selection routine finds that the corresponding TOD rate of the current time period is equal to 0, metering shuts down immediately. However, there is one exception. When a meter is under greenball condition, the metering cannot be shutdown until the greenball condition has stayed for a time length of [GRNOUT]. The metering shutdown control has one parameter, GRNOUT (i.e. greenball blackout time), whose default value is 5 minutes. For example, if
14

GRNOUT = 5 minutes and a meter turns to greenball at time 8:57 am and the end of metering period is 9:00 am, the actual metering shutdown time is 9:02 am. 4.3.7 Queue override control Queue override control needs two parameters: QTHRS (i.e. queue override threshold) and QCYLEN (i.e. cycle length under queue override). The default values for QTHRS and QCYLEN are 5 seconds and 4 seconds. QTHRS is a user-definable parameter and QCYLEN is a hard-coded parameter. The logic for queue override control is shown in Figure 4.3. Basically, the queue detector is checked every 0.1 sec to determine if it is occupied. If the queue detector is continuously occupied for more than [QTHRS] sec, queue override flag (QQR) is set to TRUE. When the metering logic determines metering rate every 30 sec, a fixed cycle length [QCYLEN] sec is applied to the meter if QQR is TRUE. It is noted that:
(1) for a single lane meter with one car per green rule (PSEL = 1), the metering rate will be 3600 / 4 * PSEL= 900 vehicles / hour
(2) if there are two metered lanes with one car per green rule (PSEL = 1), the metering rate will be 3600 / 4 * 2 * PSEL = 1800 vehicles / hour
(3) if there is one metered lane with two cars per green rule (PSEL = 2), the metering rate will be 3600 / (4 + PlatoonYellow) * PSEL, e.g., if PlatoonYellow is equal to the default 3 sec, the metering rate will be 1028 vehicles / hour
Start
Q detector is occupied Q timer > 0
else
RTS
Clear QOR flag
else
Reset Q timer Q timer = QTHRS
Decrement Q Timer
Q Timer < 0
Set QOR flag
else
Figure 4.3 Queue override control logic
15

Chapter 5 SDRMS
5.1 Introduction The San Diego Ramp Metering System (SDRMS) is one of the ramp metering systems currently used in California. It is currently deployed in District 11, District 3, and District 8. SDRMS is very similar to TOS (see Chapter 6), which can be regarded as an upgraded version of SDRMS. SDRMS has sixteen time-of-day (TOD) entries and eleven holiday entries provided to control by time-of-day and day-of-week. SDRMS can be operated under traffic-responsive or pre-timed metering control. SDRMS has two traffic responsive control logics, which are occupancy logic and volume logic. If both occupancy and volume logics are enabled, the most restrictive of the two rate codes is applied. SDRMS provides two sets of traffic responsive and cycle rate control tables, and each of them has fifteen entries. They are referred to in the documentation as "A" and "P" controls (or tables). The table in use at any given time is selectable via time-of-day table entries or via communications. Each controller can control up to 3 meters.
5.2 SDRMS logic overview The SDRMS metering rate logic is shown in Figure 5.1. Every 6 sec, SDRMS runs its TOD selection routine once to determine the active metering plan and associated parameters. Then, mainline loop detector data are collected and average running occupancy and flow data are updated. If the current time is within a time period of a TOD metering entry that enables metering, the SDRMS ramp metering may be operated under any of the following states:
• TOD start: When SDRMS’s TOD selection routine finds the current time is within a time period that needs metering, metering starts immediately with the rest-in-green state.
• Startup metering: When the condition of metering startup is satisfied, a transition period from the rest-in-green state to the cycling state is performed. The transition period includes a first green period (typically, 20 seconds) and a first yellow period (typically, 5 seconds).
• Normal metering or red-green cycling: After the transition period, metering starts with the red-green cycle and metering rate is determined by mainline traffic condition, TOD table, and the traffic-responsive cycle rate control table. An occupancy or volume control lookup table is needed for the normal metering state. How to prepare the lookup tables will be explained later.
• Queue override: During metering, if the condition for queue override control is satisfied, queue override control logic will be used to determine the metering rate.
16

• Shutdown metering: If the condition of shutdown metering is satisfied, normal metering state is changed to the rest-in-green state. A last green (typically 20 seconds) will be displayed to end the normal metering state. A meter under this state can go to the Startup metering state if Startup condition is met.
• TOD end: If the current time corresponds to a time period that has a no metering action code (e.g. CODE/RATE 50 or D0), metering will be shut down.
Figure 5.1 SDRMS logic
5.3 Algorithm Description 5.3.1 Metering mode and TOD table The basic settings for the SDRMS metering control are:
(1) whether or not the meter is enabled
(2) whether the meter is operated under traffic-responsive control or under pre-timed control
(3) if under traffic responsive control, whether occupancy control or volume control logic is selected
If a meter is enabled, a meter is operated based on time-of-day (TOD) entries. Each TOD entry associates a time period with: a metering mode (traffic-responsive or pre-timed), a minimum or maximum metering rate code, and a traffic-responsive cycle rate control table.
no
yes
Obtain 6-sec flow vol6(t) and occupancy occ6(t)
Calculate running average flow and occupancy
Find metering rate based on SDRMS algorithm
Queue override logic
Every 6 sec
Metering operation
Queue override?
Currently metering ?
Shutdown metering?no
yes Start metering?
yes
no
RATE = 0
Update metering parameters based on the current TOD
no
17

SDRMS has 16 TOD entries, and 4 bytes of data are used to represent each, as noted below:
Byte 1 = Hour that entry is to apply Byte 2 = Minute that entry is to apply Byte 3 = Days of Week that entry is to apply Byte 4 = CODE/RATE that entry is to apply
To prepare Byte 3, each bit of the byte represents each day of week.
Bit Day-of-Week 1 Monday 2 Tuesday 3 Wednesday 4 Thursday 5 Friday 6 Saturday 7 Sunday
Table 5.1 Byte 3 preparation
If a day’s corresponding bit is set, the metering represented by the TOD entry will apply to the day. For example, if metering is applied to Monday through Friday, the corresponding byte 3 will be 00011111, i.e., 0x1F. In the byte for CODE/RATE, the left 4 bits is Action Code and the right 4 bits is the Hex Rate Code. The Action Code determines metering mode. The Hex Rate Code determines the maximum or minimum rate code of traffic-responsive control based on traffic-responsive cycle rate control tables that will be explained in next subsection. The following table can be used to understand how to prepare a CODE/RATE.
Action Codes (3-7: A table; B-F: P table)
Rate Code Action
3, B 0-F Enable Traffic Responsive metering. Meter at given rate code or lower. Enable Load Switches.
4,C 0-F Enable Traffic Responsive metering. If Rate Code > 0, meter at the given rate code or higher. Enable Load Switches.
5,D 0-F Disable Traffic Responsive metering. Stop metering. Disable Load Switches.
6,E or 7,F 0-F Disable Traffic Responsive metering. Meter at Rate Code given in right nibble (fixed-time metering). Enable Load Switches.
Table 5.2 Byte 4 preparation
18

Notes: (1) The controller forces a default entry for 0000 hours, Monday thru Sunday, of
"D0". Therefore, unless a specific table entry for this time is made, each day will start with a "D0" code.
(2) On days listed in the Holiday Table: All codes are forced to be “D”. (3) “Minimum” or “Maximum” Rate Codes transmitted from central via phone
line will override any corresponding codes set by '3','4','B' or 'C' TOD table entries.
(4) When action code is 4 or C, the controller will cycle (meter) using the given code as a minimum. The controller is free to meter more restrictively (based on its own traffic responsive logic, but is not free to meter less restrictively than the given code, or to terminate metering.
(5) If given Rate Code is zero, stop metering. 5.3.2 Traffic-responsive cycle rate control tables SDRMS provides two sets of traffic-responsive cycle rate control tables. They are referred to in the documentation as "A" and "P" controls (or tables). Each control table includes:
(1) a cycle rate for rate code 1 (restriction: 2.4-13 cycles/min or 4.6-25 sec per cycle)
(2) a cycle rate change (delta)
(3) a maximum rate code Each control table has a possible 15 metering cycle rates (identified by rate codes 1 thru F). Due to the existence of maximum rate code, users can control the range of cycle lengths and thus not all cycle rates are active. For example, if a cycle rate for rate code 1 is equal to 7.5 cycles/min and a cycle rate change is equal to 0.1 cycle/min and the maximum rate code is 10, the possible 15 meter cycle rates are as follows, but only those highlighted 10 meter cycle rates are active.
rate code cycle rates (cycles/min) cycle length (sec/cycle)
1 7.5 8.00 2 7.4 8.11 3 7.3 8.22 4 7.2 8.33 5 7.1 8.45 6 7 8.57 7 6.9 8.70 8 6.8 8.82 9 6.7 8.96
10 6.6 9.09 11 6.5 9.23 12 6.4 9.37 13 6.3 9.52 14 6.2 9.68 15 6.1 9.84
Table 5.3 Cycle rate lookup table
19

When pre-time control is applied, one cycle rate is picked based on TOD entry of the time period. When traffic responsive control is applied, the metering cycle rate may be changed based on mainline traffic conditions. Let’s explain TOD entry using examples. If the cycle rate lookup table shown in Table 3 is used and CODE/RATE of a TOD entry is B4, the metering control is traffic responsive and the possible cycle rate code is 1-4 because code “B” means “Meter at given rate code or lower”. If Byte 4 is “E8”, pre-timed metering is applied during the specified time period and the metering cycle rate is cycle rate code 8 of the “P” cycle rate, which is 6.8 cycles/min or 8.82 sec/cycle. 5.3.3 Mainline traffic data collection In order to explain SDRMS’ traffic responsive metering logic, let’s describe what kind of data is to be collected by SDRMS to represent mainline traffic condition. During the metering operation, the following running averages are updated every 6 sec.
(1) 1-min exponential running volume
(2) 3-min exponential running volume
(3) 1-min exponential running occupancy
(4) 3-min exponential running occupancy
(5) 64-sec or 128-sec (depending on V1SEL) exponential running volume The following formula is used to calculate these running parameters:
NRA = C6S + {(256 - PCW) * ORA/256} where:
NRA = New Running Average PCW = Proportion Control Word (PCW1 or PCW3) ORA = Old Running Average C6S = Current 6-second Value The time period (in seconds) represented by the "running average" may be found as follows:
t = 256 * 6/PCW The advantage of using the above method to compute “running averages” is that the “running averages” can be obtained directly based on the last running average and the recent 6-sec data, without the need to store historical values. This is an advantage when the application is to older types of hardware that do not have large amounts of memory. The disadvantage is that the corresponding interval of 1-min running averages is not 1 min, but rather 59.1 sec; the corresponding interval of 3-min running averages is not 3 min, but rather 170.7 sec. For the 1-min case, PCW1 = 0x1A = 26 and the corresponding time interval is t = 256 * 6 / 26 = 59.1 sec. Although this is very close to 1 min, it nonethelesss is not exactly equal to 1 min. It is noted that there is no way to find a PCW that can accurately
20

represent 1 min (because when PCW = 25, its corresponding interval is 61.4; when PCW = 27, its corresponding interval is 56.9). For the 3-min case, PCW3 = 0x09 = 9 and the corresponding time interval is t = 256 * 6 / 9 = 170.7 sec. It is very close to 3 min but is not exactly equal to 3 min. It is noted that there is no way to find a PCW that can accurately represent 3 min (because when PCW = 10, its corresponding interval is 153.6; when PCW = 8, its corresponding interval is 192). It is noted that SDRMS also computes 64-sec and 128-sec exponential running volumes. Based on the above formula, it is found that the corresponding PCW for 64-sec and 128-sec intervals is 24 and 12, respectively. For ramp metering traffic engineers, it is important to know the physical meanings for these running averages due to the needs of metering setup. 5.3.4 Traffic responsive control SDRMS has two types of traffic responsive control logic: occupancy logic and volume logic. A meter can be set up to be under occupancy logic, or volume logic, or both. If both occupancy and volume logics are selected, the most restrictive of the two rate codes will be used. SDRMS needs users to pre-define the following parameters:
(1) PCW1 (used to compute 1-min data)
(2) PCW3 (used to compute 3-min data)
(3) V1SEL (whether using 64-sec or 128-sec data for volume logic)
(4) whether volume logic, or occupancy logic, or both is used during traffic responsive control
Traffic responsive control (either volume control or occupancy control) basically includes four control logics:
(1) Startup metering control
(2) Shutdown metering control
(3) Normal traffic responsive metering
(4) Queue override control When SDRMS’s TOD selection routine finds that the current time is within a time period that needs metering, metering starts immediately with the rest-in-green state. When the condition of startup metering is satisfied, metering starts with the red-green cycle determined by mainline traffic condition. If the condition of shutdown metering is satisfied, metering stops with the rest-in-green state. During metering, if the condition for queue override control is satisfied, queue override control logic will be used to determine the metering rate. If the current time corresponds to a time period that has no metering, the metering signal will be turned off.
21

When metering passes metering startup logic, the applied volume-based and/or occupancy-based traffic responsive metering logic will determine the appropriate metering rate based on mainline traffic conditions. To explain occupancy logic, let’s assume that Occ_Level_1_Occ = 8.25% and Occ_Occ_Delta = 0.3%. The lookup table for occupancy logic is then generated, as shown in Table 4. According to Table 1, only rates 1-10 are valid since the maximum rate code is 10. In the TOD table, the user also has another control on the ranges of rate codes. If CODE/RATE is C0 or BA, the valid rate code ranges will be from 1-10. If CODE/RATE is B5, the valid rate code ranges will be 1-5. Here, it is assumed that C0 or BA is the current CODE/RATE.
rate code cycle rates (cycles/min) cycle length (sec/cycle) occupancy
1 7.5 8.00 8.25 2 7.4 8.11 8.55 3 7.3 8.22 8.85 4 7.2 8.33 9.15 5 7.1 8.45 9.45 6 7 8.57 9.75 7 6.9 8.70 10.05 8 6.8 8.82 10.35 9 6.7 8.96 10.65
10 6.6 9.09 10.95 11 6.5 9.23 11.25 12 6.4 9.37 11.55 13 6.3 9.52 11.85 14 6.2 9.68 12.15 15 6.1 9.84 12.45
Table 5.4 Occupancy control lookup table The running average of 1-min occupancy will compare with the occupancy values listed in the “occupancy” column of Table 4. If the “table” occupancy is larger, the current Rate Code value is used. If the current running occupancy is higher than the occupancy value of the highest rate code level, the metering rate code of the highest rate code level will be used. For explaining volume logic, suppose that Vol_Rate_1 = 900 and Vol_Rate_Delta = 100. The lookup table for volume logic is then generated, as shown in Table 5. According to Table 1, only rates 1-10 are valid since the maximum rate code is 10. In the TOD table, the user has another control on the ranges of rate codes. If CODE/RATE is C0 or BA, the valid rate code ranges will be from 1-10. If CODE/RATE is B5, it means the valid rate code ranges will be 1-5. Here, it is assumed that C0 or BA is the current CODE/RATE.
22

rate code cycle rates (cycles/min) cycle length (sec/cycle) Volume per lane
1 7.5 8.00 900 2 7.4 8.11 975 3 7.3 8.22 1075 4 7.2 8.33 1175 5 7.1 8.45 1275 6 7 8.57 1375 7 6.9 8.70 1475 8 6.8 8.82 1575 9 6.7 8.96 1675
10 6.6 9.09 1775 *11 6.5 9.23 1875 12 6.4 9.37 1975 13 6.3 9.52 2075 14 6.2 9.68 2175 15 6.1 9.84 2275
Table 5.5 Volume control lookup table The running average of 64-sec or 128-sec volume (needs to be converted to hourly rate) is compared to the volume values listed in the “volume” column of Table 5. If the “table” volume is larger, the current rate code value is used. If the current running volume is higher than the volume value of the highest rate code level, the metering rate code of the highest rate code level will be used. 5.3.5 Startup and shutdown control A set of occupancy and flow thresholds (using two time bases for the levels) for both “A” and “P” cycle rate table are required for traffic responsive control. Parameters for occupancy logic include:
(1) Occ_Level_1_Occ: occupancy for the top rate code 1
(2) Occ_Occ_Delta: occupancy change
(3) OB3V: 3-min flow for beginning metering
(4) OB1O: 1-min occupancy for beginning metering
(5) OB3O: 3-min occupancy for beginning metering
(6) OE3V: 3-min flow for ending metering
(7) OE1O: 1-min occupancy for ending metering
(8) OE3O: 3- min occupancy for ending metering Occ_Level_1_Occ and Occ_Occ_Delta are used for the preparation of the lookup table for occupancy logic. Other parameters are used for metering startup and metering shutdown control under occupancy logic.
23

Parameters for volume logic include:
(1) Vol_Rate_1: volume rate for the top rate code 1
(2) Vol_Rate_Delta: volume rate change
(3) VB2V: Average volume rate (i.e. exponential hourly flow rate) to begin metering
(4) VE2V: Average volume rate (i.e. exponential hourly flow rate) to end metering
Vol_Rate_1 and Vol_Rate_Delta are used to prepare the lookup table for the preparation of volume logic. Other parameters are used for metering startup and metering shutdown control under volume logic. If the controller is not currently metering (last rate code was zero), SDRMS will evaluate the Start Metering Control logic every six seconds to see if metering should begin.
If (128-sec or 64-sec Average Running Volume > VB2V || (3-min volume > OB3V && (3-min occ > OB3O || 1-min occ > OB1O)))
{ if (metering_on_time >= MINOFF)
metering starts. } Here, MINOFF is the minimum metering off time. In order to turn on metering, the meter must have been turned off for a certain time (i.e., MINOFF). If the controller is currently metering (last rate code was non-zero), it will evaluate the Stop Metering Controls every six seconds to see if metering should end. If (128-sec or 64-sec Average Running Volume < VE2V ||
(3-min volume < OE3V && (3-min occ < OE3O || 1-min occ < OE1O))) {
if (metering_on_time >= MINON) metering ends.
} Here, MINON is the minimum metering on time. In order to turn off metering, the meter must have been turned on for a certain time (i.e. MINON). 5.3.6 Queue override control Parameters for queue override control include:
(1) Enable queue override
(2) Queue override period length select 1-min or 3-min
(3) Queue Override Base Occupancy Count: QOVC (QOVCA or QOVCP)
(4) Queue Override Occupancy Delta: QOVCAD
24

25
SDRMS also has the option for queue override control if there is queued traffic on the entrance ramp. During metering operation, either 1-min or 3-min (depending on user selection) queue override detector exponential running occupancy is re-computed every 6 seconds. SDRMS uses the following logic to evaluate if queue override needs to be given to a ramp:
If (Queue detector occupancy count >QOVC) {
// queue override starts Offset = (1- or 3-min override detector occupancy count - QOVC) /
QOVCD; RateCode = RateCode – Offset; If (RateCode < 1) RateCode = 1;
}

Chapter 6 TOS
6.1 Introduction The Traffic Operations System (TOS) is the ramp metering system currently deployed in District 4 (Bay Area) of Caltrans. TOS has sixteen time-of-day (TOD) entries and sixteen holiday or special event entries provided to control by time-of-day and day-of-week. Each TOD entry has separate metering command action code for each metered lane and supports mainline HOV lanes. The metering command action code dictates the metering control mode. TOS can be operated under traffic-responsive or pre-timed metering control. TOS has two traffic responsive control logics: occupancy logic and volume logic. Under traffic responsive control, a meter can be operated under volume logic or occupancy logic. If both occupancy and volume logics are enabled, the most restrictive of the two rates is applied. TOS has six traffic responsive rate tables and each of them has 16 entries, which are actually lookup tables that associate a set of occupancy levels (and/or flow levels) with a set of metering rates. Each controller can control up to 4 meters and each can have its own demand, passage, and queue detectors.
6.2 TOS logic overview The TOS metering rate logic is shown in Figure 6.1. Every 15 sec, TOS runs its TOD selection routine once to determine the active metering plan and associated parameters. Then, mainline loop detector data are collected and average running occupancy and flow data are updated. If the current time is within a time period of a TOD metering entry that enables metering, the TOS ramp metering starts working. It has startup and shutdown logic to deal with the startup and shutdown process. The queue override is used to apply a higher rate to avoid vehicles’ spillback to local streets.
26

no
yes
Obtain 15-sec flow vol15(t) and occupancy occ15(t)
Calculate running average flow and occupancy
Startup logic and shutdown logic
Find metering rate based on TOS algorithm
Queue override logic
Metering Rate
Every 15 sec
Update metering parameters based on the current time of day
Queue override?
Figure 6.1 TOS Logic
6.3. Algorithm Description 6.3.1 Metering mode and TOD table The basic settings for the TOS metering control are:
(1) Whether or not the meter is enabled
(2) Whether the meter is operated under traffic-responsive control or pre-timed control
(3) If under traffic responsive control, whether occupancy control or volume control logic is selected
If a meter is enabled, a meter is operated based on TOD entries. TOS has sixteen TOD entries. Each TOD entry associates a time period with Action Code for metered lanes and a HOV lane status (if HOV lane is active), as shown in Figure 6.1. Each TOD entry has Day-of-week, Hour and Minute entries, which identify the starting time and days for the entry. The Day-of-week entry consists of 1 bit per day, with Sunday = $01, Monday = $02, … , Saturday = $40. For example, a value of $3E would be valid for weekdays. Entries which apply to holidays are indicated with the holiday bit ($80) set in the Day-of-week entry.
27

Figure 6.1 An example of TOD table of a meter in District 4
One byte of data is used to represent an Action Code, which can be Fixed Rate, Traffic Responsive, Rest-in-Green or Dark. If Action Code is within the range of 15 and 90, the metering control mode is pre-time control and metering rate is equal to 10* Action Code. For example, a value of $45 indicates a fixed rate of 450 vph.. If Action Code is equal to $02, the metered lane is under Rest-in-Green state. If Action Code is equal to $01, the metered lane shall advance to the Pre-metering Non-green interval. For example, Figure 6.1 shows that meter 3 is under pre-time control with rate 800 vph starting from 15:01. If Action Code is within the range of ($D1 to $D6, $E1 to $E6, $F1 to $F6), the metering control mode is traffic responsive and the specified traffic responsive control logic and cycle rate control table are used. For example,
(1) a value of $D1 indicates that occupancy control based traffic responsive metering is applied and metering plan 1 is the active plan
(2) a value of $E4 indicates flow control based traffic responsive metering is applied and metering plan 4 is the active plan
(3) a value of $F3 indicates both occupancy control and flow control are applied and metering plan 3 is the active plan
District 4 has a program that can be used to communicate with traffic controllers in the field and then can be used to upload or download metering plans. A screenshot of the TOD schedule is as shown in Figure 6.2.
28

Figure 6.2 TOD schedule shown in District 4’s program
6.3.2 Traffic-responsive plans TOS provides 6 traffic-responsive plans. Each plan includes 16 entries, which are actually lookup tables that associate a set of occupancy levels and/or flow levels with a set of metering rates. Please note that SDRMS has a similar traffic-responsive plan concept, called traffic-responsive rate cycle control table. SDRMS has only two traffic responsive rate tables and each of them has 15 entries. The way TOS represents its traffic responsive plans is different from SDRMS. SDRMS uses a cycle rate for rate code 1, a cycle rate change (delta) and a maximum rate code. However, TOS needs the user to provide each individual occupancy (and/or flow) level and its corresponding metering rate. Figure 6.3 shows plan 1 and 2 of a meter. Since there is no value for flow rates, these plans are actually used for occupancy control logic. Figure 6.4 shows a screenshot of the traffic-responsive control tables from District 4’s TOS communication program.
29

Figure 6.3 Example of traffic-responsive plans
Figure 6.4 Example of traffic-responsive cycle rate control tables
6.3.3 Traffic responsive running parameters The mainline traffic condition is represented by two running parameters:
(1) Average 1-minute occupancy
(2) Average 1-minute lane-based volume
30
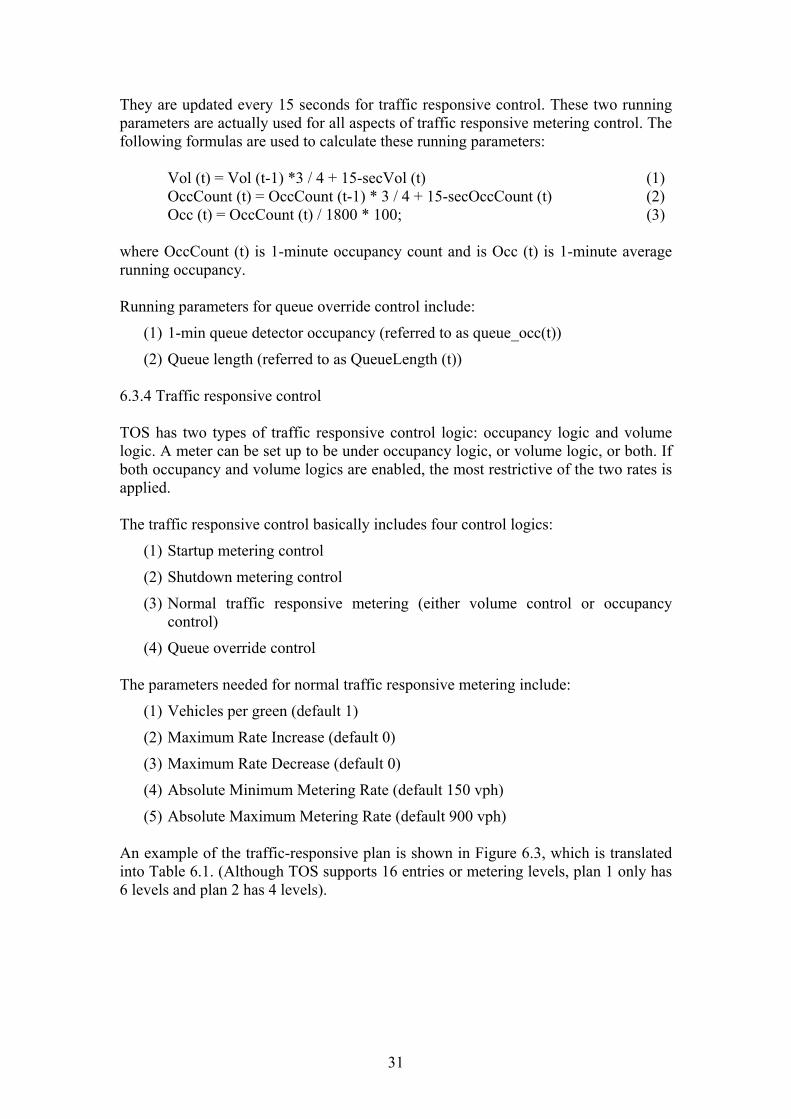
They are updated every 15 seconds for traffic responsive control. These two running parameters are actually used for all aspects of traffic responsive metering control. The following formulas are used to calculate these running parameters:
Vol (t) = Vol (t-1) *3 / 4 + 15-secVol (t) (1) OccCount (t) = OccCount (t-1) * 3 / 4 + 15-secOccCount (t) (2)
Occ (t) = OccCount (t) / 1800 * 100; (3) where OccCount (t) is 1-minute occupancy count and is Occ (t) is 1-minute average running occupancy. Running parameters for queue override control include:
(1) 1-min queue detector occupancy (referred to as queue_occ(t))
(2) Queue length (referred to as QueueLength (t)) 6.3.4 Traffic responsive control TOS has two types of traffic responsive control logic: occupancy logic and volume logic. A meter can be set up to be under occupancy logic, or volume logic, or both. If both occupancy and volume logics are enabled, the most restrictive of the two rates is applied. The traffic responsive control basically includes four control logics:
(1) Startup metering control
(2) Shutdown metering control
(3) Normal traffic responsive metering (either volume control or occupancy control)
(4) Queue override control The parameters needed for normal traffic responsive metering include:
(1) Vehicles per green (default 1)
(2) Maximum Rate Increase (default 0)
(3) Maximum Rate Decrease (default 0)
(4) Absolute Minimum Metering Rate (default 150 vph)
(5) Absolute Maximum Metering Rate (default 900 vph) An example of the traffic-responsive plan is shown in Figure 6.3, which is translated into Table 6.1. (Although TOS supports 16 entries or metering levels, plan 1 only has 6 levels and plan 2 has 4 levels).
31
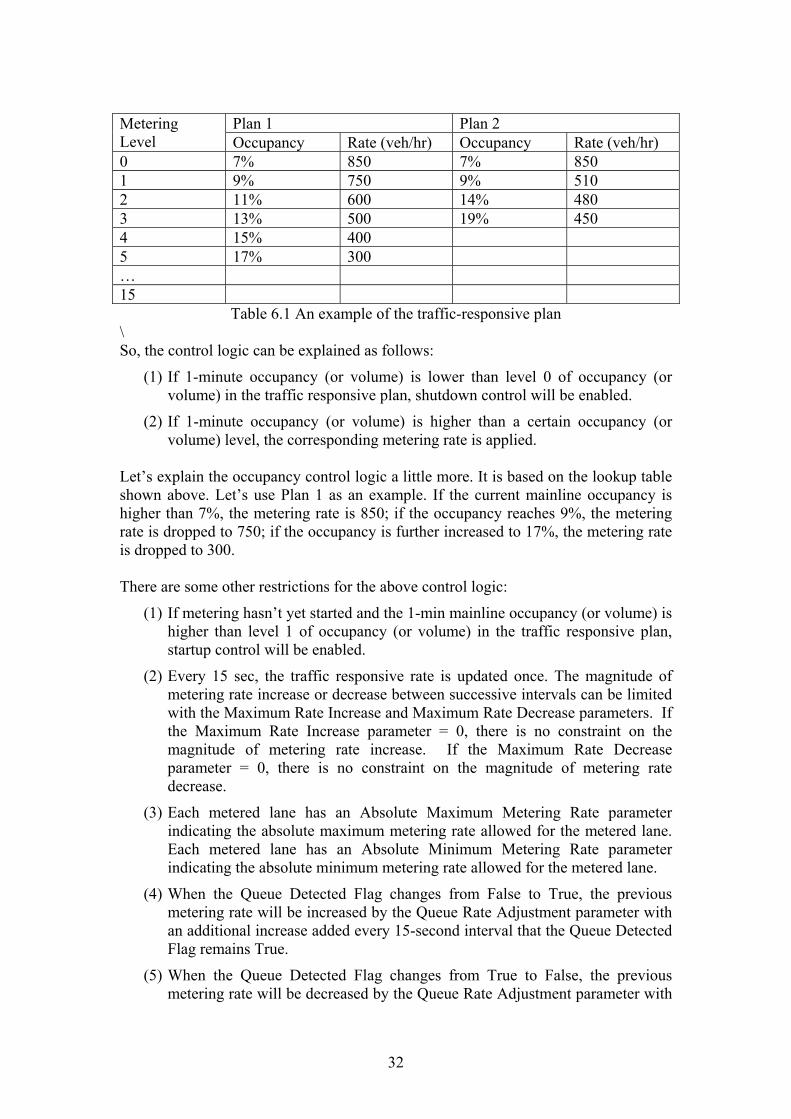
Metering Level
Plan 1 Plan 2 Occupancy Rate (veh/hr) Occupancy Rate (veh/hr)
0 7% 850 7% 850 1 9% 750 9% 510 2 11% 600 14% 480 3 13% 500 19% 450 4 15% 400 5 17% 300 … 15
Table 6.1 An example of the traffic-responsive plan \ So, the control logic can be explained as follows:
(1) If 1-minute occupancy (or volume) is lower than level 0 of occupancy (or volume) in the traffic responsive plan, shutdown control will be enabled.
(2) If 1-minute occupancy (or volume) is higher than a certain occupancy (or volume) level, the corresponding metering rate is applied.
Let’s explain the occupancy control logic a little more. It is based on the lookup table shown above. Let’s use Plan 1 as an example. If the current mainline occupancy is higher than 7%, the metering rate is 850; if the occupancy reaches 9%, the metering rate is dropped to 750; if the occupancy is further increased to 17%, the metering rate is dropped to 300. There are some other restrictions for the above control logic:
(1) If metering hasn’t yet started and the 1-min mainline occupancy (or volume) is higher than level 1 of occupancy (or volume) in the traffic responsive plan, startup control will be enabled.
(2) Every 15 sec, the traffic responsive rate is updated once. The magnitude of metering rate increase or decrease between successive intervals can be limited with the Maximum Rate Increase and Maximum Rate Decrease parameters. If the Maximum Rate Increase parameter = 0, there is no constraint on the magnitude of metering rate increase. If the Maximum Rate Decrease parameter = 0, there is no constraint on the magnitude of metering rate decrease.
(3) Each metered lane has an Absolute Maximum Metering Rate parameter indicating the absolute maximum metering rate allowed for the metered lane. Each metered lane has an Absolute Minimum Metering Rate parameter indicating the absolute minimum metering rate allowed for the metered lane.
(4) When the Queue Detected Flag changes from False to True, the previous metering rate will be increased by the Queue Rate Adjustment parameter with an additional increase added every 15-second interval that the Queue Detected Flag remains True.
(5) When the Queue Detected Flag changes from True to False, the previous metering rate will be decreased by the Queue Rate Adjustment parameter with
32

an additional decrease added every 15-second interval until the metering rate reaches the value of the current metering rate.
6.3.5 Startup and shutdown control TOS is simpler than SDRMS since TOS does not require the user to prepare parameters for the startup and shutdown control. The level 1 of occupancy or flow in the traffic responsive plan is used by the startup control logic and the level 0 of occupancy or flow in the traffic responsive plan is used by the shutdown control logic. The parameters needed for startup and shutdown control include:
(1) Minimum Non-Metering Time (default 5 minutes)
(2) Minimum Metering Time (default 5 minutes)
(3) Shutdown Normal Rate (default 900 vph)
(4) Shutdown normal time (default 1 minute) The parameters needed for queue override control include:
(1) Queue Length Upper Threshold (referred to as QLUT, default 255)
(2) Queue Length Lower Threshold (referred to as QLLT, default 0)
(3) Queue Occupancy Upper Threshold (referred to as QOUT, default 100)
(4) Queue Occupancy Lower Threshold (referred to as QOLT, default 100) (5) Queue Rate Adjustment (default 0)
The level 1 of occupancy or flow in the traffic responsive plan is used by the startup control logic to determine whether or not to start metering. The average thresholds of metering level 0 are used to determine whether or not to stop metering. The startup logic is described as follows:
If (Active Operation Mode == Fixed Rate) {
if (Duration of a Non-Metering state >= Minimum Non-Metering Time) Metering Rate = Fixed Rate specified in TOD entry;
} Else if (Active Operation Mode == Traffic Responsive) {
If (Occ (t) > Level_1_occ_level && OccupancyControl) { if (Duration of a Non-Metering state >= Minimum Non-Metering Time)
Metering Rate = Level_1_rate; }
Else if (Vol (t) > Level_1_flow_level && FlowControl) { if (Duration of a Non-Metering state >= Minimum Non-Metering Time)
Metering Rate = Level_1_rate; }
}
33

The level 0 of occupancy or flow in the traffic responsive plan is used by the shutdown control logic to determine whether to start metering. The average thresholds of metering level 0 are used to determine whether to stop metering. The shutdown logic is described as follows: If (Active Operation Mode == Dark || Rest-in-Green)
{ if (Duration of transition > Shutdown Normal Time)
METERING ENDS; else
Metering Rate = Shutdown Normal Rate } else if (Active Operation Mode == Traffic Responsive) { If (Occ (t) < Level_0_occ_level && OccupancyControl)
{ if (Duration of a Metering state >= Minimum Metering Time) {
if(Duration of transition > Shutdown Normal Time) METERING ENDS;
else Metering Rate = Level_0_rate;
} }
Else if (Vol (t) < Level_0_flow_level && FlowControl) {
if (Duration of a Metering state >= Minimum Metering Time) {
if(Duration of transition > Shutdown Normal Time) METERING ENDS;
else Metering Rate = Level_0_rate;
} }
} 6.3.6 Queue override control When queue override control is enabled, the queue length on the entrance ramp and 1-minute average occupancy of queue detectors need to be updated every 15 seconds. The Queue Length parameter is increased upon the detection of a vehicle at the queue detector and decreased upon the detection of a vehicle at the passage detector. The queue override control logic aims to determine the status of the Queue Detected Flag, which is needed by the traffic responsive logic, explained earlier, to determine the active metering rate. The logic is explained as follows:
34

35
If (Queue Detected Flag == FALSE) {
If (QLUT != 0 && QueueLength (t) >= QLUT) Queue Detected Flag = True;
If (QOUT != 0 && queue_occ(t) >= QOUT) Queue Detected Flag = True;
} else {
If (QLLT != 0 && QueueLength (t) <= QLLT) Queue Detected Flag = FALSE;
If (QOLT != 0 && queue_occ(t) <= QOLT) Queue Detected Flag = FALSE;
}
Chapter 7 Algorithms in IRMP
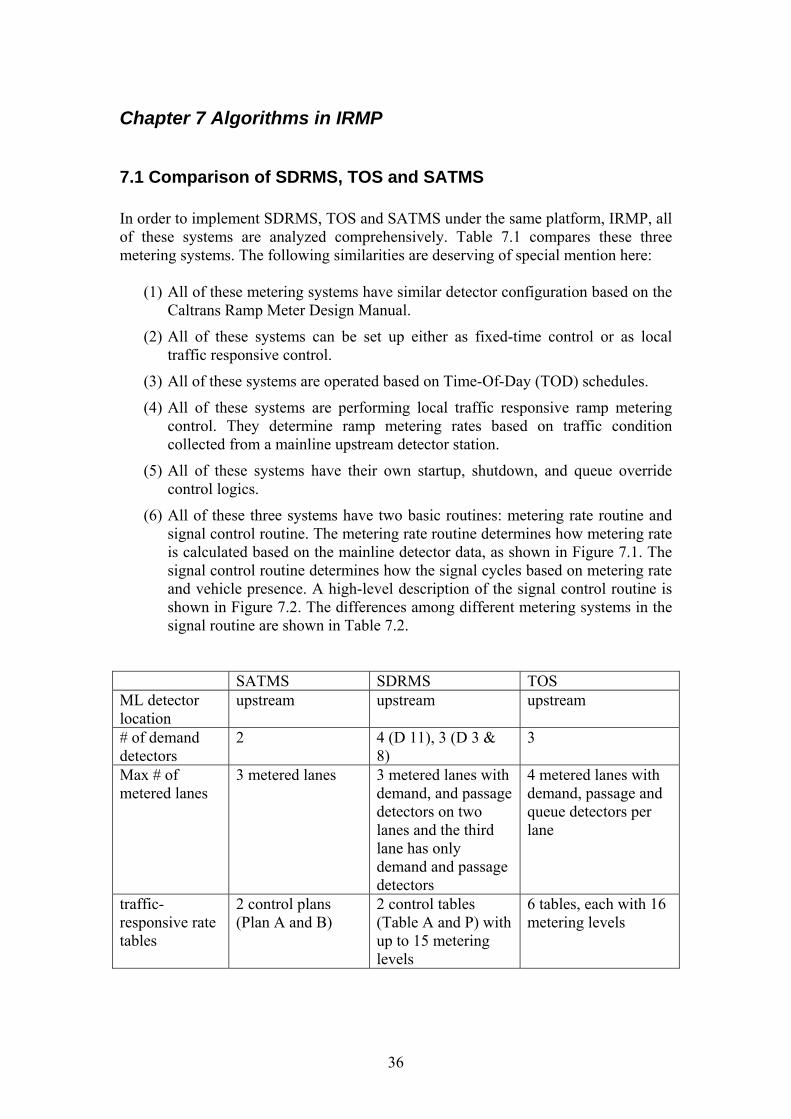
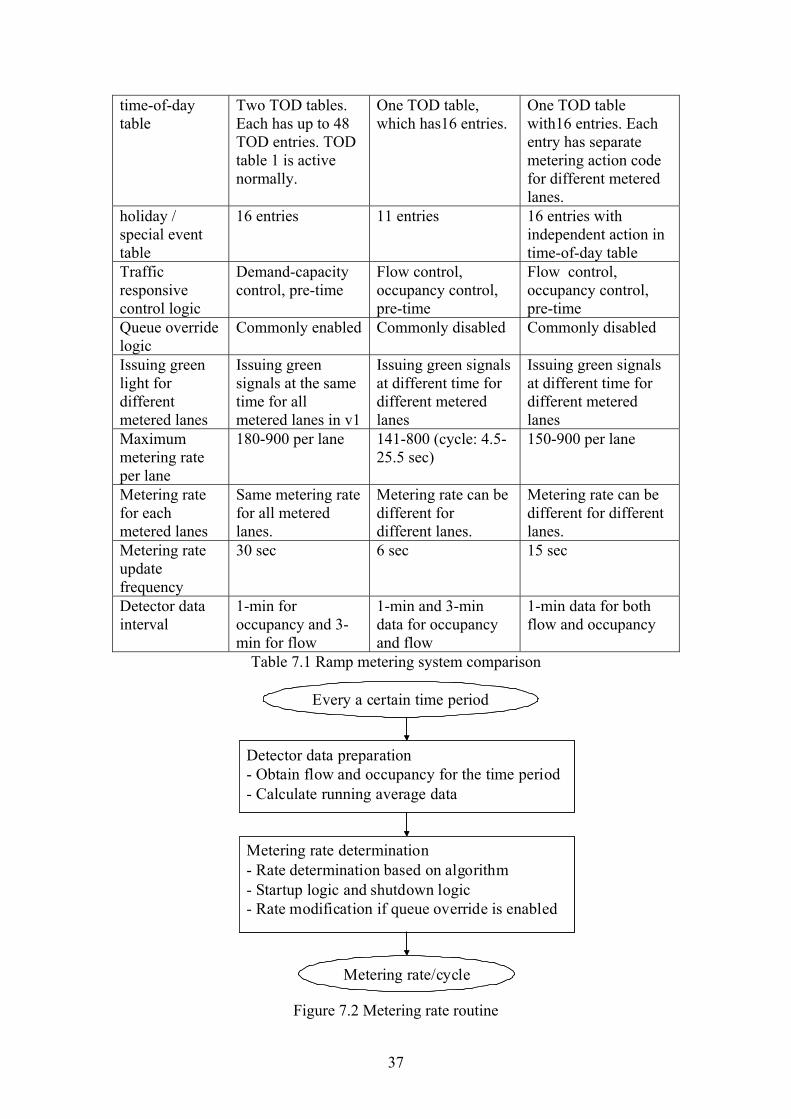
7.1 Comparison of SDRMS, TOS and SATMS In order to implement SDRMS, TOS and SATMS under the same platform, IRMP, all of these systems are analyzed comprehensively. Table 7.1 compares these three metering systems. The following similarities are deserving of special mention here:
(1) All of these metering systems have similar detector configuration based on the Caltrans Ramp Meter Design Manual.
(2) All of these systems can be set up either as fixed-time control or as local traffic responsive control.
(3) All of these systems are operated based on Time-Of-Day (TOD) schedules.
(4) All of these systems are performing local traffic responsive ramp metering control. They determine ramp metering rates based on traffic condition collected from a mainline upstream detector station.
(5) All of these systems have their own startup, shutdown, and queue override control logics.
(6) All of these three systems have two basic routines: metering rate routine and signal control routine. The metering rate routine determines how metering rate is calculated based on the mainline detector data, as shown in Figure 7.1. The signal control routine determines how the signal cycles based on metering rate and vehicle presence. A high-level description of the signal control routine is shown in Figure 7.2. The differences among different metering systems in the signal routine are shown in Table 7.2.
SATMS SDRMS TOS ML detector location
upstream upstream upstream
# of demand detectors
2 4 (D 11), 3 (D 3 & 8)
3
Max # of metered lanes
3 metered lanes 3 metered lanes with demand, and passage detectors on two lanes and the third lane has only demand and passage detectors
4 metered lanes with demand, passage and queue detectors per lane
traffic-responsive rate tables
2 control plans (Plan A and B)
2 control tables (Table A and P) with up to 15 metering levels
6 tables, each with 16 metering levels
36
time-of-day table
Two TOD tables. Each has up to 48 TOD entries. TOD table 1 is active normally.
One TOD table, which has16 entries.
One TOD table with16 entries. Each entry has separate metering action code for different metered lanes.
holiday / special event table
16 entries 11 entries 16 entries with independent action in time-of-day table
Traffic responsive control logic
Demand-capacity control, pre-time
Flow control, occupancy control, pre-time
Flow control, occupancy control, pre-time
Queue override logic
Commonly enabled Commonly disabled Commonly disabled
Issuing green light for different metered lanes
Issuing green signals at the same time for all metered lanes in v1
Issuing green signals at different time for different metered lanes
Issuing green signals at different time for different metered lanes
Maximum metering rate per lane
180-900 per lane 141-800 (cycle: 4.5-25.5 sec)
150-900 per lane
Metering rate for each metered lanes
Same metering rate for all metered lanes.
Metering rate can be different for different lanes.
Metering rate can be different for different lanes.
Metering rate update frequency
30 sec 6 sec 15 sec
Detector data interval
1-min for occupancy and 3-min for flow
1-min and 3-min data for occupancy and flow
1-min data for both flow and occupancy
Table 7.1 Ramp metering system comparison
Detector data preparation- Obtain flow and occupancy for the time period- Calculate running average data
Metering rate determination - Rate determination based on algorithm- Startup logic and shutdown logic- Rate modification if queue override is enabled
Metering rate/cycle
Every a certain time period
Figure 7.2 Metering rate routine
37

38
Figure 7.3 Signal routine
SSAATTMMSS SSDDRRMMSS TTOOSS IIssssuuee ggrreeeenn aatt ddiiffffeerreenntt ttiimmee ffoorr ddiiffffeerreenntt llaanneess
SSuuppppoorrtteedd iinn vv33 SSuuppppoorrtteedd SSuuppppoorrtteedd
FFiirrsstt ggrreeeenn 33 sseecc TTyyppiiccaallllyy,, 2200 sseecc TTyyppiiccaallllyy,, 66 sseecc FFiirrsstt yyeellllooww 33 sseecc 33--66 sseecc TTyyppiiccaallllyy,, 33..55 sseecc FFiirrsstt rreedd NNOOTT ssuuppppoorrtteedd NNOOTT ssuuppppoorrtteedd SSuuppppoorrtteedd,, 33..00 sseecc.. LLaasstt ggrreeeenn SSuuppppoorrtteedd iinn vv33 SSuuppppoorrtteedd SSuuppppoorrtteedd VVeehhiiccllee ppeerr ggrreeeenn TTyyppiiccaallllyy,, 11 TTyyppiiccaallllyy,, 11 TTyyppiiccaallllyy,, 11 YYeellllooww wwhheenn vveehh ppeerr ggrreeeenn >> 11
11..55--66 sseecc >>22 sseecc 22 –– 44 sseecc
MMiinniimmuumm ggrreeeenn 22 sseecc 11..44 –– 44..00 sseecc ((ttyyppiiccaallllyy,, 22 sseecc))
>> 11..44 sseecc
MMiinniimmuumm rreedd 22 sseecc 11..55 –– 55 sseecc ((ttyyppiiccaallllyy,, 22 sseecc))
>> 11..55 sseecc
MMaaxxiimmuumm ggrreeeenn 55 sseecc 22 –– 55 sseecc <<== 66 sseecc ## ooff ddeemmaanndd ddeetteeccttoorrss 22 44 ((DD 1111)),, 33 ((DD 33 && 88)) 33 DDeemmaanndd rreedd NNOOTT ssuuppppoorrtteedd 33 sseecc SSuuppppoorrtteedd MMiinniimmuumm mmeetteerr oonn ttiimmee
MMiinn ggrreeeennbbaallll ((GGRRNNHHLLDD)),,
GGrreeeennbbaallll bbllaacckkoouutt ((GGRRNNOOUUTT))
SSuuppppoorrtteedd SSuuppppoorrtteedd
MMiinniimmuumm mmeetteerr ooffff ttiimmee
NNOOTT ssuuppppoorrtteedd SSuuppppoorrtteedd SSuuppppoorrtteedd
Table 7.2 Signal routine comparison
Metering start-up - First yellow - First green - First red
Normal metering cycle- Red - Green - Yellow (optional)
Every timestep
Metering shutdown - Last green

7.2 Other ramp metering algorithms IRMP also provides the capability for the addition of other ramp metering algorithms that potentially could be deployed in California, such as ALINEA and SWARM, into it. 7.2.1 ALINEA The ALINEA algorithm, proposed by Papageorgiou et al (1997), is a local feedback ramp metering policy, that attempts to maximize the mainline throughput by maintaining a desired occupancy on the downstream mainline freeway. Compared to other traffic-responsive ramp metering algorithms, ALINEA is remarkably simple, highly efficient and easily implemented. Based on field tests and simulation based studies, ALINEA has very good performance. As shown in Figure 7.4, two detector stations are required for the implementation of the ALINEA algorithm. The first detector is located on the mainline freeway, immediately downstream of the entrance ramp, where the congestion caused by the excessive traffic flow originated from the ramp entrance can be detected. The second loop station is on the downstream end of the entrance ramp, and used for counting the on-ramp volume.
Surface street
Demand detector Mainline detector
Freeway
Figure 7.4 Detector layout for the implementation of the ALINEA algorithm
Original ALINEA The metering rate for an on-ramp under ALINEA control during time interval (t, t+ Δt) is calculated as:
))(*()(~)( ttOccOccKttrtr R Δ−−•+Δ−= (1) where Δt is the update cycle of ramp metering implementation; )(~ ttr Δ− is the measured metering rate of the time interval of (t –Δt, t); Occ(t–Δt) is the measured occupancy of time interval (t –Δt, t) at the downstream detector station; KR is a regulator parameter, used for adjusting the constant disturbances of the feedback
39
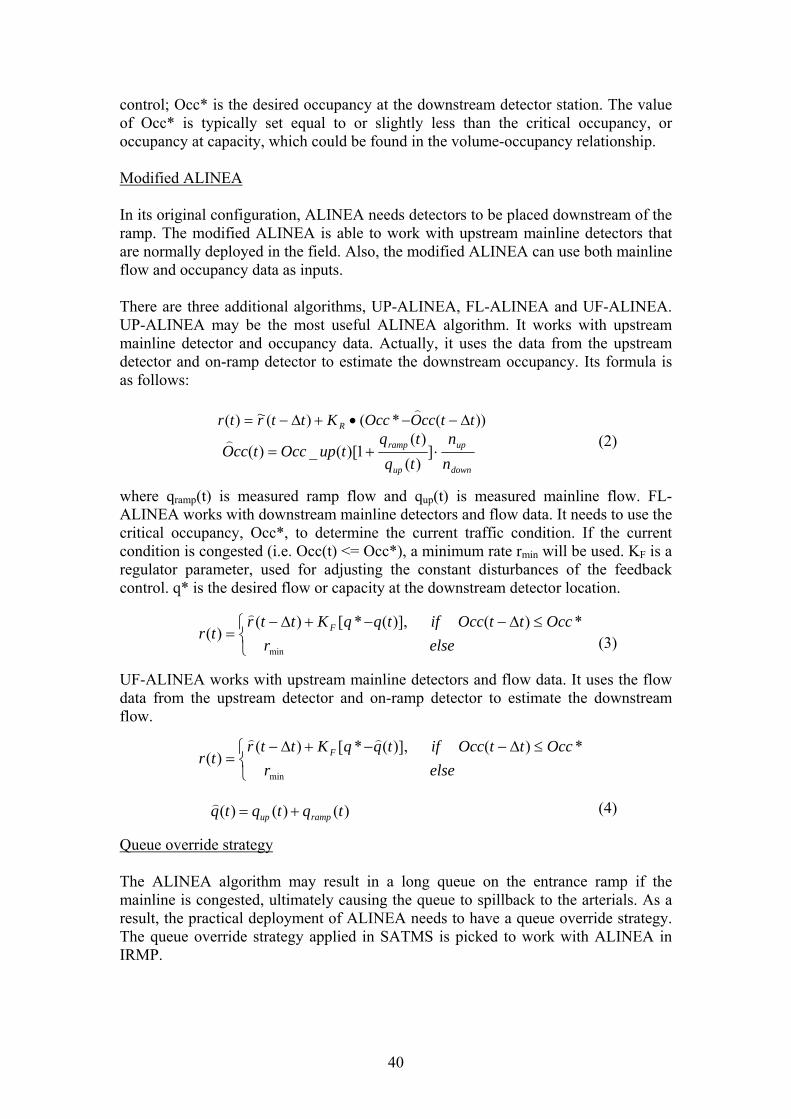
control; Occ* is the desired occupancy at the downstream detector station. The value of Occ* is typically set equal to or slightly less than the critical occupancy, or occupancy at capacity, which could be found in the volume-occupancy relationship. Modified ALINEA In its original configuration, ALINEA needs detectors to be placed downstream of the ramp. The modified ALINEA is able to work with upstream mainline detectors that are normally deployed in the field. Also, the modified ALINEA can use both mainline flow and occupancy data as inputs. There are three additional algorithms, UP-ALINEA, FL-ALINEA and UF-ALINEA. UP-ALINEA may be the most useful ALINEA algorithm. It works with upstream mainline detector and occupancy data. Actually, it uses the data from the upstream detector and on-ramp detector to estimate the downstream occupancy. Its formula is as follows:
))(*()(~)( ttccOOccKttrtr R Δ−−•+Δ−=)
(2) where qramp(t) is measured ramp flow and qup(t) is measured mainline flow. FL-ALINEA works with downstream mainline detectors and flow data. It needs to use the critical occupancy, Occ*, to determine the current traffic condition. If the current condition is congested (i.e. Occ(t) <= Occ*), a minimum rate rmin will be used. KF is a regulator parameter, used for adjusting the constant disturbances of the feedback control. q* is the desired flow or capacity at the downstream detector location. (3)
downup ntq )(
⎧ ≤Δ−−+Δ− OccttOcciftqqKttr F *)()],(*[)(
upramp ntqtupOcctccO ⋅+= ]
)(1)[(_)(
)
)
⎩⎨= elser
trmin
)(
UF-ALINEA works with upstream mainline detectors and flow data. It uses the flow data from the upstream detector and on-ramp detector to estimate the downstream flow.
⎩⎨⎧ ≤Δ−−+Δ−
=elser
OccttOcciftqqKttrtr F
min
*)()],(*[)()(
) ) (4) )) tqq + (()( tqt rampup=)
Queue override strategy The ALINEA algorithm may result in a long queue on the entrance ramp if the mainline is congested, ultimately causing the queue to spillback to the arterials. As a result, the practical deployment of ALINEA needs to have a queue override strategy. The queue override strategy applied in SATMS is picked to work with ALINEA in IRMP.
40

41
Implementation of ALINEA ALINEA is not deployed to the field in the US and how to implement it appropriately in order to be compatible with California ramp metering systems is a difficult question to address. Although we have tried to incorporate it into IRMP, it may still need some refinement in the future development. 7.2.2 SWARM Since the late 1990s, Caltrans has been testing the System-wide Adaptive Ramp Metering (SWARM), developed by NET (or Delcan, as it is now known). SWARM is a central ramp metering algorithm embedded in Caltrans’ TMC software Advanced Transportation Management System (ATMS). SWARM has four algorithms:
(1) SWARM 2a: Point detector based algorithm
(2) SWARM 2b: Segment wide algorithm
(3) SWARM 2c: Mainline detector based algorithm
(4) SWARM 1: System wide algorithm SWARM is a centralized metering system hosted at the TMC. SWARM is very different from SATMS, SDRMS, and TOS. Basically, SWARM is developed on top of SATMS. Under SWARM, ramp meters in the field are directly controlled and operated by local traffic controllers running the SATMS ramp metering program—SWARM can not be set up without SATMS. SATMS needs mainline upstream detectors. The minimum detector requirement for SWARM is that each meter must have a corresponding mainline upstream detector. SWARM was tested in the late 1990s in District 12 (Orange County) but results were unsatisfactory. Later, it was tested along freeway 210 in District 7 and some benefits were found (H. Pham, et al, 2002). SWARM has been deployed in the Portland area since 2005. Its evaluation report shows that SWARM did not provide real benefit over the previous pre-time metering (Ahn, S. et al 2007). In California, District 7 has continued to request the refinement of SWARM as of the date of this report. Since SWARM is still under development, SWARM is not included in IRMP.

Chapter 8 IRMP implementation
8.1 Introduction The Integrated Ramp Metering Platform (IRMP) is a Paramics plugin tool that allows users to quickly configure and test ramp metering in the Paramics traffic simulator. Many experiences in Paramics API programming have been accumulated. Most of existing plugins are either developed without Graphical User Interface (GUI) or using Java. IRMP utilizes a user friendly GUI, which is implemented using the latest C# and .NET technology, to make the configuration and testing of ramp metering more intuitive. The advantages of C# and .NET technology are that it is both easy and fast to develop software in a .NET language (C#, VB.NET). Moreover, it is easy to create complex graphical user interfaces (GUIs) with .NET Windows Forms. In addition, data storing and communication in IRMP is based on the Extensible Markup Language (XML), which is the most popular data exchange method in modern software. The involvement of these advanced technologies takes the Paramics API programming to a new level. The development for IRMP is based on ParamicsNET. ParamicsNET is an intermediary between the Modeller v5.1 API and software written for the .NET platform that wants to interface with the Modeller API. ParamicsNET allows the user to build software that combines all of the functionality of a traditional C/C++ Modeller plugin, the ease and speed of developing software in a .NET language (C#, VB.NET), and easy to create complex graphical user interfaces (GUIs) with .NET Windows Forms. The ParamicsNET Plugin Manager is a generic manager for controlling user access to the ParamicsNET wrapper as well as handling loading, execution, and access control for all plugins written for ParamicsNET. Several plugins for the Modeller API have been rewritten to be compatible with ParamicsNET. They include Loop Aggregator, Probe, SATMS, SDRMS, and TOS. All plugins now have GUI interfaces that allow the user to interact with them in real-time. In addition, some plugins have been updated with new features. The Integrated Ramp Metering Platform (IRMP) is a plugin developed for ParamicsNET that allows a user to quickly and easily configure and insert meters into a simulation. It also provides real-time graphical data of the performance of meters.
Figure 8.1 Overview of ParamicsNET related software and their dependencies.
Software above is dependent on some or all of the software below it.
42

8.2 ParamicsNET ParamicsNET is a mixed native/managed .DLL written in Visual C++ 2005 that provides an interface between the Modeller API and managed (.NET) code. It provides interfaces for the entire Modeller API as of version 5.1. The main class is named Paramics. All of the functionality of the Modeller API can be accessed through this class. All public methods are marked as static so there is no need to instantiate any objects, simply call methods and get the results. EX: int vehicleTypeNum = Paramics.qpg_NET_vehicleTypes(); This is the same as making the call qpg_NET_vehicleTypes()in a standard plugin. All of the qpg* and qps* functions of the Modeller API follow the same naming convention as in the above example making it very easy to transition to using ParamicsNET as well as making it easy to port plugins to ParamicsNET. ParamicsNET also supports all of the qpo* and qpx* functions provided by the Modeller API. The qpx* functions are implemented as events that can be used by an unlimited number of plugins. The qpo* functions are implemented as delegates that can only be used by one plugin at a time.
EX: Paramics.qpx_NET_timeStep += new
Dqpx_NET_timeStep(Paramics_qpx_NET_timeStep);
private void Paramics_qpx_NET_timeStep()
{ string time_s = Paramics.qpg_UTL_integerToTimeString((int)ramptime);
} This code will register your method Paramics_qpx_NET_timeStep() with ParamicsNET and from that point on your method will be called at every time step. All qpx* functions follow the same naming scheme as seen in the above example. EX: Paramics.qpo_RTM_decision +=
new Dqpo_RTM_decision(Paramics_qpo_RTM_decision);
Paramics.UpdateQPOExclusions(); Again, all qpo* functions are implemented in a similar manner. The call to Paramics.UpdateQPOExclusions(); must be made before your method will be called. Multiple qpo* functions can be setup with a single call to Paramics.UpdateQPOExclusions();. In addition you must call the function
43

again after removing your function from the delegate before your method will stop being called. Each object (nodes, links, detectors, etc) in the Paramics API has a corresponding class in ParamicsNET. The ParamicsNET version of the object can be used in a way similar to how it is used in the standard API. In addition, some of the ParamicsNET objects support properties which allows the user to write less code than in the standard API. EX: int lanes = det.Link.Lanes; is the same as:
int lanes = Paramics.qpg_LNK_lanes(Paramics.qpg_DTC_link(det));
ParamicsNET is responsible for loading the ParamicsNET Plugin Manager. In order to use ParamicsNET the programmer file for the network should have the following two lines at the end of the file: ParamicsNET.dll exclude When ParamicsNET is loaded by Modeller it will load the ParamicsNET Plugin Manager. The Plugin Manager must be provided by ITS or the manager will fail to load and ParamicsNET will be unusable.
8.3 ParamicsNET Plugin Manager The Plugin Manager is responsible for loading and activating all ParamicsNET plugins. The Plugin Manager will automatically load all ParamicsNET plugins in the specified plugin directory. This directory may be specified through the Manager’s interface. The user is presented with the plugins that have been loaded and has the option of activating any number of plugins. A plugin can specify any plugins it is dependent on and those plugins will also be activated if needed. The Plugin Manager also provides a framework for individual plugin access control. A plugin needs to implement the IsAuthorized property to allow the Manager to handle access control. A plugin can request a reference to another loaded plugin. This is the primary way that plugins interact with each other. EX: DataPlugin dataPlugin =
(DataPlugin)Manager.ui.GetPluginByName("Data"); Manager is the main class of the Plugin Manager. It has a static member named ui which has the GetPluginByName() function which will return a loaded plugin with the same name that was passed in as a parameter. The variable dataPlugin now references the loaded DataPlugin object and can now be used directly.
44
45
8.4 Various Plugins Below is a list of plugins developed for IRMP.
A. Loop Aggregator A plugin that was ported to ParamicsNET that captures data at individual detectors and uses the Data plugin to store results.
B. Probe
A plugin that was ported to ParamicsNET that is similar to Loop Aggregator. It captures performance measurement data between two detectors.
C. UCISupport
A plugin that has functions used by various plugins developed at UCI.
D. Data
A plugin that allows for the storage of generic data produced by other plugins. It supports real-time capturing and streaming of data from and to other plugins. Also has a GUI for viewing all of the data currently being captured.
E. ALINEA, SATMS, SDRMS, TOS Ramp metering plugins that were ported to ParamicsNET.
The plugins that were ported to ParamicsNET generally have the same public interfaces as they do in the standard plugin versions and can be used in a similar manner. For example, the ramp metering plugins use the AddMeter() and RemoveMeter() for adding and removing meters from the simulation.
8.5 Integrated Ramp Metering Platform (IRMP) IRMP is a ParamicsNET plugin that simplifies the creation and insertion of meters into Modeller. IRMP itself does not do much more than integrate code from the other plugins into a single unified GUI. The meter specific elements of IRMP’s GUI are provided by the respective metering plugins. IRMP only embeds the plugin’s GUI into its own.
Similarly the Performance section of IRMP is really just an embedded control from the Data plugin. IRMP only sets up which data needs to be displayed by the control.

Chapter 9 IRMP user guide
9.1 Installation There is an installer for IRMP. The user just needs to run the setup program and then follow the instruction to install it to your computer.
The user needs to specify the installation folder. User must have Paramics to be installed in C:\Program Files\paramicsv5\ in order for this program to run correctly.
46
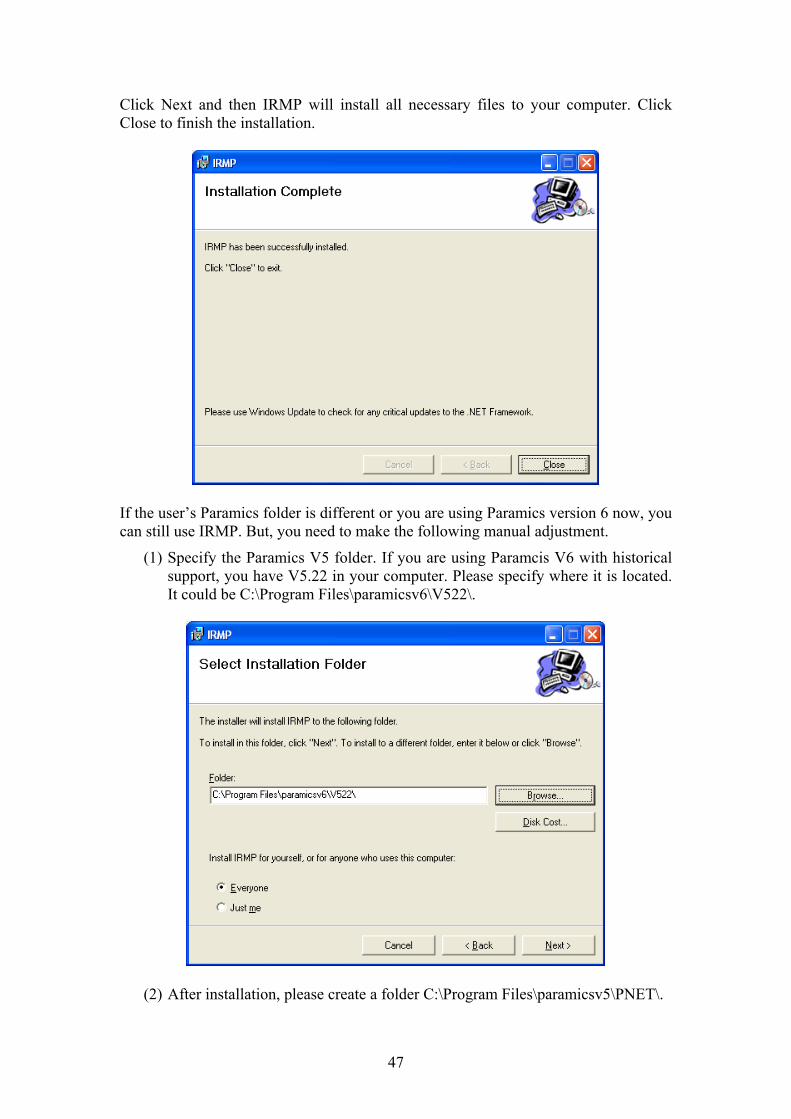
Click Next and then IRMP will install all necessary files to your computer. Click Close to finish the installation.
If the user’s Paramics folder is different or you are using Paramics version 6 now, you can still use IRMP. But, you need to make the following manual adjustment.
(1) Specify the Paramics V5 folder. If you are using Paramcis V6 with historical support, you have V5.22 in your computer. Please specify where it is located. It could be C:\Program Files\paramicsv6\V522\.
(2) After installation, please create a folder C:\Program Files\paramicsv5\PNET\.
47

(3) Copy all files in folder C:\Program Files\paramicsv6\V522\paramicsV5PNET to C:\Program Files\paramicsv5\PNET\.
9.2 How IRMP works IRMP needs to work as a plugin of a Paramics network. What you need to do next is to create a file called programming in your Paramics network. The content of the file is as follows:
ParamicsNET.dll exclude
By this, .NET wrapper, ParamicsNET.dll is called during simulation. When the network is loaded, ParamicsNET.dll calls PNETManager.dll, .NET plugin manager, to provide and display the list of plugins in the main interface. Then, the user can open the network with modeler.exe (please make sure its version is Paramics V5.2.2). After Modeller is loaded with the network, the main window of ParamicsNET will be shown.
48

Then, please check IRMP and then all involved plugins will be checked automatically as well.
Double click IRMP. If it is the first time to use IRMP, the following dialog will be shown. Click OK.
Then, the following IRMP main window is shown.
49

Users can open/create a new configuration file by right clicking Meters on the left side. How to add a new meter will be introduced later. After adding new meters and its scenarios, users need to save the configuration through File->Save Configuration As.
Users can open an existing configuration file through File->Load Configuration. The configuration file has an extension name “meters.”
50

After opening the file, existing meters and their setup will be displayed on the left side.
51

9.2.1 Meter setup A meter can be set up using different algorithms or using different settings under the same algorithm. The parameters in each algorithm have some similarities. The window below shows that a meter may be set up to employ different algorithms.
In order to add a new meter, the user needs to right click Meters on the left hand side. Then, the user can select “Add Meter”. A dialog window will be shown. The user needs to provide the name of the meter, which can be the metering location.
Click OK and the new meter will be shown on the left hand side.
52

Then, user needs to right click the added meter on the left hand side and then click “Add Scenario.” User needs to provide the scenario name, which is the name of the algorithm, which can be ALINEA, SATMS, SDRMS, or TOS.
Click OK and then the new scenario is added to the meter. The user needs to further setup the scenario. As shown in the figure below, algorithm ALINEA is shown by default although the user may have picked another algorithm. After performing a save in the next step, ALINEA is able to be changed to the algorithm on the left hand side.
53

Then, user needs to configure the new scenario by adding node to the right hand side. User needs to go to paramics Modeler window and right click a ramp meter node and then click “Select Node.”
Then, go back to IRMP GUI, select the metering algorithm on the right hand side and then press Add Node. All configuration of the meter will be filled into the form on the right hand side.
54

Users need to further set up TR Control plan and TOD plan in order to finish the setting of the scenario of the meter.
55

Users must click the Save button on the right hand side. Then, users must click File->Save Configurations As and then give a file name in order to save the configuration. In order to use the saved configuration file as the default configuration file to be opened automatically when IRMP is loaded with the network, users need to Click Options->Make Configuration Default.
For each meter, users can set up various algorithms/settings. Users need to pick one algorithm to be active before simulation. Metering should start and perform based on the active metering algorithm and its corresponding metering plan.
56

As mentioned earlier, IRMP can be used as a ramp metering design and evaluation tool. Let’s first introduce the design tool, and then the evaluation tool. 9.2.2 Design tool The design tool is used to analyze if meter performs as expected based on the collected detector data. Users can also analyze the traffic flow data and fundamental curves, as a way to analyze local traffic conditions and improve metering plans. In order to access the design tool, the user needs to click the Performance tab during simulation. The metering rates and traffic data are collected and displayed during simulation. These data/parameters include:
• Metering rate • Metering rate on each lane • Ramp flow • Mainline point flow • Mainline average flow per lane • Mainline point occupancy • Mainline point speed • Mainline smoothed volume (which is either 1-min or 3-min flow used by the
selected algorithm) • Mainline smoothed occupancy (which is either 1-min or 3-min occupancy
used by the selected algorithm)
57
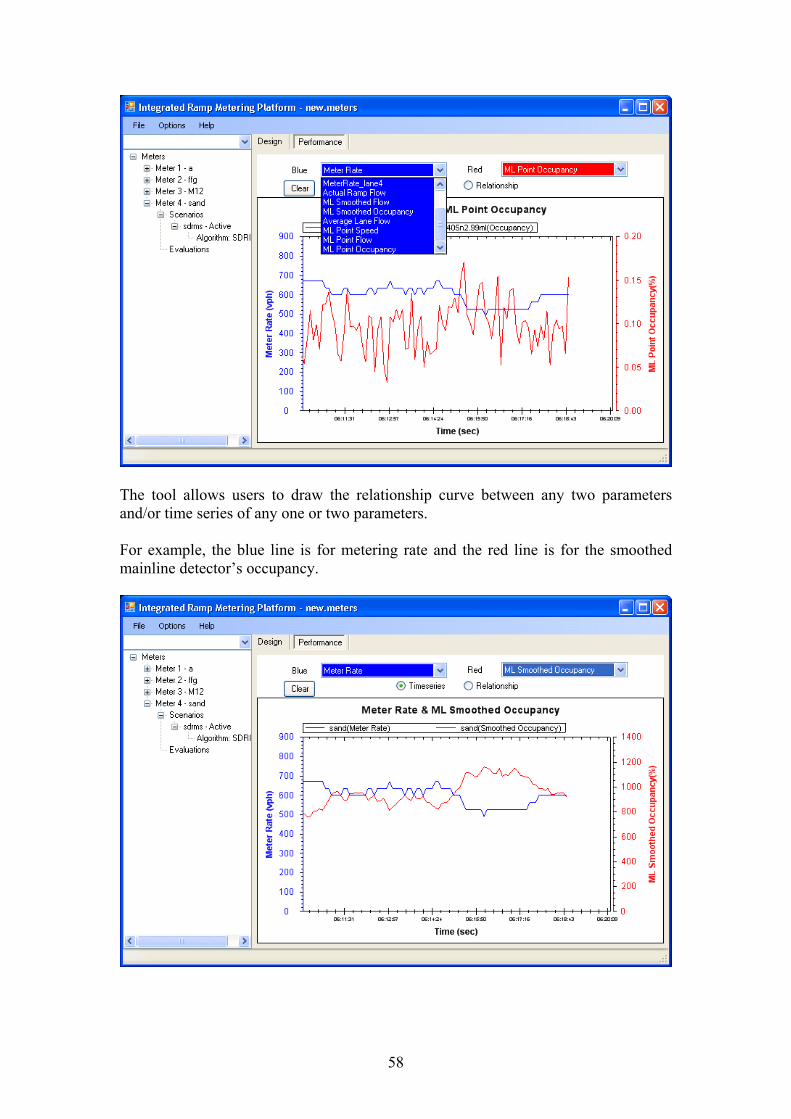
The tool allows users to draw the relationship curve between any two parameters and/or time series of any one or two parameters. For example, the blue line is for metering rate and the red line is for the smoothed mainline detector’s occupancy.
58

9.2.3 Evaluation tool Users can set up mainline delay and ramp delay data collection through the left-hand side menu. This is usually done before starting simulation. Meter performance can be shown in the Performance Tab under the Evaluation mode.
The performance measures that can be collected by IRMP include
• Ramp flow • Ramp delay • Ramp speed • Mainline section travel time • Mainline section speed • Mainline section delay • Mainline point flow • Mainline point speed • Mainline point occupancy
The evaluation tool allows users to draw the relationship curve between any two measures and/or time series of any one or two measures.
59
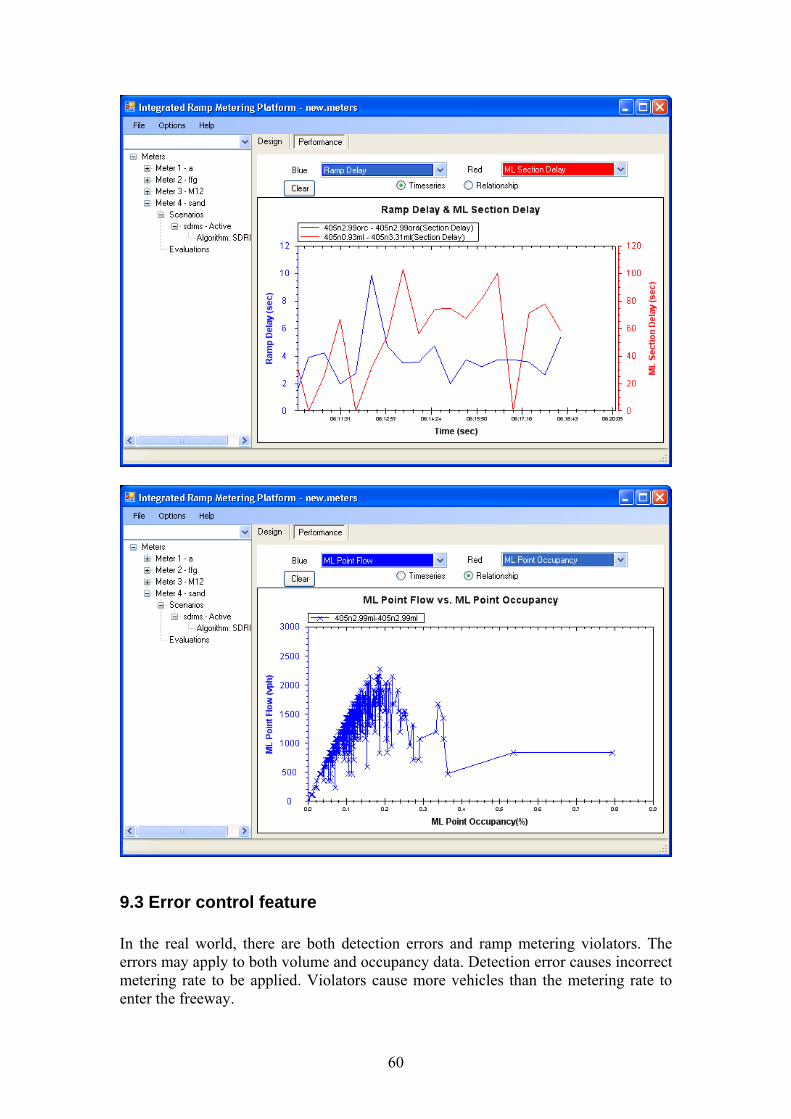
9.3 Error control feature In the real world, there are both detection errors and ramp metering violators. The errors may apply to both volume and occupancy data. Detection error causes incorrect metering rate to be applied. Violators cause more vehicles than the metering rate to enter the freeway.
60

IRMP has ability to set both the expected detection error and HOV violation rate.
In IRMP, it is assumed that detection error is evenly distributed around the true detection value for both volume and occupancy. The actual error is determined based on a random number generator, which has a seed number as the starting point. The violation is considered this way. If the calculated rate is b and the violation rate is a%, the actual metering rate is equal to b*(1+a). For example, the rate is 800 vph and the violation rate is 10%, the actual rate is 800*(1+0.1) = 880 vph.
61

Chapter 10 Conclusions and future work This report summarizes efforts on the development of an Integrated Ramp Metering design and evaluation Platform (IRMP). The platform was developed under Paramics, the primary microscopic traffic simulator in Caltrans. The latest programming language and technique including C#, .NET framework, and XML were used in the development. IRMP can be used as a ramp metering design and evaluation tool. The design tool is used to analyze if meter performs as expected based on the collected detector data. The evaluation tool is sued to evaluate how well metering performs. IRMP supports three existing ramp metering systems—SATMS, SDRMS and TOS—as well as a potential ramp metering algorithm, ALINEA. IRMP can also collect various performance measures that may apply to various ramp metering studies. Based on the testing, the prototype IRMP system developed can implement the expected functions defined by the authors. Some potential research and development can be continued based on the existing prototype IRMP. Some thoughts are listed as follows:
(1) Refine the current IRMP in order to make it more user-friendly based on users’ feedback
(2) Re-organize GUI based on user feedback & preference
(3) Add more design feature by incorporating experiences from Caltrans engineers
(4) Add data output and comparison function
(5) Upgrade to V6 when V6 has GUI functions
(6) Add more centralized algorithms like SWARM when having enough knowledge about it
(7) Make queue override strategies to be options for all algorithms
(8) Add ramp metering optimization function to IRMP
(9) Add ramp metering to the TMC operator training system that has been developed in the California ATMS testbed
62

References Ahn, S., Bertini, R.L., Auffray, B., Ross, J.H., and Eshel, O.,"Evaluating the Benefits of a System-Wide Adaptive Ramp-Metering Strategy in Portland.", Transportation Research Record: Journal of the Transportation Research Board No. 2012, Transportation Research Board of the National Academies, Washington, D.C., 2007. Caltrans (1986) SATMS 170 Controller Program users Instructions, Rev Date November 25, 1986. Caltrans District 11, Definitions & Descriptions of memory locations of user interest for California Type 170 Ramp Metering software, July 1999. Caltrans Traffic Operation Program, Ramp Meter Design Manual (2000), January 2000. Caltrans District 7, SWARM Study Final Report on W/B Foothill Freeway (W/B LA-210), October 2002. Caltrans District 4 (2004) TOS v2.1.1 User Instructions, 2004. CAMBRIDGE SYSTEMATICS (2001) Twin Cities Ramp Meter Evaluation – Final Report, Minnesota Department of Transportation, Feb., 2001. Chen C,-I., Cruz J. B. Jr and Paquet J. G. (1974). “Entrance ramp Control For travel Rate Maximization in Expressways.” Transp. Res., 8, 503-508. Chu, L., Liu X., Recker, W. (2003) Development of the Capability-Enhanced PARAMICS Simulation Environment, presented at the 82nd Transportation Research Board Annual Meeting, Washington D.C. Chu, L., Liu X., Recker, W., Zhang, H.M. (2004) Performance Evaluating of Adaptive Ramp Metering Algorithms Using Microscopic Traffic Simulation Model, Journal of Transportation Engineering, vol.130 (3), pp. 330-338. Emmanouil Smaragdis and Morkos Papageorgiou (2003) Series of New Local Ramp Metering Strategies. In Transportation Research Record: Journal of the Transportation Research Board. No 1856. Transportation Research Board of the National Academies. Washington, D.C. 2003. pp. 74-86. Hasan, M., Jha, M., and Ben-Akiva, M. (2002) Evaluation of ramp control algorithms using microscopic traffic simulation, Vol.10 (3), pp. 171-256. Jacobsen, L., Henry, K., and Mahyar, O. (1989). “Real-Time Metering Algorithm for Centralized Control.” Transp. Res. Rec., 1232, 17-26. Lau R. (1997). Ramp Metering by Zone – The Minnesota Algorithm, Minnesota Department of Transportation.
63

64
NET (1996) System Wide Adaptive Ramp Metering - High Level Design, Final Draft, Prepared by NET for Caltrans and FHWA, June 19, 1996. Paesani, G., Kerr, J., Perovich, P., and Khosravi, E. (1997). “System Wide Adaptive Ramp Metering In Southern California.” Conf. Proc., 7th Annual Meeting, ITS America. Papageorgiou, M., Hadj Salem, H., and Blosseville, J. M. (1991). “ALINEA: A Local Feedback Control Law for On-Ramp Metering.” Transp. Res. Rec. 1320, 58-64. Papageorgiou, M., Hadj-Salem, and H., Middelham, F. (1997). “ALINEA Local Ramp Metering: Summary of field Results.” Transp. Res. Rec. 1603, 90-98. Powell P. (2003) URMS User Manual Version 1.1.9 October 10, 2003 for the Universal Ramp Metering Software (URMS) Project, October 10, 2003. Taylor, C., Meldrum, D. and Jacobson, L. (1998) Fuzzy Ramp Metering: Design Overview and Simulation Results, Transp. Res. Rec. 1634, 10-18. Zhang, H. and S. G. Ritchie (1997) “Freeway ramp metering using artificial neural networks,” Transp. Res., 5C(5), 273-286. Zhang, H., Ritchie, S. G. and W. W. Recker (1996) “Some General Results on the Optimal Ramp Control Problem.” Transp. Res., 4C(2), 51-69.