Raman Microscopy in Pharmaceutical Salt Analysis - …€¦ · Raman Microscopy in Pharmaceutical...
2
Raman Microscopy in Pharmaceutical Salt Analysis Pharmaceutical and crystallographic samples typically require detailed characterisation and analysis to optimise a samples stability, physical properties and indeed general efficacy where an active drug substance is involved. Furthermore, strict regulatory and manufacturing procedures demand precise characterisation of a solid salt form drug candidate and the possible influence of environmental conditions. The hydration and structure of such samples under varying conditions is important in this full characterisation. The highly specific spectral information provided by Raman spectroscopy can elucidate polymorphic form, crystallinity and hydration of a sample - giving a far better characterisation and understanding of drug candidates physical state. For this reason, the LabRAM series of instruments has become an important analytical tool for many pharmaceutical researchers and corporations. Humidity/Vapour pressure cell The use of a specialised Humidity/Vapour pressure cell with the LabRAM can now enable researchers to study the chemistry and physical state of a sample under various environmental conditions: • Moisture induced phase transitions • Swelling of particles and granules • Degradation and caking of foodstuffs • Capillary condensation and bridging • Microbial growth • Dissolution of solids • Formation of hydrates • Selective hydration • Polymorphic transitions • Surface heterogeneity • Molecular structural changes • Deliquescence % RH Salt hydration activity Morphine C 17 H 19 NO 3 , (the principle alkaloid of opium) and its various salts are a relatively well know group of analgesic drugs. They form different crystalline structures depending upon conditions and composition. To study the effects of water vapour upon the states of a particular Sulphate salt, the VGI 2000 vapour pressure stage was attached to the LabRam Confocal Raman microscope system. The stage is capable of varying the relative humidity above the sample and with the use of a LWD 50x microscope objective and the narrow confocal aperture of the LabRAM, Raman measurements were easily possible through the standard double BK7 glass window of the stage without any major effect on the quality of the spectral output. Explore the future Automotive Test Systems | Process & Environmental | Medical | Semiconductor | Scientific Raman Spectroscopy RA29 Pharmaceuticals A p p l i c a t i o n N o t e Figure 1: Raman spectrum of a Morphine Sulphate pentahydrate salt – the spectrum is rich in spectroscopic information
Transcript of Raman Microscopy in Pharmaceutical Salt Analysis - …€¦ · Raman Microscopy in Pharmaceutical...

Raman Microscopy in Pharmaceutical Salt Analysis
Pharmaceutical and crystallographic samples typically require detailed characterisation and analysis to optimise a samples stability, physical properties and indeed general efficacy where an active drug substance is involved.Furthermore, strict regulatory and manufacturing procedures demand precise characterisation of a solid salt form drug candidate and the possible influence of environmental conditions. The hydration and structure of such samples under varying conditions is important in this full characterisation.
The highly specific spectral information provided by Raman spectroscopy can elucidate polymorphic form, crystallinity and hydration of a sample - giving a far better characterisation and understanding of drug candidates physical state. For this reason, the LabRAM series of instruments has become an important analytical tool for many pharmaceutical researchers and corporations.
Humidity/Vapour pressure cell
The use of a specialised Humidity/Vapour pressure cell with the LabRAM can now enable researchers to study the chemistry and physical state of a sample under various environmental conditions:
• Moisture induced phase transitions• Swelling of particles and granules• Degradation and caking of foodstuffs• Capillary condensation and bridging• Microbial growth• Dissolution of solids• Formation of hydrates• Selective hydration• Polymorphic transitions• Surface heterogeneity• Molecular structural changes• Deliquescence % RH
Salt hydration activity
Morphine C17H19NO3, (the principle alkaloid of opium) and its various salts are a relatively well know group of analgesic drugs. They form different crystalline structures depending upon conditions and composition.
To study the effects of water vapour upon the states of a particular Sulphate salt, the VGI 2000 vapour pressure stage was attached to the LabRam Confocal Raman microscope system.
The stage is capable of varying the relative humidity above the sample and with the use of a LWD 50x microscope objective and the narrow confocal aperture of the LabRAM, Raman measurements were easily possible through the standard double BK7 glass window of the stage without any major effect on the quality of the spectral output.
Explore the future Automotive Test Systems | Process & Environmental | Medical | Semiconductor | Scientific
Raman SpectroscopyRA29
PharmaceuticalsApplication Note
Figure 1: Raman spectrum of a Morphine Sulphate pentahydrate salt – the spectrum is rich in spectroscopic information
2
Explore the future Automotive Test Systems | Process & Environmental | Medical | Semiconductor | Scientific
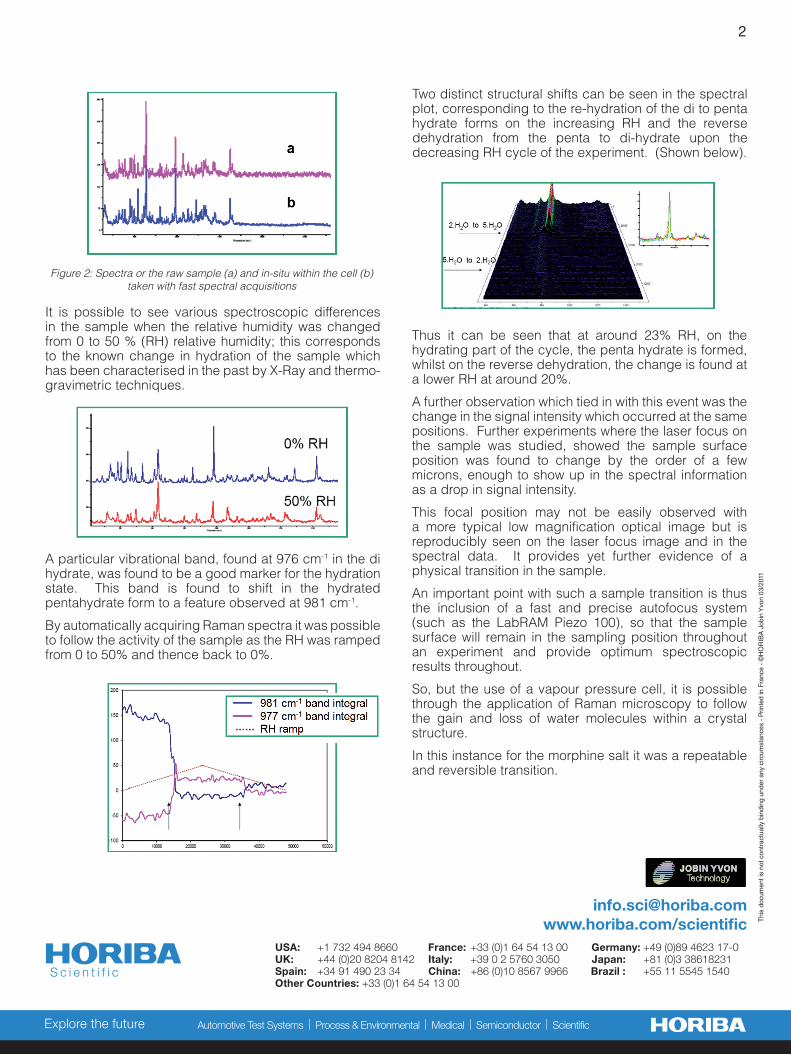
It is possible to see various spectroscopic differences in the sample when the relative humidity was changed from 0 to 50 % (RH) relative humidity; this corresponds to the known change in hydration of the sample which has been characterised in the past by X-Ray and thermo-gravimetric techniques.
A particular vibrational band, found at 976 cm-1 in the di hydrate, was found to be a good marker for the hydration state. This band is found to shift in the hydrated pentahydrate form to a feature observed at 981 cm-1.
By automatically acquiring Raman spectra it was possible to follow the activity of the sample as the RH was ramped from 0 to 50% and thence back to 0%.
Two distinct structural shifts can be seen in the spectral plot, corresponding to the re-hydration of the di to penta hydrate forms on the increasing RH and the reverse dehydration from the penta to di-hydrate upon the decreasing RH cycle of the experiment. (Shown below).
Thus it can be seen that at around 23% RH, on the hydrating part of the cycle, the penta hydrate is formed, whilst on the reverse dehydration, the change is found at a lower RH at around 20%.
A further observation which tied in with this event was the change in the signal intensity which occurred at the same positions. Further experiments where the laser focus on the sample was studied, showed the sample surface position was found to change by the order of a few microns, enough to show up in the spectral information as a drop in signal intensity.
This focal position may not be easily observed with a more typical low magnification optical image but is reproducibly seen on the laser focus image and in the spectral data. It provides yet further evidence of a physical transition in the sample.
An important point with such a sample transition is thus the inclusion of a fast and precise autofocus system (such as the LabRAM Piezo 100), so that the sample surface will remain in the sampling position throughout an experiment and provide optimum spectroscopic results throughout.
So, but the use of a vapour pressure cell, it is possible through the application of Raman microscopy to follow the gain and loss of water molecules within a crystal structure.
In this instance for the morphine salt it was a repeatable and reversible transition.
[email protected]/scientific
USA: +1 732 494 8660 France: +33 (0)1 64 54 13 00 Germany: +49 (0)89 4623 17-0UK: +44 (0)20 8204 8142 Italy: +39 0 2 5760 3050 Japan: +81 (0)3 38618231Spain: +34 91 490 23 34 China: +86 (0)10 8567 9966 Brazil : +55 11 5545 1540 Other Countries: +33 (0)1 64 54 13 00
Thi
s do
cum
ent i
s no
t con
trac
tual
ly b
indi
ng u
nder
any
circ
umst
ance
s -
Prin
ted
in F
ranc
e -
©H
OR
IBA
Job
in Y
von
03/2
011
Figure 2: Spectra or the raw sample (a) and in-situ within the cell (b) taken with fast spectral acquisitions