Ralph Norris - Personal banking including accounts, credit ... · Ralph Norris CHIEF EXECUTIVE...
18
Commonwealth Bank of Australia ACN 123 123 124 Ralph Norris CHIEF EXECUTIVE OFFICER Credit Suisse Asian Investment Conference 25 March 2010 Determined to be better than we’ve ever been.
Transcript of Ralph Norris - Personal banking including accounts, credit ... · Ralph Norris CHIEF EXECUTIVE...

Commonwealth Bank of Australia ACN 123 123 124
Ralph NorrisCHIEF EXECUTIVE OFFICER
Credit Suisse Asian Investment Conference
25 March 2010
Determined to be better than we’ve ever been.

2
This page has been intentionally left blank.

3
Disclaimer
The material that follows is a presentation of general background information
about the Bank’s activities current at the date of the presentation,
25 March 2010. It is information given in summary form and does not purport
to be complete. It is not intended to be relied upon as advice to investors or
potential investors and does not take into account the investment objectives,
financial situation or needs of any particular investor. These should be
considered, with or without professional advice when deciding if an
investment is appropriate.

4
Market shares
Dec 09 Jun 09 Dec 08
CBA BWA Combined CBA + BWA CBA + BWA
Home loans 22.5% 3.5% 26.0% 25.2% 23.2%
Credit cards 2 19.4% 2.5% 21.9% 21.5% 20.9%
Personal lending 14.2% 0.9% 15.0% 15.7% 20.2%
Household deposits 28.1% 3.1% 31.3% 32.3% 32.6%
Retail deposits 22.7% 3.9% 26.6% 26.6% 27.2%
Business lending – APRA 12.9% 5.9% 18.8% 19.4% 18.2%
Business lending – RBA 13.6% 3.5% 17.1% 16.8% 16.6%
Business deposits – APRA 16.1% 5.6% 21.7% 20.7% 22.0%
Equities trading (CommSec) : Total 6.9% n/a 6.9% 6.4% 6.0%
Australian retail funds – administrator view 14.3% 0.2% 14.5% 14.4% 14.1%
FirstChoice platform 10.4% n/a 10.4% 10.2% 9.8%
Australia life insurance (total risk) 14.4% 0.9% 15.3% 15.6% 15.5%
Australia life insurance (individual risk) 13.4% 1.2% 14.6% 14.7% 14.5%
NZ lending for housing 23.3% n/a 23.3% 23.3% 23.4%
NZ retail deposits 21.4% n/a 21.4% 21.2% 21.6%
NZ lending to business 9.2% n/a 9.2% 8.8% 8.5%
NZ retail FUM 18.0% n/a 18.0% 20.3% 19.1%
NZ annual inforce premiums 31.3% n/a 31.3% 31.7% 31.7%
1 Including St Andrew’s
2 As at November 2009
3 Bankwest market share impacted by reclassifications. Comparatives not restated
1
3
1 1

5
Strong operating performance
Dec 09
Cash NPAT $2,943m
ROE 18.5%
Tier 1 Capital 9.1%
Cash EPS (cents) 191.7
Interim Dividend (cents) 120.0
Strong financial performance
Good momentum in all businesses
Strategy driven result
Prudent business settings maintained
Well positioned for growth

6
Disciplined strategy execution delivering results
Over 1,000 new front
line service
staff added
Dedicated Group
Executive appointed
Core Banking –
targeting quantum
improvements in
service and efficiency
Engagement now top
20% world-wide1
Bankwest acquisition
at 0.7x book value
CommSee provides
single view of
customer at the
frontline
Distribution footprint
expanded to 45
Business Banking
Centres Australia-wide
Market leading online
banking presence –
NetBank, CommSec,
CommBiz, FirstChoice
Significant
improvement in
Group-wide safety
scores
Targeted growth
in Asia
Retail Deposits Suite
awarded Canstar
CANNEX 5-Star rating
80% of branches now
supported by local
business bankers
“60 minute Home
Loan” – 59% of loans
conditionally approved
and printed in branch
Internal Customer
Service scores
trending higher
CFS GAM diversified
earnings and
expansion
Retail Bank branch
transformation
programme: >200
sites refurbished /
upgraded
“CommBiz” - market
leading transactional
online banking
presence
System reliability
significantly enhanced
Very low turnover rate
relative to industry
Significant
improvement in
products-per-customer
and referral conversion
rates
Customer
Satisfaction
Business
Banking
Technology and
Operational
Excellence
Trust and
Team Spirit
Profitable
Growth
1 Source: Gallup

7
A clear, focussed strategy
Australia’s finest
financial services
organisation
Customer
Satisfaction
Business
Banking
Trust and
Team Spirit
Technology and
Operational
Excellence
Profitable
Growth

8
Other key information
Home lending Business lending
Household deposits Business deposits
26.0%
12.5% 13.2%
24.1%
CBA / Bankwest
Peer 1 Peer 2 Peer 3
31.3%
13.8% 13.4%
23.6%
CBA / Bankwest
Peer 1 Peer 2 Peer 3
18.8%17.4%
19.1%
15.5%
CBA / Bankwest
Peer 1 Peer 2 Peer 3
21.7%
17.0%
23.2%21.4%
CBA / Bankwest
Peer 1 Peer 2 Peer 3
Market Shares
1.8
1.9
2.0
2.1
2.2
2.3
2.4
2.5
2.6
Jun 07 Dec 07 Jun 08 Dec 08 Jun 09 Dec 09
CBA Peers
* From Jun 07 to Dec 09
Age 14+, 6mth
moving average
Products per customer*
Avg number of products held
per financial institution
Peer 2: +9.5%
Peer 3: +9.5%
Peer 4: +10.5%
CBA: +19.0%
Movement*
Peer 1: +8.7%
* Refer notes page at back of presentation for source information
9
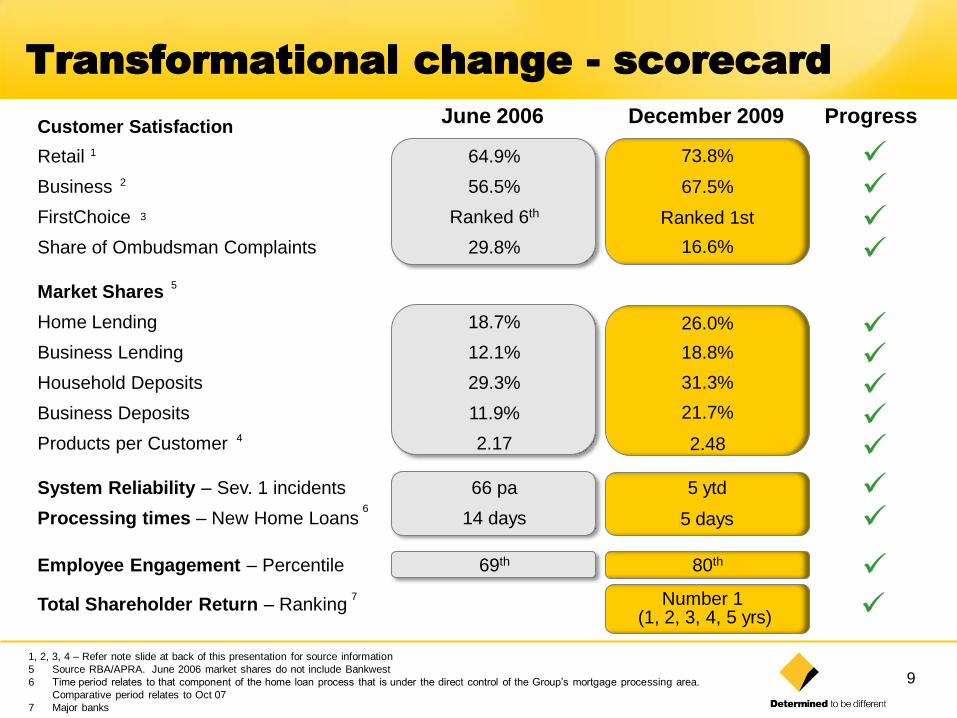
Transformational change - scorecard
Customer Satisfaction
Retail 64.9%
Business 56.5%
FirstChoice Ranked 6th
Share of Ombudsman Complaints 29.8%
Market Shares
Home Lending 18.7%
Business Lending 12.1%
Household Deposits 29.3%
Business Deposits 11.9%
Products per Customer 2.17
System Reliability – Sev. 1 incidents 66 pa
Processing times – New Home Loans 14 days
Employee Engagement – Percentile 69th
Total Shareholder Return – Ranking
1
5
1, 2, 3, 4 – Refer note slide at back of this presentation for source information
5 Source RBA/APRA. June 2006 market shares do not include Bankwest
6 Time period relates to that component of the home loan process that is under the direct control of the Group’s mortgage processing area.
Comparative period relates to Oct 07
7 Major banks
2
3
4
6
73.8%
67.5%
Ranked 1st
16.6%
5 ytd
5 days
80th
June 2006 December 2009
7
26.0%
18.8%
31.3%
21.7%
2.48
Number 1 (1, 2, 3, 4, 5 yrs)
Progress

10
Notes

11
Areas of strategic focus – near term
Continued drive to be Number 1 in customer satisfaction
Core Banking Modernisation;
On schedule - early phases very encouraging
All customer information migrated, 3 live trials underway
Quantum improvements in customer service and efficiency
Further leverage of diversified business mix;
Strong domestic retail banking franchise
Business banking upside
Wealth management growth
Profitable growth opportunities

12
1 month liquidity coverage ratio On APRA proposals, potential doubling of liquid asset requirement for Group and industry
Govt securities insufficient to meet market demand under narrower definition
>12 month funding for assets not deemed to be readily converted to cash on BIS proposals (eg, home loans)
Significant pricing impact for customers Potential economic impact as lending capacity either constrained or
sub-economic in sectors such as household and small business Additional funding requirements raise questions about market
capacity/constraints
Regulatory and other reform
Potential issues and implicationsKey proposals
New measure – Tier 1 Common
Equity
More stringent conditions for hybrids
Revised regulatory deductions
methodology
Increase in required capital levels
Reduction in hybrid issuance
Greater instance of 100% deductions against Tier 1, rather than 50:50 Tier 1
and Tier 2
Leverage ratio: New measure, capital
over exposures. No minimum ratio yet
set. Expected to be supplementary
Blunt measure – no recognition of underlying asset quality
Potential impact on size and nature of balance sheet
Accounting rule changes (likely 3 yrs
to implement). Credit losses
recognised by charging annual result
with expected loss over the life of a
loan rather than losses as incurred
Potentially not fit for purpose, with unintended consequences
High cost to implement, as changes required to performance-target setting
& pricing models
Increased subjectivity in cash flow models
Attempts to reduce pro-cyclicality
Balance sheet and capital impact unclear
Cap
ital
Liq
uid
ity
Ris
k a
nd
p
rovis
ion
ing
Narrowing definition of qualifying liquid
assets to govt securities and cash
Net Stable Funding Ratio, minimum
term funding requirement

13
Constructive dialogue on key reforms
Consumer
Liquidity
Other
Capital
1 month liquidity buffer
Qualifying assets narrowed
Net stable funding ratio
Tier 1 capital – qualifying assets, hybrids
Deductions methodology – Tier 1 impact
Leverage ratio
Rating agency models changing
Australian Credit Law Reform
Cooper Review and Ripoll Inquiry
Wealth Management fee models and
product simplification
Provisioning
Governance and remuneration
Henry Tax Review
Overseas change

14
As at June
2006 2007 2008 2009 2010 (f) 2011 (f)
Credit Growth % – Total 14.4 15.5 12.0 3.3 5-7 8-10
Credit Growth % – Housing 13.7 12.9 9.8 7.0 9-11 9-11
Credit Growth % – Business 16.6 19.2 17.1 0.4 0-2 8-10
Credit Growth % – Other Personal 9.7 16.1 3.3 -7.1 1-3 3-5
GDP % 2.6 5.3 2.4 0.6 2.7 3.0
CPI % 4.0 2.1 4.5 1.5 2.9 3.1
Unemployment rate % 4.8 4.3 4.2 5.7 5.7 5.5
Cash Rate % 5¾ 6¼ 7¼ 3 4½ 5
CBA Economists Forecasts
Credit Growth, GDP and CPI = 12 months to June
Unemployment = June quarter
Cash Rate = June month
CBA Economists summary of key indicatorsEconomic
Summary

15
Outlook
Global outlook has improved
Sustainable economic recovery under way in Australia
Increased credit growth
Continued funding cost pressure
Impairments expected to decline gradually
Some global downside risks still exist
Group retains conservative financial settings

16
Notes

17
A very good, quality result
Clear, focussed strategy Delivering results
Good momentum Some headwinds
Strong growth Income up 10%
Careful cost management Costs up 1% this half
Strong balance sheet Tier 1 Capital over 9%
Conservative provisioning $1.4bn management overlay
Delivering high ROE 18.5%

Commonwealth Bank of Australia ACN 123 123 124
Ralph NorrisCHIEF EXECUTIVE OFFICER
Credit Suisse Asian Investment Conference
25 March 2010
Determined to be better than we’ve ever been.