Rakuten, Inc. and Consolidated Subsidiaries
35
Rakuten, Inc. and Consolidated Subsidiaries Consolidated Financial Statements for the Years Ended December 31, 2009 and 2008
Transcript of Rakuten, Inc. and Consolidated Subsidiaries
Rakuten, Inc. and Consolidated Subsidiaries Consolidated Financial Statements for the Years Ended December 31, 2009 and 2008
2
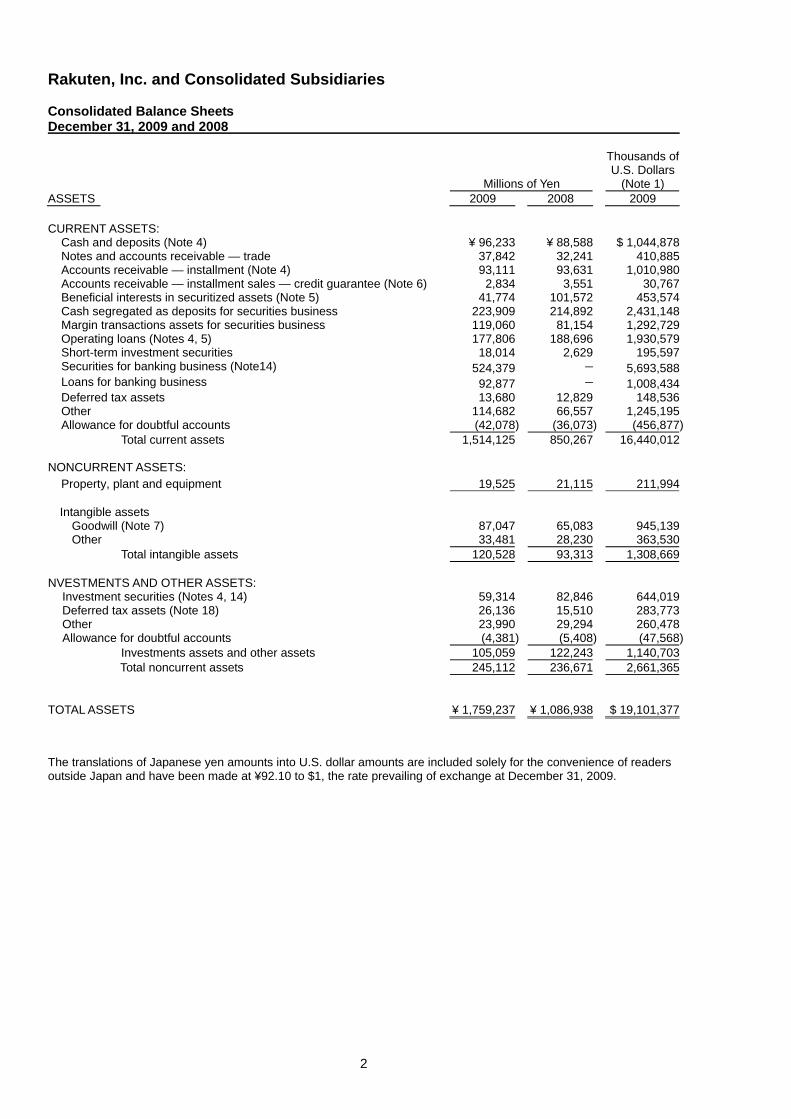
Rakuten, Inc. and Consolidated Subsidiaries Consolidated Balance Sheets December 31, 2009 and 2008
Millions of Yen
Thousands of U.S. Dollars
(Note 1) ASSETS 2009 2008 2009 CURRENT ASSETS: Cash and deposits (Note 4) ¥ 96,233 ¥ 88,588 $ 1,044,878 Notes and accounts receivable — trade 37,842 32,241 410,885 Accounts receivable — installment (Note 4) 93,111 93,631 1,010,980 Accounts receivable — installment sales — credit guarantee (Note 6) 2,834 3,551 30,767 Beneficial interests in securitized assets (Note 5) 41,774 101,572 453,574 Cash segregated as deposits for securities business 223,909 214,892 2,431,148 Margin transactions assets for securities business 119,060 81,154 1,292,729 Operating loans (Notes 4, 5) 177,806 188,696 1,930,579 Short-term investment securities 18,014 2,629 195,597 Securities for banking business (Note14) 524,379 — 5,693,588 Loans for banking business 92,877 — 1,008,434 Deferred tax assets 13,680 12,829 148,536 Other 114,682 66,557 1,245,195 Allowance for doubtful accounts (42,078) (36,073) (456,877) Total current assets 1,514,125 850,267 16,440,012 NONCURRENT ASSETS: Property, plant and equipment 19,525 21,115 211,994
Intangible assets Goodwill (Note 7) 87,047 65,083 945,139 Other 33,481 28,230 363,530
Total intangible assets 120,528 93,313 1,308,669 NVESTMENTS AND OTHER ASSETS:
Investment securities (Notes 4, 14) 59,314 82,846 644,019 Deferred tax assets (Note 18) 26,136 15,510 283,773 Other 23,990 29,294 260,478 Allowance for doubtful accounts (4,381) (5,408) (47,568)
Investments assets and other assets 105,059 122,243 1,140,703 Total noncurrent assets 245,112 236,671 2,661,365
TOTAL ASSETS ¥ 1,759,237 ¥ 1,086,938 $ 19,101,377 The translations of Japanese yen amounts into U.S. dollar amounts are included solely for the convenience of readers outside Japan and have been made at ¥92.10 to $1, the rate prevailing of exchange at December 31, 2009.
3
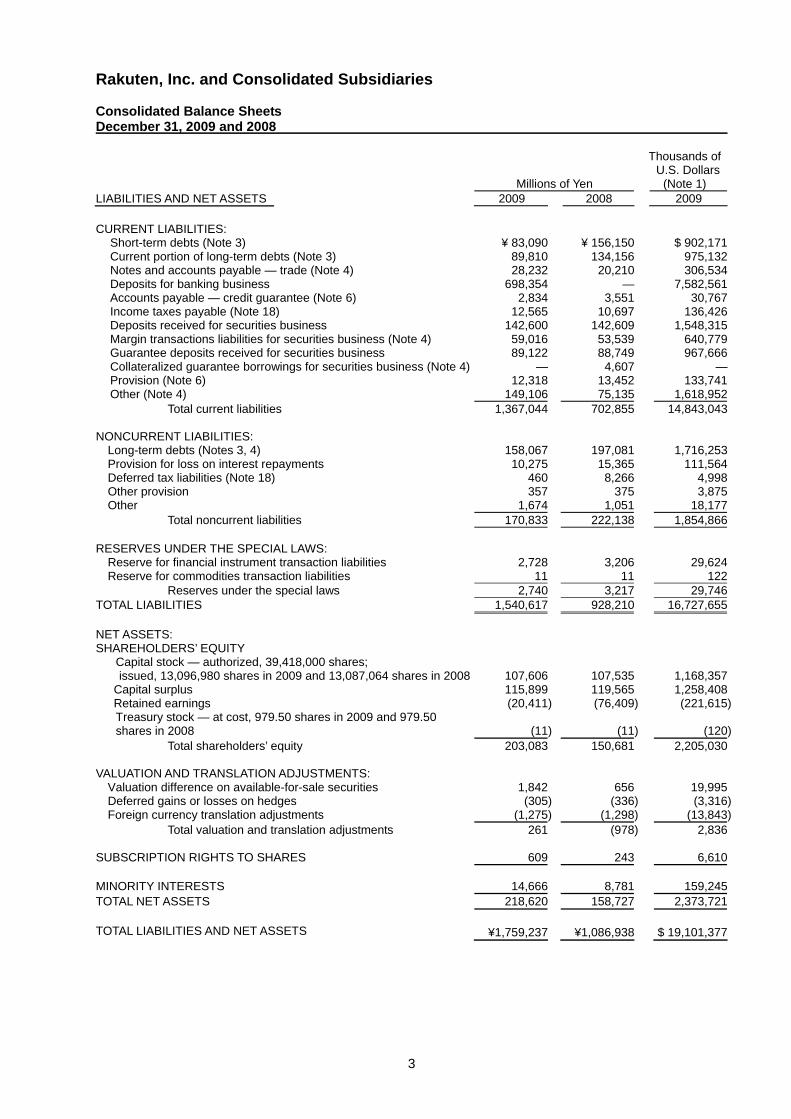
Rakuten, Inc. and Consolidated Subsidiaries Consolidated Balance Sheets December 31, 2009 and 2008
Millions of Yen
Thousands of U.S. Dollars
(Note 1) LIABILITIES AND NET ASSETS 2009 2008 2009 CURRENT LIABILITIES:
Short-term debts (Note 3) ¥ 83,090 ¥ 156,150 $ 902,171 Current portion of long-term debts (Note 3) 89,810 134,156 975,132 Notes and accounts payable — trade (Note 4) 28,232 20,210 306,534 Deposits for banking business 698,354 — 7,582,561 Accounts payable — credit guarantee (Note 6) 2,834 3,551 30,767 Income taxes payable (Note 18) 12,565 10,697 136,426 Deposits received for securities business 142,600 142,609 1,548,315 Margin transactions liabilities for securities business (Note 4) 59,016 53,539 640,779 Guarantee deposits received for securities business 89,122 88,749 967,666 Collateralized guarantee borrowings for securities business (Note 4) — 4,607 — Provision (Note 6) 12,318 13,452 133,741 Other (Note 4) 149,106 75,135 1,618,952
Total current liabilities 1,367,044 702,855 14,843,043 NONCURRENT LIABILITIES:
Long-term debts (Notes 3, 4) 158,067 197,081 1,716,253 Provision for loss on interest repayments 10,275 15,365 111,564 Deferred tax liabilities (Note 18) 460 8,266 4,998 Other provision 357 375 3,875 Other 1,674 1,051 18,177
Total noncurrent liabilities 170,833 222,138 1,854,866 RESERVES UNDER THE SPECIAL LAWS:
Reserve for financial instrument transaction liabilities 2,728 3,206 29,624 Reserve for commodities transaction liabilities 11 11 122
Reserves under the special laws 2,740 3,217 29,746 TOTAL LIABILITIES 1,540,617 928,210 16,727,655 NET ASSETS: SHAREHOLDERS’ EQUITY
Capital stock — authorized, 39,418,000 shares; issued, 13,096,980 shares in 2009 and 13,087,064 shares in 2008 107,606 107,535 1,168,357 Capital surplus 115,899 119,565 1,258,408 Retained earnings (20,411) (76,409) (221,615)Treasury stock — at cost, 979.50 shares in 2009 and 979.50 shares in 2008 (11) (11) (120)
Total shareholders’ equity 203,083 150,681 2,205,030 VALUATION AND TRANSLATION ADJUSTMENTS:
Valuation difference on available-for-sale securities 1,842 656 19,995 Deferred gains or losses on hedges (305) (336) (3,316)Foreign currency translation adjustments (1,275) (1,298) (13,843)
Total valuation and translation adjustments 261 (978) 2,836 SUBSCRIPTION RIGHTS TO SHARES 609 243 6,610 MINORITY INTERESTS 14,666 8,781 159,245 TOTAL NET ASSETS 218,620 158,727 2,373,721 TOTAL LIABILITIES AND NET ASSETS ¥1,759,237 ¥1,086,938 $ 19,101,377
4
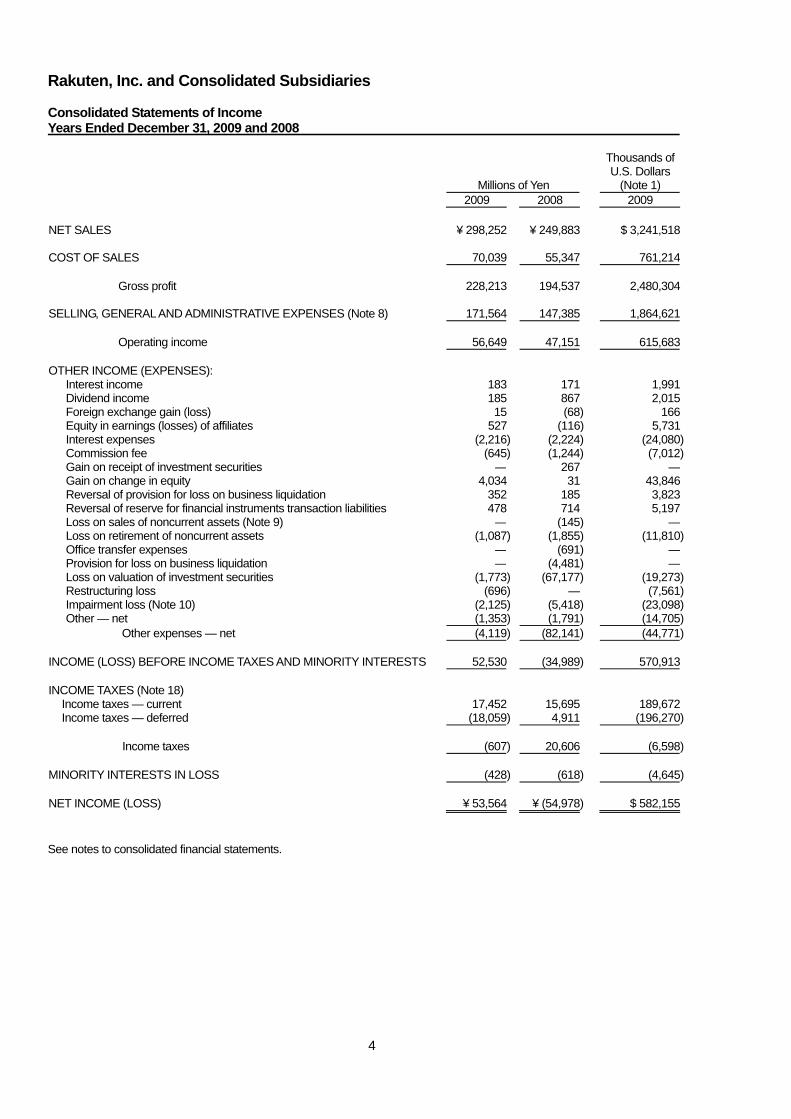
Rakuten, Inc. and Consolidated Subsidiaries Consolidated Statements of Income Years Ended December 31, 2009 and 2008
Millions of Yen
Thousands of U.S. Dollars
(Note 1) 2009 2008 2009
NET SALES ¥ 298,252 ¥ 249,883 $ 3,241,518 COST OF SALES 70,039 55,347 761,214
Gross profit 228,213 194,537 2,480,304 SELLING, GENERAL AND ADMINISTRATIVE EXPENSES (Note 8) 171,564 147,385 1,864,621
Operating income 56,649 47,151 615,683 OTHER INCOME (EXPENSES):
Interest income 183 171 1,991 Dividend income 185 867 2,015 Foreign exchange gain (loss) 15 (68) 166 Equity in earnings (losses) of affiliates 527 (116) 5,731 Interest expenses (2,216) (2,224) (24,080)Commission fee (645) (1,244) (7,012)Gain on receipt of investment securities — 267 — Gain on change in equity 4,034 31 43,846 Reversal of provision for loss on business liquidation 352 185 3,823 Reversal of reserve for financial instruments transaction liabilities 478 714 5,197 Loss on sales of noncurrent assets (Note 9) — (145) — Loss on retirement of noncurrent assets (1,087) (1,855) (11,810)Office transfer expenses — (691) — Provision for loss on business liquidation — (4,481) — Loss on valuation of investment securities (1,773) (67,177) (19,273)Restructuring loss (696) — (7,561)Impairment loss (Note 10) (2,125) (5,418) (23,098)Other — net (1,353) (1,791) (14,705)
Other expenses — net (4,119) (82,141) (44,771) INCOME (LOSS) BEFORE INCOME TAXES AND MINORITY INTERESTS 52,530 (34,989) 570,913 INCOME TAXES (Note 18) Income taxes — current 17,452 15,695 189,672 Income taxes — deferred (18,059) 4,911 (196,270) Income taxes (607) 20,606 (6,598) MINORITY INTERESTS IN LOSS (428) (618) (4,645) NET INCOME (LOSS) ¥ 53,564 ¥ (54,978) $ 582,155 See notes to consolidated financial statements.
5
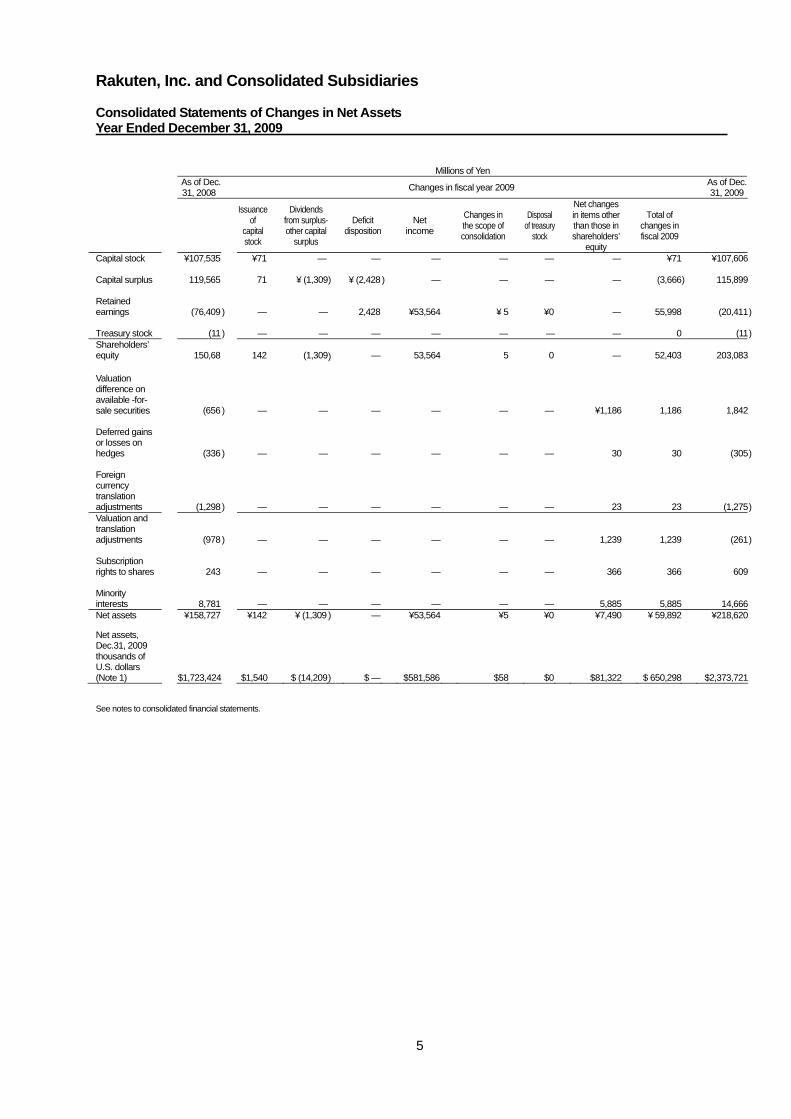
Rakuten, Inc. and Consolidated Subsidiaries Consolidated Statements of Changes in Net Assets Year Ended December 31, 2009
See notes to consolidated financial statements.
Millions of Yen
As of Dec. 31, 2008 Changes in fiscal year 2009 As of Dec.
31, 2009
Issuance of
capital stock
Dividends from surplus-other capital
surplus
Deficit disposition Net
income Changes in the scope ofconsolidation
Disposal
of treasury stock
Net changes in items other than those in shareholders’
equity
Total of
changes in fiscal 2009
Capital stock ¥107,535 ¥71 — — — — — — ¥71 ¥107,606
Capital surplus 119,565 71 ¥ (1,309) ¥ (2,428 ) — — — — (3,666) 115,899
Retained earnings
(76,409 ) — — 2,428 ¥53,564 ¥ 5 ¥0 — 55,998 (20,411)
Treasury stock (11 ) — — — — — — — 0 (11) Shareholders’ equity
150,68
142
(1,309) — 53,564 5 0
— 52,403 203,083
Valuation difference on available -for- sale securities
(656
)
—
— —
—
— —
¥1,186
1,186
1,842
Deferred gains or losses on hedges
(336
)
— — — — — —
30 30 (305 )
Foreign currency translation adjustments
(1,298
)
— — — — — —
23 23 (1,275
)
Valuation and translation adjustments
(978
)
—
— —
—
—
—
1,239
1,239
(261
)
Subscription rights to shares
243 — — — — — — 366 366 609
Minority interests 8,781 — — — — — — 5,885 5,885 14,666Net assets ¥158,727 ¥142 ¥ (1,309 ) — ¥53,564 ¥5 ¥0 ¥7,490 ¥ 59,892 ¥218,620
Net assets, Dec.31, 2009 thousands of U.S. dollars (Note 1)
$1,723,424
$1,540 $ (14,209
) $ — $581,586 $58 $0 $81,322 $ 650,298 $2,373,721
6
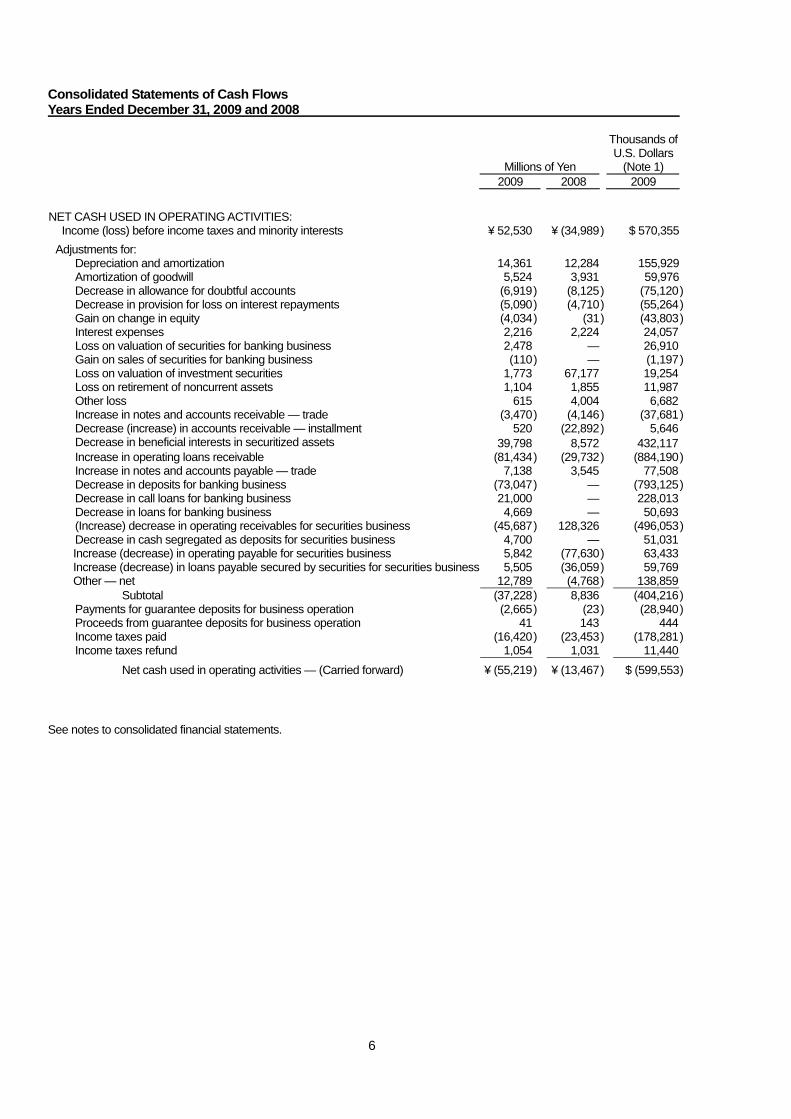
Consolidated Statements of Cash Flows Years Ended December 31, 2009 and 2008
Millions of Yen
Thousands of U.S. Dollars
(Note 1) 2009 2008 2009
NET CASH USED IN OPERATING ACTIVITIES: Income (loss) before income taxes and minority interests ¥ 52,530 ¥ (34,989 ) $ 570,355 Adjustments for: Depreciation and amortization 14,361 12,284 155,929 Amortization of goodwill 5,524 3,931 59,976 Decrease in allowance for doubtful accounts (6,919) (8,125 ) (75,120) Decrease in provision for loss on interest repayments (5,090) (4,710 ) (55,264) Gain on change in equity (4,034) (31 ) (43,803) Interest expenses 2,216 2,224 24,057 Loss on valuation of securities for banking business 2,478 — 26,910 Gain on sales of securities for banking business (110) — (1,197) Loss on valuation of investment securities 1,773 67,177 19,254 Loss on retirement of noncurrent assets 1,104 1,855 11,987 Other loss 615 4,004 6,682 Increase in notes and accounts receivable — trade (3,470) (4,146 ) (37,681) Decrease (increase) in accounts receivable — installment 520 (22,892 ) 5,646 Decrease in beneficial interests in securitized assets 39,798 8,572 432,117 Increase in operating loans receivable (81,434) (29,732 ) (884,190) Increase in notes and accounts payable — trade 7,138 3,545 77,508 Decrease in deposits for banking business (73,047) — (793,125) Decrease in call loans for banking business 21,000 — 228,013 Decrease in loans for banking business 4,669 — 50,693 (Increase) decrease in operating receivables for securities business (45,687) 128,326 (496,053) Decrease in cash segregated as deposits for securities business 4,700 — 51,031 Increase (decrease) in operating payable for securities business 5,842 (77,630 ) 63,433 Increase (decrease) in loans payable secured by securities for securities business 5,505 (36,059 ) 59,769 Other — net 12,789 (4,768 ) 138,859 Subtotal (37,228) 8,836 (404,216) Payments for guarantee deposits for business operation (2,665) (23 ) (28,940) Proceeds from guarantee deposits for business operation 41 143 444 Income taxes paid (16,420) (23,453 ) (178,281) Income taxes refund 1,054 1,031 11,440 Net cash used in operating activities — (Carried forward) ¥ (55,219) ¥ (13,467 ) $ (599,553) See notes to consolidated financial statements.
7
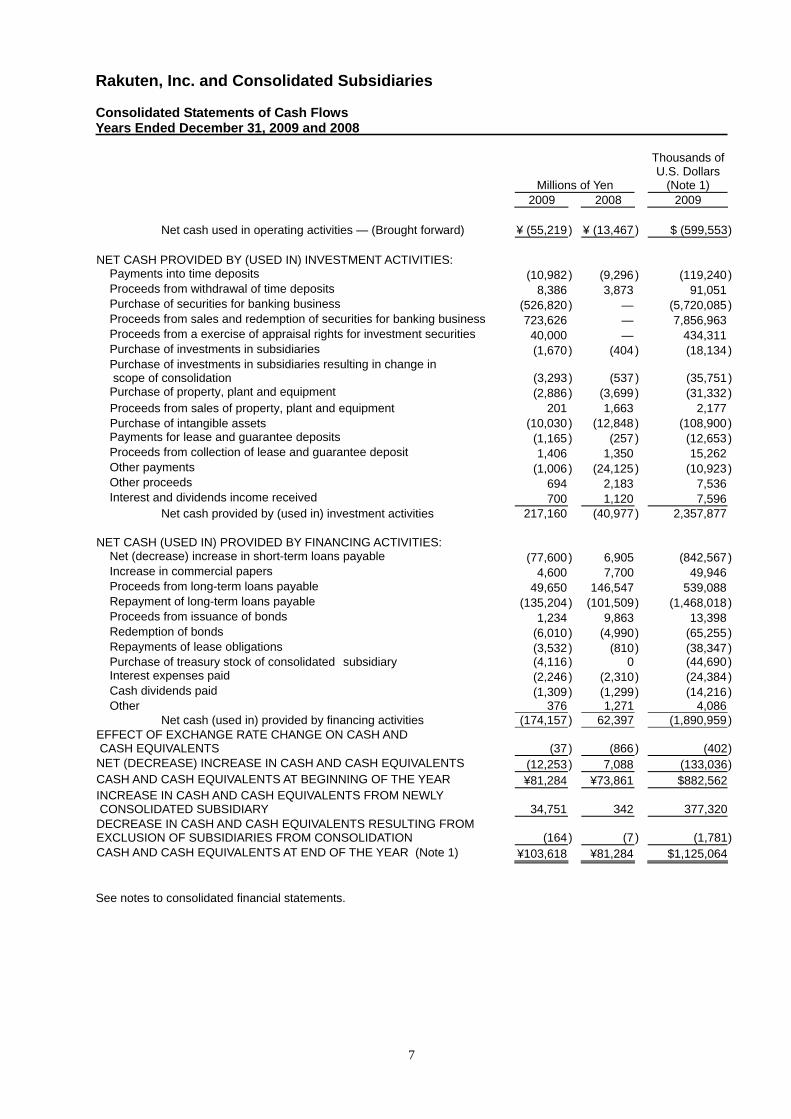
Rakuten, Inc. and Consolidated Subsidiaries Consolidated Statements of Cash Flows Years Ended December 31, 2009 and 2008
Millions of Yen
Thousands of U.S. Dollars
(Note 1) 2009 2008 2009 Net cash used in operating activities — (Brought forward) ¥ (55,219 ) ¥ (13,467 ) $ (599,553) NET CASH PROVIDED BY (USED IN) INVESTMENT ACTIVITIES: Payments into time deposits (10,982 ) (9,296 ) (119,240) Proceeds from withdrawal of time deposits 8,386 3,873 91,051 Purchase of securities for banking business (526,820 ) — (5,720,085) Proceeds from sales and redemption of securities for banking business 723,626 — 7,856,963 Proceeds from a exercise of appraisal rights for investment securities 40,000 — 434,311 Purchase of investments in subsidiaries (1,670 ) (404 ) (18,134) Purchase of investments in subsidiaries resulting in change in scope of consolidation (3,293 ) (537 ) (35,751) Purchase of property, plant and equipment (2,886 ) (3,699 ) (31,332)
Proceeds from sales of property, plant and equipment 201 1,663 2,177 Purchase of intangible assets (10,030 ) (12,848 ) (108,900)
Payments for lease and guarantee deposits (1,165 ) (257 ) (12,653) Proceeds from collection of lease and guarantee deposit 1,406 1,350 15,262 Other payments (1,006 ) (24,125 ) (10,923) Other proceeds 694 2,183 7,536 Interest and dividends income received 700 1,120 7,596 Net cash provided by (used in) investment activities 217,160 (40,977 ) 2,357,877 NET CASH (USED IN) PROVIDED BY FINANCING ACTIVITIES: Net (decrease) increase in short-term loans payable (77,600 ) 6,905 (842,567) Increase in commercial papers 4,600 7,700 49,946 Proceeds from long-term loans payable 49,650 146,547 539,088 Repayment of long-term loans payable (135,204 ) (101,509 ) (1,468,018) Proceeds from issuance of bonds 1,234 9,863 13,398 Redemption of bonds (6,010 ) (4,990 ) (65,255) Repayments of lease obligations (3,532 ) (810 ) (38,347) Purchase of treasury stock of consolidated subsidiary (4,116 ) 0 (44,690) Interest expenses paid (2,246 ) (2,310 ) (24,384) Cash dividends paid (1,309 ) (1,299 ) (14,216) Other 376 1,271 4,086 Net cash (used in) provided by financing activities (174,157 ) 62,397 (1,890,959) EFFECT OF EXCHANGE RATE CHANGE ON CASH AND CASH EQUIVALENTS
(37 )
(866 ) (402)
NET (DECREASE) INCREASE IN CASH AND CASH EQUIVALENTS (12,253 ) 7,088 (133,036) CASH AND CASH EQUIVALENTS AT BEGINNING OF THE YEAR ¥81,284 ¥73,861 $882,562 INCREASE IN CASH AND CASH EQUIVALENTS FROM NEWLY CONSOLIDATED SUBSIDIARY 34,751 342 377,320 DECREASE IN CASH AND CASH EQUIVALENTS RESULTING FROM EXCLUSION OF SUBSIDIARIES FROM CONSOLIDATION (164 ) (7 ) (1,781) CASH AND CASH EQUIVALENTS AT END OF THE YEAR (Note 1) ¥103,618 ¥81,284 $1,125,064 See notes to consolidated financial statements.
8
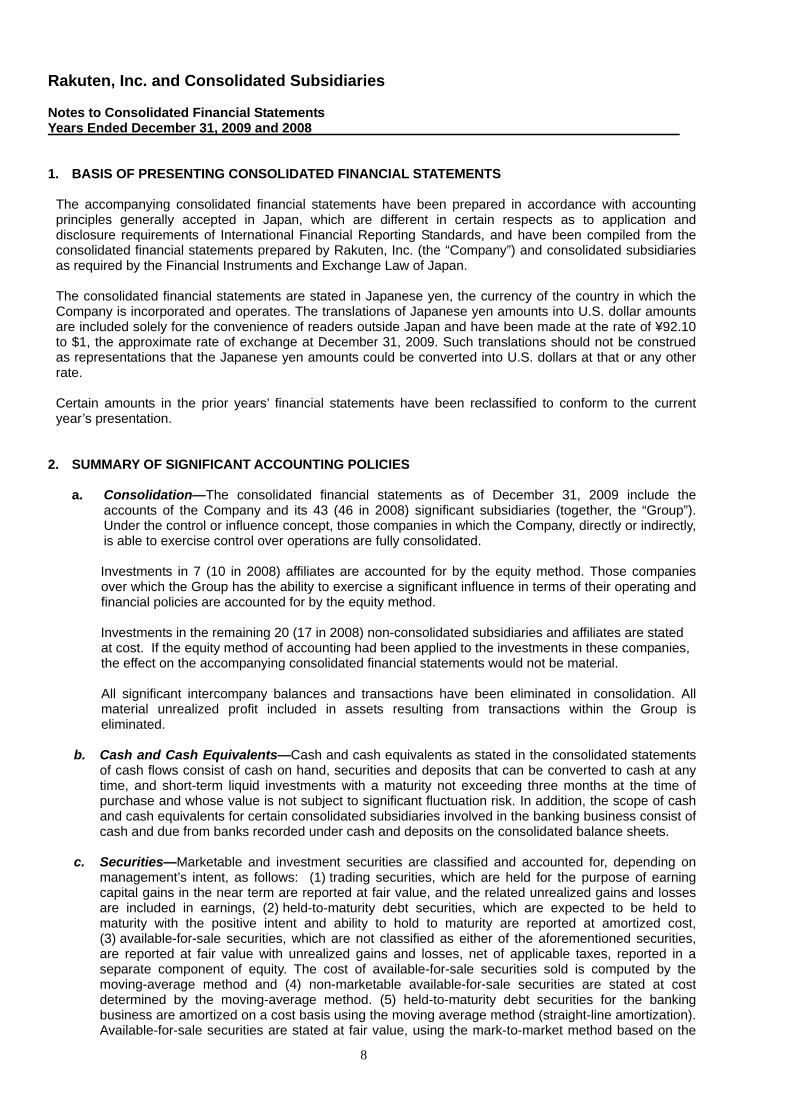
Rakuten, Inc. and Consolidated Subsidiaries Notes to Consolidated Financial Statements Years Ended December 31, 2009 and 2008 1. BASIS OF PRESENTING CONSOLIDATED FINANCIAL STATEMENTS
The accompanying consolidated financial statements have been prepared in accordance with accounting principles generally accepted in Japan, which are different in certain respects as to application and disclosure requirements of International Financial Reporting Standards, and have been compiled from the consolidated financial statements prepared by Rakuten, Inc. (the “Company”) and consolidated subsidiaries as required by the Financial Instruments and Exchange Law of Japan. The consolidated financial statements are stated in Japanese yen, the currency of the country in which the Company is incorporated and operates. The translations of Japanese yen amounts into U.S. dollar amounts are included solely for the convenience of readers outside Japan and have been made at the rate of ¥92.10 to $1, the approximate rate of exchange at December 31, 2009. Such translations should not be construed as representations that the Japanese yen amounts could be converted into U.S. dollars at that or any other rate.
Certain amounts in the prior years’ financial statements have been reclassified to conform to the current year’s presentation.
2. SUMMARY OF SIGNIFICANT ACCOUNTING POLICIES
a. Consolidation—The consolidated financial statements as of December 31, 2009 include the accounts of the Company and its 43 (46 in 2008) significant subsidiaries (together, the “Group”). Under the control or influence concept, those companies in which the Company, directly or indirectly, is able to exercise control over operations are fully consolidated. Investments in 7 (10 in 2008) affiliates are accounted for by the equity method. Those companies over which the Group has the ability to exercise a significant influence in terms of their operating and financial policies are accounted for by the equity method. Investments in the remaining 20 (17 in 2008) non-consolidated subsidiaries and affiliates are stated at cost. If the equity method of accounting had been applied to the investments in these companies, the effect on the accompanying consolidated financial statements would not be material. All significant intercompany balances and transactions have been eliminated in consolidation. All material unrealized profit included in assets resulting from transactions within the Group is eliminated.
b. Cash and Cash Equivalents—Cash and cash equivalents as stated in the consolidated statements of cash flows consist of cash on hand, securities and deposits that can be converted to cash at any time, and short-term liquid investments with a maturity not exceeding three months at the time of purchase and whose value is not subject to significant fluctuation risk. In addition, the scope of cash and cash equivalents for certain consolidated subsidiaries involved in the banking business consist of cash and due from banks recorded under cash and deposits on the consolidated balance sheets.
c. Securities—Marketable and investment securities are classified and accounted for, depending on management’s intent, as follows: (1) trading securities, which are held for the purpose of earning capital gains in the near term are reported at fair value, and the related unrealized gains and losses are included in earnings, (2) held-to-maturity debt securities, which are expected to be held to maturity with the positive intent and ability to hold to maturity are reported at amortized cost, (3) available-for-sale securities, which are not classified as either of the aforementioned securities, are reported at fair value with unrealized gains and losses, net of applicable taxes, reported in a separate component of equity. The cost of available-for-sale securities sold is computed by the moving-average method and (4) non-marketable available-for-sale securities are stated at cost determined by the moving-average method. (5) held-to-maturity debt securities for the banking business are amortized on a cost basis using the moving average method (straight-line amortization). Available-for-sale securities are stated at fair value, using the mark-to-market method based on the
9
market prices at the closing date (valuation differences are reported as a component of net assets, and are primarily calculated as cost of sales using the moving average method). Non-marketable available-for-sale securities are stated at cost or the amortized cost method using the moving average method.
d. Property, Plant and Equipment—Property, plant and equipment are stated at cost. Depreciation of
property, plant and equipment is computed mainly by the declining-balance method at rates based on the estimated useful lives of the assets subject to corporate tax law, while the straight-line method is applied to buildings.
e. Intangible Assets—Amortization on intangible assets is computed by the straight-line method.
Software for internal use is amortized by the straight-line method over its estimated useful life (generally five years).
f. Leases—For leased assets acquired before the Japanese accounting standards for leases changed,
finance leases that deem to transfer ownership of the leased assets to the lessee are to be capitalized, while other finance leases are permitted to be accounted for as operating lease transactions if certain “as if capitalized” information is disclosed in the notes to the lessee’s financial statements. Leased assets under finance leases that transfer ownership of the leased assets are depreciated using the same method that is applied to fixed assets. Assets leased in finance leases that do not transfer ownership of the leased assets are depreciated by the straight-line depreciation method over the estimated useful lives of the each asset, which is deemed to be the lease period, with zero residual value.
g. Allowance for Doubtful Accounts—An allowance equal to estimated losses is established to
prepare for losses from credit guarantees. The method of estimating the allowance is based on credit loss ratio for general credit, and on likelihood of collection for doubtful accounts. Allowance for doubtful accounts of a certain consolidated subsidiary in the banking business is provided for in accordance with internally developed standards for write-offs and provisions to allowance for loan losses, as follows. Claims considered normal claims or claims requiring caution (provided as stipulated in the “Practical Guidelines for Evaluation of Internal Control over Valuation of Assets and Audits for Write-offs and Reserves for Possible Loan Losses of Banks and Similar Institutions” (Report No. 4 of Ad Hoc Committee for Audits of Banks of the Japanese Institute of Certified Public Accountants) are classified into specific classes and then an allowance is provided based on reasonable calculations of estimated loss ratios. Provisions for claims considered potentially bankrupt are made in the amount deemed necessary after subtracting the expected collectable amounts of collateral and guarantees. For claims considered bankrupt or substantially bankrupt, the amount remaining after subtracting the expected collectable amounts of collateral and guarantees is transferred to the reserve. Following the Company’s asset self-assessment standards, operating departments conduct an asset assessment, and the Asset Audit Department, which is independent of operations, then audits the assessment results. The provisions mentioned above are then made for all claims based on these assessments.
h. Allowance for bonus—An allowance for bonus is provided for the estimated amounts to be paid in
the subsequent period based on the service provided during the current year. i. Reserve for Points—An amount equivalent to points that are earned by customers and are
expected to be used in the future is recorded for the fiscal year. A provision of allowance for points is included in selling, general and administrative expenses.
j. Allowance for Retirement Benefits—At certain consolidated subsidiaries, an allowance is made for
employees’ retirement benefits based on the estimated benefit obligation at the fiscal year-end. Actuarial differences are recorded from the following fiscal year by the straight-line method using a fixed number of years (10 years) within the average remaining service period of employees.
k. Allowance for Loss on Interest Repayments—A certain consolidated subsidiary has calculated
and recorded an allowance for expected losses on interest repayments based on factors such as the actual ratio of repayments made and average amount of repayments over the reasonable estimate period. The expected loss of ¥10,277million (¥14,068 million in 2008) for write-offs of principals by interest repayment claims was included in the allowance for doubtful accounts.
l. Reserve for Financial Instrument Transaction Liabilities—At a certain consolidated subsidiary,
10
provision is made for possible loss resulting from securities transaction accidents. The amount of the reserve is provided based on Article 175 of the Cabinet Order Concerning Transactions in Financial Instruments, which is based on the provisions of Article 46-5 of the Financial Instruments and Exchange Law.
m. Reserve for Liabilities on Transaction in Commodities—A certain consolidated subsidiary
allocate the amounts stipulated in the Commodity Exchange Law to provide for losses resulting from contingencies relating to commodity transactions, in accordance with the provisions of Article 221 of the Commodity Exchange Law.
n. Derivatives and Hedging Accounting
Hedging policies: The Group uses derivative financial instruments to manage its exposures to fluctuations in foreign exchange and interest rates. Foreign exchange forward contracts, interest rate swaps and interest rate caps are utilized by the Group to reduce foreign currency exchange and interest rate risks. The Group does not enter into derivatives for trading or speculative purposes. Interest rate swaps and interest rate caps are used to establish hedges for exposure to interest rate volatility risk associated with borrowings. Hedged items are identified by each individual contract. Interest caps are applied to all short-term borrowings by a certain consolidated subsidiary. Foreign exchange volatility risks associated with foreign currency-denominated receivables and payables relating to business transactions are, in accordance with certain company rules, managed by using currency forward agreements to reduce foreign currency exchange risks in actual demand of securities transactions. Holdings of foreign currency deposits and foreign currency-denominated securities carry the risk of exchange rate and market price fluctuations. Exchange contracts are used, subject to specific rules, to avoid this risk.
Hedge accounting: Deferred hedge accounting has been adopted. However, a special method is used for transactions which meet certain conditions. The appropriation method has been adopted for foreign currency-denominated receivables and payables with currency forward agreements.
Hedging instruments and hedged items: Hedging instruments comprise currency forward agreements, interest rate swaps and interest rate caps. Hedged items comprise foreign currency-denominated receivables and payables relating to business transactions, foreign currency deposits, foreign currency-denominated securities and loans.
Method for evaluating effectiveness of hedging activities: For interest rate swaps and interest rate caps, the company compares the cumulative changes in cash flows of the hedged items and hedging instruments every three months. The effectiveness of the hedge is determined based on the cumulative changes of the hedged items and instruments, along with other items. However, this evaluation is not performed for interest rate swaps that is applied special methods. For currency forward agreements, the effectiveness is determined by the currency, amount and settlement date of the hedged item based on the company management data.
o. Consumption Taxes—The tax-excluded method is used in consumption tax accounting for national
and local consumption taxes. p. Goodwill—The excess of the cost of an acquisition over the fair value of the net assets of the
acquired subsidiary at the date of acquisition is called goodwill. The goodwill is amortized over the period in which such action is deemed effective. However, if the amount is immaterial, the entire amount is amortized at the date of acquisition.
q. Foreign Currency Financial Statements—The balance sheet accounts of the consolidated foreign
subsidiaries are translated into Japanese yen at the exchange rate as of the balance sheet date except for net assets, which is translated at the historical rate. Revenue and expense accounts of consolidated foreign subsidiaries are translated into Japanese yen at average rate of exchange for the fiscal periods. Differences arising from such translation are shown as “Foreign currency translation adjustments” in a separate component of net assets.
11
r. Income Taxes—The provision for income taxes is computed based on the pretax income included in the consolidated statements of income. The asset and liability approach is used to recognize deferred tax assets and liabilities for the expected future tax consequences of temporary differences between the carrying amounts and the tax bases of assets and liabilities. Deferred taxes are measured by applying currently enacted tax laws to the temporary differences.
s. Retained earnings—The Corporation Law of Japan provides that an amount equal to 10% of the
amount to be distributed as distributions of capital surplus (other than the capital reserve) and retained earnings (other than the legal reserve) be transferred to the capital reserve and the legal reserve, respectively, until the sum of the capital reserve and the legal reserve equals 25% of the capital stock amount.
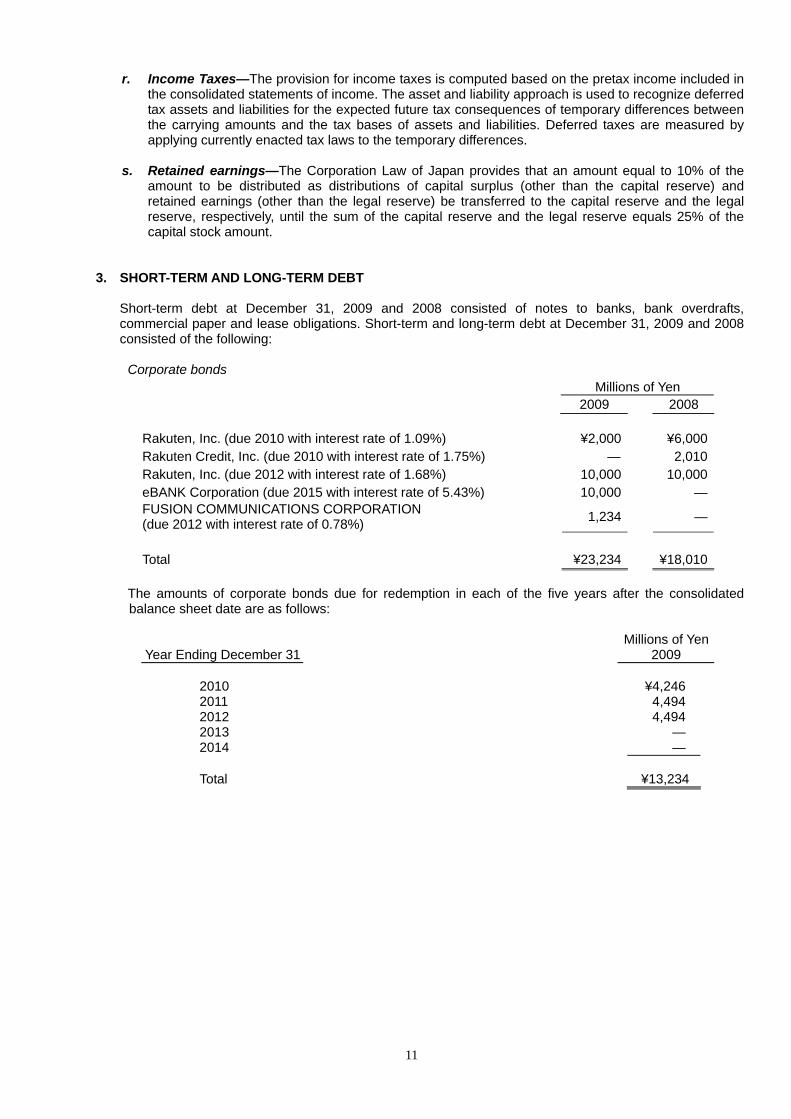
3. SHORT-TERM AND LONG-TERM DEBT
Short-term debt at December 31, 2009 and 2008 consisted of notes to banks, bank overdrafts, commercial paper and lease obligations. Short-term and long-term debt at December 31, 2009 and 2008 consisted of the following:
Corporate bonds
Millions of Yen 2009 2008
Rakuten, Inc. (due 2010 with interest rate of 1.09%) ¥2,000 ¥6,000 Rakuten Credit, Inc. (due 2010 with interest rate of 1.75%) — 2,010 Rakuten, Inc. (due 2012 with interest rate of 1.68%) 10,000 10,000 eBANK Corporation (due 2015 with interest rate of 5.43%) 10,000 — FUSION COMMUNICATIONS CORPORATION (due 2012 with interest rate of 0.78%) 1,234 —
Total ¥23,234 ¥18,010
The amounts of corporate bonds due for redemption in each of the five years after the consolidated balance sheet date are as follows:
Millions of Yen Year Ending December 31 2009
2010 ¥4,246 2011 4,494 2012 4,494 2013 — 2014 — Total ¥13,234
12
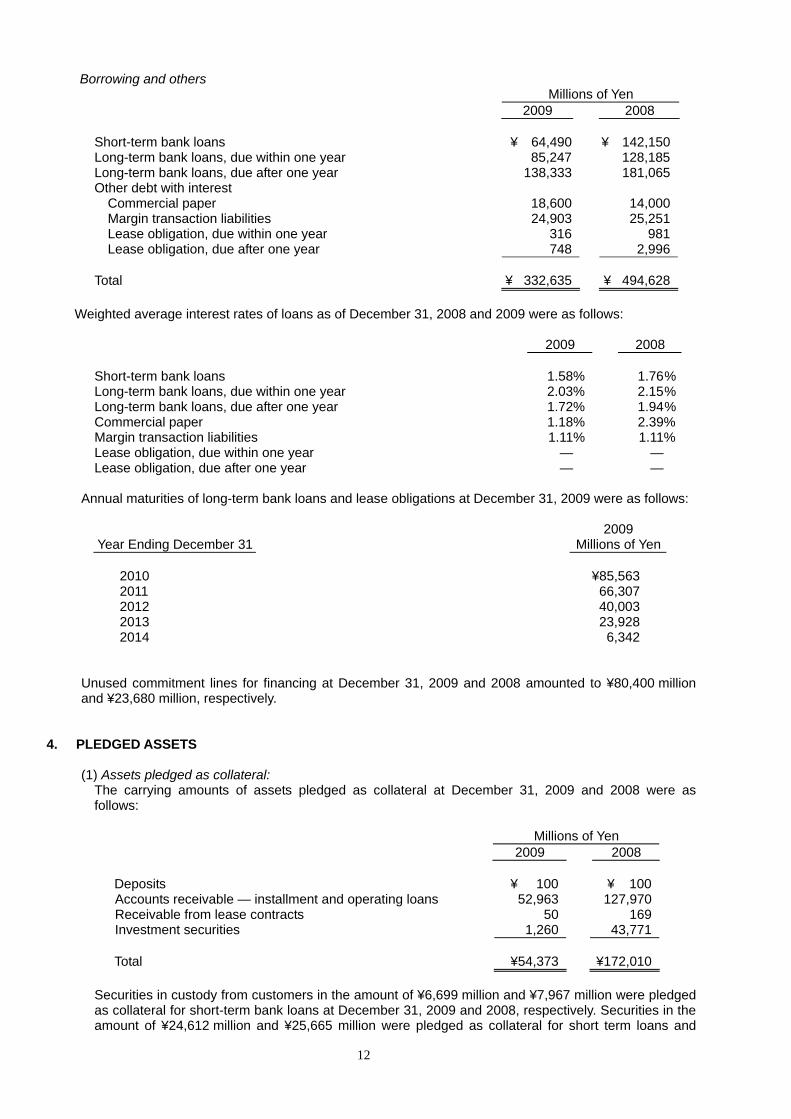
Borrowing and others Millions of Yen 2009 2008
Short-term bank loans ¥ 64,490 ¥ 142,150 Long-term bank loans, due within one year 85,247 128,185 Long-term bank loans, due after one year 138,333 181,065 Other debt with interest Commercial paper 18,600 14,000 Margin transaction liabilities 24,903 25,251 Lease obligation, due within one year 316 981 Lease obligation, due after one year 748 2,996 Total ¥ 332,635 ¥ 494,628
Weighted average interest rates of loans as of December 31, 2008 and 2009 were as follows:
2009 2008
Short-term bank loans 1.58% 1.76%Long-term bank loans, due within one year 2.03% 2.15%Long-term bank loans, due after one year 1.72% 1.94%Commercial paper 1.18% 2.39%Margin transaction liabilities 1.11% 1.11%Lease obligation, due within one year — — Lease obligation, due after one year — —
Annual maturities of long-term bank loans and lease obligations at December 31, 2009 were as follows:
Year Ending December 31 2009
Millions of Yen
2010 ¥85,563 2011 66,307 2012 40,003 2013 23,928 2014 6,342
Unused commitment lines for financing at December 31, 2009 and 2008 amounted to ¥80,400 million and ¥23,680 million, respectively.
4. PLEDGED ASSETS (1) Assets pledged as collateral:
The carrying amounts of assets pledged as collateral at December 31, 2009 and 2008 were as follows:
Millions of Yen 2009 2008
Deposits ¥ 100 ¥ 100 Accounts receivable — installment and operating loans 52,963 127,970 Receivable from lease contracts 50 169 Investment securities 1,260 43,771
Total ¥54,373 ¥172,010
Securities in custody from customers in the amount of ¥6,699 million and ¥7,967 million were pledged as collateral for short-term bank loans at December 31, 2009 and 2008, respectively. Securities in the amount of ¥24,612 million and ¥25,665 million were pledged as collateral for short term loans and
13
borrowings related to margin transactions at December 31, 2009 and 2008, respectively. Securities loaned were pledged as collateral for borrowings in the amount of ¥10,112 million and ¥4,607 million at December 31, 2009 and 2008, respectively. Securities for banking business, which were pledged as collateral for foreign exchange settlements, derivative and other transactions, and for issuing letters of credit, were ¥79,022 million at December 31, 2009. Other collateral included in current assets includes ¥5,945 million for initial margins related to futures trading and ¥698 million for guarantees pledged by consolidated subsidiaries in the banking business, and ¥8,567 million of short-term guarantee deposits pledged by a consolidated subsidiary in the securities business.
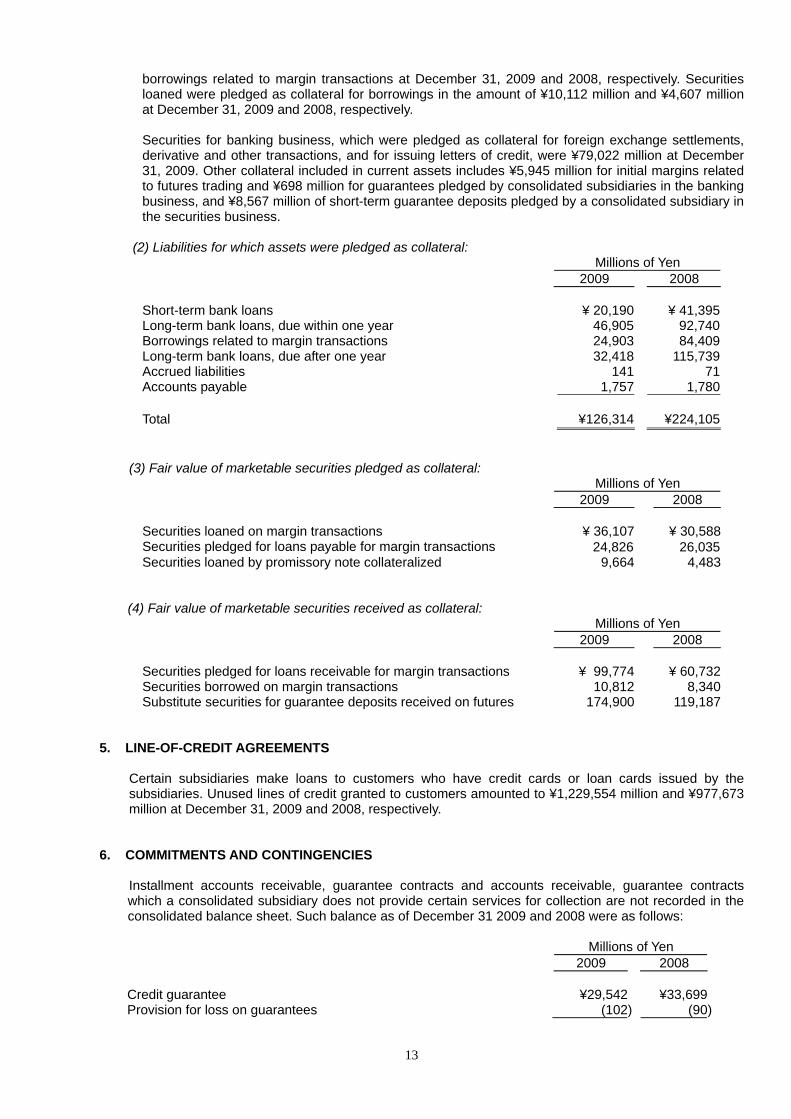
(2) Liabilities for which assets were pledged as collateral: Millions of Yen 2009 2008
Short-term bank loans ¥ 20,190 ¥ 41,395 Long-term bank loans, due within one year 46,905 92,740 Borrowings related to margin transactions 24,903 84,409 Long-term bank loans, due after one year 32,418 115,739 Accrued liabilities 141 71 Accounts payable 1,757 1,780 Total ¥126,314 ¥224,105
(3) Fair value of marketable securities pledged as collateral: Millions of Yen 2009 2008
Securities loaned on margin transactions ¥ 36,107 ¥ 30,588Securities pledged for loans payable for margin transactions 24,826 26,035Securities loaned by promissory note collateralized 9,664 4,483
(4) Fair value of marketable securities received as collateral: Millions of Yen 2009 2008
Securities pledged for loans receivable for margin transactions ¥ 99,774 ¥ 60,732Securities borrowed on margin transactions 10,812 8,340Substitute securities for guarantee deposits received on futures 174,900 119,187
5. LINE-OF-CREDIT AGREEMENTS
Certain subsidiaries make loans to customers who have credit cards or loan cards issued by the subsidiaries. Unused lines of credit granted to customers amounted to ¥1,229,554 million and ¥977,673 million at December 31, 2009 and 2008, respectively.
6. COMMITMENTS AND CONTINGENCIES Installment accounts receivable, guarantee contracts and accounts receivable, guarantee contracts
which a consolidated subsidiary does not provide certain services for collection are not recorded in the consolidated balance sheet. Such balance as of December 31 2009 and 2008 were as follows:
Millions of Yen 2009 2008
Credit guarantee ¥29,542 ¥33,699Provision for loss on guarantees (102) (90)
14
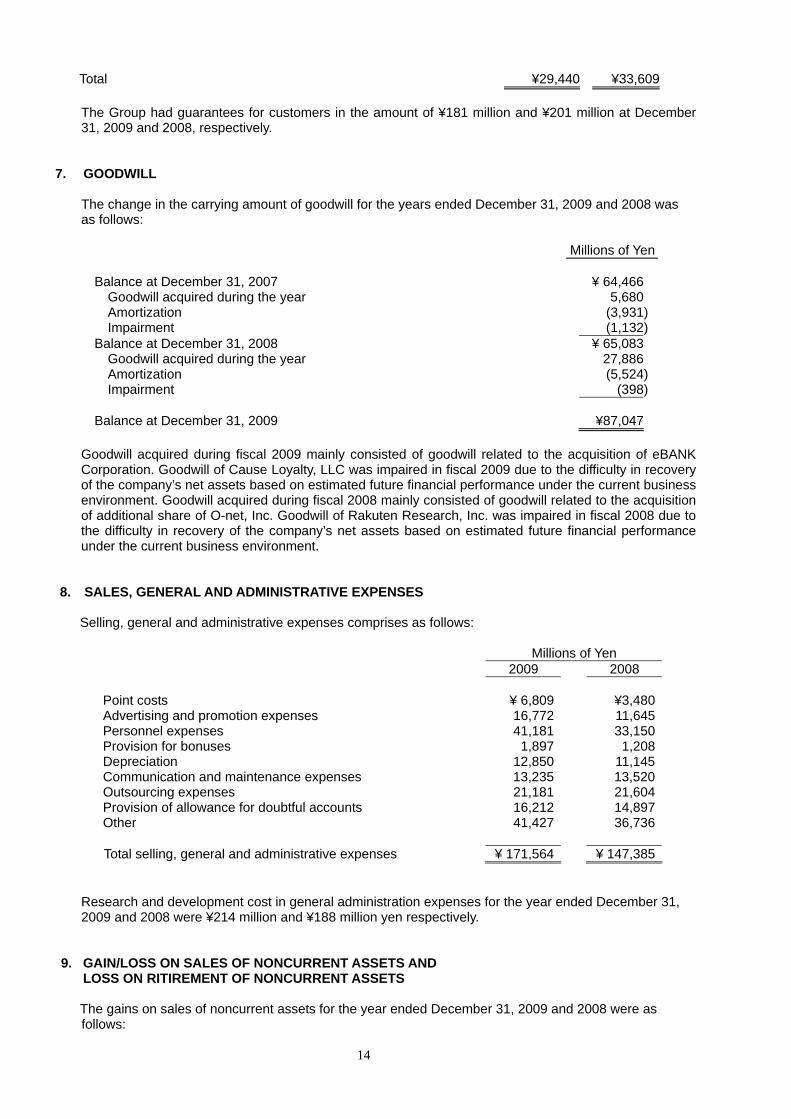
Total ¥29,440 ¥33,609
The Group had guarantees for customers in the amount of ¥181 million and ¥201 million at December 31, 2009 and 2008, respectively.
7. GOODWILL
The change in the carrying amount of goodwill for the years ended December 31, 2009 and 2008 was as follows:
Millions of Yen
Balance at December 31, 2007 ¥ 64,466
Goodwill acquired during the year 5,680 Amortization (3,931)
Impairment (1,132) Balance at December 31, 2008 ¥ 65,083
Goodwill acquired during the year 27,886 Amortization (5,524) Impairment (398)
Balance at December 31, 2009 ¥87,047 Goodwill acquired during fiscal 2009 mainly consisted of goodwill related to the acquisition of eBANK
Corporation. Goodwill of Cause Loyalty, LLC was impaired in fiscal 2009 due to the difficulty in recovery of the company’s net assets based on estimated future financial performance under the current business environment. Goodwill acquired during fiscal 2008 mainly consisted of goodwill related to the acquisition of additional share of O-net, Inc. Goodwill of Rakuten Research, Inc. was impaired in fiscal 2008 due to the difficulty in recovery of the company’s net assets based on estimated future financial performance under the current business environment.
8. SALES, GENERAL AND ADMINISTRATIVE EXPENSES Selling, general and administrative expenses comprises as follows:
Millions of Yen 2009 2008 Point costs ¥ 6,809 ¥3,480Advertising and promotion expenses 16,772 11,645Personnel expenses 41,181 33,150Provision for bonuses 1,897 1,208Depreciation 12,850 11,145Communication and maintenance expenses 13,235 13,520Outsourcing expenses 21,181 21,604Provision of allowance for doubtful accounts 16,212 14,897Other 41,427 36,736 Total selling, general and administrative expenses ¥ 171,564 ¥ 147,385
Research and development cost in general administration expenses for the year ended December 31, 2009 and 2008 were ¥214 million and ¥188 million yen respectively.
9. GAIN/LOSS ON SALES OF NONCURRENT ASSETS AND LOSS ON RITIREMENT OF NONCURRENT ASSETS
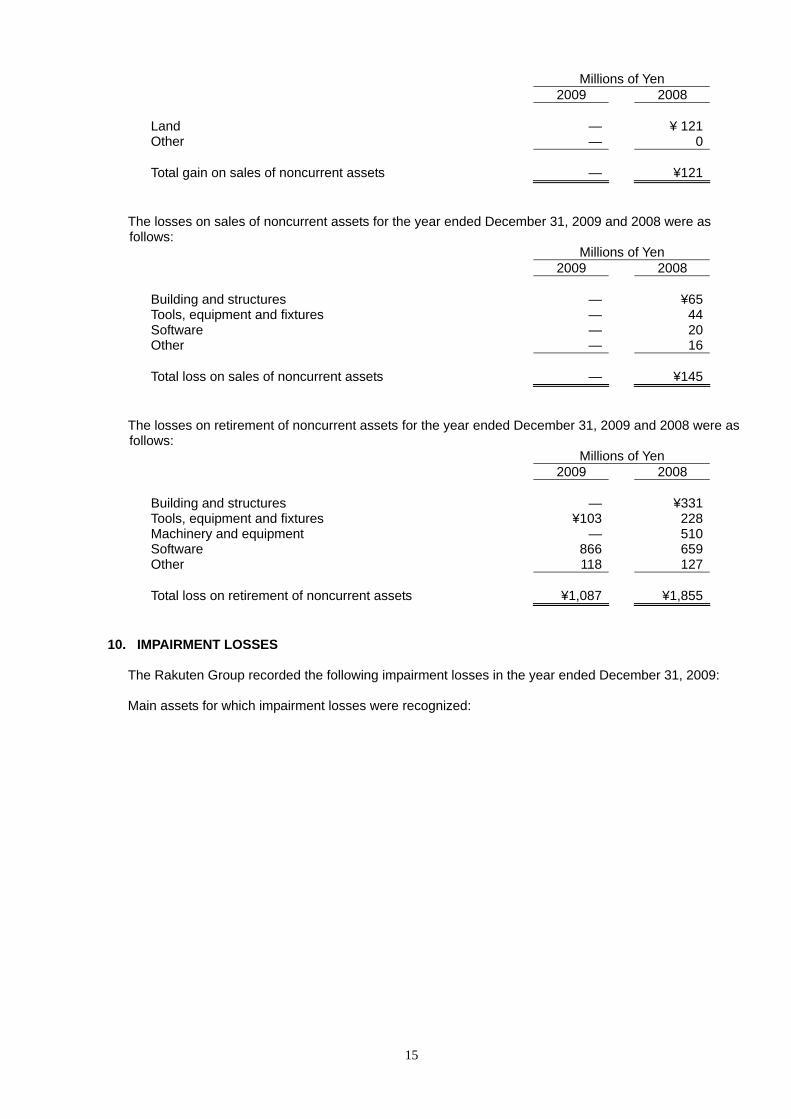
The gains on sales of noncurrent assets for the year ended December 31, 2009 and 2008 were as follows:
15
Millions of Yen 2009 2008 Land — ¥ 121Other — 0 Total gain on sales of noncurrent assets — ¥121
The losses on sales of noncurrent assets for the year ended December 31, 2009 and 2008 were as follows:
Millions of Yen 2009 2008 Building and structures — ¥65Tools, equipment and fixtures — 44Software — 20Other — 16 Total loss on sales of noncurrent assets — ¥145
The losses on retirement of noncurrent assets for the year ended December 31, 2009 and 2008 were as follows:
Millions of Yen 2009 2008 Building and structures — ¥331Tools, equipment and fixtures ¥103 228Machinery and equipment — 510Software 866 659Other 118 127 Total loss on retirement of noncurrent assets ¥1,087 ¥1,855
10. IMPAIRMENT LOSSES
The Rakuten Group recorded the following impairment losses in the year ended December 31, 2009:
Main assets for which impairment losses were recognized:
16
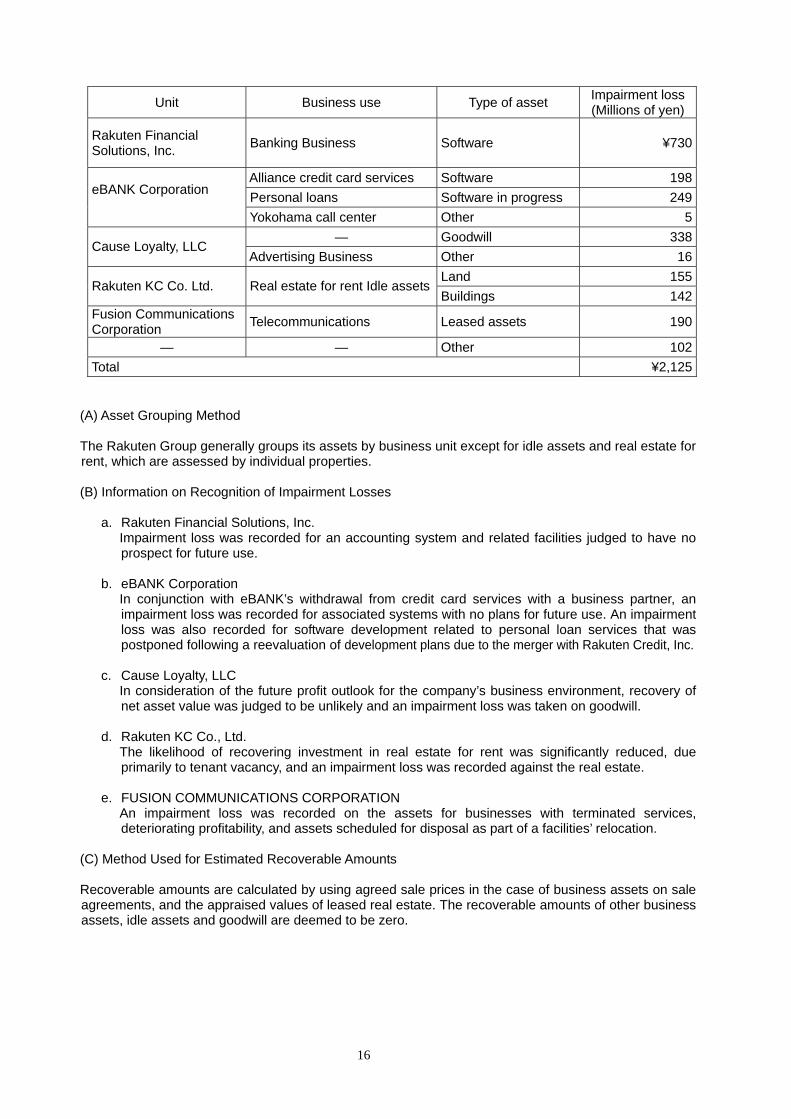
Unit Business use Type of asset Impairment loss(Millions of yen)
Rakuten Financial Solutions, Inc. Banking Business Software ¥730
Alliance credit card services Software 198 Personal loans Software in progress 249 eBANK Corporation
Yokohama call center Other 5
— Goodwill 338 Cause Loyalty, LLC
Advertising Business Other 16 Land 155
Rakuten KC Co. Ltd. Real estate for rent Idle assets Buildings 142
Fusion Communications Corporation Telecommunications Leased assets 190
— — Other 102 Total ¥2,125
(A) Asset Grouping Method
The Rakuten Group generally groups its assets by business unit except for idle assets and real estate for rent, which are assessed by individual properties.
(B) Information on Recognition of Impairment Losses
a. Rakuten Financial Solutions, Inc.
Impairment loss was recorded for an accounting system and related facilities judged to have no prospect for future use.
b. eBANK Corporation
In conjunction with eBANK’s withdrawal from credit card services with a business partner, an impairment loss was recorded for associated systems with no plans for future use. An impairment loss was also recorded for software development related to personal loan services that was postponed following a reevaluation of development plans due to the merger with Rakuten Credit, Inc.
c. Cause Loyalty, LLC
In consideration of the future profit outlook for the company’s business environment, recovery of net asset value was judged to be unlikely and an impairment loss was taken on goodwill.
d. Rakuten KC Co., Ltd.
The likelihood of recovering investment in real estate for rent was significantly reduced, due primarily to tenant vacancy, and an impairment loss was recorded against the real estate.
e. FUSION COMMUNICATIONS CORPORATION
An impairment loss was recorded on the assets for businesses with terminated services, deteriorating profitability, and assets scheduled for disposal as part of a facilities’ relocation.
(C) Method Used for Estimated Recoverable Amounts
Recoverable amounts are calculated by using agreed sale prices in the case of business assets on sale agreements, and the appraised values of leased real estate. The recoverable amounts of other business assets, idle assets and goodwill are deemed to be zero.
17
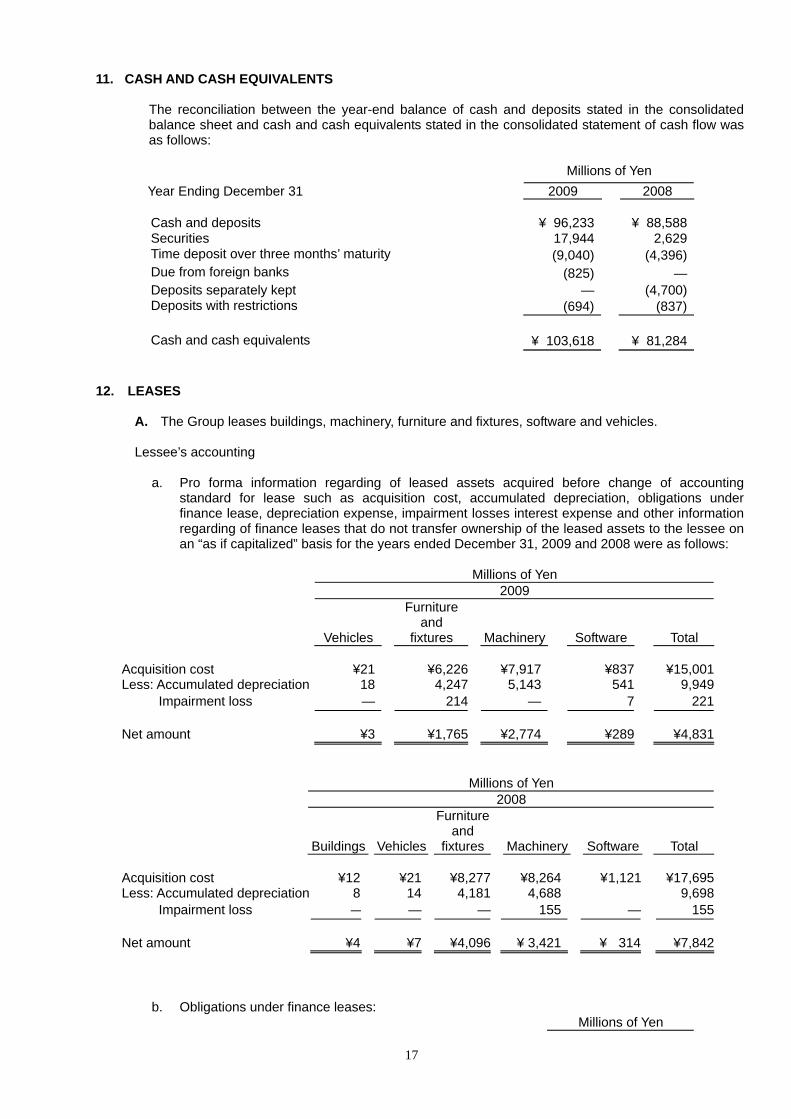
11. CASH AND CASH EQUIVALENTS
The reconciliation between the year-end balance of cash and deposits stated in the consolidated balance sheet and cash and cash equivalents stated in the consolidated statement of cash flow was as follows:
Millions of Yen Year Ending December 31 2009 2008
Cash and deposits ¥ 96,233 ¥ 88,588 Securities 17,944 2,629 Time deposit over three months’ maturity (9,040) (4,396) Due from foreign banks (825) — Deposits separately kept — (4,700) Deposits with restrictions (694) (837) Cash and cash equivalents ¥ 103,618 ¥ 81,284
12. LEASES
A. The Group leases buildings, machinery, furniture and fixtures, software and vehicles. Lessee’s accounting
a. Pro forma information regarding of leased assets acquired before change of accounting standard for lease such as acquisition cost, accumulated depreciation, obligations under finance lease, depreciation expense, impairment losses interest expense and other information regarding of finance leases that do not transfer ownership of the leased assets to the lessee on an “as if capitalized” basis for the years ended December 31, 2009 and 2008 were as follows:
Millions of Yen 2009
Vehicles
Furnitureand
fixtures Machinery Software Total
Acquisition cost ¥21 ¥6,226 ¥7,917 ¥837 ¥15,001Less: Accumulated depreciation 18 4,247 5,143 541 9,949 Impairment loss — 214 — 7 221 Net amount ¥3 ¥1,765 ¥2,774 ¥289 ¥4,831
Millions of Yen 2008
Buildings Vehicles
Furnitureand
fixtures Machinery
Software Total
Acquisition cost ¥12 ¥21 ¥8,277 ¥8,264 ¥ 1,121 ¥17,695Less: Accumulated depreciation 8 14 4,181 4,688 9,698 Impairment loss — — — 155 — 155 Net amount ¥4 ¥7 ¥4,096 ¥ 3,421 ¥ 314 ¥7,842
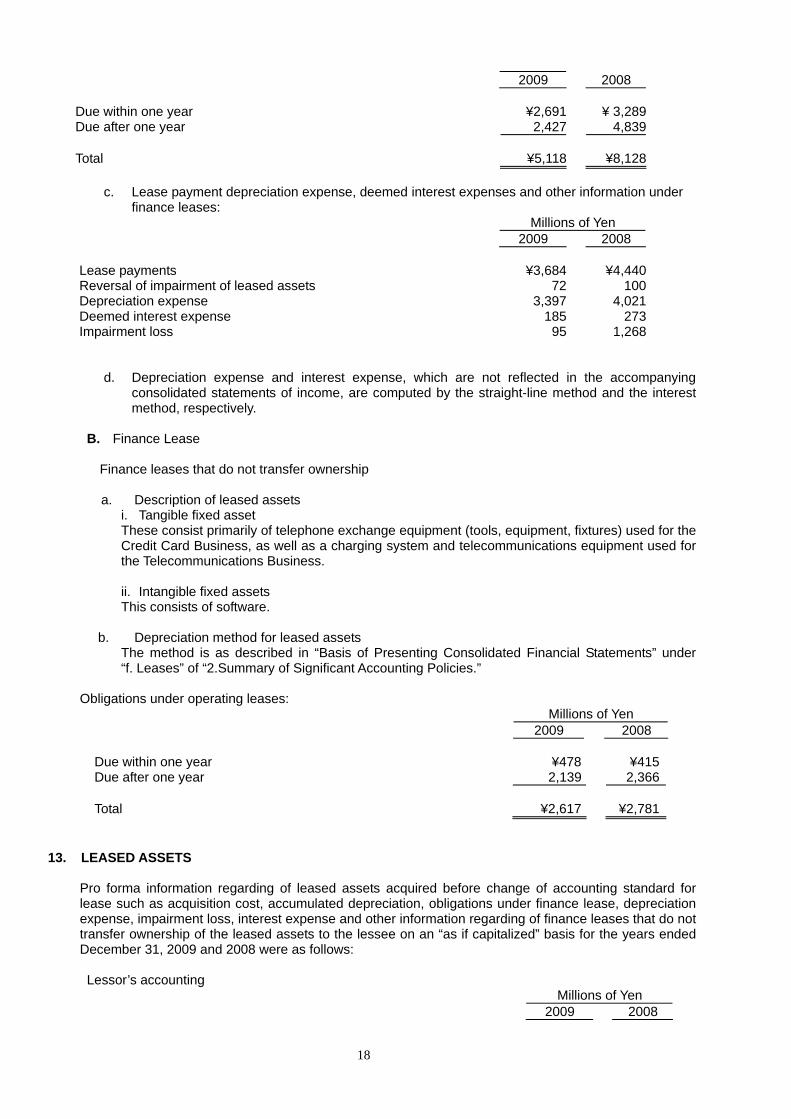
b. Obligations under finance leases: Millions of Yen
18
2009 2008
Due within one year ¥2,691 ¥ 3,289 Due after one year 2,427 4,839 Total ¥5,118 ¥8,128
c. Lease payment depreciation expense, deemed interest expenses and other information under
finance leases: Millions of Yen 2009 2008
Lease payments ¥3,684 ¥4,440 Reversal of impairment of leased assets 72 100 Depreciation expense 3,397 4,021 Deemed interest expense 185 273 Impairment loss 95 1,268
d. Depreciation expense and interest expense, which are not reflected in the accompanying
consolidated statements of income, are computed by the straight-line method and the interest method, respectively.
B. Finance Lease
Finance leases that do not transfer ownership
a. Description of leased assets
i. Tangible fixed asset These consist primarily of telephone exchange equipment (tools, equipment, fixtures) used for the Credit Card Business, as well as a charging system and telecommunications equipment used for the Telecommunications Business.
ii. Intangible fixed assets This consists of software.
b. Depreciation method for leased assets
The method is as described in “Basis of Presenting Consolidated Financial Statements” under “f. Leases” of “2.Summary of Significant Accounting Policies.”
Obligations under operating leases:
Millions of Yen 2009 2008
Due within one year ¥478 ¥415 Due after one year 2,139 2,366 Total ¥2,617 ¥2,781
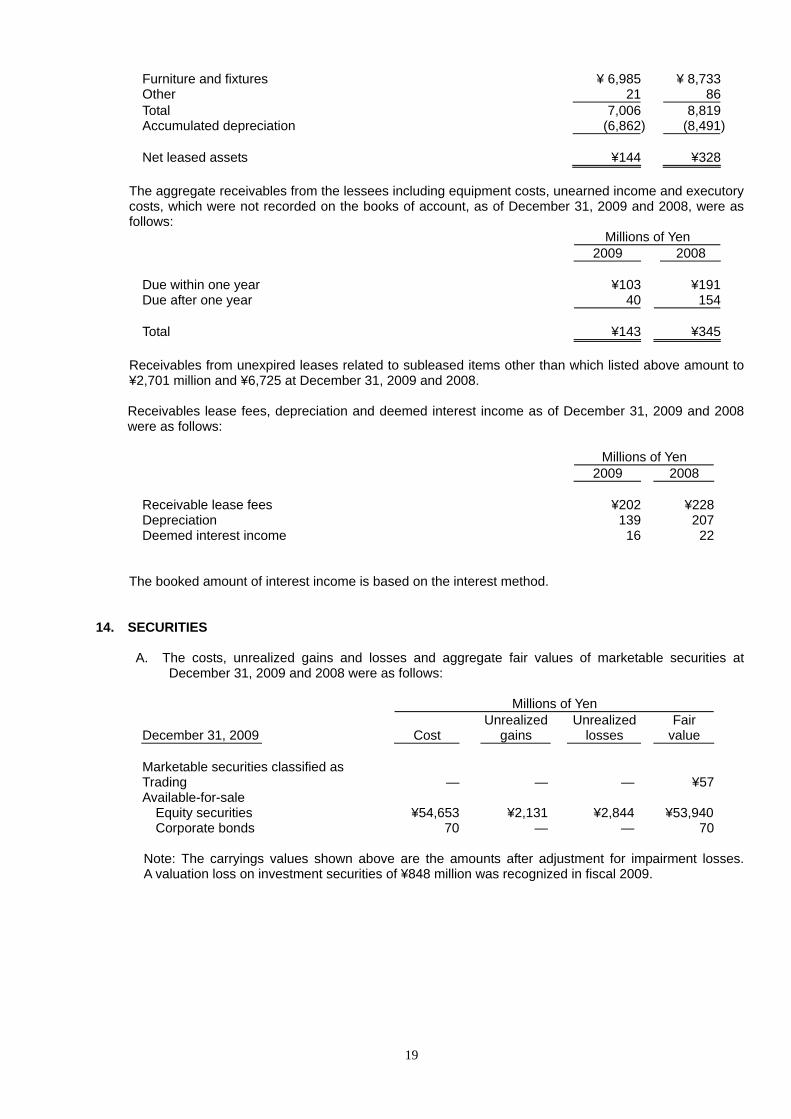
13. LEASED ASSETS
Pro forma information regarding of leased assets acquired before change of accounting standard for lease such as acquisition cost, accumulated depreciation, obligations under finance lease, depreciation expense, impairment loss, interest expense and other information regarding of finance leases that do not transfer ownership of the leased assets to the lessee on an “as if capitalized” basis for the years ended December 31, 2009 and 2008 were as follows: Lessor’s accounting
Millions of Yen 2009 2008
19
Furniture and fixtures ¥ 6,985 ¥ 8,733 Other 21 86 Total 7,006 8,819 Accumulated depreciation (6,862) (8,491) Net leased assets ¥144 ¥328
The aggregate receivables from the lessees including equipment costs, unearned income and executory
costs, which were not recorded on the books of account, as of December 31, 2009 and 2008, were as follows:
Millions of Yen 2009 2008
Due within one year ¥103 ¥191 Due after one year 40 154 Total ¥143 ¥345
Receivables from unexpired leases related to subleased items other than which listed above amount to ¥2,701 million and ¥6,725 at December 31, 2009 and 2008.
Receivables lease fees, depreciation and deemed interest income as of December 31, 2009 and 2008 were as follows:
Millions of Yen 2009 2008
Receivable lease fees ¥202 ¥228 Depreciation 139 207Deemed interest income 16 22
The booked amount of interest income is based on the interest method.
14. SECURITIES
A. The costs, unrealized gains and losses and aggregate fair values of marketable securities at December 31, 2009 and 2008 were as follows:
Millions of Yen
December 31, 2009 Cost Unrealized
gains Unrealized
losses Fair
value
Marketable securities classified as Trading — — — ¥57 Available-for-sale
Equity securities ¥54,653 ¥2,131 ¥2,844 ¥53,940 Corporate bonds 70 — — 70
Note: The carryings values shown above are the amounts after adjustment for impairment losses. A valuation loss on investment securities of ¥848 million was recognized in fiscal 2009.
20
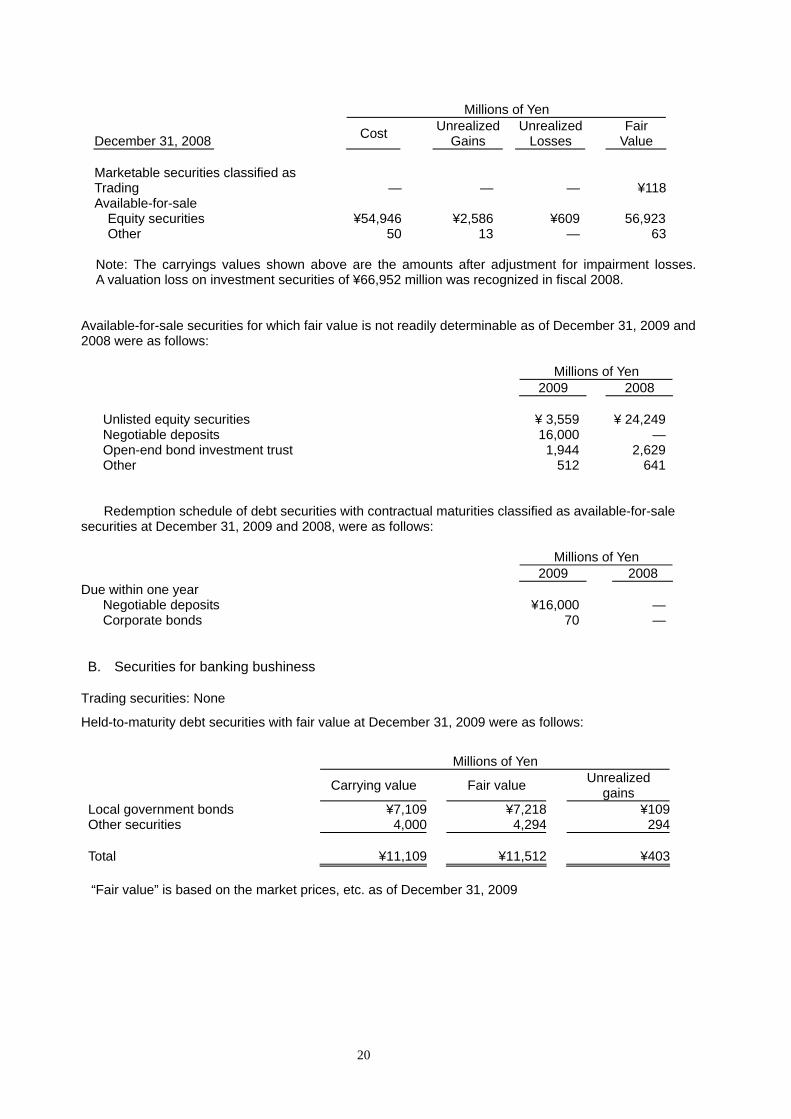
Millions of Yen
December 31, 2008 Cost UnrealizedGains
Unrealized Losses Fair
Value
Marketable securities classified as Trading — — — ¥118 Available-for-sale
Equity securities ¥54,946 ¥2,586 ¥609 56,923 Other 50 13 — 63
Note: The carryings values shown above are the amounts after adjustment for impairment losses. A valuation loss on investment securities of ¥66,952 million was recognized in fiscal 2008.
Available-for-sale securities for which fair value is not readily determinable as of December 31, 2009 and 2008 were as follows:
Millions of Yen 2009 2008
Unlisted equity securities ¥ 3,559 ¥ 24,249Negotiable deposits 16,000 —Open-end bond investment trust 1,944 2,629Other 512 641
Redemption schedule of debt securities with contractual maturities classified as available-for-sale
securities at December 31, 2009 and 2008, were as follows:
Millions of Yen 2009 2008
Due within one year Negotiable deposits ¥16,000 —Corporate bonds 70 —
B. Securities for banking bushiness
Trading securities: None
Held-to-maturity debt securities with fair value at December 31, 2009 were as follows:
Millions of Yen
Carrying value Fair value Unrealized gains
Local government bonds ¥7,109 ¥7,218 ¥109Other securities 4,000 4,294 294 Total ¥11,109 ¥11,512 ¥403 “Fair value” is based on the market prices, etc. as of December 31, 2009
21
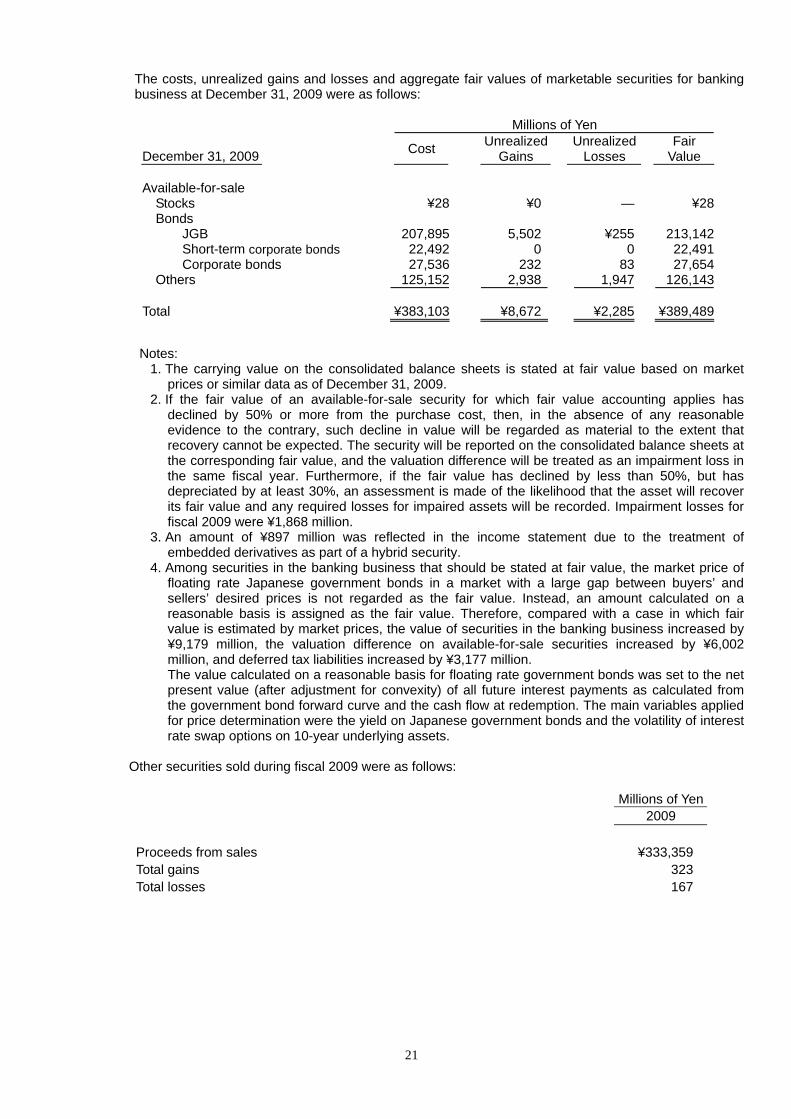
The costs, unrealized gains and losses and aggregate fair values of marketable securities for banking business at December 31, 2009 were as follows:
Millions of Yen
December 31, 2009 Cost UnrealizedGains
Unrealized Losses Fair
Value
Available-for-sale Stocks ¥28 ¥0 — ¥28
Bonds JGB 207,895 5,502 ¥255 213,142 Short-term corporate bonds 22,492 0 0 22,491 Corporate bonds 27,536 232 83 27,654
Others 125,152 2,938 1,947 126,143 Total ¥383,103 ¥8,672 ¥2,285 ¥389,489
Notes:
1. The carrying value on the consolidated balance sheets is stated at fair value based on market prices or similar data as of December 31, 2009.
2. If the fair value of an available-for-sale security for which fair value accounting applies has declined by 50% or more from the purchase cost, then, in the absence of any reasonable evidence to the contrary, such decline in value will be regarded as material to the extent that recovery cannot be expected. The security will be reported on the consolidated balance sheets at the corresponding fair value, and the valuation difference will be treated as an impairment loss in the same fiscal year. Furthermore, if the fair value has declined by less than 50%, but has depreciated by at least 30%, an assessment is made of the likelihood that the asset will recover its fair value and any required losses for impaired assets will be recorded. Impairment losses for fiscal 2009 were ¥1,868 million.
3. An amount of ¥897 million was reflected in the income statement due to the treatment of embedded derivatives as part of a hybrid security.
4. Among securities in the banking business that should be stated at fair value, the market price of floating rate Japanese government bonds in a market with a large gap between buyers’ and sellers’ desired prices is not regarded as the fair value. Instead, an amount calculated on a reasonable basis is assigned as the fair value. Therefore, compared with a case in which fair value is estimated by market prices, the value of securities in the banking business increased by ¥9,179 million, the valuation difference on available-for-sale securities increased by ¥6,002 million, and deferred tax liabilities increased by ¥3,177 million. The value calculated on a reasonable basis for floating rate government bonds was set to the net present value (after adjustment for convexity) of all future interest payments as calculated from the government bond forward curve and the cash flow at redemption. The main variables applied for price determination were the yield on Japanese government bonds and the volatility of interest rate swap options on 10-year underlying assets.
Other securities sold during fiscal 2009 were as follows:
Millions of Yen 2009
Proceeds from sales ¥333,359 Total gains 323 Total losses 167
22
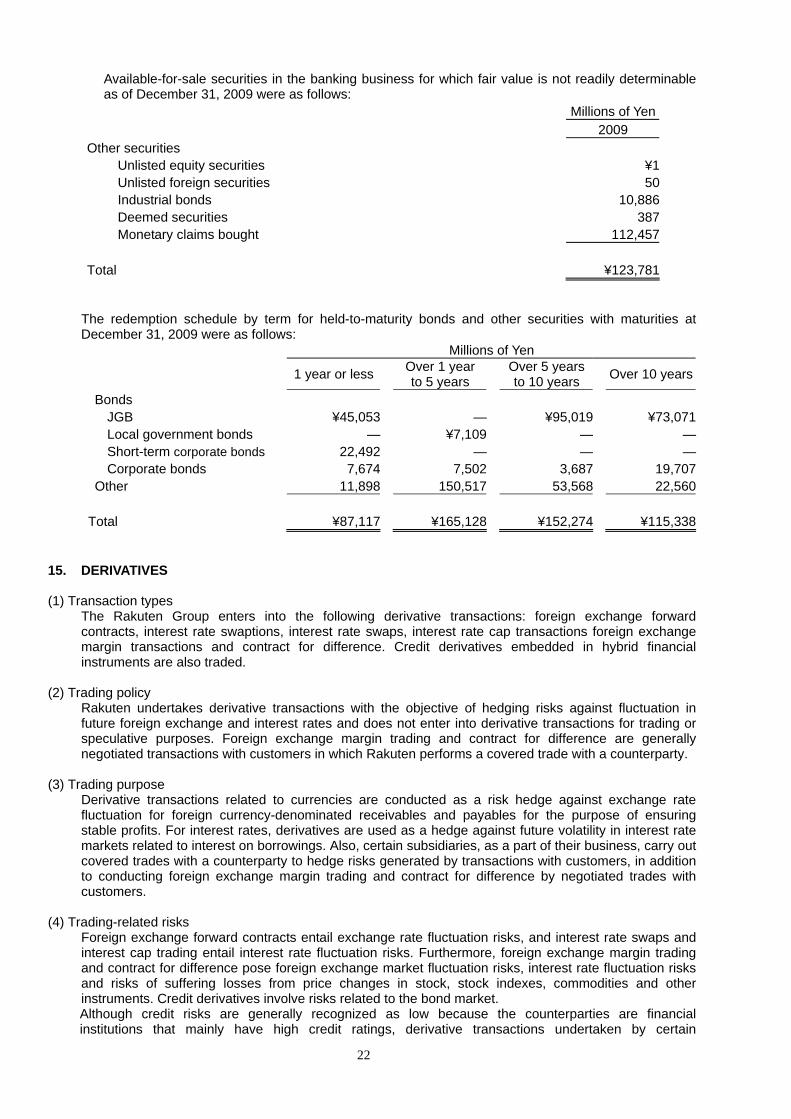
Available-for-sale securities in the banking business for which fair value is not readily determinable as of December 31, 2009 were as follows:
Millions of Yen 2009 Other securities
Unlisted equity securities ¥1Unlisted foreign securities 50Industrial bonds 10,886Deemed securities 387Monetary claims bought 112,457
Total ¥123,781
The redemption schedule by term for held-to-maturity bonds and other securities with maturities at December 31, 2009 were as follows: Millions of Yen
1 year or less Over 1 yearto 5 years
Over 5 years to 10 years Over 10 years
Bonds JGB ¥45,053 — ¥95,019 ¥73,071 Local government bonds — ¥7,109 — — Short-term corporate bonds 22,492 — — — Corporate bonds 7,674 7,502 3,687 19,707Other 11,898 150,517 53,568 22,560
Total ¥87,117 ¥165,128 ¥152,274 ¥115,338 15. DERIVATIVES
(1) Transaction types
The Rakuten Group enters into the following derivative transactions: foreign exchange forward contracts, interest rate swaptions, interest rate swaps, interest rate cap transactions foreign exchange margin transactions and contract for difference. Credit derivatives embedded in hybrid financial instruments are also traded.
(2) Trading policy
Rakuten undertakes derivative transactions with the objective of hedging risks against fluctuation in future foreign exchange and interest rates and does not enter into derivative transactions for trading or speculative purposes. Foreign exchange margin trading and contract for difference are generally negotiated transactions with customers in which Rakuten performs a covered trade with a counterparty.
(3) Trading purpose
Derivative transactions related to currencies are conducted as a risk hedge against exchange rate fluctuation for foreign currency-denominated receivables and payables for the purpose of ensuring stable profits. For interest rates, derivatives are used as a hedge against future volatility in interest rate markets related to interest on borrowings. Also, certain subsidiaries, as a part of their business, carry out covered trades with a counterparty to hedge risks generated by transactions with customers, in addition to conducting foreign exchange margin trading and contract for difference by negotiated trades with customers.
(4) Trading-related risks
Foreign exchange forward contracts entail exchange rate fluctuation risks, and interest rate swaps and interest cap trading entail interest rate fluctuation risks. Furthermore, foreign exchange margin trading and contract for difference pose foreign exchange market fluctuation risks, interest rate fluctuation risks and risks of suffering losses from price changes in stock, stock indexes, commodities and other instruments. Credit derivatives involve risks related to the bond market. Although credit risks are generally recognized as low because the counterparties are financial institutions that mainly have high credit ratings, derivative transactions undertaken by certain
23
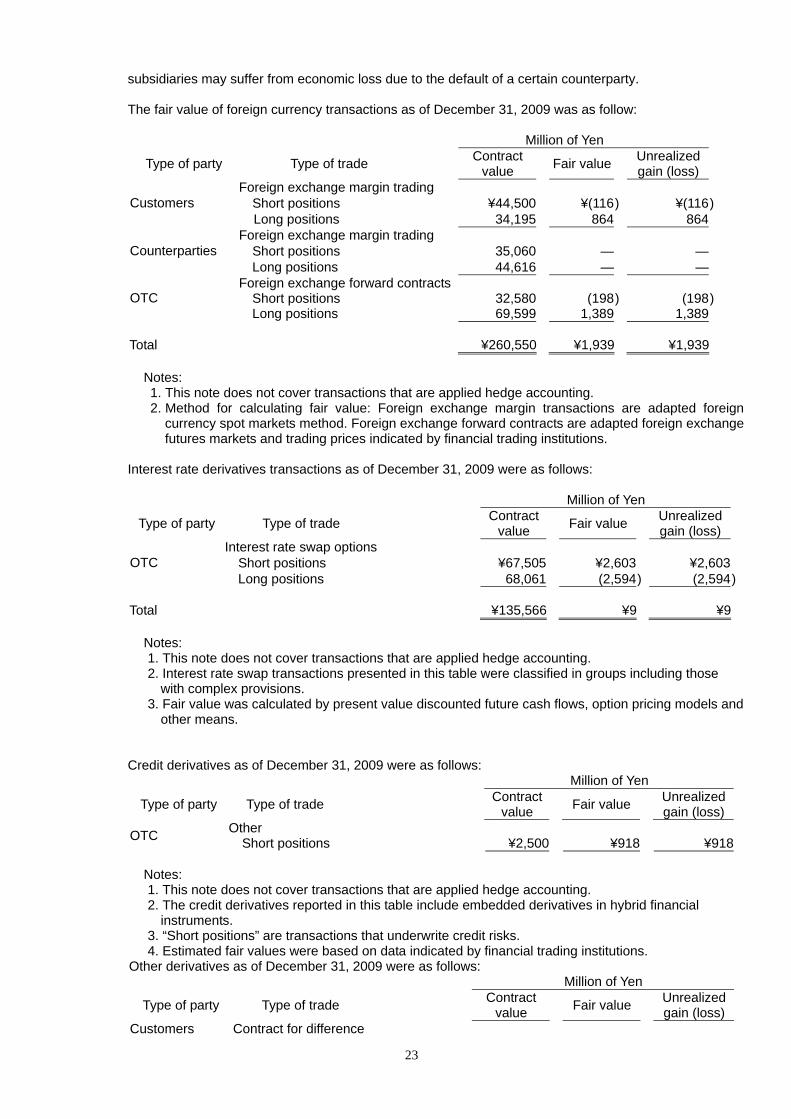
subsidiaries may suffer from economic loss due to the default of a certain counterparty.
The fair value of foreign currency transactions as of December 31, 2009 was as follow:
Million of Yen
Type of party Type of trade Contract value Fair value
Unrealizedgain (loss)
Foreign exchange margin trading Short positions ¥44,500 ¥(116) ¥(116) Customers Long positions 34,195 864 864Foreign exchange margin trading Short positions 35,060 — —Counterparties Long positions 44,616 — —Foreign exchange forward contracts
OTC Short positions Long positions
32,58069,599
(1981,389
) (1981,389
)
Total ¥260,550 ¥1,939 ¥1,939
Notes: 1. This note does not cover transactions that are applied hedge accounting. 2. Method for calculating fair value: Foreign exchange margin transactions are adapted foreign
currency spot markets method. Foreign exchange forward contracts are adapted foreign exchange futures markets and trading prices indicated by financial trading institutions.
Interest rate derivatives transactions as of December 31, 2009 were as follows:
Million of Yen
Type of party Type of trade Contract value Fair value
Unrealizedgain (loss)
Interest rate swap options Short positions ¥67,505 ¥2,603 ¥2,603OTC Long positions 68,061 (2,594) (2,594)
Total ¥135,566 ¥9 ¥9
Notes: 1. This note does not cover transactions that are applied hedge accounting. 2. Interest rate swap transactions presented in this table were classified in groups including those
with complex provisions. 3. Fair value was calculated by present value discounted future cash flows, option pricing models and
other means.
Credit derivatives as of December 31, 2009 were as follows: Million of Yen
Type of party Type of trade Contract value Fair value Unrealized
gain (loss)
OTC Other Short positions ¥2,500 ¥918
¥918
Notes: 1. This note does not cover transactions that are applied hedge accounting. 2. The credit derivatives reported in this table include embedded derivatives in hybrid financial
instruments. 3. “Short positions” are transactions that underwrite credit risks. 4. Estimated fair values were based on data indicated by financial trading institutions.
Other derivatives as of December 31, 2009 were as follows: Million of Yen
Type of party Type of trade Contract value Fair value
Unrealizedgain (loss)
Customers Contract for difference
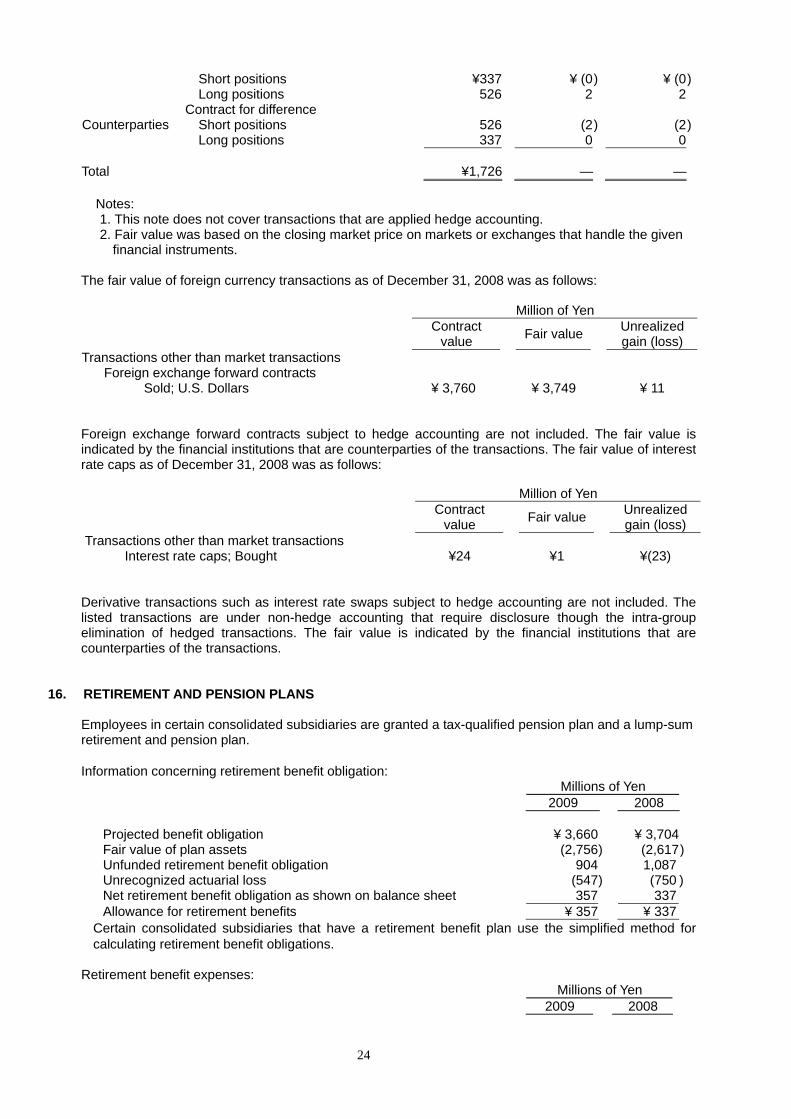
24
Short positions ¥337 ¥ (0) ¥ (0)Long positions 526 2 2
Contract for difference Short positions 526 (2) (2)Counterparties Long positions 337 0 0
Total ¥1,726 — —
Notes: 1. This note does not cover transactions that are applied hedge accounting. 2. Fair value was based on the closing market price on markets or exchanges that handle the given
financial instruments. The fair value of foreign currency transactions as of December 31, 2008 was as follows:
Foreign exchange forward contracts subject to hedge accounting are not included. The fair value is indicated by the financial institutions that are counterparties of the transactions. The fair value of interest rate caps as of December 31, 2008 was as follows:
Derivative transactions such as interest rate swaps subject to hedge accounting are not included. The
listed transactions are under non-hedge accounting that require disclosure though the intra-group elimination of hedged transactions. The fair value is indicated by the financial institutions that are counterparties of the transactions.
16. RETIREMENT AND PENSION PLANS
Employees in certain consolidated subsidiaries are granted a tax-qualified pension plan and a lump-sum retirement and pension plan.
Information concerning retirement benefit obligation:
Millions of Yen 2009 2008
Projected benefit obligation ¥ 3,660 ¥ 3,704 Fair value of plan assets (2,756 ) (2,617)Unfunded retirement benefit obligation 904 1,087 Unrecognized actuarial loss (547 ) (750 )Net retirement benefit obligation as shown on balance sheet 357 337 Allowance for retirement benefits ¥ 357 ¥ 337
Certain consolidated subsidiaries that have a retirement benefit plan use the simplified method for calculating retirement benefit obligations.
Retirement benefit expenses:
Millions of Yen 2009 2008
Million of Yen Contract
value Fair value
Unrealized gain (loss)
Transactions other than market transactions Foreign exchange forward contracts
Sold; U.S. Dollars ¥ 3,760 ¥ 3,749 ¥ 11
Million of Yen Contract
value Fair value
Unrealized gain (loss)
Transactions other than market transactions Interest rate caps; Bought ¥24 ¥1 ¥(23)
25
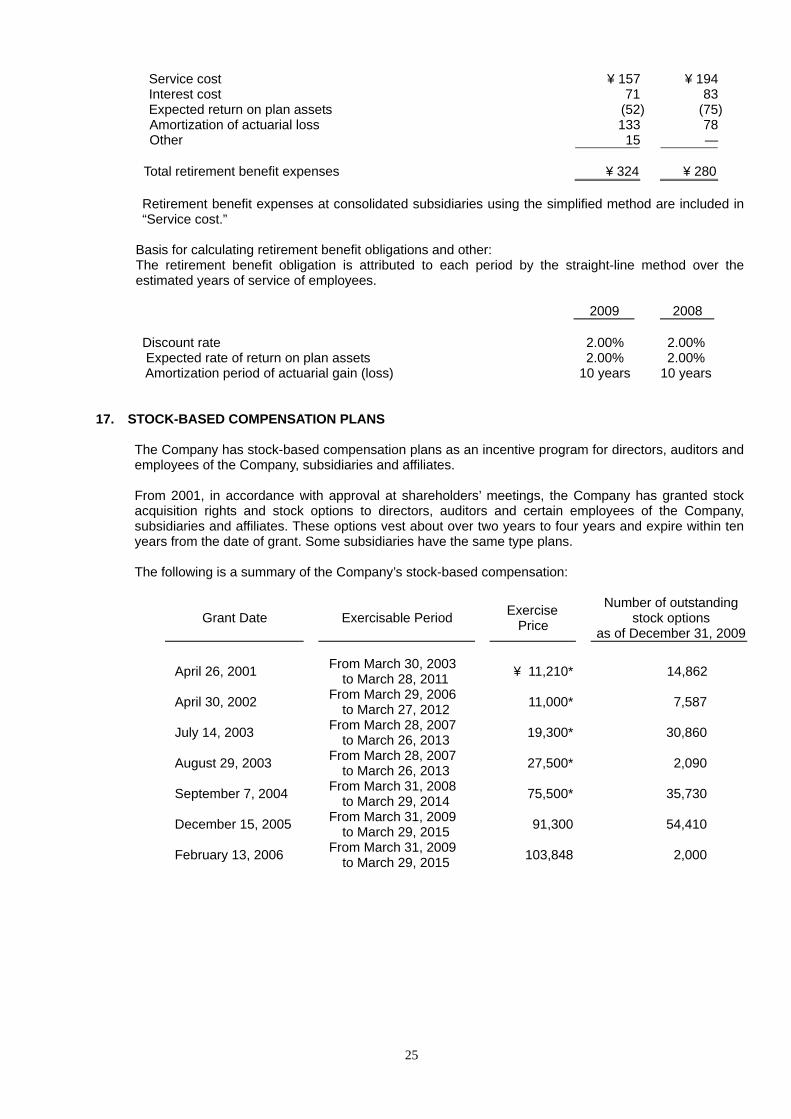
Service cost ¥ 157 ¥ 194 Interest cost 71 83 Expected return on plan assets (52) (75)Amortization of actuarial loss 133 78Other 15 —
Total retirement benefit expenses ¥ 324 ¥ 280 Retirement benefit expenses at consolidated subsidiaries using the simplified method are included in “Service cost.”
Basis for calculating retirement benefit obligations and other: The retirement benefit obligation is attributed to each period by the straight-line method over the estimated years of service of employees.
2009 2008
Discount rate 2.00% 2.00% Expected rate of return on plan assets 2.00% 2.00% Amortization period of actuarial gain (loss) 10 years 10 years
17. STOCK-BASED COMPENSATION PLANS
The Company has stock-based compensation plans as an incentive program for directors, auditors and employees of the Company, subsidiaries and affiliates. From 2001, in accordance with approval at shareholders’ meetings, the Company has granted stock acquisition rights and stock options to directors, auditors and certain employees of the Company, subsidiaries and affiliates. These options vest about over two years to four years and expire within ten years from the date of grant. Some subsidiaries have the same type plans.
The following is a summary of the Company’s stock-based compensation:
April 26, 2001 From March 30, 2003 to March 28, 2011
¥ 11,210* 14,862
April 30, 2002 From March 29, 2006 to March 27, 2012
11,000* 7,587
July 14, 2003 From March 28, 2007 to March 26, 2013
19,300* 30,860
August 29, 2003 From March 28, 2007 to March 26, 2013
27,500* 2,090
September 7, 2004 From March 31, 2008 to March 29, 2014
75,500* 35,730
December 15, 2005 From March 31, 2009 to March 29, 2015
91,300 54,410
February 13, 2006 From March 31, 2009 to March 29, 2015
103,848 2,000
Grant Date Exercisable Period Exercise
Price Number of outstanding
stock options as of December 31, 2009
26
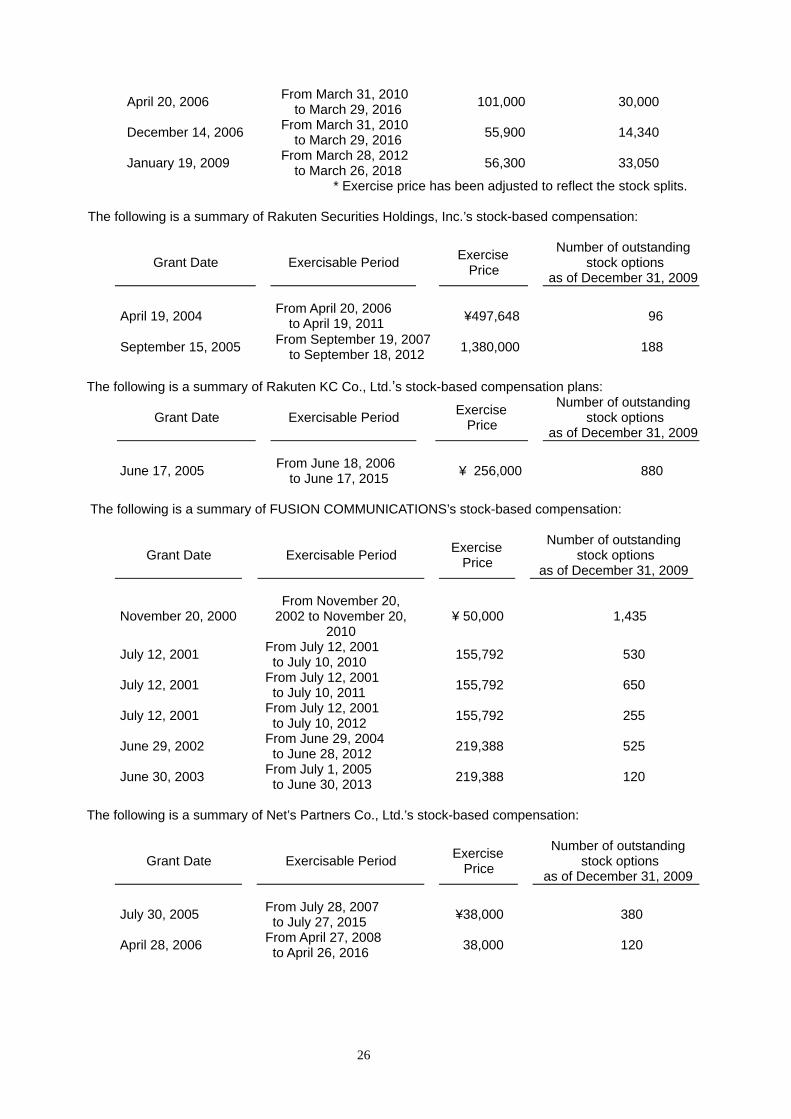
April 20, 2006 From March 31, 2010
to March 29, 2016 101,000 30,000
December 14, 2006 From March 31, 2010 to March 29, 2016
55,900 14,340
January 19, 2009 From March 28, 2012 to March 26, 2018
56,300 33,050
* Exercise price has been adjusted to reflect the stock splits.
The following is a summary of Rakuten Securities Holdings, Inc.’s stock-based compensation:
April 19, 2004 From April 20, 2006
to April 19, 2011 ¥497,648 96
September 15, 2005 From September 19, 2007 to September 18, 2012 1,380,000 188
The following is a summary of Rakuten KC Co., Ltd.’s stock-based compensation plans:
June 17, 2005 From June 18, 2006 to June 17, 2015
¥ 256,000 880
The following is a summary of FUSION COMMUNICATIONS’s stock-based compensation:
November 20, 2000
From November 20, 2002 to November 20,
2010 ¥ 50,000 1,435
July 12, 2001 From July 12, 2001 to July 10, 2010 155,792 530
July 12, 2001 From July 12, 2001 to July 10, 2011 155,792 650
July 12, 2001 From July 12, 2001 to July 10, 2012 155,792 255
June 29, 2002 From June 29, 2004 to June 28, 2012 219,388 525
June 30, 2003 From July 1, 2005 to June 30, 2013 219,388 120
The following is a summary of Net’s Partners Co., Ltd.’s stock-based compensation:
July 30, 2005 From July 28, 2007 to July 27, 2015 ¥38,000 380
April 28, 2006 From April 27, 2008 to April 26, 2016 38,000 120
Grant Date Exercisable Period Exercise
Price
Number of outstanding stock options
as of December 31, 2009
Grant Date Exercisable Period Exercise
Price
Number of outstanding stock options
as of December 31, 2009
Grant Date Exercisable Period Exercise
Price
Number of outstanding stock options
as of December 31, 2009
Grant Date Exercisable Period Exercise
Price
Number of outstanding stock options
as of December 31, 2009
27
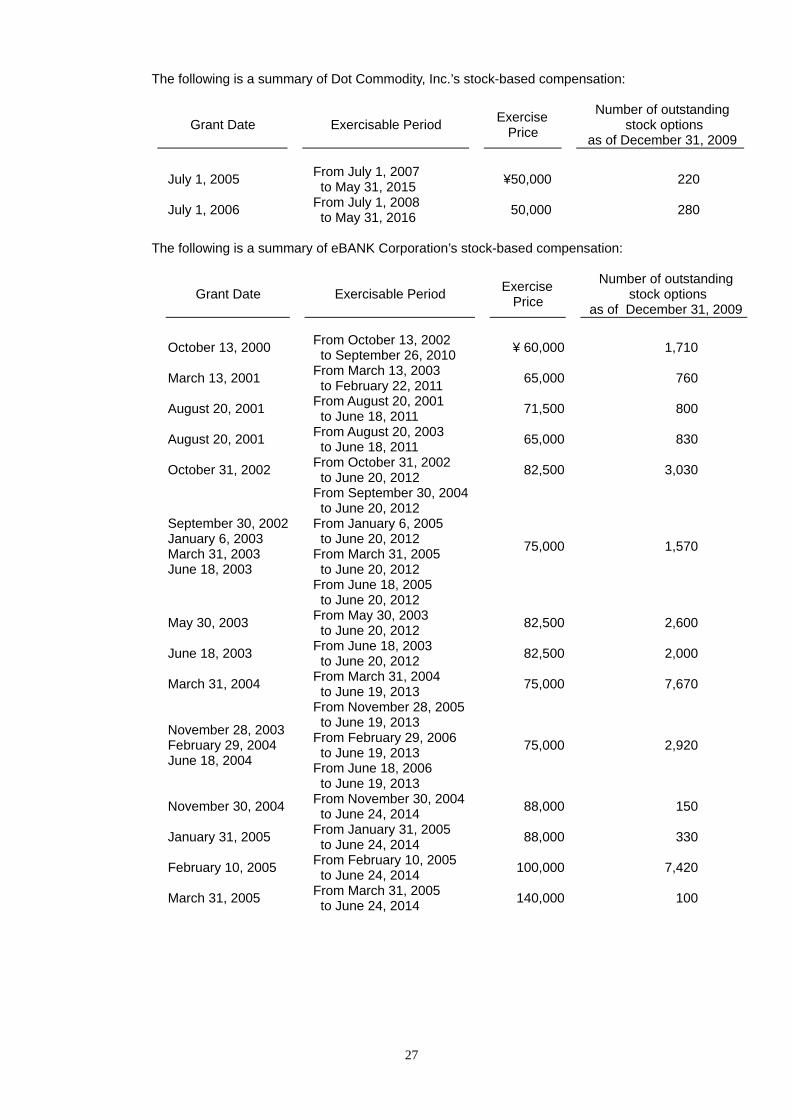
The following is a summary of Dot Commodity, Inc.’s stock-based compensation:
Grant Date Exercisable Period Exercise Price
Number of outstanding stock options
as of December 31, 2009
July 1, 2005 From July 1, 2007 to May 31, 2015
¥50,000 220
July 1, 2006 From July 1, 2008 to May 31, 2016
50,000 280
The following is a summary of eBANK Corporation’s stock-based compensation:
October 13, 2000 From October 13, 2002 to September 26, 2010 ¥ 60,000 1,710
March 13, 2001 From March 13, 2003 to February 22, 2011 65,000 760
August 20, 2001 From August 20, 2001 to June 18, 2011 71,500 800
August 20, 2001 From August 20, 2003 to June 18, 2011 65,000 830
October 31, 2002 From October 31, 2002 to June 20, 2012 82,500 3,030
September 30, 2002 January 6, 2003 March 31, 2003 June 18, 2003
From September 30, 2004 to June 20, 2012 From January 6, 2005 to June 20, 2012 From March 31, 2005 to June 20, 2012 From June 18, 2005 to June 20, 2012
75,000 1,570
May 30, 2003 From May 30, 2003 to June 20, 2012 82,500 2,600
June 18, 2003 From June 18, 2003 to June 20, 2012 82,500 2,000
March 31, 2004 From March 31, 2004 to June 19, 2013 75,000 7,670
November 28, 2003 February 29, 2004 June 18, 2004
From November 28, 2005 to June 19, 2013 From February 29, 2006 to June 19, 2013 From June 18, 2006 to June 19, 2013
75,000 2,920
November 30, 2004 From November 30, 2004 to June 24, 2014 88,000 150
January 31, 2005 From January 31, 2005 to June 24, 2014 88,000 330
February 10, 2005 From February 10, 2005 to June 24, 2014 100,000 7,420
March 31, 2005 From March 31, 2005 to June 24, 2014 140,000 100
Grant Date Exercisable Period Exercise
Price Number of outstanding
stock options as of December 31, 2009
28
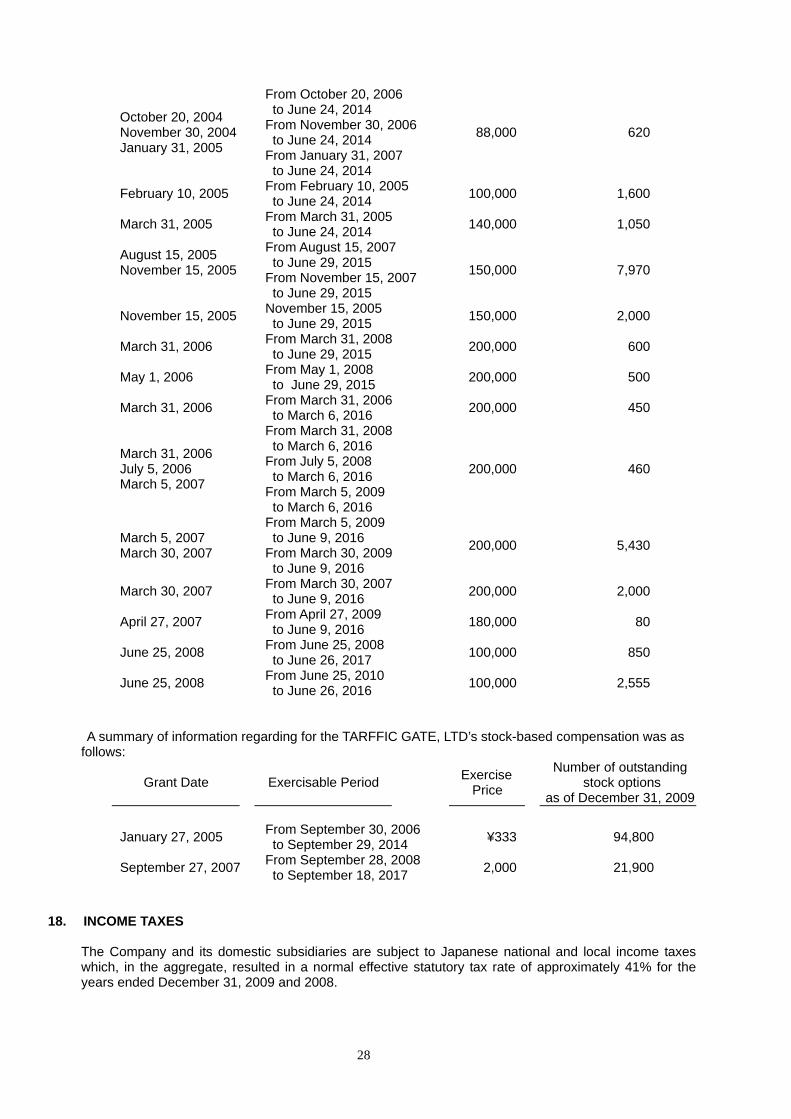
October 20, 2004 November 30, 2004January 31, 2005
From October 20, 2006 to June 24, 2014 From November 30, 2006 to June 24, 2014 From January 31, 2007 to June 24, 2014
88,000 620
February 10, 2005 From February 10, 2005 to June 24, 2014 100,000 1,600
March 31, 2005 From March 31, 2005 to June 24, 2014 140,000 1,050
August 15, 2005 November 15, 2005
From August 15, 2007 to June 29, 2015 From November 15, 2007 to June 29, 2015
150,000 7,970
November 15, 2005 November 15, 2005 to June 29, 2015 150,000 2,000
March 31, 2006 From March 31, 2008 to June 29, 2015 200,000 600
May 1, 2006 From May 1, 2008 to June 29, 2015 200,000 500
March 31, 2006 From March 31, 2006 to March 6, 2016 200,000 450
March 31, 2006 July 5, 2006 March 5, 2007
From March 31, 2008 to March 6, 2016 From July 5, 2008 to March 6, 2016 From March 5, 2009 to March 6, 2016
200,000 460
March 5, 2007 March 30, 2007
From March 5, 2009 to June 9, 2016 From March 30, 2009 to June 9, 2016
200,000 5,430
March 30, 2007 From March 30, 2007 to June 9, 2016 200,000 2,000
April 27, 2007 From April 27, 2009 to June 9, 2016 180,000 80
June 25, 2008 From June 25, 2008 to June 26, 2017 100,000 850
June 25, 2008 From June 25, 2010 to June 26, 2016 100,000 2,555
A summary of information regarding for the TARFFIC GATE, LTD’s stock-based compensation was as follows:
Grant Date Exercisable Period Exercise Price
Number of outstanding stock options
as of December 31, 2009
January 27, 2005 From September 30, 2006 to September 29, 2014 ¥333 94,800
September 27, 2007 From September 28, 2008 to September 18, 2017 2,000 21,900
18. INCOME TAXES
The Company and its domestic subsidiaries are subject to Japanese national and local income taxes which, in the aggregate, resulted in a normal effective statutory tax rate of approximately 41% for the years ended December 31, 2009 and 2008.
29
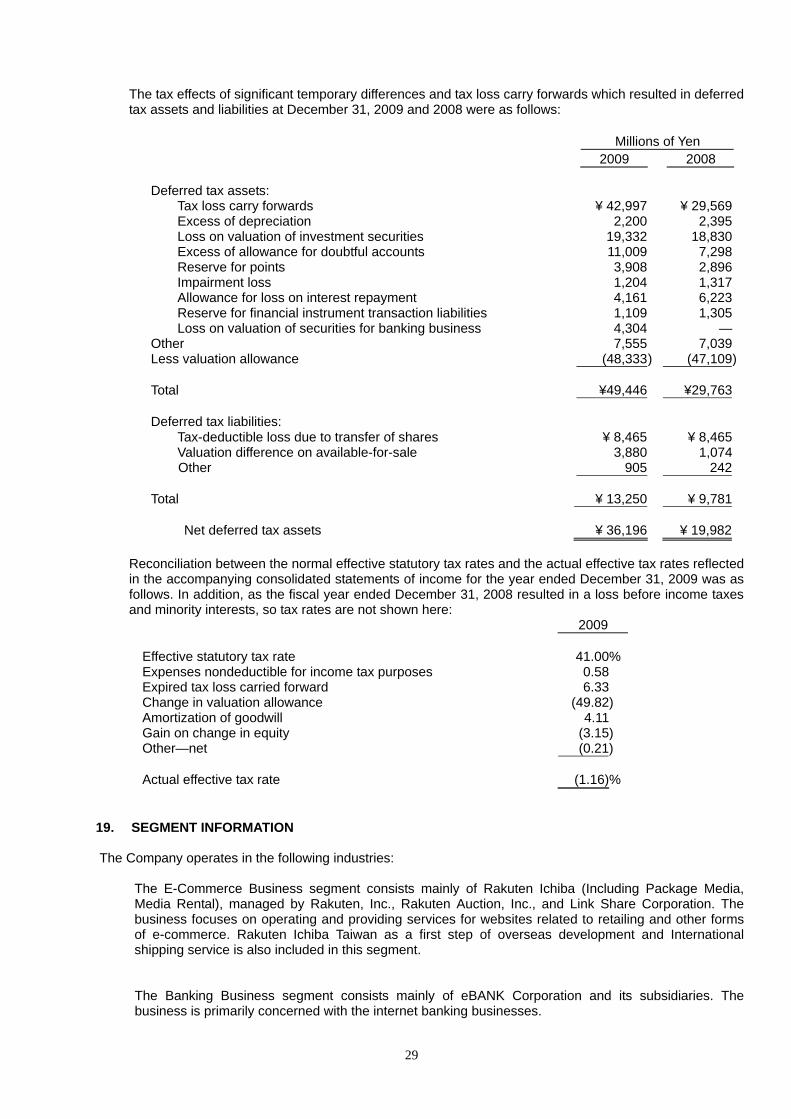
The tax effects of significant temporary differences and tax loss carry forwards which resulted in deferred tax assets and liabilities at December 31, 2009 and 2008 were as follows:
Millions of Yen 2009 2008
Deferred tax assets:
Tax loss carry forwards ¥ 42,997 ¥ 29,569 Excess of depreciation 2,200 2,395 Loss on valuation of investment securities 19,332 18,830 Excess of allowance for doubtful accounts 11,009 7,298 Reserve for points 3,908 2,896 Impairment loss 1,204 1,317 Allowance for loss on interest repayment 4,161 6,223 Reserve for financial instrument transaction liabilities 1,109 1,305 Loss on valuation of securities for banking business 4,304 —
Other 7,555 7,039 Less valuation allowance (48,333 ) (47,109) Total ¥49,446 ¥29,763
Deferred tax liabilities:
Tax-deductible loss due to transfer of shares ¥ 8,465 ¥ 8,465 Valuation difference on available-for-sale 3,880 1,074
Other 905 242 Total ¥ 13,250 ¥ 9,781
Net deferred tax assets ¥ 36,196 ¥ 19,982
Reconciliation between the normal effective statutory tax rates and the actual effective tax rates reflected in the accompanying consolidated statements of income for the year ended December 31, 2009 was as follows. In addition, as the fiscal year ended December 31, 2008 resulted in a loss before income taxes and minority interests, so tax rates are not shown here:
2009
Effective statutory tax rate 41.00% Expenses nondeductible for income tax purposes 0.58 Expired tax loss carried forward 6.33 Change in valuation allowance (49.82) Amortization of goodwill 4.11 Gain on change in equity (3.15) Other—net (0.21) Actual effective tax rate (1.16)%
19. SEGMENT INFORMATION The Company operates in the following industries:
The E-Commerce Business segment consists mainly of Rakuten Ichiba (Including Package Media, Media Rental), managed by Rakuten, Inc., Rakuten Auction, Inc., and Link Share Corporation. The business focuses on operating and providing services for websites related to retailing and other forms of e-commerce. Rakuten Ichiba Taiwan as a first step of overseas development and International shipping service is also included in this segment. The Banking Business segment consists mainly of eBANK Corporation and its subsidiaries. The business is primarily concerned with the internet banking businesses.
30
The Credit Card Business segment (previously Credit and Payment Business Segment) consists mainly of Rakuten KC Co., Ltd. The business is primarily concerned with the consumer credit card business and consumer loan businesses. The Portal and Media Business segment consists mainly of Infoseek, a portal site managed by Rakuten, Inc. Rakuten Research, Inc., Rakuten Shashinkan, Inc. and O-net, Inc. The segment focuses on the operation of Internet portal sites and community networking sites, as well as Internet market research and distribution of broadband content. Furthermore, SHOWTIME Inc. was consolidated from the end of first quarter of this fiscal year. The Travel Business segment consists of Rakuten Travel, Inc. and its subsidiaries and affiliates. It focuses on operating travel-related websites and services, such as hotel bookings. The Securities Business segment mainly consists of Rakuten Securities, Inc. The business provides the online securities brokerage and commodity trading business. The Professional Sports Business segment consists of Rakuten Baseball, Inc., and Rakuten Sports Properties, Inc. It manages the Tohoku Rakuten Golden Eagles professional baseball team, as well as planning and selling related goods.
The Telecommunication Business segment consists of FUSION COMMUNICATIONS. and its subsidiaries. The business provides IP network services, IP telephony and other services.
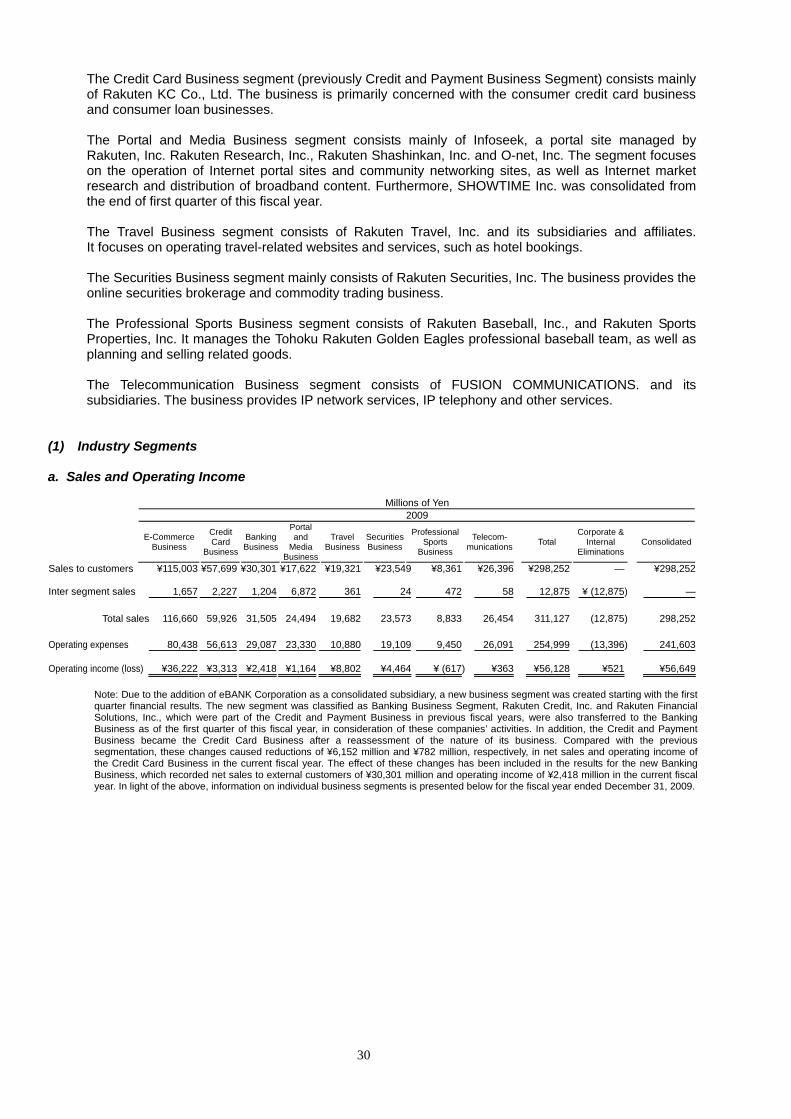
(1) Industry Segments a. Sales and Operating Income
Sales to customers ¥115,003 ¥57,699 ¥30,301 ¥17,622 ¥19,321 ¥23,549 ¥8,361 ¥26,396 ¥298,252 — ¥298,252 Inter segment sales 1,657 2,227 1,204 6,872 361 24 472 58 12,875 ¥ (12,875) —
Total sales 116,660 59,926 31,505 24,494 19,682 23,573 8,833 26,454 311,127 (12,875) 298,252
Operating expenses 80,438 56,613 29,087 23,330 10,880 19,109 9,450 26,091 254,999 (13,396) 241,603 Operating income (loss) ¥36,222 ¥3,313 ¥2,418 ¥1,164 ¥8,802 ¥4,464 ¥ (617) ¥363 ¥56,128 ¥521 ¥56,649
Note: Due to the addition of eBANK Corporation as a consolidated subsidiary, a new business segment was created starting with the first quarter financial results. The new segment was classified as Banking Business Segment, Rakuten Credit, Inc. and Rakuten Financial Solutions, Inc., which were part of the Credit and Payment Business in previous fiscal years, were also transferred to the Banking Business as of the first quarter of this fiscal year, in consideration of these companies’ activities. In addition, the Credit and Payment Business became the Credit Card Business after a reassessment of the nature of its business. Compared with the previous segmentation, these changes caused reductions of ¥6,152 million and ¥782 million, respectively, in net sales and operating income of the Credit Card Business in the current fiscal year. The effect of these changes has been included in the results for the new Banking Business, which recorded net sales to external customers of ¥30,301 million and operating income of ¥2,418 million in the current fiscal year. In light of the above, information on individual business segments is presented below for the fiscal year ended December 31, 2009.
Millions of Yen 2009
E-Commerce Business
Credit Card
Business
Banking Business
Portal and
Media Business
Travel Business
Securities Business
Professional Sports
Business
Telecom-munications Total
Corporate & Internal
Eliminations Consolidated
31
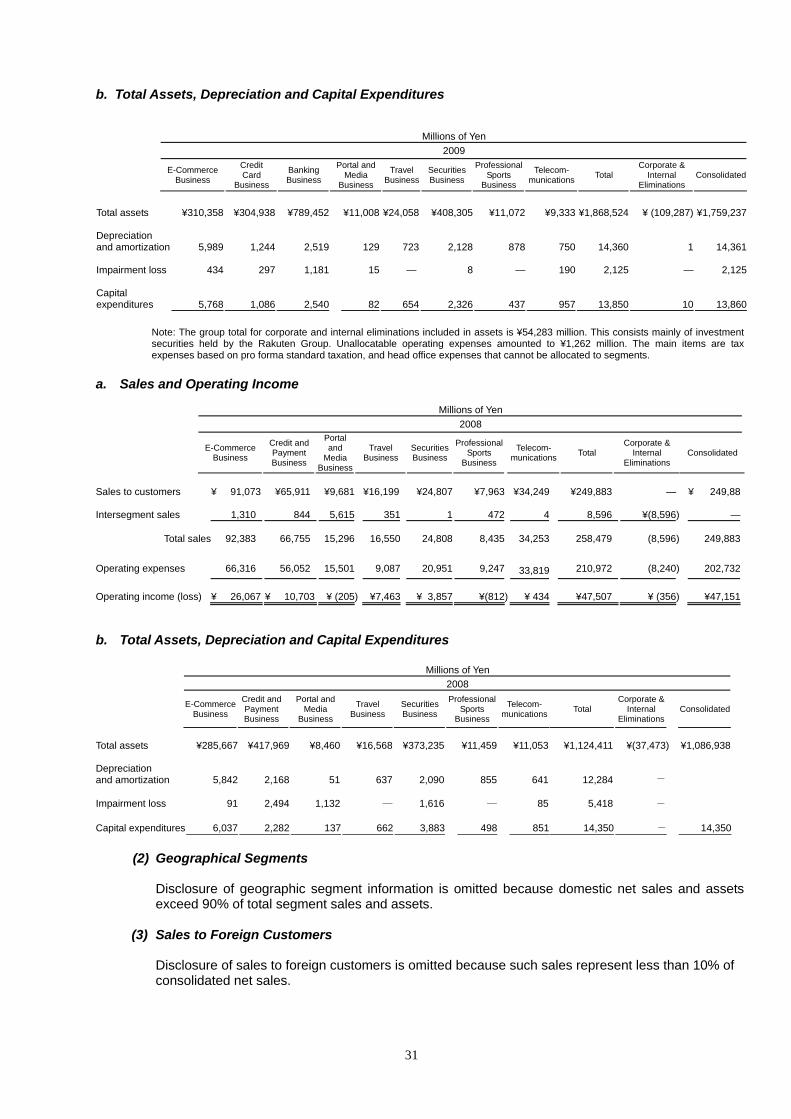
b. Total Assets, Depreciation and Capital Expenditures
Total assets ¥310,358 ¥304,938 ¥789,452 ¥11,008 ¥24,058 ¥408,305 ¥11,072 ¥9,333 ¥1,868,524 ¥ (109,287) ¥1,759,237 Depreciation and amortization 5,989 1,244 2,519 129 723 2,128 878 750 14,360 1 14,361
Impairment loss 434 297 1,181 15 — 8 — 190 2,125 — 2,125 Capital expenditures 5,768 1,086 2,540 82 654 2,326 437 957 13,850 10 13,860
Note: The group total for corporate and internal eliminations included in assets is ¥54,283 million. This consists mainly of investment securities held by the Rakuten Group. Unallocatable operating expenses amounted to ¥1,262 million. The main items are tax expenses based on pro forma standard taxation, and head office expenses that cannot be allocated to segments.
a. Sales and Operating Income
b. Total Assets, Depreciation and Capital Expenditures Millions of Yen
2008
E-Commerce Business
Credit and Payment Business
Portal and
Media Business
Travel Business
Securities Business
Professional Sports
Business
Telecom-munications Total
Corporate & Internal
EliminationsConsolidated
Total assets ¥285,667 ¥417,969 ¥8,460 ¥16,568 ¥373,235 ¥11,459 ¥11,053 ¥1,124,411 ¥(37,473) ¥1,086,938 Depreciation and amortization 5,842 2,168 51 637 2,090 855 641 12,284 -
Impairment loss 91 2,494 1,132 ― 1,616 ― 85 5,418 - Capital expenditures 6,037 2,282 137 662 3,883 498 851 14,350 - 14,350
(2) Geographical Segments
Disclosure of geographic segment information is omitted because domestic net sales and assets exceed 90% of total segment sales and assets.
(3) Sales to Foreign Customers
Disclosure of sales to foreign customers is omitted because such sales represent less than 10% of consolidated net sales.
Millions of Yen 2009
E-Commerce Business
Credit Card
Business Banking
Business
Portal and Media
Business
Travel Business
Securities Business
Professional Sports
Business
Telecom-munications Total
Corporate & Internal
EliminationsConsolidated
Millions of Yen 2008
E-Commerce Business
Credit and Payment Business
Portal and
Media Business
Travel Business
Securities Business
Professional Sports
Business
Telecom-munications Total
Corporate & Internal
EliminationsConsolidated
Sales to customers ¥ 91,073 ¥65,911 ¥9,681 ¥16,199 ¥24,807 ¥7,963 ¥34,249 ¥249,883 — ¥ 249,88 Intersegment sales 1,310 844 5,615 351 1 472 4 8,596 ¥(8,596) —
Total sales 92,383 66,755 15,296 16,550 24,808 8,435 34,253 258,479 (8,596) 249,883
Operating expenses 66,316 56,052 15,501 9,087 20,951 9,247 33,819 210,972 (8,240) 202,732
Operating income (loss) ¥ 26,067 ¥ 10,703 ¥ (205) ¥7,463 ¥ 3,857 ¥(812) ¥ 434 ¥47,507 ¥ (356) ¥47,151
32
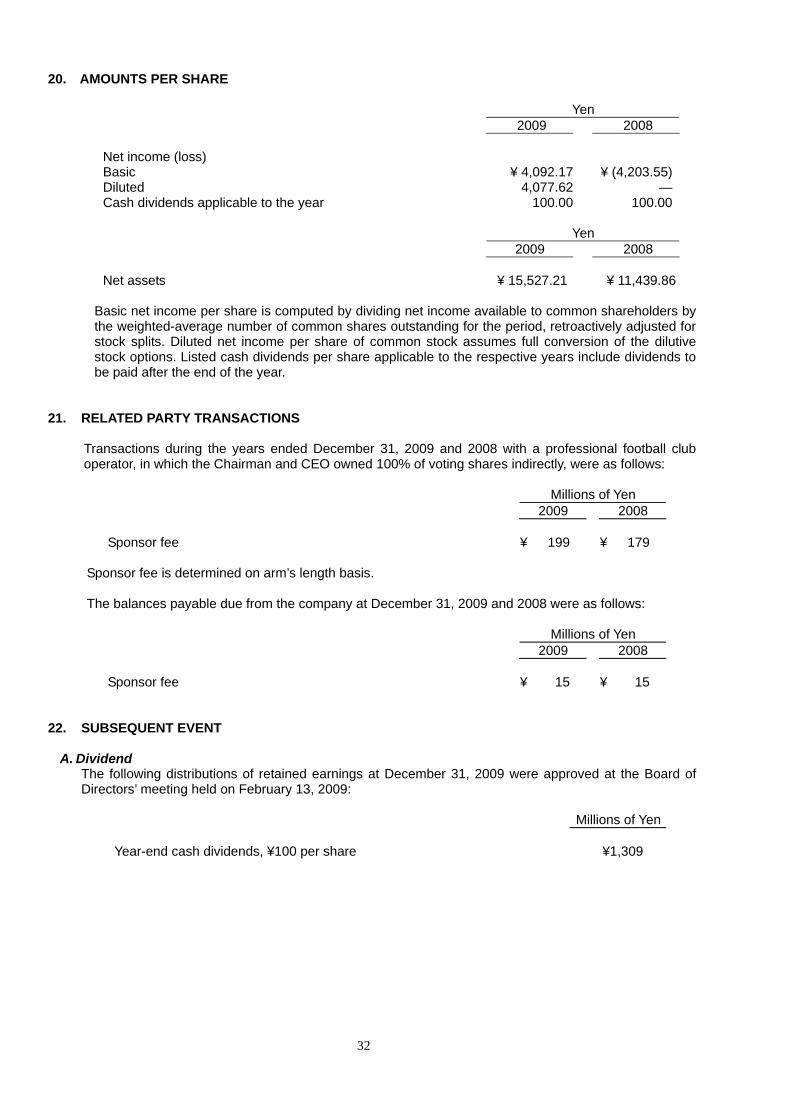
20. AMOUNTS PER SHARE
Yen 2009 2008
Net income (loss) Basic ¥ 4,092.17 ¥ (4,203.55) Diluted 4,077.62 — Cash dividends applicable to the year 100.00 100.00
Yen 2009 2008
Net assets ¥ 15,527.21 ¥ 11,439.86
Basic net income per share is computed by dividing net income available to common shareholders by the weighted-average number of common shares outstanding for the period, retroactively adjusted for stock splits. Diluted net income per share of common stock assumes full conversion of the dilutive stock options. Listed cash dividends per share applicable to the respective years include dividends to be paid after the end of the year.
21. RELATED PARTY TRANSACTIONS
Transactions during the years ended December 31, 2009 and 2008 with a professional football club operator, in which the Chairman and CEO owned 100% of voting shares indirectly, were as follows:
Millions of Yen 2009 2008
Sponsor fee ¥ 199 ¥ 179
Sponsor fee is determined on arm’s length basis.
The balances payable due from the company at December 31, 2009 and 2008 were as follows:
Millions of Yen 2009 2008
Sponsor fee ¥ 15 ¥ 15
22. SUBSEQUENT EVENT
A. Dividend
The following distributions of retained earnings at December 31, 2009 were approved at the Board of Directors’ meeting held on February 13, 2009:
Millions of Yen
Year-end cash dividends, ¥100 per share ¥1,309
33
B. Significant Subsequent Event Pertaining to Business Combination
(1) Name and business description of company acquired, major reasons for business combination, effective
date of business combination, legal form of business combination, name of business after combination, number of shares acquired, and percentage of voting rights.
Name and business description of company acquired
Name of business: bitWallet Inc. Business description of acquired company: Operation and planning of prepaid e-money
business (Edy) Reasons for combination: To leverage the Rakuten Group’s customer base
and marketing know-how with the aims of acquiring users of Edy e-money services, which are planned and operated by bitWallet, and of augmenting the Edy business by promoting its use on the Internet. In addition, strengthening the alliance between the Rakuten Group’s services and Edy allows the combined company to provide high-convenience settlement tools to users. With these aims, the two companies have agreed to a capital alliance. bitWallet was made into a Rakuten’s consolidated subsidiary through subscription to a third-party allotment of new shares issued by bitWallet.
Effective date: January 21, 2010 Legal form of combination: Acquisition of shares Name after combination: bitWallet Inc. No. of shares acquired: 576,037 Percentage of voting rights after acquisition: 52.8%
(2) Breakdown of acquisition costs
Consideration: Cash ¥3,000 million Expenditures directly related to acquisition: ¥66 millionAcquisition cost: ¥3,066 million
(3) Financing method: Internal funds
C. Agreement to establish a joint venture Rakuten and Baidu, Inc., have agreed to form a joint venture in China for an Internet shopping mall business. (1) Reason for establishment:
By combining Rakuten’s e-commerce platform technology and know-how in operating online shopping malls with Baidu’s marketing power and a strong ability to attract customers in the China market, the joint venture aims to start a giant Internet shopping mall in China.
(2) Company overview
Name of joint venture: RakuBai Limited Head office: People’s Republic of China Established: February 12, 2010 Business description: Internet shopping mall operations in China Invested capital: US$ 2,634 million (estimated) Investment ratios: Rakuten 51%, Baidu 49%
D. Grant of subscription rights to shares in accordance with Articles 236, 238, and 239 of the
34
Corporate Law At a meeting on February 12, 2010, the Board of Directors approved a resolution to set certain matters for solicitation, and to solicit subscribers for stock options pertaining to the issuance of subscription rights to shares in the form of stock options, in accordance with Articles 236, 238, and 239 of the Corporate Law, and in accordance with a resolution of the 12th General Meeting of Shareholders held on March 27, 2009. (1) Kind and number of stock options: Common stock of Rakuten, Inc. 11,989 shares (2) Eligible subscribers: Directors, corporate auditors and employees of Rakuten, Inc. (3) Issue price: Gratis (4) Amount out of issued price to be included in capital stock:
One-half of the value of the capital increase for those shares issued by exercise of the stock options as calculated in accordance with Article 17, Paragraph 1 of the Company Accounting Regulations. Any fractional amount less than one yen shall be rounded up.
(5) Allocation date for stock options: February 12, 2010 (6) Period for exercise of option rights: March 28, 2013 to March 26, 2019
E. eBANK tender offer
At a meeting on March 18, 2010, the Board of Directors of Rakuten, Inc. approved a resolution to put forward a tender offer for all outstanding shares of eBANK Corporation, a consolidated subsidiary. (1) Name and business description of company acquired, legal form of business combination, name of unit
after combination, outline and purpose of the transaction
Name and business description of company acquired
Name of business: eBANK Corporation (Name of business to be changed to Rakuten Bank Co., Ltd., on May 4, 2010.)
Business description: Banking through electronic media, primarily financial settlements
Legal form of business combination: Rakuten, Inc., as the parent company for a complete exchange of shares, will acquire and exchange shares of eBANK, as the subsidiary target for a complete exchange of shares
Name of business after combination: eBANK Corporation (Name of business will not change after combination)
Outline and purpose of the transaction: As of March 18, 2010, Rakuten held 1,579,135 shares of common stock (67.2% of outstanding shares) in eBANK, a consolidated subsidiary. Now, with the objective of making eBANK a wholly owned subsidiary, Rakuten has decided to make a tender offer to acquire all of eBANK’s outstanding shares. By making eBANK a wholly owned subsidiary, the entire Rakuten Group will realize an overall sense of speed in business operations that is appropriate for members of an Internet services enterprise. Through these efficiency improvements, Rakuten expects to achieve a superior allocation of management resources throughout the Group, which will greatly increase its corporate value. These efforts, when considered in light of continued uncertainty in global financial markets despite some signs of recovery, will help eBANK achieve steady earnings and a stronger financial structure. We therefore judge the complete purchase of eBANK to be the best option for the future.
35
In addition, by making eBANK a wholly owned subsidiary, Rakuten can establish conditions for more effective use of human and physical resources and intellectual property in the parent company and all members of the Rakuten Group. We believe we can strengthen the bank’s existing competitiveness and harness additional growth in eBANK as an online banking specialist to large increases in corporate value through means of quality improvements in various services furnished to customers and enhanced profitability. If Rakuten is unable to acquire all outstanding shares of eBANK after executing the tender offer (excluding those shares already owned by Rakuten and eBANK), then after the tender offer is complete, Rakuten plans to acquire the remaining outstanding shares of eBANK through an exchange of shares to be conducted by August 2010 and make eBANK a wholly owned subsidiary.
Summary of transaction Tender period: March 19, 2010 to April 30, 2010 Tender price: Common stock: ¥33,000 per share Preemptive right to shares: 1 yen each Share subscription rights: 1 yen each
Number of shares expected to be purchased Shares of stock: 632,881 Subscription warrants: 58,380 shares Total: 691,261 shares
Notes: Because this tender offer sets no lower and upper limits on the number of shares purchased, Rakuten plans to purchase all tendered shares. Amount of tender: ¥22,812 million (estimated) The tender amount is equal to the maximum number of shares tendered (691,261) times the price per share (33,000 yen).
(2) Financing method: Internal funds (3) Summary of accounting treatment The exchange of shares will be treated for accounting purposes as a transaction under common control in accordance with the Accounting Standards for Business Combinations (Accounting Standards Board of Japan [ASBJ], Statement No. 21, issued October 31, 2003, and revised December 26, 2008) and the Revised Guidance on Accounting Standard for Business Combinations and Accounting Standard for Business Divestitures (ASBJ Guidance No. 10, issued December 27, 2005, and revised December 26, 2008).