Rajesh Exports - rajeshindia-production.s3. · PDF file1 Evaluateresearch.com momentum going...
33
1 Evaluateresearch.com Rajesh Exports Bloomberg: RJEX_IN Consumer Discretionary: Gold Jewellery Manufacturer Thursday, July 23, 2015 Rajesh Exports is India’s largest exporter of gold jewelry with a 40% market share. The company has grown rapidly over the past decade and expects to maintain a strong growth momentum going forward driven by numerous catalysts which are likely to unfold in the near to intermediate term. Over the last five years, the company has recorded 23% EPS CAGR and 20% revenue CAGR. Conclusion Our 12-month price target on the stock is INR725 which represents about 40% upside from current levels. Our price target is based on the average of P/E, EV/EBITDA and DCF. We apply a 25x multiple on our FY03/2017 EPS estimate of INR28 which come to INR700 per share. Our EV/EBITDA shows a price of INR690 per share by applying an 8x multiple to our FY03/2017 EBITDA estimate of INR14.7 bn. Our DCF based price is INR767 per share which assumes 12.5% WACC and 2.5% terminal growth rate. See DCF details further in this report. In our recent visit with management at their corporate headquarters, the CEO reiterated his ambitious growth plans which should further add shareholder value if successfully executed. The company is currently undergoing a positive mix shift whereby the proportion of revenue contribution from the high margin retail business is increasing. There is very high operating leverage in the business with the company operating at an EBITDA margin of 2.5%. Hence, a small increase in margins can have a multiplier effect on the net income. The retail business commands gross margins in the range of 7%-8% while the exports business operates at a gross margin of under 2%. Additionally, the company is also actively pursuing inorganic growth opportunities through M&A as it moves towards its next phase of growth. Rajesh Exports has two business divisions; Exports and Retail which accounts for 91% and 9% of total revenues respectively. The company has a refining facility in the north Indian state of Uttaranchal with a capacity to refine 400 tons per annum [tpa]. It also has a jewelry manufacturing facility in the southern city Bangalore with a capacity of 250 tpa. www.evaluateresearch.com Target Price Rs. 725.00 Current Price Rs. 523.00 Upside Potential 40% Market Cap. Rs. 154,400mn $ 2.4bn Shares Outstanding 295mn Free Float (FF %) 77mn / 26% 52 Week Range (Rs) 117.35 / 538.50 Avg. Daily Value Rs. 383mn $ 6mn SENSEX Index Level 28,370 Insider Holding % 53% Net Cash 60% of market cap. P/E 18.4x (FY03/2017E) EV/EBITDA 4.72x (FY03/2017E) Risk: Above Average Analyst: Prajwal Gote [email protected] Client Servicing: Pooja Burgul [email protected]
Transcript of Rajesh Exports - rajeshindia-production.s3. · PDF file1 Evaluateresearch.com momentum going...

1 Evaluateresearch.com
www.evaluateresearch.com Rajesh Exports
Bloomberg: RJEX_IN Consumer Discretionary: Gold Jewellery Manufacturer
Thursday, July 23, 2015
Rajesh Exports is India’s largest exporter of gold jewelry with a
40% market share. The company has grown rapidly over the
past decade and expects to maintain a strong growth
momentum going forward driven by numerous catalysts which
are likely to unfold in the near to intermediate term. Over the
last five years, the company has recorded 23% EPS CAGR and
20% revenue CAGR.
Conclusion Our 12-month price target on the stock is INR725 which
represents about 40% upside from current levels. Our price
target is based on the average of P/E, EV/EBITDA and DCF.
We apply a 25x multiple on our FY03/2017 EPS estimate of
INR28 which come to INR700 per share. Our EV/EBITDA
shows a price of INR690 per share by applying an 8x multiple to
our FY03/2017 EBITDA estimate of INR14.7 bn. Our DCF
based price is INR767 per share which assumes 12.5% WACC
and 2.5% terminal growth rate. See DCF details further in this
report.
In our recent visit with management at their corporate
headquarters, the CEO reiterated his ambitious growth plans
which should further add shareholder value if successfully
executed. The company is currently undergoing a positive mix
shift whereby the proportion of revenue contribution from the
high margin retail business is increasing. There is very high
operating leverage in the business with the company operating
at an EBITDA margin of 2.5%. Hence, a small increase in
margins can have a multiplier effect on the net income. The
retail business commands gross margins in the range of 7%-8%
while the exports business operates at a gross margin of under
2%. Additionally, the company is also actively pursuing
inorganic growth opportunities through M&A as it moves
towards its next phase of growth.
Rajesh Exports has two business divisions; Exports and Retail
which accounts for 91% and 9% of total revenues respectively.
The company has a refining facility in the north Indian state of
Uttaranchal with a capacity to refine 400 tons per annum [tpa].
It also has a jewelry manufacturing facility in the southern city
Bangalore with a capacity of 250 tpa.
www.evaluateresearch.com
Target Price Rs. 725.00
Current Price Rs. 523.00
Upside Potential 40%
Market Cap. Rs. 154,400mn
$ 2.4bn
Shares Outstanding 295mn
Free Float (FF %) 77mn / 26%
52 Week Range (Rs) 117.35 / 538.50
Avg. Daily Value Rs. 383mn
$ 6mn
SENSEX Index Level 28,370
Insider Holding % 53%
Net Cash 60% of market cap.
P/E 18.4x (FY03/2017E)
EV/EBITDA 4.72x (FY03/2017E)
Risk: Above Average
Analyst:
Prajwal Gote
Client Servicing:
Pooja Burgul

2 Evaluateresearch.com
Contents
Particulars Page Number
Quick Summary and Conclusion 1
Selected Financials 3
Investment Summary 4 – 10
Recent Results 10 – 11
Catalysts 11 – 13
Risks 13 – 14
Company Description 15 – 16
Management Bio 16
Industry Overview 17 – 22
Peer Comparison 22
Appendix 23 – 25
Detailed Financials 26 – 31
Disclaimer 32

3 Evaluateresearch.com
-20%
-10%
0%
10%
20%
30%
40%
50%
60%
70%
80%
90%
0
100,000
200,000
300,000
400,000
500,000
600,000
2005 2006 2007 2008 2009 2010 2011 2012 2013 2014 2015
Revenue (Mn) Growth
Revenue Chart
RS. mn
Company Description Rajesh Exports is one of the world’s largest manufacturers of gold jewelry. With over 30
years of operating history, Rajesh Exports is a low cost manufacturer due to economies
of scale, and it derives 90% of its revenues from exports. The company is rapidly
expanding in retail stores as well with over 90 stores presently. The company is a prime
beneficiary of secular growth in Indian and Asian gold and jewelry demand.
Growth Ratios % FY 03/2014 FY 03/2015 FY 03/2016E FY 03/2017E FY 03/2018E
Revenue -6.3% 77.0% 7.4% 8.3% 9.6%
EBITDA 0.7% 65.5% 7.0% 8.3% 14.0%
Operating Income -1.2% 60.8% 8.0% 8.3% 14.2%
Net income adjusted -21.0% 83.2% 13.1% 13.1% 21.4%
Diluted EPS adjusted -21.0% 83.2% 13.1% 13.1% 21.4%
Margins (%) Gross Margin 1.5% 1.7% 1.8% 1.8% 1.9%
Operating Margin 2.6% 2.4% 2.4% 2.4% 2.5%
EBITDA Margin 2.7% 2.5% 2.5% 2.5% 2.6%
Pre-Tax Margin (adjusted) 1.4% 1.4% 1.5% 1.6% 1.8%
Net Income Margin (adjusted) 1.3% 1.3% 1.4% 1.4% 1.6%
ROE (%) 13.0% 19.1% 17.9% 17.0% 17.2%
Return on Capital Employed (ROCE) 27.2% 35.2% 31.5% 28.5% 27.1%
Return on Invested Capital (ROIC) 6.1% 9.2% 9.5% 9.7% 10.6%
Return on Assets 3.2% 4.1% 4.5% 4.6% 5.2%
P/B 0.94 1.69 3.74 3.13 2.61
P/E 7.24 8.82 20.86 18.44 15.18

4 Evaluateresearch.com
Significant Growth in Retail After having established itself as India’s largest gold export
house, a journey that began in the year 1985, management
decided to foray into the high-margin, lucrative gold retail
business in the year 2010. Since then, the store count has
grown at a healthy pace and currently stands at 83 stores all
over India. While the pace of growth did slow down in 2014 due
to restrictions on the import of gold, now that the curbs have
been lifted, management aims to expand rapidly and reach 500
stores over the next 3-4 years. The retail business currently
contributes 9% to the total revenues, and a higher percentage of
profits, which is expected to reach 40% over the next 3-4 years.
The company operates under the franchisee model in the retail
space and has a strong competitive edge being the lowest cost
gold producer and with over 30,000 designs in its repertoire.
This huge variety means that the company has something to
offer every customer type who has varied tastes and
preferences. In terms of the geographic distribution, a majority
of the company’s stores are located in southern India which
commands almost 48% of the total Indian retail market.
Management plans to increase its presence in other Indian
cities over time as it gains more insights into the local
customers’ tastes and preferences.
Margin Expansion; High Operating Leverage The company is currently undergoing a positive mix shift
whereby the proportion of revenue contribution from the high-
margin retail business is increasing. There is very high
operating leverage in the business with the company operating
at an EBITDA margin of 2.5%. Hence, a small increase in
margins can have a multiplier effect on the net income. The
retail business commands gross margins in the range of 7%-8%
while the exports business operates at a gross margin of under
2%. Even within the exports segment, management is
targeting to increase the proportion of designer jewelry which
carries higher margins. The company recently bagged an
export order for a UAE firm for designer jewelry which has
gross margins of 7%. Overall, management targets expanding
EBITDA margins from 2.5% to 2.9% over the next few years.
Strong Management; 30 Years Track Record The company is run by the Executive Chairman Rajesh Mehta
and his brother Prashant Mehta, the company’s Managing
Director, who have over 30 years of experience in running this
jewelry business. In fact, even before the company came into
existence in 1989, Mr. Mehta had been assisting his father in
running his small jewelry business. The company has a great
track record of creating shareholder wealth since its listing in
the year 1996 as the stock has appreciated multi-fold since

5 Evaluateresearch.com
then. Additionally, the family owns about 54% of the shares
outstanding and has never sold any shares since the IPO. In
our recent visit with management at their corporate
headquarters, the Chairman reiterated his ambitious growth
plans which should further add shareholder value if
successfully executed.
Inorganic Growth through Acquisitions The company recently received an approval from its board to
make acquisitions in Europe in the range of US$250-US$500
million. The company’s chairman Mr. Rajesh Mehta himself
has expressed his desire on a number of occasions to strengthen
the company’s supply chain through the acquisition of either a
mining or a refining company abroad. This will help the
company expand its global footprint as it enters its next phase
of growth. There have been rumors in the press [source: PTI,
Bloomberg, Economic Times] that the company may acquire
Swiss-based Valcambi, a precious metal refiner which has a
capacity to refine about 2,000 tons of gold, silver and platinum
per year. That company is majority-owned by the US gold
producer Newmont Mining Corp. With a net cash balance
sheet, Rajesh Exports has enough ammunition to make an
acquisition, in our view. While an acquisition looks likely, the
price and the expected synergies will determine whether it will
create or destroy shareholder value. Given management’s
strong track record and experience in managing this business
over the past 30 years, we believe an international acquisition
will be a positive catalyst for the stock price.
Lowest Cost Manufactures of Gold in the World. Management claims to be the lowest cost manufacturers of gold
in the world with the world’s largest gold manufacturing facility
having a capacity of 250 tons per annum [TPA] located in the
southern Indian city Bangalore. Over the years, the company
has developed strong technological know-how which helps it
minimize wastage which according to management is less than
0.25% compared to 3% for the industry. The company uses
state-of-the-art technology to recover gold from air, water and
every other material in its manufacturing unit. The company
imports raw gold which attracts lower import duty and refines
it in its own refinery which helps them keep their costs low as
labor is easily available and relatively inexpensive in India.
Management remains on the lookout to further lower its
production costs through vertical integration and business
expansion.
All Gold Positions Hedged; No Price and FX Risk A closer look into the company’s exports business reveals that
as soon as the company receives an export order, it immediately

6 Evaluateresearch.com
Source: Company Reports
matches the price with its import order. This eliminates the
risk of fluctuation in the gold prices from the time of receiving
an export order to the time of dispatching the finished product.
Additionally, the currency risk is completely hedged at the time
the order is received. The cost of hedging and the credit cost is
completely offset by the interest the company receives on the
deposit with the bank to obtain the letter of credit required in
the import of gold. This process can be better understood from
the figure below.
Exports Business 91% of Rev; No Inventory Risk The jewelry exports business remains a cash cow for the
company and contributes approximately 91% of revenues. The
company has a refining facility in the north Indian state of
Uttaranchal with a capacity to refine 400 tpa. Additionally, it
has a jewelry manufacturing facility in the southern city
Bangalore with a capacity of 250 tpa. The company does not
carry any inventory risk and only processes jewelry upon
receipt of an order.
Net cash + Surplus Properties = 68% of the Market Cap As of March 31, 2015, the company had RS.85 bn [RS. 288 per
share] in net cash on the balance sheet which approximates to
60% of the current market cap. Additionally, the current value
of investment properties [which is mainly comprised of land] is
RS.8 bn [RS. 27 per share] or 5% of the current market cap. So
cash plus properties account for 65% of the market cap.

7 Evaluateresearch.com
The company also has inter-corporate deposits [ICDs] on its
balance sheet which mainly represents advances/loans made to
property developers against collateral which is usually land.
The balance sheet value of these ICDs are RS.3.5 bn but
management expects to recover at least RS.5 bn [which includes
interest payments and repossession of land on default]. So
including all three, the total approximates to RS.98 bn [RS.332
per share] or 68% of the current market cap. It is important to
note that the cash is not sitting idle on the balance sheet as the
company needs it for margin deposit with banks to obtain the
letter of credit for its import orders. The question that arises
then is that how is the company able to achieve RS.500 bn in
sales from RS. 100 bn cash. The answer to this is that while the
payment for exports is received within 15-30 days, the company
gets around 90 days to make payment to its suppliers for
imports. This allows it to roll over its cash three times. This
adds to RS. 300 bn. The rest of the revenues comprise cash and
retail sales.
Loss at the Operating Level..!! Actually there is a Profit There is a popular perception among investors that the
company is losing money at the operating level as its income
statement sometimes shows an operating loss. This is primarily
because of the Indian accounting standards which require the
company to book the credit cost of imports i.e. the interest paid
on credit purchases, under its cost of sales while the interest
earned on the margin deposits [the deposits held with banks for
obtaining the letter of credit] is shown below the operating
income line. If the credit cost of goods purchased is recorded
separately or if the interest earned on margin deposits are
included as part of business operations, then there is an
operating profit. Net-net, the interest costs [i.e. the credit cost
and the cost of hedging] are completely offset by the interest
income on margin deposits which means that the business has
an actual operating margin of close to +2.4%. This can be better
explained through the table below.

8 Evaluateresearch.com
Source: Company Reports

9 Evaluateresearch.com
Venturing into the Gold Loan Business The company plans to venture into the gold loan financing
business soon which should complement its gold retail business,
in our view. Management is carefully assessing the market and
is expected to take a final decision soon. The company’s
existing network of retail stores will provide a ready customer
base and a good opportunity to cross-sell. The gold loan
business should have a positive impact on the company’s
revenues and profitability, in our view.
Very Low Maintenance CAPX The company has grown rapidly over the past decade and
expects to maintain a strong growth momentum in the
intermediate term. As such, the growth CAPX will likely
remain at an elevated level as the company pursues organic
growth opportunities by rolling out more retail stores [majority
are franchisees which requires limited CAPX from the
company] as well as inorganic growth through M&A. However,
once a manufacturing unit is established, the maintenance
CAPX requirements are limited at less than RS.20 million per
annum.
50% Capacity Utilization, Easily Upgradable. At 120 tons, the company’s current capacity utilization is 50%
which seems low. However, with a long-term vision of secular
growth in gold demand, management has expanded its
manufacturing capacity over the years from 2.5 tpa in 1994 to
250 tpa in 2001. The capacity utilization has also increased over
the years and management expects it to further increase going
forward driven by increasing export orders and robust growth
in its retail branch network. When we spoke with management,
it noted that the installed capacity can easily be expanded and
that it can add 100 tons of new capacity in just three months
time. While we do not see the need to expand capacity in the
near-term, given low current capacity utilization, flexible
capacity adjustments remain an important requirement to grow
the business in future.
Sharp Rebound in Sales in FY15 FY03/2014 was a lackluster year for the company as sales were
down -6.3% YoY while the net income was down -21%. One of
the primary reasons for this was the restrictions on the import
of gold put in by the Indian government in 2013 to control its
ballooning current account deficit. However, sales and net
income rebounded strongly in FY03/2015, up 77% and 83%
respectively, as these import restrictions were eased in the
subsequent year following a decline in the oil prices which
eased the country’s current account deficit situations. Over the
last five years, the company has recorded 23% EPS CAGR and

10 Evaluateresearch.com
20% revenue CAGR.
Robust Retail Franchise Model Retail growth will largely take place via the franchise model.
We think this format of growth makes sense for the company
for several reasons such as risk, capital outlay, managing
individual stores in diverse cities, profitability and ultimately
ROI. Rajesh Exports requires franchisees to procure top-tier
store locations on their own. As almost all franchisees are
already in the retail jewelry trade, often for decades, they
invariably already have preferred locations that would be hard
to replicate for a newcomer or for Rajesh Exports to set up on
their own with new stores. Thus the real estate [store]
investment risk is on the franchisee. Rajesh Exports provides
the entire inventory, which is typically 35 kgs of gold jewelry,
worth about US$ 1.4 million [Rs. 88 million, or Rs. 8.8 crores].
Rajesh Exports will only make this inventory investment with
hard collateral in one of three forms: land, cash, or gold. The
company is very clear it will not take any other form of
collateral, and they further require personal guarantees [such
as post-dated checks, etc] from the franchisee and immediate
family members.
With individual franchisees managing their stores, the risk of
theft and inventory shrinkage is mitigated. Also, franchisees
have customer relationships and a reputation in the local
marketplace often going back a couple of generations. The
franchisee frees up his entire inventory capital requirement.
Overall, if properly executed, the franchisee model is a win-win
for all parties. Rajesh Exports targets a ROI of 24%, while it
claims franchises have a ROI much higher than if they were to
go it alone. Rajesh Exports has the benefit of being a low cost
producer which benefits sales and margins, and it also bears
responsibility for overall branding and advertising support.
Recent Results The company reported a strong set of results for FY03/2015
ended March which was a record year for the company for both
revenues and profits. Revenues were up 77% YoY to RS.504 bn
while the net income was up 83% YoY to RS.6.5 bn. The strong
outperformance was driven by robust growth across the
company’s exports and retail businesses which benefited from
the removal of import restrictions on gold which was put in
place in the previous financial year. In FY03/2014, the
company’s revenues were down -6.3% YoY while the net income
was down -21% YoY due to these restrictions. Management has
ambitious growth plans going forward as it looks to gain a
stronger foothold into the gold retailing business.

11 Evaluateresearch.com
The company had 83 retail stores at the end of FY2015 and
plans to increase it to 500 by 2017. The retail business
currently accounts for 9% of the company’s total revenue and
the target is to ramp it up to ~30-40% over the next few years.
The retail business also carries higher gross margins of ~7%
which should lift the overall margins going forward.
Management targets to expand its EBITDA margins from 2.5%
currently to 2.9% by 2017. Given the high operating leverage in
the business, this will have a multiplier effect on the company’s
profitability, in our view. Our estimates are a little
conservative as we are building in a 2.6% EBITDA margin in
FY03/2018. At the end of FY03/2015, the company had net cash
in the balance sheet of RS.85 bn which approximates to 60% of
its current market cap. The company’s operating cash flows
tend to be volatile [but positive over time] on a yearly basis due
the nature of its exports business. However, as the retail
business ramps up, management expects less volatile and
positive cash flows from operations.
Catalysts
Growth in Retail Business Management is currently focusing on expansion of retail stores.
Retail stores have increased from 30 in FY11 to 83 in FY15 and
contribution of retail revenue to total revenue has increased
from less than 5% in FY11 to 9% in FY15. Management expects
the number of outlets to increase to almost 500 in the coming 3
to 4 years which should increase the contribution from this
segment to 40% of the total revenues. In terms of the
geographic distribution, a majority of the company’s stores are
located in Southern India which commands almost 48% of the
total Indian retail market. Management targets to increase its
presence in other Indian cities over time as it gains more
insights into the local customers’ tastes and preferences. The
retail business will help the company to diversify its operations
and remains a key catalyst for the company.
Margin Expansion Margin expansion remains an important catalyst for the stock
as the company is currently undergoing a positive mix shift
whereby the proportion of high margin retail business is
increasing. Management’s target is to expand EBITDA margin
from 2.5% to 2.9% over the next few years. Even in the exports
business, the company is targeting the designer jewelry
business which carries higher margins. Company has recently
bagged two export orders from Middle East of around Rs 25 bn
which has a gross margin of around 7%.

12 Evaluateresearch.com
Potential M&A – Key Growth Strategy for Development There have been rumors in the press that the company may
acquire Swiss-based Valcambi, a precious metal refiner which
has a capacity to refine about 2,000 tons of gold, silver and
platinum per year. The company is majority owned by the US
gold producer Newmont Mining Corp. With a net cash balance
sheet, the company has enough ammunition to make an
acquisition in our view. While an acquisition looks likely, the
price and the expected synergies will determine whether it will
create or destroy shareholder value. Given management’s
strong track record and experience in managing this business
over the past 30 years, we believe an international acquisition
will be a positive catalyst for the stock price.
Cultural & Demographic Trends Bode Well for Gold With 50% of India’s population below the age of 30, the
demographic trends bode well for domestic gold consumption.
Indian weddings are famous for spending on bridal jewelry, as
well as by those attending the event. India reclaimed its
world’s top gold consumer crown from China as demand for
jewelry surged in the second half of 2014, data from the World
Gold Council (WGC) shows. For the current year, India gold
jewelry demand is up 15% in tonnage, and 8% in US dollar
terms in the first quarter of 2015. China has also grown
rapidly, and we believe there is tremendous pent-up demand
and consumer buying power, as historically jewelry was banned
under communist rule, so it has not been handed down over the
generations, as is the case in India. In fact, Chinese gold
jewelry demand has more than doubled from about 75 tons in
Q1 2010 to over 165 tons in Q1 2015. Together, India and
China are slightly over 50% of global gold consumption, which
bodes well for Rajesh Export’s domestic retail as well as Asian
and Middle East export businesses. Finally, in our
conversations with several Indian jewelers, there is a growing
concern about fake diamonds, mainly from man-made Russian
labs. Some participants feel as many as one-third of diamonds
in India may be fake. Gold may benefit from these diamond
concerns, as the purity and veracity of the yellow metal is both
easily verifiable and authentic.
New Revenue Segment - Gold Financing The company plans to venture into the gold loan financing
business soon which should complement its gold retail business
in our view. Management is carefully assessing the market and
is expected to take a final decision soon. The company’s
existing network of retail stores will provide a ready customer
base and a good opportunity to cross-sell. The gold loan
business should have a positive impact on the company’s
revenues and profitability in our view.

13 Evaluateresearch.com
Entering New Export Market – Global Footprint Rajesh Exports is trying to enhance its global footprints and to
make effective utilization of spare capacity by way of entering
newer export markets. Currently the company trades with
Middle East, USA, Europe and is looking to increase its
presence in these markets as well as enter into newer
geographies.
Risks
Current Account Deficit: Import Controls Historically and likely going forward, gold has been a great
store of value for Indians. It has been a good inflation hedge
and currency hedge, as gold is an international commodity and
local Indian prices reflect Rupee pricing after conversion from
US dollar prices. However, India continues to run a current
account deficit [CAD], and the Indian consumer’s love affair
with gold and precious stones [such as diamonds] are a large
contributor. While India’s CAD has declined this year and is
well under control, largely on the back of lower import oil
prices, any future surge in the CAD could lead to the import
restriction on gold. While any such restrictions are likely to be
temporary and just lead to deferral of revenue, and not
permanently lost revenue, it could nonetheless impact short-
term revenue and profitability.
Expensive Acquisitions Sometimes companies with ambitious growth targets end up
making expensive acquisitions which results in shareholder
value destruction in the long term. The company acquired the
retail network of 36 stores from Oyzterbay in 2008 which did
not work out as per expectations. However, it did gain insights
into the Indian retail market and is currently doing well with
its Shubh retail chain.
Poor Execution in Retail Business Expansion The company has a presence in the Indian wholesale jewelry
distribution market for the past 30 years which gives us
confidence about management’s track record and execution
skills. However, the retail jewelry business has its own set of
dynamics which management needs to keep in mind while
expanding in this space. A failure to be on top of changes in
fashion and customers tastes and preferences can negatively
impact the company’s brand value.
Risks in Gold Loan Business The company plans to venture into the gold financing business
which entails lending money to customers using gold as

14 Evaluateresearch.com
collateral. While gold prices have steadily increased over time
and has proved to be a good inflation hedge, a material decline
in its price can result in substantial customer defaults which
might hurt the company’s profitability.
Decline in Demand for Gold Jewelry Going Forward A decline in the demand for gold jewelry can put pressure on
the company’s revenues and earnings going forward. While
gold jewelry has stood the test of time, there is undeniably a
fashion element to it which might result in substitution from
other precious stones like diamond. Additionally, an ever
increasing price of gold raises the question of affordability and
might result in people favoring imitation jewelry products
which is more popular in the western countries.
Labor Issues/Strikes While the company continues to automate its production
process, jewelry manufacturing business in India is still labor
intensive and are prone to disruptions caused due to time-off’s
and strikes. Though we are not aware of any major labor issues
at the company, it nonetheless remains a risk and might impact
the company’s ability to execute its deliverables in a timely
manner.
Loss of Key Export Clients A failure to meet timely delivery deadline or quality standards
might result in the loss of key export clients which will negative
impact profitability and share price.

15 Evaluateresearch.com
Company Description Rajesh Exports Ltd headquartered at Bangalore, is the world’s
largest gold jewelry manufacturer and the country’s largest
exporter of gold jewelry. The company’s manufacturing facility
has an installed capacity of processing 250tpa of gold jewelry.
Currently the company utilizes only 50% of the installed
capacity. REL has pioneered the concept of fusion jewelry i.e. a
combination of man and machine made jewelry. Rajesh Exports
was incorporated in the year 1985 and promoted by two
brothers, Mr Rajesh Mehta (Chairman) and Prashant Mehta
(Managing Director) with a view to start the retail business of
gold in India, but could not do so as the Gold control Act posed
challenges. Mehta initially started off with the export of gold as
the same was permitted. However, the retail vision of company
took shape in the year 2010 with wholesale supply of jewelry in
India to understand the Indian Jewelry market. The company
currently has two business lines: Exports and Retail.
Export Business Overview Rajesh Exports trades with more than 20 countries with
customers being top jewelry sellers across the globe. The
company works on a contract basis. Only when a customer
approaches Rajesh Exports to deliver specific design of jewelry
of desired quality, the company imports gold as per the
requirement. This eliminates inventory buildup risk as well as
the risk arising from fluctuation in gold prices. The company
imports dore gold (Raw Gold) from largest mining companies
worldwide rather than pure gold to save cost. Raw gold
imported is refined at Rudrapur, Uttaranchal were Rajesh
Exports has set up India’s largest and state of the art gold
refinery with a capacity of 400 tons per annum. Refined gold is
transferred to manufacturing plant set at Bangalore,
Karnataka with a capacity of 250 tons per annum for the
manufacture of jewelry. Currently, exports revenue accounts
for almost 91% of total revenue of the business. Rajesh Exports
is the largest gold jewelry exporter from India as it accounts for
almost 40% of India’s total exports. The top five customers
account for nearly 40% of its total revenues.
Retail Business After establishing itself as a leading jewelry exporter of India,
Mr. Mehta started of with wholesale supply of jewelry in India
in the year 2006 to understand the Indian Jewelry market. He
originally wanted to start with the retail gold business in India,
but was restricted from doing so due to compliance issues.
After being in the exports business for almost 20 years, he
finally got an opportunity to enter the frontend market in India.
Rajesh Exports came up with a model that placed them on the
opposite end of spectrum. Instead of building huge showrooms

16 Evaluateresearch.com
or convincing businessmen to invest in new shops under a franchise model, he approached existing small-time retailers
catering to local clientele. That’s how “Shubh was born in 2010”.
The company supplies the inventory and takes care of
advertising and insurance. Mehta believes the key selling point
of his plan is the pricing. Usually, jewellers charge more than
the quoted gold price on account of wastage, making, and other
expenses. At Shubh, the customers are charged real rate per
gram (the weight multiplied by quoted price). Currently the
company has 83 retail stores in South India and contributes 9%
to the total revenues. Management is quite confident to
increase the retail stores to 500 in coming 3-4 years and to
expand the contribution from retail stores to almost 40%.
Management Bio
Rajesh Mehta, Chairman Mr. Rajesh Mehta is the executive chairman of Rajesh Exports
Ltd. Mr. Mehta waded into the world of business in his teens
by helping out his father who was selling artificial gems to
jewelers. He had set-up the country’s first organized
manufacturing facility in 1989 at Bangalore. He is responsible
for the overall functioning of the company, in addition to being
specifically in-charge of finance and marketing functions. He
has an experience of over 30 years in the functioning and
management of the jewelry trade and has traveled extensively
within India and abroad for establishing a strong network in
the industry. In addition to his post as executive chairman of
REL, he is a member of the Export Trade Advisory Committee
of the Bangalore Jewellers Association. He is also the president
of the Karnataka Jewelry Exports Association. He was listed in
Forbes magazine as India’s 88th richest person in 2014.
Prashant Mehta, Managing Director Prashant Mehta is the Managing Director of the company. He is
in charge of the day-to-day functioning of the company and
holds specific charge of the production unit of Rajesh Exports.
He has over 30 years of experience in the jewelry business and
is recognized as an authority in the production of gold jewelry.

17 Evaluateresearch.com
Gold Industry Review
Gems & Jewelry Sector of India - Overview The Gems and jewelry sector in India plays a significant role in
the Indian economy, contributing around 6-7 per cent of the
country’s GDP. One of the fastest growing sectors, it is largely
export oriented and labor intensive and a major contributor to
employment and foreign exchange earnings. The government of
India has declared the sector as a focus area for export
promotion based on its potential for growth and value addition.
The industry provides direct employment to roughly 2.5 million
people in India [and contributes more than $30 billion to GDP]
which is comparable to the 2.1 million jobs provided by the IT
industry and is 2.5 times that provided by the basic iron and
steel manufacturing and automotive manufacturing industry.
The government has recently undertaken various measures to
promote investments and to upgrade technology and skills to
promote brand India in the international market.
Regulatory Hurdles and Initiatives in the Gold Industry The ongoing regulatory measures to curb gold imports by
imposing high import duty (10 %: current as compared to 2% in
2012) are aimed to reduce the current account deficit (CAD).
Under the 80:20 scheme, the government had, on 14-August-
2013, allowed nominated agencies to import gold on the
condition that 20 per cent of the import would be exported. This
requirement had restricted the gold imports through official
channels. As a result, there was a rise in unofficial imports
which lead to higher level of cash transactions for gold purchase
in the domestic market and a loss of tax earnings for the
government.
Talking about the issue of gold import and the current account
deficit (CAD), Manish Jain, Chairman-elect, Gems & Jewelry
Foundation, India, said, "We hope that Union Finance Minister
addresses the important issue of reduction of import duty on
gold which has given rise to creation of parallel economy
through smuggling of gold. The FY 2015 CAD / GDP ratio is
presently around 0.9 per cent and is estimated to reduce to 0.3
per cent in the next year. We expect import duty reductions on
gold soon.” (Mar-2015; Business Standard)
The Reserve Bank of India (RBI) had started liberalizing gold
norms in May-2014. With this, star and premier trading houses
(big importers and exporters) can now import the commodity,
which select banks could only do till May-2014. RBI, in
November 2014, scrapped the 80:20 rule, which required
jewelers to export 20 per cent of total gold imports. Also, banks
and nominated agencies can now offer gold for domestic use as
18 Evaluateresearch.com
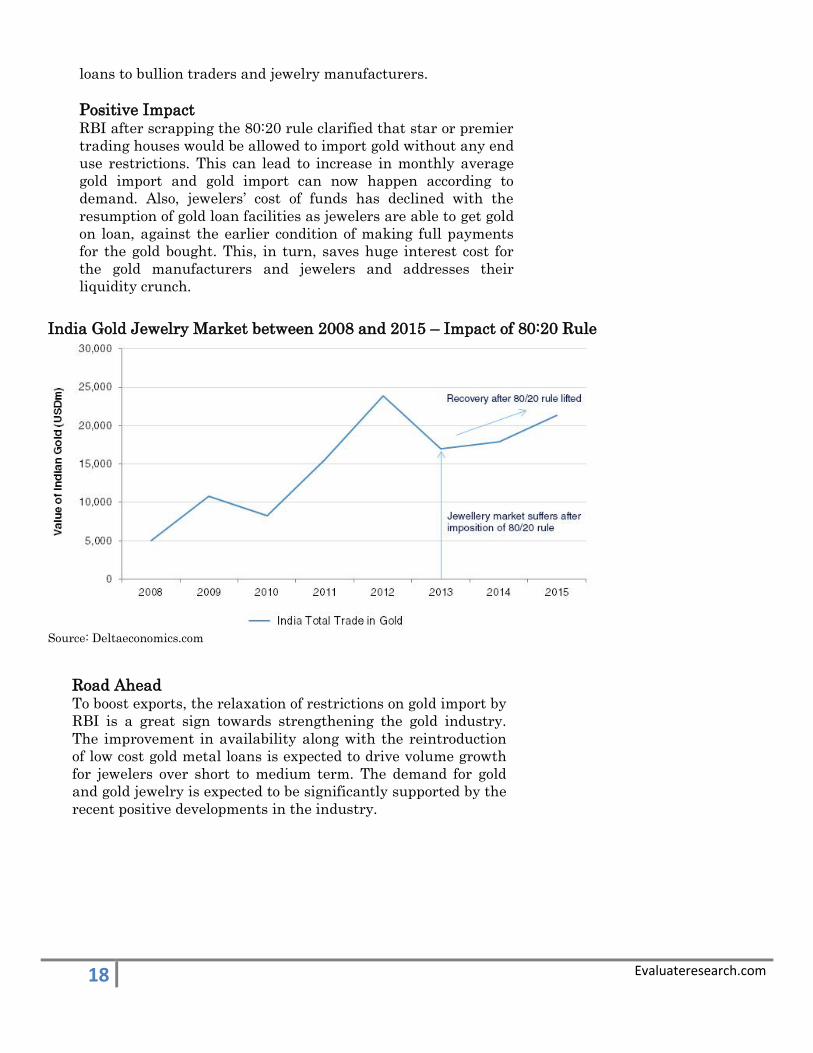
India Gold Jewelry Market between 2008 and 2015 – Impact of 80:20 Rule
Source: Deltaeconomics.com
loans to bullion traders and jewelry manufacturers.
Positive Impact RBI after scrapping the 80:20 rule clarified that star or premier
trading houses would be allowed to import gold without any end
use restrictions. This can lead to increase in monthly average
gold import and gold import can now happen according to
demand. Also, jewelers’ cost of funds has declined with the
resumption of gold loan facilities as jewelers are able to get gold
on loan, against the earlier condition of making full payments
for the gold bought. This, in turn, saves huge interest cost for
the gold manufacturers and jewelers and addresses their
liquidity crunch.
Road Ahead To boost exports, the relaxation of restrictions on gold import by
RBI is a great sign towards strengthening the gold industry.
The improvement in availability along with the reintroduction
of low cost gold metal loans is expected to drive volume growth
for jewelers over short to medium term. The demand for gold
and gold jewelry is expected to be significantly supported by the
recent positive developments in the industry.

19 Evaluateresearch.com
Global Demand Scenario for the Gold Market Tons
Q1'14 Q1'15 5-year Average
YoY Change
Consumer Demand in Selected Markets
India 167.1 191.7 233.2 ↑ 15
China 293.8 272.9 231.9 ↓ -7
Middle East 102.3 83.6 80.5 ↓ -18
United States 32.8 32.3 47.1 ↓ -2
Europe ex CIS 65.4 73.5 87.7 ↑ 12
Source: World Gold Council
Historical Global Demand for Gold
Source: World Gold Council
(1,000)
-
1,000
2,000
3,000
4,000
5,000
6,000
2005 2006 2007 2008 2009 2010 2011 2012 2013 2014
Jewellery (TPA) Bar and Coin Investment (TPA) Central Bank (TPA) Total Demand (TPA)
Historical Gold Demand

20 Evaluateresearch.com
India reclaimed its world’s top gold consumer crown from China
as demand for jewelry surged in the third quarter of 2014.
Demand responded, in varying degrees according to specific
local market conditions, to economic growth and price
movements. An increase in Indian consumer demand was more
a reflection of unusual weakness in the year-earlier period than
any particular strength in Q1 2015. The first quarter of last
year saw a combination of factors discourage jewelry purchases:
import curbs were in full force; approaching government
elections created an atmosphere of uncertainty; and temporary
restrictions were placed on free movement of cash and assets
such as gold.
Demand was muted in January and February – particularly at
the wholesale level – as there was some expectation that the
government would reduce import duties on gold. Ahead of its
February budget, the government removed the ban on gold coin
imports, but the budget itself kept import duties intact. Once
confirmation was received that the duty would remain
unchanged, gold imports doubled in March as the trade – which
had been holding off in case the duty was cut – built stocks
ahead of Akshaya Tritiya ( April 2015). The reaction in imports
was not quite replicated at the consumer level, where the
picture is more of a steadying of jewelry demand after the
volatility of the last two years. But the outlook for the sector is
healthy, particularly given upward revisions to GDP growth.
And demand during the Akshaya Tritiya festival (April – 2015)
was buoyant, with retailers reporting growth of around 10-15%
in sales over last year.
China’s jewelry demand: down 10% but longer-term uptrend
remains intact. In China, gold jewelry came under pressure
from a combination of slowing GDP growth, rallying stock
markets, and a cautious outlook for gold prices. Against this
background of factors, Chinese New Year – traditionally a
popular time for buying and gifting gold jewelry – was
relatively restrained. Slower GDP growth dampened consumer
sentiment and jewelry demand weakened accordingly. The
government’s anti-corruption drive continues to restrain
demand, although the bulk of the effects of this policy have
already been felt and should have a minimal impact on year-on-
year comparisons going forward.
Demand in Dubai was relatively resilient, with a minor decline,
compared to the wider region. Akshaya Tritiya is gaining
traction in the market as a gold-buying occasion, catering to the
expat Indian community. This emerging trend has positive
implications for future demand given the size of the Indian
population.

21 Evaluateresearch.com
Significance of Gold Jewelry Export for India
The adjoining graph shows value of gold jewelry exports from
India (bar) and equivalent quantity of gold exported in gold
jewelry form (line) from 2004-05 till 2014-15 (April till
Dec).Accordingly, between 2004-05 and 2009-10, the value of
exports climbed up, thanks to gradual increase in prices while
the tonnage of gold jewelry remained stable at around 239 tons.
However, 2010-11 saw steep erosion in the tonnage of gold
jewelry exports to 177 tons, thanks to global recession in 2009
and volatile and very high price of gold. In the Indian context,
higher export realization of gold jewelry reduces the net outflow
of US dollars needed to import gold. Therefore, it is important
to improve gold jewelry exports all the time.
Gold jewelry export contributes about 27% to India’s total gems
and jewelry exports (excluding export of rough diamonds).
Thus, export of gold jewelry is one of the important segments of
the gems and jewelry value chain. When India depends entirely
on import of gold to meet the demand of the jewelry industry,
for domestic consumption or exports, higher gold jewelry
exports always is a boon for India. So, it is always good for
India’s gold jewelry industry if export growth continues in both
value and volume terms.
In the perspective of the company reviewed, on 10th July –
2015 , Rajesh Exports informed the exchanges that it had
bagged export orders worth Rs 1,448 crore for designer range of
gold and diamond studded jewelry from UAE. Chairman Rajesh
Mehta said these types of orders have higher margins and will
increase the overall profitability of the company.

22 Evaluateresearch.com
Operating History of the Company
Year Details
1960-84 Mr. Rajesh Mehta and brothers assisted their father in supply of raw materials and ancillary support to local
jewelers.
1985 First showroom in Bangalore with variety of designs and unmatched services
1986 Established second showroom in Bangalore.
1990 Rajesh Exports established the first organized gold jewelry manufacturing facility in India.
1991 Rajesh Exports established India’s first R&D facility in the jewelry sector.
1994 Rajesh Exports emerged as the largest exporter of jewelry from India.
1995 Initial Public Offer (IPO) of securities to fund expansion of manufacturing facility.
1995 IPO overwhelmingly subscribed and REL securities listed and traded on the BSE and NSE.
1996 REL successfully implemented the expansion plan.
1999 REL plans to set up World’s Largest manufacturing facility.
2001 Expanded the manufacturing facility further to 2.5 tpa, 10 tpa, 250 tpa in 1994,1998 and 2001 respectively to
serve the vision for the next 20 years.
2002 REL completes construction of World’s Largest manufacturing facility.
2003 REL begins commercial production in the manufacturing facility.
2006 REL started wholesale supply of jewelry in India to understand Indian jewelry market.
2006 REL achieves sales of USD 1.5 billion.
2008 REL establishes branded retail chain stores under the name of ‘Shubh Jewellers’.
2008 Acquired Oyzterbay, a Retail Gold jewelry chain selling jewelry across the country in 35 locations.
2009 Company has prolific database with regards to minutest Indian gold jewelry data in terms of Designs –
Seasonality - Taste across different regions.
2011 Introduced Retail Gold Revolution in India through Shubh Jewellers retail stores.
2013 REL launched 80 Shubh Showrooms in the state of Karnataka.
Peer Comparison
Company Tkr & Exch Mkt Cap ($ mn)
P/E P/B Net Profit Margin Operating Profit Margin ROE EV / EBITDA
Rajesh Exports Ltd. RJEX IN 2300 21.4 4.1 1.3% 2.4% 21.3% 5.3
Pandora A/S PNDORA DC 14000 34.9 14.1 10.8% 34.9% 44.1% 15.5
Titan Co Ltd. TTAN IN 4800 37.2 9.8 6.9% 8.9% 29.1% 30.1
PC Jeweller Ltd. PCJL IN 1200 20.7 3.9 6.0% 11.0% 20.6% 8.4
Shenyang Cuihua Gold and Jewelry Co Ltd. 002731 CH 770 38.7 4.6 3.0% 5.4% 12.7% 23.4
Tribhovandas Bhimji Zaveri Ltd. TBZL IN 167 43.6 2.3 1.3% 3.4% 5.3% 20.7
Shrenuj & Co Ltd SJC IN 109 9.5 - 1.3% 4.1% 7.4% 16.7
Gitanjali Gems Ltd GITG IN 72 4.7 - 0.8% 6.2% 0.9% 11.0
Thanga Mayil Jewelry Ltd TJL IN 39 - 1.9 -1.6% 0.3% -15.8% 97.8
Alankit Ltd ALAN IN 25 - 15.4 9.3% 11.8% 2.0% -
Average
120.3 29.4 7.0 3.9% 5.4% 12.8% 10.1
According to Mr. Mehta, 95 per cent of the company's revenue
comes from jewelry exports and only 5 per cent of the total
revenue comes from jewelry retailing. So a slowdown in retail
jewelry sales has not affected the overall revenue of the
company. Also, here it is significant to note that Rajesh Exports
contributes 40% of the total gold jewelry export from India.

23 Evaluateresearch.com
Source: Company Reports
Source: Company Reports

24 Evaluateresearch.com
Source: Company Reports
53.04%
15.56%
1.72% 7.41%
1.20%
Shareholding Pattern
Promoters
Foreign Institutional Investors
Private Corporate Bodies /
Public
Mutual Funds / Financial
Institution
NRI's/OCB's

25 Evaluateresearch.com
Chief Strategist and Promoter Mr. Siddharth Mehta along with Evaluate’s Analyst Prajwal Gote
Jewelry Retail outlet in Bangalore, India

26 Evaluateresearch.com
5-Year Price Chart

27 Evaluateresearch.com
Income Statement (INR million) FY 03/2011 FY 03/2012 FY 03/2013 FY 03/2014 FY 03/2015 FY 03/2016E FY 03/2017E FY 03/2018E FY 03/2019E FY 03/2020E CAGR (2016-20) Revenue 200,452 250,621 304,251 285,141 504,628 541,970 586,954 643,302 691,549 740,649 8% y/y
25.0% 21.4% -6.3% 77.0% 7.4% 8.3% 9.6% 7.5% 7.1%
Cost of Revenue -203,254 -246,823 -308,150 -280,732 -495,804 -532,215 -576,389 -631,079 -678,410 -725,836 Gross Profit -2,802.6 3,798.0 -3,898.6 4,409.0 8,824.0 9,755.5 10,565.2 12,222.7 13,139.4 14,813.0 Gross margin (%) -1.4% 1.5% -1.3% 1.5% 1.7% 1.8% 1.8% 1.9% 1.9% 2.0% Other Operating Revenue 4886.0 5917.6 7718.7 6644.6 6644.6 7045.6 7630.4 8362.9 8990.1 9628.4 as a % of sales 2.4% 2.4% 2.5% 2.3% 1.3% 1.3% 1.3% 1.3% 1.3% 1.3% Selling, General & Admin Expense -314.6 -424.3 -272.2 -2,436.1 -2,805.0 -3,251.8 -3,521.7 -3,859.8 -4,149.3 -4,443.9 as a % of sales 0.2% 0.2% 0.1% 0.9% 0.6% 0.6% 0.6% 0.6% 0.6% 0.6% Other Operating expenses 1,695.5 -3,243.8 4,026.6 -1,131.1 -622.2 -542.0 -587.0 -643.3 -691.5 -740.6 as a % of sales -0.8% 1.3% -1.3% 0.4% 0.1% 0.1% 0.1% 0.1% 0.1% 0.1% Operating Income 3,464.2 6,047.4 7,574.5 7,486.4 12,041.4 13,007.3 14,086.9 16,082.5 17,288.7 19,256.9 10%
y/y
74.6% 25.3% -1.2% 60.8% 8.0% 8.3% 14.2% 7.5% 11.4% Operating margin (%) 1.7% 2.4% 2.5% 2.6% 2.4% 2.4% 2.4% 2.5% 2.5% 2.6% Interest Expense -1,666.8 -3,693.5 -2,995.1 -3,634.7 -4,782.7 -4,780.9 -4,780.9 -4,780.9 -4,780.9 -4,780.9 Interest income 684.6 1,948.7 289.8 186.8 0.0 0.0 0.0 0.0 0.0 0.0 Equity in (losses)income of affiliates 0.0 0.0 0.0 5.3 0.0 0.0 0.0 0.0 0.0 0.0 Other recurring (expenses)/income 25.1 15.9 26.8 -6.3 1.1 0.0 0.0 0.0 0.0 0.0 Amortization of intangibles 0.0 0.0 0.0 0.0 0.0
Goodwill impairment 0.0 0.0 0.0 0.0 0.0 Other non recurring (expenses) income 181.2 0.0 0.0 0.1
Pretax Income (reported) 2,688.3 4,318.5 4,896.0 4,037.6 7,259.7 8,226.4 9,306.0 11,301.7 12,507.9 14,476.0 15% y/y
60.6% 13.4% -17.5% 79.8% 13.3% 13.1% 21.4% 10.7% 15.7%
Pretax Income (adjusted) 2507.1 4318.5 4896.0 4037.5 7259.7 8226.4 9306.0 11301.7 12507.9 14476.0 15% y/y
72.2% 13.4% -17.5% 79.8% 13.3% 13.1% 21.4% 10.7% 15.7%
- Income Tax Expense -208.1 -194.5 -370.1 -462.8 -711.3 -822.6 -930.6 -1130.2 -1250.8 -1447.6 effective tax rate (%) 7.7% 4.5% 7.6% 11.5% 9.8% 10.0% 10.0% 10.0% 10.0% 10.0% - Minority Interests 0 0 0 0 0 0 0 0 0 0 Income Before XO Items 2480.2 4124.0 4525.9 3574.8 6548.4 7403.8 8375.4 10171.5 11257.1 13028.4 15%
y/y
66.3% 9.7% -21.0% 83.2% 13.1% 13.1% 21.4% 10.7% 15.7% - Extraordinary Loss Net of Tax 0.0 0.0 0.0 0.0 0.0 0.0 0.0 0.0 0.0 0.0 Net Income (reported) 2480.2 4124.0 4525.9 3574.8 6548.4 7403.8 8375.4 10171.5 11257.1 13028.4 15%
y/y
66.3% 9.7% -21.0% 83.2% 13.1% 13.1% 21.4% 10.7% 15.7% Exceptional (L)G 0.00 0.00 0.00 0.00
Net Income (adjusted) 2,299.1 4,124.0 4,525.9 3,574.7 6,548.4 7,403.8 8,375.4 10,171.5 11,257.1 13,028.4 15% y/y
79.4% 9.7% -21.0% 83.2% 13.1% 13.1% 21.4% 10.7% 15.7%
Basic EPS (reported) 8.4 14.0 15.3 12.1 22.2 25.1 28.4 34.5 38.1 44.1 Basic EPS (adjusted) 7.8 14.0 15.3 12.1 22.2 25.1 28.4 34.5 38.1 44.1
Basic Weighted Avg Shares 295.25 295.25 295.25 295.25 295.25 295.25 295.25 295.25 295.25 295.25
Diluted EPS (reported) 8.40 13.97 15.33 12.11 22.18 25.08 28.37 34.45 38.13 44.13 15% y/y
66.3% 9.7% -21.0% 83.2% 13.1% 13.1% 21.4% 10.7% 15.7%
Diluted EPS (adjusted) 7.79 13.97 15.33 12.11 22.18 25.08 28.37 34.45 38.13 44.13 15% y/y
79.4% 9.7% -21.0% 83.2% 13.1% 13.1% 21.4% 10.7% 15.7%
Diluted Weighted Avg Shares 295.25 295.25 295.25 295.25 295.25 295.25 295.25 295.25 295.25 295.25

28 Evaluateresearch.com
Reference Items FY 03/2011 FY 03/2012 FY 03/2013 FY 03/2014 FY 03/2015 FY 03/2016E FY 03/2017E FY 03/2018E FY 03/2019E FY 03/2020E EBITDA 3483.8 6068.1 7595.1 7650.5 12663.4 13549.3 14673.9 16725.8 17980.3 19997.5 Dividends per Share 0.60 0.60 1.00 1.00 1.00 1.00 1.00 1.00 1.00 1.00 Dividend payout ratio 7.7% 4.3% 6.5% 8.3% 4.5% 4.0% 3.5% 2.9% 2.6% 2.3% Dep & Amor. 19.6 20.7 20.6 164.1 622.0 542.0 587.0 643.3 691.5 740.6 as a % of sales 0.0% 0.0% 0.0% 0.1% 0.1% 0.1% 0.1% 0.1% 0.1% 0.1%
Balance Sheet (INR million) FY 03/2011 FY 03/2012 FY 03/2013 FY 03/2014 FY 03/2015 FY 03/2016E FY 03/2017E FY 03/2018E FY 03/2019E FY 03/2020E Assets
+ Cash & Near Cash Items 78,150.0 78,548.3 98,457.6 72,141.6 109,317.7 115,948.8 124,135.6 134,441.5 144,323.2 155,170.6 + Short-Term Investments 0.0 0.0 0.0 0.0 12,554.7 12,554.7 12,554.7 12,554.7 12,554.7 12,554.7 + Accounts & Notes Receivable 15,887.7 26,017.9 23,291.1 24,151.9 21,948.8 20,787.9 27,337.6 29,962.0 32,209.1 34,496.0 + Inventories 3,773.4 6,344.0 7,753.0 5,713.0 6,752.1 7,290.6 7,895.7 8,644.9 9,293.3 9,943.0 + Other Current Assets 6,862.6 8,058.4 8,160.8 8,128.9 7,008.9 7,008.9 7,008.9 7,008.9 7,008.9 7,008.9 Total Current Assets 104,673.6 118,968.6 137,662.5 110,135.4 157,582.2 163,590.9 178,932.6 192,612.0 205,389.3 219,173.2 + Long-Term Investments 373.6 373.8 373.8 503.3 369.0 369.0 369.0 369.0 369.0 369.0 + Gross Fixed Assets 524.0 541.7 548.8 1,673.4 2,248.4 3,332.3 3,919.3 4,562.6 5,254.1 5,994.8 - Accumulated Depreciation -149.6 -170.0 -190.7 -354.2 -976.4 -1,518.4 -2,105.3 -2,748.6 -3,440.2 -4,180.8 + Net Fixed Assets 374.4 371.7 358.2 1,319.3 1,272.0 1,814.0 1,814.0 1,814.0 1,814.0 1,814.0 + Other Long-Term Assets 14.3 14.2 6.8 423.3 298.1 298.1 298.1 298.1 298.1 298.1 + Goodwill & other Intangible Assets 0.0 0.0 0.0 0.0 0.0 0.0 0.0 0.0 0.0 0.0 Total Long-Term Assets 762.3 759.6 738.8 2,245.8 1,939.1 2,481.0 2,481.0 2,481.0 2,481.0 2,481.0 Total Assets 105,435.9 119,728.3 138,401.2 112,381.2 159,521.2 166,072.0 181,413.6 195,093.0 207,870.3 221,654.2
Liabilities & Shareholders' Equity + Accounts Payable 59,061.7 62,522.5 80,499.1 52,155.1 88,045.2 87,487.4 94,748.9 98,552.0 100,367.5 101,418.2
+ Short-Term Borrowings 25,342.1 32,566.7 27,286.1 31,176.1 36,775.9 36,775.9 36,775.9 36,775.9 36,775.9 36,775.9 + Other Short-Term Liabilities 5,008.3 4,661.8 6,383.8 1,539.5 501.3 501.3 501.3 501.3 501.3 501.3 Total Current Liabilities 89,412.1 99,751.0 114,168.9 84,870.6 125,322.4 124,764.6 132,026.1 135,829.3 137,644.7 138,695.5 + Long-Term Borrowings 0.0 0.0 0.0 0.0 0.0 0.0 0.0 0.0 0.0 0.0 + Other Long-Term Liabilities 56.1 91.2 86.7 85.7 0.0 0.0 0.0 0.0 0.0 0.0 Total Liabilities 89,468.2 99,842.1 114,255.6 84,956.3 125,322.4 124,764.6 132,026.1 135,829.3 137,644.7 138,695.5 + Total Preferred Equity 0.0 0.0 0.0 0.0 0.0 0.0 0.0 0.0 0.0 0.0 + Share Capital & APIC 295.3 295.3 295.3 295.3 295.3 295.3 295.3 295.3 295.3 295.3 + Retained Earnings & Other Equity 15,672.5 19,590.9 23,850.4 27,129.7 33,903.6 41,012.1 49,092.3 58,968.5 69,930.3 82,663.5 Total Shareholders' Equity 15,967.7 19,886.1 24,145.7 27,424.9 34,198.8 41,307.3 49,387.5 59,263.8 70,225.6 82,958.7 + Minority Interest 0.0 0.0 0.0 0.0 0.0 0.0 0.0 0.0 0.0 0.0 Total Liabilities & Equity 105,435.9 119,728.3 138,401.2 112,381.2 159,521.2 166,072.0 181,413.6 195,093.1 207,870.3 221,654.2

29 Evaluateresearch.com
Cash Flow (INR million) FY 03/2011 FY 03/2012 FY 03/2013 FY 03/2014 FY 03/2015E FY 03/2016E FY 03/2017E FY 03/2018E FY 03/2019E FY 03/2020E + Net Income 2,688.0 4,318.8 4,896.2 4,037.3 6,548.4 7,403.8 8,375.4 10,171.5 11,257.1 13,028.4 + Depreciation & Amortization 19.6 20.7 20.6 164.1 622.0 542.0 587.0 643.3 691.5 740.6 + Other Non-Cash Adjustments 1,661.3 3,691.4 2,141.4 3,011.5 0.0 0.0 0.0 0.0 0.0 0.0 + Changes in Working Capital 2,437.2 -10,941.7 21,427.6 -32,235.9 37,136.0 64.6 106.7 429.6 -1,080.1 -1,885.8 Cash From Operating Activities 6,806.0 -2,910.8 28,485.7 -25,022.9 44,306.4 8,010.3 9,069.0 11,244.4 10,868.5 11,883.3 + Disposal of Fixed Assets 0.0 0.2 0.0 0.2
+ Capital Expenditures -26.7 -18.4 -7.1 -1,154.8 -1,009.3 -1,083.9 -587.0 -643.3 -691.5 -740.6 + Increase in Investments 0.0 0.0 0.0 -100.0 259.5 0.0 0.0 0.0 0.0 0.0 + Decrease in Investments 15.0 0.0 0.0 0.0
+ Other Investing Activities 0.6 2.2 1.6 1.0 0.0 0.0 0.0 0.0 0.0 0.0 Cash From Investing Activities -11.1 -16.0 -5.5 -1,253.6 -749.7 -1,083.9 -587.0 -643.3 -691.5 -740.6 + Dividends Paid -226.5 -205.9 -295.3 -295.3 -295.3 -295.3 -295.3 -295.3 -295.3 -295.3 + Change in Short-Term Borrowings 4,441.0 7,224.6 -5,280.4 3,890.0 5,599.8 0.0 0.0 0.0 0.0 0.0 + Increase in Long-Term Borrowing 0.0 0.0 0.0 0.0 0.0 0.0 0.0 0.0 0.0 0.0 + Decrease in Long-term Borrowing 0.0 0.0 0.0 0.0
+ Increase in Capital Stocks 2,272.3 0.0 0.0 0.0 + Decrease in Capital Stocks 0.0 0.0 0.0 0.0 + Other Financing Activities -1,666.9 -3,693.5 -2,995.1 -3,634.8 Cash from Financing Activities 4,819.9 3,325.2 -8,570.8 -40.0 5,304.6 -295.3 -295.3 -295.3 -295.3 -295.3
Net Changes in Cash 11,614.8 398.3 19,909.4 -26,316.5 48,861.2 6,631.1 8,186.8 10,305.9 9,881.7 10,847.4
Ratio Analysis FY 03/2011 FY 03/2012 FY 03/2013 FY 03/2014 FY 03/2015 FY 03/2016E FY 03/2017E FY 03/2018E FY 03/2019E FY 03/2020E
Growth Ratios % Revenue
25.0% 21.4% -6.3% 77.0% 7.4% 8.3% 9.6% 7.5% 7.1% EBITDA
74.2% 25.2% 0.7% 65.5% 7.0% 8.3% 14.0% 7.5% 11.2%
Operating Income
74.6% 25.3% -1.2% 60.8% 8.0% 8.3% 14.2% 7.5% 11.4% Net income reported
66.3% 9.7% -21.0% 83.2% 13.1% 13.1% 21.4% 10.7% 15.7%
Net income adjusted
79.4% 9.7% -21.0% 83.2% 13.1% 13.1% 21.4% 10.7% 15.7% Diluted EPS reported
66.3% 9.7% -21.0% 83.2% 13.1% 13.1% 21.4% 10.7% 15.7%
Diluted EPS adjusted
79% 10% -21% 83% 13% 13% 21% 11% 16% Dividend per share
0.00% 66.67% 0.00% 0.00% 0.00% 0.00% 0.00% 0.00% 0.00%
Accounts Receivables
63.8% -10.5% 3.7% -9.1% -5.3% 31.5% 9.6% 7.5% 7.1% Inventory
68.1% 22.2% -26.3% 18.2% 8.0% 8.3% 9.5% 7.5% 7.0%
Fixed Assets
-0.3% -2.7% 204.0% -13.7% 28.0% 0.0% 0.0% 0.0% 0.0% Total Assets
13.6% 15.6% -18.8% 41.9% 4.1% 9.2% 7.5% 6.5% 6.6%
Working Capital
-28.7% 78.1% -67.1% 236.5% 0.1% 0.2% 0.8% -2.0% -3.6% Accounts Payable
5.9% 28.8% -35.2% 68.8% -0.6% 8.3% 4.0% 1.8% 1.0%
Short Term Debt
28.5% -16.2% 14.3% 18.0% 0.0% 0.0% 0.0% 0.0% 0.0% Long Term Debt
Total Equity
24.5% 21.4% 13.6% 24.7% 20.8% 19.6% 20.0% 18.5% 18.1%
Cash From Operations
-142.8% -1078.6% -187.8% -277.1% -81.9% 13.2% 24.0% -3.3% 9.3% Capital Expenditure
31.1% 61.4% -16142.5% 12.6% -7.4% 45.9% -9.6% -7.5% -7.1%
Free Cash Flow
-143.2% -1072.2% -191.9% -265.4% -84.0% 22.5% 25.0% -4.0% 9.5%

30 Evaluateresearch.com
Per Share Data (INR) FY 03/2011 FY 03/2012 FY 03/2013 FY 03/2014 FY 03/2015 FY 03/2016E FY 03/2017E FY 03/2018E FY 03/2019E FY 03/2020E Basic EPS (adjusted) 7.8 14.0 15.3 12.1 22.2 25.1 28.4 34.5 38.1 44.1 Diluted EPS (adjusted) 7.8 14.0 15.3 12.1 22.2 25.1 28.4 34.5 38.1 44.1 Dividend per share (DPS) 0.6 0.6 1.0 1.0 1.0 1.0 1.0 1.0 1.0 1.0 Book Value per share (BVPS) 54.1 67.4 81.8 92.9 115.8 139.9 167.3 200.7 237.9 281.0
Margins (%) Gross Margin -1.4% 1.5% -1.3% 1.5% 1.7% 1.8% 1.8% 1.9% 1.9% 2.0%
Operating Margin 1.7% 2.4% 2.5% 2.6% 2.4% 2.4% 2.4% 2.5% 2.5% 2.6% EBITDA Margin 1.7% 2.4% 2.5% 2.7% 2.5% 2.5% 2.5% 2.6% 2.6% 2.7% Pre-Tax Margin (adjusted) 1.3% 1.7% 1.6% 1.4% 1.4% 1.5% 1.6% 1.8% 1.8% 2.0% Net Income Margin (adjusted) 1.1% 1.6% 1.5% 1.3% 1.3% 1.4% 1.4% 1.6% 1.6% 1.8%
Return Ratios Dupont ROE (%) 14.4% 20.7% 18.7% 13.0% 19.1% 17.9% 17.0% 17.2% 16.0% 15.7%
Margin (%) 1.1% 1.6% 1.5% 1.3% 1.3% 1.4% 1.4% 1.6% 1.6% 1.8% Turnover (x) 1.9 2.1 2.2 2.5 3.2 3.3 3.2 3.3 3.3 3.3 Leverage (x) 6.6 6.0 5.7 4.1 4.7 4.0 3.7 3.3 3.0 2.7
Return on Assets 2.2% 3.4% 3.3% 3.2% 4.1% 4.5% 4.6% 5.2% 5.4% 5.9% Return on Capital Employed 21.6% 30.3% 31.3% 27.2% 35.2% 31.5% 28.5% 27.1% 24.6% 23.2% Return on Invested Capital 5.6% 7.9% 8.8% 6.1% 9.2% 9.5% 9.7% 10.6% 10.5% 10.9%
FCF Calculation Op. cash 6,806.0 -2,910.8 28,485.7 -25,022.9 44,306.4 8,010.3 9,069.0 11,244.4 10,868.5 11,883.3
capex -26.7 -18.4 -7.1 -1,154.8 -1,009.3 -1,083.9 -587.0 -643.3 -691.5 -740.6 FCF (INR million) 6,779.3 -2,929.3 28,478.6 -26,177.8 43,297.1 6,926.4 8,482.1 10,601.1 10,177.0 11,142.6 FCF margin (%) 3.4% -1.2% 9.4% -9.2% 8.6% 1.3% 1.4% 1.6% 1.5% 1.5% FCF per share 22.96 -9.92 96.46 -88.66 146.65 23.46 28.73 35.91 34.47 37.74 Price/FCF per share 22.78 -52.71 5.42 -5.90 3.57 22.29 18.20 14.57 15.17 13.86 FCF Yield 4.4% -1.9% 18.4% -17.0% 28.0% 4.5% 5.5% 6.9% 6.6% 7.2%
Net Cash calculation Cash + short term investments 78,150.0 78,548.3 98,457.6 72,141.6 121,872.4 128,503.5 136,690.3 146,996.2 156,877.9 167,725.3
Less: long term debt + ST debt -25,342.1 -32,566.7 -27,286.1 -31,176.1 -36,775.9 -36,775.9 -36,775.9 -36,775.9 -36,775.9 -36,775.9 Net Cash 52,807.9 45,981.7 71,171.5 40,965.5 85,096.5 91,727.6 99,914.4 110,220.3 120,102.0 130,949.4
Net cash per share 178.9 155.7 241.1 138.7 288.2 310.7 338.4 373.3 406.8 443.5
Valuation ratio's
P/B 1.96 1.91 1.47 0.94 1.69 3.74 3.13 2.61 2.20 1.86 P/E 13.60 9.21 7.84 7.24 8.82 20.86 18.44 15.18 13.72 11.85 P/S 0.16 0.15 0.12 0.09 0.11 0.28 0.26 0.24 0.22 0.21 EV/sales -0.11 -0.03 -0.12 -0.05 -0.05 0.13 0.12 0.11 0.10 0.09 EV/EBITDA -6.18 -1.32 -4.70 -1.97 -2.16 5.12 4.72 4.14 3.86 3.47 EV/EBIT -6.22 -1.32 -4.71 -2.01 -2.27 5.33 4.92 4.31 4.01 3.60 EV/FCF -3.18 2.73 -1.25 0.58 -0.63 10.01 8.17 6.54 6.81 6.22 Dividend Yield (%) 0.11% 0.11% 0.19% 0.19% 0.19% 0.19% 0.19% 0.19% 0.19% 0.19% Div payout on FCF 2.6% -6.0% 1.0% -1.1% 0.7% 4.3% 3.5% 2.8% 2.9% 2.6%

31 Evaluateresearch.com
Working Capital Ratios FY 03/2011 FY 03/2012 FY 03/2013 FY 03/2014 FY 03/2015 FY 03/2016E FY 03/2017E FY 03/2018E FY 03/2019E FY 03/2020E Receivable days (DSO) 14 31 30 30 17 14 17 17 17 17 Inventory days (DIO) 3 7 8 9 5 5 5 5 5 5 Payables days (DPO) 53 90 85 86 52 60 60 57 54 51 Current ratio 1.2 1.2 1.2 1.3 1.3 1.3 1.4 1.4 1.5 1.6 Quick ratio 1.1 1.1 1.1 1.2 1.2 1.3 1.3 1.4 1.4 1.5 Working capital -37546 -26764 -47678 -15701 -52837 -52901 -53008 -53438 -52357 -50472 Cash conversion cycle -35 -52 -47 -47 -30 -41 -38 -35 -32 -29
Leverage Ratios Debt / equity 159% 164% 113% 114% 108% 89% 74% 62% 52% 44%
Net cash (debt) / equity 331% 231% 295% 149% 249% 222% 202% 186% 171% 158% Net cash (debt) / mkt cap 169% 121% 201% 158% 147% 59% 65% 71% 78% 85% Net cash (debt) / capital 128% 88% 138% 70% 120% 117% 116% 115% 112% 109%
Coverage Ratios Interest coverage [EBIT] 3.5 3.5 2.8 2.2 2.5 2.7 2.9 3.4 3.6 4.0
Interest coverage [Opt. CF] 6.9 -1.7 10.5 -7.3 9.3 1.7 1.9 2.4 2.3 2.5
Earnings Quality Ratios Net operating assets/liab [NOA] -36840 -26096 -47026 -13541 -50898 -50420 -50527 -50957 -49876 -47991
Average NOA
-31468 -36561 -30283 -32219 -50659 -50474 -50742 -50416 -48934 B/S accrual ratio
-0.34 0.57 -1.11 1.16 -0.01 0.00 0.01 -0.02 -0.04
CF accurual ratio
-0.22 0.66 -0.99 1.15 -0.01 0.00 0.01 -0.02 -0.04
Enterprise Value Calculation FY 03/2011 FY 03/2012 FY 03/2013 FY 03/2014 FY 03/2015 Current Market Cap. 31,261 37,981 35,471 25,893 57,766 154,416 + Minority Interest 0 0 0 0 0 0 +Total Debt (ST & LT Debt) 25,342 32,567 27,286 31,176 36,776 36,776 - Cash & Equivalents 78,150 78,548 98,458 72,142 121,872 121,872 Enterprise Value -21,547 -8,001 -35,700 -15,072 -27,331 69,319

32 Evaluateresearch.com
DCF model 2011 2012 2013 2014 2015 2016E 2017E 2018E 2019E 2020E 2021E 2022E 2023E 2024E 2025E
(in INR million)
EBIT 3,464 6,047 7,575 7,486 12,041 13,007 14,087 16,083 17,289 19,257 19,812 21,199 22,683 24,044 25,487
% growth 0% 75% 25% -1% 61% 8% 8% 14% 8% 11% 3% 7% 7% 6% 6%
Taxes @ 7.7% 4.5% 7.6% 11.5% 9.8% 10.0% 10.0% 10.0% 10.0% 10.0% 10.0% 10.0% 10.0% 10.0% 10.0%
EBIAT 3,196 5,775 7,002 6,628 10,862 11,707 12,678 14,474 15,560 17,331 17,831 19,079 20,415 21,640 22,938
% growth 0% 81% 21% -5% 64% 8% 8% 14% 8% 11% 3% 7% 7% 6% 6%
+ D&A 20 21 21 164 622 542 587 643 692 741 792 848 907 962 1,019
- Capital expenditures -27 -18 -7 -1,155 -1,009 -1,084 -587 -643 -692 -741 -3,170 -3,392 -3,629 -3,847 -4,078
- Change in net WC 2,437 -10,942 21,428 -32,236 37,136 65 107 430 -1,080 -1,886 248 158 -68 -798 -1,077
Free Cash Flow to Firm 5,626 -5,164 28,443 -26,598 47,610 11,229 12,785 14,904 14,480 15,445 15,702 16,694 17,625 17,956 18,803
FCY y/y growth -192% -651% -194% -279% -76% 14% 17% -3% 7% 2% 6% 6% 2% 5%
Value per Share
Cost of capital WACC 12.5%
Terminal Growth 10.5% 11.5% 12.5% 13.5% 14.5% PV of Free Cash Flow 82,106
2.0% 874 809 757 714 678 PV of Terminal Value 59,349
2.3% 885 817 763 718 681 Add: Net Cash 85,096
2.5% 893 823 767 722 684 Total Equity Value 226,552
2.8% 906 832 774 727 688 Shares outstanding 295.25
3.0% 915 839 779 731 691 DCF value 767

33 Evaluateresearch.com
Disclaimer Evaluate Research provides institutional equity research on global public
mid-cap companies. All information used in the publication of this report has
been compiled from publicly available sources that are believed to be reliable;
and we do not seek insider information for writing this report. Opinions,
estimates and projections in this report constitute the current judgment of the
analyst(s) as on the date of this report. It is not guaranteed as to accuracy,
nor is it a complete statement, of the financial products, securities, or markets
referred to. Opinions are subject to change without notice. To the extent
permitted by law, Evaluate does not accept any liability arising from the use
of information in this report.
This document is provided for information purposes only, and is not a
solicitation or inducement to buy, sell, subscribe, or underwrite securities or
units. Evaluate does not make individually tailored investment
recommendations. Any valuation given in a research note is the theoretical
result of a study of a range of possible outcomes, and not a forecast of a likely
share price. The securities, issuances or investment strategies discussed in
this report may not be suitable for all investors. Investments involve many
risk and potential loss of capital. Past performance is not necessarily
indicative of future results. Evaluate may publish further update notes on
these securities/companies but has no scheduled commitment and may cease
to follow these securities/companies as may be decided by the research
management.
The companies or funds covered in this research may pay us a fee in order for
this research to be made available. Any fees are paid upfront without
recourse. Evaluate and its analysts are free to issue any opinion on the
security or issuance. Evaluate seeks to comply with the CFA Institute
Standards as well as NIRI Guidelines (National Investor Relations Institute,
USA) for all conduct, research and dissemination of research, particularly
governing independence in issuer commissioned research.
Forward-looking information or statements in this report contain information
that is based on assumptions, forecasts and estimates of future results, and
therefore involve known and unknown risks or uncertainties which may cause
the actual results, performance or achievements of their subject matter to be
materially different from the current expectations.
Evaluate makes an effort to use reliable, comprehensive information, but
makes no representation that this information is accurate or complete.
Evaluate is under no obligation to update or keep current the information
contained herein. The compensation of the analyst who prepares any Evaluate
research report is determined exclusively by Evaluate’s research and senior
management.
Evaluate Research Ltd. does not conduct any investment banking, stock
brokerage or money management business and accordingly does not itself hold
any positions in the securities mentioned in this report. However, Evaluate’s
directors, affiliates, and employees may have a position in any or related
securities mentioned in this report at an appropriate time period after the
report has already been disseminated, and in compliance with all CFA
Institute Standards.
No part of this report may be reproduced or published without the prior
written consent from Evaluate Research Ltd. Please cite the source when
quoting.
Copyright 2015 Evaluate Research Limited. All rights reserved.
Evaluate Research Ltd.
30/F Singapore Land Tower
50 Raffles Place
SINGAPORE
Sai Capital Bldg – Suite 402
Opp. JW Marriott Hotel
SB RD, Pune 411 016
INDIA
Analyst:
Prajwal Gote
Client Servicing:
Pooja Burgul
I, Prajwal Gote, certify that the opinions expressed in this report accurately reflect my personal views about the subject and its underlying securities. I further certify that the performance of stocks or securities in this report is not directly tied to my compensation, though my compensation is based on firm profitability, including the investment research and management performance of Evaluate Research Ltd.


![Rajesh Exports Board approves acquisition in the Middle East [Company Update]](https://static.fdocuments.net/doc/165x107/577c79a11a28abe054936dc6/rajesh-exports-board-approves-acquisition-in-the-middle-east-company-update.jpg)