Raising the Bar: A Competitive Realities Report and Target ... · Raising the Bar: A Competitive...
135
715 Birkdale Drive | Atlanta, GA 30215 | p 770.716.9544 | f 770.719.8911 | www.garnereconomics.com Raising the Bar: A Competitive Realities Report and Target Industry Strategy for Missoula, Montana June 1, 2018 Prepared for the:
Transcript of Raising the Bar: A Competitive Realities Report and Target ... · Raising the Bar: A Competitive...

Raising the Bar: A Competitive Realities Report and Target Industry Strategy for Missoula, Montana | Page 1
715 Birkdale Drive | Atlanta, GA 30215 | p 770.716.9544 | f 770.719.8911 | www.garnereconomics .com
Raising the Bar: A Competitive Realities Report and Target Industry Strategy for Missoula, Montana
June 1, 2018
Prepared for the:

Raising the Bar: A Competitive Realities Report and Target Industry Strategy for Missoula, Montana | Page 2
TABLE OF CONTENTS
Introduction and Executive Summary ....................................................... 3
Chapter 1: Stakeholder Input ..................................................................... 6
Chapter 2: MEP/Missoula Report Card .................................................... 10
Chapter 3: Assets & Challenges Assessment ........................................... 13
Chapter 4: Dashboard Indicators Summary ............................................. 17
Chapter 5: Demographic & Community Trends ....................................... 25
Population Trends ................................................................................ 25
Age ........................................................................................................ 27
Diversity ................................................................................................ 29
New Residents ...................................................................................... 30
Educational Attainment........................................................................ 31
Secondary School Performance............................................................ 32
Household Income................................................................................ 33
Personal Income ................................................................................... 34
Per Capita Income ................................................................................ 35
Poverty ................................................................................................. 35
Crime .................................................................................................... 36
Cost of Living ........................................................................................ 37
Chapter 6: Economic Dynamics & Employment Trends .......................... 38
Labor Force Participation .................................................................. 38
Labor Force Participation—Families ................................................. 39
Labor Force ........................................................................................ 40
Labor Force Draw .............................................................................. 40
College Enrollment & Degrees Granted ............................................ 42
Commuting Patterns ......................................................................... 44
Estimated Annual Wages .................................................................. 46
Major Industry Sector Composition .................................................. 47
New Firm Startups ............................................................................. 48
Self-Employment ............................................................................... 49
Broadband Availability ...................................................................... 50
Airport Service ................................................................................... 51
Chapter 7: Retail Analysis......................................................................... 52
Chapter 8: Local Specialization, Competitiveness & Growth ................... 55
Chapter 9: Optimal Business Targets for Missoula County, Montana ..... 70
Chapter 10: Recommendations ............................................................... 93
Enhance the Product (Asset development) ...................................... 94
Execute Effectively (Organizational) ................................................. 96
Tell the Story (Marketing) ................................................................. 99
Chapter 11: Conclusion .......................................................................... 104
Appendices
A: Focus Group Summary ................................................................ 107
B: Survey Results ............................................................................. 115
C: Assets & Challenges Endnotes .................................................... 124
D: Industry Details ........................................................................... 127
E: Occupational Details ................................................................... 131
Project Goal
Understand the asset development, marketing, and potential organizational changes the Missoula Economic
Partnership (MEP), and other entities must make to attract and retain the types of businesses that will continue to
create jobs and opportunities for the community.

Raising the Bar: A Competitive Realities Report and Target Industry Strategy for Missoula, Montana | Page 3
Introduction and Executive Summary
In March 2018, the Missoula Economic
Partnership (MEP) retained Garner
Economics, LLC to develop a Competitive
Realities Report and Targeted Industry
Strategy for Missoula. The focus of the
effort is to assess current dynamics within
the Missoula market and identify ways to
strengthen the organization’s economic development service delivery
efforts. Given Garner Economics’ previous experience and work in
Missoula (Garner Economics created the initial Targeted Industry
Strategy for MEP’s predecessor organization in 2010), the project also
evaluates the progress made in implementing the initial strategy.
The goal of this engagement is for MEP to understand the product
improvement, marketing, and potential organizational changes it must
make to attract and retain the types of businesses that will continue to
create jobs and opportunities for the community.
FIGURE 1.1: PROJECT PROCESS
Specifically, the scope of services for the overall project included:
• A comprehensive and holistic assessment of key forces driving the economy and its shifting dynamics;
• An Assets and Challenges Assessment (A&C) of the City and County from the perspective of a site location consultant that facilitates investment decisions;
• Recommendations for business targets suitable for MEP (and community) to pursue based on our research and analysis; and, finally,
• A set of implementable recommendations that MEP can utilize to enhance business recruitment, retention, and expansion efforts for the region while sustaining and enhancing its quality of place.
Methodology
As illustrated in Figure 1.1, the first part of the consulting effort was a
deep dive into the economy of Missoula City and County (Phase 1 of
the project and chapters 1-8). These chapters are a compilation of local
facts and data points with quantitative analysis and some subjective
opinions.
Discovery
• Reviewed past studies and progress since the 2010 study
• Conducted site visit, focus groups, and survey
• Evaluated workforce, demographic, and existing cluster status/conditions
• Undertook an Assets and Challenges Assessment
PHASE 1 PHASE 2 PHASE 3
Analysis & Strategy
• Business retention
• Product planning and development to support clusters
• Business recruitment and marketing to identified clusters
• Workforce needs to support and grow targeted sectors
Recommendations
Implementation plan with actionable items for target recruitment/growth
• Product improvement
• Effective economic development service delivery
• Marketing

Raising the Bar: A Competitive Realities Report and Target Industry Strategy for Missoula, Montana | Page 4
Methodology
The first part of the consulting effort was a deep dive into the economy
of Missoula City and County (Phase 1 of the project and chapters 1-8).
These chapters are a compilation of local facts and data points with
quantitative analysis and some subjective opinions.
Our approach began with the consulting team conducting an Assets
and Challenges Assessment of Missoula. This was done through a
windshield tour of the area and against a pre-determined list of 53
criteria used to evaluate the area from a site selection perspective.
Garner Economics assessed Missoula based on the qualities, elements,
and infrastructure that a business will look for when considering
Missoula as a place for its operations or as an investment.
Comprised of an Assets and Challenges Assessment, Stakeholder input, and an Economic and Labor Analysis, Phase 1 is both an objective and subjective evaluation of the area. We applied many of the same criteria to assess Missoula that we use when engaged by a corporate client to evaluate communities for possible investment. The assessment allows us to document challenges that exist in Missoula that constitute potential barriers to successful target industry recruitment. By knowing what challenges or gaps exist, various entities can take the steps necessary to mitigate the situation, strengthen its overall “product,” and be a more attractive business location for the targets. Likewise, by knowing its strengths, MEP can better leverage them in its efforts to attract businesses.
Stakeholder Input
As a complement to the assessment of the physical and regulatory
structure of Missoula against its benchmarked peers, Garner
Economics conducted four focus groups of key stakeholders in the area
and distributed an electronic survey to reach MEP’s broader
stakeholders. The purpose of both exercises was to solicit a variety of
perceptions of the area’s business climate and brand as well as to
identify ways to improve both branding and business climate.
Target Industry Analysis
Based on the data and assessments in the first phase of the project, a
target industry strategy (TIS) of Missoula was undertaken. It identifies
and provides the rationale for four core target sectors that will both
diversify the industry mix in Missoula, as well as build on current areas
of strengths. These targets are “best fits” for Missoula based on
attributes, assets, and aspirations of the area as a whole.
The description of, and rationale for, the targets detailed in Chapter 9
will help MEP prioritize marketing resources and will identify areas
where policymakers can act to increase Missoula’s competitive
position in attracting and retaining these business sectors. Chapter 10
suggests actions MEP and/or its partners can take to mitigate
challenges identified in the various assessments and create a stronger
economic development platform to market the region.
The identified target industry sectors are:
CORE TARGETS
Biosciences
Creative Professional & Business Services*
High-Value Technology Services
High-Value Manufacturing
Experiential Economy
*Class A office space development essential for this target

Raising the Bar: A Competitive Realities Report and Target Industry Strategy for Missoula, Montana | Page 5
Recommendations
As noted above, Missoula has several attributes it can build upon to
attract the target industries. The recommendations reflect items the
team believes the County should undertake to mitigate negative
perceptions of the area by site location advisors or companies looking
to invest in the region.
The recommendations are not meant to provide a comprehensive
economic development strategy. Rather, they are specific actions MEP
and its economic development partners can take to strengthen the
area’s business climate fundamentals in the areas most important to
the target industries and or in the successful execution of economic
development initiatives.
The recommendations are broken into three categories:
• Enhance the Product: Policy changes and investments that should
be made to strengthen the region’s product;
• Tell the Story: Tactics MEP can use to tell the area’s economic
development story better; and
• Execute Effectively: Key organizational recommendations and
tactics to market the region better.
Additionally, the resulting recommendations identify areas where MEP
can act as a catalyst to lead initiatives to improve the area’s economic
development product. The tactics to market the region to prospective
target industry companies are primarily for MEP. However, the
messaging and brand should be supported by all economic
development organizations working to improve Missoula. By proactive
and strategic outreach to those industries, Missoula, MEP, and the
other economic development actors in the region can shape the area’s
economic future and ensure that there are sufficient economic
opportunities for its residents.
The following chapters describe our findings within a cohesive
assessment of Missoula’s current state and potential. It sets the
groundwork to assist MEP in providing excellent economic
development service delivery within the scope of its mission.
Targeted Industry Strategy (TIS) Recommendations
Enhance the Product (Programs for Asset Development) 1. Advocate for sustainable funding for the community’s
economic development infrastructure and catalyze programs to use the monies effectively.
2. Develop a real estate portfolio of additional sites and develop a speculative building for the targeted business sectors. A. Construct a multi-purpose speculative building. B. Create a public-private partnership owned office park
campus.
Execute Effectively (Organizational recommendations) 1. Realign the Missoula Economic Partnership (MEP) to enhance
its economic development service delivery. 2. Create a “Business Solutions Center” as a one stop location of
the various economic development organizations (EDOs) in Missoula that also offers tech space for second stage companies.
Tell the Story (Tactics to market Missoula) 1. Enhance MEP’s marketing tools.
A. Develop a unified brand for Missoula. B. Enhance MEP website to address the needs of location
consultants and potential investors (companies). 2. Enhance external outreach efforts to reach targets.
A. Execute a process for lead generation and business target profiling with the targeted companies.
B. Develop familiarization (FAM) events for consultants and companies.
C. Create a cadre of Economic Development Ambassadors to extend the Missoula brand.

Raising the Bar: A Competitive Realities Report and Target Industry Strategy for Missoula, Montana | Page 6
CHAPTER 1: STAKEHOLDER INPUT
Community input is a vital part of the targeted
industry planning process. Feedback from
stakeholders provides a context around the data
accumulated in Phase I and helps validate
conclusions made therein. Similarly, the input often
raises issues or nuances that are critical to
understanding the community. These insights may or may not be
discernible through desktop research and on-site tours.
Given this, Garner Economics undertook two community engagement
streams to better understand the economic development issues facing
Missoula.
Focus Groups
On April 11, 2018, Garner Economics held four focus group sessions
with community leaders in Missoula to solicit their perceptions and
opinions of the area’s business climate, existing assets, and economic
competitiveness.
Fifty-four people participated in the four groups. The focus groups
were organized into the following categories: Large Employers, Smaller
Employers and Entrepreneurs, the Technology Sector, and
Government/Academia. Participants were invited by MEP given their
past or current engagement in local economic development efforts
(either as a partner or client). The same questions were posed to each
of the focus groups. A more detailed summary and individual
responses are in Appendix A.
Electronic Survey
In addition to the focus group discussions, Garner Economics
developed and launched a community survey to solicit feedback from
a broader representation of businesses and economic development
representatives in Missoula. The survey was distributed to a wider
audience and respondents may or may not have had as extensive
engagement with MEP as the focus group participants. The survey was
open April 11–27, 2018 and was completed by 117 people.
Key Themes
The following summarizes the key themes emerging from the focus
group discussions and the survey results (Note: the comments listed
are specifically from focus group participants and survey respondents.
Garner Economics recognizes that these are not necessarily be
statements of fact, but rather opinions and perceptions.).
A Tale of Two Cities
Participants in the focus groups and respondents to the survey tended
to divide into two camps—those who want Missoula to follow the
perceived path of Bozeman or Bend and grow by attracting and
cultivating the “creative class,” leveraging the high-quality of place to
build an economy with higher-paying job opportunities, and those who
would prefer that the market and private business decisions drive how
Missoula grows. Those in the latter camp are not opposed to growing
the economy but believe that government regulations or intervention
are having the reverse effect, stifling business and inhibiting growth in
Missoula.
The results of this divide are differing opinions on the business climate, current leadership, and impact of economic development efforts in the region. The differing opinions are also evident in the feedback received
on economic development efforts currently underway.

Raising the Bar: A Competitive Realities Report and Target Industry Strategy for Missoula, Montana | Page 7
Mixed Business Climate
Focus group participants hold an overall favorable opinion of the area’s
business climate, with both camps ranking the City of Missoula and the
County higher than average. The employers focus groups (large,
smaller, and high-tech) gave the City an average score on 3.32 and the
County a score of 3.29 on a five-point scale (with five being a positive
business climate). If the Government/Academia scores are included,
the scores rise to 3.5 and 3.37, respectively. On the whole, comments
from the focus group participants were positive, noting that smaller
businesses tend to have fewer issues with the business climate than
those entities that are building and/or need permits for new buildings.
Negative comments on the business climate noted the lack of
leadership, the tendency of the city council to defer to populism rather
than staff recommendations, and the lack of resources and emphasis
placed on economic development.
Survey respondents were less positive about the business climate. On
average, they scored the City and County slightly lower than average,
giving the City of Missoula an average score of 2.75 and the County a
score of 2.71. Several of the open-ended comments provided to the
business climate question and comments to other questions suggest
that business in the area is over-taxed and over-regulated.
FIGURE 1.1: BUSINESS CLIMATE RANKINGS
Lack of Resources
Regardless of whether the focus group participants or the survey
respondents see growth as a generally positive or negative, the large
majority of both groups recognize that the area lacks the resources to
undertake initiatives to effect substantial change. They recognized that
there is a lack of tax base upon which the local authorities can tax or
around which to raise funds. Without such funds the local government
is hard-pressed to deliver the infrastructure improvements desired by
businesses and residents or prioritize and resource economic
development efforts in the region.
Similarly, the organizations that provide the economic development
service delivery programs also find it difficult to raise monies to fund
their efforts. Several groups also noted that there appears to be some
duplication of efforts and perceived competition among the economic
development groups. Survey respondents echoed this assessment.
“We all do a great job at our organizations—we want to collaborate, but we have to create an atmosphere to do it.
There is lots of good discussion, but when we get back to our day jobs, we can’t prioritize our collaborative efforts and we
can’t implement. Not one of us can do it all; not one of wants to do it all, but we are missing a system
to connect in Missoula.”
--Focus Group Participant

Raising the Bar: A Competitive Realities Report and Target Industry Strategy for Missoula, Montana | Page 8
Focus on Workforce Development
Both the focus groups and the survey respondents noted the large and
growing gap between housing prices/cost of living and the average
wages in the area. Rightfully, they point to the need to strengthen the
workforce so that the area is more competitive in attracting and
supporting traded industries able to pay a higher wage.
Focus groups participants pointed to the programs being initiated by
the community college and high schools as a step in the right direction.
Focus group participants also noted the need to better engage the
University of Montana.
Missing Infrastructure
As noted above, there are varying opinions as to the types of
infrastructure local government should provide or advocate. However,
both the focus group participants and the survey respondents agree
that more attention needs to be paid to maintenance of the road
network in the area as well as to making the road network more
efficient. Both the focus group participants and the survey respondents
would like to see better air service into the area. Focus group
participants also noted the need to better leverage the fiber network
going through the region.
Potential Industries for Missoula
When asked what industry sectors would be a good fit for the area,
focus group participants suggested business sectors and industries that
could both leverage and protect the area’s natural beauty. Focus group
participants most frequently suggested the high-tech/high-growth
sector, medical and healthcare, light resource manufacturing, biotech
and bioscience (to leverage the work in Rocky Mountain Laboratories)
and traded professional services. However, several participants in the
High-Tech focus group were critical of the workforce product
graduating from the various local academic institutions that are
educating students in the respective disciplines.
Survey respondents listed similar business sectors, adding lifestyle
entrepreneurs (people who can work from anywhere), recreational
equipment manufacturers, and innovative manufacturing to their top
five.
Additionally, both groups noted the increase in support for the
entrepreneurial community (especially those in technology) and want
to see continued support for those initiatives. Coupled with the
perceived strength in creative industries, focus group participants and
survey respondents believe attention should be paid to start-up and
home-grown industries.
Many “Lights,” No Focus
Several of the focus group participants noted (or their comments
suggest) there is a strong and growing contingent of economic
development stakeholders in the private sector and economic
development organizations that are committed to growing the area
and giving back to their community. They note the commitment of
those in the area to collaborate to effect positive change, but also note
that the lack of leadership or a common, shared focus inhibits much
progress. As one focus group participant suggested: “We are
rudderless—individual groups are always spinning around with a new
focus.” The lack of focus (and resources) has meant that many
initiatives never get off the ground or are pitted against each other
rather than finding areas of alignment.
Figure 1.2 on the following page describes the perspectives of survey
respondents. Appendix A provides more detail on the focus group
discussions. Appendix B provides the feedback from the survey
respondents.

Raising the Bar: A Competitive Realities Report and Target Industry Strategy for Missoula, Montana | Page 9
FIGURE 1.2: SAMPLE OF SURVEY RESPONSES
What types of companies do you think would be a good fit for the Missoula region?
What do you think are some of the biggest obstacles that inhibit the region in its ability to attract, expand, or retain businesses and investment?
For the purposes of this question, hard infrastructure is defined as the physical networks such as roadways, sewer, broadband internet, airports and/or ports; soft infrastructure refers to institutions or places that support the economic, health, and cultural climate of a place, such as the education system, the health care system, system of government, and/or parks. What hard or soft infrastructure is weak or missing in the area?

Raising the Bar: A Competitive Realities Report and Target Industry Strategy for Missoula, Montana | Page 10
CHAPTER 2: MEP/MISSOULA REPORT CARD
In March of 2010, Garner Economics completed a Competitive Realties Report and Industry Target Strategy for the City of Missoula (but for all of Missoula County). As part of our due diligence for this update, Garner Economics undertook a comparative analysis of where Missoula stood eight years ago versus where the City, County, and MEP stand now related to implementation of the program recommendations and initiatives. The following illustrates the contrast between the former and current program and the evolution of Missoula as a competitive place for business.
FIGURE 2.1: COMPARISON OF ASSETS AND CHALLENGES ASSESSMENTS
FIGURE 2.2: BUSINESS AND INDUSTRY TARGETING—MEP TARGET MARKET TRENDS
Garner Economics Targets (2010) MEP Internal Strategic Plan (2016) MEP Website (2018)
• Creative Professional Services
• Shared Back-Office Services
• Medical/Pharmaceutical
Wholesaling
• Mobile Entrepreneurs
• Information Technology and Data
• Biotech and Life Sciences
• Advanced Manufacturing
• Professional Services
• Business Support Services/Back Office
• Creative Industries/Media
• Warehousing/Distribution
• Finance and Insurance
• Life Sciences
• Information Technologies
• Manufacturing
• Back Office & Creative Services
• Forest Products & Renewables

Raising the Bar: A Competitive Realities Report and Target Industry Strategy for Missoula, Montana | Page 11
Raising the Bar: A Competitive Realities Report and Target Industry Strategy for Missoula, Montana | Page 12

Raising the Bar: A Competitive Realities Report and Target Industry Strategy for Missoula, Montana | Page 13
CHAPTER 3: ASSETS AND CHALLENGES ASSESSMENT
Missoula County offers a unique mix of assets for businesses
contemplating relocation or expansion as well as entrepreneurial start
ups. In conducting the Assets and Challenges Assessment, we
employed the same criteria and methodology we use when conducting
a community evaluation for our corporate clients to explore and
identify locations for investment. By understanding the County’s
Assets and Challenges from a location strategy perspective, we believe
the County will be better positioned to compete more effectively and
to resolve area challenges that are likely inhibitors to investment
projects. By recognizing and understanding the area’s strengths and
opportunities, the County will ultimately be able to determine the
proper target audience of companies to which it should effectively
communicate the area’s assets.
Garner Economics analyzed 53 community factors as part of the
assessment. Ratings were identified by evaluating the County’s
position for each of the factors against the state of Montana and the
United States.
We define a “neutral” rating as normal in the realm of economic
development opportunity and competitiveness. An “asset” rating
indicates a positive feature of the County that would be evaluated and
rated as a competitive strength versus the benchmark locations. A
“challenge” rating identifies a factor that is considered a relative
deficiency compared to other locations and may be an impediment to
economic development requiring remediation.
Of the 53 variables analyzed, 19 are considered an asset and 14 a
challenge (20 rated as neutral). With 20 variables rated as a neutral or
average, any or all of these rankings, taken either individually or as a
whole, could be an impediment to attracting or retaining private
investment within the County. The objective in the future will be for
those policymakers engaged in local economic development to move
the bar from a challenge to a neutral or asset ranking, move the neutral
rankings to an asset, and to sustain or prevent a slippage of the current
asset rankings that you have today.
To enable a summary overview of the report’s main findings for
readers, a set of dashboard icons is presented. Each finding has an
accompanying icon to assist with interpretation. Data sources and
rationale for the rankings can be found in Appendix C.
REPORT DASHBOARD
Indicates the County is better (more positive) compared to a majority of the benchmark geographies or points to a positive trend or asset within the County.
Indicates the County is neutral or normal, neither positive nor negative. Indicator may represent an observation or be in the middle of the benchmark geographies.
Indicates the County has a worse rating for that particular attribute compared to a majority of the benchmark geographies or points to a negative trend or challenge within the County.
A

Raising the Bar: A Competitive Realities Report and Target Industry Strategy for Missoula, Montana | Page 14
Access to Markets Missoula is within 400 miles of 9.2 million people.
Because of limited population density and one
east/west interstate (I-90), the area is not ideal for
distribution centers. Rail is provided by Montana
Rail Link, a short line railroad. Missoula
International Airport (MSO) is served by four
airlines with direct flights to twelve major markets
and summer seasonal service to select cities, e.g.
Atlanta.
Labor Of the nine-variables measured within labor, four
are considered an asset with two as a challenge.
Those challenges include lack of an engineering
program and the availability of skilled industrial
workers. Only 3.6% of the Missoula workforce is
engaged in manufacturing and, as such, there are
only 2,033 employed in manufacturing occupations
with a Location Quotient of 0.51.
Access to Resources Even though as noted in the Labor category that
manufacturing is considered a challenge with a
small portion of the overall workforce engaged in
production-positions jobs, there has been an uptick
in manufacturing establishments in Missoula. In
2017, there were 161 payroll manufacturing
locations compared to 127 in 2010. Business and
professional services fare better with 735 business
locations in 2017 compared to 589 in 2010.
Attribute Rank
Centrally located for major regional market
1
Centrally located for national market 2
Well-positioned to serve international markets
3
Interstate highways 4
Rail service 5
Port facilities (inland and/or water)
Within 1 hour of commercial air passenger service
6
General aviation airport capable of handling corporate aircraft
Broadband availability and speeds 7
Attribute Rank
Availability of skilled industrial workers 8
Availability of skilled admin workers 9
Availability of technicians, scientists 10
Availability of managerial personnel 11
Cost of labor 12
Availability of post-secondary
vocational training
13
Availability of on-the-job training
assistance (customized, no cost
training)
14
Within 1/2 hour of major
university/college
15
Availability of engineering program or
related programs
16
Attribute Rank
Availability of locally-grown agricultural products for food processing
17
Availability of manufacturing processes 18
Availability of business and professional services
19
Cost of electricity and natural gas for industrial/commercial use
20

Raising the Bar: A Competitive Realities Report and Target Industry Strategy for Missoula, Montana | Page 15
County (MEP) Economic Development Program MEP, the official economic development organization
representing the City, County and business
community, has three FTEs. Having only one person
engaged in business development and investment
activities is not sufficient for a community of this size.
The budget for MEP is problematic as well, given that
less than $46,000 is appropriated for direct outreach
and promotional efforts.
Access to Space The availability of office sites and industrial property
is a potential Achilles’ heel for Missoula. The
Missoula County Development Park shows well but
has limited acreage. Bonner Mill Industrial TIF District
is a re-use but is not aesthetically pleasing and
appears to have no development standards. Class A
office space is hard to find and there are limited to
no office parks where class A space can be built.
Most office sites are redevelopment opportunities
the City will need to lead.
Access to Capital The availability of low-interest loans for small
business and the availability of venture or angel
capital from local or regional sources is a positive for
Missoula. There are a variety of loans, grants, and
other funding sources for startup and early stage
companies.
Attribute Rank Adequate level of professional staff 21
Involvement of both public and private sectors
Local economic development organization has a strategic plan
Level of leadership support of economic development program
Level of cooperation between various organizations involved in economic development activity
Level of awareness of community regarding economic development
22
Level of funding for local economic development program
23
Attribute Rank
Availability of fully served and attractive industrial sites
24
Availability of fully served and attractive office sites
25
Availability of suitable industrial space (bldgs)
Availability of suitable office space (Class A and B space)
Attribute Rank
Availability of low-interest loans for small business
26
Availability of venture capital from local sources for business startups or early stage funding
27

Raising the Bar: A Competitive Realities Report and Target Industry Strategy for Missoula, Montana | Page 16
Government Impact on Business
The quality of local elementary and secondary education is an asset for
Missoula, as is the quality and availability of post-secondary education.
Stakeholder engagement from both the focus groups and the electronic
survey noted that public infrastructure, e.g. the condition of local roads, as
a challenge. The statewide median of local property taxes, among the
highest in the state, is also a challenge for Missoula.
Attribute Rank
Condition and maintenance of local streets 28
Availability and type of local incentives 29
Quality of local elementary and secondary education 30
Quality/availability of post-secondary education 31
Business permitting procedures and costs 32
Local property taxes (statewide median) 33
Quality of Place
Missoula has a high cost of living index (COL) at 103, with the national
average at 100 and Montana at 97. The housing index primarily inflates the
overall COL in Missoula. Of the twelve variables measured, only COL and
crime statistics are considered a challenge. Six of the variables are
considered an asset, including: the availability of executive level housing,
cultural activities, recreational opportunities, the general appearance of
the community, nearly no retail leakage, and the appearance of the
downtown.
Attribute Rank
Availability of executive-level housing 34
Availability of moderate-cost housing 35
Availability of apartments 36
Cost-of-living index 37
Level of crime 38
Level of arts and cultural activity 39
Availability of recreational opportunities 40
General appearance of the community
Retail leakage 41
Availability of adequate medical facilities 42
Availability of first-class hotels, motels, and resorts 43
Appearance of the Central Business District(s) 44

Raising the Bar: A Competitive Realities Report and Target Industry Strategy for Missoula, Montana | Page 17
CHAPTER 4: DASHBOARD INDICATORS SUMMARY
The following analysis examines the economic position and competitiveness of Missoula County located in the
mountains of western Montana. Covering over 2,600 square miles, the County comprises the Missoula
Metropolitan Statistical area with the City of Missoula as the principle city. For this report, Missoula County is
used wherever possible for analysis with several data points at the city level.
For context, Missoula County is compared to itself over time, the State of Montana, and the nation. Along with
other studies, the 2010 COMPETITVE REALITIES REPORT prepared by Garner Economics is also referenced to address
change (where possible) .
This analysis relies heavily on raw objective data collected by governmental or impartial third-party agencies.
In all cases, the original and most current available data for all geographies included in the report(as of April
2018) are used. Garner Economics conducted all unique calculations and computations from the original data.
Measurements
• Population Trends
• Age Distribution
• Diversity
• New Residents
• Educational Attainment
• Secondary School Performance
• Household & Individual Income
• Per Capita Income
• Poverty
• Crime Rate
• Cost of Living
• Labor Force Draw
• Labor Force Participation
• Commuting Patterns
• Enrollment & Degrees Granted
• Industry Sector Composition
• Estimated Average Annual Wage
• New Firms Startups
• Self‐Employment
• Broadband Access
• Military Impact
• Hospitality Industry
• Retail Demand & Leakage
• Major Industry Sector Change
• Industry Earnings
• GDP and Exports
• Occupational Change
• Occupational Earnings
• Local Specialization, Competitiveness & Growth
Missoula County, MT

Raising the Bar: A Competitive Realities Report and Target Industry Strategy for Missoula, Montana | Page 18
Demographic & Community Trends
Population Change
Missoula County is growing at a steady rate, outpacing the state and nation, with a 10.7 percent increase in the past
decade and 5.8 percent over the past five years. A majority of growth is due to domestic migration.
Age Distribution
Missoula County has a relatively young population with a median age of 36.4 years and high percentage of age groups
20-39 years old.
New Residents
The County attracted approximately 12,443 new residents (inflow) in 2016, 10.8 percent of the population. The median age
of new residents was younger than the state and nation.
Posi
tive
Population
Age
New Residents
Educational Attainment
Secondary Schools
Per Capita Income
Labor Force
Labor Force Participation
Colleges
Commuting
Major Industry Composition
Start-ups
Airport Service
Neu
tral
Household Income
Personal Income
Labor Draw
Average Wage
Self-Employment
Broadband
Neg
ativ
e
Poverty
Cost of Living
Crime Rate
13 6 3

Raising the Bar: A Competitive Realities Report and Target Industry Strategy for Missoula, Montana | Page 19
Demographic & Community Trends (continued)
Educational Attainment
Missoula County is home to highly educated individuals with 72.9 percent having some college or higher education
degrees or certificates. The County had the highest percentage of its population with Bachelor’s and Graduate or
Professional degrees. New residents reflect this education profile with 73.4 percent of those who moved to the County
in the past year having some college or higher.
Secondary School
Performance
Missoula County has an excellent 4-year graduation rate that is consistently higher than the nation. The 2017
graduation rate dropped nearly 3 points and fell under Montana’s rate. Missoula County had a composite score for
2017 of 20.6, between the state and nation. The County regularly scores a few points off of the national average and
better than Montana’s scores.
Household Income
Missoula County’s household income distribution has a higher emphasis on lower to middle range income with the
highest percentage of households in two brackets: those making $25,000 and under as well as those making $35,000
to $50,000. On a positive note, the County grew its higher income brackets between 2011 and 2016.
Personal Income
The 2016 personal income distribution for Missoula County shows a spike in the $15,000-$25,000 category with 28
percent of the working population earning an average income in that range.
Per Capita Income
Missoula County’s 2016 per capita income was $30,103, ranking between the state and the nation (Table 5.8). Per
capita income increased an impressive 25.9 percent over the past five years.
Poverty
Missoula County has an overall high poverty rate (16.5 percent) in comparison to the benchmarks of the state and the
nation. The poverty rate for children under age 18 is 18.9 percent, which is higher than the state average but lower
than the national rate of 19.5 percent.
Crime Rate
Missoula County’s 2016 Property Crime Rate is comparatively high at 3,526.4 crimes reported per 100,000 residents.
The Violent Crime Rate is also higher than the state and nation at 410.7 crimes reported per 100,000 residents. These
rates are significantly higher than 2011 rates. Any change in reporting standards may affect the rate comparison of
2011 to 2016 crime figures.

Raising the Bar: A Competitive Realities Report and Target Industry Strategy for Missoula, Montana | Page 20
Demographic & Community Trends (continued)
Cost of Living
Missoula’s Cost of Living Index was 103, above the state and national level. In particular, the Housing Index was 116
compared to a national average of 100. Transportation and Utilities indices were below the national average.
Labor Market Analysis & Employment Trends
Labor Force Participation
Among residents aged 16 and over in Missoula County in 2016, 69.4 percent participate in the labor force, a figure
above the state and nation’s participation rate.. Its participation rate in 2011 was 71 percent and it is following the
national trend of decline, but still at a high level. The County had the highest number of families participating in the
workforce as well with 78.6 percent when compared to the state and nation.
Labor Force
Missoula County’s labor force of 61,579 has remained fairly steady with a 4.1 percent growth rate withing the past
five years. Unemployment in the County has been on the decline since 2010 and remains lower than both the nation
and the state.
Labor Draw
A 60-minute drive-time analysis from Missoula showed marginal increases in labor force and population that would
impact the local work force. Due to geographical terrain and road networks, a 60-minute drive-time does not reach
all of the County and captures only a narrow segment outsite the County along major roadways.
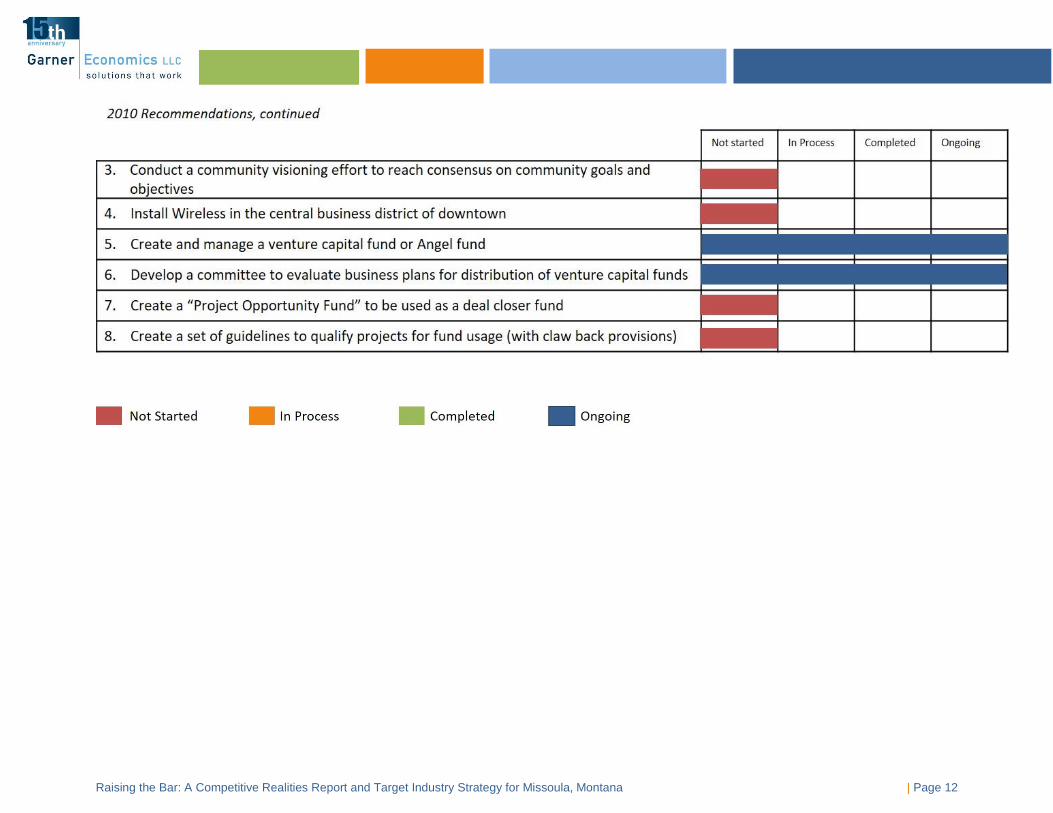
College Enrollment &
Degrees Granted
Missoula is home to the University of Montana with more than 11,800 students enrolled at the school. Enrollment has declined, primarily in undergraduate attendance. The University has several national recognized programs along with a pharmacy school and the Missoula College offering 2-year technical training. Nearly 3,300 degrees were conferred in 2016.
Commuting Patterns
Missoula County retains a majority of its residents for work within the County. In 2015, more than 40,000 Missoula
County residents lived and worked in the County. Only 7,818 residents commuted to jobs outside of the county while
nearly 14,000 commuters came into the county for work.

Raising the Bar: A Competitive Realities Report and Target Industry Strategy for Missoula, Montana | Page 21
Labor Market Analysis & Employment Trends (continued)
Average Wage
Missoula County’s estimated annual average wage of $38,755 was under the state and national averages, though it
has grown 13.4 percent over the past 5 years.
Major Industry Composition
The County has nearly half of its employment within four major industry sectors similar to the state and nation.
These sectors are Government (17.3 percent), Health Care & Social Assistance (15.8 percent), Retail Trade (12.8
percent), and Accommodation & Food Services. The remaining employment is distributed among many diverse
sectors.
Startups
Missoula County performs well with regard to start‐up rates and employment at new firms. Rates were above the
United States when compared at a start‐up rate per 100,000 residents. With the exception of 2017, employment at
new firms follows the state trend and has been increasing.
Self-Employment
As of 2016, 12 percent of workers in Missoula County are self-employed, ranking the County between the state
and the nation. Self-employment decreased marginally from 2011 to 2016.
Broadband
Missoula County and the City of Missoula have good access to broadband internet with a high percentage of the
population being able to buy service at 100 mbps levels or faster. Several internet providers advertise gigabit
service as well. The average download speed at 17.95 does not reflect the anecdotal reports by the focus group
members of faster speeds and is well below the national average.
Airport Service
Missoula International Airport serves the County with commercial passenger and air cargo service. The airport has
good assets and passenger enplanements have increased dramatically since 2013.

Raising the Bar: A Competitive Realities Report and Target Industry Strategy for Missoula, Montana | Page 22
Local Specialization, Competitiveness & Growth
Below are general observations from an in-depth analysis of industry sectors and occupational groups in Missoula County. This information is not benchmarked.
Major Industry Sector Change
✓ The largest absolute industry job gains in Missoula County between 2012 and 2017 came from Accommodation & Food
Services (+ 900 jobs), followed closely by Health Care & Social Assistance (+894 jobs) (Figure 8.1, Table 8.1).
✓ Overall, Missoula County shows a net increase of 5,151 jobs taking into consideration covered, non-covered, and self-
employed individuals.
✓ Gains were made in the majority of industry categories while job losses occurred mostly in the Administrative, Support,
Waste Management & Remediation Services sector (-608 jobs).
✓ Moderate losses occurred in the following sectors: Transportation & Warehousing; Management of Companies; Mining,
Quarying, Oil & Gas Extraction; and Utilities.
Industry Earnings
✓ Overall, the average earnings per job in the county were $38,755 in 2017, which is 25.9 percent below the national
average of $52,284 (Table 8.2, Figure 8.2).
✓ Earnings in the County are below national averages for all major employment sectors with the exception of Agriculture,
Forestry, Fishing & Hunting, which was significantly higher than the national average by more than 50 percent.
Major Occupational
Change
✓ Over the last five years, all but one major occupational categories in Missoula County added jobs. The largest job gains
were in Food Preparation & Serving Related (+ 741 jobs) (Figure 8.3, Table 8.3).
✓ Other sectors with strong growth include Construction & Extraction (+ 519 jobs), Office and Administrative Support (+
472 jobs), and Building & Grounds Cleaning & Maintenance (+ 414 jobs).
✓ Other occupational groups adding at least 300 jobs over the past five years include Personal Care & Service (+ 372 jobs),
Sales & Related (+ 353 jobs), and the well-paying Healthcare Practitioners & Technical (+ 321 jobs).
✓ Between 2012 and 2017, only one occupational category—Military (- 22 jobs) —saw a decline in employment.

Raising the Bar: A Competitive Realities Report and Target Industry Strategy for Missoula, Montana | Page 23
Local Specialization, Competitiveness & Growth, continued
Occupational Earnings
✓ A comparison of the same-occupation average hourly earnings for Missoula County to the national median wage revealed no occupations that were higher than or equal to the national average (Table 8.4, Figure 8.4).
✓ Occupational wages in Missoula County were somewhat in line with national averages with all pay comparisons under 40 percent difference. Pay levels range from three percent under national average for Protective Service positions to 36 percent under for Computer & Mathematical jobs.
✓ The average wage for all occupations in Missoula County was $18.91 compared to $23.21 for the national average hourly wage, a 19 percent difference.
Major Industry Sector
Specialization & Growth
✓ Major industry sector specialization focuses on the geographic concentrations of similarly classified industries. For many industry sectors there exist interconnections between suppliers, occupations, and associated supporting institutions.
✓ Eight industries sectors have a local specialization above one and experienced job growth in the past five years in Missoula County (Table 8.5; Figure 8.5). These comprise the Competitve category and are:
• Arts, Entertainment & Recreation (1.54 LQ)
• Health Care & Social Assistance (1.25 LQ)
• Retail Trade (1.24 LQ)
• Accommodation & Food Services (1.22 LQ)
• Other Services (1.14 LQ)
• Government (1.13 LQ)
• Construction (1.09 LQ) • Real Estate, Rental & Leasing (1.02 LQ)
✓ Industries with local specialization below one but had job growth within the County over the past five years are considered Emerging. Seven industry sectors are in this category based on job growth between 2012 and 2017 including Agriculture, Forestry, Fishing & Hunting; Information; and Professional, Scientific & Technical Services.
✓ The five remaining sectors are classified as Declining due to job loss and low local specialization. These include Transportation & Warehousing; Administration & Support, Waste Management & Remediation Services; and Utilities.
✓ There were no sectors deemed At Risk for this time period.

Raising the Bar: A Competitive Realities Report and Target Industry Strategy for Missoula, Montana | Page 24
Industry Competitiveness
✓ The Competitiveness screen seeks to reveal local competitive advantages (i.e., unique growth beyond predicted industry trends).
✓ By the Competitiveness measure, Administrative & Support, Waste Management & Remediation Services is the lone industry sector with local growth and national growth for this time period (Table 8.6, Figure 8.6).
✓ Six industries demonstrated local growth:
• Government
• Other Services
• Finance & Insurance
• Construction
• Agriculture, Forestry, Fishing & Hunting
• Wholesale Trade
✓ Seven industry sectors show local decline for this study period even though national trends show growth. The most significant sectors include Health Care & Social Assistance; Accomodation & Food Services; Professional, Scientific & Technical Services; and Transportation & Warehousing.
✓ This analysis suggests the County’s least competitive sectors showing local and national decline are Manufacturing; Retail Trade; Information; Real Estate, Rental & Leasing; Utilities; and Mining, Quarrying, Oil & Gas Extraction.
Major Occupational
Sector Specialization and Growth
✓ Occupational groupings represent similar skills and educational qualifications, but are not necessarily specific to one industry sector.
✓ Twelve occupational groups are Competitive as shown in Table 8.7 and Figure 8.7. The group with the highest LQ is Life, Physical & Social Science with an LQ of 2.26. The occupation group with the highest employment in 2017 is Office & Administrative Support, employing 10,820. Several groups that experienced job growth in the past five years over 400 were Food Preparation & Serving Related, Construction & Extraction, Office & Administrative Support, and Building & Grounds Cleaning & Maintenance.
✓ Most of the remaining occupational groups (10) are classified as Emerging, or having job growth with local specialization under 1. Two of these groups had job growth over 200: Business and Financial Operations, which gained 276 jobs over the past five years, and Management, which added 241 jobs during the same time period.
✓ The Military occupation is Declining due to job loss and low local specialization.
✓ There are no occupational groups that are classified as At Risk for this time frame.

Raising the Bar: A Competitive Realities Report and Target Industry Strategy for Missoula, Montana | Page 25
CHAPTER 5: DEMOGRAPHIC & COMMUNITY TRENDS
This chapter focuses on the residents of Missoula County, Montana. The analysis explores population demographics, new residents,
educational attainment, and secondary school performance. Income for households and individuals, per capita income, and poverty
rates are key indicators of residents’ economic standing. Also included in this chapter are several indicators affecting residents’ quality
of life and opportunity, such as crime rates and cost of living.
Population Trends
Population growth can be a significant factor in local economic health and is often a key consideration in business
expansion and site selection decisions. Population declines, very slow growth rates, or significant domestic out-
migration cause companies to be wary of an area favoring those locations that are dynamic and growing.
Missoula County is growing at a steady rate, outpacing the state and nation with a 10.7 percent increase in the past
decade and 5.8 percent over the past five years (Table 5.1, Figure 5.1). Population for the County is at 117,441, 11,331
more residents than in 2007. Recent population change has been less dramatic than the 10-year change of 14.6
percent in Missoula’s last COMPETIVE REALITIES REPORT (CRR) of 2010. However growth is still strong. The rate of change
increased from 2013 through 2016, and the past year has shown a modest slow down of approximately half a percent
(Figure 5.2, Figure 5.3).
Table 5.1 Net Population Change
Highest Growth Rate Shaded
Geography 2007 2012 2017 Change
2007-2017 Change
2012-2017 % Change
2007-2017 % Change
2012-2017
Missoula County 106,110 111,016 117,441 11,331 6,425 10.7% 5.8%
Montana 964,706 1,003,522 1,050,493 85,787 46,971 8.9% 4.7%
United States 301,231,207 313,993,272 325,719,178 24,487,971 11,725,906 8.1% 3.7%
Source: US Census Bureau, Garner Economics
Figure 5.1 Net Population Change
2007-2017

Raising the Bar: A Competitive Realities Report and Target Industry Strategy for Missoula, Montana | Page 26
Figure 5.2 Figure 5.3 Missoula County Population Growth Missoula County Annual Rate of Population Change
Population growth has three major sources: 1) natural (births minus
deaths), 2) domestic migration, and 3) international migration. Missoula’s
population growth comes mainly through domestic migration at 58.1
percent, with natural increase levels 35.2 percent and international
migration at 6.7 percent (Figure 5.4). Missoula has higher international
migration than the state.
Figure 5.4 Components of Population Growth 2010-2017
Source: US Census Bureau, Garner Economics

Raising the Bar: A Competitive Realities Report and Target Industry Strategy for Missoula, Montana | Page 27
Age
The age composition of a local population can be an important determinant in business decisions and
competitiveness. The lack or underrepresentation of younger workers may deter firms from considering some
communities for their long-term plans. Low proportions of middle-age workers may prevent firms from
initiating expansions requiring quick start-up operations.
A high proportion of older workers may indicate certain incumbent skills or the need to replace soon-to-retire
workers. With many communities across the nation focusing on retaining and attracting talent, an existing
pool of younger people for both current and future workforce participation is essential in making a
community attractive for companies and people alike.
Missoula County has a relatively young population with an median age of 36.4 years, younger than the
national median of 37.9 and much younger than the state (Figure 5.5). In fact, the County has the highest
percentage of population groups from age 20 through 39 years compared to the state and nation (Table 5.2).
Montana has higher percentage of population over 50 years.
Table 5.2 Percent of Population by Age Groups 2016
Highest Percentage Shaded
Geography <10 yrs
10-19 yrs
20-29 yrs
30-39 yrs
40-49 yrs
50-59 yrs
60-69 yrs
70-79 yrs
80+ yrs
Missoula County 10.7% 11.5% 18.3% 14.4% 12.5% 12.7% 11.3% 5.4% 3.3%
Montana 12.0% 12.6% 13.1% 12.2% 11.4% 13.9% 13.5% 7.3% 4.1%
United States 12.4% 13.1% 13.9% 13.2% 12.6% 13.5% 11.3% 6.3% 3.7%
Source: US Census Bureau, Garner Economics
Figure 5.5 2016 Median Age
36.4 Missoula County 2016 Median Age

Raising the Bar: A Competitive Realities Report and Target Industry Strategy for Missoula, Montana | Page 28
Missoula County age distribution shows the
strength of its younger population compared
to Montana and the United States (Figure
5.6). Home to the main campus of the
University of Montana, the student
population surely impacts the concentration
of younger residents. Spring enrollment at
the Mountain Campus was 9,407 with an
additional 1,580 students at Missoula
College.
The population as a whole is growing in the
County with several age groups seeing large
increases, while others are showing declines.
The age group of 20 to 29 years shows a steep
decline between 2012 and 2017 (Figure 5.7).
Missoula County shows a mixed pattern of
growth with groups ages 30 to 49 years old, a
prime work force age span.
Source: US Census Bureau, Garner Economics
Figure 5.6: 2016 Age Distribution
Figure 5.7: Change in Age Groups 2012-2017
18.3%

Raising the Bar: A Competitive Realities Report and Target Industry Strategy for Missoula, Montana | Page 29
Diversity
Missoula County is primarily comprised of those who identify themselves
as White with 91.9 percent of the total population (Table 5.3). A growing
number of people respond with Two or More Races as their ethnic identiy
with the County mirroring the state and nation. Montana has the highest
percentage of its population identying with American Indian or Alaska
Native with 6.4 percent. In 2016, 2.6 percent of Missoula County residents
were in this group.
By itself, racial diversity is not a determining factor in local economic
competitiveness, although some firms may prefer higher rates of diversity
to attract and retain certain workers. This is particularly true for
multinational firms looking to attract workers from outside the United
States. As talent attraction and retention are key factors in economic
development today, an increasing number of companies cultivate
corporate cultures that emphasizes diveristy. In turn, these companies
often seek areas that reflect or support inclusiveness and tolerance among
many groups of people.
Table 5.3 Population Diversity 2016
Highest Percentage Shaded
White Two or
More Races American Indian or Alaska Native
Asian Black or African
American Other
Hispanic or Latino*
Missoula County 91.9% 3.1% 2.6% 1.6% 0.6% 0.2% 3.1%
Montana 89.0% 3.1% 6.4% 0.8% 0.4% 0.4% 3.6%
United States 72.6% 3.2% 0.8% 5.4% 12.7% 5.2% 17.8%
* Note: Hispanic or Latino is not counted as a race, but rather origin of any race.
Source: US Census Bureau, Garner Economics

Raising the Bar: A Competitive Realities Report and Target Industry Strategy for Missoula, Montana | Page 30
New Residents
Attracting new residents from a diversity of outside locations can reflect the County’s broader appeal and provide
an indicator of economic dynamism. This measure of new residents reflects the population that has moved within
the past year into Missoula County and not a net migration figure.
Missoula County gained about half of its new residents through migration from a different state and an additional
44.4 percent through those who moved from another county within Montana (Table 5.4, Figure 5.8). The County’s
pull for those from a different state was slightly higher than the state and much higher than the nation. Nearly 5
percent of new residents moved from abroad, higher than Montana but well under the national level.
The 2016 median age of new residents to Missoula County was 36.6, much younger than the state and under the
national level (Figure 5.9). The County drew younger people from within the Same State at a median age of 22,
most likely reflecting the University of Montana draw (Table 5.4). New residents moving to Missoula County from
abroad were significantly older than the state and nation with a median age of 38.
Table 5.4 New Residents 2016
Highest Percentage Shaded
Source: US Census Bureau, Garner Economics
Missoula County Montana United States
% New Residents 10.8% 7.5% 6.3%
# Total New Residents 12,443 77,460 20,119,803
Moved from Same State 44.4% 46.7% 50.8%
Same State: Median Age (years) 22 27 28
Same State: Median Income $21,148 $17,519 $22,171
Moved from Different State 50.9% 49.3% 38.1%
Different State: Median Age (years) 27 27 29
Different State: Median Income $11,068 $20,196 $25,223
Moved from Abroad 4.6% 4.0% 11.1%
Abroad: Median Age (years) 38 25 30
Abroad: Median Income $6,625 $6,631 $17,952
Figure 5.8 Sources of New Residents 2016
Figure 5.9
Median Age of New Residents 2016

Raising the Bar: A Competitive Realities Report and Target Industry Strategy for Missoula, Montana | Page 31
Educational Attainment
The level of education of the County’s population is often a decisive factor
in economic competitiveness. Firms understand the need to operate in
areas with a sufficient supply of workers that meet or exceed their
demands. They also know that the lack of an educated workforce can
significantly affect business performance.
Educational attainment among Missoula County’s population age 25 and
over is fairly high with 72.9 percent receiving some higher education
experience (Figure 5.10). This is above state and national levels. In fact, the
percent of those with a Bachelor’s degree and Graduate or Professional
degree is highest amongst the state and nation. All higher education
categories grew from the 2010 CRR measure—66.8 percent had some
college.
Impressively, 73.4 percent of new residents who move to Missoula County
have some college or higher (Figure 5.11). Those with Bachelor’s degrees
are 32.9 percent of new residents, which is highest among all comparisons.
Figure 5.10 Educational Attainment, 2016
Figure 5.11 Educational Attainment of New Residents, 2016
72.9% Some College or Higher
73.4% Some College or Higher
Source: US Census Bureau, Garner Economics

Raising the Bar: A Competitive Realities Report and Target Industry Strategy for Missoula, Montana | Page 32
Secondary School Performance
Graduation Rate
The share of high school students that graduate within four years of
beginning 9th grade is an important measure of the performance of local
school districts.
The four-year graduation rate for Missoula County has been consistently
above 85 percent for the past five years (Figure 5.12, Table 5.5). This is well
above all benchmarks, though a decrease in 2017 placed the County just
under Montana’s graduation rate. Rates for 2017 were not available for the
United States. However, if the national upward trend continues, it will rise
to the same level as Missoula County.
ACT Scores
The ACT standardized test, utilized for college admissions in the United
States, is a widely accepted measure of education quality. Scores are
especially relevant to businesses because they provide a measure of the
“final product” of public schools and secondary school performance.
Missoula County had a composite score for 2017 of 20.6, between the state
and nation (Figure 5.13, Table 5.6). The County consistently scores a few
points off of the national average and better than Montana’s scores.
Source: Montana Office of Public Instruction, Garner Economics
Figure 5.12 4-Year Graduation Rates
Table 4.5
4-Year Graduation Rates Highest Rate Shaded
2013 2014 2015 2016 2017
Missoula County 88.3% 87.8% 89.2% 88.4% 85.5%
Montana 84.4% 85.4% 86.0% 85.6% 85.8%
United States 81.4% 82.3% 83.2% 84.1% n/a
Figure 5.13 ACT Average Composite Scores
Table 4.6
ACT Average Composite Scores Highest Score Shaded
2013 2014 2015 2016 2017
Missoula County 21.0 20.8 20.9 20.9 20.6
Montana 21.3 20.5 20.4 20.3 20.3
United States 20.9 21.0 21.0 20.8 21.0

Raising the Bar: A Competitive Realities Report and Target Industry Strategy for Missoula, Montana | Page 33
Household Income
Household income reflects income for residents regardless of where they work. Missoula County’s household income
distribution has a higher emphasis on lower to middle range income with the highest percentage of households making
$25,000 and under (Figure 5.13, Table 5.7). The County also had the highest percentage of households making $35,000
to $50,000. Missoula County’s median household income in 2016 was $46,550, lower than the state and nation (Figure
5.14). On a positive note, the County grew its higher income brackets between 2011 and 2016 (Figure 5.15).
Figure 5.13 Household Income Distribution, 2016
Table 5.7 Household Income Distribution, 2016
Highest Percentage Shaded
Geography < $10K $10-$15K
$15-$25K
$25-$35K
$35-$50K
$50-$75K
$75-$100K
$100-$150K
$150-$200K
$200K +
Missoula County 7.4% 6.6% 11.1% 10.5% 16.8% 16.0% 11.8% 11.5% 4.1% 4.1%
Montana 6.4% 6.0% 10.7% 11.3% 15.6% 18.6% 12.2% 11.7% 3.8% 3.7%
United States 6.7% 4.8% 9.7% 9.5% 13.0% 17.7% 12.3% 14.0% 5.8% 6.4%
Source: US Census Bureau, Garner Economics
Figure 5.14 Median Household Income, 2016
Figure 5.15
Change in Household Income Distribution Missoula County, 2011-2016

Raising the Bar: A Competitive Realities Report and Target Industry Strategy for Missoula, Montana | Page 34
Personal Income
Earnings for individuals reflect the income for residents
regardless of where they work or others’ earnings in their
household. The data captures individuals ages 16 or over who
are full-time, year-round workers with earnings.
Missoula County’s 2016 average individual income of $50,440
ranks below the state and nation, as was true in 2011 (Table
5.7). Personal income increased 18.2 percent over the five-
year period, a rate just behind Montana but significantly above
the national growth rate.
The 2016 personal income distribution for Missoula County
shows a spike in the $15,000-$25,000 category with 28 percent
of the working population earning an average income in that
range (Figure 5.16).
Table 5.7 Average Personal Income
Highest Relative Figure Shaded
2011 2016 % Change 2011-2016
Missoula County $42,660 $50,440 18.2%
Montana $44,857 $53,137 18.5%
United States $56,405 $62,193 10.3%
Source: US Census Bureau, Garner Economics
Figure 5.16 Missoula County Personal Income Distribution, 2016

Raising the Bar: A Competitive Realities Report and Target Industry Strategy for Missoula, Montana | Page 35
Per Capita Income
Per capita income is the average annual income computed for every man, woman, and
child. It is derived by dividing aggregate income by total population. Per capita income
is a measure for all residents regardless of where they work, their age, or whether they
derive any income.
Missoula County’s 2016 per capita income was $30,103, ranking between the state and
the nation (Table 5.8). Per capita income increased an impressive 25.9 percent over
the past five years.
Poverty
The measurement of poverty in the County helps to evaluate the well-being of its citizens and the state of the economy. Missoula County has a high
poverty rate (16.5 percent) in comparison to the state and the nation (Figure 5.17). Missoula’s poverty rate for children under age 18 is higher than the
state at 18.9 percent. However, this rate is lower than the national rate of 19.5 percent.
Figure 5.17 Population in Poverty
Poverty Rate for Total Population Poverty Rate for Children Under Age 18
Source: US Census Bureau, Garner Economics
Table 5.8 Per Capita Income
Highest Relative Figure Shaded
2011 2016 % Change in Per Capita
Missoula County $23,917 $30,103 25.9%
Montana $23,893 $28,933 21.1%
United States $26,708 $31,128 16.5%
Source: US Census Bureau, Garner Economics

Raising the Bar: A Competitive Realities Report and Target Industry Strategy for Missoula, Montana | Page 36
Crime
Crime rates may seem outside the typical measures of economic competitiveness, but these represent
a widely accepted, objective gauge used by firms. Crime rates may reflect underlying economic
conditions and may signal deeper systemic problems more than standard economic measures show.
Missoula County’s 2016 Property Crime Rate is comparatively high at 3,526.4 crimes reported per
100,000 residents (Table 5.9, Figure 5.18). The Violent Crime Rate is also higher than the state and nation
at 410.7 crimes reported per 100,000 residents. These rates are significantly higher than 2011 rates
(Table 5.10). Any change in reporting standards may affect the rate comparison of 2011 to 2016 crime
figures.
For an unilateral view of crime rates, research is based on crimes reported and published in the FBI
Uniform Crime Report for 2016. Missoula County’s rates include the Missoula County Sheriff’s Office,
City of Missoula Police Department, and the University of Montana Police Department.
Table 5.9 Crime Rates per 100,000 Residents
Lowest Rate Shaded
Table 5.10 Missoula County Crime Rates per 100,000 Residents
Sources: Uniform Crime Reports, FBI, Garner Economics
Property Crime Violent Crime
Crimes Reported
Crime Rate
Crimes Reported
Crime Rate
Missoula County 4,087 3,526.4 476 410.7
Montana 27,976 2,683.5 3,840 368.3
United States 7,919,035 2,450.7 1,248,185 386.3
Property Crime Rate Violent Crime Rate
2011 2,593.0 253.9
2016 3,526.4 410.7
2011-2016 Change 136% 162%
Figure 5.18 Crime Rates per 100,000 Residents

Raising the Bar: A Competitive Realities Report and Target Industry Strategy for Missoula, Montana | Page 37
Cost of Living
Cost of Living indicators for cities reflect the general cost of mid-management level living in that
area. The Cost of Living Index uses the national average of 100 for measuring the cost for a set basket
of goods and services. Missoula County has a higher cost of living than Montana and the nation as
a whole (Table 5.11, Figure 5.19).
The composite Cost-of-Living Index for the City of Missoula is 103 compared with 97 for the state
and 100 for the nation. Missoula mirrors the cost level of the state for all categories under the main
index with the exception of Housing. The Housing index for the Cityof Missoula is estimated at 116.
Table 5.11 Cost of Living Index, 2017
Index Missoula Montana
Cost of Living Index 103 97
Goods & Services Index 101 101
Grocery Index 102 102
Healthcare Index 103 103
Housing Index 116 99
Transportation Index 95 95
Utilities Index 77 77
Source: AreaVibes.com derived from C2ER Index for 2017, Garner Economics
Figure 5.19 2017 Cost of Living Index

Raising the Bar: A Competitive Realities Report and Target Industry Strategy for Missoula, Montana | Page 38
CHAPTER 6: ECONOMIC DYNAMICS & EMPLOYMENT TRENDS
This chapter focuses on the labor market of Missoula County, Montana, beginning with the residents within the County, then exploring
commuting patterns with the surrounding area and the full labor force draw of a 60-minute drive time from the City of Missoula. The data
then transitions to employer-based information, including employment, industry composition, wage comparisons, and additional
workplace statistics for those working in Missoula County.
Labor Force Participation
Among residents aged 16 and over in Missoula County in 2016, 69.4 percent participate in
the labor force, a figure above the state and nation (Table 6.1). The County’s participation
rate in 2011 was the also the highest of the comparative geographies with a participation
rate of 71 percent.
Unfortunately, the County followed the national trend of labor force decline between 2011
and 2016 with a loss of 1.6 percent in its labor force participation (Figure 6.1). Although
the participation rate is dropping, it is doing so at a rate slower than Montana and still
remains well above the state and nation.
Table 6.1 Labor Force Participation Rate
Highest Rate Shaded
2011 2016 Change
2011-2016
Missoula County 71.0% 69.4% -1.6%
Montana 65.5% 63.4% -2.1%
United States 64.0% 63.1% -0.9%
Source: US Census Bureau, Garner Economics
Figure 6.1 Change in Labor Force Participation 2011-2016

Raising the Bar: A Competitive Realities Report and Target Industry Strategy for Missoula, Montana | Page 39
Labor Force Participation—Families1
Among all families in Missoula County, 46.6 percent have two income earners (Married-Couple Families – Dual Income) which is the biggest sector families
in the labor force (Table 6.2, Figure 6.2). The County has the highest share of married families with one income in the Married-Couple Families - Wife in
Labor Force, Husband Not category at 16.1 percent as well as the highest share of Single Female in Labor Force at 13.5 percent. Overall, the participation
rate of families in Missoula County is higher than the state and nation.
Table 6.2 Labor Force Participation of Families 2016
Highest Rate Shaded
Missoula County Montana United States
Married-couple families
Married-Couple Families - Dual Income 46.6% 42.8% 37.2%
Married-couple families - Husband in Labor Force, Wife Not 6.6% 14.0% 16.1%
Married-Couple Families - Wife in Labor Force, Husband Not 7.3% 6.5% 5.8%
Other families
Single Female in Labor Force 12.2% 8.9% 13.5%
Single Males in labor force 5.8% 4.9% 5.8%
Total Families in Labor Force 78.6% 77.1% 78.4%
Figure 6.2
Labor Force Participation of Families, 2016
1 According to the US Census, a family consists of a householder and one or more other people living in the same household who are related to the householder by birth, marriage, or
adoption. Other families include unmarried related persons such as single parents.

Raising the Bar: A Competitive Realities Report and Target Industry Strategy for Missoula, Montana | Page 40
Source: US Census Bureau, Garner Economics
Labor Force
The 2017 labor force of Missoula County was 61,570 according the the Bureau of
Labor Statistics (Table 6.3). The labor force is growing at a rate of 4.1 percent,
though that increase has occurred entirely in the past five years. The five-year rate
of change is higher than the state and nation and is slightly under these
benchmarks when looking at change over 10 years.
Unemployment, shown in Figure 6.3, has been less dramatic than the nation over
the past decade while mirroring the change state-wide. The highest annual
unemployment rate was 7.3 percent in 2010 compared to the United States
unemployment rate of 9.3 percent that same year.
Table 6.3 Labor Force
Highest Rate of Change Shaded
2007 2012 2017 5-year Change
10-Year Change
Missoula County 59,156 59,139 61,579 4.1% 4.1%
Montana 502,070 506,485 525,453 3.7% 4.7%
United States 153,124,000 154,975,000 160,320,000 3.4% 4.7%
Source: Bureau of Labor Statistics, Garner Economics
Labor Force Draw
The effective labor draw considers the documented labor pool for a location based on the existing residential workforce and local road network. The
analysis considers the pool of active workers residing within a representative drive time from a site.
Since mountainous terrain figures into the transportation picture, this study looks at a 60-minute drive time analysis from the City of Missoula to enlarge
the reach of possible commuters. The drive-time area labor force was 71,955 for 2017, a number not significantly larger than the County’s own labor force
number of 61,579 (Figure 6.4). The drive-time area did not cover all of Missoula County and had a narrow reach outside its borders along main highways.
Figure 6.3
Unemployment rate 2007-2017

Raising the Bar: A Competitive Realities Report and Target Industry Strategy for Missoula, Montana | Page 41
The low drive-time unemployment rate of 4.1 percent adds to the improbability of drawing many more workers from the study area.
Figure 6. 4 60-Minute Drive-Time Analysis
Center: City of Missoula
132,076 Population
36.7 Median Age
71,955 Labor Force
69,022 Average Employed
4.1% Unemployment Rate
Source: ESRI, 2017 data, Garner Economics

Raising the Bar: A Competitive Realities Report and Target Industry Strategy for Missoula, Montana | Page 42
College Enrollment & Degrees Granted
As important as the existing workforce, those who will join the ranks of the labor force with degrees
or certifications enhance the opportunity for companies to relocate or expand in the area. Within
Missoula County, the University of Montana provides a large resource of students for the future work
force. Missoula College, the two-year unit of the University, is home to occupational and technical
educational opportunities to gain skills.
Total enrollment for the Fall of 2017 at the University of Montana was 11,865 students (Figure 6.5).
Enrollment has decreased over the past five years, mainly in the undergraduate and Missoula College
areas (Figure 6.6, Table 6.4).
Figure 6.6 Fall Enrollment at University of Montana by Type
Table 6.4 Fall Enrollment at University of Montana
Type of Enrollment 2013 2014 2015 2016 2017
Undergraduate 9,787 9,447 8,732 7,987 7,550
Graduate 2,018 2,008 2,030 2,110 2,326
School of Law 253 252 237 232 216
Missoula College 2,467 2,245 2,045 2,090 1,773
Total Enrollment 14,525 13,952 13,044 12,419 11,865
Source: University of Montana Office of Institutional Research, Garner Economics
Figure 6.5 Fall Enrollment at University of Montana
Source: University of Montana Office of Institutional Research
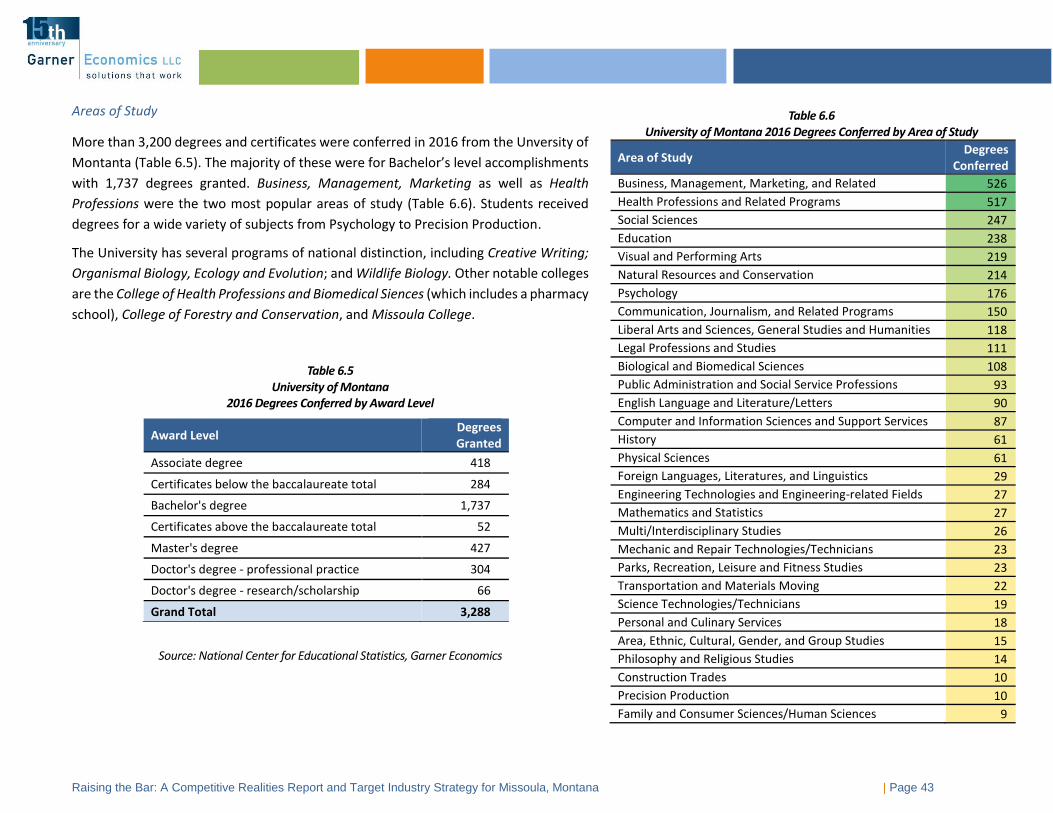
Raising the Bar: A Competitive Realities Report and Target Industry Strategy for Missoula, Montana | Page 43
Areas of Study
More than 3,200 degrees and certificates were conferred in 2016 from the Unversity of
Montanta (Table 6.5). The majority of these were for Bachelor’s level accomplishments
with 1,737 degrees granted. Business, Management, Marketing as well as Health
Professions were the two most popular areas of study (Table 6.6). Students received
degrees for a wide variety of subjects from Psychology to Precision Production.
The University has several programs of national distinction, including Creative Writing;
Organismal Biology, Ecology and Evolution; and Wildlife Biology. Other notable colleges
are the College of Health Professions and Biomedical Siences (which includes a pharmacy
school), College of Forestry and Conservation, and Missoula College.
Table 6.5 University of Montana
2016 Degrees Conferred by Award Level
Source: National Center for Educational Statistics, Garner Economics
Award Level Degrees Granted
Associate degree 418
Certificates below the baccalaureate total 284
Bachelor's degree 1,737
Certificates above the baccalaureate total 52
Master's degree 427
Doctor's degree - professional practice 304
Doctor's degree - research/scholarship 66
Grand Total 3,288
Table 6.6 University of Montana 2016 Degrees Conferred by Area of Study
Area of Study Degrees
Conferred
Business, Management, Marketing, and Related 526
Health Professions and Related Programs 517
Social Sciences 247
Education 238
Visual and Performing Arts 219
Natural Resources and Conservation 214
Psychology 176
Communication, Journalism, and Related Programs 150
Liberal Arts and Sciences, General Studies and Humanities 118
Legal Professions and Studies 111
Biological and Biomedical Sciences 108
Public Administration and Social Service Professions 93
English Language and Literature/Letters 90
Computer and Information Sciences and Support Services 87
History 61
Physical Sciences 61
Foreign Languages, Literatures, and Linguistics 29
Engineering Technologies and Engineering-related Fields 27
Mathematics and Statistics 27
Multi/Interdisciplinary Studies 26
Mechanic and Repair Technologies/Technicians 23
Parks, Recreation, Leisure and Fitness Studies 23
Transportation and Materials Moving 22
Science Technologies/Technicians 19
Personal and Culinary Services 18
Area, Ethnic, Cultural, Gender, and Group Studies 15
Philosophy and Religious Studies 14
Construction Trades 10
Precision Production 10
Family and Consumer Sciences/Human Sciences 9

Raising the Bar: A Competitive Realities Report and Target Industry Strategy for Missoula, Montana | Page 44
Commuting Patterns
Worker flows help define the size of a local economy’s labor draw, and trends help describe
attraction and regional competition. Worker flows represent both daily commuters and
short-term, away-from-home assignments (major construction projects, on-site consulting,
etc.).
Missoula County retains a majority of its residents for work within the County. In 2015, more
than 40,000 Missoula County residents lived and worked in the County (Figure 6.7). Only
7,818 residents commuted to jobs outside of the County while nearly 14,000 commuters
came into the county for work.
Commuting patterns have not altered a great deal over the past decade, however a slight
decline with both In-Commuters and Out-Commuters from 2014 to 2015 seems to have been
matched with an uptick in residents staying in the County for work (Figure 6.8).
Figure 6.7 Missoula County 2015 Commuting Patterns
*The U.S. Census Bureau counts one primary job per worker. Source: U.S. Census Bureau, Longitudinal Employer-Household Dynamics (LEHD), Garner Economics
In-Commuters into Missoula County
Of the workers employed in the county, 26% came from outside.
Of the residents working in 2015, 16% commuted to jobs outside the county.
Live in Missoula County and Commute to Jobs Outside
40,071
Missoula County Residents Live and
Work in County
13,844
7,818
Figure 6.8 Missoula County Commuting Patterns, 2002-2015
Figure 6.9
18.7 Average Travel Time to Work
Missoula County, 2016
Source: US Census Bureau

Raising the Bar: A Competitive Realities Report and Target Industry Strategy for Missoula, Montana | Page 45
In-Commuter and Out-Commuter Counties
The majority of commuting is between Ravalli County, Lewis and Clark County, and Flathead County. In-Commuters primarily travel from Ravalli County
with 3,535 reported in 2015 to work in Missoula County (Figure 6.10). Out-Commuter travel is more distributed among the three counties mentioned
above (Figure 6.11).
Figure 6.10 Figure 6.11 Missoula County In-Commuters, 2015 Missoula County Out-Commuters, 2015
Source: U.S. Census Bureau, Longitudinal Employer-Household Dynamics (LEHD), Garner Economics

Raising the Bar: A Competitive Realities Report and Target Industry Strategy for Missoula, Montana | Page 46
Estimated Annual Wages
In 2017, the estimated average wage per job in Missoula County equaled $38,755 (Figure
6.12), or $745 weekly. It should be noted that wage applies only to employment in
Missoula County and does not measure wages for those workers who live in the County
but commute elsewhere to work (See “Commuting” earlier in Chapter 5). The annual
average earnings for all County residents, whether they stay in the County for work or
out-commute, is $50,440 for 2016 (See Personal Income in Chapter 4).
Missoula County’s average annual wage is the lowest among the benchmark geographies
for both 2012 and 2017 (Table 6.7). Wages grew 13.4 percent over the past five years,
which was higher than the national growth rate but below Montana’s rate. Adjusted for
inflation, Missoula County followed the state and national trend of modest wage growth
from 2011 to 2017 (Figure 6.13).
Figure 6.13 Annual Wages Adjusted for Inflation
Source: EMSI, Garner Economics
Figure 6.12 Estimated Annual Average Wages
Table 6.7
Average Wages 2012-2017 Highest Figure Shaded
2012 2017 #
Change %
Change
Missoula County $34,179 $38,755 $4,576 13.4%
Montana $34,381 $39,713 $5,332 15.5%
United States $46,905 $52,284 $5,379 11.5%

Raising the Bar: A Competitive Realities Report and Target Industry Strategy for Missoula, Montana | Page 47
Major Industry Sector Composition
A comparison of major industry employment composition provides a broad relative assessment of differences among economies. Missoula County’s largest
sector of employment in 2017 was Government with 17.3 percent of the total employment (Table 6.8). Total employment, for this study, includes covered
and uncovered employment as well as self-employed individuals.
The three additional sectors with over ten percent of employment are Health Care & Social Assistance (15.8 percent), Retail Trade (12.8 percent), and
Accommodation & Food Services (10.4 percent). Missoula County has a larger proportion of its workforce in these sectors compared to the state and
nation. The top four employment sectors rank exactly the same for the state and nation, then begin to differ for the remainder of industries.
Table 6.8 2017 Industry Sector Composition
Highest Relative Figure Shaded
Industry Sector Missoula County Montana United States
Government 17.3% 18.5% 15.4%
Health Care & Social Assistance 15.8% 13.3% 12.6%
Retail Trade 12.8% 11.6% 10.3%
Accommodation & Food Services 10.4% 10.1% 8.6%
Construction 5.9% 7.7% 5.5%
Professional, Scientific & Technical Services 5.7% 5.0% 6.4%
Other Services 5.5% 4.9% 4.8%
Administrative & Support & Waste Management & Remediation 5.2% 3.9% 6.2%
Manufacturing 3.4% 3.9% 7.9%
Finance & Insurance 3.1% 3.0% 3.9%
Wholesale Trade 3.0% 3.3% 3.8%
Transportation & Warehousing 2.9% 3.1% 3.5%
Arts, Entertainment & Recreation 2.6% 2.5% 1.7%
Real Estate, Rental & Leasing 1.7% 1.5% 1.7%
Information 1.7% 1.3% 1.9%
Agriculture, Forestry, Fishing & Hunting 1.2% 2.9% 1.2%
Educational Services 1.1% 1.3% 2.6%
Management of Companies & Enterprises 0.4% 0.4% 1.4%
Utilities 0.2% 0.6% 0.4%
Mining, Quarrying, Oil & Gas Extraction 0.0% 1.2% 0.4%
Source: EMSI, Garner Economics

Raising the Bar: A Competitive Realities Report and Target Industry Strategy for Missoula, Montana | Page 48
New Firm Startups
Tracking the rate of startup firms is another good measure of the entrepreneurial ecosystem of an area. The ability to create a new company establishes
new jobs and helps bolster the local economy. Additionally, new firms contribute disproportionately to job creation and have an important role in
employment growth.
Startup activity is viewed by both start-up rate and employment by new firms. Measuring startups relative to population—number of new firms per
100,000 people—helps to compare relative activity across different areas. Missoula County had a higher rate compared to the nation and generally trended
similarly to Montana (Figure 6.14). In 2013, the latest year available, Missoula County was slightly higher than Montana.
Another indicator to consider is the employment created by new firms. At the local level, the number of people employed at firms which were newly
established (0-1 year-old) illustrate how startups add to the economy. Missoula County is increasing the number of people employed by new firms since
2013 and again is trending with Montana (Figure 6.15).
Figure 6.14 Figure 6.15 Number of Startups per 100,000 Population Employment at New Firms
Source: US Census Bureau, Business Dynamics Statistics, Garner Economics Source: US Census Bureau, LEHD, Garner Economics

Raising the Bar: A Competitive Realities Report and Target Industry Strategy for Missoula, Montana | Page 49
Self-Employment
Measuring the proportion of persons who are self-employed is a rough
means of guaging entrepreneurial activity, which, in turn, can provide a
view of local risk-taking and economic dynamism.
As of 2016, 12 percent of workers in Missoula County were self-employed
(Table 6.9, Figure 6.16). The proportion is below the state self-employment
level although above the national rate.
Of those self-employed, a much higher share is in the category of Not
Incorporated, which includes unpaid family workers, for all geographies
versus Incorporated ventures. All geographies reviewed in this report
declined in self-employment over the past five years, with Missoula County
dropping only 0.3 percent.
Table 6.9 Self-Employed as a Percentage of Workers 16 Years +
(Highest Relative Number Shaded)
Geography Self-Employed - Incorporated
Self-Employed - Not Incorporated
Total Self-Employed 2011
Self-Employed - Incorporated
Self-Employed - Not Incorporated
Total Self-Employed 2016
Change in Self-Employment
Self-Employed 2011 Self-Employed 2016 2011-2016
Missoula County 4.7% 7.6% 12.3% 4.8% 7.2% 12.0% -0.3%
Montana 5.4% 10.5% 15.9% 5.8% 9.5% 15.3% -0.6%
United States 3.6% 6.6% 10.2% 3.5% 6.2% 9.7% -0.5%
Source: U.S. Census Bureau American Community Survey (5-Year Averages compared); Garner Economics
Figure 6.16 Self-Employed as a Percentage of Workers 16 Years +

Raising the Bar: A Competitive Realities Report and Target Industry Strategy for Missoula, Montana | Page 50
Source: U.S. Census Bureau American Community Survey (5-Year Averages compared); Garner Economics
Broadband Availability
Broadband access and speed have a big impact on the local economy in
terms of supporting business, entrepreneurship, and educational
opportunities.
According to BroadbandNow, a national aggregator of internet access and
speeds, Missoula County has good access to broadband internet with
speeds up to 1,000 megabits per second, or mbps. More than 87.9 percent
of households have access to broadband internet that is at least 100 mbps,
which is higher than the state (Table 6.10).
Average download speed for the county is 17.95 mbps which is slightly
higher than the state, but well behind the nation (Figure 6.17). Two
providers advertise the availability of one gigabit service in the City of
Missoula, which does have parts of the city reporting download speeds of
56.02 mbps.
Table 6.10 2017 Broadband Access & Speed Available Percent of Population
Missoula Montana
2017 Broadband Access (25 mbps or faster) 88.4% 71.7%
2017 Broadband Access (100 mbps or faster) 87.9% 62.7%
2017 Broadband Access (1 gigabit) 0.3% 1.9%
Figure 6.17
Average Download Speed
Source: BROADBANDNOW, 2017

Raising the Bar: A Competitive Realities Report and Target Industry Strategy for Missoula, Montana | Page 51
Airport Service
The primary airport serving the area is the Missoula International Airport
(MSO). MSO offers nonstop service to 12 destinations, several which are
seasonal, and one new flight to Dallas-Fort Worth set to begin in June of
2018. A Small Community Air Service Development Grant with a local match
was obtained to fund a Minimum Revenue Guarantee for an airline to start
the Dallas-Fort Worth flight. Six commercial airlines and three cargo
companies serve the airport.
In 2016, MSO had 381,582 passenger emplanements, ranking it 138th
among all US airports in terms of passenger traffic. (Table 6.11). Measuring
passenger enplanements, MSO is the 3rd busiest airport in Montana behind
Bozeman and Billings. Passenger traffic at MSA has experienced a dramatic
increase since 2013 and an overall growth of 30.5 percent over ten years
(Figure 6.18). For comparison, nationwide change for all commercial service
airports declined 44 percent over the same period.
Table 6.11 Figure 6.17
Missoula International Airport Overview Passenger Enplanements at MSO, 2006-2016
Source: Missoula International Airport Web Site Source: Bureau of Transportation Statistics, Garner Economics
Airport Missoula International
Airport
Code MSO
Runways 2
Longest Runway (ft) 9,501
ILS Yes
Acreage 2,700
Commercial Passenger Airlines Serving Airport 6
Air Cargo Serving Airport 3
Non-Stop Destination 12
2016 U.S. Rank (Passenger) 138

Raising the Bar: A Competitive Realities Report and Target Industry Strategy for Missoula, Montana | Page 52
CHAPTER 7: RETAIL ANALYSIS
To determine specific industries with retail potential, a retail leakage, or gap analysis, was conducted. Leakage in an area represents a
condition where demand exceeds supply. In other words, retailers outside the market area are fulfilling the demand for retail products,
and demand is therefore "leaking" out of the trade area. If leakage is high, the County could potentially support more businesses in that
area.
Missoula County has robust retails sales
exceeding demand for the residents of the
County. The County’s 2017 retail sales were
estimated to be $2.3 billion for retail trades,
food, and drink sales. The County has a Retail
Surplus of $753 million dollars, shown on the
right side of Figure 7.1. This is the difference
between retail demand, or the “Retail
Potential,” and actual retail sales. This means
that Missoula County performs rather well in
fulfilling market demand and attracting non-
resident shoppers.
A review of 13 major retail categories reveals
that only one category has a retail gap of two
million dollars—Health and Personal Care
Stores, shown on the bottom of Figure 7.1.
Top sales categories for Missoula County are
Motor Vehicle & Parts Dealers, Gasoline
Stations, and General Merchandise Stores
(Figure 7.1, Table 7.1).
Surprisingly, Nonstore Retail, which is often the
category with the largest leakage, has a retail
surplus for Missoula County. This category
accounts for digital commerce/internet-based
retail, vending, fuel dealers, and other direct
sales establishments.
Figure 7.1 2017 Missoula County Retail Surplus/Leakage
Source: ESRI Retail MarketPlace Profile, Garner Economics
Retail Leakage | Retail Surplus

Raising the Bar: A Competitive Realities Report and Target Industry Strategy for Missoula, Montana | Page 53
Table 7.1
2017 Retail Sales and Leakage in Missoula County
Industry Group NAICS Demand
(Retail Potential) Supply
(Retail Sales) Retail Gap/Surplus Businesses
Motor Vehicle & Parts Dealers 441 $302,543,596 $526,252,096 $223,708,500 120
Automobile Dealers 4411 $241,041,566 $383,598,107 $142,556,541 59
Other Motor Vehicle Dealers 4412 $32,203,927 $97,106,916 $64,902,989 25
Auto Parts, Accessories & Tire Stores 4413 $29,298,103 $45,547,073 $16,248,970 36
Furniture & Home Furnishings Stores 442 $45,171,030 $58,252,892 $13,081,862 67
Furniture Stores 4421 $28,126,824 $32,661,231 $4,534,407 32
Home Furnishings Stores 4422 $17,044,206 $25,591,661 $8,547,455 35
Electronics & Appliance Stores 443 $44,487,641 $57,976,332 $13,488,691 34
Bldg. Materials, Garden Equip. & Supply Stores 444 $88,992,737 $128,244,499 $39,251,762 72
Bldg. Material & Supplies Dealers 4441 $80,125,453 $117,786,072 $37,660,619 54
Lawn & Garden Equip & Supply Stores 4442 $8,867,284 $10,458,427 $1,591,143 18
Food & Beverage Stores 445 $207,276,774 $253,625,990 $46,349,216 60
Grocery Stores 4451 $187,139,971 $212,203,356 $25,063,385 31
Specialty Food Stores 4452 $8,872,461 $5,728,111 ($3,144,350) 21
Beer, Wine & Liquor Stores 4453 $11,264,342 $35,694,523 $24,430,181 8
Health & Personal Care Stores 446,4461 $76,355,546 $74,156,149 ($2,199,397) 64
Gasoline Stations 447,4471 $188,223,811 $325,516,377 $137,292,566 52
Clothing & Clothing Accessories Stores 448 $58,587,375 $72,951,509 $14,364,134 95
Clothing Stores 4481 $37,577,704 $55,101,745 $17,524,041 65
Shoe Stores 4482 $5,732,234 $8,792,187 $3,059,953 9
Jewelry, Luggage & Leather Goods Stores 4483 $15,277,437 $9,057,577 ($6,219,860) 21
Sporting Goods, Hobby, Book & Music Stores 451 $88,979,030 $117,565,213 $28,586,183 84
Sporting Goods/Hobby/Musical Instr Stores 4511 $83,645,597 $93,869,063 $10,223,466 72
Book, Periodical & Music Stores 4512 $5,333,433 $23,696,150 $18,362,717 12

Raising the Bar: A Competitive Realities Report and Target Industry Strategy for Missoula, Montana | Page 54
Industry Group NAICS Demand
(Retail Potential) Supply
(Retail Sales) Retail Gap Businesses
General Merchandise Stores 452 $295,411,338 $422,771,609 $127,360,271 23
Department Stores Excluding Leased Depts. 4521 $183,565,200 $231,644,724 $48,079,524 15
Other General Merchandise Stores 4529 $111,846,138 $191,126,885 $79,280,747 8
Miscellaneous Store Retailers 453 $58,674,577 $66,142,227 $7,467,650 130
Florists 4531 $3,571,475 $1,243,493 ($2,327,982) 13
Office Supplies, Stationery & Gift Stores 4532 $16,887,278 $19,033,594 $2,146,316 32
Used Merchandise Stores 4533 $11,305,817 $6,293,060 ($5,012,757) 27
Other Miscellaneous Store Retailers 4539 $26,910,007 $39,572,080 $12,662,073 58
Nonstore Retailers 454 $5,662,341 $11,530,775 $5,868,434 12
Electronic Shopping & Mail-Order Houses 4541 $2,928,869 $10,524,757 $7,595,888 9
Vending Machine Operators 4542 $503,615 $187,852 ($315,763) 1
Direct Selling Establishments 4543 $2,229,857 $818,166 ($1,411,691) 2
Food Services & Drinking Places 722 $150,852,148 $250,116,247 $99,264,099 318
Special Food Services 7223 $1,164,650 $3,443,765 $2,279,115 17
Drinking Places - Alcoholic Beverages 7224 $8,743,842 $53,951,243 $45,207,401 31
Restaurants/Other Eating Places 7225 $140,943,656 $192,721,239 $51,777,583 270
Source: ESRI Retail MarketPlace Profile, Garner Economics
Note: Industries belonging to NAICS 722 (Food Services and Drinking Places) have been included as a convenience. Technically, these are not retail industries. Retail leakage is the value of retail goods that shoppers from your region buy from other regions. The "Demand" column represents the total amount that your residents spend on a particular industry, while the "Leakage" column represents how much of that spending happens outside of the region.

Raising the Bar: A Competitive Realities Report and Target Industry Strategy for Missoula, Montana | Page 55
CHAPTER 8: LOCAL SPECIALIZATION, COMPETITIVENESS & GROWTH
The following section provides a more detailed and in-depth assessment of the Missoula County economy. The analysis examines the local
economy from several different perspectives, each adding a supporting layer of information. The assessment’s main goals are to provide historic
context, reveal areas of unique specialization, gauge competitiveness, and help uncover emerging trends and opportunities. The two main
areas of analysis are major industries and occupational groups. For each area, there are relative measures of specialization, growth, local
competitiveness, and earnings.
Major Industry Sector Change
The largest absolute industry job gains in
Missoula County between 2012 and 2017
came from Accommodation & Food
Services (gaining 900 jobs) followed
closely by Health Care & Social Assistance
(adding 894 jobs) (Figure 8.1, Table 8.1).
Overall, Missoula County shows a net
increase of 5,151 jobs taking into
consideration covered, non-covered, and
self-employed individuals.
Gains were made in the majority of
industry categories with job losses
occuring mostly in the Administrative,
Support, Waste Management &
Remediation Services sector (-608 jobs).
Moderate losses occurred in the
following sectors: Transportation &
Warehousing; Management of
Companies; Mining, Quarying, Oil & Gas
Extraction; and Utilities.
Figure 8.1
2012-2017 Employment Change by Major Industry
Sorted by Absolute Change
Source: ESRI, Garner Economics

Raising the Bar: A Competitive Realities Report and Target Industry Strategy for Missoula, Montana | Page 56
Table 8.1 Missoula County Employment Change by Major Industry, 2012–2017
Sorted by Absolute Change
Description 2012 Jobs
2017 Jobs
2012-2017 Job Change
% Change 2012-2017
United States
% Change 2012-2017
Accommodation & Food Services 6,114 7,013 900 14.7% 14.2%
Health Care & Social Assistance 9,682 10,576 894 9.2% 10.6%
Construction 3,241 3,972 731 22.6% 15.6%
Government 11,004 11,618 613 5.6% 1.6%
Professional, Scientific & Technical Services 3,284 3,845 561 17.1% 12.0%
Other Services 3,150 3,677 527 16.7% -0.2%
Retail Trade 8,060 8,566 506 6.3% 6.2%
Manufacturing 1,935 2,295 360 18.6% 3.6%
Finance & Insurance 1,858 2,054 196 10.6% 4.8%
Wholesale Trade 1,843 2,036 193 10.5% 3.4%
Real Estate, Rental & Leasing 980 1,141 161 16.4% 10.1%
Agriculture, Forestry, Fishing & Hunting 652 774 123 18.8% 2.6%
Arts, Entertainment & Recreation 1,670 1,772 102 6.1% 13.7%
Educational Services 695 754 59 8.5% 8.9%
Information 1,131 1,135 4 0.3% 5.3%
Utilities 169 163 -6 -3.6% 1.6%
Mining, Quarrying, Oil & Gas Extraction 60 26 -34 -56.5% -
24.2%
Management of Companies & Enterprises 310 272 -38 -12.1% 12.7%
Transportation & Warehousing 2,066 1,971 -95 -4.6% 15.8%
Administrative, Support, Waste Management & Remediation
4,088 3,479 -608 -14.9% 11.7%
Grand Total 61,991 67,141 5,151 90.4%
Source: EMSI, Garner Economics

Raising the Bar: A Competitive Realities Report and Target Industry Strategy for Missoula, Montana | Page 57
Industry Earnings
A comparison of Missoula County’s average
industry earnings to national averages
offers insights into areas of unique
expertise and cost-saving opportunities.
Overall, the average earnings per job in the
county were $38,755 in 2017 which is 25.9
percent below the national average of
$52,284 (Table 8.2, Figure 8.2).
Earnings in the County are below national
averages for all major employment sectors
with the exception of Agriculture, Forestry,
Fishing & Hunting, which was higher than
the national average by more than 50
percent.
Table 8.2 2017 Average Annual Industry Salary Comparison
Average Wages Above National Level Shaded
NAICS Description 2017 County
Wages 2017 U.S.
Wages Percent
Difference
11 Agriculture, Forestry, Fishing & Hunting $47,939 $31,881 50.4%
21 Mining, Quarrying, Oil & Gas Extraction $58,050 $102,114 -43.2%
22 Utilities $86,138 $105,626 -18.4%
23 Construction $40,838 $53,602 -23.8%
31 Manufacturing $39,033 $65,962 -40.8%
42 Wholesale Trade $54,558 $74,625 -26.9%
44 Retail Trade $28,624 $30,781 -7.0%
48 Transportation & Warehousing $47,836 $51,466 -7.1%
51 Information $51,505 $98,989 -48.0%
52 Finance & Insurance $66,009 $102,241 -35.4%
53 Real Estate, Rental & Leasing $33,280 $52,306 -36.4%
54 Professional, Scientific & Technical Services $53,436 $86,092 -37.9%
55 Management of Companies & Enterprises $85,751 $118,309 -27.5%
56 Administrative, Support, Waste Management & Remediation
$32,081 $37,170 -13.7%
61 Educational Services $20,411 $39,553 -48.4%
62 Health Care & Social Assistance $46,650 $48,555 -3.9%
71 Arts, Entertainment & Recreation $19,042 $34,103 -44.2%
72 Accommodation & Food Services $17,238 $20,577 -16.2%
81 Other Services $25,646 $29,153 -12.0%
90 Government $44,492 $52,971 -16.0% All Industry Total $38,755 $52,284 -25.9%
Source: ESRI, Garner Economics
Raising the Bar: A Competitive Realities Report and Target Industry Strategy for Missoula, Montana | Page 58
Figure 8.2 2017 Average Annual Industry Salary Comparison
Source: EMSI, Garner Economics
U.S. Average Wage

Raising the Bar: A Competitive Realities Report and Target Industry Strategy for Missoula, Montana | Page 59
Major Occupational Change
Over the last five years, all but one major
occupational categories in Missoula
County added jobs. The largest job gains
were in Food Preparation & Serving
Related, gaining 741 jobs (Figure 8.3, Table
8.3).
Other sectors with strong growth include
Construction & Extraction, adding 519
jobs; Office and Administrative Support,
gaining 472 jobs; and Building & Grounds
Cleaning & Maintenance, growing by 414
jobs.
Other occupational groups adding at least
300 jobs over the past five years include
Personal Care & Service (+ 372 jobs), Sales
& Related (+ 353 jobs), and the well-paying
Healthcare Practitioners & Technical,
which gained 321 jobs.
One occupational category lost jobs—
Military jobs declined by 22 in the County
between 2012 and 2017.
Figure 8.3
2012-2017 Employment Change by Major Occupational Groups
Sorted by Absolute Change
Source: ESRI, Garner Economics
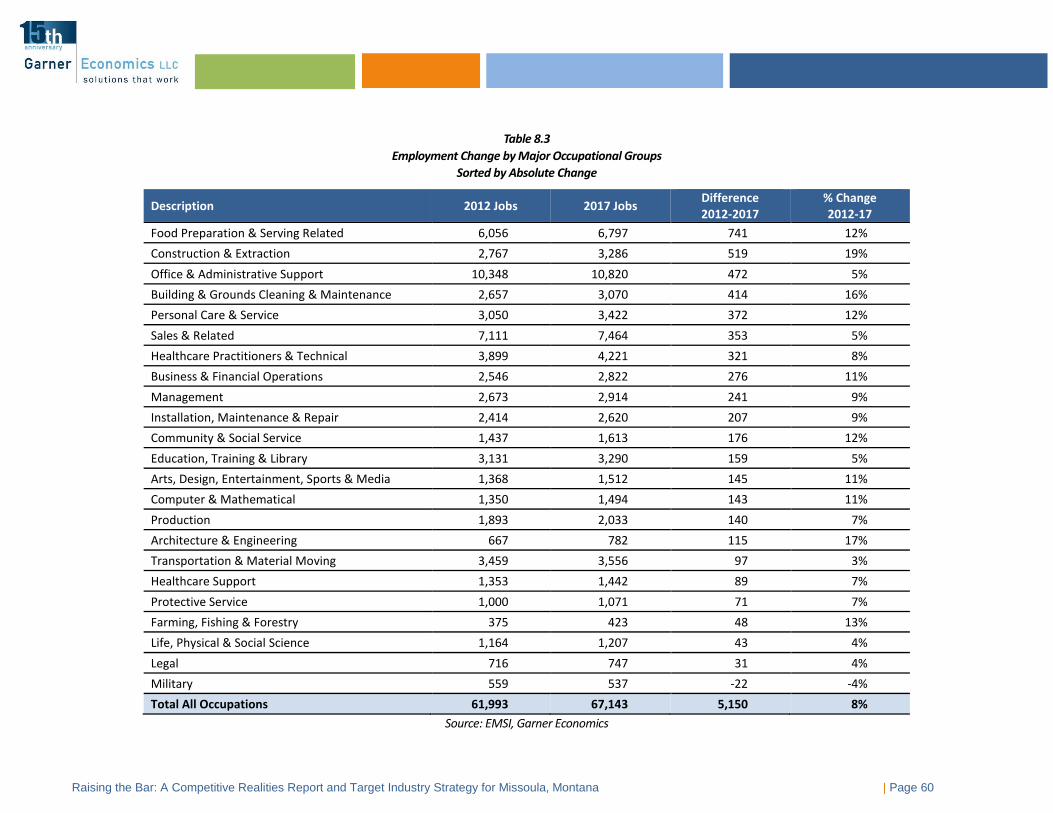
Raising the Bar: A Competitive Realities Report and Target Industry Strategy for Missoula, Montana | Page 60
Table 8.3
Employment Change by Major Occupational Groups
Sorted by Absolute Change
Description 2012 Jobs 2017 Jobs Difference 2012-2017
% Change 2012-17
Food Preparation & Serving Related 6,056 6,797 741 12%
Construction & Extraction 2,767 3,286 519 19%
Office & Administrative Support 10,348 10,820 472 5%
Building & Grounds Cleaning & Maintenance 2,657 3,070 414 16%
Personal Care & Service 3,050 3,422 372 12%
Sales & Related 7,111 7,464 353 5%
Healthcare Practitioners & Technical 3,899 4,221 321 8%
Business & Financial Operations 2,546 2,822 276 11%
Management 2,673 2,914 241 9%
Installation, Maintenance & Repair 2,414 2,620 207 9%
Community & Social Service 1,437 1,613 176 12%
Education, Training & Library 3,131 3,290 159 5%
Arts, Design, Entertainment, Sports & Media 1,368 1,512 145 11%
Computer & Mathematical 1,350 1,494 143 11%
Production 1,893 2,033 140 7%
Architecture & Engineering 667 782 115 17%
Transportation & Material Moving 3,459 3,556 97 3%
Healthcare Support 1,353 1,442 89 7%
Protective Service 1,000 1,071 71 7%
Farming, Fishing & Forestry 375 423 48 13%
Life, Physical & Social Science 1,164 1,207 43 4%
Legal 716 747 31 4%
Military 559 537 -22 -4%
Total All Occupations 61,993 67,143 5,150 8%
Source: EMSI, Garner Economics

Raising the Bar: A Competitive Realities Report and Target Industry Strategy for Missoula, Montana | Page 61
Occupational Earnings
A comparison of the same-occupation average
hourly earnings for Missoula County to the national
median wage revealed no occupations that were
higher than or equal to the national average (Table
8.4, Figure 8.4).
Occupational wages in Missoula County were
somewhat in line with national averages with all
pay comparisons under 40 percent difference. Pay
levels range from three percent under for
Protective Service positions to 36 percent under for
Computer & Mathematical jobs.
The average wage for all occupations in Missoula
County was $18.91 compared to $23.21 for the
national average hourly wage, a 19 percent
difference.
Table 8.4 2017 Average Hourly Wage Comparison
Average Wages Above National Level Shaded
SOC Description 2017 County
Wages 2017 U.S.
Wages Percent
Difference
11-0000 Management $38.21 $50.68 -25%
13-0000 Business & Financial Operations $27.47 $35.60 -23%
15-0000 Computer & Mathematical $26.65 $41.54 -36%
17-0000 Architecture & Engineering $29.39 $40.18 -27%
19-0000 Life, Physical & Social Science $24.39 $35.06 -30%
21-0000 Community & Social Service $17.48 $22.50 -22%
23-0000 Legal $33.44 $48.53 -31%
25-0000 Education, Training & Library $19.98 $25.68 -22%
27-0000 Arts, Design, Entertainment, Sports & Media $18.01 $25.03 -28%
29-0000 Healthcare Practitioners & Technical $35.04 $38.34 -9%
31-0000 Healthcare Support $13.62 $14.58 -7%
33-0000 Protective Service $21.39 $21.97 -3%
35-0000 Food Preparation & Serving Related $10.51 $11.47 -8%
37-0000 Building & Grounds Cleaning & Maintenance $12.07 $12.92 -7%
39-0000 Personal Care & Service $11.16 $12.08 -8%
41-0000 Sales & Related $16.64 $19.53 -15%
43-0000 Office & Administrative Support $15.19 $17.91 -15%
45-0000 Farming, Fishing & Forestry $17.22 $12.98 33%
47-0000 Construction & Extraction $19.54 $21.74 -10%
49-0000 Installation, Maintenance & Repair $18.56 $21.88 -15%
51-0000 Production $15.72 $17.83 -12%
53-0000 Transportation & Material Moving $16.17 $17.30 -7%
Total All Occupations $18.91 $23.21 -19%
Source: ESRI, Garner Economics
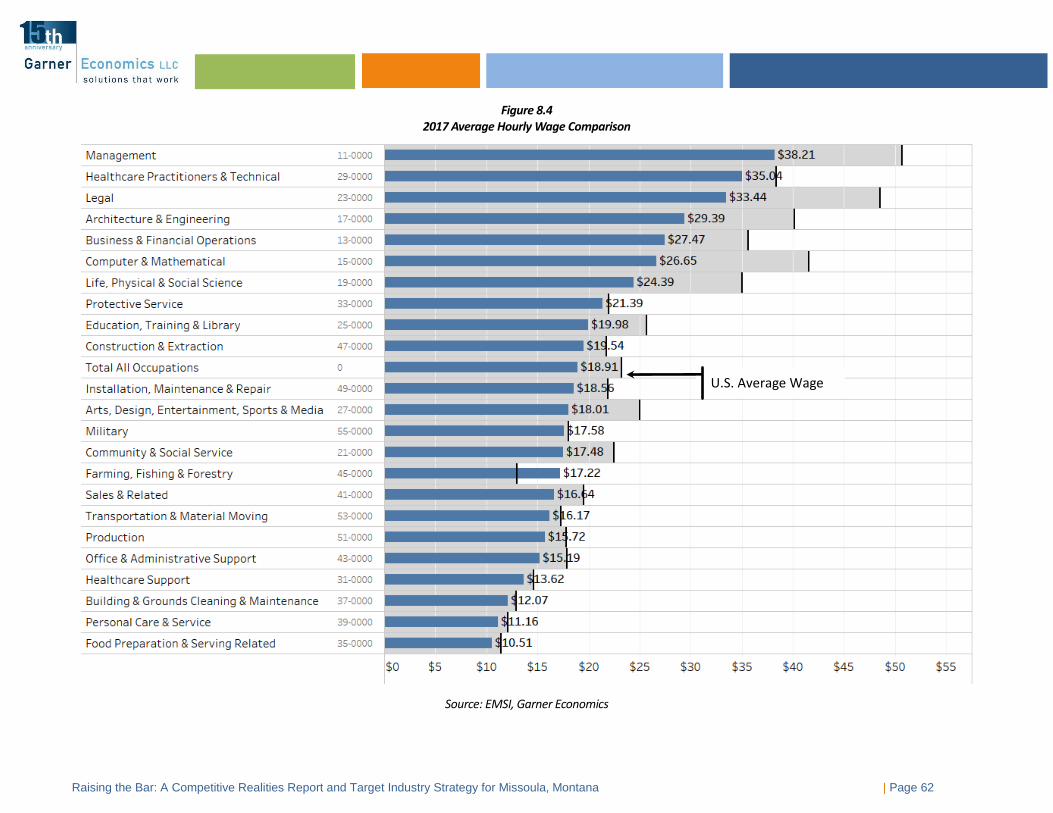
Raising the Bar: A Competitive Realities Report and Target Industry Strategy for Missoula, Montana | Page 62
Figure 8.4 2017 Average Hourly Wage Comparison
Source: EMSI, Garner Economics
U.S. Average Wage

Raising the Bar: A Competitive Realities Report and Target Industry Strategy for Missoula, Montana | Page 63
The following assessment tools include a series of bubble/scatter charts and tables. Axis and quadrant labels should be read as general guides resulting from
purely quantitative analysis, not definitive conclusions. Each chart or table is meant as only one piece of a multiple-part analysis. To assist the reader in
interpreting the bubble charts, each axis and quadrant is labeled with broad descriptives.
To measure local specialization, location quotients (LQs) for each occupation or industry are calculated. LQs are ratios of an area's distribution of employment for a specific occupation/industry compared to a reference or base area's distribution. In this analysis, the reference area is the United States. If an LQ is equal to 1, then the industry has the same share of its area employment as it does in the reference area. An LQ greater than 1 indicates an industry with a greater share of the local area employment than is the case in the reference area and implies local specialization. LQs are calculated by first dividing local industry employment by the all-industry total of local employment. Second, reference area industry employment is divided by the all-industry total for the reference area. Finally, the local ratio is divided by the reference area ratio.
Chart axis definitions:
• Specialization: Measured using location quotient (LQ). Reflects the level of relative concentration of a particular occupation/industry to the nation. In simple terms, a high LQ (above 1.2) indicates what a local economy is good at doing and implies there are unique skills, institutions, raw materials, etc., that support this position.
• Industry Effect: The portion of growth/decline attributed to a particular industry nationwide. For example, if hospital employment grew by 5 percent nationwide in 2011, we would expect to see the same percentage increase locally, assuming that the forces driving nationwide growth would have a similar local impact.
• Local Effect: The proportion of growth/decline not captured by the industry effect, indicating unique local performance. The local effect measures local activity outside the expected nationwide trend. A consistent positive local competitive effect signals superior local performance.
Chart quadrant label definitions:
At-Risk: Locally specialized and recent local job losses.
Declining: Not locally specialized and recent local job losses.
Competitive: Locally specialized and recent local job gains.
Emerging: Not locally specialized and recent local job gains.
• Local Decline/National Growth: Industry or occupation gains nationwide and local losses or gains below nationwide trend.
• Local Growth/National Growth: Industry or occupation gains nationwide and positive local gains or losses less than nationwide trend.
• Local Growth/National Decline: Industry or occupation losses nationwide and positive local gains or losses less than nationwide trend.
• Local Decline/National Decline: Industry or occupation losses nationwide and local losses or gains below nationwide trend.
Detailed industry and occupational information can be found in the Appendices.

Raising the Bar: A Competitive Realities Report and Target Industry Strategy for Missoula, Montana | Page 64
Major Industry Sector Specialization & Growth
Major industry sector specialization focuses on the geographic
concentrations of similarly classified industries. For many
industry sectors there exist interconnections between
suppliers, occupations, and associated supporting institutions.
Eight industries sectors have a local specialization above one
and experienced job growth in the past five years in Missoula
County (Table 8.5; Figure 8.5). These comprise the Competitve
category and are:
• Arts, Entertainment & Recreation (1.54 LQ)
• Health Care & Social Assistance (1.25 LQ)
• Retail Trade (1.24 LQ)
• Accommodation & Food Services (1.22 LQ)
• Other Services (1.14 LQ)
• Government (1.13 LQ)
• Construction (1.09 LQ) • Real Estate, Rental & Leasing (1.02 LQ)
Industries with local specialization below one but had job
growth within the County over the past five years are
considered Emerging. Seven industry sectors are in this
category based on job growth between 2012 and 2017,
including Agriculture, Forestry, Fishing & Hunting; Information;
and Professional, Scientific & Technical Services.
The five remaining sectors are classified as Declining due to job
loss and low local specialization: Transportation &
Warehousing; Administration & Support, Waste Management
& Remediation Services; and Utilities.
There were no sectors deemed At Risk for this time period.
Table 8.5 Industry Specialization and Growth, 2017
Industry Sector 2012-2017
Employment Change
2017 Location Quotient
2017 Jobs
Competitive
Arts, Entertainment & Recreation 102 1.54 1,772
Health Care & Social Assistance 894 1.25 10,576
Retail Trade 506 1.24 8,566
Accommodation & Food Services 900 1.22 7,013
Other Services 527 1.14 3,677
Government 613 1.13 11,618
Construction 731 1.09 3,972
Real Estate, Rental & Leasing 161 1.02 1,141
Emerging
Agriculture, Forestry, Fishing & Hunting 123 0.96 774
Information 4 0.91 1,135
Professional, Scientific & Technical Services 561 0.90 3,845
Wholesale Trade 193 0.81 2,036
Finance & Insurance 196 0.79 2,054
Educational Services 59 0.44 754
Manufacturing 360 0.43 2,295
Declining
Transportation & Warehousing (95) 0.85 1,971
Administrative & Support, Waste Management & Remediation
(608) 0.83 3,479
Utilities (6) 0.69 163
Management of Companies & Enterprises (38) 0.29 272
Mining, Quarrying, Oil & Gas Extraction (34) 0.10 26
Source: EMSI, Garner Economics

Raising the Bar: A Competitive Realities Report and Target Industry Strategy for Missoula, Montana | Page 65
Table 8.5 Industry Specialization and Growth, 2017
Industries with Employment of Approximately 500 and Above, 2017
Source: EMSI, Garner Economics
Size of bubble relative to 2017 jobs.

Raising the Bar: A Competitive Realities Report and Target Industry Strategy for Missoula, Montana | Page 66
Industry Competitiveness
The Competitiveness screen seeks to reveal local
competitive advantages (i.e., unique growth beyond
predicted industry trends).
By the Competitiveness measure, Administrative &
Support, Waste Management & Remediation Services is
the lone industry sector with local growth and national
growth for this time period (Table 8.6, Figure 8.6).
Six industries demonstrated local growth:
• Government
• Other Services
• Finance & Insurance
• Construction
• Agriculture, Forestry, Fishing & Hunting
• Wholesale Trade
Seven industry sectors show local decline for this study
period even though national trends show growth. The
most significant sectors include Health Care & Social
Assistance; Accomodation & Food Services; Professional,
Scientific & Technical Services; and Transportation &
Warehousing.
This analysis suggests the County’s least competitive
sectors showing local and national decline are
Manufacturing; Retail Trade; Information; Real Estate,
Rental & Leasing; Utilities; and Mining, Quarrying, Oil &
Gas Extraction.
Table 8.6 2017 Industry Specialization and Growth
Industry Sector Local
Competitive Effect
Industry Effect
2017 Jobs
Local Growth/National Growth
Administrative & Support, Waste Management & Remediation
493 126 3,479
Local Growth/National Decline
Government 1,349 (957) 11,618
Other Services 484 (103) 3,677
Finance & Insurance 341 (192) 2,054
Construction 178 (917) 3,972
Agriculture, Forestry, Fishing & Hunting 57 (105) 774
Wholesale Trade 14 (194) 2,036
Local Decline/National Growth
Educational Services (14) 174 754
Management of Companies & Enterprises (70) 52 272
Health Care & Social Assistance (181) 2,951 10,576
Arts, Entertainment & Recreation (290) 262 1,772
Accommodation & Food Services (375) 1,065 7,013
Professional, Scientific & Technical Services (491) 689 3,845
Transportation & Warehousing (833) 223 1,971
Local Decline/National Decline
Manufacturing (8) (782) 2,295
Retail Trade (187) (545) 8,566
Information (173) (241) 1,135
Real Estate, Rental & Leasing (36) (147) 1,141
Utilities (38) (18) 163
Mining, Quarrying, Oil & Gas Extraction (26) (5) 26
Source: EMSI, Garner Economics
Source: ESRI, Garner Economics

Raising the Bar: A Competitive Realities Report and Target Industry Strategy for Missoula, Montana | Page 67
Figure 8.6 Industry Relative Components of Growth, 2012–2017
Industries with Employment of Approximately 500 and Above, 2017
Source: EMSI, Garner Economics
Size of bubble relative to 2017 jobs.

Raising the Bar: A Competitive Realities Report and Target Industry Strategy for Missoula, Montana | Page 68
Occupational Specialization & Growth
Occupational groupings represent similar skills and educational
qualifications, but are not necessarily specific to one industry
sector.
Twelve occupational groups are Competitive as shown in Table 8.7
and Figure 8.7. The group with the highest LQ is Life, Physical &
Social Science with an LQ of 2.26. The occupation group with the
highest employment in 2017 is Office & Administrative Support
employing 10,820. Several groups that experienced job growth in
the past five years over 400 were Food Preparation & Serving
Related, Construction & Extraction, Office & Administrative
Support, and Building & Grounds Cleaning & Maintenance.
Most of the remaining occupational groups (10) are classified as
Emerging, or having job growth with local specialization under 1.
Two of these groups had job growth over 200: Business and
Financial Operations, with job growth of 276 over the past five
years, and Management, which added 241 jobs during the same
time period.
The Military occupation is Declining and due to job loss and low
local specialization.
There are no occupational groups that are classified as At Risk for
this time frame.
Table 8.7 2017 Occupational Specialization and Growth
Description 2012-2017
Change
2017 Location Quotient
2017 Jobs
Competitive
Life, Physical & Social Science 43 2.26 1,207
Community & Social Service 176 1.47 1,613
Legal 31 1.36 747
Arts, Design, Entertainment, Sports & Media 145 1.25 1,512
Personal Care & Service 372 1.23 3,422
Building & Grounds Cleaning & Maintenance 414 1.22 3,070
Food Preparation & Serving Related 741 1.21 6,797
Healthcare Practitioners & Technical 321 1.14 4,221
Sales & Related 353 1.12 7,464
Construction & Extraction 519 1.10 3,286
Office & Administrative Support 472 1.08 10,820
Installation, Maintenance & Repair 207 1.03 2,620
Emerging Education, Training & Library 159 0.86 3,290
Business & Financial Operations 276 0.83 2,822
Farming, Fishing & Forestry 48 0.83 423
Transportation & Material Moving 97 0.81 3,556
Management 241 0.80 2,914
Computer & Mathematical 143 0.79 1,494
Healthcare Support 89 0.78 1,442
Protective Service 71 0.72 1,071
Architecture & Engineering 115 0.71 782
Production 140 0.51 2,033
Declining
Military (22) 0.64 537
Source: EMSI, Garner Economics
Source: ESRI, Garner Economics

Raising the Bar: A Competitive Realities Report and Target Industry Strategy for Missoula, Montana | Page 69
Figure 8.7 Occupational Specialization and Growth, 2017
Occupations with Employment of Approximately 500 and Above, 2017
Source: EMSI, Garner Economics

Raising the Bar: A Competitive Realities Report and Target Industry Strategy for Missoula, Montana | Page 70
CHAPTER 9: OPTIMAL BUSINESS TARGETS FOR MISSOULA COUNTY, MONTANA
The optimal business sectors selection is based on the specific characteristics of the economy and assets
of Missoula County. These recommended targets are designed to assist the County and its economic
development organization in prioritizing resources and focusing on sectors in which the County holds a
competitive advantage and/or has significant growth potential. This approach will help policymakers
prioritize the County’s community and economic development strategy.
Garner Economics uses a desirability and feasibility screening matrix to determine the optimal targets.
Desirability begins with considering the types of business sectors that stakeholders of Missoula County
would like to see in the community (Figure 9.1). Feasibility includes what the area can reasonably achieve
in the short- to mid-term based on current or planned locational assets and on an analytical review of the
regional economy.
Using results from the Assets and Challenges Assessment, focus groups, a community survey, and field visits, five business and industry families were chosen that best match Missoula County’s unique competitive advantages. These targets are: Creative Professional & Business Services, Bioscience, High-Value Technology Services, High-Value Manufacturing, and the Experiential Economy.
Many of these categories are supportive of each other and can be associated easily with other target families. For instance, Pharmaceutical & Medicine Manufacturing fits under both High-Value Manufacturing and Bioscience due to the production technology and workforce needs common to both. Sub-targets are placed in business and industry families with regards to common threads of assets and workforce.
For each targeted business sector, the County’s competitive advantages are presented, along with
national trends and projections of the targets. In some cases, target sectors are actually losing jobs
nationally, but the particular set of economic development assets in Missoula County position it to capture
any growing demand. Under each target, a list of individual subsectors is provided with accompanying
NAICS classifications.
For each target, a bulleted list of rationales is presented and identified as appealing to the needs of
prospects (P) or the community (C). This material can be used in marketing and community support
efforts or to help economic development personnel prioritize targeting efforts.
Figure 9.1:
Optimal Target
Screening Process
Optimal Targets
1. Bioscience
2. Creative Professional
& Business Services
3. High-Value Technology
Services
4. High-Value Manufacturing
5. Experiential Economy
Desirability
Feasibility
Optimal Targets

Raising the Bar: A Competitive Realities Report and Target Industry Strategy for Missoula, Montana | Page 71
Over the past eight years, the Missoula Economic Partnership’s targets have evolved but maintaining similar business and industry families. Most targets
listed earlier in this report have been verified and presented in the new recommended targets. Details from stated desired targets collected from focus
groups, surveys, and selected Location Quotients are shown below in Figure 9.2.
Figure 9.2 Target Screening Details
Desired Targets from Surveys High Location Quotients for Industries and Occupations • Medical and healthcare (3)
• High Tech – high-growth (3)
• Light resource manufacturing (2)
• Biotech/Bioscience (2)
• Traded professional services (2)
• Timber industry
• Software
• Cloud computing
• Knowledge-based professional services
• Creative class – music, film, arts
• Ecotourism
• University has clinical research – not using it to their potential.
• Breweries and distilleries
• Outdoor equipment manufacturing
Sources EMSI, Garner Economics

Raising the Bar: A Competitive Realities Report and Target Industry Strategy for Missoula, Montana | Page 72
FIGURE 9.3 OPTIMAL TARGETS FOR MISSOULA COUNTY
Targets are suggested based on leveraging the existing workforce & assets, raising the economic wealth of the community, and creating a place that
attracts visitors and new residents alike (quality of place).
CORE INDUSTRY TARGETS for MEP COMMUNITY TARGET
Bioscience Creative Professional &
Business Services* High-Value
Technology Services High-Value
Manufacturing Experiential
Economy
• Environmental Consulting
Services
• Forestry Support Services (Including Disaster Management Technology)
• Geophysical, Surveying & Mapping Services
• Medical & Diagnostic Laboratories
• R&D in the Physical, Engineering, and Life Sciences
• Scientific & Technical Consulting Services
• Telepharmacy & Pharmaceutical Distribution**
• Testing Laboratories
• Accounting, Tax Preparation, Bookkeeping, & Payroll Services
• Architectural & Related Services
• Business Support Services
• Design Services
• Finance & Insurance Activities
• Legal Services
• Marketing
• Multimedia, Animation & Video Production
• Office Administrative Services
• App Design/Custom Programming (Including Health IT)
• Computer Systems Design
• Data Processing, Hosting, & Related Services
• Data Science & Analytics
• Engineering Services & Consulting
• Satellite Communications Technology
• Software Publishers
• Craft Breweries & Distilleries
• General Beverage Mfg.
• Medical Device Mfg.
• Pharmaceutical & Medicine Mfg.
• Plastic Product Mfg.
• Recreational Equipment Mfg.
• Sawmills & Wood Preservation
• Veneer, Plywood, & Engineered Wood Product Mfg. (Including Sustainable Building Material Mfg.)
• Co-Working & Shared Office Facilities
• Ecotourism
• Lifestyle Entrepreneurs
• Local or Unique Retail
• Performing Artists, Writers, & Performers
• Performing Arts Companies
• Promoters of Performing Arts, Sports & Similar Events
• Spectator Sports
• Traveler Accommodations
* Class A office space development essential for this target
**Dependent on interpretation and possible adjustment of Montana Board of Pharmacy rules disallowing “TelePharmacies” or “Remote Pharmacies” in certain areas

Raising the Bar: A Competitive Realities Report and Target Industry Strategy for Missoula, Montana | Page 73
The Bioscience target family is the result of the convergence of existing assets in Missoula County and
surrounding area, including the Rocky Mountain Laboratories, University of Montana programs, and high
concentrations of bioscience and natural resources industry and occupations. The underlying link in this
family is science and research.
The National Institute of Health’s Rocky Mountain Laboratories in Hamilton houses state-of-the-art
research facilities and world-class scientists involved in the study of infectious diseases. In the early 1900s
researchers came to the Bitterroot Valley to learn about Rocky Mountain spotted fever and began a
history in bioscience that continues to influence both public health and the local economy.
The University of Montana houses several schools and majors that provide a backbone of research and
talent for the industry. More than 2,300 degrees were conferred in 2016 related to Bioscience from UM
and Salish Kootenai College (in nearby Pablo). The Organismal Biology, Ecology and Evolution and Wildlife
Biology are Programs of National Distinction. The College of Health Professions and Biomedical Sciences,
W.A. Franke College of Forestry & Conservation, and the Skaggs School of Pharmacy all add to the assets
of Missoula County as a competitive location for growing bioscience. Additional majors at the University
of Montana offering degrees to the doctorate level include:
• Biochemistry and Biophysics Program
• Biomedical and Pharmaceutical Sciences
• Cellular, Molecular, and Microbial Biology
• Chemistry and Biochemistry
• Environmental Studies
• Pharmaceutical Sciences and Drug Design
• Systems Ecology
• Toxicology
Rationales
Low cost of labor (P)
Availability of post-secondary vocational training (P)(C)
Within 1/2 hour of major university/college (P)(C)
Availability of business and professional services (P)
Availability of venture capital from local sources for business startups or early stage funding (P)
Quality of local elementary and secondary education (P)(C)
Quality/availability of post-secondary education (P)(C)
General appearance of the community(P)(C)
Appearance of the Central Business District (P)(C)
Degrees conferred to relevant areas of study are more than 2,300 in 2016 (P)
TARGET 1: BIOSCIENCE

Raising the Bar: A Competitive Realities Report and Target Industry Strategy for Missoula, Montana | Page 74
Rationales
continued
Local Job Growth 47% over past decade (P)(C)
Local Job Growth Forecast of 26% (P)(C)
National Job Growth 17% over past decade (P)(C)
National Job Growth Forecast of 16% (P)(C)
National Average Wage $91,711 (C)
Extremely high LQ of 45.2 in Support Activities for Forestry (P)
LQ of 3.11 for Environmental Consulting Services (P)
LQ of 2.91 for Geophysical Surveying and Mapping Services (P)
LQ of 12.36 for Forest and Conservation Workers (P)
LQ of 9.96 for Conservation Scientists (P)
LQ of 7.25 for Misc. Life, Physical, and Social Science Technicians (P)
LQ of 4.64 for Atmospheric and Space Scientists (P)
Table 9.4: Regional Degree Completions in Majors Related to Bioscience, 2016
Degrees by Area of Study Certificate or
Associate Bachelor’s
Degree Graduate
Degree Number of
Degrees 2016
Business, Management, Marketing, and Related Support Services
138 324 64 526
Health Professions and Related Programs
183 48 286 517
Social Sciences 17 196 34 247
Natural Resources and Conservation 1 156 57 214
Psychology 12 131 33 176
Communication, Journalism, and Related Programs
137 13 150
Biological and Biomedical Sciences 85 23 108
Public Administration and Social Service Professions
46 47 93
Computer and Information Sciences and Support Services
65 15 7 87
Physical Sciences 2 44 15 61
Engineering Technologies and Engineering-related Fields
27
27
Mathematics and Statistics 18 9 27
Mechanic and Repair Technologies/Technicians
23
23
Parks, Recreation, Leisure, and Fitness Studies
21 2 23
Science Technologies/Technicians 19 19
Family and Consumer Sciences/Human Sciences
9 9
TOTAL 487 1,221 599 2,307
Source: National Center for Education Statistics, Garner Economics
Graduates from University of Montana and Salish Kootenai College (Pablo, MT)

Raising the Bar: A Competitive Realities Report and Target Industry Strategy for Missoula, Montana | Page 75
Within the Bioscience target family exists a specialty for Missoula County: natural resources and conservation. The County has an extremely high concentration (LQ of 45.2) in the Support Activities for Forestry Industry. This subsector encompasses the areas of timber production, wood technology, forestry economics and marketing, and forest protection. Neptune Aviation Services, an aerial firefighting company, is headquartered in Missoula. This firm is an example of the expertise based in the County along with environmental consulting, testing, and management of natural resources.
The Skaggs School of Pharmacy is a plus for the Bioscience target. As the only pharmacy school in Montana, there is great opportunity to leverage this asset for growing and attracting business to the County. Programs
within in the school focus on Biomedical and Pharmaceutical Sciences as well as Pharmacy Practice. A licensed pharmacist is key to several innovative approaches to pharmaceutical operations. Telepharmacy, automated, and mail-order pharmacies enable professionals to serve a greater geography and population from a centralized location managing remote locations. The Telepharmacy/Pharmaceutical Distribution subsector will require some collaboration with the Montana Board of Pharmacy on allowed activities within specific categories and locations relative to other pharmacies.
The Bioscience target family is a mix of science and research activities joining educational assets, leveraging research partners, and potential for talent in the County.
Table 9.5: Bioscience Subsectors
NAICS Description National Wages
2017
National Job Growth
2007-2017
National Job Growth Forecast
2017-2027
National Job Count 2017
11531 Support Activities for Forestry $44,172 -1.7% 13.5% 19,701
42421 Drugs and Druggists' Sundries Merchant Wholesalers (Telepharmacy/Pharmaceutical Distribution)
$111,429 -5.8% -2.2% 203,680
54136 Geophysical Surveying and Mapping Services $77,681 -22.7% 1.7% 15,817
54137 Surveying and Mapping (except Geophysical) Services $55,855 -26.7% 0.3% 50,802
54138 Testing Laboratories $75,894 9.2% 8.0% 167,101
54162 Environmental Consulting Services $68,769 9.1% 12.4% 100,820
54169 Other Scientific and Technical Consulting Services $79,046 34.6% 19.3% 240,537
54171 Research/ Development in the Physical, Engineering, & Life Sciences $131,455 11.9% 12.2% 611,968
54199 All Other Professional, Scientific, and Technical Services $55,439 76.7% 30.7% 248,050
62151 Medical and Diagnostic Laboratories $62,039 25.3% 28.9% 281,718
WEIGHTED AVERAGES/TOTAL $91,711 16.7% 15.6% 1,940,193
Source: EMSI, Garner Economics

Raising the Bar: A Competitive Realities Report and Target Industry Strategy for Missoula, Montana | Page 76
Table 9.6: Bioscience Existing Pool of High-Demand Occupations, 2017
Description Employed in
Missoula County LQ
Registered Nurses 1,450 1.16
Miscellaneous Healthcare Support Occupations 654 1.06
Miscellaneous Life, Physical, and Social Science Technicians 475 7.25
Licensed Practical and Licensed Vocational Nurses 386 1.24
Health Practitioner Support Technologists and Technicians 334 1.02
Pharmacists 204 1.55
Diagnostic Related Technologists and Technicians 200 1.23
Medical and Health Services Managers 168 1.13
Conservation Scientists and Foresters 134 9.96
Biological Scientists 129 2.82
Clinical Laboratory Technologists and Technicians 125 0.89
Miscellaneous Information and Record Clerks 120 1.46
Medical Records and Health Information Technicians 108 1.21
Compliance Officers 102 0.84
Miscellaneous Health Technologists and Technicians 101 1.63
Occupational Health and Safety Specialists and Technicians 97 2.30
Surveyors, Cartographers, and Photogrammetrists 94 3.78
Medical, Dental, and Ophthalmic Laboratory Technicians 66 1.84
Forest and Conservation Workers 63 12.36
First-Line Supervisors of Farming, Fishing, and Forestry Workers 59 2.69
Chemists and Materials Scientists 57 1.42
Natural Sciences Managers 55 2.34
Environmental Scientists and Geoscientists 52 0.97
Biological Technicians 42 1.30
Veterinarians 41 1.21
Miscellaneous Health Practitioners and Technical Workers 27 0.92
Atmospheric and Space Scientists 20 4.64
Miscellaneous Health Diagnosing and Treating Practitioners 20 0.87
Environmental Engineers 19 0.84
Source: EMSI, Garner Economics

Raising the Bar: A Competitive Realities Report and Target Industry Strategy for Missoula, Montana | Page 77
Missoula County, MT is well situated to grow its existing business and professional services sectors. In
2017 there were 735 business locations compared to 589 in 2010, a change of 25 percent. These
businesses offer a wide variety of services and illustrate that the County possesses a strong concentration
of business service jobs and availability of skilled administrative workers. Additionally, the natural beauty
and fiber network factors into the attractiveness of this location for businesses and talent alike.
An area of emphasis in this target is Creative Professional Services, which builds on the vibrant arts
community in the County. Recent ranked 4th in the nation among medium-sized cities for arts activities,2
this business sector is a natural fit for the area. There are high concentrations of Film & Video Editors and
Camera Operators (LQ 2.92) as well as Video Production (LQ 1.6). Firms fitting into this group would
involve advertising, marketing, multimedia, and video production as well as design.
The University of Montana adds to the potential talent pool of workers for the Creative Professional and
Business Services target family. The Creative Writing program is one of the oldest and most prestigious in
the country and is a program of national distinction. UM’s College of Business, College of Visual and
Performing Arts, and the Alexander Blewett III School of Law graduate students with business, marketing,
creative, legal, accounting, and other skills that create and sustain the workforce pipeline.
The main obstacle for this sector is the lack of existing Class A office space in Missoula County. There are
limited office parks where class A space can be built, and many office sites are redevelopment
opportunities through the City which may discourage firms looking to relocate.
2 National Center for Arts Research at Southern Methodist University, Missoulian, May 1, 2017.
Rationales
Availability of skilled admin workers (P)
Within 1 hour of commercial air passenger service (P)
Low cost of labor (P)
Within 1/2 hour of major university/college (P)(C)
Availability of low-interest loans for small business (P)(C)
Quality of local elementary and secondary education (P)(C)
Quality/availability of post-secondary education (P)(C)
Availability of executive-level housing
General appearance of the community(P)(C)
Appearance of the Central Business District (P)(C)
TARGET 2: CREATIVE PROFESSIONAL
& BUSINESS SERVICES
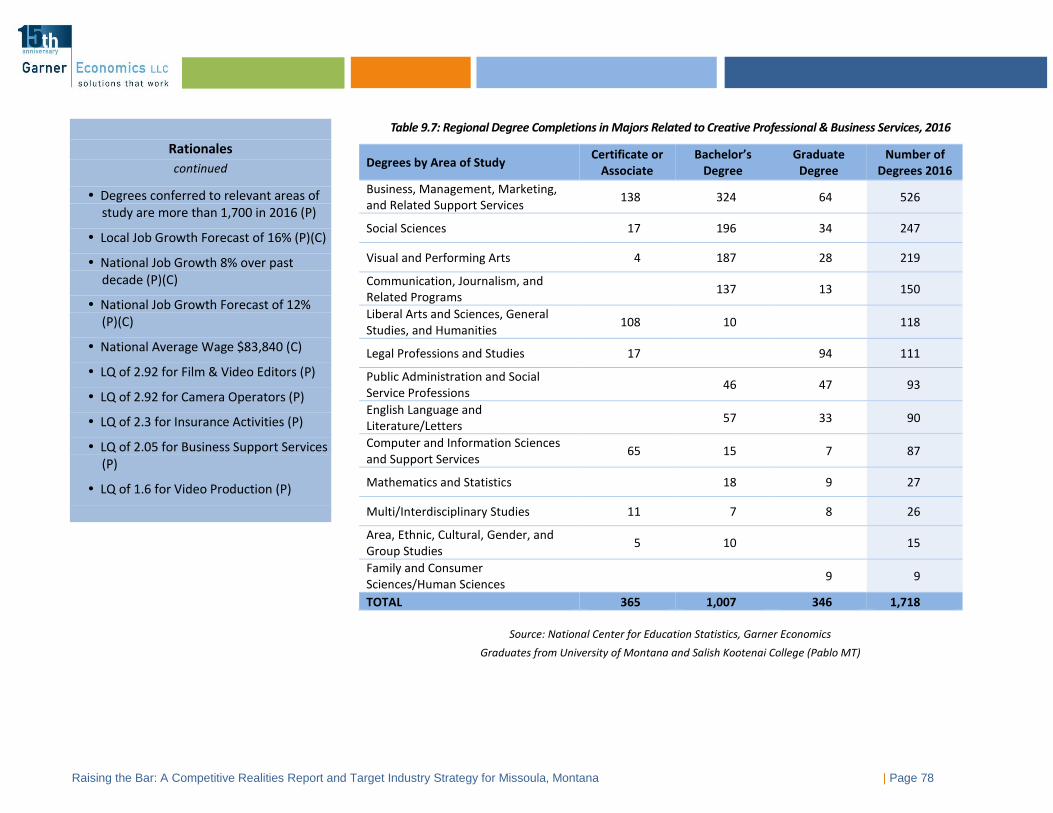
Raising the Bar: A Competitive Realities Report and Target Industry Strategy for Missoula, Montana | Page 78
Rationales
continued
Degrees conferred to relevant areas of study are more than 1,700 in 2016 (P)
Local Job Growth Forecast of 16% (P)(C)
National Job Growth 8% over past decade (P)(C)
National Job Growth Forecast of 12% (P)(C)
National Average Wage $83,840 (C)
LQ of 2.92 for Film & Video Editors (P)
LQ of 2.92 for Camera Operators (P)
LQ of 2.3 for Insurance Activities (P)
LQ of 2.05 for Business Support Services (P)
LQ of 1.6 for Video Production (P)
Table 9.7: Regional Degree Completions in Majors Related to Creative Professional & Business Services, 2016
Degrees by Area of Study Certificate or
Associate Bachelor’s
Degree Graduate
Degree Number of
Degrees 2016
Business, Management, Marketing, and Related Support Services
138 324 64 526
Social Sciences 17 196 34 247
Visual and Performing Arts 4 187 28 219
Communication, Journalism, and Related Programs
137 13 150
Liberal Arts and Sciences, General Studies, and Humanities
108 10 118
Legal Professions and Studies 17 94 111
Public Administration and Social Service Professions
46 47 93
English Language and Literature/Letters
57 33 90
Computer and Information Sciences and Support Services
65 15 7 87
Mathematics and Statistics 18 9 27
Multi/Interdisciplinary Studies 11 7 8 26
Area, Ethnic, Cultural, Gender, and Group Studies
5 10 15
Family and Consumer Sciences/Human Sciences
9 9
TOTAL 365 1,007 346 1,718
Source: National Center for Education Statistics, Garner Economics
Graduates from University of Montana and Salish Kootenai College (Pablo MT)

Raising the Bar: A Competitive Realities Report and Target Industry Strategy for Missoula, Montana | Page 79
Table 9.8: Creative Professional & Business Services Subsectors
NAICS Description National Wages
2017
National Job Growth
2007-2017
National Job Growth Forecast
2017-2027
National Job Count 2017
5231 Securities and Commodity Contracts Intermediation and Brokerage $226,873 -13.4% 5.9% 458,468
5241 Insurance Carriers $91,361 -5.6% 4.8% 1,200,697
5411 Legal Services $90,377 -5.5% 0.9% 1,337,839
5412 Accounting, Tax Preparation, Bookkeeping, and Payroll Services $67,167 6.6% 8.4% 1,168,970
5414 Specialized Design Services $45,336 1.0% 9.5% 281,387
5418 Advertising, Public Relations, and Related Services $76,941 1.3% 6.6% 541,344
5611 Office Administrative Services $82,301 30.1% 19.1% 523,295
5614 Business Support Services $40,536 9.9% 14.1% 978,124
51211 Motion Picture and Video Production $80,858 29.7% 20.7% 300,931
51219 Postproduction Services and Other Motion Picture and Video Industries
$71,375 7.9% 14.2% 28,412
52429 Other Insurance Related Activities $71,801 32.4% 21.1% 369,543
54131 Architectural Services $79,931 -13.1% 4.1% 206,023
54132 Landscape Architectural Services $51,269 -18.8% 2.9% 48,794
54161 Management Consulting Services $85,007 45.8% 28.4% 1,363,439
WEIGHTED AVERAGE/TOTAL $83,840 7.5% 11.8% 8,815,641
Source: EMSI, Garner Economics

Raising the Bar: A Competitive Realities Report and Target Industry Strategy for Missoula, Montana | Page 80
Table 9.9: Creative Professional & Business Services Existing Pool of High-Demand Occupations, 2017
Description Employed in
Missoula County LQ
Office Clerks, General 2,228 1.57
Secretaries and Administrative Assistants 1,933 1.09
Customer Service Representatives 1,138 0.97
Bookkeeping, Accounting, and Auditing Clerks 1,138 1.55
General and Operations Managers 670 0.70
Receptionists and Information Clerks 570 1.26
Computer Support Specialists 563 1.48
Accountants and Auditors 492 0.82
First-Line Supervisors of Office and Administrative Support Workers 473 0.74
Lawyers and Judicial Law Clerks 463 1.33
Miscellaneous Business Operations Specialists 365 0.86
Miscellaneous Managers 322 0.93
Human Resources Workers 223 0.83
Billing and Posting Clerks 221 1.01
Designers 218 0.79
Management Analysts 209 0.60
Paralegals and Legal Assistants 201 1.63
Claims Adjusters, Appraisers, Examiners, and Investigators 185 1.45
Market Research Analysts and Marketing Specialists 177 0.69
Database and Systems Administrators and Network Architects 176 0.62
Miscellaneous Office and Administrative Support Workers 169 1.27
Buyers and Purchasing Agents 167 0.88
Public Relations Specialists 163 1.53
Cost Estimators 148 1.52
Credit Counselors and Loan Officers 146 0.98
Writers and Editors 136 0.96
Miscellaneous Information and Record Clerks 120 1.46
Architects 110 1.74
Photographers 91 1.57
Television, Video, and Motion Picture Camera Operators and Editors 79 2.72
Source: EMSI, Garner Economics

Raising the Bar: A Competitive Realities Report and Target Industry Strategy for Missoula, Montana | Page 81
Montana is making a name for itself in technology. The state’s high-tech companies are growing nine
times faster than other sectors according to a recent report by the Bureau of Business and Economic
Research at the University of Montana. Missoula certainly has a piece of the technology sector with
businesses engaged in a variety of functions. The definition of high technology utilized in the UM report
includes sectors spread across several industry families, including bioscience, several manufacturing
subsectors, and information technology.
The high-value technology services target family for Missoula County comprises firms which provide
technical services in the communications, engineering, data processing, software, and applications areas.
Of the subsectors identified, the Engineering Services had the strongest existing 2017 employment in the
County (475 jobs), closely followed by Computer Systems Design Services (388 jobs). Custom Computer
Programming Services had 217 employees which doubled over the past decade. This target family is
projected to grow 23 percent nationally and estimated to grow 19 percent in Missoula County over the
next ten years.
The rise of “big data” and health information technology will provide opportunity for areas with excellent
internet and computing infrastructure, talent development strategies, and attractive quality of place to
capitalize on this growth. Tech companies will choose a city and a part of town based on the availability
of substantial internet access and the ability to attract and retain workers.
Broadband access is good in the City and County with a high percentage of the population being able to
buy service at 100 mbps levels or faster. Average download speeds published do not show well, however.
Several providers advertise gigabit service and reports, including MEP Missoula Broadband & Business
Survey (2016), showed satisfactory speeds. Internet access and bandwidth needs will grow exponentially
in the future. Being able to provide solid, fast internet access will enhance the success of this sector.
Rationales
Within 1 hour of commercial air passenger service (P)
Low cost of labor (P)
Within 1/2 hour of major university/college (P)(C)
Availability of post-secondary vocational training (P)(C)
Availability of business and professional services (P)
Availability of low-interest loans for small business (P)(C)
Availability of venture capital from local sources for business startups or early stage funding (C)
Quality of local elementary and secondary education (P)(C)
Quality/availability of post-secondary education (P)(C)
Availability of executive-level housing
TARGET 3: HIGH-VALUE
TECHNOLOGY SERVICES

Raising the Bar: A Competitive Realities Report and Target Industry Strategy for Missoula, Montana | Page 82
Again, the availability of Class A office space may affect recruitment efforts. It is likely that many high-value technology service firms will be smaller and would be keen on redevelopment projects in the heart of downtown. Additionally, this report contains several recommendations that could enhance the availability of space for this target.
Needs for highly skilled workers in the sector can pull from recent graduates in the area—over 1,100 degrees were conferred in 2016 for related majors. Additionally, alternate training is widely available via online classes for those seeking various certifications. Several code schools offer boot camps and junior-level classes in Missoula. The focus on building this sector’s talent pipeline can advance many employment sectors.
Table 9.10: Regional Degree Completions in Majors Related to High-Value Technology Services, 2016
Degrees by Area of Study Certificate
or Associate Bachelor’s
Degree Graduate
Degree Number of
Degrees 2016
Business, Management, Marketing, and Related Support Services
138 324 64 526
Social Sciences 17 196 34 247
Communication, Journalism, and Related Programs
137 13 150
Liberal Arts and Sciences, General Studies, and Humanities
108 10 118
Computer and Information Sciences and Support Services
65 15 7 87
Engineering Technologies and Engineering-related Fields
27 27
Mathematics and Statistics 18 9 27
TOTAL 355 700 127 1,182
Source: National Center for Education Statistics, Garner Economics
Graduates from University of Montana and Salish Kootenai College (Pablo, MT)
Rationales
continued
General appearance of the community (P)(C)
Appearance of the Central Business District (P)(C)
Montana’s high-tech companies growing nine times faster than other sectors3
Degrees conferred to relevant areas of study are more than 1,100 in 2016 (P)
Local Job Growth 29% over past decade (P)(C)
Local Job Growth Forecast of 19% (P)(C)
National Job Growth 41% over past decade (P)(C)
National Job Growth Forecast of 23% (P)(C)
National Average Wage $113,897 (C)
High LQ of 5.87 in Satellite Telecommunication Industry (P)
3 A Profile of Montana’s HighTech Industries, February 2018, Bureau of Business and Economic Research University of Montana.

Raising the Bar: A Competitive Realities Report and Target Industry Strategy for Missoula, Montana | Page 83
Table 9.11: High-Value Technology Services Subsectors
NAICS Description National
Wages 2017
National Job Growth
2007-2017
National Job Growth Forecast
2017-2027
National Job Count 2017
51121 Software Publishers $154,152 46.3% 26.8% 370,709
51741 Satellite Telecommunications $113,572 -34.4% 28.6% 8,682
51821 Data Processing, Hosting, and Related Services $110,159 15.0% 13.0% 316,825
54133 Engineering Services $92,903 3.1% 11.3% 982,741
541511 Custom Computer Programming Services $110,273 44.1% 23.4% 946,316
541512 Computer Systems Design Services $104,839 53.4% 26.6% 1,022,180
541519 Other Computer Related Services $105,497 5.9% 10.5% 124,629
Weighted Average/Total $113,897 40.7% 23.3% 2,789,340
Source: EMSI, Garner Economics

Raising the Bar: A Competitive Realities Report and Target Industry Strategy for Missoula, Montana | Page 84
Table 9.12: High-Value Technology Services Existing Pool of High-Demand Occupations, 2017
Description Employed in
Missoula County LQ
Customer Service Representatives 1,138 0.97
Receptionists and Information Clerks 570 1.26
Computer Support Specialists 563 1.48
Software Developers and Programmers 527 0.72
Miscellaneous Business Operations Specialists 365 0.86
Miscellaneous Sales Representatives, Services 267 0.61
Designers 218 0.79
Management Analysts 209 0.60
Heating, Air Conditioning, and Refrigeration Mechanics and Installers 208 1.43
Market Research Analysts and Marketing Specialists 177 0.69
Database and Systems Administrators and Network Architects 176 0.62
Miscellaneous Installation, Maintenance, and Repair Workers 169 0.96
Writers and Editors 136 0.96
Computer and Information Analysts 135 0.46
Data Entry and Information Processing Workers 127 1.00
Miscellaneous Information and Record Clerks 120 1.46
Computer and Information Systems Managers 87 0.55
Production, Planning, and Expediting Clerks 84 0.59
Television, Video, and Motion Picture Camera Operators and Editors 79 2.72
Radio and Telecommunications Equipment Installers and Repairers 75 0.70
Miscellaneous Computer Occupations 72 0.60
Miscellaneous Electrical and Electronic Equipment Mechanics, Installers, and Repairers 70 0.64
Broadcast and Sound Engineering Technicians and Radio Operators 47 0.76
Miscellaneous Media and Communication Workers 45 0.95
Computer, Automated Teller, and Office Machine Repairers 45 0.86
Precision Instrument and Equipment Repairers 30 0.93
Miscellaneous Media and Communication Equipment Workers 17 1.78
Source: EMSI, Garner Economics

Raising the Bar: A Competitive Realities Report and Target Industry Strategy for Missoula, Montana | Page 85
Manufacturing has a high multiplier effect on the economy and it is a popular, desirable part of economic
development recruitment plans. However, not all manufacturing is created equal and not all communities
are a fit. Being strategic in supporting high-value manufacturing offers a better return on investment of
time and marketing.
As noted earlier in this report, only 3.6 percent of Missoula County’s workforce are employed in
manufacturing (about 2,000 production workers). There has been an uptick in manufacturing
establishments with the number of companies growing 27 percent to 161 locations in the County.
Employment has increased in the past five years a total of 7 percent for production occupations and 19
percent for all workers working at a manufacturing location. Automation of manufacturing processes also
aids in the ability of a smaller workforce to run a manufacturing facility.
Specific segments of manufacturing that are recommended as a good fit for Missoula County include:
• Craft breweries, distilleries, and general beverage manufacturing
• Wood-based products
• Recreational equipment
• Medical devices
• Pharmaceutical and medicine
• Plastic products
Breweries and distilleries are on-trend nationally and tend to cluster in areas with a young population and visitor count—Missoula has both. Along with general beverage manufacturing (water, soft drinks, etc.), breweries and distilleries can serve the region well. The brewing industry in Missoula County has a high LQ of 7.91.
Rationales
Regional access via Interstate highways (P)
Low cost of labor (P)
Availability of post-secondary vocational training (P)(C)
Within 1/2 hour of major university/college (P)(C)
Availability of business and professional services (P)
Quality of local elementary and secondary education (P)(C)
Quality/availability of post-secondary education (P)(C)
General appearance of the community (P)(C)
Degrees conferred to relevant areas of study are nearly 1,100 in 2016 (P)
Rationales continued
TARGET 4: HIGH-VALUE
MANUFACTURING

Raising the Bar: A Competitive Realities Report and Target Industry Strategy for Missoula, Montana | Page 86
Local Job Growth 13% over past decade (P)(C)
Local Job Growth Forecast of 8% (P)(C)
National Job Growth Forecast of 2% (P)(C)
National Average Wage $67,285 (C)
High LQ of 7.91 for Breweries
LQ of 4.23 for Distilleries (P)
LQ of 4.9 for Veneer, Plywood, and Engineered Wood Products
LQ of 4.12 for Sawmills and Wood Preservation (P)
LQ of 2.38 for Misc. Woodworkers (P)
LQ of 1.93 for Woodworking Machine Workers (P)
Existing pool of high-demand occupations and occupations with skills transferability (P)
Source: National Center for Education Statistics, Garner Economics
Graduates from University of Montana and Salish Kootenai College (Pablo, MT)
Wood-based manufacturing adds value
to an abundant natural resource in the
area. Several wood product subsectors have high concentrations as well as wood working occupations. The
opportunity to specialize in sustainable building materials, a growing market nationally, would appeal to many
of Missoula’s residents and utilize area environmental and technical knowledge.
The presence of a strong bioscience sector in Missoula County dovetails nicely with pharmaceutical and
medicine and medical device manufacturing. Expanded research and development coupled with
collaborations between laboratories and the University of Montana could support these ventures.
In 2016, more than 1,000 degrees were granted for majors relating to these manufacturing targets, including
bioscience, precision production, and engineering technologies. The lack of an engineering school was noted
in the Assets and Challenges portion of this report and does impact the attractiveness for manufacturing.
Infrastructure does exist to train production and technical workers, but some work could be done to make
this free or low-cost to new and expanding manufacturing companies. Additional strategies such as junior
apprenticeship programs and promoting technical careers in schools has proved successful in other areas.
Table 9.13: Regional Degree Completions in Majors Related to High-Value Manufacturing, 2016
Degrees by Area of Study Certificate
or Associate Bachelor’s
Degree Graduate
Degree
Number of Degrees
2016
Business, Management, Marketing, and Related Support Services 138 324 64 526
Communication, Journalism, and Related Programs 137 13 150
Biological and Biomedical Sciences 85 23 108
Computer and Information Sciences and Support Services 65 15 7 87
Physical Sciences 2 44 15 61
Engineering Technologies and Engineering-related Fields 27 27
Mathematics and Statistics 18 9 27
Mechanic and Repair Technologies/Technicians 23 23
Transportation and Materials Moving 22 22
Science Technologies/Technicians 19 19
Precision Production 10 10
Family and Consumer Sciences/Human Sciences 9 9
TOTAL 306 623 140 1,069
Table 9.14: High-Value Manufacturing Subsectors

Raising the Bar: A Competitive Realities Report and Target Industry Strategy for Missoula, Montana | Page 87
NAICS Description National
Wages 2017
National Job Growth
2007-2017
National Job Growth Forecast
2017-2027
National Job Count 2017
3211 Sawmills and Wood Preservation $45,418 -17.2% 2.6% 96,102
3212 Veneer, Plywood, and Engineered Wood Product Manufacturing $48,032 -28.2% 4.2% 77,744
3254 Pharmaceutical and Medicine Manufacturing $115,373 -1.8% 5.3% 291,365
3261 Plastics Product Manufacturing $51,914 -5.0% -2.3% 577,430
3391 Medical Equipment and Supplies Manufacturing $72,734 0.6% 5.8% 317,106
312111 Soft Drink Manufacturing $55,354 2.7% -0.1% 81,572
312112 Bottled Water Manufacturing $54,075 -1.6% 14.7% 15,731
312120 Breweries $47,746 152.2% 33.0% 66,686
312140 Distilleries $66,555 84.7% 21.7% 13,564
339920 Sporting and Athletic Goods Manufacturing $51,832 -14.0% -6.7% 49,863
Weighted Average/Total $67,285 -2.7% 3.2% 1,587,162
Source: EMSI, Garner Economics

Raising the Bar: A Competitive Realities Report and Target Industry Strategy for Missoula, Montana | Page 88
Table 9.15: High-Value Manufacturing Existing Pool of High-Demand Occupations, 2016
Description Employed in
Missoula County LQ
General and Operations Managers 670 0.70
Stock Clerks and Order Fillers 670 0.78
Maintenance and Repair Workers, General 636 1.01
Pharmacists 204 1.55
Miscellaneous Installation, Maintenance, and Repair Workers 169 0.96
First-Line Supervisors of Production and Operating Workers 165 0.63
Miscellaneous Production Workers 140 0.36
Clinical Laboratory Technologists and Technicians 125 0.89
Welding, Soldering, and Brazing Workers 124 0.65
Packaging and Filling Machine Operators and Tenders 124 0.74
Miscellaneous Assemblers and Fabricators 110 0.19
Woodworking Machine Setters, Operators, and Tenders 106 1.93
Engineering Technicians, Except Drafters 101 0.54
Occupational Health and Safety Specialists and Technicians 97 2.30
Inspectors, Testers, Sorters, Samplers, and Weighers 85 0.38
Industrial Machinery Installation, Repair, and Maintenance Workers 79 0.39
Medical, Dental, and Ophthalmic Laboratory Technicians 66 1.84
Machinists 64 0.38
Crushing, Grinding, Polishing, Mixing, and Blending Workers 61 0.76
Molders and Molding Machine Setters, Operators, and Tenders, Metal and Plastic
58 0.88
Chemists and Materials Scientists 57 1.42
Mechanical Engineers 57 0.46
Chemical Processing Machine Setters, Operators, and Tenders 42 0.81
Cabinetmakers and Bench Carpenters 39 0.85
Electrical and Electronics Engineers 38 0.28
Industrial Engineers, Including Health and Safety 25 0.21
Industrial Production Managers 20 0.28
Miscellaneous Woodworkers 15 2.38
Extruding, Forming, Pressing, and Compacting Machine Setters, Operators, and Tenders
11 0.37
Source: EMSI, Garner Economics

Raising the Bar: A Competitive Realities Report and Target Industry Strategy for Missoula, Montana | Page 89
The natural beauty and vibe of Missoula County are the focus of the Experiential Economy target. The
goal of this target is to create memorable experiences in Missoula and grow the entrepreneurial
ecosystem. Luckily, Missoula does have incredible assets in the form of mountains, rivers, a vibrant
downtown, and a lively arts scene.
This target is aimed at addressing a recurring theme from the stakeholder input process for identifying
desirable targets. Surveys and focus groups report that ecotourism and the creative/arts sectors would
be a fit for the County. The feasibility screening has verified these as viable targets. In fact, several arts
and recreation industries have high concentrations in the County—Theater Companies and Dinner
Theatres (LQ of 3.88) and Recreation Workers (LQ of 3.06).
The enhancement of local offerings of entrepreneurial assets, tourism, entertainment, and lodging is a
necessary component of adding to Missoula County’s appeal to the companies and workers that it seeks
to attract for its four main target industry groups. This effort is intended as a “community target” that
should be pursued by organizations with missions that complement the targets (e.g., Downtown Missoula
Partnership, Destination Missoula, City of Missoula, major business and recreation companies, academic
institutions).
Making a more memorable Missoula also includes enhancing the entrepreneurial ecosystem. The
availability of low-interest loans and venture capital score well in the Assets and Challenges review.
Creating additional office space in the form of co-working or shared facilities for start-ups and
collaborative workers can boost the entrepreneurial environment.
Other areas within the target are focused arts, tourism, and spectator sports. As the quality of place and
positive experiences grow, the more attractive Missoula will become for visitors as well as current and
future residents.
Rationales
Leveraging natural assets of Missoula County
Within 1 hour of commercial air passenger service (P)
Low cost of labor (P)
Within 1/2 hour of major university/college (P)(C)
Availability of low-interest loans for small business (P)(C)
Availability of venture capital from local sources for business startups or early stage funding (C)
Quality of local elementary and secondary education (P)(C)
Quality/availability of post-secondary education (P)(C)
Availability of executive-level housing
General appearance of the community(P)(C)
Appearance of the Central Business District (P)(C)
TARGET 5: EXPERIENTIAL ECONOMY

Raising the Bar: A Competitive Realities Report and Target Industry Strategy for Missoula, Montana | Page 90
Rationales
continued
Local Job Growth Forecast of 8% (P)(C)
National Job Growth Forecast of 9% (P)(C)
National Average Wage $30,273 (C)
High LQ of 2.38 for Performing Arts Companies (P)
Table 9.16: Degree Completions in Majors Related to Experiential Economy, 2016
Degrees by Area of Study Certificate or
Associate Bachelor’s
Degree Graduate
Degree Number of
Degrees 2016
Business, Management, Marketing, and Related Support Services
138 324 64 526
Social Sciences 17 196 34 247
Visual and Performing Arts 4 187 28 219
Natural Resources and Conservation 1 156 57 214
Communication, Journalism, and Related Programs
137 13 150
Liberal Arts and Sciences, General Studies, and Humanities
108 10
118
Multi/Interdisciplinary Studies 11 7 8 26
Parks, Recreation, Leisure and Fitness Studies
21 2 23
Transportation and Materials Moving 22 22
Personal and Culinary Services 18 18
Area, Ethnic, Cultural, Gender, and Group Studies
5 10
15
TOTAL 324 1,048 206 1,578
Source: National Center for Education Statistics, Garner Economics Graduates from University of Montana and Salish Kootenai College (Pablo MT)

Raising the Bar: A Competitive Realities Report and Target Industry Strategy for Missoula, Montana | Page 91
Table 9.17: Experiential Economy Subsectors
NAICS Description National
Wages 2017
National Job Growth
2007-2017
National Job Growth Forecast
2017-2027
National Job Count
2017
451 Sporting Goods, Hobby, Musical Instrument, and Book Stores $21,369 -6.7% 12.1% 640,619
452 General Merchandise Stores $23,821 4.3% 9.9% 3,164,241
453 Miscellaneous Store Retailers $25,710 -7.0% 1.7% 959,759
487 Scenic and Sightseeing Transportation $33,570 17.8% 15.2% 36,941
7111 Performing Arts Companies $42,997 12.6% 12.0% 150,990
7112 Spectator Sports $115,198 3.7% 8.9% 190,415
7113 Promoters of Performing Arts, Sports, and Similar Events $38,114 53.5% 17.7% 155,287
7115 Independent Artists, Writers, and Performers $38,427 -0.5% 4.3% 298,431
7211 Traveler Accommodation $31,129 5.4% 9.3% 1,910,137
53112 Lessors of Nonresidential Buildings (except Miniwarehouses) $64,984 1.1% 2.9% 201,608
Weighted Average/Total $30,273 2.6% 8.7% 7,708,429
Source: EMSI, Garner Economics
Note: Lifestyle Entrepreneurs does not have an associated NAICS code. Co-Working & Shared Office Facilities falls under NAICS 53112: Lessors of Nonresidential Buildings.

Raising the Bar: A Competitive Realities Report and Target Industry Strategy for Missoula, Montana | Page 92
Table 9.18: Experiential Economy Existing Pool of High-Demand Occupations, 2017
Description Employed in
Missoula County LQ
Retail Salespersons 2,527 1.30
Cashiers 1,858 1.23
Customer Service Representatives 1,138 0.97
First-Line Supervisors of Sales Workers 1,040 1.39
Recreation and Fitness Workers 709 2.41
Stock Clerks and Order Fillers 670 0.78
Grounds Maintenance Workers 615 1.03
Receptionists and Information Clerks 570 1.26
Athletes, Coaches, Umpires, and Related Workers 352 2.67
Hotel, Motel, and Resort Desk Clerks 246 2.30
Designers 218 0.79
Buyers and Purchasing Agents 167 0.88
Property, Real Estate, and Community Association Managers 162 1.40
Writers and Editors 136 0.96
Miscellaneous Entertainment Attendants and Related Workers 127 0.86
Marketing and Sales Managers 119 0.46
Actors, Producers, and Directors 93 1.07
Musicians, Singers, and Related Workers 89 0.80
Artists and Related Workers 87 0.99
Miscellaneous Sales and Related Workers 73 0.94
Meeting, Convention, and Event Planners 69 1.40
Lodging Managers 48 2.46
Broadcast and Sound Engineering Technicians and Radio Operators 47 0.76
Miscellaneous Media and Communication Workers 45 0.95
Miscellaneous Transportation Workers 27 1.61
Tour and Travel Guides 21 0.90
Miscellaneous Media and Communication Equipment Workers 17 1.78
Miscellaneous Entertainers and Performers, Sports and Related Workers 15 1.01
Source: EMSI, Garner Economics

Raising the Bar: A Competitive Realities Report and Target Industry Strategy for Missoula, Montana | Page 93
CHAPTER 10: RECOMMENDATIONS TO ACHIEVE SUCCESS
To ensure that Missoula (City and County) can meet its full potential, leverage its many assets, and strengthen its business climate to retain current companies and attract the recommended business targets, MEP, City, and the County must be proactive in driving
Missoula County’s economic future and setting it apart from other peer jurisdictions.
The following observations, conclusions, and recommendations are based on data and feedback collected during Phase 1. They also build upon the assessments made to prioritize the business targets identified in Chapter 9
As noted in the introductory chapters, this assessment—and the observations herein—were developed from a site selector’s perspective. The recommendations are built with an eye toward those areas that will differentiate Missoula County. The goal of this target industry strategy is to provide a framework for the community to consider its economic development service delivery and activities to support and augment MEP’s work to recruit companies and the work of other City and County entities engaged in economic development. The recommendations look at Missoula as a whole, but are limited to the successful execution of the targets, since this is not a comprehensive strategic economic development plan.
Recommendations for action are categorized under three areas of opportunity: Enhance the Product (Product Improvement), Tell the Story (Marketing), and Execute Effectively (Organizational) (Figure 10.1). In some instances, and where relevant and possible, a cost estimate to implement the noted recommendation has been offered.
An estimated timeline for the optimal application of the recommendations is included in the Recommendations Summary table on pages 115-116.
FIGURE 10.1: RECOMMENDATION CATEGORIES
Enhance the Product
Product improvement initiatives to ensure Missoula is in a
competitive position to attract, retain, and grow the types of
companies and sectors it desires
Tell the Story Execute Effectively
Product marketing actions for
Missoula to share the economic
dynamism of the area with target
prospects and talent
Organizational adjustments that
allow MEP or other EDOs to align
its mission and focus on those
areas that will directly impact the
economic growth the community
desires

Raising the Bar: A Competitive Realities Report and Target Industry Strategy for Missoula, Montana | Page 94
I. ENHANCE THE PRODUCT (ASSET DEVELOPMENT)
Strategy:
Strengthen the County’s assets in key areas that support MEP’s and the community’s goal of attracting and growing more high-quality economic activities, while protecting the quality of the community.
The County’s “product” is defined as the infrastructure—including a favorable business climate—needed to attract investment to Missoula County. Local marketing efforts will only be successful if the County has a community “product” to sell. This includes sites and buildings, utility infrastructure, workforce development, entrepreneurship, incentives, and other amenities to attract targeted business sectors pay higher wages.
1. Advocate for sustainable funding for the community’s economic
development infrastructure and catalyze programs to use the monies
effectively.
Observation: Missoula must strengthen several areas of its economic development infrastructure with large investments or recurring funding to differentiate the region. Such transformational efforts are necessary to demonstrate that Missoula is invested and dedicated to providing a world-class environment and business climate for diverse projects and businesses. However, given the current tools available to municipal fiscal authorities in Montana, raising funds for these needed investments is difficult.
Montana is one of four states that does not have a sales tax. A local option sales tax has been debated for years, and the legislature came close in 2017 to allowing communities to vote on a local option sales tax in their respective jurisdictions. The Montana League of Cities and Towns endorses a sales tax (Resolution #2016-17 LOCAL OPTION TAX). However, currently a local option sales tax for most municipalities still does not exist. A
4 https://mtrevenue.gov/taxes/miscellaneous-taxes-and-fees/local-resort-tax/
municipal fiscal authority in Montana is limited to collecting additional monies through property taxes. A few communities with a population of less than 5,500 where the majority of local employment is related to businesses catering to the recreational and personal needs of tourist visitors are allowed to charge a resort tax. The funds may be used for “any activity, undertaking, or administrative service that the municipality is authorized by law to perform,” including infrastructure and public services. Currently, ten municipalities have enacted the resort tax with voter approval, according to the Montana Department of Revenue4.
A sustainable funding source for Missoula (City and County) that would allow for similar investments would serve as a catalyst for local initiatives that are needed but would otherwise be difficult to implement.
One example of the return and impact of such foresight is the State of Texas’ economic development funding model. In 1979, the Texas Legislature decentralized economic development by giving cities and counties more control over their destinies. It allowed each entity to vote on an up to ½-cent sales tax for tools and investments needed to better sell themselves as a location for business (e.g., deal closing funds, entrepreneurial development, venture capital or early stage investment funding, and product improvement such as infrastructure or increased air service). As a result, site selection industry leaders consistently rank Texas as having one of the strongest economic development programs and as a best practice example of sustainable funding for economic development on the local level, with 680 local economic development corporations (EDCs) using some form of this funding mechanism. Texas has also ranked as the highest performing state in net new job growth for the last 18 years.

Raising the Bar: A Competitive Realities Report and Target Industry Strategy for Missoula, Montana | Page 95
Recommendation: Given the need to articulate and show its support for short- and long-term strategic economic development investments as it works to attract the business targets, Missoula (City and County) should create a sustainable funding source for economic development. This approach, if successfully enacted, would be transformational in nature and would have a profound, positive impact on the area’s ability to attract the types of companies and economic activity it desires.
Retail sales in Missoula City and County are strong, with nearly no retail leakage from the area and an estimated $2.3 billion in retail sales in Missoula County in 2017. The table below illustrates the forecasted additional funds that would be derived for economic development purposes using the Texas model of a local option sales tax.
Estimated Retail Sales for Missoula County 2017 $2,365,101,915
Impact of additional local option sales tax:
‒ Applying a 1/4 cent tax $ 5,912,755
‒ Applying a 1/2 cent tax 11,825,510
‒ Applying a 1 cent tax 23,651,019
This type of initiative is transformational and would truly set the region apart from many communities in both Montana and the United States. It would allow for industrial and office site development, municipal water and sewer in more areas of the County, broadband connectivity in the rural areas, subsidized air service as needed to enhance demand to certain destinations, deal closing opportunities (project opportunity fund), and more. This single effort would do more to transform the region economically and help to diversify its economy than any other recommendation noted.
2. Develop a real estate portfolio of additional sites and develop a
speculative building for the targeted business sectors.
Observation: As noted in the Assets and Challenges assessment (Chapter 3), an adage in the economic development profession is “no product-no project.” Missoula has two industrial sites that are considered “shovel ready” in economic development nomenclature: the Missoula Development Park and the Bonner Mill Tax-increment Financing (TIF) District, with the latter being a redevelopment project. Missoula’s Achilles’ heel is the limited availability of sites prepared for high-end office construction—Class A or B office space—and suitable industrial or distribution space (spec or available existing buildings). With speed to market being of extreme importance, the lack of these space options will cause Missoula County to be passed over by many of the recommended targets for a community that has these product options.
Recommendations:
A. Construct a multi-purpose speculative building
Missoula County should consider constructing a multi-purpose speculative building in the Missoula Development Park that will meet the initial requirements of many of those targeted business sectors identified in Chapter 9. These would include options for four of the five industry target groups.
Garner Economics recommends an industrial shell building of no less than 50,000 sq. ft., expandable to 100,000 sq. ft., with a ceiling height of no less than 32 ft. The building, if designed appropriately, would be a multi-functional building that can crossover to different industry sectors and not be limited to a singular use.

Raising the Bar: A Competitive Realities Report and Target Industry Strategy for Missoula, Montana | Page 96
B. Create a public-private partnership owned office park campus
Missoula County is severely limited in available Class A and Class B office space. Yet its economy is structured to attract those types of operations. The community would be more effective in attracting technology companies (either as startups or new re-locations/expansions) if it had the appropriate office space to house them.
MEP should engage an independent real estate broker or land use planning firm to undertake a market analysis of the best location for such an office park and devote the resources to create a public/private partnership to create a campus-like office park. The park would be similar to municipally-owned industrial parks in the United States and would be created under the same premise behind the development of Missoula Development Park.
The successful passage and implementation of Recommendation 1 above (a sustainable funding source for economic development) would successfully support the funding for these two recommendations to create a real estate portfolio.
Cost: $35,000 +/- to engage a real estate analysis
II. EXECUTE EFFECTIVELY (ORGANIZATIONAL)
Strategy:
Build a focused economic development service delivery mechanism for existing and potential businesses in Missoula (City and County) that are aligned with the vision for the area and the needs of the target business sectors.
1. Realign the Missoula Economic Partnership (MEP) to enhance its
effective economic development service delivery.
Observation: In each of the focus groups we asked the question, “What are your past experiences with and current perceptions of the various economic development efforts by group(s) involved in investment attraction, retention, the hospitality sector, and assisting entrepreneurs? How could these efforts or groups be improved?” Responses were most critical of the “alphabet soup” of economic development organizations, all vying for the same resources, with several perceptions that some duplicate services. Quotable examples include:
“Collaboration—everyone says it at every meeting, but I’m not sure we’re there yet—one step forward, two steps back.”
“They are all rudderless—groups are always spinning around with a new focus. There doesn’t seem to be a plan for economic development. We need leadership—from a single entity.”
“There are a lot of cliques in the town. It’s really easy to get hated here if you’re not careful.”
“The foundation is here—incredibly impressed by what exists and what is possible—but everyone is so strapped for resources. If there could just be some planning that would create focus and collaboration…and throw money at that.”

Raising the Bar: A Competitive Realities Report and Target Industry Strategy for Missoula, Montana | Page 97
The recurring theme from both the focus groups and electronic survey respondents is that the various economic development organizations (EDOs) need to cooperate, coordinate, and communicate more. To achieve that goal, consolidation is encouraged.
Given its picturesque surroundings and proximity to international tourism destinations, the area should also consider tourism when right-sizing its economic development efforts. Tourism is economic development and tourism development efforts need to be at the table with any economic development discussion. Tourism is about placemaking, and quality of place is a key consideration in investment promotion.
Moreover, MEP’s promotional budget compared to those of peer organizations is rather low, especially if the area wants to compete and differentiate itself from other business locations. The entire MEP budget for promotional (marketing) outreach is $46,000. Furthermore, the operating budget for MEP is approximately $700,000. This total budget is also a relatively low budget when compared to similar sized EDOs nationally (based on population). In contrast, the EDO of Great Falls, MT has a 2018 operating budget is $1.5 million and a marketing budget of over $200,000.
Recommendation: MEP should reorganize as a holding company, led by a President/CEO that has the leadership qualities needed to achieve success in economic development and who can serve as both as a catalyst and a facilitator to work with both the public and private sectors to achieve wealth building opportunities for Missoula. MEP would evolve from a reactive organization that serves only as a facilitator to one that is proactive and a catalyst for transformative change. The operating units under the reconstituted MEP would be for talent development and attraction (workforce), business investment (which will include attraction, retention and entrepreneurship), and Destination Missoula. The latter two organizations and efforts are engaged in the promotion and attraction of external investment, entrepreneurs, tourists, and conventioneers. With the creation of a workforce/talent development entity, the reorganization would be a logical consolidation for marketing Missoula as a place for business and talent (especially since tourists will sometimes become investors). The emphasis on talent development (both increasing and aligning skills of the current workforce and attracting talent and lifestyle entrepreneurs) would be institutionalized.
“Collaboration—everyone says it at every meeting, but I’m not sure we’re there yet—one step forward, two steps back.”
—Focus Group Participant

Raising the Bar: A Competitive Realities Report and Target Industry Strategy for Missoula, Montana | Page 98
Under this structure, the MEP board will become a Board of Trustees for the newly formed holding company. Trustees should be appointed by the City and County, and with private sector representation from the MEP that make up private sector investors. The new entity would collaborate with the City’s Office of Redevelopment, Housing, and Community Development (MRHCD). It will also collaborate with the Missoula County Commission and their efforts related to the County’s tax increment finance and tax allocation districts, which works to facilitate business investment outside the corporate limits of Missoula City. Figure 10.2 illustrates the three entities and their interconnected relationship. The MEP board of directors will need to conduct a salary survey to determine the level of compensation for the President/CEO of MEP. The same salary survey should be able to determine the appropriate range for the director of the reconstituted Economc Development Council, a department of the MEP
but with high visibility (investment attraction, retention and entrepreneurship responsibilities).
Cost: $65,000 (annual base) for the new MEP workforce director; CEO and EDC director salaries to be to be determined. One net new position for MEP. The CEO salary will be adjusted higher for the correct hire. Director of the EDC’s salary will be adjusted accordingly based on comparable market comparisons.
FIGURE 10.2: MEP REORGANIZATION

Raising the Bar: A Competitive Realities Report and Target Industry Strategy for Missoula, Montana | Page 99
2. Create a “Business Solutions Center” as a one stop location of the
various EDOs in Missoula that also offers tech space for second stage
companies.
Observation: Missoula lacks both Class A office space and options for 1,000-5,000 sq. ft. of space for both start up and second stage technology or life-science related companies. Moreover, as noted above, the area’s economic development support infrastructure is crowded and not easy to navigate.
Recommendation: MEP should advocate for the development of 25,00-30,000 sq. ft. office space. Ideally, 20 percent of the resulting development should be set aside for the City and MEP to house their respective economic development offices and to provide rental opportunities for technology companies. The development should be targeted toward downtown. This would continue Missoula’s role as a key player and factor in the redevelopment of downtown. This would provide startups and second stage companies opportunities to grow in the attractive Class A space and to attract and retain talent and grow their businesses. The development could be structured to encourage companies to find larger space as their operations expand and thrive.
III. TELL THE STORY (MARKETING)
Strategy:
Share the region’s story as a competitive business location with executives representing companies in the area’s key industry sectors and target business sectors, site selection consultants, and professionals with skills demanded by those sectors.
1. Enhance MEP’s marketing tools.
Observation: MEP’s business solicitation efforts will need to take a more proactive and focused effort if it is to be successful in attracting target businesses. While implementing this targeted industry strategy, more emphasis should be placed on fine-tuning messages and marketing to target audiences that will have a direct impact on the area’s economic development goals.
MEP could use the wealth of information and data provided in this body of work as the foundation and basis of an integrated plan for communications, marketing, and public relations. Doing so will strengthen the region’s position for economic development, entrepreneurship, business attraction, and talent attraction to domestic and international audiences comprised of C-level executives, site selectors, and skilled professionals.
Additionally, research and experience have shown that between 30 and 40 percent of all investment projects in the United States are facilitated by site selectors and real estate brokers. This means that most investment projects emanate from companies directly. It is incumbent upon MEP to have a marketing framework that touches both audiences. The recommendations suggested below are aimed at addressing both audiences.

Raising the Bar: A Competitive Realities Report and Target Industry Strategy for Missoula, Montana | Page 100
A. Develop a unified brand for Missoula. Observation: Developing a unified brand for Missoula was recommended in 2010 but was not implemented. MEP, Chamber of Commerce, Destination Missoula, and the County and City governments all have distinct logos, taglines, and messaging for external audiences. Since marketing is expensive, best practice research and experience suggest a successful destination/location marketing strategy is to generate a unified voice for investment or spending (tourism) opportunity in Missoula (City and County). To do so, all organizations must agree to have a unified, cohesive brand that promotes the community to both internal and external audiences. Based on each organization’s respective audiences, tailored tag lines can be created to serve individual audiences.
Destination Marketing Organizations have successfully implemented the principle of a unified brand to raise brand-awareness of areas and market them cohesively. In a webinar focused on the positive influence tourism can have on traditional economic development activities, Atlas Advertising noted the following:
• Places leave the most lasting impressions, tangible or intangible, on human beings as individuals, whether they are deciding where a company stays or relocates or where they want to vacation.
• As information is more readily available and the competition to attract talent or visitors heightens, visitors and companies face more difficult decisions. The onset of digital and easily accessible information and data is a game-changer in how decisions are made.
• More and more, companies are seeking to locate where the workforce and talent are, and visitors tend to seek options for their next vacations based on information they glean from the internet. How a community’s brand attracts and retains those audiences is the destination challenge of the next 25 years.
• With a discernible and credible brand, communities can be more successful and sincere in having a real dialogue about the community’s assets, differentiating factors, and authentic character.
Recommendation: MEP should lead the development of an overall, unified brand identity to be used by the entities noted above involved in economic development and tourism promotion to external audiences.
As such, MEP and related organizations should engage a firm that specializes in brand development to create a unified brand for Missoula. Collectively, these organizations would leverage marketing budgets by showing a consistent mark and tagline, globally for investment promotion. Once the unified brand is created, all entities should use and follow the resulting campaign.
Cost: $80,000 for brand creation (does not include collateral development or advertising).

Raising the Bar: A Competitive Realities Report and Target Industry Strategy for Missoula, Montana | Page 101
B. Enhance the MEP website to address the needs of location consultants and potential investors (companies).
Observation: Though the MEP website contains much valuable information for potential investors, it is difficult to find existing data on the current website or the data may be irrelevant or not updated. The site also has a dated (visual) feel compared to the other best practice websites noted below. An economic development organization’s (EDO) website is its most important marketing tool to attract investment into the region. As such, the MEP website needs to be designed to offer the resources that meet its primary and specific audiences’ needs.
Recommendation: As MEP works to implement its business development and marketing efforts for the area, its website should be adjusted to serve both the information needs and the interests of location advisory audiences and companies doing site searches on their own. The site’s navigation functionality, graphic appeal, and available data should be built and directed to these external audiences.
From the perspective of a location advisory firm, Garner Economics suggests the following recommendations to enhance the MEP website:
• Navigation should be restructured to better serve each target sector, especially for recruitment. Successful websites have oriented navigation by audience type, such as the optimal industry targets noted in Chapter 9.
• While advisors will begin their expansion or location search via the internet, eventually real-time contact with considered locations is made. Contact information (especially phone) should be clearly visible on each page (e.g., in the header of the site) and on all material for printing or downloading.
• Data most commonly considered in the location process by site selectors and corporate end users should be available and easily accessible. The data compiled for the MEP from this report should be used.
• A PDF creator should be employed so visitors can customize documents for printing or downloading.
• Branded, thematic maps should be created to orient and inform website visitors.
• Social media tools should be integrated into the website’s strategy given the local audience and investors that use such tools. Site location consultants and many companies that are engaged in the site location search will not use social media as frequently. However, potential work talent and employees do, and they may influence their company’s location decision.
• Content providing a county and regional overview and statistical data should be created and translated into the languages of potential international clients (e.g., Chinese, German, Hebrew, Japanese, and Spanish).
Best practice examples for effective EDO websites include:
‒ EDC of Southwest Indiana (http://www.southwestindiana.org) ‒ Charlotte Regional Partnership (http://charlotteusa.com) ‒ Boone County, Indiana (http://booneedc.org/) ‒ Chambers County, Alabama (http://www.chambersida.com/)
Cost: $25,000 +/-

Raising the Bar: A Competitive Realities Report and Target Industry Strategy for Missoula, Montana | Page 102
2. Enhance MEP’s external outreach efforts to reach the targets.
As noted above, between 30 and 40 percent of all investment projects in the United States are facilitated by site selectors and real estate brokers. Given this continued practice, Missoula should work to target its attraction communications and efforts to this group.
Recommendations:
A. Execute a process for lead generation and business target profiling with the targeted companies.
To jump-start MEP’s ability to fully utilize the business sector targets and subsector targets identified in Chapter 9, MEP should engage a marketing firm to provide lead generation services that identify qualified investment opportunities. This service should yield a list of companies that would be hot prospects for MEP’s recruitment efforts. The identification effort would include the company’s current location, contact information for the C-level executive responsible for choosing future operation sites, business description [NAICS code, etc.], and magnitude of recent growth.
If done correctly, the lead generation identification process is methodical and evaluates key company performance metrics including sales, employment, growth, number of locations, and other relevant factors. The process tracks and evaluates “events” undertaken by companies in the identified target business sectors that indicate expansion or consolidation. Such events would include mergers and acquisitions, executive changes, or technology development. The process would also track overall industry trends. Through this evaluation of indicative corporate behavior, the lead generation firm would identify specific companies and qualified leads that are “best bets” to consider an expansion opportunity in the short and medium term.
Engaging a firm with a lead generation capacity will enable MEP to conduct its marketing efforts in a focused and more direct manner. With a list of qualified leads, MEP can focus its efforts on specific companies and concentrate broader marketing efforts in areas where there is a larger concentration of the qualified companies. The approach would be more cost-effective and would focus business development efforts.
Cost: $15,000–35,000
B. Develop familiarization (FAM) events for consultants and companies.
While MEP can present itself and its assets well on paper (and on its website), the best way to introduce the many assets the community has to offer to location advisors and companies is to allow them to experience Missoula firsthand. Site location consultants typically handle 30 percent of all location advisory work in the United States (which means companies do 70 percent of their investment analyses internally). Engaging these consultants is a cost-effective way to introduce Missoula to corporate relocation decision-makers and extend the Missoula brand. With a FAM event, MEP has an opportunity to make a new impression with this important audience.

Raising the Bar: A Competitive Realities Report and Target Industry Strategy for Missoula, Montana | Page 103
Once a year, MEP should contract with an organization such as the Site Selectors Guild, an association of the world’s foremost professional site selection consultants, to conduct a two-day tour of the area. Such “familiarization” or “FAM” events allow experts to discover Missoula firsthand and/or be briefed on updates and enhancements to the region’s business climate. Successful FAM events are predicated on having some sort of draw that will attract high-quality consultants, which in turn reinforces the unique brand of the region and its value as a business location.
http://www.siteselectorsguild.com/themes/site_themes/ssg/uploads/AdvisoryForums.pdf
Cost: $25,000-35,000 each year, depending on the number of consultants or interactions desired.
C. Create a cadre of Economic Development Ambassadors to extend the Missoula brand.
The Missoula region is rich with business executives who travel the globe for their respective companies. MEP can leverage those local connections and engage those executives to promote business investment in the region. Such third-party testimonials are an effective way to promote the area to their peers internationally.
MEP should develop an ambassadors program to train willing business leaders to assist the organization in extending the brand of the region as a place to do business. MEP staff would provide the ambassadors with talking points and collateral to help them tout the region's business attributes.
Cost: $5,000 for materials

Raising the Bar: A Competitive Realities Report and Target Industry Strategy for Missoula, Montana | Page 104
CHAPTER 11: CONCLUSION
To be successful in executing the Target Industry Strategy (TIS), MEP and the Missoula region will need to leverage its unique mix of assets to strengthen the area’s product and market its value proposition to the targets. While Missoula has a strong base from which to build, the area must be more proactive in building the assets and infrastructure needed to attract the
higher-quality targets and companies. As noted in the Assets and Challenges Assessment, there are several areas where improvement would better set Missoula apart from peer communities. To be successful, MEP needs to focus its targeted industry efforts and find more resources to devote to its economic development marketing.
To create change, MEP and the entire community will need to be more proactive and champion long-term investments that will serve both existing and new companies. MEP must take a more structured approach to telling the area’s story. With this new strategy, MEP should communicate the County’s assets more specifically to the companies that
the community wants to attract, while also leveraging those assets to continue to serve the existing company base.
Inherent in this change will be a more proactive and outward-facing marketing and business recruiting effort. In addition to targeting the optimal industries noted earlier in this report, MEP must work with other economic development partners and stakeholders to create and encourage the development of the spaces and places where such activity will occur.
***
Garner Economics would like to thank the MEP staff and leadership for their help and assistance during this process. Their compilation of data and information, as well as their openness and willingness to explore various opportunities to strengthen operations, have contributed to the richness and rigor of this report. Additional thanks to Mayor John Engen from the City of Missoula and Ellen Buchannan from the Missoula Redevelopment Authority.

Raising the Bar: A Competitive Realities Report and Target Industry Strategy for Missoula, Montana | Page 105
RECOMMENDATIONS SUMMARY
The below recommendations form the core of the target industry strategy for Missoula and inform the MEP’s economic development recruitment and
marketing work for years to come. By telling its story more succinctly and taking proactive steps to strengthen its assets to be a more competitive location
for the recommended targets, Missoula can build economic opportunities for its residents, businesses, and future residents. These recommendations were
developed given the analysis and assessments of the first two phases of the project.
Strategy Actions Timing
Enhance the Product
(Asset Development)
Strengthen the County’s assets in key areas
to support MEP’s and the community’s goal
of attracting and growing more high-quality
economic activities, while protecting the
quality of the community.
1. Advocate for sustainable funding for the community’s economic development infrastructure and catalyze programs to use the monies effectively.
2019
2. Develop a real estate portfolio of additional sites and develop a speculative building for the targeted business sectors.
2020
A. Construct a multi-purpose speculative building. 2021
B. Create a public-private partnership owned office park campus. 2020
Execute Effectively
(Economic Development Service Delivery)
Build a focused economic development
service delivery mechanism for existing and
potential businesses in Missoula (City and
County) that are aligned with the vision for
the area and the needs of the target
business sectors.
1. Realign the Missoula Economic Partnership (MEP) to enhance its effective economic development service delivery.
2019-2020
2. Create a “Business Solutions Center” as a one stop location of the various EDO’s in Missoula that also offers tech space for second stage companies.
2021

Raising the Bar: A Competitive Realities Report and Target Industry Strategy for Missoula, Montana | Page 106
Strategy Actions Timing
Tell the Story
(Marketing)
Share the region’s story as a competitive
business location with executives
representing companies in the area’s key
industry sectors and target business
sectors, site selection consultants, and
professionals with skills demanded by those
sectors.
1. Enhance MEP’s marketing tools. 2019
A. Develop a unified brand for Missoula. 2019
B. Enhance the MEP website to address the needs of location consultants and potential investors (companies).
2019
2. Enhance external outreach efforts to reach targets. 2019-2024
A. Execute a process for lead generation and business target profiling with the targeted companies.
2019
B. Develop familiarization (FAM) events for consultants and companies. 2020
C. Create a cadre of Economic Development Ambassadors to extend the Missoula brand.
2019

Raising the Bar: A Competitive Realities Report and Target Industry Strategy for Missoula, Montana | Page 107
APPENDIX A: FOCUS GROUP SUMMARY
Note: The comments listed below are summarized from the focus group discussions. The responses are reported as they were offered. They are not necessarily statements of fact, but rather opinion or perception. The number in parentheses indicates the number of focus groups where participants expressed the sentiment or raised the concern.
1. What are several words or phrases that describe the Missoula region?
Descriptors of the region were predominantly positive. Focus group participants noted the quality of place of the region thanks to the natural beauty of the region, as well as the resurgence of the downtown. They noted the progressive, diverse, and engaged community and the pervasive sense of opportunity. Challenges noted include the land-locked nature of the region and the lack of air-service and remote geographic position.
Specific responses include:
• Beautiful (3)
• Outspoken (3)
• Diverse (3)
• Outdoorsy (2)
• Emerging/entrepreneurial (2)
• Growing (2)
• Opportunity (2)
• Zoo town
• Livable
• Quality of life
• Unique – weird
• University town
• Somewhat smoky
• Activists-oriented
• Travel restricted
• Vibrant
• Discovered
• Remote
• Community
• Potential
• Home
• Relaxed
• Progressive
• Intelligent
• Creative
• Engaged
• Hippies
• Involved
• Land-locked
• Adventure
• Collaborative

Raising the Bar: A Competitive Realities Report and Target Industry Strategy for Missoula, Montana | Page 108
2. What do you think are some of the biggest obstacles that inhibit the City and County in their ability to attract, expand, or retain businesses and investment?
Respondents in all the focus groups noted the level of air-service and lack of talent/high-skilled workers as obstacles. Several groups noted the lack of affordable housing and the low wages offered as deterrents. The level of taxes, cost of goods, lack of available land, weather, and isolated location were other often noted responses.
• Labor force, lack of talent (4)
• Limited air-travel opportunities (4)
• Housing costs, lack of affordable housing and housing stock (3)
• Lower Wages (3)
• Taxes (2)
• Costs of goods (2)
• Weather/climate (2)
• Isolated (2)
• Regulations (2)
• Lack of available land (2)
• Infrastructure—broadband, rail, and interstate access
• Speed of getting things done—or lack thereof…
• Lack of institutional capital
• Transportation—roadways/corridors
• Lack of facilities—biotech lab space
• Income
• Lack of planning
• Money/resources
3. On a scale of 1 to 5, with five being best, how would you rate the business climate of Missoula City? the County?
Average scores given by group were as follows:
Large Employers High-Tech Industry Smaller Employers Government/Academia
Missoula 3.20 3.50 3.25 4.06
County 3.11 3.44 3.33 3.59
The following comments were given to explain the scores:
Smaller companies had less of a problem with regulations and policies; larger companies commented that the council often changes interpretations and makes the processes unpredictable. “City Council is more to populism.”
One group noted that Missoula has a reputation for being “fairly anti-business.”
One participant noted that there is more red tape than he expected, but that once he got into the system and knew the staff who could help, it has been much easier.

Raising the Bar: A Competitive Realities Report and Target Industry Strategy for Missoula, Montana | Page 109
Business climate comments, continued
One focus group drew a comparison to Bozeman where it seems as though there is more local support for economic development. Their policies seem to be more tangible and it seems easier to do business there.
Compared to other markets/states, the city doesn’t play as nicely with the economic development organizations.
A lot of the leadership here is fragmented versus other markets—lots o points of light, but you can’t tell if they are pointed in the same direction. Politics in Missoula is polarized.
One participant who ranked the county lower than the city notes that the county does not have as broad a tool box.
A few quotes:
“Development services are good to work with but interpretations are sometimes outside of the regulations; the Council appears to be back of the envelope and change staff recommendations without much forethought.”
“City leadership has good vision—pro-growth. Having worked in Seattle and LA, it is much simpler to start a business in Missoula.”
"City tries to invest in infrastructure and look at being accessible. They are better communicators and more responsive to the private sector and building services for business."
4. What do you see as the area’s strengths?
Responses regarding the area’s strengths mirrored the responses to question #1, with all the groups noting the high quality of place that makes it easy to retain workers and manifested in the availability of outdoor recreation as well as arts and culture. Focus group participants also frequently noted the shared community values and sense of collaboration, the higher education institutions in the region, the educated workforce, and accessibility to officials as assets of the region.
• Quality of place (4)
• Shared community values and focus (3)
• Local colleges and universities (3)
• Quality healthcare (3)
• Educated workforce (2)
• Accessibility to officials (2)
• Rich arts and cultural environment (2)
• Access to outdoors and recreation (2)
• MEP
• Lots of support for local
• Support for entrepreneurs
• Easy to retain talent
• Downtown
• Work ethic
• Cost of living (compared to many places)
• Family-friendly
• Individualism
• K-12 schools

Raising the Bar: A Competitive Realities Report and Target Industry Strategy for Missoula, Montana | Page 110
5. How do you see the current labor situation in the area (both quality and employee attraction and availability)?
All focus group noted the effect of the gap between wages and housing prices on labor availability. The noted the “Mountain tax” and noted that its easier to convince labor to take a lower rate because of it.
Most noted that the quality of the minimum wage/hourly labor force is weak.
The groups were mixed as to their use of workforce development programs. All groups did note that the region is not fully-leveraging the graduates of the University of Montana and that more work could be done to better align needed skills and university curricula. Those saying the system needs improvement note that there are programs, but it is difficult to find them.
The region faces the same problem as is prevalent nationally in terms of sourcing qualified trades people.
Comments were made regarding the labor tax in Montana and the need to explain it to new employers.
For higher-wage earners and those who are mobile, participants note that it is easy to attract and retain that level of talent if the region’s lifestyle
fits with those workers: “If you have the right story, it’s super easy to attract talent—for generic work (with lower-skilled labor), it is harder.” The group noted the example of ClassPass.
Some industries/clusters do have difficulty recruiting talent (biotech, for example) because the market is rather thin and talent is hesitant to commit to moving given the lack of other opportunities. "Who we can attract here won't stay long."
Several focus group participants also noted the difficulty in recruiting from the millennial generation: “There’s a generation of people coming through the workforce that isn’t aligned with what a hard day’s work is like. In manufacturing—executive talent and manufacturing—it is hard to find floor people. There’s a lot of babysitting that is going on right now.”
In technology, they reported that retaining employees is not the issue: the lack of applicants, even for entry-level jobs, is.
Other quotes: "We don't do business the same way here as other places."
"We need to work on developing people here."
6. What infrastructure is missing or unsatisfactory in the area?
• Affordable flights (3)
• Broadband (3)
• Community working spaces (2)
• Trails and sidewalks (2)
• Traffic flow
• Water service in county
• Bike path design
• Class B + office space
• Affordable housing
• Housing supply
• Riverfront trail connections and crossings
• Outdoor eateries
• Public transportation
• A by-pass road around the downtown/core
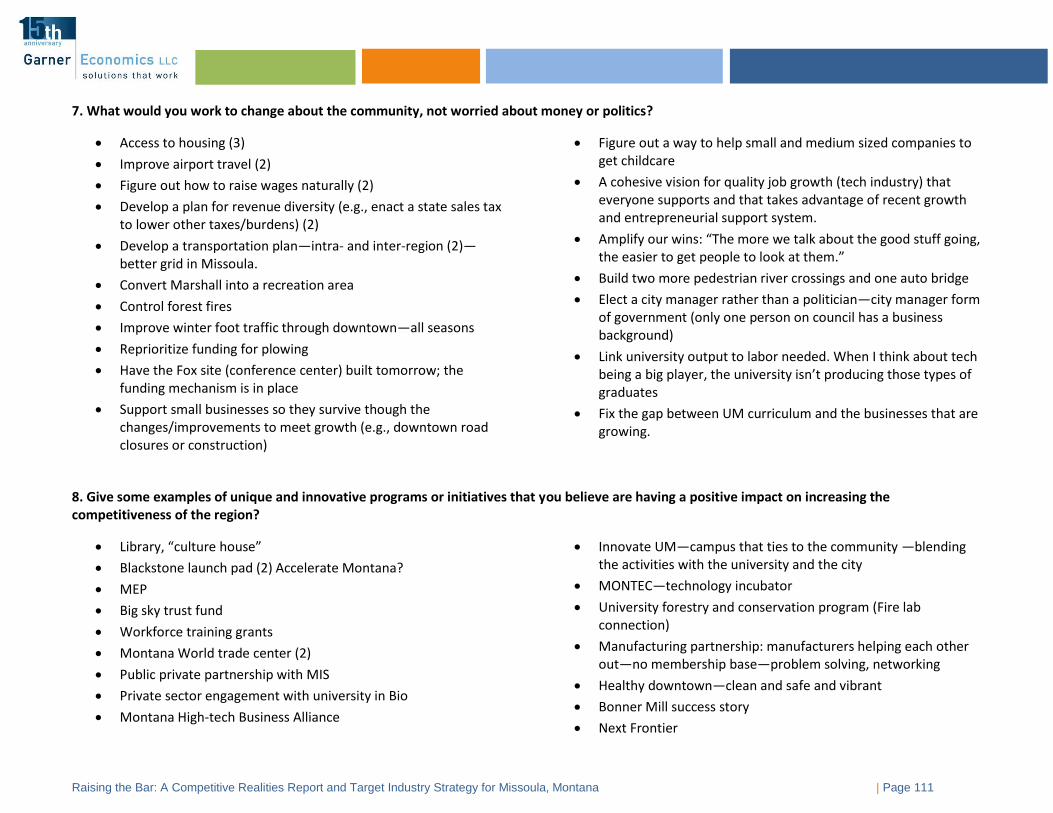
Raising the Bar: A Competitive Realities Report and Target Industry Strategy for Missoula, Montana | Page 111
7. What would you work to change about the community, not worried about money or politics?
• Access to housing (3)
• Improve airport travel (2)
• Figure out how to raise wages naturally (2)
• Develop a plan for revenue diversity (e.g., enact a state sales tax to lower other taxes/burdens) (2)
• Develop a transportation plan—intra- and inter-region (2)—better grid in Missoula.
• Convert Marshall into a recreation area
• Control forest fires
• Improve winter foot traffic through downtown—all seasons
• Reprioritize funding for plowing
• Have the Fox site (conference center) built tomorrow; the funding mechanism is in place
• Support small businesses so they survive though the changes/improvements to meet growth (e.g., downtown road closures or construction)
• Figure out a way to help small and medium sized companies to get childcare
• A cohesive vision for quality job growth (tech industry) that everyone supports and that takes advantage of recent growth and entrepreneurial support system.
• Amplify our wins: “The more we talk about the good stuff going, the easier to get people to look at them.”
• Build two more pedestrian river crossings and one auto bridge
• Elect a city manager rather than a politician—city manager form of government (only one person on council has a business background)
• Link university output to labor needed. When I think about tech being a big player, the university isn’t producing those types of graduates
• Fix the gap between UM curriculum and the businesses that are growing.
8. Give some examples of unique and innovative programs or initiatives that you believe are having a positive impact on increasing the competitiveness of the region?
• Library, “culture house”
• Blackstone launch pad (2) Accelerate Montana?
• MEP
• Big sky trust fund
• Workforce training grants
• Montana World trade center (2)
• Public private partnership with MIS
• Private sector engagement with university in Bio
• Montana High-tech Business Alliance
• Innovate UM—campus that ties to the community —blending the activities with the university and the city
• MONTEC—technology incubator
• University forestry and conservation program (Fire lab connection)
• Manufacturing partnership: manufacturers helping each other out—no membership base—problem solving, networking
• Healthy downtown—clean and safe and vibrant
• Bonner Mill success story
• Next Frontier

Competitive Realities Report and Target Industry Strategy for Missoula, Montana | Page 112
9. Are there programs in peer/competitor regions that the community should consider for the area? If so, give examples.
In some instances, participants named places and their programs; in other instances, they offered initiatives and programs Missoula could use.
Examples:
• Chicago: gateway green, beautification
• Bend, OR: transportation infrastructure
• Zero panhandling ordinance
• South Dakota: development park
• Spokane: development park
• Boise: use of the riverfront
• SPARK
• State of Utah: has innovation fund that funds and houses them
• UNC Friday center: K-12 computer training statewide
• Stanford incubator program
• Goldman Sachs: 10K small business program, partnership between Babson and Goldman Sachs
• Switzerland: social safety net for companies who support local workers
Programs needed:
• Programs to keep companies going or growing.
• Cities doing work around innovation and looking at productivity at the city level—chief innovation officers using data
• Kentucky research funding
• Deal with social issues holistically (e.g., panhandlers, homeless, childcare, transit)
• Need taxation structure to fund initiatives.
• Affordable housing initiatives
• Port idea—intermodal, inland port
• Private/public engagement at the university level
• Economic development entity owning infrastructure, sites or incubators
• Some angel and venture funds
• Programs to deal with the wage gap

Raising the Bar: A Competitive Realities Report and Target Industry Strategy for Missoula, Montana | Page 113
10. What types of companies do you think would be a good fit for the Missoula region and why?
• Medical and healthcare (3)
• High Tech – high-growth (3)
• Light resource manufacturing (2)
• Biotech/Bioscience (2)
• Traded professional services (2)
• Timber industry
• Software
• Cloud computing
• Knowledge-based professional services
• Creative class (music, film, arts)
• Ecotourism
• University has clinical research, but not using it to their potential.
• Breweries and distilleries
• Outdoor equipment manufacturing
11. What are your past experiences with and current perceptions of the various economic development efforts by group(s) involved in investment attraction, retention, the hospitality sector, and assisting entrepreneurs? How could these efforts or groups be improved?
General thoughts on ED in the area:
• Collaboration—everyone says it at every meeting, but I’m not sure we’re there yet—one step forward, two steps back.
• We have the desire, but there aren’t the communications—we need an inventory of what’s going on and who’s in charge.
• They are all rudderless—groups are always spinning around with a new focus. There doesn’t seem to be a plan for economic development. We need leadership—from a single entity.
• There has been improvement: “We’re doing no harm now so that’s good.”
• We don’t have the cohesion/single focus that they do in Bozeman.
• There are a lot of cliques in the town: “It’s really easy to get hated here if you’re not careful.”
• “The foundation is here—incredibly impressed by what exists and what is possible—but everyone is so strapped for resources—if there could just be some planning that would create focus and collaboration – and throw money at that.”
• “We all do a great job at our organizations—we want to collaborate, but we have to create an atmosphere to do it. There is lots of good discussion, but when we get back to our day jobs, we can’t prioritize it and we can’t implement. Not one of us can do it all; not one of wants to do it all, but we are missing a system to connect in Missoula.”
• “We are all striving to get funding from the same pool. We all hit up the same organizations.”
• More alignment in efforts than in the past
• There is little support from the state; the state doesn’t coordinate anything.

Raising the Bar: A Competitive Realities Report and Target Industry Strategy for Missoula, Montana | Page 114
Needs:
• Having a single resource/place where people can go to get the promotional materials to help brand Missoula
• Way to calculate the “Mountain tax” —trade-off between wages and living in Missoula and its natural assets
• “We need the future of MEP to be the dealmaker.”
• Focus on brand/perception of region; it is in need of repair. We need to figure out how to get the positive news covered.
• Need to find someone to build networks and identify connections.
• Figure out where the overlap between efforts
Organizations/initiatives to leverage:
• Mansfield Center—They bring in heavy hitters from all over the place—we don’t court the people who come here to visit them.
• MRA is a great entity helping with development in Missoula
• MONTEC

Raising the Bar: A Competitive Realities Report and Target Industry Strategy for Missoula, Montana | Page 115
APPENDIX B: SURVEY RESULTS
1. What are several words or phrases that MOST describe Missoula? (Choose up to five responses.)
Response Option # rec’d Outdoor Recreation 93
Expensive 71
Creative/Artistic 57
Place to raise a family 47
Attractive/picturesque 45
Highly-educated population 35
High poverty levels 32
Underemployed population 32
Environmental stewards 25
Vibrant 22
Tight-knit/community-oriented 22
Stagnant 11
Collaborative 10
Young population 10
Sprawling 8
Visionary 5
Other responses not noted above included:
• High cost of living compared to wages (5)
• Growing too fast (2)
• High or increasing taxes (2)
• Liberal
• Not family friendly
• Expensive commercial rent
• Ridiculous fees and regulations
• Anti‐motor‐vehicle
• “Large split between those with and those without”
• Fiscally irresponsible city
• Diverse
• College town
• Unfriendly to small business
• Lacking leadership
• Center for great arts and gateway to outdoor experiences

Raising the Bar: A Competitive Realities Report and Target Industry Strategy for Missoula, Montana | Page 116
2. What do you think are some of the biggest obstacles that inhibit the region in its ability to attract, expand, or retain businesses and investment? (Choose up to five responses.)
Response Option # rec’d
High cost of living 70
Cost/limited number of flights from MSO 58
High property taxes 54
Not a diversified economy/too reliant on certain sectors such as healthcare and government
36
Infrastructure is not well maintained 32
Remote location 31
Lack of a comprehensive community vision 29
Local workforce is not properly trained for business demands
27
Lack of industrial land or commercial real estate to support growing industries
23
Adverse to risk/late adopters of market trends 19
Raw land expense 19
Limited availability of local venture capital 14
Brain drain 13
Difficult to attract talent 10
Perception of being only a tourism/retirement community
5
Lack of highway access 1
Other Responses • Low wages (3)
• Slow to respond to requests for building permits and has too many antiquated restrictions for new businesses.
• None
• Lack of small business support
• No affordable office space
• City government prefers pet projects that waste tax dollars over focusing on the primary goal of local government: responsible infrastructure management
• Traffic
• Ridiculous fees, regulations, cost of commercial property, and anti-motor-vehicle
• Resistance to zoning
• Resistance to protecting prime farm land
• City does not always back expansion and growth
• Lack of institutions that can tax and then deliver infrastructure desired by businesses
• Lack of higher-level professionals
• Lack of high quality and available child care
• Lack of robust public transit
• Lack of area-based companies that compete nearer national compensation levels
• Local and state government are not business-friendly
• Current government leadership not focused on attracting industry that employs people at a livable wage

Raising the Bar: A Competitive Realities Report and Target Industry Strategy for Missoula, Montana | Page 117
3. On a scale of 1 to 5, with 5 being “Very Strong,” how would you rate the business climate of Missoula County (with business climate defined as those policies and laws enacted by the County that impact local businesses, either positively or negatively)? City of Missoula?
Response Option Missoula County
City of Missoula
1 - Very Weak 6 16
2 - Weak 29 25
3 - Average 53 44
4 - Strong 21 26
5 - Very Strong 2 4
4. What do you see as the area's strengths (Choose up to five.)?
Response Option # rec’d
Access to the natural amenities and outdoor recreation 98
Lifestyle 66
Quality of place/sense of community 54
Vibrant downtown 43
Higher education assets 42
Family-friendly atmosphere 37
Strong K-12 public schools 29
Food/craft beer scene 29
Strong healthcare 27
Optimal-size community 23
Availability of water 21
Cultural assets 21
Low cost of utilities 6
5. What local factors affect the current labor situation in the area (in terms of
quality, and employee attraction, and availability)? (Select all that apply.)
Response Option # rec’d
Tight overall labor market 47
Difficult to keep entry level-workers 41
Lack of workers with technical skills 37
Lack of skilled workers 31
The workforce overall is average 30
Lack of "employability" skills 26
Lack of experienced management 25
The workforce overall is good 25
Difficult to find employees who can pass drug tests 12
Absenteeism 11
The workforce overall is excellent 9
Lack of training for those in hospitality/tourism 4
Other comments included:
• Low wage levels make it difficult to attract/retain quality workers (8)
• Businesses should invest/train current employees rather than hiring
outside of the area
• Our University is deteriorating, making it difficult to attract skilled workers
• Employees want to get paid way more than local businesses can afford
• Too many college students willing to work for peanuts keep entry‐level
turnover high and wages low
• Lack of job opportunities for professionals
• Entry‐level jobs abound, but don't pay enough to support a living wage
• Visibility of the hiring companies to potential workforce is an issue
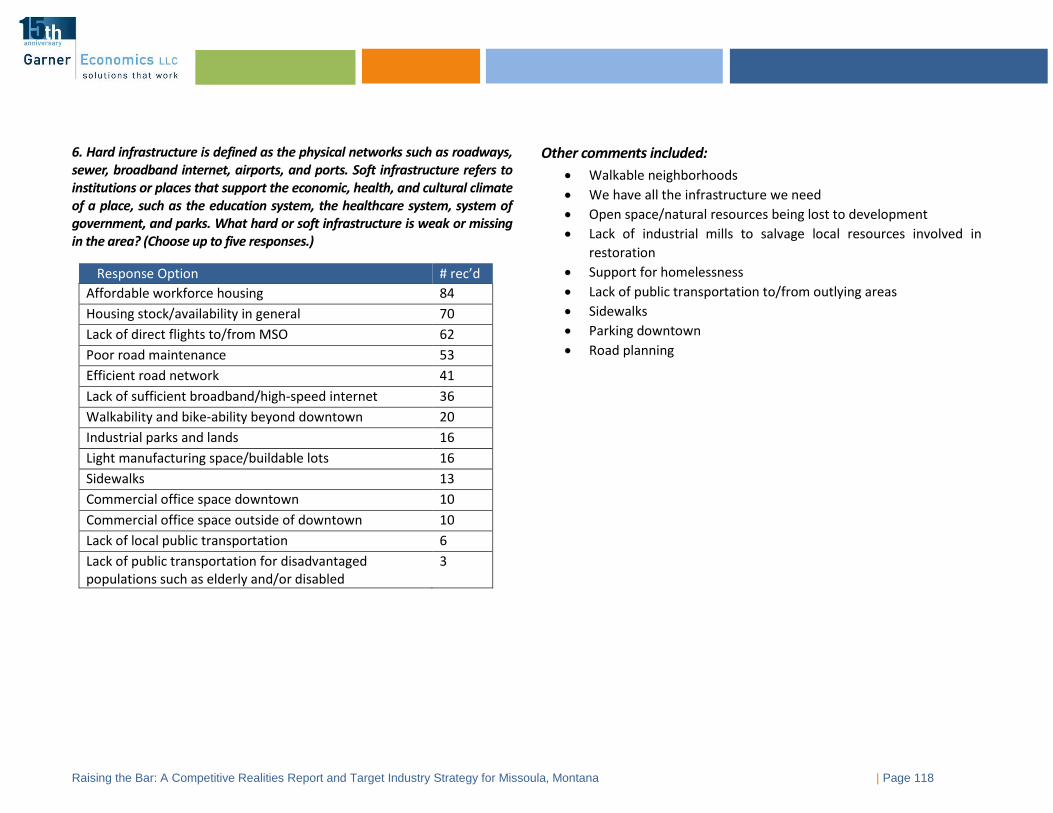
Raising the Bar: A Competitive Realities Report and Target Industry Strategy for Missoula, Montana | Page 118
6. Hard infrastructure is defined as the physical networks such as roadways, sewer, broadband internet, airports, and ports. Soft infrastructure refers to institutions or places that support the economic, health, and cultural climate of a place, such as the education system, the healthcare system, system of government, and parks. What hard or soft infrastructure is weak or missing in the area? (Choose up to five responses.)
Response Option # rec’d
Affordable workforce housing 84
Housing stock/availability in general 70
Lack of direct flights to/from MSO 62
Poor road maintenance 53
Efficient road network 41
Lack of sufficient broadband/high-speed internet 36
Walkability and bike-ability beyond downtown 20
Industrial parks and lands 16
Light manufacturing space/buildable lots 16
Sidewalks 13
Commercial office space downtown 10
Commercial office space outside of downtown 10
Lack of local public transportation 6
Lack of public transportation for disadvantaged populations such as elderly and/or disabled
3
Other comments included:
• Walkable neighborhoods
• We have all the infrastructure we need
• Open space/natural resources being lost to development
• Lack of industrial mills to salvage local resources involved in
restoration
• Support for homelessness
• Lack of public transportation to/from outlying areas
• Sidewalks
• Parking downtown
• Road planning

Competitive Realities Report and Target Industry Strategy for Missoula, Montana | Page 119
7. Without worrying about money or politics, what one thing would you work to change about Missoula to make it a more attractive place for business and investments? This open-ended text question solicited several different types of responses. Improve business climate
The answers provided straddled both sides of the spectrum. Some indicated that the area’s business climate could be improved by providing more services and working to influence future growth; others believe the situation can be improved by less regulation, lower taxes, and more policies to influence markets. Comments include:
• Decrease taxes and unwarranted policies (8)
• Support to small businesses/retailers (6)
• Lower property taxes (6)
• Manage growth (3)
• Be more business friendly (3)
• Let the market have a bigger role in determining how land is used and where
• A politic leadership that encourages economic growth and diversification and rewards entrepreneurial people in the community
• Change the local government attitude toward the energy industry
• More autonomy for the City government to act, without state restrictions.
• Stop constraining the housing market through government purchases of open space.
• Have one, shared economic goal
• Stop subsidizing private investment with tax dollars
• Implement sales tax
Transportation, infrastructure
• Work on transportation issues (infrastructure maintenance and growth and flow) (8)
• More connectivity (e.g., affordable and regular direct flights) (8)
• Broadly available high speed low latency internet (3)
• Walkability and a vibrant downtown (3)
• Create an event center (2)
• Expand airport
• More family-oriented business.
• Dealing with parking downtown for the public (customers)
• Increase number of good restaurants
• Build a Community owned events center.
• More “ready-to-build” industrial lots
• High-speed public transit
Economic Development priorities
• Increase higher-wage job opportunities (10)
• Provide incentives for businesses to relocate (2)
• Recruit/grow jobs for more skilled managers and employees
• Foster community and collaboration among common business functions and across industries

Raising the Bar: A Competitive Realities Report and Target Industry Strategy for Missoula, Montana | Page 120
Address social issues; lessen gap between housing costs and wages
• More affordable housing options (17)
• A more sustainable and effective method to address homelessness (2)
• Raise the minimum wage to a living wage.
• Less violent crime
• Municipal, excellent-quality, child care facilities, that offer outstanding care to all at a sliding scale
University of Montana
• Greater private-sector collaboration with the university
• Improve image of UM
• More qualified graduates from the university in technology and software engineering.
Miscellaneous
• Market sustainable practices.
• Legalize recreational marijuana
• Recycling
• Diversity
8. Give some examples of local, unique, and innovative programs or initiatives that you believe are having a positive impact on increasing the competitiveness of the Missoula region?
• None/Do not know of any (15)
• Blackstone Launchpad (9)
• Arts/food/culture (8)
• Missoula Economic Partnership (8)
• Montana High Tech Business Alliance (5)
• University of Montana and its high-quality research (4)
• Free public transportation (4)
• Bonner Mill site (3)
• Craft beer and distilleries (3)
• Montana Code School (3)
• New Innovation Corridor proposed by Blackfoot and partners (3)
• Infill (2)
• Airport expansion (2)
• C3 WorkLounge (2)
• Library and similar programs (2)
• City-owned water (2)
• More flights to a variety of cities (2)
• Walkability Master Plans (e.g., sidewalk, bicycle) (2)
• Tech industry (2)
• Open Space conservation program (2)
• Compassionate social networks (e.g., MUD, Home ReSource, Garden City Harvest) (2)
• Downtown collaborations (2)
• Missoula College (2)
• Missoula's Insectarium & soon-to-be-built Butterfly House
• Healthcare regional center
• River front development
• Hunting infrastructure (e.g., Back Country Hunters & Anglers, RMEF and Boone and Crockett Club headquarters
• Graduation Matters Missoula
• Community Wildfire Protection Plan

Raising the Bar: A Competitive Realities Report and Target Industry Strategy for Missoula, Montana | Page 121
Unique local programs, continued
• MCDC New Markets Tax Program
• Childcare Development Center
• Data science initiative at UM
• Land trust
• The Broadband Initiative
• Zootown arts center
• Farmers market
• Missoula Chamber of Commerce
• Nick Checota's businesses and community investments
• Downtown Missoula master plan
• Big Sky Trust Fund Economic Development grants
• Montana World Trade Center
• Hellgate Venture Network
• Next Frontier Capital
• IWT grant
• The Spark! initiative, First Friday, Out To Lunch
• Montana and Idaho Community Development Corporation
• Sustainability initiatives through the city and county
• New Fort Missoula Park/athletic field facility

Competitive Realities Report and Target Industry Strategy for Missoula, Montana | Page 122
9. Which of the below programs in peer/competitor regions should be considered for this area? (Choose up to five responses.)
Response option # rec’d
Workforce housing initiatives 71
Programs to close skills gaps between classroom training and workforce needs
49
Use of research and development credits or venture capital to encourage creative industry growth
45
Initiatives to strengthen regional transportation infrastructure
42
Affordable turn-key office space for early stage businesses
38
Cultivating an arts district 37
Use of research and development (R&D) to encourage industry growth.
29
Talent recruitment initiatives 27
Use of venture capital to encourage industry growth. Please specify which industry below.
26
Investment in sports and recreation venues 16
Are there other programs in peer/competitor regions that the region should consider for the area? If so, give examples.
Specific communities included:
• Bozeman, MT (3)
• Ogden, UT
• Bend, OR
• Plano, TX
• Denver, CO
Program suggestions included:
• Work share spaces/co‐working support (2)
• Future of our transportation within the city and getting to the city (2)
• Internet service as a public utility (2)
• Technical trade apprenticeship programs (2)
• B‐Corp Certification
• Mass timber Products
• Inclusion zoning to help provide permanently affordable housing.
• Open Data City initiatives
• Tiny home communities
• Alternative energy, especially solar
• Promote open and free markets
• Outdoor industry products and services
• Programs that reduce the tax burden on individual homeowners and
businesses.
• Tax incentives

Raising the Bar: A Competitive Realities Report and Target Industry Strategy for Missoula, Montana | Page 123
10. What types of companies do you think would be a good fit for Missoula?
Response Option # rec’d
Technology/IT 88
Lifestyle entrepreneurs (people who can work from anywhere)
70
Recreational equipment manufacturers 67
General, innovative manufacturing 63
Outdoor recreation providers 57
Professional services 56
Health and wellness-focused companies 53
Creative services 53
Experiential tourism 43
Other suggestions:
• Medical/Healthcare (4)
• Biotechnology/Life sciences (4)
• Agriculture (vertical farming, hydroponics, aquaponics) (3)
• Manufacturing (3)
• Sustainable Business (3)
• STEM (2)
• R&D in Clean Tech (2)
• Small/light manufacturing (2)
• E-commerce
• Alternative Energy
• Wood products
• Climate adaptation and mitigation
• Cryptocurrency
• Natural resource development
• Recycling, composting
• Brewing and distilling
• IoT
If applicable, which industry do you feel should be targeted for venture capital or Research and Development?
• High-technology (21)
• Software development (5)
• Medical/Healthcare (4)
• Biotechnology/Life sciences (4)
• Agriculture (vertical farming, hydroponics, aquaponics) (3)
• Manufacturing (3)
• STEM (2)
• R&D in Clean Tech (2)
• Outdoor recreation (2)
• Sustainable Business (2)
• Small/light manufacturing (2)
• E-commerce
• Alternative Energy
• Tourism and recreation including arts
• Wood products
• Green industries, innovating for sustainable solutions
• Climate adaptation and mitigation
• Cryptocurrency
• Natural resource development
• Recycling, composting
• Professional Services
• Brewing and distilling
• IoT

Competitive Realities Report and Target Industry Strategy for Missoula, Montana | Page 124
APPENDIX C: ASSETS & CHALLENGES ENDNOTES
Access to Markets
400 Mile Radius Results
Geography Name Year Total Population
Radius Region 2017 9,261,205
Source: U.S. Census Bureau 2 Ibid. 3 www.mwtc.org/; www.investusafund.com/ 4 I-90 runs E/W through Missoula. 5 Based in Missoula, Montana; Montana Rail Link (MRL) is a class II regional railroad, https://www.montanarail.com/documents/MRL-FactSheet-2016.pdf 6 Missoula International Airport is served by four airlines that offer direct flights to twelve major U.S. markets with connecting flights to thousands of cities worldwide. 7 2017 Broadband Access & Speed Available/ Percent of Population
Missoula Montana
2017 Broadband Access (25 mbps or faster)
88.4% 71.7%
2017 Broadband Access (100 mbps or faster)
87.9% 62.7%
2017 Broadband Access (1 gigabit)
0.3% 1.9%
Source: BroadbandNow
Labor
8 2,033 employed in production occupations with a LQ of 0.51. 9 10,800 employed in office and administrative support occupations with a LQ of 1.08. 10 Over 7,700 people employed in a variety of related occupations with LQ ranges from a low of 0.71 to a high of 2.26. 11 2,914 employed in managerial occupations with a LQ of 0.80. 12 Average Wages 2012-2017 Highest Figure Shaded
2012 2017 #
Change %
Change
Missoula County
$34,179 $38,755 $4,576 13.4%
Montana $34,381 $39,713 $5,332 15.5%
United States $46,905 $52,284 $5,379 11.5% Source: EMSI 13 Missoula College http://mc.umt.edu/academics/default.php 14 MT Department of Labor and Industry http://apprenticeship.mt.gov/ 15 University of Montana with 174 academic programs. 16 UM does not provide an engineering degree curriculum.
Access to Resources
17 Missoula County ranks 52 out of 56 MT counties in the value of agricultural products sold, according to the US Ag Census, 2012. The County fares better with livestock and with bee colonies. 18 3.6% of the workforce is engaged in manufacturing. There are 161 payrolled locations (2017), up from 127 in 2010: Garner Economics, BLS. 19 735 payrolled business locations in 2017, up from 589 in 2010. Ibid.

Raising the Bar: A Competitive Realities Report and Target Industry Strategy for Missoula, Montana | Page 125
20 Utilities Comparison to National Average
Electric Provider Missoula Average Cost 2016
National Average 2016
Missoula Electric Coop, Inc
Industrial: 7.75 (cents/kWh) Commercial: 8.92 (cents/kWh)
Industrial: 6.76
(cents/kWh)
Commercial: 10.43
(cents/kWh) Northwestern Energy
Industrial: 9.45 (cents/kWh) Commercial: 11.43 (cents/kWh)
Natural Gas Provider Missoula Average Cost 2016
National Average 2016
Northwestern Energy
Industrial Sales Price ($)7.00 Commercial Sales Price ($)7.53 (Dollars per Thousand Cubic Feet)
Industrial Sales Price ($)3.52 Commercial Sales Price ($)7.28 (Dollars per Thousand Cubic Feet)
Source: eia.gov
County (MEP) Economic Development Program 21 Three FTEs. 22 MEP web site is outdated with references from 2014. 23 Less than $46,000 budgeted for direct outreach/promotional efforts.
Access to Space
24 Missoula County Development Park; Bonner Mill Industrial TIF District 25 Primarily redevelopment opportunities http://www.missoulapartnership.com/real-estate/development-opportunities/
Access to Capital
26 www.missoulapartnership.com/relocate-or-expand/capital/ 27 Ibid.; http://www.missoulapartnership.com/grow-your-business/angel-network/
Government Impact on Business
28 Based on feedback from both focus groups and e survey respondents. 29 http://www.missoulapartnership.com/relocate-or-expand/capital/ 30 ACT Average Composite Scores Highest Score Shaded
2013 2014 2015 2016 2017
Missoula County 21.0 20.8 20.9 20.9 20.6
Montana 21.3 20.5 20.4 20.3 20.3
United States 20.9 21.0 21.0 20.8 21.0 Source: Montana Office of Public Instruction, Garner Economics
31 http://www.missoulapartnership.com/the-facts/education/ 32 Based on overwhelming feedback from the survey and some in the focus groups about the City. 33 Highest median property tax in the state http://www.tax-rates.org/montana/property-tax
Quality of Place
34 534 homes for sale at +$300k as of 5/14/18 according to Zillow.com. 35 287 homes for sale at $150k to $299k as of 5/14/18 according to Zillow.com. 36 300 available rentals as of 5/15/18 according to Apartments.com.

Raising the Bar: A Competitive Realities Report and Target Industry Strategy for Missoula, Montana | Page 126
37 2017 Cost of Living Index
Index Missoula Montana
Cost of Living Index 103 97
Goods & Services Index 101 101
Grocery Index 102 102
Healthcare Index 103 103
Housing Index 116 99
Transportation Index 95 95
Utilities Index 77 77
Source: AreaVibes.com derived from C2ER Index for 2017, Garner Economics
38 Crime Rates per 100,000 Residents Lowest Rate Shaded
Sources: Uniform Crime Reports, FBI, Garner Economics
39 http://destinationmissoula.org/ 40 Ibid. 41 The county’s 2017 retail sales were estimated to be $2.3 billion for retail trades, food, and drink sales. The county has a Retail Surplus of $753 million dollars. 42 Two hospitals with 472 total beds. Primarily health providers (not wide spread clinical research or trials). https://www.dropbox.com/s/5076qnuu09wzmv8/Medical%20Beds.docx?dl=0 43 Fourteen AAA three diamond properties are in Missoula County, but no 4 or 5 diamond properties. 44 Downtown Missoula shows well.
Property Crime Violent Crime
Crimes Reported
Crime Rate
Crimes Reported
Crime Rate
Missoula County 4,087 3,526.4 476 410.7
Montana 27,976 2,683.5 3,840 368.3
United States 7,919,035 2,450.7 1,248,185 386.3

Raising the Bar: A Competitive Realities Report and Target Industry Strategy for Missoula, Montana | Page 127
APPENDIX D: INDUSTRY DETAILS
Specialized industries are highlighted light blue for location quotients greater than 1.20.
NAICS Description 2017 Jobs
2012-2017 Change
2017 Location Quotient
2017 Avg. Wages
11 Agriculture, Forestry, Fishing & Hunting 774 123 0.96 $47,939
111 Crop Production 159 18 0.46 $22,100
112 Animal Production and Aquaculture 91 21 0.5 $30,572
113 Forestry and Logging 111 (68) 3.36 $37,524
114 Fishing, Hunting and Trapping <10 Insf. Data 0.08 Insf. Data
115 Support Activities for Agriculture and Forestry 412 157 1.78 $64,589
21 Mining, Quarrying, Oil & Gas Extraction 26 (34) 0.1 $58,050
212 Mining (except Oil and Gas) <10 Insf. Data 0.07 Insf. Data
213 Support Activities for Mining 21 (22) 0.18 $55,529
22 Utilities 163 (6) 0.69 $86,138
221 Utilities 163 (6) 0.69 $86,138
23 Construction 3,972 731 1.09 $40,838
236 Construction of Buildings 1,036 319 1.21 $38,035
237 Heavy and Civil Engineering Construction 568 (106) 1.32 $58,752
238 Specialty Trade Contractors 2,369 519 1 $37,771
31 Manufacturing 2,295 360 0.43 $39,033
311 Food Manufacturing 358 39 0.54 $27,240
312 Beverage and Tobacco Product Manufacturing 261 63 2.41 $24,810
313 Textile Mills <10 Insf. Data 0.01 Insf. Data
314 Textile Product Mills 18 6 0.34 $21,141
315 Apparel Manufacturing <10 Insf. Data 0.11 Insf. Data
316 Leather and Allied Product Manufacturing 11 Insf. Data 0.87 $22,440
321 Wood Product Manufacturing 392 89 2.25 $46,726
323 Printing and Related Support Activities 78 (3) 0.4 $27,837
325 Chemical Manufacturing 222 40 0.64 $49,540
326 Plastics and Rubber Products Manufacturing 118 49 0.39 $39,820

Raising the Bar: A Competitive Realities Report and Target Industry Strategy for Missoula, Montana | Page 128
NAICS Description 2017 Jobs
2012-2017 Change
2017 Location Quotient
2017 Avg. Wages
327 Nonmetallic Mineral Product Manufacturing 65 27 0.37 $41,586
331 Primary Metal Manufacturing <10 Insf. Data 0 Insf. Data
332 Fabricated Metal Product Manufacturing 156 34 0.26 $42,233
333 Machinery Manufacturing 40 7 0.09 $53,333
334 Computer and Electronic Product Manufacturing 27 (15) 0.06 $75,956
335 Electrical Equipment, Appliance, and Component Manufacturing <10 Insf. Data 0.02 Insf. Data
336 Transportation Equipment Manufacturing 121 Insf. Data 0.17 $34,605
337 Furniture and Related Product Manufacturing 76 2 0.44 $27,979
339 Miscellaneous Manufacturing 341 (64) 1.27 $47,515
42 Wholesale Trade 2,036 193 0.81 $54,558
423 Merchant Wholesalers, Durable Goods 1,036 44 0.82 $56,518
424 Merchant Wholesalers, Nondurable Goods 825 98 0.94 $44,978
425 Wholesale Electronic Markets and Agents and Brokers 174 50 0.46 $88,247
44 Retail Trade 8,566 506 1.24 $28,624
441 Motor Vehicle and Parts Dealers 1,157 157 1.34 $48,192
442 Furniture and Home Furnishings Stores 319 82 1.52 $33,381
443 Electronics and Appliance Stores 275 (56) 1.23 $39,604
444 Building Material and Garden Equipment and Supplies Dealers 875 109 1.59 $33,778
445 Food and Beverage Stores 1,351 136 1.02 $22,466
446 Health and Personal Care Stores 332 71 0.72 $32,241
447 Gasoline Stations 570 91 1.45 $20,275
448 Clothing and Clothing Accessories Stores 618 29 1.03 $17,317
451 Sporting Goods, Hobby, Musical Instrument, and Book Stores 658 31 2.42 $18,386
452 General Merchandise Stores 1,618 (185) 1.21 $26,731
453 Miscellaneous Store Retailers 549 33 1.36 $21,289
454 Nonstore Retailers 244 8 0.84 $32,756
48 Transportation & Warehousing 1,971 (95) 0.85 $47,836
481 Air Transportation 37 (51) 0.18 $40,967
482 Rail Transportation 335 20 3.58 $93,606
484 Truck Transportation 835 (58) 1.2 $44,134
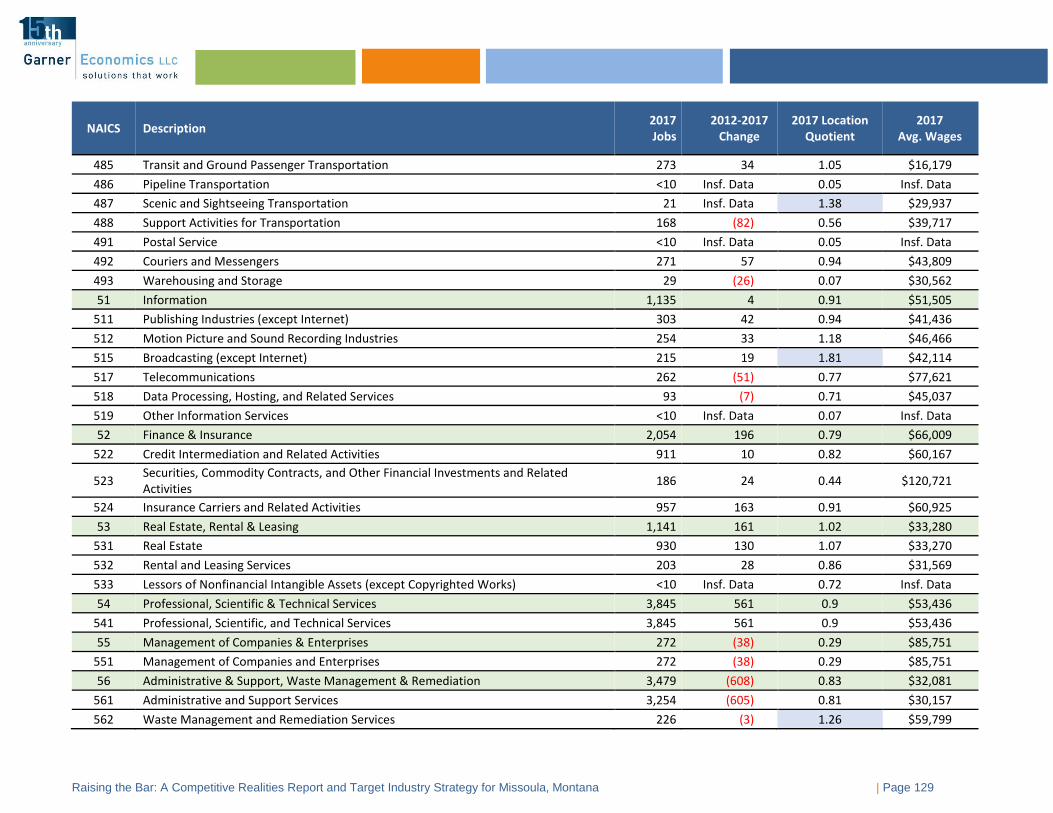
Raising the Bar: A Competitive Realities Report and Target Industry Strategy for Missoula, Montana | Page 129
NAICS Description 2017 Jobs
2012-2017 Change
2017 Location Quotient
2017 Avg. Wages
485 Transit and Ground Passenger Transportation 273 34 1.05 $16,179
486 Pipeline Transportation <10 Insf. Data 0.05 Insf. Data
487 Scenic and Sightseeing Transportation 21 Insf. Data 1.38 $29,937
488 Support Activities for Transportation 168 (82) 0.56 $39,717
491 Postal Service <10 Insf. Data 0.05 Insf. Data
492 Couriers and Messengers 271 57 0.94 $43,809
493 Warehousing and Storage 29 (26) 0.07 $30,562
51 Information 1,135 4 0.91 $51,505
511 Publishing Industries (except Internet) 303 42 0.94 $41,436
512 Motion Picture and Sound Recording Industries 254 33 1.18 $46,466
515 Broadcasting (except Internet) 215 19 1.81 $42,114
517 Telecommunications 262 (51) 0.77 $77,621
518 Data Processing, Hosting, and Related Services 93 (7) 0.71 $45,037
519 Other Information Services <10 Insf. Data 0.07 Insf. Data
52 Finance & Insurance 2,054 196 0.79 $66,009
522 Credit Intermediation and Related Activities 911 10 0.82 $60,167
523 Securities, Commodity Contracts, and Other Financial Investments and Related Activities
186 24 0.44 $120,721
524 Insurance Carriers and Related Activities 957 163 0.91 $60,925
53 Real Estate, Rental & Leasing 1,141 161 1.02 $33,280
531 Real Estate 930 130 1.07 $33,270
532 Rental and Leasing Services 203 28 0.86 $31,569
533 Lessors of Nonfinancial Intangible Assets (except Copyrighted Works) <10 Insf. Data 0.72 Insf. Data
54 Professional, Scientific & Technical Services 3,845 561 0.9 $53,436
541 Professional, Scientific, and Technical Services 3,845 561 0.9 $53,436
55 Management of Companies & Enterprises 272 (38) 0.29 $85,751
551 Management of Companies and Enterprises 272 (38) 0.29 $85,751
56 Administrative & Support, Waste Management & Remediation 3,479 (608) 0.83 $32,081
561 Administrative and Support Services 3,254 (605) 0.81 $30,157
562 Waste Management and Remediation Services 226 (3) 1.26 $59,799

Raising the Bar: A Competitive Realities Report and Target Industry Strategy for Missoula, Montana | Page 130
NAICS Description 2017 Jobs
2012-2017 Change
2017 Location Quotient
2017 Avg. Wages
61 Educational Services 754 59 0.44 $20,411
611 Educational Services 754 59 0.44 $20,411
62 Health Care & Social Assistance 10,576 894 1.25 $46,650
621 Ambulatory Health Care Services 4,179 413 1.31 $54,485
622 Hospitals 2,859 214 1.36 $65,256
623 Nursing and Residential Care Facilities 1,616 89 1.15 $23,709
624 Social Assistance 1,922 178 1.08 $21,224
71 Arts, Entertainment & Recreation 1,772 102 1.54 $19,042
711 Performing Arts, Spectator Sports, and Related Industries 409 (31) 1.17 $28,756
712 Museums, Historical Sites, and Similar Institutions 40 7 0.57 $30,583
713 Amusement, Gambling, and Recreation Industries 1,324 126 1.81 $15,698
72 Accommodation & Food Services 7,013 900 1.22 $17,238
721 Accommodation 1,457 213 1.75 $23,139
722 Food Services and Drinking Places 5,556 686 1.13 $15,690
81 Other Services 3,677 527 1.14 $25,646
811 Repair and Maintenance 857 101 1.21 $32,530
812 Personal and Laundry Services 796 104 0.88 $21,808
813 Religious, Grantmaking, Civic, Professional, and Similar Organizations 1,652 219 1.34 $27,165
814 Private Households 372 104 0.99 $11,257
90 Government 11,618 613 1.13 $44,492
901 Federal Government 1,907 (23) 0.93 $60,685
902 State Government 5,845 372 2.6 $38,612
903 Local Government 3,865 264 0.65 $45,394 All Industry Total/Average 67,143 5,150 $38,755
Source: ESRI, Garner Economics

Raising the Bar: A Competitive Realities Report and Target Industry Strategy for Missoula, Montana | Page 131
APPENDIX E: OCCUPATIONAL DETAILS
Specialized occupational categories are highlighted light blue for location quotients greater than 1.20
SOC Description 2017 Jobs
2012 - 2017 Change
2017 Location Quotient
2017 Avg. Wages
11-0000 Management Occupations 2,914 241 0.80 $38.21
11-1000 Top Executives 820 50 0.75 $49.82
11-2000 Advertising, Marketing, Promotions, Public Relations, and Sales Managers 159 10 0.53 $51.75
11-3000 Operations Specialties Managers 363 20 0.48 $49.99
11-9000 Other Management Occupations 1,572 162 1.05 $28.13
13-0000 Business and Financial Operations Occupations 2,822 276 0.83 $27.47
13-1000 Business Operations Specialists 1,879 184 0.87 $26.56
13-2000 Financial Specialists 943 92 0.75 $29.30
15-0000 Computer and Mathematical Occupations 1,494 144 0.79 $26.65
15-1100 Computer Occupations 1,469 141 0.81 $26.49
15-2000 Mathematical Science Occupations 25 3 0.33 $36.06
17-0000 Architecture and Engineering Occupations 782 115 0.71 $29.39
17-1000 Architects, Surveyors, and Cartographers 203 46 2.32 $26.88
17-2000 Engineers 320 28 0.45 $36.56
17-3000 Drafters, Engineering Technicians, and Mapping Technicians 259 40 0.86 $22.58
19-0000 Life, Physical, and Social Science Occupations 1,207 43 2.26 $24.39
19-1000 Life Scientists 283 21 2.23 $30.16
19-2000 Physical Scientists 147 8 1.27 $34.59
19-3000 Social Scientists and Related Workers 201 10 1.50 $25.37
19-4000 Life, Physical, and Social Science Technicians 577 6 3.65 $18.64
21-0000 Community and Social Service Occupations 1,613 176 1.47 $17.48
21-1000 Counselors, Social Workers, and Other Community and Social Service Specialists 1,424 134 1.58 $17.35
21-2000 Religious Workers 188 41 0.95 $18.43
23-0000 Legal Occupations 747 31 1.36 $33.44
23-1000 Lawyers, Judges, and Related Workers 485 16 1.32 $39.97
23-2000 Legal Support Workers 262 15 1.43 $21.27

Raising the Bar: A Competitive Realities Report and Target Industry Strategy for Missoula, Montana | Page 132
SOC Description 2017 Jobs
2012 - 2017 Change
2017 Location Quotient
2017 Avg. Wages
25-0000 Education, Training, and Library Occupations 3,290 159 0.86 $19.98
25-1000 Postsecondary Teachers 727 43 1.15 $28.28
25-2000 Preschool, Primary, Secondary, and Special Education School Teachers 1,123 70 0.63 $22.78
25-3000 Other Teachers and Instructors 821 5 1.37 $12.79
25-4000 Librarians, Curators, and Archivists 130 15 1.11 $15.65
25-9000 Other Education, Training, and Library Occupations 489 26 0.72 $14.65
27-0000 Arts, Design, Entertainment, Sports, and Media Occupations 1,512 144 1.25 $18.01
27-1000 Art and Design Workers 303 2 0.83 $17.40
27-2000 Entertainers and Performers, Sports and Related Workers 558 35 1.58 $16.53
27-3000 Media and Communication Workers 418 35 1.24 $20.13
27-4000 Media and Communication Equipment Workers 233 72 1.48 $18.62
29-0000 Healthcare Practitioners and Technical Occupations 4,221 322 1.14 $35.04
29-1000 Health Diagnosing and Treating Practitioners 2,659 206 1.15 $43.10
29-2000 Health Technologists and Technicians 1,437 104 1.09 $21.17
29-9000 Other Healthcare Practitioners and Technical Occupations 124 10 1.75 $23.59
31-0000 Healthcare Support Occupations 1,442 89 0.78 $13.62
31-1000 Nursing, Psychiatric, and Home Health Aides 692 25 0.64 $11.48
31-2000 Occupational Therapy and Physical Therapist Assistants and Aides 36 2 0.45 $20.09
31-9000 Other Healthcare Support Occupations 714 61 1.04 $15.38
33-0000 Protective Service Occupations 1,071 71 0.72 $21.39
33-1000 Supervisors of Protective Service Workers 106 6 0.91 $34.38
33-2000 Fire Fighting and Prevention Workers 63 6 0.45 $27.36
33-3000 Law Enforcement Workers 388 11 0.72 $26.30
33-9000 Other Protective Service Workers 513 47 0.74 $14.25
35-0000 Food Preparation and Serving Related Occupations 6,797 741 1.21 $10.51
35-1000 Supervisors of Food Preparation and Serving Workers 523 55 1.13 $14.81
35-2000 Cooks and Food Preparation Workers 2,096 236 1.50 $10.98
35-3000 Food and Beverage Serving Workers 3,471 406 1.10 $9.83
35-9000 Other Food Preparation and Serving Related Workers 708 45 1.18 $9.24

Raising the Bar: A Competitive Realities Report and Target Industry Strategy for Missoula, Montana | Page 133
SOC Description 2017 Jobs
2012 - 2017 Change
2017 Location Quotient
2017 Avg. Wages
37-0000 Building and Grounds Cleaning and Maintenance Occupations 3,070 413 1.22 $12.07
37-1000 Supervisors of Building and Grounds Cleaning and Maintenance Workers 148 15 0.99 $14.81
37-2000 Building Cleaning and Pest Control Workers 2,315 305 1.31 $11.94
37-3000 Grounds Maintenance Workers 608 95 1.02 $11.86
39-0000 Personal Care and Service Occupations 3,422 372 1.23 $11.16
39-1000 Supervisors of Personal Care and Service Workers 109 0 1.01 $16.24
39-2000 Animal Care and Service Workers 105 18 0.84 $11.43
39-3000 Entertainment Attendants and Related Workers 226 (9) 0.88 $10.02
39-4000 Funeral Service Workers 11 Insf. Data 0.40 $16.62
39-5000 Personal Appearance Workers 423 73 0.99 $12.23
39-6000 Baggage Porters, Bellhops, and Concierges 13 (5) 0.40 $10.45
39-7000 Tour and Travel Guides 21 6 0.92 $15.43
39-9000 Other Personal Care and Service Workers 2,514 288 1.42 $10.80
41-0000 Sales and Related Occupations 7,464 353 1.12 $16.64
41-1000 Supervisors of Sales Workers 1,040 45 1.39 $21.10
41-2000 Retail Sales Workers 4,761 240 1.27 $12.75
41-3000 Sales Representatives, Services 677 21 0.72 $28.85
41-4000 Sales Representatives, Wholesale and Manufacturing 563 64 0.74 $27.64
41-9000 Other Sales and Related Workers 423 (17) 0.90 $15.42
43-0000 Office and Administrative Support Occupations 10,820 472 1.08 $15.19
43-1000 Supervisors of Office and Administrative Support Workers 470 10 0.74 $24.09
43-2000 Communications Equipment Operators 34 (16) 0.78 $11.80
43-3000 Financial Clerks 1,806 72 1.27 $16.48
43-4000 Information and Record Clerks 2,597 25 1.04 $13.91
43-5000 Material Recording, Scheduling, Dispatching, and Distributing Workers 1,302 13 0.74 $15.79
43-6000 Secretaries and Administrative Assistants 1,926 158 1.09 $15.65
43-9000 Other Office and Administrative Support Workers 2,685 211 1.42 $13.44
45-0000 Farming, Fishing, and Forestry Occupations 423 48 0.83 $17.22
45-1000 Supervisors of Farming, Fishing, and Forestry Workers 57 10 2.60 $22.50
45-2000 Agricultural Workers 204 56 0.46 $15.27

Raising the Bar: A Competitive Realities Report and Target Industry Strategy for Missoula, Montana | Page 134
SOC Description 2017 Jobs
2012 - 2017 Change
2017 Location Quotient
2017 Avg. Wages
45-3000 Fishing and Hunting Workers <10 Insf. Data 0.40 Insf. Data
45-4000 Forest, Conservation, and Logging Workers 157 (14) 5.35 $17.77
47-0000 Construction and Extraction Occupations 3,286 519 1.10 $19.54
47-1000 Supervisors of Construction and Extraction Workers 302 37 1.11 $27.06
47-2000 Construction Trades Workers 2,700 477 1.15 $18.68
47-3000 Helpers, Construction Trades 58 7 0.57 $13.93
47-4000 Other Construction and Related Workers 214 7 1.16 $20.93
47-5000 Extraction Workers 12 (9) 0.15 $21.82
49-0000 Installation, Maintenance, and Repair Occupations 2,620 206 1.03 $18.56
49-1000 Supervisors of Installation, Maintenance, and Repair Workers 198 14 1.01 $26.25
49-2000 Electrical and Electronic Equipment Mechanics, Installers, and Repairers 185 (22) 0.69 $22.04
49-3000 Vehicle and Mobile Equipment Mechanics, Installers, and Repairers 1,015 55 1.35 $17.20
49-9000 Other Installation, Maintenance, and Repair Occupations 1,221 159 0.92 $17.91
51-0000 Production Occupations 2,033 140 0.51 $15.72
51-1000 Supervisors of Production Workers 164 21 0.63 $23.02
51-2000 Assemblers and Fabricators 123 (17) 0.16 $13.24
51-3000 Food Processing Workers 327 24 0.94 $13.24
51-4000 Metal Workers and Plastic Workers 311 52 0.38 $17.23
51-5100 Printing Workers 67 (1) 0.61 $14.16
51-6000 Textile, Apparel, and Furnishings Workers 162 2 0.59 $11.03
51-7000 Woodworkers 165 30 1.41 $15.43
51-8000 Plant and System Operators 84 (3) 0.65 $23.09
51-9000 Other Production Occupations 628 31 0.56 $15.30

Raising the Bar: A Competitive Realities Report and Target Industry Strategy for Missoula, Montana | Page 135
SOC Description 2017 Jobs
2012 - 2017 Change
2017 Location Quotient
2017 Avg. Wages
53-0000 Transportation and Material Moving Occupations 3,556 97 0.81 $16.17
53-1000 Supervisors of Transportation and Material Moving Workers 165 11 0.96 $26.95
53-2000 Air Transportation Workers 48 (30) 0.40 $33.51
53-3000 Motor Vehicle Operators 1,948 134 1.05 $15.78
53-4000 Rail Transportation Workers 155 9 2.82 $25.22
53-5000 Water Transportation Workers <10 Insf. Data 0.19 Insf. Data
53-6000 Other Transportation Workers 77 (5) 0.50 $15.93
53-7000 Material Moving Workers 1,157 (23) 0.58 $13.11
55-0000 Military occupations 537 (22) 0.64 $17.58
55-9000 Military occupations 537 (22) 0.64 $17.58 All Occupations Total/Average 67,143 5,150 $18.91
Source: ESRI, Garner Economics