Rainy River Site Tour June 2019
45
1 Rainy River Site Tour June 2019
Transcript of Rainy River Site Tour June 2019
1
Rainy River Site TourJune 2019

Cautionary Statements
2
CAUTIONARY NOTE REGARDING FORWARD-LOOKING STATEMENTS
Certain information contained in this presentation, including any information relating to New Gold’s future financial or operating performance are “forward looking”. All statements in this presentation,
other than statements of historical fact, which address events, results, outcomes or developments that New Gold expects to occur are “forward-looking statements”. Forward-looking statements are
statements that are not historical facts and are generally, but not always, identified by the use of forward-looking terminology such as “plans”, “expects”, “is expected”, “budget”, “scheduled”, “targeted”,
“estimates”, “forecasts”, “intends”, “anticipates”, “projects”, “potential”, “believes” or variations of such words and phrases or statements that certain actions, events or results “may”, “could”, “would”,
“should”, “might” or “will be taken”, “occur” or “be achieved” or the negative connotation of such terms. Forward looking statements in this presentation include statements with respect to: potential
opportunities and future activities and performance in the areas of health and safety, permitting, mining, mill operation, capital expenditure and development and exploration at the Rainy River Mine.
All forward-looking statements in this presentation are based on the opinions and estimates of management as of the date such statements are made and are subject to important risk factors and
uncertainties, many of which are beyond New Gold’s ability to control or predict. Certain material assumptions regarding such forward-looking statements are discussed in this presentation, New Gold’s
latest annual management’s discussion and analysis (“MD&A”), Annual Information Form and Technical Reports filed at www.sedar.com and on EDGAR at www.sec.gov. In addition to, and subject to,
such assumptions discussed in more detail elsewhere, the forward-looking statements in this presentation are also subject to the following assumptions: (1) there being no significant disruptions affecting
New Gold’s operations; (2) political and legal developments in jurisdictions where New Gold operates, or may in the future operate, being consistent with New Gold’s current expectations; (3) the
accuracy of New Gold’s current mineral reserve and mineral resource estimates; (4) the exchange rate between the Canadian dollar and U.S. dollar being approximately consistent with current levels;
(5) prices for diesel, natural gas, fuel oil, electricity and other key supplies being approximately consistent with current levels; (6) equipment, labour and materials costs increasing on a basis consistent
with New Gold’s current expectations; (7) arrangements with First Nations and other Aboriginal groups in respect of the Rainy River mine being consistent with New Gold’s current expectations; (8) all
required permits, licenses and authorizations being obtained from the relevant governments and other relevant stakeholders within the expected timelines and the absence of material negative comments
during the applicable regulatory processes; and (9) in the case of production, cost and expenditure outlooks at the operating mines for 2019, commodity prices, exchange rates, grades, recovery rates,
mill availability and mill throughput rates being consistent with those estimated for the purposes for 2019.
Forward-looking statements are necessarily based on estimates and assumptions that are inherently subject to known and unknown risks, uncertainties and other factors that may cause actual results,
level of activity, performance or achievements to be materially different from those expressed or implied by such forward-looking statements. Such factors include, without limitation: significant capital
requirements and the availability and management of capital resources; additional funding requirements; price volatility in the spot and forward markets for metals and other commodities; fluctuations in
the international currency markets and in the rates of exchange of the currencies of Canada and the United States; discrepancies between actual and estimated production, between actual and
estimated mineral reserves and mineral resources and between actual and estimated metallurgical recoveries; risks related to early production at the Rainy River Mine, including failure of equipment,
machinery, the process circuit or other processes to perform as designed or intended; fluctuation in treatment and refining charges; changes in national and local government legislation in Canada and
the United States; taxation; controls, regulations and political or economic developments in the countries in which New Gold does or may carry on business; the speculative nature of mineral exploration
and development, including the risks of obtaining and maintaining the validity and enforceability of the necessary licenses and permits and complying with the permitting requirements of each jurisdiction
in which New Gold operates; the uncertainties inherent to current and future legal challenges New Gold is or may become a party to; diminishing quantities or grades of mineral reserves and mineral
resources; competition; loss of key employees; rising costs of labour, supplies, fuel and equipment; actual results of current exploration or reclamation activities; uncertainties inherent to mining economic
studies; changes in project parameters as plans continue to be refined; accidents; labour disputes; defective title to mineral claims or property or contests over claims to mineral properties; unexpected
delays and costs inherent to consulting and accommodating rights of Indigenous groups; risks, uncertainties and unanticipated delays associated with obtaining and maintaining necessary licenses,
permits and authorizations and complying with permitting requirements. In addition, there are risks and hazards associated with the business of mineral exploration, development and mining, including
environmental events and hazards, industrial accidents, unusual or unexpected formations, pressures, cave-ins, flooding and gold bullion losses and risks associated with early production of a mine, such
as Rainy River, (and the risk of inadequate insurance or inability to obtain insurance to cover these risks) as well as “Risk Factors” included in New Gold’s Annual Information Form, MD&A and other
disclosure documents filed on and available at www.sedar.com and on EDGAR at www.sec.gov. Forward-looking statements are not guarantees of future performance, and actual results and future
events could materially differ from those anticipated in such statements. All of the forward-looking statements contained in this news release are qualified by these cautionary statements. New Gold
expressly disclaims any intention or obligation to update or revise any forward-looking statements whether as a result of new information, events or otherwise, except in accordance with applicable
securities laws.
TECHNICAL INFORMATION
The scientific and technical information contained herein has been reviewed and approved by Mr. Eric Vinet, Vice President, Technical Services of New Gold. Mr. Vinet is a Professional Engineer and
member of the Ordre des ingénieurs du Québec. Mr. Vinet is a "Qualified Person" for the purposes of NI 43-101. Technical Reports for its mineral properties, all of which are available on SEDAR at
www.sedar.com, contain further details regarding Mineral Reserve and Mineral Resource estimates, classification and reporting parameters, key assumptions and associated risks for each of New Gold's
mineral properties, including a breakdown by category.

3
CAUTIONARY NOTE TO U.S. READERS CONCERNING ESTIMATES OF MINERAL RESERVES AND MINERAL RESOURCES
Information concerning the properties and operations of New Gold has been prepared in accordance with Canadian standards under applicable Canadian securities laws, and may not be comparable
to similar information for United States companies. The terms "Mineral Resource", "Measured Mineral Resource", "Indicated Mineral Resource" and "Inferred Mineral Resource" used in this news release
are Canadian mining terms as defined in the Canadian Institute of Mining, Metallurgy and Petroleum ("CIM") Definition Standards for Mineral Resources and Mineral Reserves adopted by CIM Council
on May 10, 2014 and incorporated by reference in National Instrument 43101. While the terms "Mineral Resource", "Measured Mineral Resource", "Indicated Mineral Resource" and "Inferred Mineral
Resource" are recognized and required by Canadian securities regulations, they are not defined terms under standards of the United States Securities and Exchange Commission. As such, certain
information contained in this news release concerning descriptions of mineralization and mineral resources under Canadian standards is not comparable to similar information made public by United
States companies subject to the reporting and disclosure requirements of the United States Securities and Exchange Commission.
An "Inferred Mineral Resource" has a great amount of uncertainty as to its existence and as to its economic and legal feasibility. Under Canadian rules, estimates of inferred mineral resources may not
form the basis of feasibility or pre-feasibility studies. It cannot be assumed that all or any part of an "Inferred Mineral Resource" will ever be upgraded to a higher confidence category. Readers are
cautioned not to assume that all or any part of an "Inferred Mineral Resource" exists or is economically or legally mineable.
Under United States standards, mineralization may not be classified as a "Reserve" unless the determination has been made that the mineralization could be economically and legally produced or
extracted at the time the reserve estimation is made. Readers are cautioned not to assume that all or any part of the measured or indicated mineral resources will ever be converted into mineral
reserves. In addition, the definitions of "Proven Mineral Reserves" and "Probable Mineral Reserves" under CIM standards differ in certain respects from the standards of the United States Securities and
Exchange Commission. Accordingly, information contained in this presentation that describes the Company’s mineral deposits may not be comparable to similar measures presented by other mining
companies. It should not be considered in isolation or as a substitute for measures of performance prepared in accordance with IFRS.
Cautionary Statements

AGENDA
1. 2019 Guidance & Q1 2019 Highlights
2. Health & Safety and ESR
3. Community and HR
4. Geology, Mining and Maintenance
5. Mill Operations
6. Operating Unit Costs
7. Capital Projects Highlights
8. New Life of Mine; Open Pit & Underground Optimization
9. Exploration
4

5
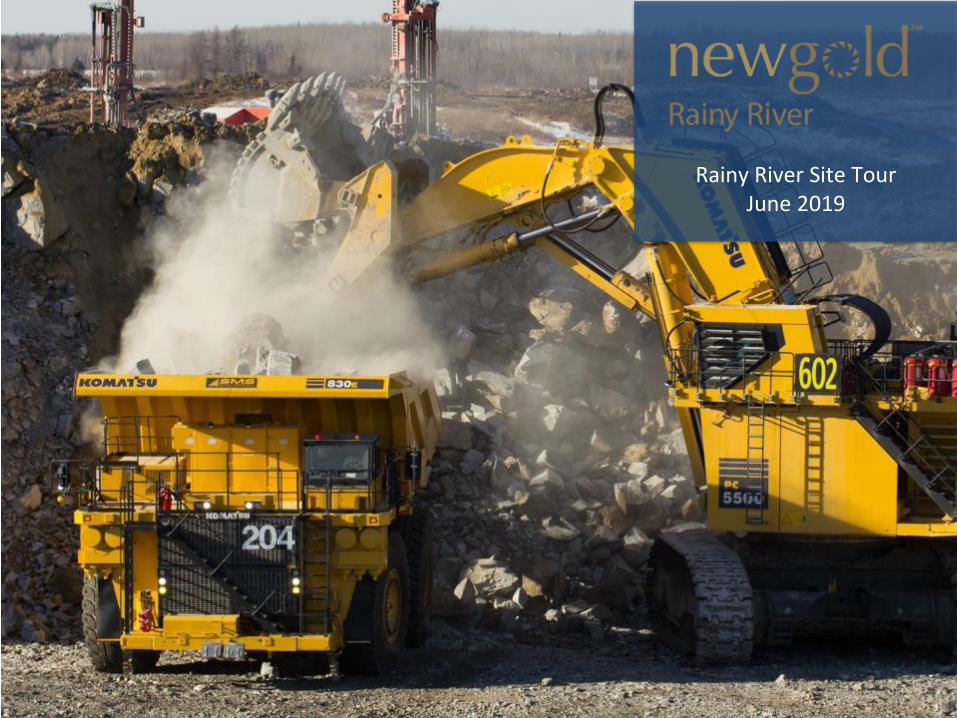
Open Pit Mining at Rainy River
V:\Picture and Videos\Drone Pictures and Video\2019\06 June\06-10-2019\DJI_0088_4Mbps.mp4

6
• Ramp up to full operating
capacity
• Debottlenecking tailings by Q4
via booster pump
• Recovery improvement
• Improved reliability of main
equipment
2019 Au and Au eq.12019 Cash Costs1 & AISC1
(per Au Eq oz) 2019 Sustaining Capital1
Mining Processing
$870-$950Total cash costs
$1690-$1790All-in sustaining costs
• Ex-pit and total material mined
ahead of plan at end of Q1
• Q1 Ex-pit rate of 112 ktpd
• Implementing short interval control
and operator feedback for
improved productivity
Rainy River 2019 Guidance & Highlights
• Initiated PCR (primary
component replacement) on
mining fleet
• 4 new D75K drills in Q3
• 5 new haul trucks in Q2
• Maintenance audit in Q2
• Building new truck shop
Maintenance
245-270k Au oz
250-275k AuEq oz
$150-$165 million
Construction Capital
$60-$65 million
Other Sustaining Capital
Positioning for Efficient and Sustainable Mining
1. See Non GAAP Measures and Other Endnote in "Endnotes"
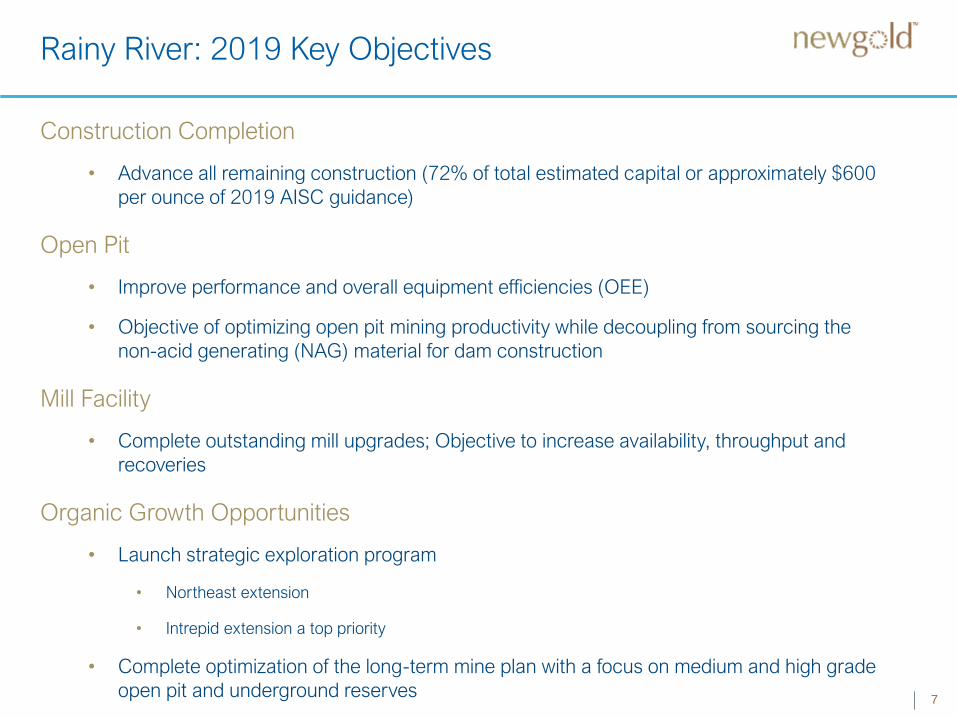
Rainy River: 2019 Key Objectives
Construction Completion
• Advance all remaining construction (72% of total estimated capital or approximately $600
per ounce of 2019 AISC guidance)
Open Pit
• Improve performance and overall equipment efficiencies (OEE)
• Objective of optimizing open pit mining productivity while decoupling from sourcing the
non-acid generating (NAG) material for dam construction
Mill Facility
• Complete outstanding mill upgrades; Objective to increase availability, throughput and
recoveries
Organic Growth Opportunities
• Launch strategic exploration program
• Northeast extension
• Intrepid extension a top priority
• Complete optimization of the long-term mine plan with a focus on medium and high grade
open pit and underground reserves7
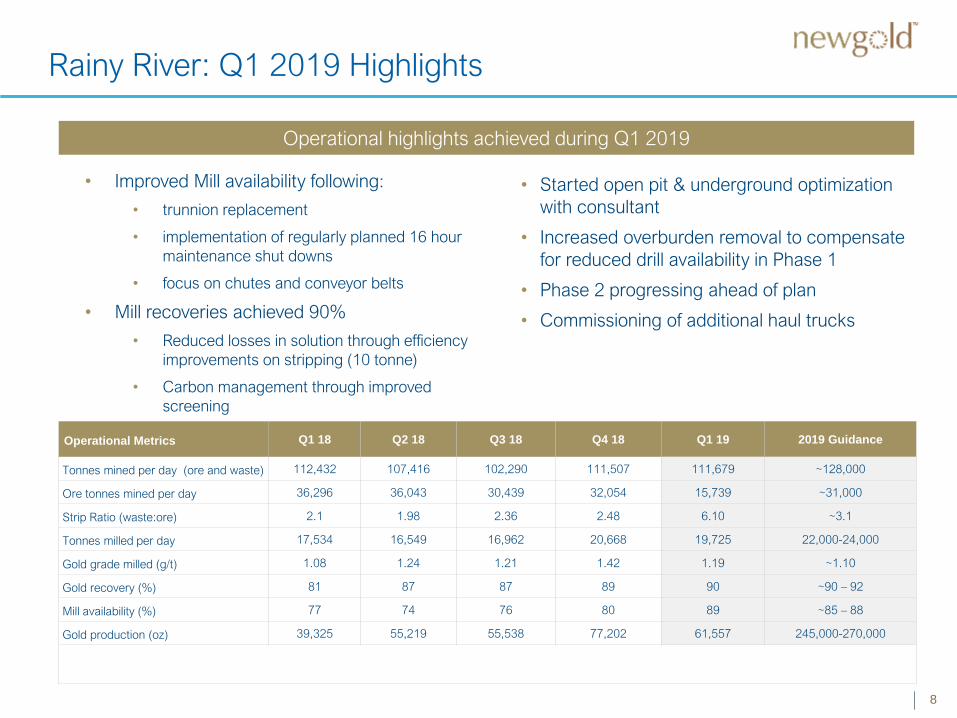
Operational Metrics Q1 18 Q2 18 Q3 18 Q4 18 Q1 19 2019 Guidance
Tonnes mined per day (ore and waste) 112,432 107,416 102,290 111,507 111,679 ~128,000
Ore tonnes mined per day 36,296 36,043 30,439 32,054 15,739 ~31,000
Strip Ratio (waste:ore) 2.1 1.98 2.36 2.48 6.10 ~3.1
Tonnes milled per day 17,534 16,549 16,962 20,668 19,725 22,000-24,000
Gold grade milled (g/t) 1.08 1.24 1.21 1.42 1.19 ~1.10
Gold recovery (%) 81 87 87 89 90 ~90 – 92
Mill availability (%) 77 74 76 80 89 ~85 – 88
Gold production (oz) 39,325 55,219 55,538 77,202 61,557 245,000-270,000
8
• Improved Mill availability following:
• trunnion replacement
• implementation of regularly planned 16 hour
maintenance shut downs
• focus on chutes and conveyor belts
• Mill recoveries achieved 90%
• Reduced losses in solution through efficiency
improvements on stripping (10 tonne)
• Carbon management through improved
screening
Rainy River: Q1 2019 Highlights
Operational highlights achieved during Q1 2019
• Started open pit & underground optimization
with consultant
• Increased overburden removal to compensate
for reduced drill availability in Phase 1
• Phase 2 progressing ahead of plan
• Commissioning of additional haul trucks

Rainy River Achievements / Successes
• 2.1M hours LTI free in 2018 (currently at 1.6M hours for 2019)
• First place obstacle course at Regional Underground Rescue Competition (April 2019)
• Collaborating with and serving as the back up Rescue Team for Lac des Iles Mine
Challenges
• Developing a workforce in a non-traditional mining area
• Reducing musculoskeletal injuries
• Developing first line supervision leadership capacity; current leadership from different
industries and backgrounds
Improvement Initiatives
• Implementing “Know Your Numbers” Employee Health Program
• Currently a member of the “Ontario Safety Group”. During this 5 year program we will
receive a 7% reduction in WSIB rates; equivalent to $1M savings over the life of the program.
• Implementing Visible Safety Leadership Training Program
9
Health and Safety Update

2019 Targets
• Develop in-house skills to meet air, noise and
water monitoring commitments
• Develop in-house skills to manage GoldSim
water balance on site
• Implementing Environmental Management
System (ISO 14001)
Annual Regulatory Reports
• Submission completed for 2018
No Significant Environmental Incidents in H1 2019
• Decrease in non-compliance and reportable incidents over same period in 2018
10
Environment
Reportable Spills (examples):
• Hydrocarbon >100L
• Corrosive Products (Lime) 5kg/5L
• Toxic Substances (Copper sulfate) 5kg

11
TMA Water Inflow
Treatment• TMA to WTP
• WTP to NC/BCR1
• BCR1 to WMP
• WMP to BCR2
• BCR2 to CP
• CP to Pinewood via 2
pipelines
Inflow in TMA• Snowmelt + Rain
• Ground thaw
• Mill Discharge
• Pit and MRP waters
NOTE: TMA - Tailings Management Area, WMP - Water Management Pond, WTP - Water Treatment Plant,
NC – Nitrification Cell, BCR - Biochemical reactor, CP - Compliance Point
Pumping• Capacity increased
• Booster pump (planned)
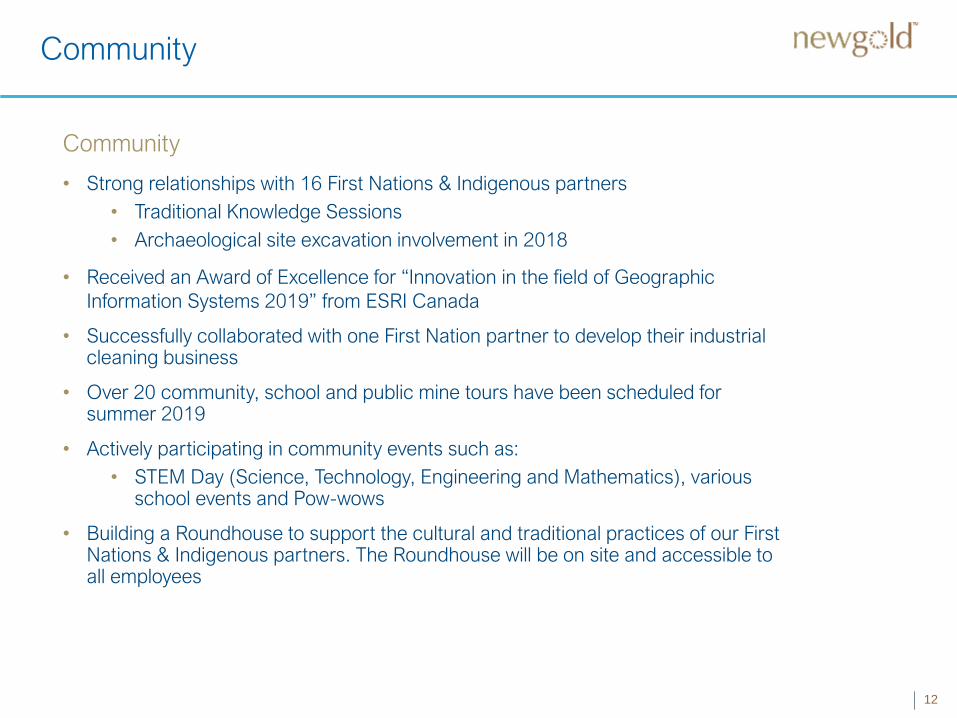
Community
• Strong relationships with 16 First Nations & Indigenous partners
• Traditional Knowledge Sessions
• Archaeological site excavation involvement in 2018
• Received an Award of Excellence for “Innovation in the field of Geographic
Information Systems 2019” from ESRI Canada
• Successfully collaborated with one First Nation partner to develop their industrial cleaning business
• Over 20 community, school and public mine tours have been scheduled for summer 2019
• Actively participating in community events such as:
• STEM Day (Science, Technology, Engineering and Mathematics), various school events and Pow-wows
• Building a Roundhouse to support the cultural and traditional practices of our First Nations & Indigenous partners. The Roundhouse will be on site and accessible to all employees
12
Community

Community Involvement
13

Our People
14
Current Statistics
• 718 employees
• 73% from the local Rainy River & Kenora Districts
• 184 (26%) Indigenous employees
• 101 (14%) female employees
• Turnover rate reduced from 26% (May 2018) to 22% (to end of Q1 2019)
Employee Attraction & Retention Initiatives
• Implementing recruitment technology to streamline application process
• Establish permanent camp facilities
• Implementing new rosters (14/14 rotational schedule)
• Introduction of rewards and recognition program
Leadership Development Strategy
• Management assessments conducted
• Plans for structured leadership development are underway

15
Mining - Geology
• Volcanogenic Massive Sulphide (VMS) ore system
• Hosted in felsic to intermediate volcanic lithologies
Pit outline
• Five ore lenses:
1) Cap Zone: 10%
2) Zone 34: 0.01%
3) ODM: 67%
4) HS: 9%
5) 433: 14%

• Ore-waste contacts not visually
defined. Need assay
confirmation
• Blast ball movement monitoring
used to map dig shapes
• Grade control model estimated
from blast hole sampling used to
generate dig shapes
• RC program scheduled for Q3
will cover three benches ahead
of mining to improve ore control
Mining – Geology Mineralization
Legend
0.3 – 0.5 g/t Au
0.5 – 0.8 g/t Au
> 0.8 g/t Au
300 bench – plan view
Longitudinal section
Phase 1
Phase 2
16

17
Resource Reconciliation
• Grade control model reconciles well with resource model including high grade
• Inclusion of low grade blocks within medium/high grade dig shapes
• Transfer of some medium/high grade to low grade dig shape
• Mill processed 6.5M tonnes at 1.25 g/t gold in 2018; mostly from high grade mining
• Implies dilution of 8% between resources and mining (dig shape) vs model using 5% dilution
• Improve predictability and segregation; RC drilling program launch in Q3
• Updated dilution model
2018 Reconciliation
Resource model Grade control - model Grade control - dig shapes GC shape VS Resource
tonnes Au, g/t Au, oz tonnes Au, g/t Au, oz tonnes Au, g/t Au, oz tonnes Au, g/t Au, oz
HGO 5,504,000 1.70 300,800 6,260,000 1.62 325,700 6,687,000 1.38 296,400 21% -19% -1%
MGO 3,536,000 0.64 72,500 3,840,000 0.64 79,000 3,602,000 0.72 83,700 2% 13% 15%
HGO+MGO 9,040,000 1.28 373,300 10,100,000 1.25 404,700 10,289,000 1.15 380,100 14% -11% 2%
LGO 3,190,000 0.40 40,600 3,519,000 0.39 44,600 2,417,000 0.52 40,300 -24% 31% -1%
Total 12,230,000 1.05 413,900 13,619,000 1.03 449,300 12,706,000 1.03 420,400 4% -2% 2%

Mine Performance
18
Photo taken: June 14, 2019

Mine Performance
19
Q1 Performance
• Planned lower grades and a higher strip ratio; as
mining transitioned from Phase 1 to Phase 2
• Phase 1 delayed in Q1 due to poor drilling availability
70% vs 85%
• Increased overburden removal to compensate for
reduced drill availability in Phase 1.
• Overall strip ratio of 3.1 over the balance of the year
remains on track for guidance
• Utilized East Outcrop (EOC) to supply 900kt of Non-
Acid Generating (NAG) rock for Tailings Management
Area (TMA)
• Lower grade ore coming from open pit increased
stockpile re-handling
0
20,000
40,000
60,000
80,000
100,000
120,000
140,000
160,000
Q1 2018 Q2 2018 Q3 2018 Q4 2018 Q1 2019
ton
ne
s p
er
da
y
Total Material Moved & Ex-pit
TMM Ex-Pit Linear (TMM)
Note: TMM is defined as all material moved. Ex-pit is defined as mined
from operating pit.
Q1
Actual
Ex-pit tonnes mined Mt 46.7 10.1
Ex-pit ore tonnes mined Mt 11.3 1.4
Ex-pit ktpd 128 112
Ex-pit strip ratio (waste:ore) 3.1 6.1
Out-pit tonnes mined 4.5 0.9
Out/in pit re-handling 5.3 2.1
Total tonnes moved Mt 56.5 13.1
FY GuidanceMining Operating KPIs

Mine Performance
20
Challenges
• Increased rock ratio in H2 completing Phase 1 and
increasing productivity in Phase 2
• Need to operate an independent pit to supply NAG for TMA
• Overburden (OVB) is 30-60m, requiring in-pit re-handling of
waste rock for padding
• East and West dumps requires sequencing of OVB and rock
for padding
• In-pit water management
• Training a large number of inexperienced workforce
Opportunities
• Commissioning 4 new drills to improve availability
• Improved operating conditions with wide benches in Phase 2
• Overburden sloping with smaller contractor equipment
• Load & haul improvement through:
• Fleet Management System optimization and
dispatcher training
• Enhancing organizational effectiveness
• Performance management framework
• Mine planning and execution
• Use of short interval control with supervisor coaching
& training
Phase 1
Phase 2
2019 Pit Progression
At the end of 2019 lowest bench elevation will be 250 in Phase 2
Double sided loading

Performance Management Framework
21
SHORT INTERVAL CONTROL
OPERATOR SCORECARDS
VISUAL MANAGEMENT

YTD Results and Expected Future Gains
22
Truck Payload Management
Increase of 18.5ktpd (or 12.5%) in fleet capability
Mining Shift Change
Increase of 5ktpd (or 3.5%) in fleet capability
Reduction in truck queue
Reduction in shovel load times
Reduction in truck spotting times
REALIZED GAINS
TO BE REALIZED

Mining Fleet Performance
23
Loading Units1 – PC8000
2 – PC5500
1 – WA1200
1 – PC3000
Haulage Fleet16 – 830E 1AC
9 – 830E-5
40%
60%
80%
100%
Ava
ilab
ility
Loading Units (12 months)
Availability (%) Avail Target (%)
40%
60%
80%
100%
Availa
bili
ty
Haulage Fleet (12 months)
Availability (%) Avail Target (%)
40%
60%
80%
100%
Ava
ilab
ility
Drill Fleet (12 months)
Availability (%) Avail Target (%)
Drill Fleet2 – DR461i
2 – DR580
1 – DR560
1 – DR1500i
24
Challenges
• Improving mobile fleet availability amid the proposed transformations
• Developing trade experience with Ultra Class fleet
• Now in a consistent PCR (primary component replacement) program
• Increased maintenance associated with construction fleet at TMA
Opportunities
• Truck shop construction including overhead crane
• Onsite warehouse
• Major delays identified, remedial action plans in development
• Implementing outputs from asset management assessment
• Drill strategy going forward existing 2-D461i drills to be traded in and replaced with 4
new D75K drills
• Rebuild program for 580 drills planned for Q2/3
Mining Fleet Performance

Mill Facility
25

Mill Facility Performance
26
• Mill performance continues to improve quarter over quarter
• Mill has ramped up to design capacity and proven it can perform beyond name plate
• Mill availability, throughput and recoveries at, or above target
• Reduced average throughput in Q1, due to planned maintenance on main equipment and challenges with frost in the
coarse ore stockpile
21-25k
25-27k
>27k
Design capacity 21ktpd Short term objective 24ktpd 12 month trend line
Q1
Actual
Milled ktpd 22.0 - 24.0 19.7
Gold grade milled (g/t) ~1.10 1.19
Gold recovery (%) 90 - 92 90
Mill availability (%) 85 - 88 89
Milling Operating KPIs FY Guidance
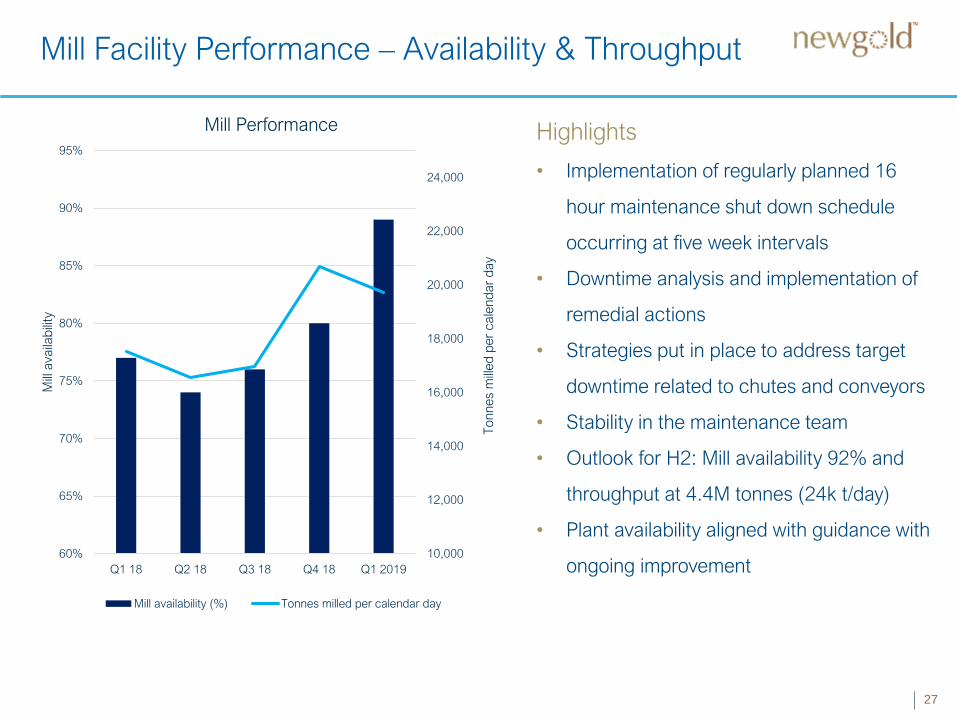
Mill Facility Performance – Availability & Throughput
27
Highlights
• Implementation of regularly planned 16
hour maintenance shut down schedule
occurring at five week intervals
• Downtime analysis and implementation of
remedial actions
• Strategies put in place to address target
downtime related to chutes and conveyors
• Stability in the maintenance team
• Outlook for H2: Mill availability 92% and
throughput at 4.4M tonnes (24k t/day)
• Plant availability aligned with guidance with
ongoing improvement10,000
12,000
14,000
16,000
18,000
20,000
22,000
24,000
60%
65%
70%
75%
80%
85%
90%
95%
Q1 18 Q2 18 Q3 18 Q4 18 Q1 2019
To
nn
es
mill
ed
pe
r ca
len
da
r d
ay
Mill
ava
ilab
ility
Mill Performance
Mill availability (%) Tonnes milled per calendar day

Mill Facility Performance – Recovery Losses
28
• Gold recovery was below plan in Feb. & Mar. due to two primary factors:
• Reduced feed grade
• Higher peak throughput than planned (impacting grind particle size, 84um vs 75um)
• Improvements achieved in both solution and solids losses due to improved carbon handling practices,
strip efficiency and increased plant head grade
• To date, plant results match grade recovery model
80
82
84
86
88
90
92
94
96
98
100
0.20 0.40 0.60 0.80 1.00 1.20 1.40 1.60 1.80 2.00
Pla
nt
Re
co
ve
ry %
Gold Grade
Grade-Recovery Model vs Actual
MarJan
Feb
80%
82%
84%
86%
88%
90%
92%
94%
96%
98%
100%
Oct-18 Nov-18 Dec-18 Jan-19 Feb-19 Mar-19
Plant Recovery
Recovery - Gold Losses Solids Losses Solution

29
Challenges
• Tailings pipeline system bottleneck:
• Booster pump installation along the tailings line
• Primary crusher dust:
• Add water in summer; calcium chloride in winter
• Coarse ore stockpile frozen feed:
• Add calcium chloride; install grizzly bars; modify apron chutes in H2
Opportunities
• Increased throughput - (post tailings debottlenecking):
• Optimize flocculant addition system
• Redesign trash screen feed distribution system
• Commission pebble crusher (July); new SAG liner configuration (August)
• Criticality spares assessment; Ensure all required critical spares are on hand
• Online vibration analysis on critical components of the plant (improve reliability)
• Cost reduction
• Grinding media change to reduce consumption; Recycle steel from SAG to Ball Mill
• Cyanide consumption reduction with free cyanide analyzer; Optimize leach retention time
• Recovery Improvements
• Carbon strip configuration improvements to reduce solution losses (10 vs 20 tonne strips)
• Gravity circuit commissioning (loss in solid improvement)
Mill Challenges & Opportunities

Operating Unit Costs (USD)
30
• Ex-pit operating cost in line with guidance; room for significant improvement
• Processing costs impacted by the significant buildup of ice in the crushed ore
stockpile and above the apron feeders in Q1; expected to decline in H2 as mill
availability and throughput improve
• Site G&A costs are inline on an absolute basis, but were negatively impacted on
a unit cost basis due to lower tonnes milled
Q1
Actual
Open Pit Net Mining Costs ($/expit) $3.25 - $3.75 $3.54 3.35$
Processing Costs ($/tonne milled) $8.50 - $9.00 $12.27 9.66$
Site G&A ($/tonne milled) $3.75 - $4.25 $4.75 4.44$
FY GuidanceUnit Operating Costs2018
Actual

Initiatives to Reduce our Operating Costs
31
Open Pit Mining
• Operating efficiency & productivity
improvements through coaching &
implementation of short interval control
tools
• Implement maintenance audit
improvement actions (reduction in
outside services)
• Cost analysis on top cost drivers
Processing
• Reduction in cyanide and SO2
consumption via auto control
• Elimination of carbon acid wash (with no
impact on recovery)
• Changing grinding media (forecasting a
30% reduction in SAG media
consumption)
• Targeting reduced power consumption
during Ontario Peak consumptions to
reduce long term power costs
Site G&A
• 70% spend under contract
• Master service agreements with
Vendors to ensure fixed rates
• Inventory control management
(Rationalize inventory)
• Build on-site warehouse
• Reduce costs associated with
turnover
$0.00
$2.00
$4.00
$6.00
$8.00
$10.00
$12.00
$14.00
$16.00
Q4 17 Q1 18 Q2 18 Q3 18 Q4 18 Q1 2019
Operating Costs
Open pit mining costs ($/ore and operating waste tonne mined ex-pit) Processing costs ($/tonne milled) Site G&A ($/tonne milled)

Rainy River: 2019 Capital Highlights
32
Sustaining Capital, ARO Amort. & Other ($M) 2019 Estimates
Sustaining Capital $210 – $230
Total construction capital $150 - $165
− Tailings facility (Stage 2) $65 - $70
− Waste Dump (Management & Stabilization/Wick
Drains)$45 - $50
− Water treatment train $5 - $10
− Maintenance/Warehouse facility ~$20
− Mill commissioning completion ~$5
− Camp facility ~$10
Other sustaining capital $60-$65
− Machinery & Equipment $10-$13
− Mining infrastructure $6-$8
− Capital Leases ~$9
− Mill upgrades ~$2
− Capitalized Mining, 2018 Sustaining Capital and
Working Capital ~$33
ARO Amortization and Other ~$2
Key Construction Capital Items
• ~72% ($150-$165M) of sustaining capital
is related to deferred construction and
additional mill upgrades.
Other Key Sustaining Capital
• ~50% (~$33M) of remaining sustaining
capital for phase 2 capital stripping and
capital projects not completed in 2018
(~$15M)
Positioning site as “Fully Built” in late 2019 /
early 2020
Sustaining capital is expected to significantly decrease beginning in 2020 as
deferred construction is completed

Capital Projects
33
Construction Items – TMA Stage 2
• Completed South Dam Buttress
• Major Contractor commenced placement
on North & West Dam
• New Gold Fleet commenced placement
on South & North Dam
Self Perform Burrito Construction
Waste Dump Stabilization (Wick Drains)
• Contracts awarded and construction
commenced for East Mine Rock
Stockpile (EMRS)
• West Mine Rock Stockpile (WMRS)
impacted by new pit shell, design being
re-optimized
West Mine Rock Stockpile

Capital Projects
34
Truck shop location
Crushing rock for wick drains
Water Treatment Plant clarifiers
Sonic drilling TMA instrumentation

New Life of Mine (LOM)
35
H1:Analysis
Q3: Development of
optional scenarios
Q4: Finalize mine plan
Scenario analysis
Design parameter studies
Mine plan strategies
Physicals (early Q3)
Complete capital budget
Complete cost analysis
• Focus on medium and high grade ore to create a more profitable open pit
• Optimize capital required to support mining, processing and tailings disposal of medium and high grade ore
• Optimize open pit production and decouple the NAG construction needs from mining operation
• Consider various underground scenarios to further enhance profitability
• Utilize excess mill capacity to process stock pile tonnes during the open pit mine life
• Benchmarking best industry practices to optimize mining and milling and reduce costs
• Increase free cash flow generation
Optimized u/g mine plan
Deliver updated mine plan

Open Pit Optimization - Preliminary Overview
36
Section, Looking NW
Current Phase 1
Current Phase 2
Current Phase 3
Potential MG/HG Shell
Mineable from underground
Potential reduction of pit shell size using higher cutoff grade at lower gold price (preliminary work only)

Open Pit Optimization - Preliminary Overview
37
Current Pit Shell Proposed Optimized Pit Shell
Potential Higher Profitability During Open Pit MiningMaximum NPV
• Cut-off grades, pit design and sequencing under
review
• Significant reduction in total tonnes mined
• Minimize tailings and waste dumps space (and
stabilization) required
• Low grade stockpiling strategy
• Capital intensive
• Lower margin during open pit mining
Potential reduction of pit shell size using higher cutoff grade at lower gold price (preliminary work only)

2018 Mineral Reserves and Resources
38
Mineral Reserves Statement as at December 31, 2018
Proven & Probable Metal grade Contained metal
Tonnes
000s
Gold
g/t
Silver
g/t
Copper
%
Gold
Koz
Silver
Koz
Copper
Mlbs
RAINY RIVER
Direct processing reserves
Open Pit
Proven 18,663 1.24 2.4 - 744 1,450 -
Probable 47,670 1.18 3.0 - 1,810 4,542 -
Open Pit P&P (direct processing-MGO&HGO) 66,333 1.20 2.8 - 2,554 5,993 -
Underground
Proven - - - - - - -
Probable 8,954 3.55 9.5 - 1,021 2,728 -
Underground P&P (direct processing) 8,954 3.55 9.5 - 1,021 2,728 -
Low grade reserves
Open Pit
Proven 8,430 0.36 2.0 - 97 541 -
Probable 32,714 0.35 2.3 - 366 2,428 -
Open Pit P&P (LGO) 41,145 0.35 2.2 - 463 2,969 -
Surface Stockpiles
Proven 7,307 0.63 1.8 - 147 426 -
Open Pit P&P (stockpile) 7,307 0.63 1.8 - 147 426 -
Combined P&P
Proven 34,400 0.89 2.4 - 989 2,291 -
Probable 89,339 1.11 3.4 - 3,197 9,825 -
Total Rainy River P&P 123,739 1.05 3.0 - 4,186 12,116 -
Please refer to the 2018 AIF for additional details on assumptions and parameters

Underground Optimization Evaluation–Preliminary Overview
1. Stope optimized vs cut-off grade sensitivity
2. 4 portal locations for evaluation determined
• Option A: Open Pit Phase 2 bench 180 RL access
• Option B: Open Pit Phase 2 bench access West – 310 RL
• Option C: West - Waste Dump access
• Option D: Existing LOM UG plan
3. Scenario A,B,C high level evaluation complete
4. Scenario A,B selected for further work
5. Shorter payback, less upfront capital required
39
Current Design
Each u/g sector to be evaluated as
independent project
Potential reduction of total underground development required (preliminary work only)

4.0 g/t cut-off – stope optimizer
2.2 g/t cut-off – mine design
40
Underground Stope Optimizer vs Cut-off Grades
Main underground sectors remain mineable at higher cut-off grades
Potential impact on underground stoping using higher cut-off grade (preliminary work only)

41
2019 Exploration Program - Intrepid North
• Located within 1km from Rainy River mill
• Testing potential repeats of mineralized lenses north of Intrepid ore body
• Started drilling campaign in Q2
• 15% complete with 2 holes for 1000 m
• Objective 7,500 metres in 15 holes planned
• Drilling program to continue through Q3 with assessment of results in Q4
Intrepid
North
Target
area

42
Rainy River Northeast Trend
• 15 kilometre trend of prospective
geochemical and geophysical anomalies
along major regional scale fault zone
• Additional geophysical and geochemical
targeting surveys in Q3
• Significant discovery potential for
orogenic-gold deposit type
Coventry
• Prospective gold grain in till and
geophysical anomalies
• Additional geochemical survey for drill
target definition
• Potential to define Rainy River deposit
type mineralization
Surface Exploration

43
Q & A

Endnotes
44
NON-GAAP MEASURES
1. ALL-IN SUSTAINING COSTS PER GOLD EQUIVALENT OUNCE
"All-in sustaining costs per gold equivalent ounce” is a non-GAAP financial measure. Consistent with guidance announced in 2013 by the World Gold Council, an association of various gold mining companies from
around the world New Gold defines "all-in sustaining costs" per ounce as the sum of total cash costs, capital expenditures that are sustaining in nature, corporate general and administrative costs, capitalized and
expensed exploration that is sustaining in nature, lease payments that are sustaining in nature, and environmental reclamation costs, all divided by the ounces of gold equivalent sold to arrive at a per ounce figure.
In addition to gold the Company produces copper and silver. Gold equivalent ounces of copper and silver produced in a quarter are computed by calculating the ratio of the average spot market copper and silver
prices to the average spot market gold price in a quarter and multiplying this ratio by the pounds of copper and silver ounces produced during that quarter. Gold equivalent ounces produced in a period longer than
one quarter are calculated by adding the number of gold equivalent ounces in each quarter of that period. Notwithstanding the impact of copper and silver sales, as a Company focused on gold production, New Gold
aims to assess the economic results of its operations in relation to gold, which is the primary driver of New Gold’s business.
New Gold believes this non-GAAP financial measure provides further transparency into costs associated with producing gold and assists analysts, investors and other stakeholders of the Company in assessing the
Company's operating performance, its ability to generate free cash flow from current operations and its overall value. This data is furnished to provide additional information and is a non-GAAP financial measure. All-in
sustaining costs presented do not have a standardized meaning under IFRS and may not be comparable to similar measures presented by other mining companies. It should not be considered in isolation or as a
substitute for measures of performance prepared in accordance with IFRS and is not necessarily indicative of cash flow from operations under IFRS or operating costs presented under IFRS.
"Sustaining costs" is a non-GAAP financial measure. New Gold defines sustaining costs as the difference between all-in sustaining costs and total cash costs, being the sum of net capital expenditures that are
sustaining in nature, corporate general and administrative costs, capitalized and expensed exploration that is sustaining in nature, lease payments that are sustaining in nature. and environmental reclamation costs.
New Gold terms non-sustaining capital costs to be “growth capital”. Management uses sustaining costs to understand the aggregate net result of the drivers of all-in sustaining costs other than total cash costs. The
line items between cash costs and all-in sustaining costs in the tables below break down the components of sustaining costs. Sustaining costs is intended to provide additional information only, does not have any
standardized meaning under IFRS, and may not be comparable to similar measures presented by other mining companies. It shouldnot be considered in isolation or as a substitute for measures of performance
prepared in accordance with IFRS.
2. TOTAL CASH COSTS
"Total cash costs per ounce” and total cash costs per gold equivalent ounce are non-GAAP financial measures which are calculated in accordance with a standard developed by The Gold Institute, a worldwide
association of suppliers of gold and gold products that ceased operations in 2002. Adoption of the standard is voluntary and the cost measures presented may not be comparable to other similarly titled measures of
other companies. New Gold reports total cash costs on a sales basis. The Company believes that certain investors use this information to evaluate the Company's performance and ability to generate liquidity through
operating cash flow to fund future capital expenditures and working capital needs. This measure, along with sales, is considered to be a key indicator of the Company's ability to generate operating earnings and cash
flow from its mining operations. Total cash costs include mine site operating costs such as mining, processing and administration costs, royalties, production taxes, but are exclusive of amortization, reclamation, capital
and exploration costs. Total cash costs per gold ounce are net of by-product sales and are divided by gold ounces sold to arrive at a per ounce figure. Total cash costs per gold equivalent ounce are divided by gold
equivalent ounces sold to arrive at a per ounce figure.
Unless otherwise indicated, all total cash cost information in this news release is on a gold equivalent ounce basis. Gold equivalent ounces of copper and silver produced in a quarter are computed by calculating the
ratio of the average spot market copper and silver prices to the average spot market gold price in a quarter and multiplying this ratio by the pounds of copper and silver ounces produced during that quarter. Gold
equivalent ounces produced in a period longer than one quarter are calculated by adding the number of gold equivalent ounces in each quarter of that period. This data is furnished to provide additional information
and is a non-GAAP financial measure. Total cash costs presented do not have a standardized meaning under IFRS and may not be comparable to similar measures presented by other mining companies. It should
not be considered in isolation or as a substitute for measures of performance prepared in accordance with IFRS and is not necessarily indicative of cash flow from operations under IFRS or operating costs presented
under GAAP.

Endnotes
45
NON-GAAP MEASURES CONTINUED
3. SUSTAINING CAPITAL
“To determine sustaining capital expenditures, New Gold uses cash flow related to mining interests from its statement of cash flows and deducts any expenditures that are non-sustaining. Capital expenditures to
develop new operations or capital expenditures related to major projects at existing operations where these projects will materially benefit the operation are classified as non-sustaining and are excluded. The definition
of sustaining versus non-sustaining is similarly applied to capitalized and expensed exploration costs. Exploration costs to develop new operations or that relate to major projects at existing operations where these
projects are expected to materially benefit the operation are classified as non-sustaining and are excluded.”
OTHER ENDNOTE
GOLD EQUIVALENT
“Gold equivalent ounces produced includes silver ounces and copper pounds converted to a gold equivalent based on a ratio of the average spot market prices for the commodities for
each period.”