


Raintree Plantation - Lots For Sale
106
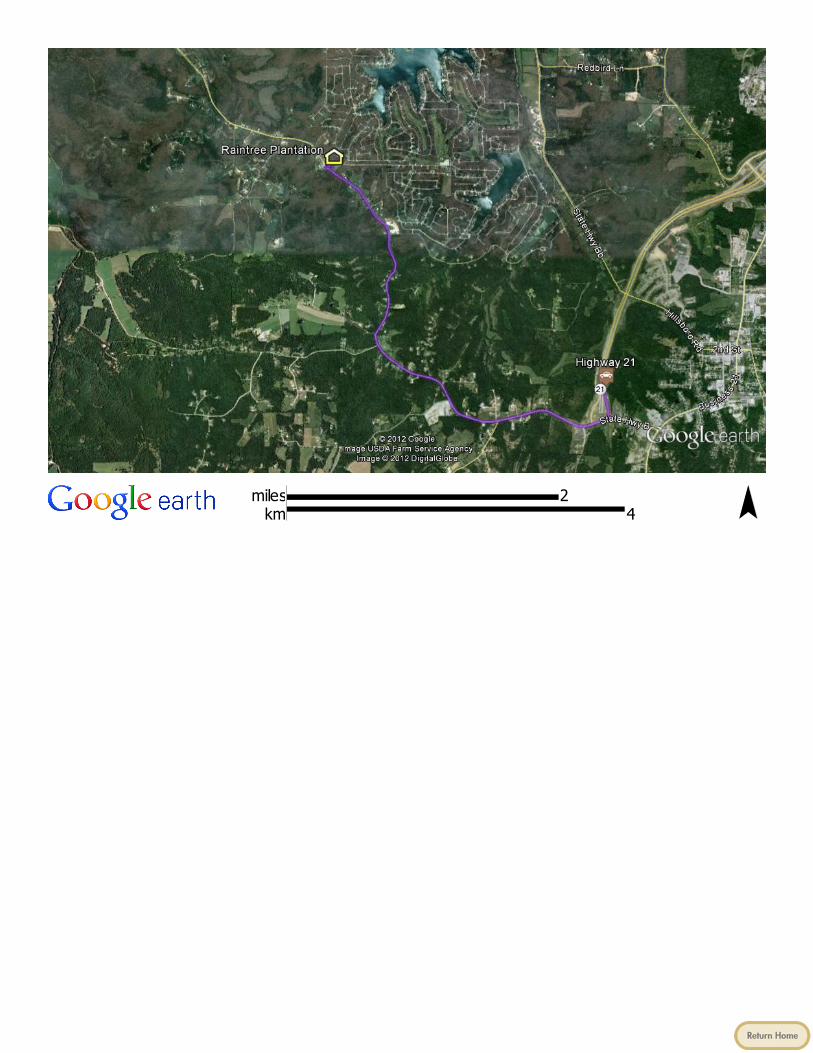
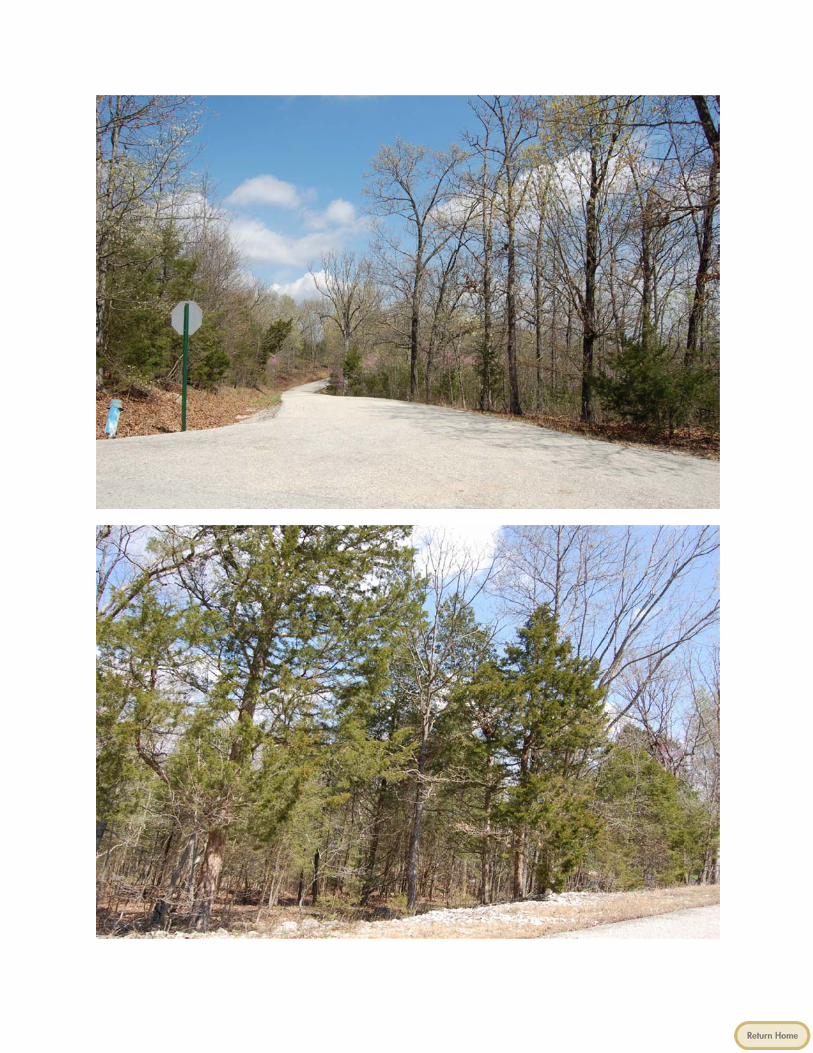
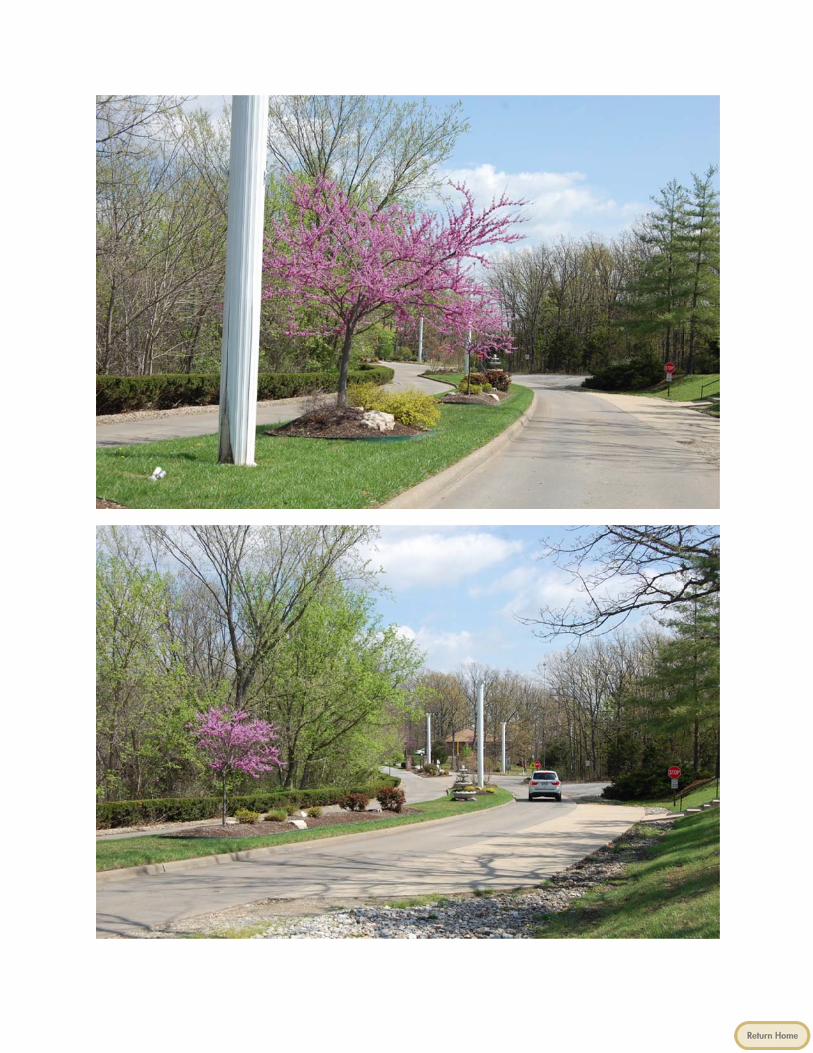
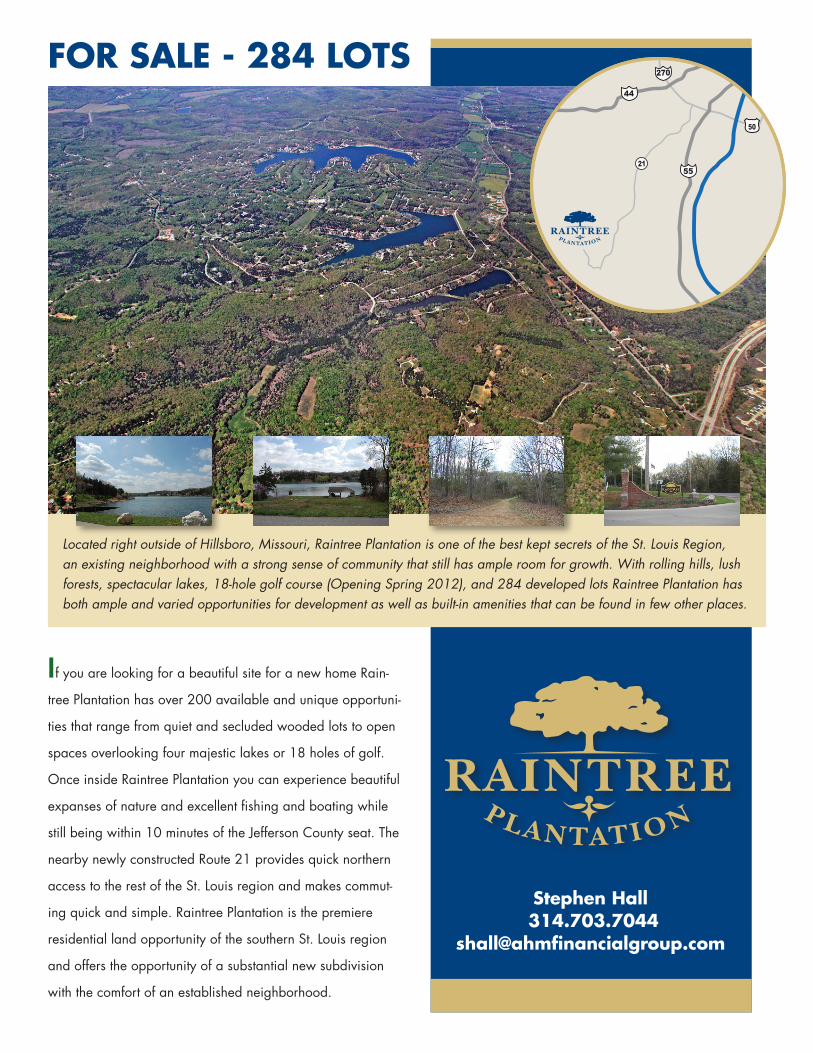
I f you are looking for a beautiful site for a new home Rain- tree Plantation has over 200 available and unique opportuni- ties that range from quiet and secluded wooded lots to open spaces overlooking four majestic lakes or 18 holes of golf. Once inside Raintree Plantation you can experience beautiful expanses of nature and excellent fishing and boating while still being within 10 minutes of the Jefferson County seat. The nearby newly constructed Route 21 provides quick northern access to the rest of the St. Louis region and makes commut- ing quick and simple. Raintree Plantation is the premiere residential land opportunity of the southern St. Louis region and offers the opportunity of a substantial new subdivision with the comfort of an established neighborhood. Located right outside of Hillsboro, Missouri, Raintree Plantation is one of the best kept secrets of the St. Louis Region, an existing neighborhood with a strong sense of community that still has ample room for growth. With rolling hills, lush forests, spectacular lakes, 18-hole golf course (Opening Spring 2012), and 284 developed lots Raintree Plantation has both ample and varied opportunities for development as well as built-in amenities that can be found in few other places. Stephen Hall 314.703.7044 shall@ahmfinancialgroup.com FOR SALE - 284 LOTS 50 21 44 270 55
-
Upload
rachel-ballard -
Category
Documents
-
view
223 -
download
3
description
Raintree Plantation Lots For Sale Saint Louis, Missouri
Transcript of Raintree Plantation - Lots For Sale
If you are looking for a beautiful site for a new home Rain-
tree Plantation has over 200 available and unique opportuni-
ties that range from quiet and secluded wooded lots to open
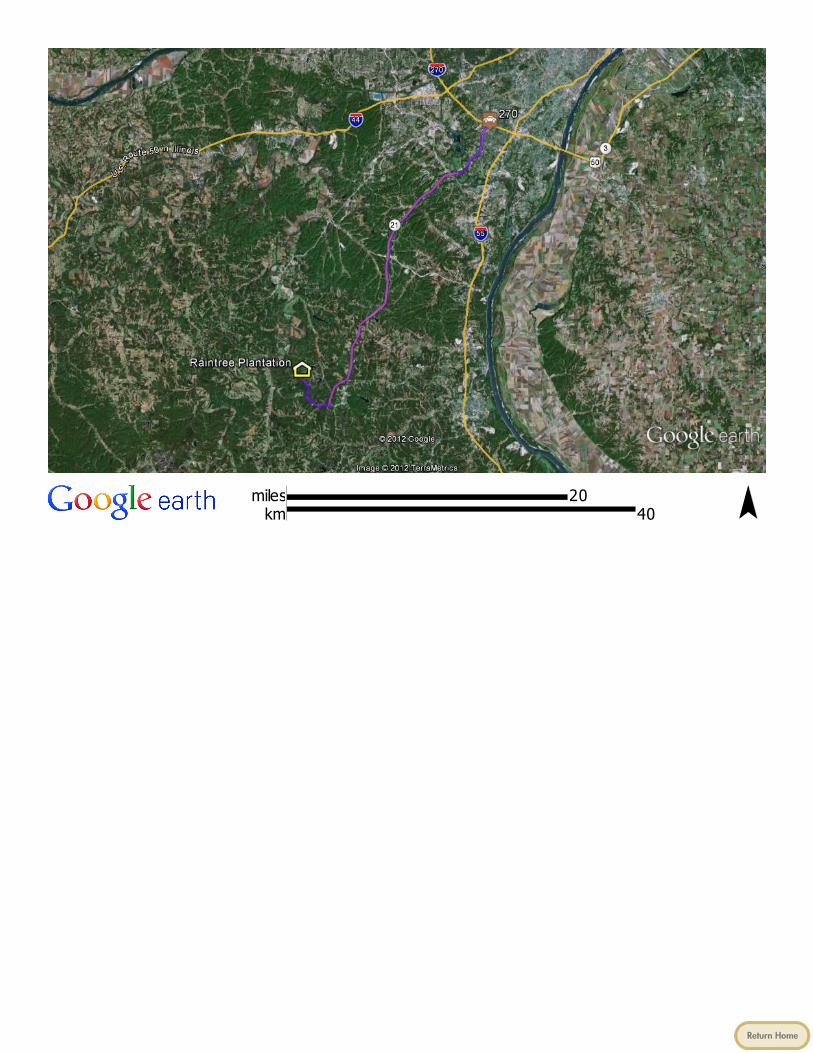
spaces overlooking four majestic lakes or 18 holes of golf.
Once inside Raintree Plantation you can experience beautiful
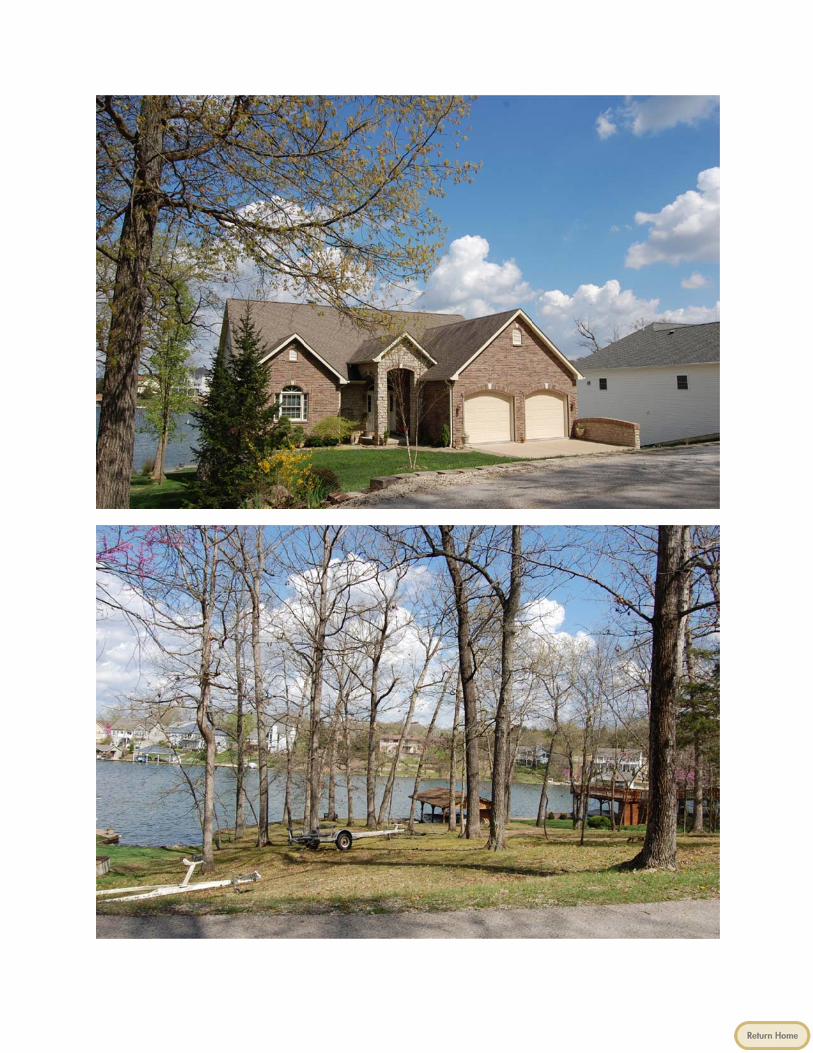
expanses of nature and excellent fishing and boating while
still being within 10 minutes of the Jefferson County seat. The
nearby newly constructed Route 21 provides quick northern
access to the rest of the St. Louis region and makes commut-
ing quick and simple. Raintree Plantation is the premiere
residential land opportunity of the southern St. Louis region
and offers the opportunity of a substantial new subdivision
with the comfort of an established neighborhood.
Located right outside of Hillsboro, Missouri, Raintree Plantation is one of the best kept secrets of the St. Louis Region, an existing neighborhood with a strong sense of community that still has ample room for growth. With rolling hills, lush forests, spectacular lakes, 18-hole golf course (Opening Spring 2012), and 284 developed lots Raintree Plantation has both ample and varied opportunities for development as well as built-in amenities that can be found in few other places.
Stephen Hall 314.703.7044
FOR SALE - 284 LOTS
50
21
44
270
55

Stephen Hall 314.703.7044
All About Raintree Plantation
Mapping Perspectives
Raintree Community Photography
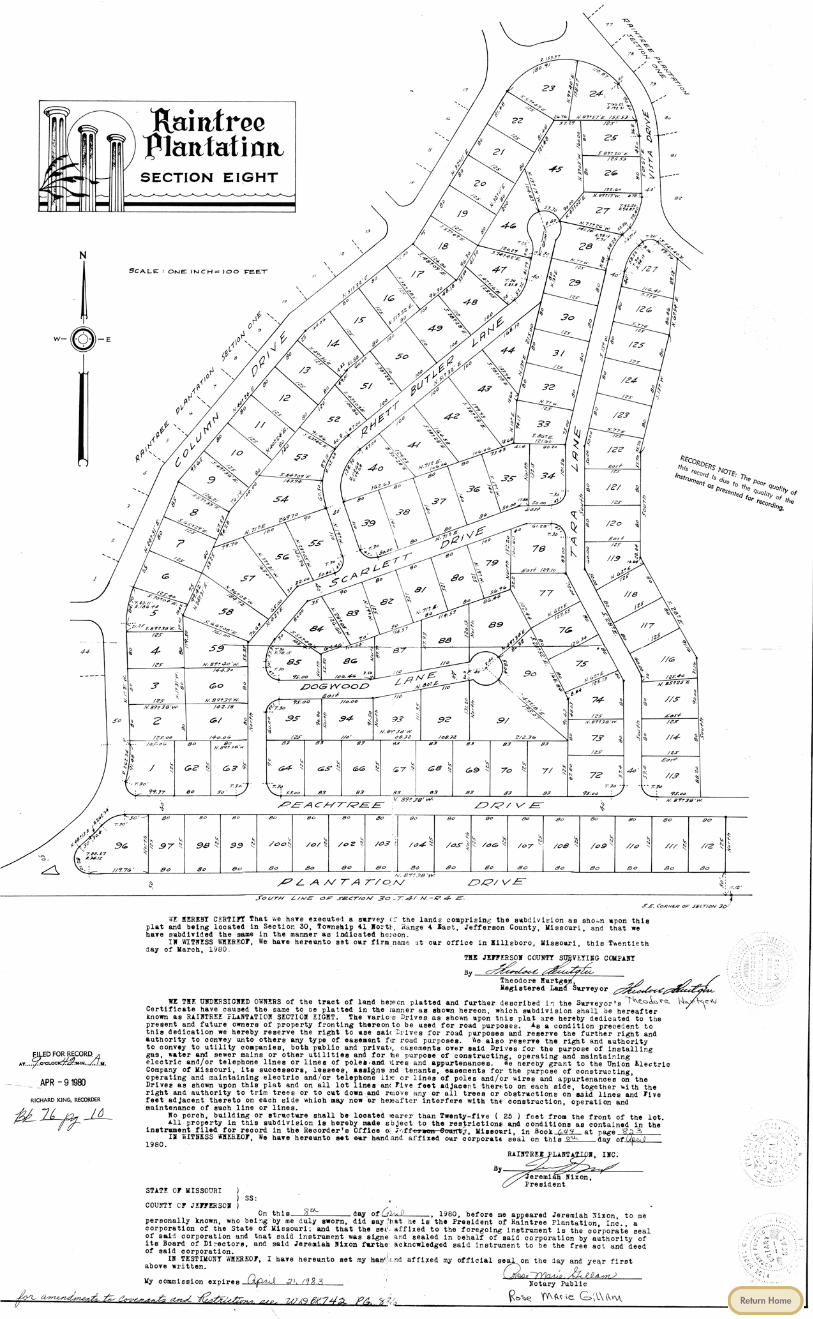
Plats of Raintree Plantation
Demographics Surrounding Raintree Plantation
Home Types
MarketGraphics Research (Learn About the Market)
Construction Lending and Mortgage Programs
Click the Links Below to Learn More

RAINTREE PLANTATIONLocated right outside of Hillsboro, Missouri, Raintree Plantation is one of the best kept
secrets of the St. Louis Region, an existing neighborhood with a strong sense of com-
munity that still has ample room for growth. With rolling hills, lush forests, spectacular
lakes, 18-hole golf course, and 284 developed lots for sale Raintree Plantation has
both ample and varied opportunities for development as well as built-in amenities that
can be found in few other places.
If you are looking for a beautiful site for a new home Raintree Plantation has over 200
available and unique opportunities that range from quiet and secluded wooded lots to
open spaces overlooking four majestic lakes or 18 holes of golf. Once inside Raintree
Plantation you can experience beautiful expanses of nature and excellent fishing and
boating while still being within 10 minutes of the Jefferson County seat. The nearby
newly constructed Route 21 provides quick northern access to the rest of the St. Louis
region and makes commuting quick and simple. Raintree Plantation is the premiere
residential land opportunity of the southern St. Louis region and offers the opportunity
of a substantial new subdivision with the comfort of an established neighborhood.
ALL ABOUT

Copyright © and (P) 1988–2009 Microsoft Corporation and/or its suppliers. All rights reserved. http://www.microsoft.com/mappoint/Certain mapping and direction data © 2009 NAVTEQ. All rights reserved. The Data for areas of Canada includes information taken with perm ission from Canadian authorities, including: © Her Majesty the Queen in Right of Canada, © Queen's Printer for Ontario. NAVTEQ and NAVTEQ ON BOARD are trademarks of NAVTEQ. © 2009 Tele Atlas North America, Inc. All rights reserved. Tele Atlas and Tele Atlas North America are trademarks of Tele Atlas, Inc. © 2009 by Applied Geographic Systems. All rights reserved.
Raintree Plantation Five Mile Competitive
0 mi 1 2 3 4


Study Area: Raintree Plantation Demographic AreaBenchmark: The United States
Population
The population in this area is estimated to change from 448,685 to 469,638, resulting in a growth of 4.7%between the year 2000 and the current year. Over the next five years, the population is projected to grow by1.5%.
The Population in The United States is estimated to change from 281,421,906 to 309,038,974 ,resulting in a growth of 9.8% between 2000 and the current year. Over the next five years, thepopulation is expected to grow by 4.1%
The current year median age for this population is 40.0, and the average age is 39.3. Five years from now, themedian age is projected to be 41.1.
The current year median age for The United States is 37.0, while the average age is 37.7. Five yearsfrom now, the median age is projected to be 37.8
Of this area's current year population:91.4% are White alone, 4.2% are Black or African American alone, 0.3% are American Indian or AlaskaNative alone, 1.8% are Asian alone, 0.0% are Native Hawaiian or other Pacific Islander alone, 0.7% areSome Other Race, and 1.6% are Two or More Races
For The United States:72.3% are White alone, 12.4% are Black or African American alone, 0.9% are American Indian orAlaska Native alone, 4.4% are Asian alone, 0.2% are Native Hawaiian or other Pacific Islanderalone, 6.8% are Some Other Race, and 3.0% are Two or More Races
This area's current estimated Hispanic or Latino population is 2.4%, while The United States currentestimated Hispanic or Latino population is 15.8% .
HouseholdsThe number of households in this area is estimated to change from 178,880 to 188,744, resulting in anincrease of 5.5% between 2000 and the current year. Over the next five years, the number is expected toincrease by 1.7%. The number of households in The United States is estimated to change from 105,480,101 to 116,136,617,resulting in an increase of 10.1% between 2000 and the current year. Over the next five years, the number isprojected to increase by 4.1%.
Household IncomeThe average household income is estimated to be $67,994 for the current year, while the average householdincome for The United States is estimated to be $71,071 for the same time frame The average household income in this area is projected to increase 8.4% over the next five years, from$67,994 to $73,675. The United States is projected to have a 9.0% increase in average household income.The current year estimated per capita income for this area is $27,495, compared to an estimate of $27,034 forThe United States as a whole.
Demographic Executive Summary Report file:///C:/DOCUME~1/KATIEP~1/LOCALS~1/Temp/PCTempExecutiv...
1 of 3 3/30/2012 8:07 AM

EmploymentFor this area, 52.5% of the population is estimated to be employed and age 16 and over for the current year.The employment status of this labor force is as follows:0.1% are in the armed forces, 66.0% are employed civilians, 3.2% are unemployed civilians, 30.7% are notin the labor force. For The United States, 47.3% of the population is estimated to be employed and age 16 and over for thecurrent year. Of this labor force: 0.5% are in the Armed Forces, 61.0% are employed civilians, 4.1% areunemployed civilians, and 34.4% are not in the labor force. For this area, 52.5% of the population is estimated to be employed and age 16 and over for the current year.The occupational classifications are as follows:22.3% have occupation type blue collar, 61.0% are white collar, and 16.7% are service & farm workers.
For The United States, 47.3% of the population is estimated to be employed and age 16 and over for thecurrent year. The occupational classifications are as follows:22.1% have occupation type blue collar, 60.2% are white collar, and 17.6% are service & farm workers. For the civilian employed population age 16 and over in this area, it is estimated that they are employed in thefollowing occupational categories:1.8% are in Architecture and Engineering, 1.6% are in Arts, Entertainment and Sports, 4.9% are in Businessand Financial Operations, and 2.8% are in Computers and Mathematics, 4.9% are in Education, Training andLibraries, 5.7% are in Healthcare Practioners and Technicians, 2.2% are in Healthcare Support, 1.0% are inLife, Physical and Social Sciences, 8.1% are in Management, 15.7% are in Office and AdministrativeSupport. 1.4% are in Community and Social Services, 5.8% are in Food Preparation and Serving, 0.9% are in LegalServices, 2.0% are in Protective Services, 12.2% are in Sales and Related Services, 2.9% are in PersonalCare Services. 3.7% are in Building and Grounds Maintenance, 6.4% are in Construction and Extraction, 0.1% are inFarming, Fishing and Forestry, 3.9% are in Maintenance and Repair, 6.6% are in Production, 5.4% are inTransportation and Moving. For the civilian employed population age 16 and over in The United States, it is estimated that they areemployed in the following occupational categories:1.9% are in Architecture and Engineering, 1.9% are in Arts, Entertainment and Sports, 4.4% are in Businessand Financial Operations, and 2.4% are in Computers and Mathematics, 5.8% are in Education, Training andLibraries, 5.1% are in Healthcare Practioners and Technicians, 2.3% are in Healthcare Support, 0.9% are inLife, Physical and Social Sciences, 9.6% are in Management, 14.2% are in Office and AdministrativeSupport. 1.6% are in Community and Social Services, 5.4% are in Food Preparation and Serving, 1.1% are in LegalServices, 2.2% are in Protective Services, 11.3% are in Sales and Related Services, 3.3% are in PersonalCare Services. 3.9% are in Building and Grounds Maintenance, 6.0% are in Construction and Extraction, 0.7% are inFarming, Fishing and Forestry, 3.4% are in Maintenance and Repair, 6.5% are in Production, 6.1% are inTransportation and Moving.
Educational AttainmentCurrently, it is estimated that 6.4% of the population over 25 in this area had earned a Masters Degree, 1.5%had earned a Professional School Degree, 0.7% had earned a Doctorate Degree and 16.2% had earned aBachelor's Degree.
In comparison, for The United States, it is estimated that 7.0% of the population over 25 in this area hadearned a Masters Degree, 1.9% had earned a Professional School Degree, 1.1% had earned a DoctorateDegree and 17.4% had earned a Bachelor's Degree.
Demographic Executive Summary Report file:///C:/DOCUME~1/KATIEP~1/LOCALS~1/Temp/PCTempExecutiv...
2 of 3 3/30/2012 8:07 AM

DwellingsMost of the dwellings (76.8%) in this area are estimated to be Owner Occupied for the current year. For TheUnited States, the majority of housing units are Owner Occupied (66.8%). The majority of dwellings in this area (71.4%) are estimated to be "detached single units" for the current year.In The United States, the majority of dwellings are estimated to be "detached single units". The majority of housing units in this area (15.9%) are estimated to have been built in 1939 or earlier for thecurrent year. Most of the housing units in The United States (16.2%) are estimated to have been built between1970 and 1979 for the current year.
Demographic Executive Summary Report file:///C:/DOCUME~1/KATIEP~1/LOCALS~1/Temp/PCTempExecutiv...
3 of 3 3/30/2012 8:07 AM

Pop Facts:Population Quick Facts
Pop Facts:Population Quick Facts
Population2015 Projection 476,6442010 Estimate 469,6382000 Census 448,6851990 Census 420,886
Growth 2010-2015 1.49%Growth 2000-2010 4.67%Growth 1990-2000 6.60%
2010 Estimated Total Population by Age 469,638
Age 0 to 4 29,254 6.23%Age 5 to 9 28,714 6.11%Age 10 to 14 29,454 6.27%Age 15 to 17 19,255 4.10%Age 18 to 20 17,000 3.62%Age 21 to 24 22,668 4.83%Age 25 to 34 56,501 12.03%Age 35 to 44 63,930 13.61%Age 45 to 54 77,440 16.49%Age 55 to 64 60,076 12.79%Age 65 to 74 35,880 7.64%Age 75 to 84 20,452 4.35%Age 85 and over 9,014 1.92%
Age 16 and over 375,832 80.03%Age 18 and over 362,961 77.29%Age 21 and over 345,961 73.67%Age 65 and over 65,346 13.91%
2010 Estimated Median Age 402010 Estimated Average Age 39.34
Raintree Plantation

2010 Estimated Population by Single Race Classification 469,638
White Alone 429,163 91.38%Black or African American Alone 19,751 4.21%American Indian and Alaska Native Alone 1,236 0.26%Asian Alone 8,298 1.77%Native Hawaiian and Other Pacific Islander Alone 175 0.04%Some Other Race Alone 3,493 0.74%Two or More Races 7,522 1.60%
2010 Estimated Population Hispanic or Latino 469,638
Hispanic or Latino 11,325 2.41%Not Hispanic or Latino 458,313 97.59%
2010 Estimated Population by Sex469,638
Male 228,631 48.68%Female 241,007 51.32%

Pop Facts:Household Quick Facts
Pop Facts:Household Quick Facts
Households
2015 Projection 192,0152010 Estimate 188,7442000 Census 178,8801990 Census 164,136
Growth 2010-2015 1.73%Growth 2000-2010 5.51%Growth 1990-2000 8.98%
2010 Estimated Households by Household Income 188,744
Less than $15,000 16,263 8.62%$15,000 to $24,999 17,118 9.07%$25,000 to $34,999 20,523 10.87%$35,000 to $49,999 30,432 16.12%$50,000 to $74,999 40,918 21.68%$75,000 to $99,999 27,272 14.45%$100,000 to $124,999 17,857 9.46%$125,000 to $149,999 8,369 4.43%$150,000 to $199,999 5,971 3.16%$200,000 to $499,999 3,490 1.85%$500,000 or more 531 0.28%
2010 Estimated Average Household Income $67,994 2010 Estimated Median Household Income $56,132 2010 Estimated Per Capita Income
$27,495
2010 Median Household Income by Single Race Classification or Ethnicity
White Alone $57,816 Black or African American Alone $29,540 American Indian and Alaska Native Alone $43,265 Asian Alone $47,674 Native Hawaiian and Other Pacific Islander Alone $35,625 Some Other Race Alone $38,495 Two or More Races $39,367
Hispanic or Latino 45,103Not Hispanic or Latino 56,351
Raintree Plantation Demographic Area

2010 Estimated Households by Household Type 188,744
Family Households 127,948 67.79%Nonfamily Households 60,796 32.21%
2010 Estimated Group Quarters Population 4,165
2010 Estimated Households by Household Size 188,744
1-person household 52,936 28.05%2-person household 60,868 32.25%3-person household 32,415 17.17%4-person household 26,484 14.03%5-person household 11,071 5.87%6-person household 3,545 1.88%7 or more person household 1,425 0.75%
2010 Average Household Size 2.47

2010 Estimated Family Households by Type and Presence of Own Children 127,948
Married-Couple Family, own children 39,993 31.26%Married-Couple Family, no own children 58,142 45.44%Male Householder, own children 4,479 3.50%Male Householder, no own children 4,562 3.57%Female Householder, own children
11,727 9.17%Female Householder, no own children 9,045 7.07%
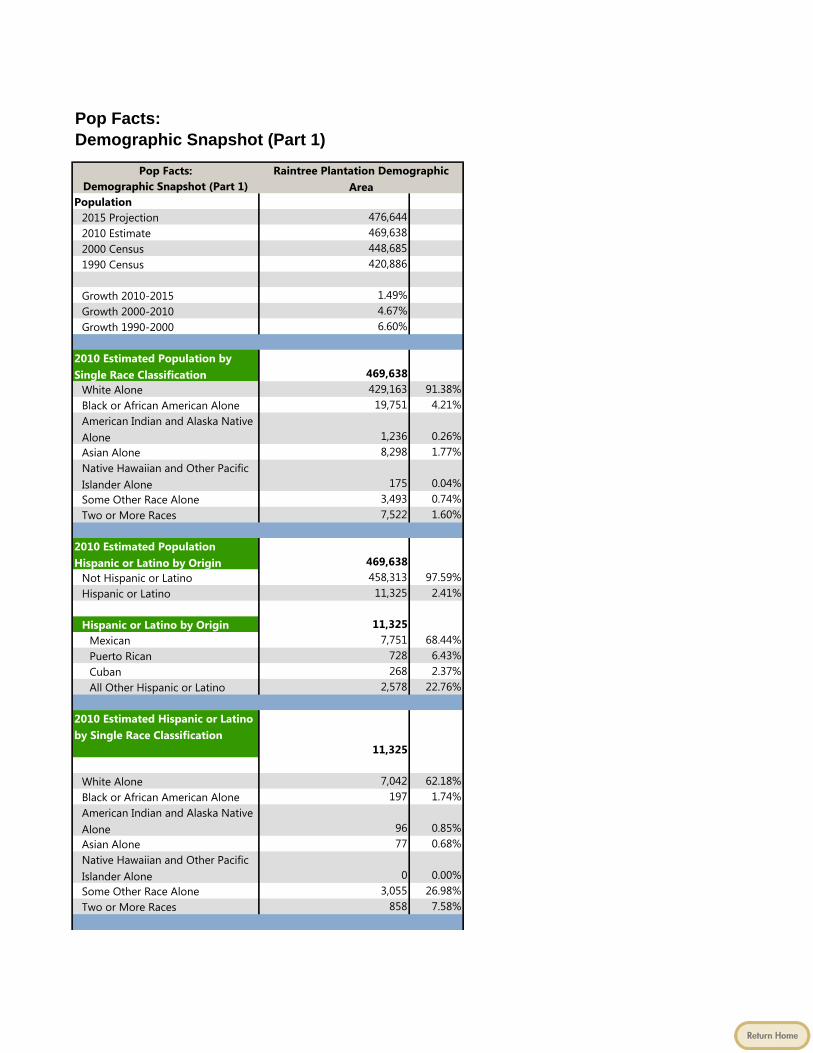
Pop Facts:Demographic Snapshot (Part 1)
Pop Facts:Demographic Snapshot (Part 1)
Population2015 Projection 476,6442010 Estimate 469,6382000 Census 448,6851990 Census 420,886
Growth 2010-2015 1.49%Growth 2000-2010 4.67%Growth 1990-2000 6.60%
2010 Estimated Population by Single Race Classification 469,638
White Alone 429,163 91.38%Black or African American Alone 19,751 4.21%American Indian and Alaska Native Alone 1,236 0.26%Asian Alone 8,298 1.77%Native Hawaiian and Other Pacific Islander Alone 175 0.04%Some Other Race Alone 3,493 0.74%Two or More Races 7,522 1.60%
2010 Estimated Population Hispanic or Latino by Origin 469,638
Not Hispanic or Latino 458,313 97.59%Hispanic or Latino 11,325 2.41%
Hispanic or Latino by Origin 11,325Mexican 7,751 68.44%Puerto Rican 728 6.43%Cuban 268 2.37%All Other Hispanic or Latino 2,578 22.76%
2010 Estimated Hispanic or Latino by Single Race Classification
11,325
White Alone 7,042 62.18%Black or African American Alone 197 1.74%American Indian and Alaska Native Alone 96 0.85%Asian Alone 77 0.68%Native Hawaiian and Other Pacific Islander Alone 0 0.00%Some Other Race Alone 3,055 26.98%Two or More Races 858 7.58%
Raintree Plantation Demographic Area

2010 Estimated Population, Asian Alone Race by Category 8,298
Chinese, except Taiwanese 1,097 13.22%Filipino 1,192 14.36%Japanese 236 2.84%Asian Indian 1,074 12.94%Korean 559 6.74%Vietnamese 3,131 37.73%Cambodian 29 0.35%Hmong 0 0.00%Laotian 334 4.03%Thai 182 2.19%All other Asian Races, including 2 or more 464 5.59%

2010 Estimated Population by Ancestry 469,638
Arab 2,387 0.51%Czech 4,361 0.93%Danish 663 0.14%Dutch 3,149 0.67%English 25,691 5.47%French (except Basque) 15,570 3.32%French Canadian 767 0.16%German 143,745 30.61%Greek 1,702 0.36%Hungarian 1,429 0.30%Irish 48,633 10.36%Italian 24,137 5.14%Lithuanian 483 0.10%Norwegian 1,514 0.32%Polish 10,632 2.26%Portuguese 195 0.04%Russian 1,147 0.24%Scottish 4,620 0.98%Scotch-Irish 4,272 0.91%Slovak 373 0.08%Subsaharan African 2,062 0.44%Swedish 1,736 0.37%Swiss 1,592 0.34%Ukrainian 559 0.12%United States of America 30,798 6.56%Welsh 1,306 0.28%West Indian (exc Hisp groups) 341 0.07%
Other 84,770 18.05%Ancestry Unclassified 51,004 10.86%

2010 Estimated Population Age 5+ by Language Spoken At Home
440,384Speak only English 409,372 92.96%Speak Asian or Pacific Island Language 5,563 1.26%Speak IndoEuropean Language 15,896 3.61%Speak Spanish 7,619 1.73%Speak Other Language 1,934 0.44%
2010 Estimated Population by Sex469,638
Male 228,631 48.68%Female 241,007 51.32%
2010 Estimated Population by Age469,638
Age 0 to 4 29,254 6.23%Age 5 to 9 28,714 6.11%Age 10 to 14 29,454 6.27%Age 15 to 17 19,255 4.10%Age 18 to 20 17,000 3.62%Age 21 to 24 22,668 4.83%Age 25 to 34 56,501 12.03%Age 35 to 44 63,930 13.61%Age 45 to 54 77,440 16.49%Age 55 to 64 60,076 12.79%Age 65 to 74 35,880 7.64%Age 75 to 84 20,452 4.35%Age 85 and over 9,014 1.92%
Age 16 and over 375,832 80.03%Age 18 and over 362,961 77.29%Age 21 and over 345,961 73.67%Age 65 and over 65,346 13.91%
2010 Estimated Median Age 402010 Estimated Average Age 39.34

2010 Estimated Male Population by Age 228,631
Age 0 to 4 14,907 6.52%Age 5 to 9 14,705 6.43%Age 10 to 14 15,110 6.61%Age 15 to 17 9,899 4.33%Age 18 to 20 8,743 3.82%Age 21 to 24 11,485 5.02%Age 25 to 34 27,884 12.20%Age 35 to 44 31,751 13.89%Age 45 to 54 38,424 16.81%Age 55 to 64 28,678 12.54%Age 65 to 74 16,291 7.13%Age 75 to 84 8,116 3.55%Age 85 and over 2,638 1.15%
2010 Estimated Median Age, Male38.65
2010 Estimated Average Age, Male38.01
2010 Estimated Female Population by Age 241,007
Age 0 to 4 14,347 5.95%Age 5 to 9 14,009 5.81%Age 10 to 14 14,344 5.95%Age 15 to 17 9,356 3.88%Age 18 to 20 8,257 3.43%Age 21 to 24 11,183 4.64%Age 25 to 34 28,617 11.87%Age 35 to 44 32,179 13.35%Age 45 to 54 39,016 16.19%Age 55 to 64 31,398 13.03%Age 65 to 74 19,589 8.13%Age 75 to 84 12,336 5.12%Age 85 and over 6,376 2.65%
2010 Estimated Median Age, Female 41.342010 Estimated Average Age, Female 40.61

2010 Estimated Population Age 15 and Over by Marital Status 382,216
Total, Never Married 112,524 29.44%Males, Never Married 59,261 15.50%Females, Never Married 53,263 13.94%
Married, Spouse present 191,627 50.14%Married, Spouse absent 10,140 2.65%Widowed 23,973 6.27%
Males, Widowed 4,828 1.26%Females, Widowed 19,145 5.01%
Divorced 43,952 11.50%Males, Divorced 18,631 4.87%Females, Divorced 25,321 6.62%
2010 Estimated Population Age 25 and Over by Educational Attainment 323,293
Less than 9th grade 14,013 4.33%Some High School, no diploma 27,625 8.54%High School Graduate (or GED) 97,882 30.28%Some College, no degree 77,673 24.03%Associate Degree 25,888 8.01%Bachelor's Degree 52,461 16.23%Master's Degree 20,728 6.41%Professional School Degree 4,750 1.47%Doctorate Degree 2,273 0.70%
2010 Est. Pop. Age 25+ by Educational Attainment, Hispanic or Latino 5,971
Less than 9th grade 917 15.36%Some High School, no diploma 1,001 16.76%High School Graduate (or GED) 1,489 24.94%Some College, no degree 903 15.12%Associate Degree 314 5.26%Bachelor's Degree 858 14.37%Graduate or Professional Degree 489 8.19%

Pop Facts:Demographic Snapshot (Part 2)
Pop Facts:Demographic Snapshot (Part 2)
Households2015 Projection 192,0152010 Estimate 188,7442000 Census 178,8801990 Census 164,136
Growth 2010-2015 1.73%Growth 2000-2010 5.51%Growth 1990-2000 8.98%
2010 Estimated Households by Household Type 188,744
Family Households 127,948 67.79%Non-family Households 60,796 32.21%
2010 Estimated Group Quarters Population 4,165
2010 Households by Ethnicity: Hispanic or Latino 3,394 1.80%
Raintree Plantation Demographic Area

2010 Estimated Households by Household Income 188,744
Less than $15,000 16,263 8.62%$15,000 to $24,999 17,118 9.07%$25,000 to $34,999 20,523 10.87%$35,000 to $49,999 30,432 16.12%$50,000 to $74,999 40,918 21.68%$75,000 to $99,999 27,272 14.45%$100,000 to $124,999 17,857 9.46%$125,000 to $149,999 8,369 4.43%$150,000 to $199,999 5,971 3.16%$200,000 to $499,999 3,490 1.85%$500,000 or more 531 0.28%
2010 Estimated Average Household Income $67,994 2010 Estimated Median Household Income $56,132 2010 Estimated Per Capita Income
$27,495
2010 Median Household Income by Single Race Classification or Ethnicity
White Alone $57,816 Black or African American Alone $29,540 American Indian and Alaska Native Alone $43,265 Asian Alone $47,674 Native Hawaiian and Other Pacific Islander Alone $35,625 Some Other Race Alone $38,495 Two or More Races $39,367
Hispanic or Latino $45,103 Not Hispanic or Latino $56,351

2010 Estimated Households by Type and Presence of Own Children 127,948
Married-Couple Family, own children 39,993 31.26%Married-Couple Family, no own children 58,142 45.44%Male Householder, own children 4,479 3.50%Male Householder, no own children 4,562 3.57%Female Householder, own children
11,727 9.17%Female Householder, no own children 9,045 7.07%
2010 Estimated Households by Household Size 188,744
1-person household 52,936 28.05%2-person household 60,868 32.25%3-person household 32,415 17.17%4-person household 26,484 14.03%5-person household 11,071 5.87%6-person household 3,545 1.88%7 or more person household 1,425 0.75%
2010 Estimated Average Household Size 2.47

2010 Estimated Households by Presence of People 188,744
Households with 1 or more People under Age 18 59,140 31.33%
Married-Couple Family 40,553 21.49%Other Family, Male Householder 4,865 2.58%Other Family, Female Householder
13,085 6.93%Nonfamily, Male Householder 523 0.28%Nonfamily, Female Householder 114 0.06%
Households no People under Age 18 129,604 68.67%
Married-Couple Family 54,348 28.79%Other Family, Male Householder 3,862 2.05%Other Family, Female Householder
6,831 3.62%Nonfamily, Male Householder 28,128 14.90%Nonfamily, Female Householder 36,435 19.30%
2010 Estimated Households by Number of Vehicles 188,744
No Vehicles 11,252 5.96%1 Vehicle 62,336 33.03%2 Vehicles 76,729 40.65%3 Vehicles 27,424 14.53%4 Vehicles 7,968 4.22%5 or more Vehicles 3,035 1.61%
2010 Estimated Average Number of Vehicles 1.84
Family Households2015 Projection 130,5762010 Estimate 127,9482000 Census 120,2181990 Census 115,113
Growth 2010-2015 2.05%Growth 2000-2010 6.43%Growth 1990-2000 4.43%
2010 Estimated Families by Poverty Status 127,948
Income At or Above Poverty Level
Current Year Families at or Above Poverty 120,930 94.51%Current Year Families at or Above Poverty with Children 54,195 42.36%
Income Below Poverty Level

Current Year Families Below Poverty 7,018 5.49%Current Year Families Below Poverty with Children 5,703 4.46%
2010 Estimated Population Age 16 and Over by Employment 375,832
In Armed Forces 260 0.07%Civilian - Employed 248,033 66.00%Civilian - Unemployed 12,176 3.24%Not in Labor Force 115,363 30.70%
2010 Estimated Employed Population Age 16 and Over by Class of Worker 246,512
For-Profit Private Workers 186,904 75.82%Non-Profit Private Workers 25,697 10.42%Local Government Workers 13,152 5.34%State Government Workers 4,849 1.97%Federal Government Workers 5,270 2.14%Self-Employed Workers 10,387 4.21%Unpaid Family Workers 253 0.10%

2010 Estimated Employed Population Age 16 and Over by Occupation 246,512
Management , Including Farmers and Farm Managers 19,939 8.09%Business and Financial Operations
12,052 4.89%Computer and Mathematical 6,845 2.78%Architecture and Engineering 4,501 1.83%Life, Physical, and Social Science 2,373 0.96%Community and Social Services 3,349 1.36%Legal 2,322 0.94%Education, Training, and Library 11,977 4.86%Arts, Design, Entertainment, Sports, and Media 4,021 1.63%Healthcare Practitioners and Technical 14,083 5.71%Healthcare Support 5,529 2.24%Protective Service 4,983 2.02%Food Preparation and Serving Related 14,190 5.76%Building and Grounds Cleaning, and Maintenance 9,141 3.71%Service : Personal Care and Service
7,233 2.93%Sales and Related Occupations 30,116 12.22%Office and Administrative Support
38,788 15.73%Farming, Fishing, and Forestry 187 0.08%Construction and Extraction 15,663 6.35%Installation, Maintenance, and Repair 9,603 3.90%Production 16,336 6.63%Transportation and Material Moving 13,281 5.39%

2010 Estimated Employed Population Age 16 and Over by Occupation Classification 246,512
Blue Collar 54,883 22.26%White Collar 150,366 61.00%Service & Farm 41,263 16.74%
2010 Estimated Workers Age 16 and Over by Transportation To Work 242,800
Drove Alone 203,352 83.75%Car Pooled 23,023 9.48%Public Transportation 4,525 1.86%Walked 2,482 1.02%Bicycle 252 0.10%Other Means 2,067 0.85%Worked at Home 7,099 2.92%
2010 Estimated Workers Age 16 and Over by Travel Time to Work
237,442Less than 15 minutes 44,878 18.90%15 to 29 Minutes 94,003 39.59%30 to 44 Minutes 63,765 26.85%45 to 59 Minutes 22,683 9.55%60 or more Minutes 12,113 5.10%
2010 Estimated Average Travel Time to Work in Minutes 29.01
2010 Estimated Tenure of Occupied Housing Units 188,744
Owner-Occupied 145,001 76.82%Renter-Occupied 43,743 23.18%
2010 Occupied Housing Units, Average Length of Residence
Owner-Occupied 17Renter-Occupied 7
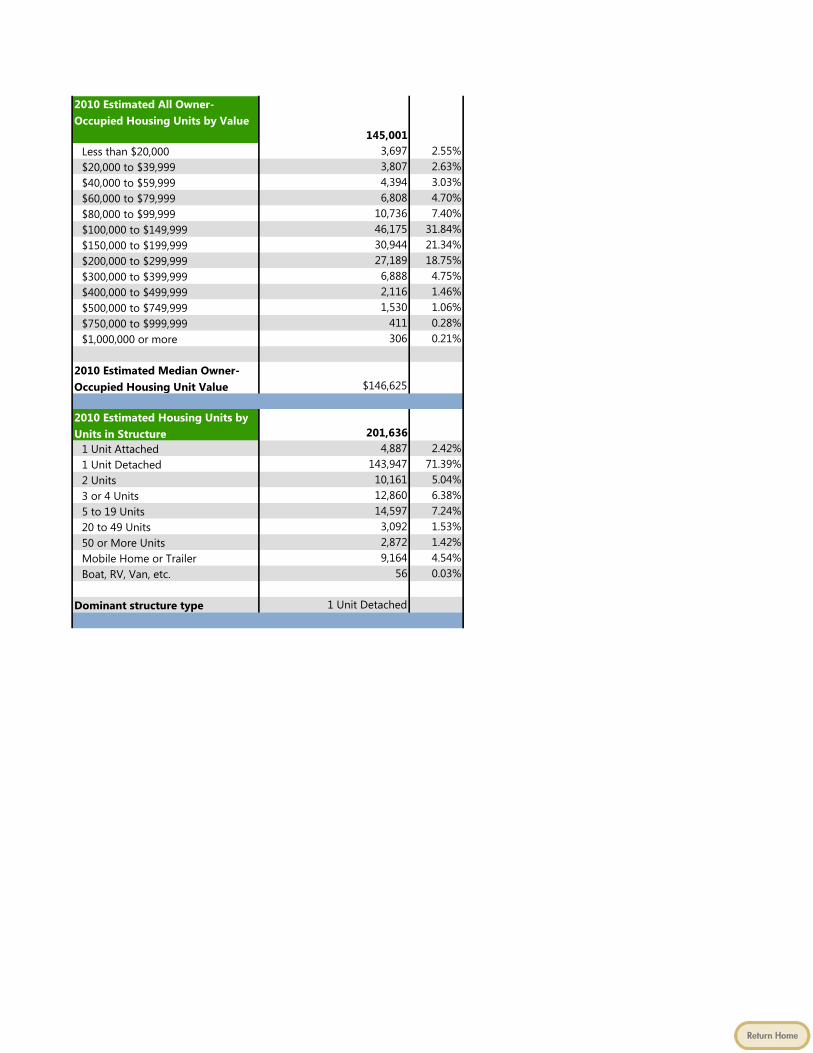
2010 Estimated All Owner-Occupied Housing Units by Value
145,001Less than $20,000 3,697 2.55%$20,000 to $39,999 3,807 2.63%$40,000 to $59,999 4,394 3.03%$60,000 to $79,999 6,808 4.70%$80,000 to $99,999 10,736 7.40%$100,000 to $149,999 46,175 31.84%$150,000 to $199,999 30,944 21.34%$200,000 to $299,999 27,189 18.75%$300,000 to $399,999 6,888 4.75%$400,000 to $499,999 2,116 1.46%$500,000 to $749,999 1,530 1.06%$750,000 to $999,999 411 0.28%$1,000,000 or more 306 0.21%
2010 Estimated Median Owner-Occupied Housing Unit Value $146,625
2010 Estimated Housing Units by Units in Structure 201,636
1 Unit Attached 4,887 2.42%1 Unit Detached 143,947 71.39%2 Units 10,161 5.04%3 or 4 Units 12,860 6.38%5 to 19 Units 14,597 7.24%20 to 49 Units 3,092 1.53%50 or More Units 2,872 1.42%Mobile Home or Trailer 9,164 4.54%Boat, RV, Van, etc. 56 0.03%
Dominant structure type 1 Unit Detached
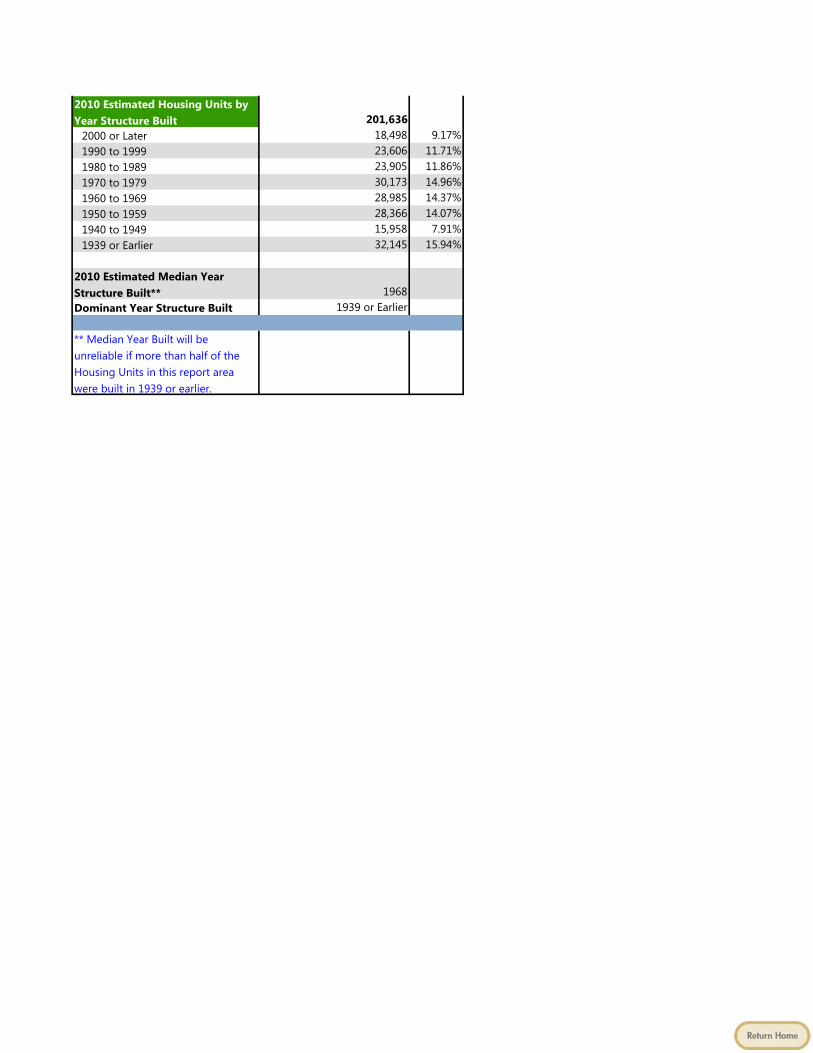
2010 Estimated Housing Units by Year Structure Built 201,636
2000 or Later 18,498 9.17%1990 to 1999 23,606 11.71%1980 to 1989 23,905 11.86%1970 to 1979 30,173 14.96%1960 to 1969 28,985 14.37%1950 to 1959 28,366 14.07%1940 to 1949 15,958 7.91%1939 or Earlier 32,145 15.94%
2010 Estimated Median Year Structure Built** 1968Dominant Year Structure Built 1939 or Earlier
** Median Year Built will be unreliable if more than half of the Housing Units in this report area were built in 1939 or earlier.

Pop Facts:Household Trend
Pop Facts:Household Trend
2000 2010 2015Census Estimate Projection
Population 448,685 469,638 476,644Percent Change 4.67% 1.49%
Households 178,880 188,744 192,015Percent Change 5.51% 1.73%
Families 120,218 127,948 130,576Percent Change 6.43% 2.05%
Housing Units 189,058 201,636 205,068Percent Change 6.65% 1.70%
Group Quarters Population 4,172 4,165 4,166Percent Change -0.17% 0.02%
Average Household Size 2.48 2.47 2.46Percent Change -0.76% -0.22%
Income TotalsAggregate($MM) Household Income 9,825 12,833 14,147
Percent Change 30.62% 10.23%Per Capita Income $21,971 $27,495 $29,845
Percent Change 25.14% 8.55%
Households by Household Income* 178,877 188,744 192,015
Less than $15,000 20,730 11.59% 16,263 8.62% 15,182 7.91%$15,000 to $24,999 22,036 12.32% 17,118 9.07% 15,805 8.23%$25,000 to $34,999 24,260 13.56% 20,523 10.87% 19,088 9.94%$35,000 to $49,999 31,954 17.86% 30,432 16.12% 29,435 15.33%$50,000 to $74,999 39,491 22.08% 40,918 21.68% 40,377 21.03%$75,000 to $99,999 21,708 12.14% 27,272 14.45% 28,253 14.71%$100,000 to $124,999 17,857 9.46% 19,564 10.19%$100,000 to $149,999 13,908 7.78%$125,000 to $149,999 8,369 4.43% 11,098 5.78%$150,000 to $199,999 5,971 3.16% 7,678 4.00%$150,000 to $249,999 3,820 2.14%$200,000 to $499,999 3,490 1.85% 4,763 2.48%$250,000 to $499,999 781 0.44%$500,000 or more 189 0.11% 531 0.28% 772 0.40%
Average Household Income $54,924 $67,994 $73,675 Median Household Income $45,521 $56,132 $60,215
Raintree Plantation Demographic Area
% % %
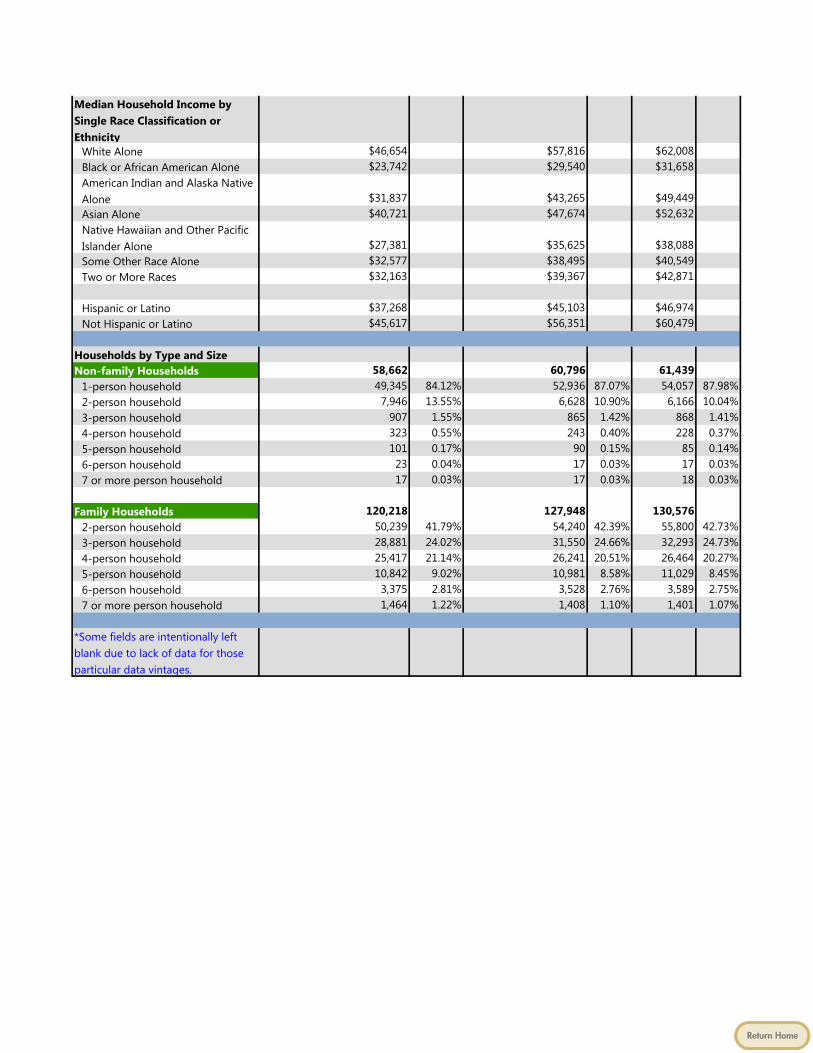
Median Household Income by Single Race Classification or Ethnicity
White Alone $46,654 $57,816 $62,008 Black or African American Alone $23,742 $29,540 $31,658 American Indian and Alaska Native Alone $31,837 $43,265 $49,449 Asian Alone $40,721 $47,674 $52,632 Native Hawaiian and Other Pacific Islander Alone $27,381 $35,625 $38,088 Some Other Race Alone $32,577 $38,495 $40,549 Two or More Races $32,163 $39,367 $42,871
Hispanic or Latino $37,268 $45,103 $46,974 Not Hispanic or Latino $45,617 $56,351 $60,479
Households by Type and SizeNon-family Households 58,662 60,796 61,439
1-person household 49,345 84.12% 52,936 87.07% 54,057 87.98%2-person household 7,946 13.55% 6,628 10.90% 6,166 10.04%3-person household 907 1.55% 865 1.42% 868 1.41%4-person household 323 0.55% 243 0.40% 228 0.37%5-person household 101 0.17% 90 0.15% 85 0.14%6-person household 23 0.04% 17 0.03% 17 0.03%7 or more person household 17 0.03% 17 0.03% 18 0.03%
Family Households 120,218 127,948 130,5762-person household 50,239 41.79% 54,240 42.39% 55,800 42.73%3-person household 28,881 24.02% 31,550 24.66% 32,293 24.73%4-person household 25,417 21.14% 26,241 20.51% 26,464 20.27%5-person household 10,842 9.02% 10,981 8.58% 11,029 8.45%6-person household 3,375 2.81% 3,528 2.76% 3,589 2.75%7 or more person household 1,464 1.22% 1,408 1.10% 1,401 1.07%
*Some fields are intentionally left blank due to lack of data for those particular data vintages.

PRIZMHousehold Segments
PRIZMHousehold Segments
2010 2015Households Households
Households by PRIZM Segment 188,744 192,015
54 Multi-Culti Mosaic 6.17% 54 Multi-Culti Mosaic 6.03%39 Domestic Duos 4.95% 39 Domestic Duos 4.83%
30 Suburban Sprawl 3.67% 15 Pools & Patios 3.62%15 Pools & Patios 3.66% 30 Suburban Sprawl 3.58%
14 New Empty Nests 3.61% 14 New Empty Nests 3.55%40 Close-In Couples 3.58% 40 Close-In Couples 3.54%
29 American Dreams 3.37% 29 American Dreams 3.36%19 Home Sweet Home 3.01% 19 Home Sweet Home 3.02%32 New Homesteaders 2.73% 32 New Homesteaders 2.83%18 Kids & Cul-de-Sacs 2.65% 20 Fast-Track Families 2.72%
01 Upper Crust 3,288 1.74% 3,309 1.72%02 Blue Blood Estates 2,364 1.25% 2,468 1.29%03 Movers & Shakers 3,366 1.78% 3,468 1.81%04 Young Digerati 713 0.38% 733 0.38%05 Country Squires 1,322 0.70% 1,386 0.72%06 Winner's Circle 3,161 1.67% 3,311 1.72%07 Money & Brains 1,936 1.03% 1,973 1.03%08 Executive Suites 598 0.32% 614 0.32%09 Big Fish, Small Pond 1,826 0.97% 1,930 1.01%10 Second City Elite 2,463 1.30% 2,474 1.29%
11 God's Country 516 0.27% 540 0.28%12 Brite Lites, Li'l City 1,797 0.95% 1,854 0.97%13 Upward Bound 3,132 1.66% 3,247 1.69%14 New Empty Nests 6,816 3.61% 6,822 3.55%15 Pools & Patios 6,908 3.66% 6,955 3.62%16 Bohemian Mix 1,175 0.62% 1,185 0.62%17 Beltway Boomers 3,640 1.93% 3,722 1.94%18 Kids & Cul-de-Sacs 5,000 2.65% 5,213 2.71%19 Home Sweet Home 5,675 3.01% 5,806 3.02%20 Fast-Track Families 4,889 2.59% 5,230 2.72%
21 Gray Power 4,691 2.49% 4,670 2.43%22 Young Influentials 3,145 1.67% 3,195 1.66%23 Greenbelt Sports 456 0.24% 479 0.25%24 Up-and-Comers 1,605 0.85% 1,652 0.86%25 Country Casuals 2,229 1.18% 2,369 1.23%26 The Cosmopolitans 3,165 1.68% 3,206 1.67%27 Middleburg Managers 4,189 2.22% 4,215 2.20%28 Traditional Times 2,236 1.18% 2,346 1.22%29 American Dreams 6,370 3.37% 6,454 3.36%30 Suburban Sprawl 6,922 3.67% 6,880 3.58%
Raintree Plantation Demographic Area
% %
Top 10 PRIZM Segments

31 Urban Achievers 1,918 1.02% 1,956 1.02%32 New Homesteaders 5,154 2.73% 5,434 2.83%33 Big Sky Families 1,741 0.92% 1,820 0.95%34 White Picket Fences 1,872 0.99% 1,930 1.01%35 Boomtown Singles 1,799 0.95% 1,804 0.94%36 Blue-Chip Blues 2,996 1.59% 3,065 1.60%37 Mayberry-ville 4,099 2.17% 4,324 2.25%38 Simple Pleasures 1,447 0.77% 1,514 0.79%39 Domestic Duos 9,344 4.95% 9,270 4.83%40 Close-In Couples 6,765 3.58% 6,799 3.54%
41 Sunset City Blues 2,399 1.27% 2,366 1.23%42 Red, White & Blues 2,135 1.13% 2,231 1.16%43 Heartlanders 1,754 0.93% 1,841 0.96%44 New Beginnings 3,908 2.07% 3,914 2.04%45 Blue Highways 1,005 0.53% 1,050 0.55%46 Old Glories 2,564 1.36% 2,536 1.32%47 City Startups 652 0.35% 653 0.34%48 Young & Rustic 944 0.50% 987 0.51%49 American Classics 4,581 2.43% 4,516 2.35%50 Kid Country, USA 2,928 1.55% 3,076 1.60%
51 Shotguns & Pickups 1,213 0.64% 1,262 0.66%52 Suburban Pioneers 2,558 1.36% 2,535 1.32%53 Mobility Blues 1,462 0.77% 1,440 0.75%54 Multi-Culti Mosaic 11,640 6.17% 11,574 6.03%55 Golden Ponds 368 0.19% 383 0.20%56 Crossroads Villagers 1,222 0.65% 1,297 0.68%57 Old Milltowns 776 0.41% 825 0.43%58 Back Country Folks 335 0.18% 349 0.18%59 Urban Elders 1,500 0.79% 1,504 0.78%60 Park Bench Seniors 547 0.29% 545 0.28%
61 City Roots 3,732 1.98% 3,708 1.93%62 Hometown Retired 899 0.48% 877 0.46%63 Family Thrifts 695 0.37% 692 0.36%64 Bedrock America 831 0.44% 889 0.46%65 Big City Blues 2,198 1.16% 2,212 1.15%66 Low-Rise Living 3,170 1.68% 3,131 1.63%
67 Unclassified 0 0.00% 0 0.00%

PRIZM Household SegmentsSegment Snapshots
PRIZM Household SegmentsSegment Snapshots
2010 2015Households Households
Households by PRIZM Segment 188,744 192,015
01 Upper Crust 3,288 1.74% 3,309 1.72%The nation's most exclusive address, Upper Crust is the wealthiest lifestyle in America-a haven for empty-nesting couples over 55 years old. No segment has a higher concentration of residents earning over $200,000 a year or possessing a postgraduate degree. And none has a more opulent standard of living.
02 Blue Blood Estates 2,364 1.25% 2,468 1.29%Blue Blood Estates is a family portrait of suburban wealth, a place of million-dollar homes and manicured lawns, high-end cars and exclusive private clubs. The nation's second-wealthiest lifestyle, it is characterized by married couples with children, college degrees, a significant percentage of Asian Americans and six-figure incomes earned by business executives, managers and professionals.
03 Movers & Shakers 3,366 1.78% 3,468 1.81%Movers & Shakers is home to America's up-and-coming business class: a wealthy suburban world of dual-income couples who are highly educated, typically between the ages of 35 and 54 and often with children. Given its high percentage of executives and white-collar professionals, there's a decided business bent to this segment: Movers & Shakers rank number-one for owning a small business and having a home office.
% %
Raintree Plantation Demographic Area

04 Young Digerati 713 0.38% 733 0.38%Young Digerati are the nation's tech-savvy singles and couples living in fashionable neighborhoods on the urban fringe. Affluent, highly educated and ethnically mixed, Young Digerati communities are typically filled with trendy apartments and condos, fitness clubs and clothing boutiques, casual restaurants and all types of bars-from juice to coffee to microbrew.
05 Country Squires 1,322 0.70% 1,386 0.72%The wealthiest residents in exurban America live in Country Squires, an oasis for affluent Baby Boomers who've fled the city for the charms of small-town living. In their bucolic communities noted for their recently built homes on sprawling properties, the families of executives live in six-figure comfort. Country Squires enjoy country club sports like golf, tennis and swimming as well as skiing, boating and biking.
06 Winner's Circle 3,161 1.67% 3,311 1.72%Among the wealthy suburban lifestyles, Winner's Circle is the youngest, a collection of mostly 25- to 34-year-old couples with large families in new-money subdivisions. Surrounding their homes are the signs of upscale living: recreational parks, golf courses and upscale malls. With a median income of nearly $90,000, Winner's Circle residents are big spenders who like to travel, ski, go out to eat, shop at clothing boutiques and take in a h

07 Money & Brains 1,936 1.03% 1,973 1.03%The residents of Money & Brains seem to have it all: high incomes, advanced degrees and sophisticated tastes to match their credentials. Many of these citydwellers, predominantly white with a high concentration of Asian Americans, are married couples with few children who live in fashionable homes on small, manicured lots.
08 Executive Suites 598 0.32% 614 0.32%Executive Suites consists of upper-middle-class singles and couples typically living just beyond the nation's beltways. Filled with significant numbers of Asian Americans and college graduates-both groups are represented at more than twice the national average-this segment is a haven for white-collar professionals drawn to comfortable homes and apartments within a manageable commute to downtown jobs, restaurants and
t t i t
09 Big Fish, Small Pond 1,826 0.97% 1,930 1.01%Older, upper-class, college-educated professionals, the members of Big Fish, Small Pond are often among the leading citizens of their small-town communities. These upscale, empty-nesting couples enjoy the trappings of success, belonging to country clubs, maintaining large investment portfolios and spending freely on computer technology.
10 Second City Elite 2,463 1.30% 2,474 1.29%

There's money to be found in the nation's smaller cities, and you're most likely to find it in Second City Elite. The residents of these satellite cities tend to be prosperous executives who decorate their $200,000 homes with multiple computers, large-screen TV sets and an impressive collection of wines. With more than half holding college degrees, Second City Elite residents enjoy cultural activities-from reading books to attending theater to dance productions.
11 God's Country 516 0.27% 540 0.28%When city dwellers and suburbanites began moving to the country in the 1970s, God's Country emerged as the most affluent of the nation's exurban lifestyles. Today, wealthier communities exist in the hinterlands, but God's Country remains a haven for upper-income couples in spacious homes. Typically college-educated Baby Boomers, these Americans try to maintain a balanced lifestyle between high-power jobs and laid-back leisure.
12 Brite Lites, Li'l City 1,797 0.95% 1,854 0.97%Not all of the America's chic sophisticates live in major metros. Brite Lights, Li'l City is a group of well-off, middle-aged couples settled in the nation's satellite cities. Residents of these typical DINK (double income, no kids) households have college educations, well-paying business and professional careers and swank homes filled with the latest technology.
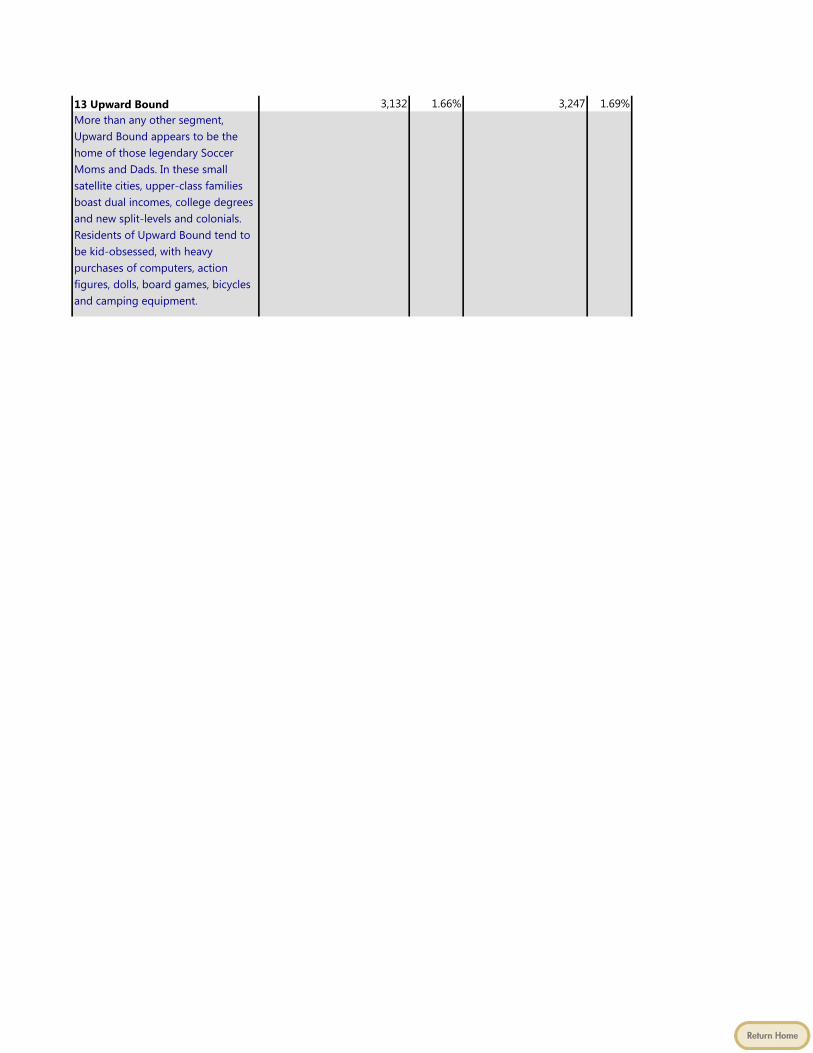
13 Upward Bound 3,132 1.66% 3,247 1.69%More than any other segment, Upward Bound appears to be the home of those legendary Soccer Moms and Dads. In these small satellite cities, upper-class families boast dual incomes, college degrees and new split-levels and colonials. Residents of Upward Bound tend to be kid-obsessed, with heavy purchases of computers, action figures, dolls, board games, bicycles and camping equipment.

14 New Empty Nests 6,816 3.61% 6,822 3.55%With their grown-up children recently out of the house, New Empty Nests is composed of upscale older Americans who pursue active-and activist-lifestyles. Nearly three-quarters of residents are over 65 years old, but they show no interest in a rest-home retirement. This is the top-ranked segment for all-inclusive travel packages; the favorite destination is Italy.
15 Pools & Patios 6,908 3.66% 6,955 3.62%Formed during the postwar Baby Boom, Pools & Patios has evolved from a segment of young suburban families to one for mature, empty-nesting couples. In these stable neighborhoods graced with backyard pools and patios-the highest proportion of homes were built in the 1960s-residents work as white-collar managers and professionals, and are now at the top of their careers
16 Bohemian Mix 1,175 0.62% 1,185 0.62%A collection of young, mobile urbanites, Bohemian Mix represents the nation's most liberal lifestyles. Its residents are a progressive mix of young singles and couples, students and professionals, Hispanics, Asians, African-Americans and whites. In their funky rowhouses and apartments, Bohemian Mixers are the early adopters who are quick to check out the latest movie, nightclub, laptop and microbrew.

17 Beltway Boomers 3,640 1.93% 3,722 1.94%The members of the postwar Baby Boom are all grown up. Today, these Americans are in their forties and fifties, and one segment of this huge cohort-college-educated, upper-middle-class and home-owning-is found in Beltway Boomers. Like many of their peers who married late, these Boomers are still raising children in comfortable suburban subdivisions, and they're pursuing kid-centered lifestyles.
18 Kids & Cul-de-Sacs 5,000 2.65% 5,213 2.71%Upscale, suburban, married couples with children-that's the skinny on Kids & Cul-de-Sacs, an enviable lifestyle of large families in recently built subdivisions. With a high rate of Hispanic and Asian Americans, this segment is a refuge for college-educated, white-collar professionals with administrative jobs and upper-middle-class incomes. Their nexus of education, affluence and children translates into large outlays for child-centered products and services.
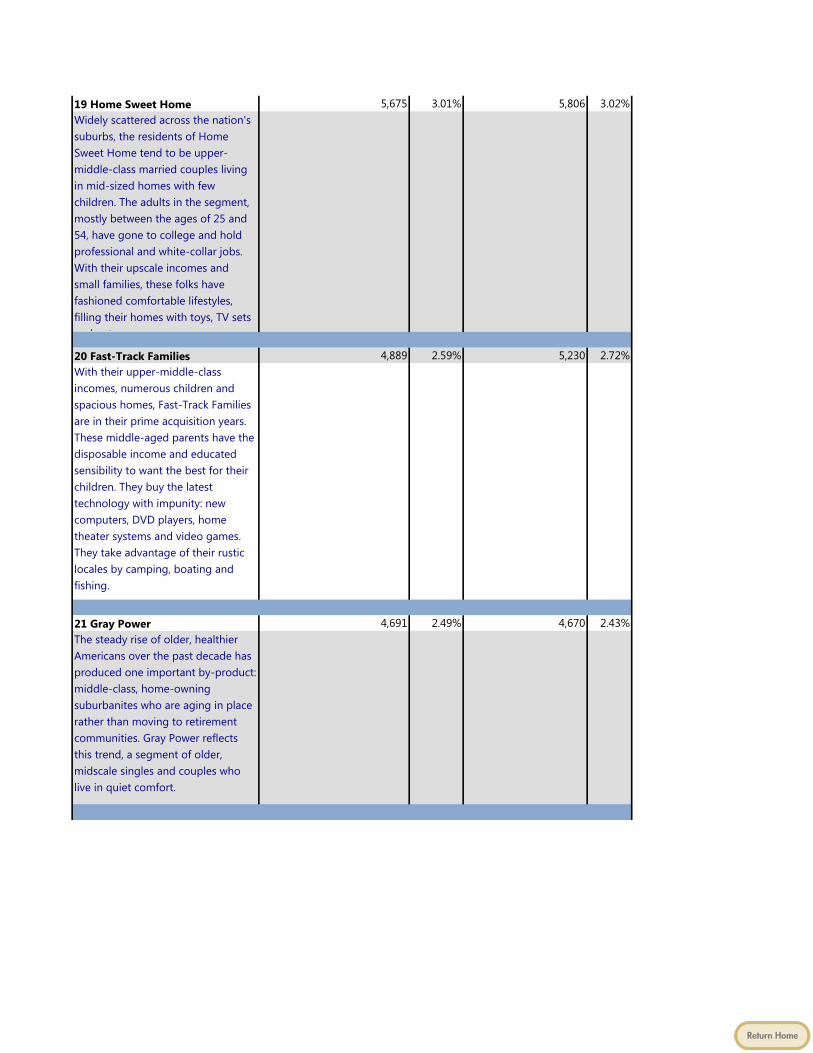
19 Home Sweet Home 5,675 3.01% 5,806 3.02%Widely scattered across the nation's suburbs, the residents of Home Sweet Home tend to be upper-middle-class married couples living in mid-sized homes with few children. The adults in the segment, mostly between the ages of 25 and 54, have gone to college and hold professional and white-collar jobs. With their upscale incomes and small families, these folks have fashioned comfortable lifestyles, filling their homes with toys, TV sets
d t
20 Fast-Track Families 4,889 2.59% 5,230 2.72%With their upper-middle-class incomes, numerous children and spacious homes, Fast-Track Families are in their prime acquisition years. These middle-aged parents have the disposable income and educated sensibility to want the best for their children. They buy the latest technology with impunity: new computers, DVD players, home theater systems and video games. They take advantage of their rustic locales by camping, boating and fishing.
21 Gray Power 4,691 2.49% 4,670 2.43%The steady rise of older, healthier Americans over the past decade has produced one important by-product: middle-class, home-owning suburbanites who are aging in place rather than moving to retirement communities. Gray Power reflects this trend, a segment of older, midscale singles and couples who live in quiet comfort.
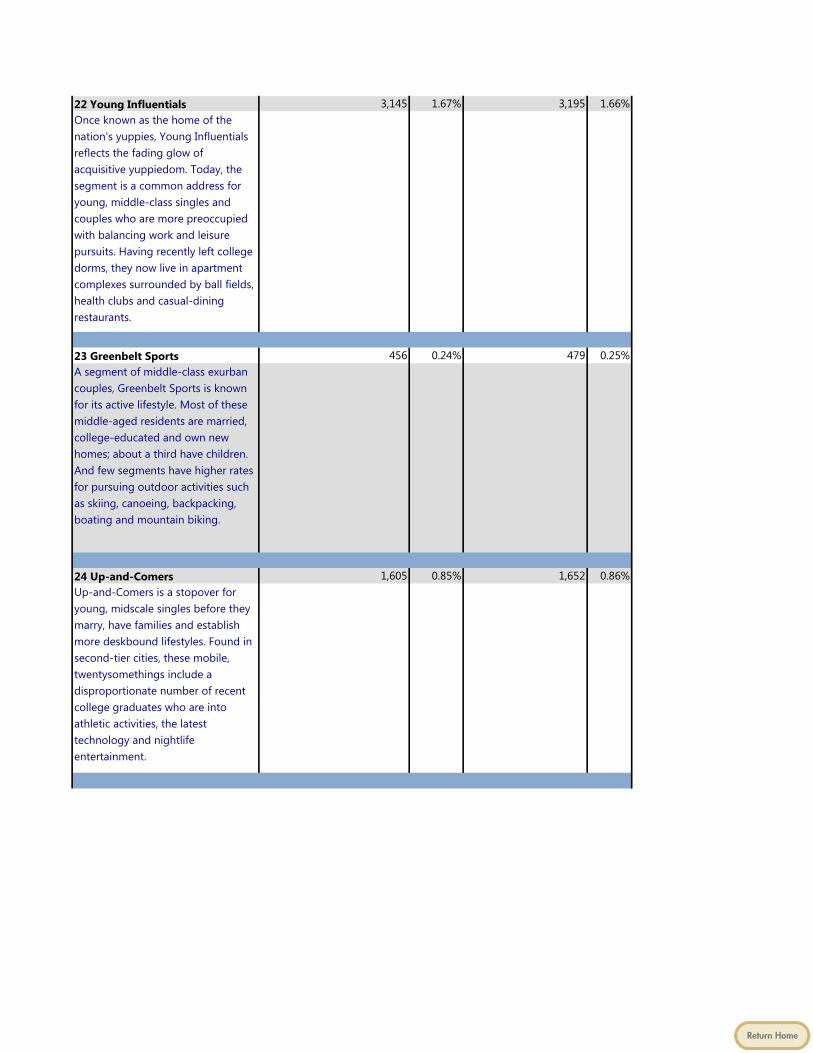
22 Young Influentials 3,145 1.67% 3,195 1.66%Once known as the home of the nation's yuppies, Young Influentials reflects the fading glow of acquisitive yuppiedom. Today, the segment is a common address for young, middle-class singles and couples who are more preoccupied with balancing work and leisure pursuits. Having recently left college dorms, they now live in apartment complexes surrounded by ball fields, health clubs and casual-dining restaurants.
23 Greenbelt Sports 456 0.24% 479 0.25%A segment of middle-class exurban couples, Greenbelt Sports is known for its active lifestyle. Most of these middle-aged residents are married, college-educated and own new homes; about a third have children. And few segments have higher rates for pursuing outdoor activities such as skiing, canoeing, backpacking, boating and mountain biking.
24 Up-and-Comers 1,605 0.85% 1,652 0.86%Up-and-Comers is a stopover for young, midscale singles before they marry, have families and establish more deskbound lifestyles. Found in second-tier cities, these mobile, twentysomethings include a disproportionate number of recent college graduates who are into athletic activities, the latest technology and nightlife entertainment.

25 Country Casuals 2,229 1.18% 2,369 1.23%There's a laid-back atmosphere in Country Casuals, a collection of middle-aged, upper-middle-class households that have started to empty-nest. Workers here-and most households boast two earners-have well-paying blue- or white collar jobs, or own small businesses. Today these Baby-Boom couples have the disposable income to enjoy traveling, owning timeshares and going out to eat
26 The Cosmopolitans 3,165 1.68% 3,206 1.67%Educated, midscale and multi-ethnic, The Cosmopolitans are urbane couples in America's fast-growing cities. Concentrated in a handful of metros-such as Las Vegas, Miami and Albuquerque-these households feature older home-owners, empty-nesters and college graduates. A vibrant social scene surrounds their older homes and apartments, and residents love the nightlife and enjoy leisure-intensive lifestyles.
27 Middleburg Managers 4,189 2.22% 4,215 2.20%Middleburg Managers arose when empty-nesters settled in satellite communities which offered a lower cost of living and more relaxed pace. Today, segment residents tend to be middle-class and over 55 years old, with solid managerial jobs and comfortable retirements. In their older homes, they enjoy reading, playing musical instruments, indoor gardening and refinishing furniture.
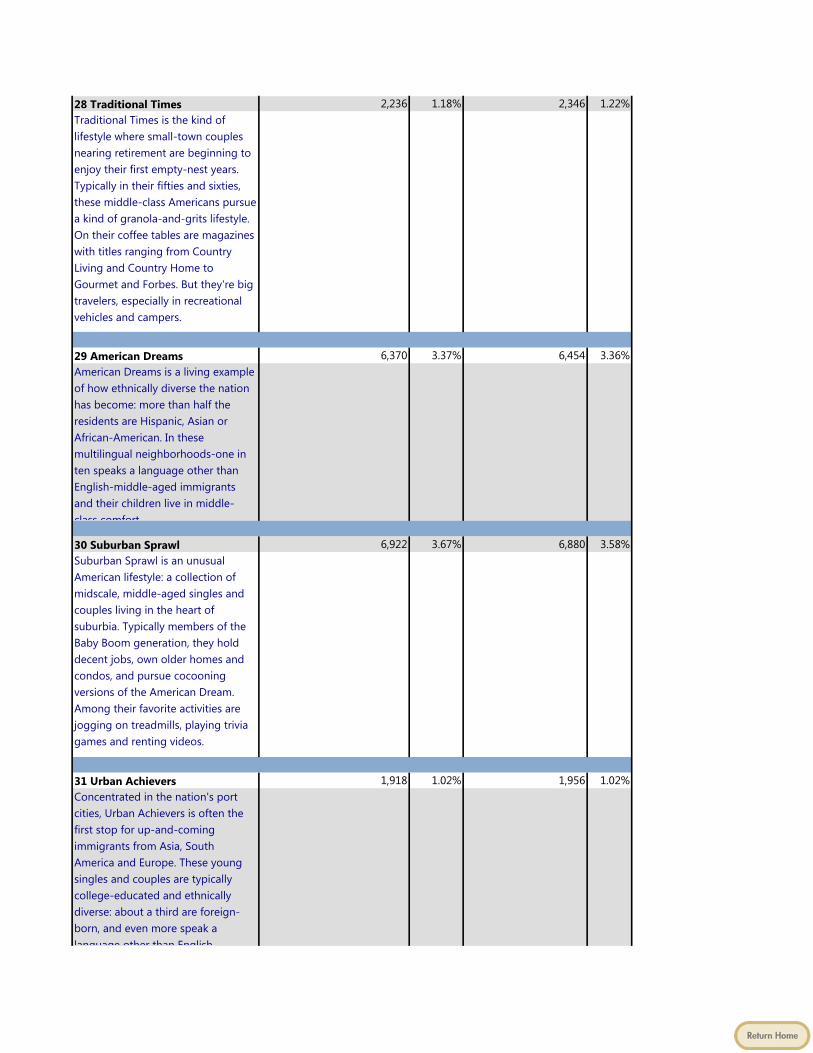
28 Traditional Times 2,236 1.18% 2,346 1.22%Traditional Times is the kind of lifestyle where small-town couples nearing retirement are beginning to enjoy their first empty-nest years. Typically in their fifties and sixties, these middle-class Americans pursue a kind of granola-and-grits lifestyle. On their coffee tables are magazines with titles ranging from Country Living and Country Home to Gourmet and Forbes. But they're big travelers, especially in recreational vehicles and campers.
29 American Dreams 6,370 3.37% 6,454 3.36%American Dreams is a living example of how ethnically diverse the nation has become: more than half the residents are Hispanic, Asian or African-American. In these multilingual neighborhoods-one in ten speaks a language other than English-middle-aged immigrants and their children live in middle-class comfort
30 Suburban Sprawl 6,922 3.67% 6,880 3.58%Suburban Sprawl is an unusual American lifestyle: a collection of midscale, middle-aged singles and couples living in the heart of suburbia. Typically members of the Baby Boom generation, they hold decent jobs, own older homes and condos, and pursue cocooning versions of the American Dream. Among their favorite activities are jogging on treadmills, playing trivia games and renting videos.
31 Urban Achievers 1,918 1.02% 1,956 1.02%Concentrated in the nation's port cities, Urban Achievers is often the first stop for up-and-coming immigrants from Asia, South America and Europe. These young singles and couples are typically college-educated and ethnically diverse: about a third are foreign-born, and even more speak a language other than English

32 New Homesteaders 5,154 2.73% 5,434 2.83%Young, middle-class families seeking to escape suburban sprawl find refuge in New Homesteaders, a collection of small rustic townships filled with new ranches and Cape Cods. With decent-paying jobs in white-collar and service industries, these dual-income couples have fashioned comfortable, child-centered lifestyles, their driveways filled with campers and powerboats, their family rooms with PlayStations and Game Boys.
33 Big Sky Families 1,741 0.92% 1,820 0.95%Scattered in placid towns across the American heartland, Big Sky Families is a segment of young rural families who have turned high school educations and blue-collar jobs into busy, middle-class lifestyles. Residents like to play baseball, basketball and volleyball, besides going fishing, hunting and horseback riding. To entertain their sprawling families, they buy virtually every piece of sporting equipment on the market
34 White Picket Fences 1,872 0.99% 1,930 1.01%Midpoint on the socioeconomic ladder, residents in White Picket Fences look a lot like the stereotypical American household of a generation ago: young, middle-class, married with children. But the current version is characterized by modest homes and ethnic diversity-including a disproportionate number of Hispanics and African-Americans.

35 Boomtown Singles 1,799 0.95% 1,804 0.94%Affordable housing, abundant entry-level jobs and a thriving singles scene-all have given rise to the Boomtown Singles segment in fast-growing satellite cities. Young, single and working-class, these residents pursue active lifestyles amid sprawling apartment complexes, bars, convenience stores and laundromats
36 Blue-Chip Blues 2,996 1.59% 3,065 1.60%Blue-Chip Blues is known as a comfortable lifestyle for young, sprawling families with well-paying blue-collar jobs. Ethnically diverse-with a significant presence of Hispanics and African-Americans-the segment's aging neighborhoods feature compact, modestly priced homes surrounded by commercial centers that cater to child-filled households.
37 Mayberry-ville 4,099 2.17% 4,324 2.25%Like the old Andy Griffith show set in a quaint picturesque berg, Mayberry-ville harks back to an old-fashioned way of life. In these small towns, middle-class couples and families like to fish and hunt during the day, and stay home and watch TV at night. With lucrative blue-collar jobs and moderately priced housing, residents use their discretionary cash to purchase boats, campers, motorcycles and pickup trucks.

38 Simple Pleasures 1,447 0.77% 1,514 0.79%With more than two-thirds of its residents over 65 years old, Simple Pleasures is mostly a retirement lifestyle: a neighborhood of lower-middle-class singles and couples living in modestly priced homes. Many are high school-educated seniors who held blue-collar jobs before their retirement. And a disproportionate number served in the military; no segment has more members of veterans clubs.
39 Domestic Duos 9,344 4.95% 9,270 4.83%Domestic Duos represents a middle-class mix of mainly over 55 singles and married couples living in older suburban homes. With their high-school educations and fixed incomes, segment residents maintain an easy-going lifestyle. Residents like to socialize by going bowling, seeing a play, meeting at the local fraternal order or going out to eat

40 Close-In Couples 6,765 3.58% 6,799 3.54%Close-In Couples is a group of predominantly older, African-American couples living in older homes in the urban neighborhoods of mid-sized metros. High school educated and empty nesting, these 55-year-old-plus residents typically live in older city neighborhoods, enjoying secure and comfortable retirements.
41 Sunset City Blues 2,399 1.27% 2,366 1.23%Scattered throughout the older neighborhoods of small cities, Sunset City Blues is a segment of lower-middle-class singles and couples who have retired or are getting closed to it. These empty-nesters tend to own their homes but have modest educations and incomes. They maintain a low-key lifestyle filled with newspapers and television by day, and family-style restaurants at night
42 Red, White & Blues 2,135 1.13% 2,231 1.16%The residents of Red, White & Blues typically live in exurban towns rapidly morphing into bedroom suburbs. Their streets feature new fast-food restaurants, and locals have recently celebrated the arrival of chains like Wal-Mart, Radio Shack and Payless Shoes. Middle-aged, high school educated and lower-middle class, these folks tend to have solid, blue-collar jobs in manufacturing, milling and construction

43 Heartlanders 1,754 0.93% 1,841 0.96%America was once a land of small middle-class towns, which can still be found today among Heartlanders. This widespread segment consists of middle-aged couples with working-class jobs living in sturdy, unpretentious homes. In these communities of small families and empty-nesting couples, Heartlanders pursue a rustic lifestyle where hunting and fishing remain prime leisure activities along with cooking, sewing, camping and boating.
44 New Beginnings 3,908 2.07% 3,914 2.04%Filled with young, single adults, New Beginnings is a magnet for adults in transition. Many of its residents are twentysomething singles and couples just starting out on their career paths-or starting over after recent divorces or company transfers. Ethnically diverse-with nearly half its residents Hispanic, Asian or African-American-New Beginnings households tend to have the modest living standards typical of transient apartment dwellers.
45 Blue Highways 1,005 0.53% 1,050 0.55%On maps, blue highways are often two-lane roads that wind through remote stretches of the American landscape. Among lifestyles, Blue Highways is the standout for lower-middle-class couples and families who live in isolated towns and farmsteads. Here, Boomer men like to hunt and fish, the women enjoy sewing and crafts, and everyone looks forward to going out to a country music concert

46 Old Glories 2,564 1.36% 2,536 1.32%Old Glories are the nation's downscale suburban retirees, Americans aging in place in older apartment complexes. These racially mixed households often contain widows and widowers living on fixed incomes, and they tend to lead home-centered lifestyles. They're among the nation's most ardent television fans, watching game shows, soaps, talk shows and newsmagazines at high rates.
47 City Startups 652 0.35% 653 0.34%In City Startups, young, multi-ethnic singles have settled in neighborhoods filled with cheap apartments and a commercial base of cafes, bars, laundromats and clubs that cater to twentysomethings. One of the youngest segments in America-with ten times as many college students as the national average-these neighborhoods feature low incomes and high concentrations of Hispanics and African-Americans.
48 Young & Rustic 944 0.50% 987 0.51%Like the soap opera that inspired its nickname, Young & Rustic is composed of young, restless singles. Unlike the glitzy soap denizens, however, these folks tend to be lower income, high school-educated and living in tiny apartments in the nation's exurban towns. With their service industry jobs and modest incomes, these folks still try to fashion fast-paced lifestyles centered on sports, cars and dating.

49 American Classics 4,581 2.43% 4,516 2.35%They may be older, lower-middle class and retired, but the residents of American Classics are still living the American Dream of home ownership. Few segments rank higher in their percentage of home owners, and that fact alone reflects a more comfortable lifestyle for these predominantly white singles and couples with deep ties to their neighborhoods
50 Kid Country, USA 2,928 1.55% 3,076 1.60%Widely scattered throughout the nation's heartland, Kid Country, USA is a segment dominated by large families living in small towns. Predominantly white, with an above-average concentration of Hispanics, these young, these working-class households include homeowners, renters and military personnel living in base housing; about 20 percent of residents own mobile homes.
51 Shotguns & Pickups 1,213 0.64% 1,262 0.66%The segment known as Shotguns & Pickups came by its moniker honestly: it scores near the top of all lifestyles for owning hunting rifles and pickup trucks. These Americans tend to be young, working-class couples with large families-more than half have two or more kids-living in small homes and manufactured housing. Nearly a third of residents live in mobile homes, more than anywhere else in the nation

52 Suburban Pioneers 2,558 1.36% 2,535 1.32%Suburban Pioneers represents one of the nation's eclectic lifestyles, a mix of young singles, recently divorced and single parents who have moved into older, inner-ring suburbs. They live in aging homes and garden-style apartment buildings, where the jobs are blue-collar and the money is tight. But what unites these residents-a diverse mix of whites, Hispanics and African-Americans-is a working-class sensibility and an appreciation for their off-the-beaten-track neighborhoods.
53 Mobility Blues 1,462 0.77% 1,440 0.75%Young singles and single parents make their way to Mobility Blues, a segment of working-class neighborhoods in America's satellite cities. Racially mixed and under 25 years old, these transient Americans tend to have modest lifestyles due to their lower-income blue-collar jobs. Surveys show they excel in going to movies, playing basketball and shooting pool
54 Multi-Culti Mosaic 11,640 6.17% 11,574 6.03%An immigrant gateway community, Multi-Culti Mosaic is the urban home for a mixed populace of younger Hispanic, Asian and African-American singles and families. With nearly a quarter of the residents foreign born, this segment is a mecca for first-generation Americans who are striving to improve their lower-middle-class status.

55 Golden Ponds 368 0.19% 383 0.20%Golden Ponds is mostly a retirement lifestyle, dominated by downscale singles and couples over 65 years old. Found in small bucolic towns around the country, these high school-educated seniors live in small apartments on less than $25,000 a year; one in five resides in a nursing home. For these elderly residents, daily life is often a succession of sedentary activities such as reading, watching TV, playing bingo and doing craft projects.
56 Crossroads Villagers 1,222 0.65% 1,297 0.68%With a population of middle-aged, blue-collar couples and families, Crossroads Villagers is a classic rural lifestyle. Residents are high school-educated, with lower-middle incomes and modest housing; one-quarter live in mobile homes. And there's an air of self-reliance in these households as Crossroads Villagers help put food on the table through fishing, gardening and hunting.
57 Old Milltowns 776 0.41% 825 0.43%America's once-thriving mining and manufacturing towns have aged-as have the residents in Old Milltowns communities. Today, the majority of residents are retired singles and couples, living on downscale incomes in pre-1960 homes and apartments. For leisure, they enjoy gardening, sewing, socializing at veterans clubs or eating out at casual restaurants.

58 Back Country Folks 335 0.18% 349 0.18%Strewn among remote farm communities across the nation, Back Country Folks are a long way away from economic paradise. The residents tend to be poor, over 55 years old and living in older, modest-sized homes and manufactured housing. Typically, life in this segment is a throwback to an earlier era when farming dominated the American landscape.
59 Urban Elders 1,500 0.79% 1,504 0.78%For Urban Elders-a segment located in the downtown neighborhoods of such metros as New York, Chicago, Las Vegas and Miami-life is often an economic struggle. These communities have high concentrations of Hispanics and African-Americans, and tend to be downscale, with singles living in older apartment rentals
60 Park Bench Seniors 547 0.29% 545 0.28%Park Bench Seniors typically are retired singles living in the racially mixed neighborhoods of the nation's satellite cities. With modest educations and incomes, these residents maintain low-key, sedentary lifestyles. Theirs is one of the top-ranked segments for TV viewing, especially daytime soaps and game shows
61 City Roots 3,732 1.98% 3,708 1.93%Found in urban neighborhoods, City Roots is a segment of lower-income retirees, typically living in older homes and duplexes they've owned for years. In these ethnically diverse neighborhoods-more than a third are African-American and Hispanic-residents are often widows and widowers living on fixed incomes and maintaining low-key lifestyles.

62 Hometown Retired 899 0.48% 877 0.46%With three-quarters of all residents over 65 years old, Hometown Retired is one of the oldest lifestyles. These racially mixed seniors tend to live in aging homes-half were built before 1958-and typically get by on social security and modest pensions. Because most never made it beyond high school and spent their working lives at blue-collar jobs, their retirements are extremely modest.
63 Family Thrifts 695 0.37% 692 0.36%The small-city cousins of inner-city districts, Family Thrifts contain young, ethnically diverse parents who have lots of children and work entry-level service jobs. In these apartment-filled neighborhoods, visitors find the streets jam-packed with babies and toddlers, tricycles and basketball hoops, Daewoos and Hyundais.
64 Bedrock America 831 0.44% 889 0.46%Bedrock America consists of young, economically challenged families in small, isolated towns located throughout the nation's heartland. With modest educations, sprawling families and blue-collar jobs, many of these residents struggle to make ends meet. One quarter live in mobile homes. One in three haven't finished high school. Rich in scenery, Bedrock America is a haven for fishing, hunting, hiking and camping.

65 Big City Blues 2,198 1.16% 2,212 1.15%With a population that's 50 percent Latino, Big City Blues has the highest concentration of Hispanic Americans in the nation. But it's also the multi-ethnic address for downscale Asian and African-American households occupying older inner-city apartments. Concentrated in a handful of major metros, these young singles and single-parent families face enormous challenges: low incomes, uncertain jobs and modest educations. More than 40 percent haven't finished high school.
66 Low-Rise Living 3,170 1.68% 3,131 1.63%The most economically challenged urban segment, Low-Rise Living is known as a transient world for young, ethnically diverse singles and single parents. Home values are low-about half the national average-and even then less than a quarter of residents can afford to own real estate. Typically, the commercial base of Mom-and-Pop stores is struggling and in need of a renaissance

April 12, 2012 RE: RAINTREE PLANTATION RESIDENTIAL DEVELOPMENT
DEMOGRAPHIC OPPORTUNITY AND SUITABLE HOME TYPES
Based on our initial evaluation of the Raintree Plantation residential development, available
developed lots, demographic opportunity, and foreseen market conditions, we are suggesting the
following buyer groups, home types, and price ranges.
Buyer Group – Pre Retirees, Grand-kids Second Home, Golf/Fishing/Bridge Buddies
Comments – This common sense, low debt, and cautious group has lived in South St.
Louis County forever. Quietly building up a head of steam for a non-Florida next life
stage, they need to be convinced that Raintree Plantation is the place (different than any
other place) in Jefferson County that is up to their stubborn standards. If convinced the
place is right, they may be apt to buy, build, live part-time, and then take it easy to really
move-in full time. A big part of the convincing will be social reinforcement from family
and friends eager to be their neighbors and/or weekend visitors at Raintree Plantation.
Home Type Description Basic Style Bedrooms Baths Price Range
The Brag-About Common Sense Home Ranch 2 2 Up to $175,000
Dual Master Bedroom Lifestyle Home Ranch 2 2 $175 - $275,000 Welcome Mat Out for Friends/Family 1 ½ Story 3.5 2.5 $225 - $325,000
Buyer Group – Jeff County Crowd and I’m Proud!
Comments – This hard driving and proud group are the Jefferson County movers, shakers,
and known about the county folks. They may have moved many times in the past, but
they’re available to re-settle in for the duration. If the Proud Crowd discovers one
community that’s a fit for them with their JeffCo peeps, this market segment awakens and
is ready to move and congregate. The fabric of Raintree Plantation works perfectly for the
common community part. Equally important are shoulder space, a broad range of housing
choices, and no dictated compromises on their individuality.
Home Type Description Basic Style Bedrooms Baths Price Range
Finally Retired Sign in the Front Yard Ranch 2 2 Up to $175,000
Our First Home – Apartment Flee’ers Ranch 2 1 ½ About $125,000
3 Home Lots, 3 Generations, and a Path All 2-3 2-3 $175 - $325,000
The Multi-Generation Flex Home 2 Story 3.5 2.5 $225 - $325,000 5 Lot – 3 Home Show-off Compound Any Many Many $375 - $625,000
Never Enough Garages Custom Home 1 ½ Story 3-4 3 $275 - $425,000

Buyer Group – New Jefferson County Discoverers
Comments – These are the emerging St. Louis area independent thinkers. They’re willing
to shun provincial thinking about where you went to whatever. So over the wornout labels
based on where you live, they are (1) the new-to-the-area move-ins as well as (2) the STL
born but not buying Dad’s Oldsmobile. Do they know about Raintree Plantation? – No.
Has anyone told them they should live in So-Jeff-Co? – No. Are these the right questions
and answers for independent Discovers? – Yes! If we help them discover Raintree, they
will come and look. If they like the woods, the lake, golf, and the community vibe, then
listen for “Eureka” and let them stake their claims.
Home Type Description Basic Style Bedrooms Baths Price Range
New Family and a Little Bit Country Ranch 2 2 Near $125,000
School Buses, Summer Golf and Fishing 2 Story 3-4 2.5 $175 – 275,000
Far Enough Away to Feel Retired 1 ½ Story 3.5 2.5 $125 – 225,000 Divorced, Widowed, Safety+Small Homes Varies 2 2 $125 – 225,000
White Collar - Will Drive (25 miles max) 2 Story 3-4 3 $275 – 375,000
Woodsy “Chic” Cabin/ Cottage
2 1 $75 - $125,000

St. Louis Region (10-County Market)Jefferson County
200
300
400
500
600
700
800
Dec. 09
Jan. 10
Feb. 10
Mar. 10
Apr. 10
May 10
Jun. 10
Jul. 10
Aug. 10
Sep. 10
Oct. 10
Nov. 10
Dec. 10
Jan. 11
Feb. 11
Mar. 11
Apr. 11
May 11
Jun. 11
Jul. 11
Aug. 11
Sep. 11
Oct. 11
Nov. 11
Dec. 11
Jan. 12
Permits by 12-Month Period Ending in Month Shown
200400600800
10001200140016001800
Jan 2003
Mar 2003
May 2003
Jul 2003
Sep 2003
Nov 2003
Jan 2004
Mar 2004
May 2004
Jul 2004
Sep 2004
Nov 2004
Jan 2005
Mar 2005
May 2005
Jul 2005
Sep 2005
Nov 2005
Jan 2006
Mar 2006
May 2006
Jul 2006
Sep 2006
Nov 2006
Jan 2007
Mar 2007
May 2007
Jul 2007
Sep 2007
Nov 2007
Jan 2008
Mar 2008
May 2008
Jul 2008
Sep 2008
Nov 2008
Jan 2009
Mar 2009
May 2009
Jul 2009
Sep 2009
Nov 2009
Jan 2010
Mar 2010
May 2010
Jul 2010
Sep 2010
Nov 2010
Jan 2011
Mar 2011
May 2011
Jul 2011
Sep 2011
Nov 2011
Jan 2012
Permits by 12-Month Period Ending in Month Shown

Developed Lot Inventory - Top NumberForecasted 12-Month Demand - Bottom Number
48459
42314
45868
336120
692134
22837
41049
64395
1,168165
793122
2,704141
2,406401
2,694471
2,342163
583167
24412
3,113414
1,111137
1,242210
46334
18214
1,38363Flood
Plain
31462
48442
1,207227
21145
5617
1,34183
1,926106
4417

Jefferson County - MG Areas 9 thru 11
3/08 - 3/09
7/08 - 7/09
11/08 - 11/09
3/09 - 3/10
7/09 - 7/10
11/09 - 11/10
3/10 - 3/11
7/10 - 7/11
11/10 - 11/11
3/11 - 3/12 * Next 12 Mos
Closings 787 760 586 601 562 659 562 524 349 349 350Net Home Inv. 232.2 197.8 170.6 154.9 166.3 135.2 141.4 126.8 115.7 126.030% Closings 236.1 228.0 175.8 180.3 168.6 197.7 168.6 157.2 104.7 104.7 105.020% Closings 157.4 152.0 117.2 120.2 112.4 131.8 112.4 104.8 69.8 69.8 70.0Gross Inv 453 377 378 337 390 291 261 254 258 242The best net home inventory should fall under the 20% of annual closings. Above 30% is a concern. This chart hascolumns representing closings and net home inventory not sold with the 20% to 30% caution inventory range shown by the 2 crossing lines.* Next 12 Mos Projected Demand - The activity anticipated to occur in the subdivisions tracked based on past audit.
0
100
200
300
400
500
600
700
800
900
3/08 - 3/09 7/08 - 7/09 11/08 -11/09
3/09 - 3/10 7/09 - 7/10 11/09 -11/10
3/10 - 3/11 7/10 - 7/11 11/10 -11/11
3/11 - 3/12 * Next 12Mos
Historical New Home Inventory vs. Projected Demand(Only active subdivision data, not homes built on odd lots)
Closings Net Home Inv. 20% Closings 30% Closings Gross Inv Manageable Gross Inventory
A9CSALE.XLS / A9CSALEVolume 62, March 2012
© MarketGraphics Research Group, Inc. 2012

St. Louis Region (10-County Market)Homes Needed AnnuallyCounty Current Lot
InventoryBalance
20122013
Needed2014
Needed2015
Needed2016
Needed2017
NeededTotal Demand 2012 to 2017
SL City 484 49 69 77 86 96 111 487
SL County 3,190 431 607 676 758 843 973 4,289
Jefferson 4,665 357 503 560 628 698 806 3,553
St. Charles 8,269 1,012 1,425 1,587 1,779 1,979 2,285 10,066
St. Clair 4,224 459 646 720 807 897 1,036 4,565
Madison 3,270 267 376 419 469 522 603 2,655
Franklin 1,418 227 118 131 147 163 189 974
Warren 1,397 84 133 148 165 184 212 925
Lincoln 2,367 94 122 135 152 169 195 867
Monroe 798 86 319 355 398 443 512 2,114
Total 30,082 3,066 4,318 4,807 5,388 5,994 6,921 30,495
0
5,000
10,000
15,000
20,000
25,000
30,000
35,000
Current LotInventory
Balance 2012 2013 Needed 2014 Needed 2015 Needed 2016 Needed 2017 Needed
30,082
3,0664,318 4,807 5,388 5,994
6,921