Railroad Grade Crossing Monitoring System · PDF fileRailroad Grade Crossing Monitoring System...
40
Railroad Grade Crossing Monitoring System Prepared by TEXAS TRANSPORTATION INSTITUTE THE TEXAS A&M UNIVERSITY SYSTEM 701 NORTH POST OAK, SUITE 430 HOUSTON, TEXAS 77024-3827 for TEXAS DEPARTMENT OF TRANSPORTATION
-
Upload
nguyenquynh -
Category
Documents
-
view
230 -
download
2
Transcript of Railroad Grade Crossing Monitoring System · PDF fileRailroad Grade Crossing Monitoring System...

Railroad Grade Crossing Monitoring System
Prepared by
TEXAS TRANSPORTATION INSTITUTE THE TEXAS A&M UNIVERSITY SYSTEM
701 NORTH POST OAK, SUITE 430 HOUSTON, TEXAS 77024-3827
for
TEXAS DEPARTMENT OF TRANSPORTATION

RAILROAD GRADE CROSSING MONITORING SYSTEM
by
Merrell E. Goolsby, P.E. Senior Research Engineer
Texas Transportation Institute
Michael J. Vickich Systems Analyst
Texas Transportation Institute
and
Anthony P. Voigt, P.E. Assistant Research Engineer
Texas Transportation Institute
Sponsored by the Texas Department of Transportation
In Cooperation with the U.S. Department of Transportation
Federal Highway Administration
August 2003
TEXAS TRANSPORTATION INSTITUTE The Texas A&M University System
701 North Post Oak, Suite 430 Houston, Texas 77024-3827

i
EXECUTIVE SUMMARY Highway-rail grade crossings can be source of significant traffic delay, particularly in large urban areas such as Houston. This project examined how real-time detection, communication, and information systems can be integrated to monitor the movements of trains in a corridor to reduce conflicts and delays created by railroad grade crossings for the primary benefit of fire and police personnel while on emergency runs. This railroad grade crossing monitoring project was developed by the Houston District of the Texas Department of Transportation (TxDOT) and Texas Transportation Institute (TTI) as part of the ITS Priority Corridor Program. The Sugar Land Rail Monitoring System covers the 6.4 mile US 90A rail-highway corridor between Kirkwood and Grand Parkway. On average, more than 30 total trains per day use the corridor. The UPRR passes through two fire department districts, creating the need for Fire Stations 1 and 2 to make emergency runs crossing the UPRR tracks. Timely information of projected crossing blockages was considered to be the most useful piece of information that the system could produce. MONITORING SYSTEM The system monitors the following parameters: presence of train and direction, speed of train, length of train, and crossing gate closures via monitoring of traffic signal preemption relays. Using this information, the system determines real time train status and projects downstream crossing closing and clearance times. The typical field installation is located at signalized intersections of US 90A with streets crossing the UPRR tracks. Equipment consists of pole mounted field cabinet with electrical service, Doppler radar, signal preemption connections, local processor, and wireless modem. A Yagi or omni-directional antenna provides wireless CDPD communications to the central facility. Information kiosks displaying train status were provided by TxDOT and the City of Sugar Land at three emergency service locations. One was located centrally between the police and fire dispatcher consoles at the Police Station and two kiosks (at Fire Station 1 and one at Fire Station 2) were located within the stations near the dispatch printers and communications radios. A typical kiosk display during a train passage is shown in Figure S-1. Overall performance of the system was considered good. A log was maintained of maintenance/system outages, which indicates approximately six percent “down time” of individual monitoring sites was experienced. Most of the system outages related to two primary problems: power surges and wireless communication services. These problems were substantially resolved during the course of the project, resulting in a stable system.

ii
Figure S-1. Typical Display during Train Passage SYSTEM USAGE The Sugar Land Fire Department provided incident logs for these two stations in order to better understand the relationship between emergency runs and the rail monitoring system. Emergency runs for the two stations were logged over a six month period. Each station made over 500 runs during this period, averaging 2.8 runs per day for each station. Of the 1,036 runs logged, 296 required crossing the UPRR tracks. Interviews were conducted with fire station officers at both Fire Station 1 and 2. Results of the survey indicate the system is understood and trusted, provides useful information, and the information is generally used when making emergency runs. Structured interviews were also conducted with four police and three fire dispatchers located at the dispatch center. These interviews indicate the dispatchers had confidence in the system and utilized it to assist police and fire personnel in the field.
iii
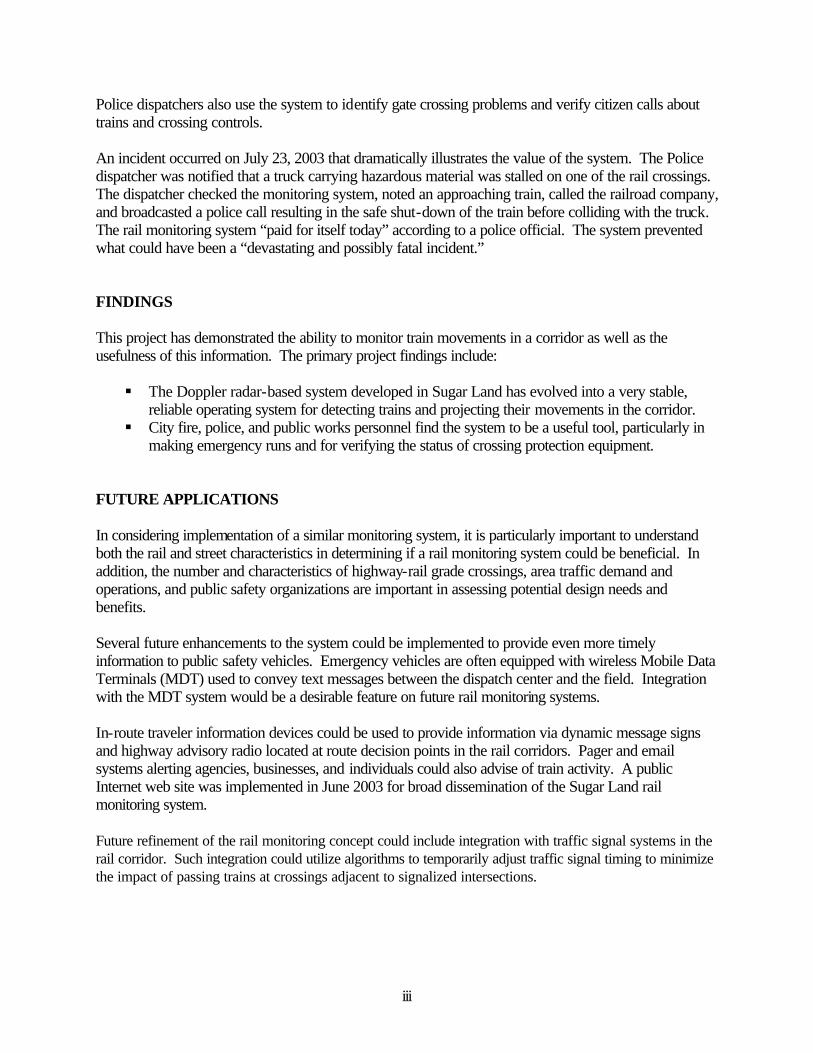
Police dispatchers also use the system to identify gate crossing problems and verify citizen calls about trains and crossing controls. An incident occurred on July 23, 2003 that dramatically illustrates the value of the system. The Police dispatcher was notified that a truck carrying hazardous material was stalled on one of the rail crossings. The dispatcher checked the monitoring system, noted an approaching train, called the railroad company, and broadcasted a police call resulting in the safe shut-down of the train before colliding with the truck. The rail monitoring system “paid for itself today” according to a police official. The system prevented what could have been a “devastating and possibly fatal incident.” FINDINGS This project has demonstrated the ability to monitor train movements in a corridor as well as the usefulness of this information. The primary project findings include: § The Doppler radar-based system developed in Sugar Land has evolved into a very stable,
reliable operating system for detecting trains and projecting their movements in the corridor. § City fire, police, and public works personnel find the system to be a useful tool, particularly in
making emergency runs and for verifying the status of crossing protection equipment. FUTURE APPLICATIONS In considering implementation of a similar monitoring system, it is particularly important to understand both the rail and street characteristics in determining if a rail monitoring system could be beneficial. In addition, the number and characteristics of highway-rail grade crossings, area traffic demand and operations, and public safety organizations are important in assessing potential design needs and benefits. Several future enhancements to the system could be implemented to provide even more timely information to public safety vehicles. Emergency vehicles are often equipped with wireless Mobile Data Terminals (MDT) used to convey text messages between the dispatch center and the field. Integration with the MDT system would be a desirable feature on future rail monitoring systems. In-route traveler information devices could be used to provide information via dynamic message signs and highway advisory radio located at route decision points in the rail corridors. Pager and email systems alerting agencies, businesses, and individuals could also advise of train activity. A public Internet web site was implemented in June 2003 for broad dissemination of the Sugar Land rail monitoring system. Future refinement of the rail monitoring concept could include integration with traffic signal systems in the rail corridor. Such integration could utilize algorithms to temporarily adjust traffic signal timing to minimize the impact of passing trains at crossings adjacent to signalized intersections.

iv
DISCLAIMER The contents of this report reflect the views of the authors, who are responsible for the facts and accuracy of the data presented herein. The contents do not necessarily reflect the official view or policies of the Texas Department of Transportation (TxDOT) or the Federal Highway Administration (FHWA). This report does not constitute a standard, specification, or regulation. The engineer in charge of this project was Merrell E. Goolsby, P.E. (Texas #29551).

v
ACKNOWLEDGEMENTS This report was developed as part of the Houston ITS Priority Corridor Program, under Work Order 8 “Railroad Grade Crossing Monitoring System.” The Priority Corridor Program is directed by Mr. David Fink, P.E., with Mr. John Gaynor, P.E., serving as Project Director for this project. Mr. Gene Ritch and Mr. Leonard Ruback of TTI were instrumental in design, deployment, and operation of the Sugar Land Rail Monitoring System.
vi
TABLE OF CONTENTS
Page 1. Introduction…………………………………………………………………………….. 1 Concept of Operations……………………………………………………………… 1 Project Development……………………………………………………………….. 2 2. System Monitoring Concepts………………………………………………………….. 3 Transponder System………………………………………………………………... 3 Doppler Radar System……………………………………………………………… 4 Deployment Decision ……………………………………………………………… 5 3. Deployment of the Sugar Land Railroad Monitoring System……………………… 6 Physical Description of Components and Installations…………………………….. 8 System Architecture, Processing, and Communications…………………………… 10 System Changes during Project…………………………………………………….. 15 4. System Performance and Usage………………………………………………………. 16 System Performance………………………………………………………………... 16 System Usage ……………………………………………………………………… 18 5. Findings and Future Directions………………………………………………………. 25 Summary of Findings ……………………………………………………………… 25 Potential Future Applications ……………………………………………………… 26 Future of Sugar Land System ……………………………………………………… 27 Appendix………………………………………………………………………………….. 29
1
1. INTRODUCTION Highway-rail grade crossings can be source of significant traffic delay, particularly in large urban areas such as Houston. With evolving Intelligent Transportation System (ITS) technologies, it is possible to assemble information and traffic control systems to monitor the movement of motor vehicles and trains. For example, automatic vehicle identification transponders have been used for a number of years to sample travel times and speeds on Houston area freeways. This project was conceived to examine how detection, communication, and information systems can be integrated to monitor the movements of trains in a corridor to reduce conflicts and delays created by railroad grade crossings. This project developed a system primarily oriented for use by fire and police personnel to minimize conflicts and delays while on emergency runs. CONCEPT OF OPERATIONS The theory behind a train monitoring system is that operations and safety on the surface street system may be improved if local agencies and travelers become aware when trains approach highway-rail intersections. This information can be used to improve local governmental services in two respects: traffic operations and emergency response. Transportation departments and agencies can use train monitoring information to control traffic signal timings to minimize delays by modifying timings or employing diversion strategies. These systems also provide valuable information (such as crossing blockage extent and duration) to emergency vehicles. Private companies could use this information to better route truck and delivery vehicles around delays caused by train crossing blockages. Travelers in the rail corridor could adjust trips based on knowledge of train movements and projections received before making a trip. The concept of the rail monitoring project centers on coordinating and refining operations of both vehicle and train traffic at the railroad/roadway interface. Once a system of train detection and monitoring has been implemented in the field, the usefulness of that system relies on the integration of train travel data into a transportation or emergency management centers. Train information can be used to send operational information to emergency services centers, to provide automated route planning, and provide robust and timely information to emergency vehicles. Users of Rail Information There are several potential users of rail monitoring data. They could encompass both public and private users, and their uses are varied. Transportation Management Centers (TMC) may provide a central location for data collection, processing, and monitoring of rail activity and a means of disseminating information to the public and other agencies. Other agencies using TMC rail data could include emergency service providers such as fire, emergency medical service (EMS), and police who can benefit from real-time railroad condition information when responding to calls for assistance.

2
In areas with transit operations, transit agencies could use real-time route modification if provided with advanced knowledge of blocked intersections. Traffic signals adjacent to or in the proximity of rail crossings currently receive a very basic indication that a train is approaching. More specific train operation data could allow an advanced traffic signal controller to coordinate vehicular movements more efficiently and safely. These systems could also be used to provide motorists with train crossing delay information, either by using message displays on roadside variable message signs or by delivering the message directly to drivers or vehicles. PROJECT DEVELOPMENT This railroad grade crossing monitoring project was developed by the Houston District of the Texas Department of Transportation (TxDOT) and Texas Transportation Institute (TTI) as part of the ITS Priority Corridor Program. The project, as initially conceived, was to be a traveler information system alerting motorists of current and projected blockages at grade crossings. It was anticipated that the system would be installed on the Union Pacific Railroad (UPRR) parallel to Hempstead Road and/or parallel to IH 610 (West Loop). Changes to interrelated Priority Corridor projects in these corridors and the better corridor characteristics of Sugar Land led to the Sugar Land deployment. The project evolved into a prototypical system deployed in Sugar Land to provide information to public safety departments. This real-time information could then be used in making routing decisions for emergency runs requiring the crossing of railroad tracks. The concept could (if successful) be expanded to provide traveler information in the vicinity of railroad grade crossings using dynamic message signs (DMS), highway advisory radio (HAR), pagers, or other information devices. The Houston ITS Priority Corridor Program Plan included this project as Work Order 8, “Railroad Grade Crossing Monitoring System.” The initial monitoring concepts would have used automatic vehicle identification (AVI) technology similar to that used on Houston area freeways to develop the Houston TranStar “traffic map” of measured speeds. American railroads had adopted a requirement that railroad rolling stock be equipped with automatic equipment identification (AEI) transponder tags, which are essentially similar to the EZ tags used in the Houston area, and can be read just as highway-equipped vehicles are read. The deployed project in Sugar Land used an alternate technology based on Doppler radar as significant institutional delays were encountered in advancing the AVI concept to deployment. The Doppler radar-based system had recently been developed and tested by TTI’s TransLink Laboratory in College Station. The Sugar Land system expanded and enhanced the College Station demonstration project to provide an operational system, oriented to the City of Sugar Land as the system user. This report describes the development and testing work for the AVI-based monitoring concept, as well as the Doppler radar-based system actually deployed in Sugar Land. In addition, operating and maintenance experience of the system are discussed.

3
2. SYSTEM MONITORING CONCEPTS Two systems for monitoring train movements were considered in the evolution of the deployed project. Functionally, the two concepts were very similar with the primary difference being the technology used for train detection, e.g., transponders (AVI) and Doppler radar. Each technology could detect presence, direction, speed, and length of trains. Both concepts also included the monitoring of trains at crossings adjacent to signalized intersections. This was accomplished by interfacing in the traffic signal cabinet with the signal preemption relay circuit, which is activated by the railroad’s equipment controlling the active crossing protection systems (gates and flashers) at the grade crossing. Monitoring of the warning systems provides a positive indication of train presence at grade crossings to supplement train detection/projection data provided by the AVI or Doppler radar sites. TRANSPONDER SYSTEM The automatic vehicle identification system was originally envisioned as the method for determining presence, direction, speed, and length of the train. It was conceptually appealing since transponders were affixed to both sides of each rail car and locomotive and could be read by equipment located strategically adjacent to the tracks. In addition, the transponder technology was familiar to TxDOT and TTI, as it is the basis for monitoring freeway operations in the Houston area. Railroads use the transponders (called AEI–automatic equipment identification–tags) for tracking rail shipments through their yards and track system. The railroads have tag readers placed strategically at yards and on their track system. Initial Project Development and Testing In developing the AVI-based approach to train detection, several key questions needed answers since this was a new application of AEI/AVI technology. Were railroad AEI transponders compatible with the AVI readers used on Houston freeways? Could the AEI tags be read? At what distances? Could they be read at various speeds? Initially, simple tests were made with a handheld AVI reader to verify the ability to read AEI tags from stationary trains. The success of this test was followed by a test using a temporary setup of the AVI equipment used in freeway monitoring installations. Amtech (now TransCore), the AVI system supplier, developed a preliminary design for the AVI system, which was field tested by TTI and Amtech. The test utilized a two antenna system to create a speed trap. Results of this test indicated that AEI tags could be read successfully from a distance of 25 to 35 feet, while trains were moving at 30 to 50 miles per hour. It was considered that trains traveling at speeds outside this range would probably be monitored as well, but there was no opportunity at the test site to verify this. The tests indicated that more complete and accurate reads could be made if the distance from the antenna to the tag was less than 25 feet.

4
Attempts were made over an extended period of time to foster involvement and cooperation in the project by the Union Pacific Railroad (UPRR). Based on the initial tests of the AVI technology, it was considered desirable to locate readers on the railroad right of way. With typical right of way widths of 100 feet, AVI reader locations would need to be a minimum of 45-50 feet from the tags if located off the right of way. TTI conducted additional tests at two sites for the eventuality of installing the AVI equipment off the railroad right of way. The first site is on the single track rail line parallel to Hempstead Road. This site was selected because an operational AVI system on Hempstead Road was available for testing purposes. Modification to the antenna location was made, and AEI tags were successfully read from a distance of 50 feet. Characteristics of this line–slow moving trains on a single track–resulted in a high percentage of tag reads. The second site was on the double track UPRR line parallel to IH 610. This test utilized a mobile AVI reader system acquired by TxDOT as part of the AVI Phase 4 freeway monitoring project. AEI tags were read from a distance of 50 feet, but not with as high an accuracy as at the Hempstead Road site. This site has fast moving trains on double tracks, which reduced the number of tag reads. In addition, there was a problem obtaining accurate, matching reads from two successive antenna in order to determine direction of travel, speed of train, and an estimate of train length. Lengthening the speed trap (separation of antennas) to 200 feet was unsuccessful in obtaining better results because of loss of signal strength from antenna to reader. It was concluded from these tests that to successfully utilize the currently available AVI technology for monitoring trains, a distance of 25 feet or less from antenna to tag is necessary. This requirement makes it necessary to set up the monitoring system on railroad right of way–something that could not be agreed upon between UPRR and TxDOT. DOPPLER RADAR SYSTEM Field tests at the IH 610 site were then expanded to include Doppler radar in conjunction with the testing of the AVI system. The Doppler radar system developed by TTI’s TransLink Laboratory had been found to successfully detect and measure presence, direction, speed, and length of trains in a proof of concept project conducted on the Wellborn Road Corridor in College Station (1). The AVI and radar data were compared to observations collected manually of the number of rail cars in each train, length of the train, and speed of the train. The following findings resulted from observation of 136 trains. § The AVI system detected 38 percent of the trains on the double tracks with only 12 percent of
trains having sufficient reads to determine speed and direction of trains. § Doppler radar detected the passage of 100 percent of trains with speed measurements
essentially the same as taken by a hand-held laser speed gun. (1) Integrating Train Information for Advanced Transportation Management, Research Report 1752-7, Leonard G. Ruback and Kevin N. Balke, Texas Transportation Institute, 2001.

5
§ The concept of using AVI technology to monitor train movement was found to be viable, but equipment would need to be placed on railroad right of way to provide sufficient train movement information.
§ Estimated deployment costs are significantly higher for the AVI systems at approximately $35,000 per site versus $7,500 to $10,000 for Doppler radar.
DEPLOYMENT DECISION TxDOT made a decision to deploy the Doppler radar railroad grade crossing monitoring system with gate monitoring in Sugar Land. This decision was based on several factors. It appeared difficult to gain approval to place the AVI monitoring system on railroad right of way, as well as the higher cost of the AVI system. The Doppler radar proof of concept project in College Station had produced a viable radar-based detection system, and tests in Houston indicated it could satisfy the rail monitoring needs. In addition, other concurrent ITS Priority Corridor projects in the Hempstead Road and IH 610 corridors no longer had an interrelationship with the rail monitoring project. The US 90A corridor in Sugar Land had a high volume of trains and highway traffic resulting in significant traffic delays. Meetings with the City of Sugar Land indicated their strong interest in having the project in their city.

6
3. DEPLOYMENT OF THE SUGAR LAND RAILROAD MONITORING SYSTEM
The Sugar Land rail monitoring system covers the 6.4 mile US 90A rail-highway corridor between Kirkwood and Grand Parkway. Major street crossings included in the system are State Highway 6, Eldridge, and Dairy Ashford. The system implemented in Sugar Land offered several characteristics that were beneficial for evaluation. As shown in Figure 1, the City of Sugar Land is split geographically by US 90A and the Union Pacific Railroad, which runs parallel to each other through the city. On average, more than 30 total trains per day use the corridor with train volumes for a typical weekday shown in Table 1.
Figure 1. Project Area and Location of Fire/Police Facilities

7
Table 1. Trains Passing Through Monitoring System–Typical Week
Day Eastbound Westbound Total
Sunday Monday Tuesday
Wednesday Thursday
Friday Saturday
16 18 9 20 13 16 15
12 20 20 14 20 17 20
28 38 29 34 33 33 35
Totals 107 123 230
Daily Average 33
Note: Train counts made February 9-15, 2003.
The line is basically single track with a double track section (used for train passing) located between Ulrich and Grand Parkway. Essentially all train traffic is through traffic with typical speeds of 25-40 miles per hour. Lower speeds occur when trains move to or from the passing track. Typical train lengths are 2,000 to 8,000 feet. Two minor sidings exist at the Imperial Sugar Plant and near Industrial with minimal impact on train operations. The rail monitoring system for Sugar Land was developed to primarily provide monitoring capability for City of Sugar Land Fire and Police using the Internet as the information carrier. There was no intended public information dissemination capability of the system; however, Internet logs indicated that pages were being viewed by non-agency users (general public, local industry). The City of Sugar Land has Fire/EMS stations on both sides of the UPRR tracks, while the police station is located on the south side of the UPRR. The City indicated that fire units must frequently cross the tracks to respond to emergencies (Figure 1). Timely information of projected crossing blockages was considered to be the most useful piece of information that the system could produce. In order to provide meaningful information about train operations in the area, the system had to monitor several operational parameters including the following: § presence of train and direction; § speed of train; § length of train; and § gate closures (monitoring of rail to signal preemption relays).
Using this information, the system could then monitor the system status in real time and calculate projections for downstream crossing closing and clearance intervals. The system uses the Doppler-based monitoring with crossing gate relay monitoring. The sensor technology adopted for the off right of way detectors was radio frequency Doppler radar. The Doppler radar technology is mature with development of microwave components underway since the 1930s and solid state equipment common and reliable. Current practices with solid state integrated circuitry result

8
in the transmitter and receiver being physically small and lightweight. The Doppler systems work well in either side-fire or overhead installations, as long as the appropriate off-angle speed corrections are accounted for. Radar range issues are easily met with Federal Communications Commission (FCC) part 15 equipment, which results in using equipment with low power consumption and low cost. Radar systems offer presence as well as speed and direction detection, both requirements for railroad monitoring systems of the type installed for this project. PHYSICAL DESCRIPTION OF COMPONENTS AND INSTALLATIONS This section describes the field equipment and physical configuration of the cabinets. It also presents a summary of the site locations and kiosk setup and operation. Field Equipment The typical field installation is located at signalized intersections of US 90A with streets crossing the UPRR tracks. Equipment consists of pole mounted field cabinet, with electrical service connections to a circuit breaker within the local traffic signal controller cabinet. If the site includes a signal preemption circuit, the preemption connection is also made in the signal controller cabinet. Figure 2 shows the typical cabinet location mounted on service pole. The cabinets were typically mounted at nine to ten feet in height to reduce the possibility of theft or vandalism. The Yagi or omni-directional antenna was attached above the cabinet, either on the cabinet itself or attached to conduit attached to the pole. The cabinet used for the initial installations was a typical TxDOT school flasher cabinet.
Figure 2. Typical Cabinet Location Critical equipment within the cabinet consists of the following components: § 12 volt regulated power supply (Pyramid PS-3KX); § alternating current (AC) surge protection (EDCO ACP-340); § Cellular Digital Packet Data (CDPD) modem (Airlink Redwing or Novatel Sage); § wireless modem surge protection (Polyphaser MDS-24-F); § component electrical surge protection modules (2-EDCO PHC-020); § preempt relay (Guardian Electric 1395 JPVS-2C-12D); § processor/radar reset relay (Guardian Electric 1395 JPVS-2C-12D); § microcontroller (Tiny Tiger) mounted on circuit board; and § 9 volt power supply for CDPD modem (if necessary).

9
Equipment outside the cabinet consists of: § Doppler radar unit (Decatur Electronics SI-2); and § omni-directional or Yagi antenna.
Monitoring Site Locations The locations and functions of each installation are presented in Table 2. Note that the end stations at Kirkwood and Grand Parkway are spaced over one mile from the first cross street to give sufficient warning of approaching trains. For example, a train traveling 45 miles per hour will arrive at the first crossing in 1.5 to 2 minutes.
Table 2. Location and Function of Sugar Land Rail Monitoring Sites
Crossing1 Monitoring Function Distance between Sites (miles)
Grand Parkway2 Prison Road State Highway 6 Ulrich Wood Eldridge Industrial Dairy Ashford Kirkwood
Doppler
Gate
Doppler and Gate
Doppler and Gate
Gate
Doppler and Gate
Gate
Gate
Doppler and Gate
1.42
0.74
0.81
0.51
0.68
0.80
0.18
1.26
Total Lengths 6.40 1 Crossings listed from west to east. 2 Doppler radar site only–no at-grade crossing.
Kiosk Location/Function The information kiosks were provided by TxDOT and the City of Sugar Land and were placed at three emergency service locations. The police and fire dispatch at the Police Headquarters was outfitted with a kiosk that was located centrally between the two dispatchers (Figure 3). Two kiosks, one at Fire Station 1 and one at Fire Station 2, were located within the stations placed near the dispatch printers and communications radios (Figure 4). These kiosks are essentially computer systems set up for viewing only on 17-inch CRT screens.

10
Figure 3. Police Headquarters Kiosk Figure 4. Fire Station Kiosk SYSTEM ARCHITECTURE, PROCESSING, AND COMMUNICATIONS The Sugar Land Rail Monitoring System is organized into several distinct subsystems, as shown in Figure 5. The Field Subsystem includes the equipment along the rail corridor that monitors activity and acquires raw data regarding the status of each crossing and information about detected trains. The Communications Subsystem transports raw data from the Field Subsystem to another subsystem, called the Central Processing Subsystem. The Central Processing Subsystem combines and processes raw data from each of the Field Subsystems and generates the dataset that is utilized by the Traveler Subsystem. The Central Processing Subsystem also determines the corridor status as a whole and provides remote management and configuration capabilities for each of the Field Subsystems. The Traveler Subsystem formats the data for presentation and provides users access to the information through the Internet. Computer kiosks were set up at the three locations to provide continuous display of the corridor status map and train project information.
Figure 5. System Overview Field Subsystem The Field Subsystem (Figure 6) is responsible for acquiring the raw data from the rail corridor including train speed, position, direction, and signal preemption status. The system consists of nine individual sites along the rail corridor. Two different site configurations exist. The first type of configuration is only utilized to monitor the preemption status of the nearby grade crossing. The second type of configuration detects train movement in addition to preemption status. Each configuration is comprised of a microcontroller and a 12-volt power supply. The configuration used for train detection also contains a Doppler radar.

11
Figure 6. Field Subsystem Central to the operation of each field site is a programmable microcontroller. The microcontroller provides a RS-232 serial interface to the train detection device and communication device, which acts as a gateway to the Communications Subsystem. It controls the operation of the train detection device, monitors environmental indicators such as voltage and equipment temperature and reports site status messages to the Central Processing Subsystem. It also detects the preemption status of the nearby grade crossing by monitoring the connected circuit. The microcontroller used in Sugar Land is the Basic Tiger from Wilke Technology GmbH. Programs written in a language called BASIC-Tiger control the activities of the microcontroller. Doppler radars from Decatur Electronics are used as the train detection device. The microcontroller interacts with the Doppler radar by polling it at a specified interval. Raw data samples are acquired and processed by the microcontroller using custom-built software running on the microcontroller’s Central Processing Unit (CPU). One of the shortcomings of the Radio Frequency (RF) radar used in the Sugar Land corridor is the radar’s potential to detect “false positives,” usually occurring in heavy rain. Heavy rain reflects enough RF energy to cause the radar to interpret it as a slow moving train. To circumvent this issue, the microcontroller runs all data samples received from the radar through filtering algorithms, which determine whether object detection is due to a train or rain. The algorithms use variables to determine whether the RF energy intensity equates to the thresholds necessary to confirm that a train has been detected. If the object detected turns out to be a train, the filtered data is passed to another algorithm that calculates train length, train speed, and train direction. The data is then transferred to the Communications Subsystem through the RS-232 serial interface of the microcontroller. Communications Subsystem The Communications Subsystem includes the communications equipment and transport capabilities necessary to transfer information between the Field Subsystem and the Central Processing Subsystem, as diagrammed in Figure 7.

12
Figure 7. Communications Subsystem The Sugar Land Rail Monitor utilizes Cellular Digital Packet Data (CDPD) for communications between the Field and Central Subsystems. CDPD is a fully documented, open specification for transporting data wirelessly over the public cellular network. Verizon Wireless’s Mobile IP CDPD service was chosen for the system due to its availability throughout the corridor, easy integration with the Internet Protocol and technological maturity. In addition, a wireless solution made communications installation and deployment relatively easy. CDPD provides the system with a raw data transmission rate of about 9.6 kilobits per second (kbps), which is less than the advertised rate of 19.2 kbps due to communications system overhead and network congestion. However, 9.6 kbps is sufficient for the relatively small amount of data packets that are transferred during system operations in the Sugar Land corridor. Each Field Subsystem is equipped with a CDPD modem and antenna for communications. As CDPD utilizes the cellular network, it is necessary to acquire a cellular channel to transport data. Each site uses either omni-directional or directional antenna to assist in signal acquisition, depending on the location. To manage the transport of data to and from the Field Subsystem, the system uses CDPD modems from Airlink Communications and Novatel Wireless. The modems operate in full-duplex mode, allowing simultaneous two-way communications between the Field and Central Subsystems. Data is sent to and from the Field Subsystem through the modem’s RS-232 interface. The modem’s internal Internet Protocol (IP) software stack translates the data to User Datagram Protocol (UDP) packets for transport. During the transport phase, data is sent through the CDPD network to the IP and port address of the machine running the Central Processing Subsystem. As each modem is also assigned an IP address, any data sent to the Field Subsystem from the Central Processing Subsystem follows the opposite path. Central Processing Subsystem The Central Processing Subsystem is responsible for acquiring, processing, and merging data from each Field Subsystem in the corridor and producing output that is utilized by the Traveler Subsystem for

13
presentation as shown in Figure 8. The Central Processing System also contains a System Management interface that allows administrators to remotely configure each Field Subsystem and to analyze raw data before it is processed. The Central Processing System is a single application running on one machine. It was written in Microsoft Visual Basic and utilizes ActiveX, Microsoft’s component based software design framework.
Figure 8. Central Processing Subsystem Utilizing the User Datagram Protocol (UDP) for the Internet, the Central Processing Subsystem listens and receives data from each of the Field Subsystems in the corridor. The system translates the data into events for each crossing. Events indicate a clear crossing, train arrival, train departure, train presence, or gate arm down. From these events, the system determines the status of the rail corridor as a whole. Potential corridor statuses include “Clear,, “Train Detected,” “Intersection Blocked,” or “Unknown.” When the corridor status is “Clear,” corridor updates occur every 20 seconds. When the Central Processing System determines that a train is in the corridor, it tracks it as it moves through the system. Information about each train is stored in a program object and is updated at least once every two seconds. The object contains the train location, train speed, train length, train direction of travel, and system confidence of data estimates. In addition, estimates for arrival and departure time for downstream crossing locations are calculated. Note that there is no logical limit to the number of trains that can be tracked at once. As they are updated, each of these values is written to a single Extensible Markup Language (XML) file. XML is a standard, universal format for encoding and exchanging documents on the Internet. The XML file provides the Traveler Subsystem with accessible format for processing and presenting the information to users. Traveler Subsystem The Traveler Subsystem (Figure 9) for the Sugar Land Rail Monitor consists of a web-based application that depicts real-time conditions in the rail corridor (Figure 10). The application is made available through the Microsoft Internet Information Services Web Server and can be accessed on the Internet with a web browser such as Microsoft Internet Explorer. For this project, access was limited to three Internet kiosks, located at Fire Station 1, Fire Station 2, and at the fire/police dispatch console. The scripts responsible for disseminating the information were developed using Microsoft Active Server Pages (ASP), a technology used to build dynamic web applications. As a data source, the application reads an Extensible Markup Language (XML) file that contains information about each crossing’s status along with any train events occurring in the corridor. The XML file is created by the Central Processing

14
Subsystem. To update automatically without user intervention, the application is programmed to refresh its information every ten seconds.
Figure 9. Traveler Subsystem
Figure 10. User Interface/Kiosk Display
15
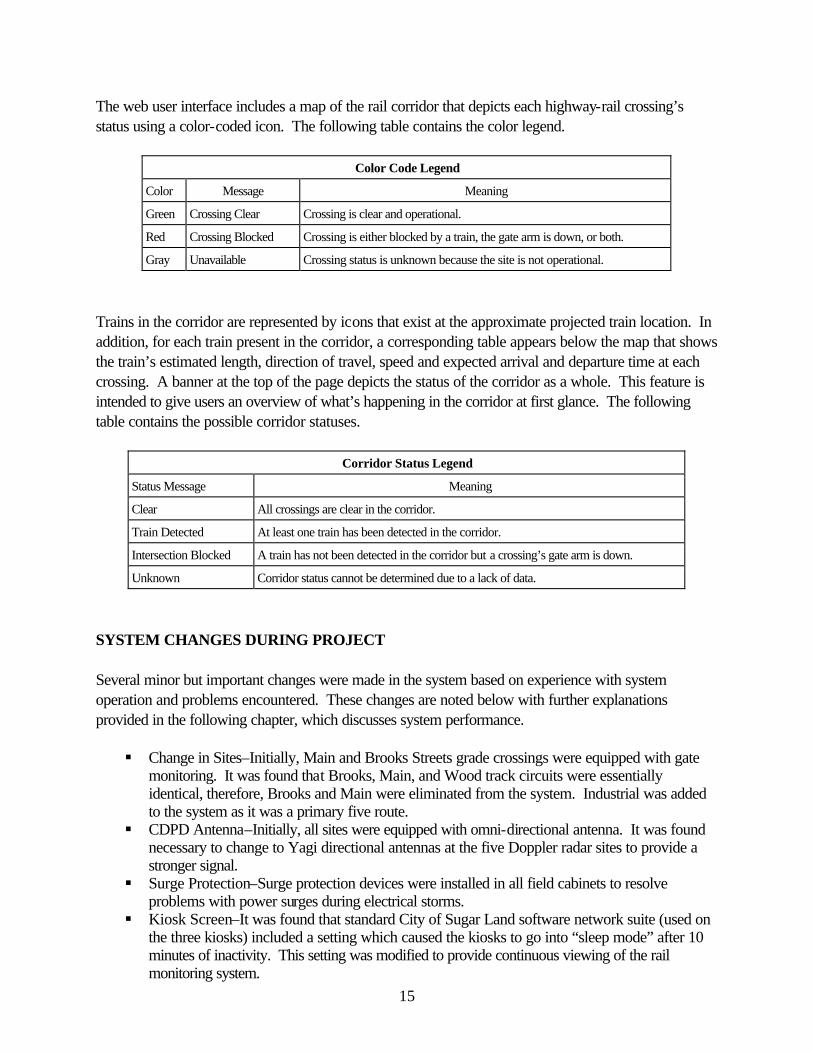
The web user interface includes a map of the rail corridor that depicts each highway-rail crossing’s status using a color-coded icon. The following table contains the color legend.
Color Code Legend
Color Message Meaning
Green Crossing Clear Crossing is clear and operational.
Red Crossing Blocked Crossing is either blocked by a train, the gate arm is down, or both.
Gray Unavailable Crossing status is unknown because the site is not operational.
Trains in the corridor are represented by icons that exist at the approximate projected train location. In addition, for each train present in the corridor, a corresponding table appears below the map that shows the train’s estimated length, direction of travel, speed and expected arrival and departure time at each crossing. A banner at the top of the page depicts the status of the corridor as a whole. This feature is intended to give users an overview of what’s happening in the corridor at first glance. The following table contains the possible corridor statuses.
Corridor Status Legend
Status Message Meaning
Clear All crossings are clear in the corridor.
Train Detected At least one train has been detected in the corridor.
Intersection Blocked A train has not been detected in the corridor but a crossing’s gate arm is down.
Unknown Corridor status cannot be determined due to a lack of data.
SYSTEM CHANGES DURING PROJECT Several minor but important changes were made in the system based on experience with system operation and problems encountered. These changes are noted below with further explanations provided in the following chapter, which discusses system performance. § Change in Sites–Initially, Main and Brooks Streets grade crossings were equipped with gate
monitoring. It was found that Brooks, Main, and Wood track circuits were essentially identical, therefore, Brooks and Main were eliminated from the system. Industrial was added to the system as it was a primary five route.
§ CDPD Antenna–Initially, all sites were equipped with omni-directional antenna. It was found necessary to change to Yagi directional antennas at the five Doppler radar sites to provide a stronger signal.
§ Surge Protection–Surge protection devices were installed in all field cabinets to resolve problems with power surges during electrical storms.
§ Kiosk Screen–It was found that standard City of Sugar Land software network suite (used on the three kiosks) included a setting which caused the kiosks to go into “sleep mode” after 10 minutes of inactivity. This setting was modified to provide continuous viewing of the rail monitoring system.

16
4. SYSTEM PERFORMANCE AND USAGE This project developed a unique system to monitor and project train movements in a highway-rail corridor. It was deployed as a demonstration project to assess how well the monitoring system performs, to gain insights into how the system is used, to identify “lessons learned,” and to suggest potential future directions for the Sugar Land demonstration project. SYSTEM PERFORMANCE The rail monitoring system was assembled using a number of available, proven components including Doppler radar, microcontrollers, modems, and computers and using wireless communications. However, the system was assembled in a special-purpose field application which had not been previously utilized. A full year’s experience with system and component problems is summarized in Table 3.
Overall performance of the system was considered good with approximately six percent down time of individual monitoring sites. Most of the system outages relate to two primary problems: power surges and wireless communication services. Both problems were addressed during the course of the project, with only the problem of intermittent CDPD service remaining (and that primarily at one location). In addition, a viewing problem with the three kiosks developed, but was corrected. Each of these three system-related problems is discussed in the following sections. CDPD Service To successfully transport data over the CDPD network, a cellular signal must be acquired and then maintain a certain Received Signal Strength Indication (RSSI). If the RSSI value drops below a certain threshold, the modem disconnects from the network and any data packets sent to the modem during the
System ComponentGrand Parkway
Prison Road
SH-6 Ulrich Wood Eldridge IndustrialDairy-Ashford
KirkwoodTotal and
Percent1
CDPD Total 6 10 0 11 2 4 60 1 0 94 (2.9%) Network Provider Full Outage 0 3 0 0 2 0 0 1 0 6 Intermittent Outage 6 7 0 11 0 0 60 0 0 84 Other 0 0 0 0 0 4 0 0 0 4Field Microcontroller Total 0 0 18 1 4 0 0 0 0 23 (0.7%) Power Surge Related 0 0 18 0 0 0 0 0 0 18 Other 0 0 0 1 4 0 0 0 0 5Radar Total 0 not installed 13 13 not installed 1 0 not installed 13 40 (2.2%) Power Surge Related 0 0 13 13 0 0 0 0 13 39 Other 0 0 0 0 0 1 0 0 0 1Complete Power Failure 0 0 0 1 0 27 0 0 20 48 (1.5%)Totals 6 (1.6%) 10 (2.7%) 31 (8.5%) 26 (7.1%) 6 (1.6%) 32 (8.8%) 60 (16.4%) 1 (0.3%) 33 (9.0%)
Note: For period April 15, 2002 to April 15, 2003.1Percent of time of outage related to nine and five (radar) sites over a period of 365 days; therefore, will not total same as percent by site.
Table 3. Sugar Land Outage Summary by Days

17
disconnect period are lost. As data are sent over a CDPD network, slight RSSI degradation can be expected. This is problematic at locations where the acquired cellular signal barely meets the minimum RSSI requirements and the rate of data transfer is continuous. A stream of data packets can cause the RSSI to degrade and force the modem off the network. In the Sugar Land corridor, this was evident at field sites equipped with train sensor equipment (Doppler radar). During a train event, the volume of data transferred would increase and therefore, force the RSSI below the required threshold and the modem off the network. Any data sent to the modem during this time period was lost. This occurred at sites with an omni-directional antenna. To gain a stronger signal, a directional Yagi antenna was installed at all field sites equipped with train sensors. The Yagi antennas are aimed towards the nearest cellular tower and therefore, allow the modem to concentrate the signal, providing a higher RSSI value that enables the modem to maintain its connection with the network. Another issue regarding CDPD is the registration of the modems within the cellular network. As a modem acquires a signal, it registers itself within the network. The registration process consists of the modem exchanging authentication information with the network provider using its Equipment Identifier (EID). Occasionally, the provider will reject the modem’s authentication request and prevent the modem from registering on the network. To remedy this issue, the network provider must manually reset the modem’s IP address in their system. Data is lost during the time period that the modem is unable to register. Finally, some of the communications outages were due to malfunctions with the network provider’s equipment. Network router malfunctions and cellular site equipment problems occurred on several occasions rendering communications at individual sites non-existent for periods of time lasting from several minutes to several days. Power Interruptions Initially, the field subsystem was installed without power surge protection equipment. During periods of lightning, various components of the field subsystem, including the Doppler radar, microcontroller, and CDPD modem, were damaged by power surges, in some cases, beyond repair. These electronic components were not field hardened and were found to be vulnerable to power surges. To help remedy this problem, a surge protection system was designed and installed in each of the field cabinets. In addition on several occasions, the external power to the field cabinet from the adjacent traffic signal cabinet went out. In these cases, power remained out at the site until the agency responsible for maintaining the signal cabinet was able to fix the problem. Kiosk Issues The remote kiosks, installed at two fire stations and police/fire dispatch, were intended to be “always on” systems that disseminate the corridor status information to users. Under normal operating conditions, the kiosk screens display the most current version of the rail corridor information. During a

18
period of the evaluation, the screens of the remote kiosks experienced a problem that caused the monitors on the kiosks to go “blank” after ten minutes of inactivity. Moving the mouse or touching the keyboard restored the screen, however, the kiosks were intended to provide personnel with information without user intervention. After several months of troubleshooting, the problem was traced to a network software module that was installed on the kiosks by Sugar Land’s Information Systems personnel after the initial system installation. The software was removed and the problem was resolved. SYSTEM USAGE The Sugar Land Rail Monitoring system is a demonstration project of a traveler information system with its application in Sugar Land oriented for use by the fire and police departments. An Internet web site was set up recently for the general public viewing of the rail monitoring information, linked from the Houston TranStar “traffic” web site. The Internet site for the general public updates automatically every three minutes, whereas displays on the City’s kiosks update every ten seconds. Dissemination of the information could utilize other forms, such as dynamic message signs, highway advisory radio, pagers, and in-vehicle devices. It is assumed this traveler information would be of value only to people or businesses close to the corridor. The system usage discussed in this section relates to usage experience of the City of Sugar Land. Fire Department Activity and System Usage The UPRR passes through two fire department districts, creating the need for Fire Stations 1 and 2 to make emergency runs crossing the UPRR tracks. The Sugar Land Fire Department provided incident logs for these two stations in order to better understand the relationship between emergency runs and the rail monitoring system. Emergency runs for the two stations over a six month period are summarized in Table 4. Each station made over 500 runs during this period, averaging 2.8 runs per day for each station. Of the 1,036 runs logged, 296 required crossing the UPRR tracks, nearly one third of the emergency runs. Of the emergency runs made by Fire Station 1, over 23 percent were across the tracks, while Fire Station 2 crossed the tracks on 34 percent of its runs.
Table 4. Summary of Fire Department Emergency Runs (June-November 2002)
Fire Station 1 Fire Station 2
Number of Runs Route Crosses Railroad Percent of Runs Crossing Railroad
516 121 23%
520 175 34%
Average Daily Runs 2.8 2.8
Average Daily Crossing Railroad 0.7 0.9
Source: Incident Log by Station, Sugar Land Fire Department.

19
Interviews were conducted with six station officers (three shifts) at Fire Station 1 and 2 with these interviews summarized in Table 5 and highlighted below. § Frequency of Use? – Varied by shift. Some appeared to use system several times per week,
acting on the information, while others seldom used the system. § Route changes based on information? – Varied by shift from once per week to none. § Best about screen? – Generally favorable comments about information supplied. § Screen improvement needs? – Scrolling needed to see all information. Screen does not show
trains on sidings. Make information larger and more readable. § Reasons for not checking train status? – Screen saver makes viewing take longer. Move
monitor close to ring-down printer. Fire unit may not be at station when dispatched. Learning curve in use of system.
§ Contact dispatcher for update during run? – Varied from none to twice per week. § Rating of confidence in system? – Most rated it 10 (on a scale of 1 to 10; 10 being best). § Other uses of information? – EMS might could use. Traffic Department could use more
detailed information on trains and blockages. § Does system provide adequate warning? – Yes. § Does system need to be lengthened? – Generally, no need to extend for City of Sugar Land
needs. Results of the survey indicate the system is understood and trusted, provides useful information, and the information is generally used when making emergency runs. Several comments were made suggesting improvements to the display of information. Several suggestions have been acted upon, including eliminating the need to scroll the screen for projection information and eliminating the screen saver.
Table 5. Interview of Sugar Land Fire Department Station Officers
Question Fire Station 1 Fire Station 2
1. Estimate how many times per week a fire response route conflicts with a train operation blocking the chosen route.
s Once per week. s Twice. s Not once since started.
s On one fire call (south of railroad), a train was noted on monitor and would block Industrial before fire engine could arrive. The station officer noted train speed and length and chose Industrial anyway (40 mph and 5000 ft). Did have to wait for train to clear.
s Once total time. s Two to three times.
2. Estimate how many times per week the response route is changed after observing or hearing information from the railroad status screen.
s Once per week. Do not try if route is or will be blocked for a few minutes by gate arm; have dispatch call #2.
s Seldom; once or twice in entire time. s At no time has this situation occurred.
s Once in the last week. Two trains were involved Industrial over to Gillingham.
s Once total time. s None.

20
Table 5. Interview of Sugar Land Fire Department Station Officers
Question Fire Station 1 Fire Station 2
3. What do you like best about the railroad status screen?
s Good color contrast (blocked crossings in red).
s Everything (speed, direction) is there on the screen, but the observer has to think about the blockages based on direction.
s Indicates train speed, direction, and length of train.
s Renders all conditions in one glance. s Theory is good. On a limited number of
routes, it shows a train but no speed or directions. (All data on one screen is there but have to scroll down to uncover.)
s There have been in the past train accidents where Fire Unit #2 has to “go around” to get to the scene on the south side. Only one adequate route (Dairy Ashford and Industrial).
4. What do you dislike about the railroad status screen?
s Does not show trains on the siding track. s It is okay; just have to remember to
check before leaving station house. s Nothing.
s GUI does not place all information on one screen (have to scroll down to see projection and clearances).
s Scrolling is problem at fire call. s No comment (it is not a necessity).
5. Does railroad status screen provide information that is useful to you on your fire runs?
s Yes, train length and speed will cause decision. Also, knowledge of the siding track train.
s Yes. s No.
s Yes, two trains were involved as in #2 answer.
s Yes. s No.
6. What are the reasons you may not check the railroad status screen when starting or making a fire run?
s Screen saver causes blank screen; move monitor and printer closer.
s If the fire location is north of tracks, forget screen.
s All personnel are outside or fire unit already in the field.
s Remembers because of multi signs in station house. Responding to a fire call when outside of the station house (no one is left in station house; everyone goes).
s It has been a learning curve (station officer was out for 4-5 weeks). If a fire unit has already committed, train information of no help.
s Already “out in the field”; likes monitor position.
7. What do you suggest be done to improve the train information or the screen presentation on the railroad status screen?
s Show all rail tracks, projection time frames, and speed large on screen so as to be readable.
s Change screen; when train is near crossing make the “red” larger and train information larger (for better, faster sighting).
s No improvements.
s None. Not really, maybe ask the fire dispatcher for rail crossing conditions.
s Enlarge current location of train along with speed and direction.
s No changes.
8. Estimate how many times per week a fire chauffeur asks the dispatcher for the train status while making the run.
s The station officer makes the route(s) decision; about twice per week based on seasonal activities.
s Not done as of yet. s None.
s Twice in the last month. s Twice have checked with dispatch. s None.
9. On a scale of 1 to 10 (with 10 begin the highest level of confidence), how would you rate your confidence in the information on the railroad status screen?
s 10. Information has been tested and is very accurate.
s 10 s 10. If shift is able to use information; if
so, should be okay.
s Not really thought about it; maybe an 8. s 8 s 10

21
Table 5. Interview of Sugar Land Fire Department Station Officers
Question Fire Station 1 Fire Station 2
10. What other uses do you make of information from the railroad status monitor?
s Can get the identification of train, speed(s), and where train is headed.
s Train speed and direction yields which crossing will be opened first.
s None.
s EMS could utilize information but EMS on different channels. Unknown if EMS uses GUI. Most calls are north of railroad. The Traffic Department of Sugar Land would like to have this additional information: number of trains per day; number of trains per peak traffic periods; number of blockages; percentages/average blockage time by hour; give general public a proactive feeling for City’s efforts with answers; and peak period traffic control could be helped by fewer trains during 6:00-9:00 and 4:00-7:00, especially at 9:00 and 6:00.
s When other “companies” (fire units) are added the train locations will be needed.
s None. The length of the train could be used for clearance.
11. Does the current railroad status system provide adequate advanced warning of street blockages?
s Adequate. s Yes, it does. s It can be but no opportunity as of now.
s Yes. s Yes. s Yes.
12. Do the current endpoints of the detection system need to be expanded?
s No extensions. s No further help is need; adequate
coverage. s Adequate.
s East of Kirkwood would be no benefit since it is somewhat difficult to travel from Station #2 to Kirkwood. Few times this has happened. Since Grand Parkway has no preempt, the next site is Harlem Road which reaches into unincorporated area.
s Yes, expand east of Kirkwood. No, do not expand west of Grand Parkway.
s No.
Fire and Police Dispatch Structured interviews were also conducted with four police and three fire dispatchers located at the dispatch center. The interviews are summarized in Table 6 and highlighted below. § Ease of use? – Easy for all. Screen saver not favored. § Times per week train conflicts with response route? – Varied from not often to three to four
times per week. § Times per week you advise units of conflict? – Varied up to six times per week with most
twice per week. § What best about screen? – Easy to read, can check citizen calls on gate status, and knowing
status of crossings. § Dislike about screen? – All dispatchers disliked screen saver (this corrected after City changed
programming of computers). § System provides useful information? – Most said yes.

22
§ Accuracy of information? – Responses indicate confidence in accuracy with some exceptions noted.
§ Suggest improvements in information? – No recommended changes. § How often officer/fireman in field requests train status? – Varied from rarely to twice a week to
every time fire run crosses tracks. § What other uses made of train information? – Verifies citizen calls on gate problem and power
problems. These interviews indicate the dispatchers had confidence in the system and utilized it to assist police and fire personnel in the field. Police dispatchers use the system to identify gate crossing problems and verify citizen calls about trains and crossing controls.
Table 6. Interview of Sugar Land Rail Fire and Police Dispatchers
Question Police Dispatch Fire Dispatch
1. Do you find the railroad status system easy to use?
s Yes, it shows when gate arms are down and a train in the system.
s Yes. s Yes. s Yes.
s Yes. s Yes. s Yes, except screen saver put monitor into
“dark” mode. At 6:00 am, the screen is always “dark.”
2. How many times per week are you aware of when a police/fire response route conflicts with a train operation blocking the chosen route?
s Unknown. s No idea. s 3-4 times per week. s Not often.
s No idea. s Station 1, none. Station 2, couple. s 2 out of 10.
3. Estimate how many times per week you advise police/fire units of a train conflict based on information from the railroad status screen?
s Twice in all weeks of service. s Twice per week. s Twice per week. s Not done; maybe once.
s None. s Station 2 only station asking, not sure of
answer. s Maybe 5-6 times per week.
4. What do you like best about the railroad status screen?
s Fun to watch trains pass through system. s Indicates intersection is blocked. s Easy to read; positioned where screen can
be seen; and provides an interface to Internet but gets “stuck.”
s Checking the screen to insure crossings clear when shift is over.
s Looks at screen before ending shift to insure train(s) are not blocking desired crossing.
s When citizens call about gate arms blocking crossing, can view screen for information.
s Being able to tell fire units if blockage(s) are occurring or will be occurring.
5. What do you dislike about the railroad status screen?
s Try to refresh screen but will not; have to manually reset screen.
s Screen saver blanks screen “a lot.” s Screen “freezes” (goes blank) and have to
get up and move mouse. s Nothing.
s Blank screen when train information is needed.
s Monitor’s screen goes into “sleep mode” and the mouse must be moved before train scene is renewed.
s Losing screen.
6. Do you feel the railroad status screen provides useful information?
s Sometimes. s Yes. s Yes. s Yes.
s Yes. s Yes. s Yes.

23
Table 6. Interview of Sugar Land Rail Fire and Police Dispatchers
Question Police Dispatch Fire Dispatch
7. Has the information on the screen been accurate?
s Sometimes shows gray or red on screen, but when I do drive by arms are not down.
s Yes. s Yes. s Yes.
s Not all the time; sometimes all red, gray. s Yes, for the most part. s Yes, except the Ulrich/Wood all red but no
crossing blocked.
8. What do you suggest be done to improve the train information or the screen presentation on the railroad status screen?
s No idea. s Have intersection blockage known before
train’s arrival. s Okay as is. s Fine as is.
s Nothing. s Okay as is. s Fine as is.
9. Estimate how many times per week an officer/fire personnel in the field asks for the train status just before or in the process of responding to a call.
s Usually do not. s Average two times per week. s Once. s None.
s Once. s Every time Station 2 has to cross tracks,
will call Fire Dispatch for up to date information (train status).
s Rarely.
10. What other uses are made of the railroad status screen (besides emergency use)?
s If a citizen calls about “gate arms are down,” the screen serves as a conformation of what is in the field.
s Use when a malfunction occurs. There are more PD south, north crossings than north, south per week.
s I check if someone calls about gate arms malfunctioning; can use rail image to confirm.
s Lost power last week; some gray and some red, but something was wrong.
s Nothing. s It tells police units when there is a
malfunction of gate arms. s Fire runs knowing crossing(s) blocked.
When gate arms are down, there is verification via the screen.
11. What other thoughts or comments do you have about the system?
s None at this time. s No additional ideas. s Okay as is. s It is okay as is.
s None. s Great except for screen saver blockage(s). s No further comment(s).
General Public Late in the project, an Internet site identical in appearance to those of the fire and police kiosks was activated for use by the general public. In July 2003, the Sugar Land Rail Monitor received over 40,000 page impressions from over 3,800 unique visitors. The following comments have been received by visitors to the web site. § “WAY TO GO! COOL stuff you’ve done with UP! As a Meadows Place parent with kids
driving to Dulles junior high and senior high and neighborhoods beyond 90A, you know when the trains are coming. As a supply chain solution maker for Hewlett Packard, I may, and many other folks might not realize the importance of having a major railroad lane going through their city. Solutions like this allow us to have cheap goods and jobs as well as way for residents to bystep the train traffic too. Keep up the great ideas! Move it on way east. I grew up at Telephone and Griggs.”

24
§ “I just saw on the site that the sugarland train route is listed. Is there a place I could see the train status that crosses richmond, westheimer and san felipe?”
§ “Can you move the Rail Monitor East to include Stafford? Murphy Road (FM 1092) is pretty bad at times!”
§ “It would b helpful if an arrow pointing north can be placed on the map. Initially it is difficult 2 tell which way is “north”.”
§ “Trains move fast. Set the page to auto refresh more often if your server and connection can handle it!”
Hazmat Truck Incident A dramatic incident involving the rail monitoring system occurred as this report was being prepared. This incident illustrates how the rail monitoring system can, with one major incident, justify the development and cost of the monitoring system. The following quotation is from a description of the incident as provided by Mr. David Spilman, Public Safety Communications Supervisor for the Sugar Land Police Department.
On 7/23/03 at 7:11 am this Communications (Center) was notified that there was a truck stuck on the tracks in front of Nalco. The police and fire dispatcher immediately noticed on the Railroad Monitor that there was a train west bound from the City Limits of Sugar Land at 44 miles per hour. The fire dispatcher immediately contacted the railroad tower. The railroad recommended that this department put out flares about a mile before the blocked intersection and that they would attempt to close down the train. Units were immediately dispatched to the scene as well as a call broadcast to units to put a flare on the tracks to shut down the train. Unfortunately there were no units close to the area. Quality Wrecker who was in the area did manage to put flares on the track to shut down the train. In communications the railroad monitor continued to be monitored to tell officers the location of the train as it approached the truck holding extremely hazardous chemicals. Because of Quality was able to signal the train to stop it was stopped just past Ulrich and it avoided the collision. The truck contained Sodium Hydroxide. The hazardous materials book indicates that in cases of spill of this chemical an area with a 800 meter radius should be evacuated. Had it not been for the Railroad Monitor located in communications, and quick actions by the communications personnel. The situation described above could have been not only devastating but possibly fatal. The Railroad monitor installed by the Texas Transportation Institute proved to be invaluable and just this incident would have more than paid for any expenses incurred in this project.
25
5. FINDINGS AND FUTURE DIRECTIONS This project has demonstrated the ability to monitor train movements in a corridor, and the usefulness of this information to the City of Sugar Land. The following discussion summarizes project findings and potential future directions for the Sugar Land system and future deployment of new rail monitoring systems. SUMMARY OF FINDINGS The following highlights findings, which are discussed in more detail in previous sections of this report. § AVI-Based System–Preliminary tests indicate this to be a technically viable means of
monitoring train movements; however, it will likely require cooperation of railroad companies in deploying portions of the system on railroad right of ways. In addition, system costs are higher than for a Doppler radar system.
§ The Doppler radar-based system developed in Sugar Land has evolved into a very stable, reliable operating system for detecting trains and projecting the movements in the corridor.
§ City fire, police, and public works personnel find the system to be useful in making emergency runs and for verifying the status of crossing protection equipment.
Capabilities In developing, modifying, and evaluating the rail monitoring project, the system was found to have robust capabilities as summarized in the following. § Accurate speed, direction, and length of train measurements at five Doppler sites. § Projections of train arrival/departure at downstream grade crossings. § Positive measure of train presence where active crossing protection circuits are provided by the
railroad for traffic signal preemption. § Ability to monitor and project multiple trains in system. § Easy-to-use information display on user kiosks.
Limitations Some limitations are based on those of the monitoring system itself, while others relate to limitations created by the physical configuration of the railroad facilities (i.e., sidings and passing track), as follows.

26
§ The passing track between Ulrich and Grand Parkway allows trains to “disappear” from the system as they slow or stop for other trains to pass. They reappear (as a new train) when they move past a Doppler radar site.
§ Activity (infrequent) from/to the two sidings can cause short “train events” to appear and disappear from the system.
§ Gate circuit monitoring data is not used in verifying and updating projections. Future system refinements could integrate this information into the train projection algorithm.
§ CDPD communication occasionally lost at individual sites and no ability to recover lost data. § Slow trains (less than 10 mph) can give erratic data. § Trains moving simultaneously on main track and passing track can give erratic information (as
both pass same monitoring site). § Brief time windows for viewing kiosk and understanding information as fireman answer fire
alarm; i.e., criteria for leaving station within 60 seconds of alarm. A number of these limitations are specific to the Sugar Land location, but give an indication of the need to make a careful review of physical and operational characteristics in considering future deployments. POTENTIAL FUTURE APPLICATIONS Experience with the Sugar Land system provides insights and guidance in deployment and design of future railroad monitoring projects. Deployment Considerations It is particularly important to understand both the rail and street characteristics in determining if a rail monitoring system could be beneficial. These include location and operation of rail sidings, passing operations (if any), train makeup, operating speeds, and number of daily train operations. In addition, the number and characteristics of highway-rail grade crossings and area traffic demand and operations are important in assessing potential design needs and benefits. It is also important to review operational characteristics of emergency service organizations (as in the Sugar Land project), particularly the magnitude of movements across the railroad tracks, if the system is to serve emergency services. Integration with Mobile Data Terminals Emergency vehicles are often equipped with a Mobile Data Terminal (MDT), which is the case for City of Sugar Land fire and police vehicles. These wireless on-vehicle communication devices are currently used to convey text messages between the dispatch center and the field. City of Sugar Land staff indicated that transmitting train status and projection information into emergency vehicles could enhance the usefulness of train monitoring information.

27
Integration with the MDT system would be a desirable feature on future rail monitoring systems to be used by emergency service organizations. Sufficient bandwidth and MDT capability would be necessary to handle the graphic data of the train monitoring system. Traveler Information Dissemination of train monitoring information was limited to City of Sugar Land agencies in this demonstration project. However, traveler information devices could be used to provide broader dissemination, such as dynamic message signs (DMS) and highway advisory radio (HAR), located at route decision points in the rail corridors. Pager and email systems alerting agencies, businesses, and individuals could advise of train activity. An Internet web site was implemented in June 2003 for broad dissemination of the Sugar Land rail monitoring system with a link to it placed on the widely-used Houston TranStar “traffic” web site. Integration with Traffic Signal Systems Future refinement of the rail monitoring concept could provide integration with traffic signal systems in the rail corridor. Such an integration could utilize algorithms to temporarily adjust traffic signal timing to minimize the impact of passing trains at crossings adjacent to signalized intersections. In the case of Sugar Land, the UPRR abuts the right of way of US 90A, a major arterial roadway in Sugar Land. Movements adjacent to and on the cross street are impacted by trains blocking the cross street, while initiating a preemption sequence in the traffic signal. TxDOT has programmed a research project to investigate integration of rail information into traffic signal operations. Title of this two-year project is Non-Vital Rail Preemption of Signalized Intersections Near Highway-Rail Grade Crossings, and project is expected to begin September 1, 2003. FUTURE OF SUGAR LAND SYSTEM The Sugar Land rail monitoring project was developed and evaluated as a Priority Corridor demonstration project. With the demonstration project complete, TxDOT and the City of Sugar Land will determine its future direction. The field installations were not developed for long-term use, with small cabinets and crowded equipment and wiring. For long-term use of the system, it is considered desirable to migrate the field installation into larger, better organized cabinets. Diagrams are included in the Appendix illustrating recommendations for wiring and layout of the larger cabinet. A cost estimate (included in the Appendix) was developed that shows the cost for field equipment installation as currently deployed ($66,000), which can provide an order of magnitude basis for estimating costs for a new system. The Appendix table also provides an estimate of the cost ($36,000) to move the field equipment to new cabinets.

28
Future of CDPD New wireless technologies have made CDPD obsolete. Verizon Wireless, the provider in Sugar Land, has announced it will end its CDPD service at the end of Year 2005. Verizon and other wireless service providers are expected to develop wireless data networks to replace the CDPD service. No specific guidance has been provided by Verizon Wireless on the impacts of this change, but it is expected to result (at a minimum) in the need to replace current CDPD modems with modems related to the new technology used.

29
APPENDIX
RECOMMENDED FIELD EQUIPMENT FOR RAIL MONITORING PROJECT

30
Figure A-1. Recommended Cabinet Wiring

31
Figure A-2. Recommended Cabinet Layout

32
Item Brand/Model Unit Quantity Unit Price Extended Quantity Extended
12 Volt Power Supply Pyramid PS-4KX EA 1 45.00$ 45.00$ 0 -$ Filtering Surge Protection EDCO ACP-340 EA 1 120.00$ 120.00$ 0 -$ Lightning Protection EDCO PHC-020 EA 2 75.00$ 150.00$ 0 -$ CDPD Modem Airlink Redwing EA 1 475.00$ 475.00$ 0 -$ 9 Volt Power Supply EA 1 25.00$ 25.00$ 0 -$ Microprocessor Tiny Tiger EA 1 150.00$ 150.00$ 0 -$ Microprocessor Board TTI EA 1 100.00$ 100.00$ 0 -$ Relay EA 2 6.00$ 12.00$ 0 -$ Relay Base EA 2 6.00$ 12.00$ 0 -$ Power Cord for 9V Supply EA 1 5.00$ 5.00$ 0 -$ DB9 Connectors EA 2 10.00$ 20.00$ 0 -$ Cabinet Fan - 150VAC EA 1 15.00$ 15.00$ 1 15.00$ Cabinet (TxDOT Flasher Cabinet) EA 1 350.00$ 350.00$ 1 350.00$ YAGI Antenna EA 1 95.00$ 95.00$ 0 -$ YAGI Coax LF 15 0.50$ 7.50$ 0 -$ Aluminum Sheets for Back Plates SF 2 10.00$ 20.00$ 1 10.00$ Terminal Block (10's) EA 5 5.00$ 25.00$ 0 -$ YAGI Antenna Surge Suppressor EA 1 80.00$ 80.00$ 0 -$ Misc - Antenna/Modem Connectors - 1 60.00$ 60.00$ 1 60.00$ Misc - Terminal Block Connectors - 1 10.00$ 10.00$ 1 10.00$ Misc - Standoffs, connectors - 1 50.00$ 50.00$ 1 50.00$ Circuit Breaker - 20A EA 1 30.00$ 30.00$ 1 30.00$ Doppler Radar EA 1 650.00$ 650.00$ 0 -$ Wire (#6, #10, #14, #16) - average LF 60 0.50$ 30.00$ 60 30.00$ Miscellaneous Cost LS 3% 76.10$ 3% 16.65$
Total Cost: In-Cabinet and Electronics (Complete Install) 2,612.60$ 571.65$
Cost Estimate for Wiring CabinetLabor - TTI MH 16 65.00$ 1,040.00$ 16 1,040.00$
Field InstallationMobilization LS 15% 391.89$ 15% 391.89$ Labor - Electric Contractor HR 6 300.00$ 1,800.00$ 4 1,200.00$ Misc Conduit/Wiring LS 1 500.00$ 500.00$ 0.5 250.00$
Total Labor and Miscellaneous Installation Costs: 2,691.89$ 1,841.89$
Total Cost for Cabinet Installation: New: 6,344.48$ Modification: 3,453.54$ Contengency (15%): 951.67$ 518.03$
For 9 Sites (with contengency): System: 65,665.41$ System: 35,744.13$
Note: Estimate includes field equipment only and does not include computer hardware and software.
Cost Estimate - Cabinet Replace and Modification
Cost Estimate for Cabinet (Complete)
Sugar Land Rail Monitoring SystemEstimated Cost for Field Equipment