raid/vol6/convert/981646/00001 - nehrpsearch.nist.gov · The following brief discussion of the...
20
DAJ.VJPING MEASUREMENTS OF TALL S'rRUCTURES by George T. Taoka University of Hawaii at Manoa D:;parbnent of Civil Ehgineering 2540 Dole Street HOnolulu, HI 96822 REPRODUCED BY NATIONAL TECHNICAL INFORMATION SERVICE u.s. DEPARTMENT Of COMMERCE SPRINGfiElD, VA 22161 Grant Number ENV75-16926 i'laHer,"! 'A f NSF/RA-800613 PBfl2-1 41 83A
-
Upload
truongkhuong -
Category
Documents
-
view
214 -
download
1
Transcript of raid/vol6/convert/981646/00001 - nehrpsearch.nist.gov · The following brief discussion of the...

DAJ.VJPING MEASUREMENTS OF TALL S'rRUCTURES
by
George T. Taoka
University of Hawaii at ManoaD:;parbnent of Civil Ehgineering
2540 Dole StreetHOnolulu, HI 96822
REPRODUCED BYNATIONAL TECHNICALINFORMATION SERVICE
u.s. DEPARTMENT Of COMMERCESPRINGfiElD, VA 22161
Grant Number ENV75-16926
i'laHer,"!'Afa5ir~in~;';,"~; i-~v,
NSF/RA-800613
PBfl2-1 41 83A


50272 -101
REPORT DOCUMENTATION 11. REPORT NO.
PAGE NSFjRA-8006134. Title and Subtitle
Damping Measurements of Tall Structures
7. Author(s)
G.T.Taoka
3. Recipient·s Accession No.
,'~TI~ 1 I¥ l' 8J 3 65. Report Date
1980
6. 0081978. Performin&: Organization Rept. No.
10. Project/Task/Work Unit No.
u. Contract(C) or Grant(G) No.
9. Performin&: Or&:anization Name and Address
University of Hawaii at ManoaDepartment of Civil Engineering2540 Dole StreetHonolulu, HI 96822
(C)
(G)ENV7516926
----------- _.
12. Sponsorin&: Organization Name and Address
Engineering and Applied Science (EAS)National Science Foundation1800 G Street, N.W.Washington, DC 20550
15. Supplementary Notes
Submitted by: Communications Program (OPRM)National Science FoundationWashi ngton, DC 2~~g _
13. Type of Report & Period Covered
Fi na1
14.
. --.._.------------116. Abstract (Limit: 200 words)
Results of an investigation of damping measurements of five tall steel structures arepresented. The structures include four buildings ranging in height from 103 to 170meters, and a four-legged square tower of a total height of 333 meters. For eachstructure, ambient vibration records were mechanically digitized and analyzed bythree system identification methods: the correlation method, the spectral momentsmethod, and the power spectral density method. A trapezoidal filter was used toisolate individual modes before the records were subjected to analysis. Dampingestimates were also obtained under forced vibration rotating shaker tests. Theseestimates appeared to be consistent with those obtained under ambient conditions forfundamental modes of vibration. Considerable variations were present when dampingratios for higher mode estimates were compared.
1--------------------------------------------------117. Document Analysis a. Descriptors
Earthquake resistant structuresCorrelationSpectral energy distributionSteel structures
b. Identifiers/Open-Ended Terms
G.T. Taoka, jPI
c. COSATI Field/Group
18. Availability Statement
NTIS
(See ANSI-Z39.18)
Random vibrationVibration dampingSkyscrapers
19. Security Class (This Report)
20. Security Class (This Page)
See InstructIons on Reverse
21. No. of Pages
22. Price
OPTIONAL FORM 272 (4-77)(Formerly NTIS-3SlDepartment of Commerce


NSFjRA-800613
DAMPING MEASUREMENTS OF TALL STRUCTURES
George T. Taoka*, Member, ASCE
ABSTRACT
The results of an investigation of damping measurements of fivetall steel structures are presented. The structures include four tallsteel buildings ranging in height from 103 to 170 meters, and a fourlegged square steel tower of tatal height 333 meters.
For each structure, ambient vibration records were mechanicallydigitized and analyzed by three system identification methods: thecorrelation method, the spectral moments method, and the power spectraldensity method. A trapezoidal filter was used to isolate individualmodes before the records were subjected to analysis.
In addition to estimates from random vibration data, damping estimates were also obtained under forced vibration rotating shaker tests.These estimates appeared consistent with those obtained from abientdata for fundamental modes of vibration. However, considerable variations were present when damping ratios for higher modes were compared.
I. THE COHREU.TION £.i"ETHOD
The theoretical basis for the use of the correlation function toestimate structural response parameters has been reviewed by Cherryand Brady [1]. A detailed discussion of the use of this method toestimate damping is available in a report by Taoka and Sca..711an (10].The following brief discussion of the general theo~J involved is ta..~en
from Cherry and Brady [lJ, and is included here for completeness.
If h (or) is the system response function due to a unit impulseapplied at T ~ 0, then the relation be~ieen an input flli71ction x(t)~71d the resulting output response yet) is given by
y(t) =~ h(T) X(t-T) dTo
For a lightly damped sL71gle degree of freedom oscillator havinga natural circular frequency W &71d a small critical damping ratio ~
the system response function is defL71ed as
(1)
-Z;;WTh(T) = e sin [!l-Z;;2 WT],
w/I-l;2
It is assumed that h(T) = 0 for T < O.
T > 0
The autocovari2~c8 flli71ction for a function y(t) is defined by
*Professor of Civil Engineering, University of Hawaii at Manoa
1 Taoka

= lim 1T+:x> T
0< k < H
T
J2 yet) y(t+T) dt-T2
It can be shown that if the input function x(t) is composed·ofI1white noise ll with constant spectral density GO, that the output autocovariance function is given by
ITa [CyCT) = _0_ e-l;WT (cos /l-l; 2 WT
2l;w3
+ l; sin 11-£;;2 wT)l (4)Il-l/ . J
Equation (4) represents a cosinusoidal function with exponentialdecay. The decay of the envelope of the autocovariance estimate of theoutrut resnonse can thus be used to estimate the critical damning ratiol; of the system. rne unbiased autocovariance estimate of a time series{Yn} where n varies from 1 to N is given by
1 N-kCx(k) = N-k I YnYn+k'
n=l
The corresponding autocorrelogr&u esti2ate is given by
C (k)Ry(k) =etTor 0 < k < M (6)
y
In both Eqs. (5) and (6), the integer M, the maximua lag number,is kept small compared to N the number of.points in the series.
The logarithmic decrement method (lOJ was used to estimate thecritical damping ratio in each mode. The value is determined by
1 [AD ll;=-ln---2TIq A
p+qJ
where F'J is the peak arnplitude at cycle p and p])+q is the peak allJ.'Plitude q cycles later.
II. SPECTR6cL HOHE.:.'1TS HETHOD
In 1972, Vanmarcke [11] proposed a spectral moments method forestimating frequency and damping parameters of a randomly excitedsystem. The zeroeth order moment gives the area li..TJ.der the power spectral density fli..Dction. The first order moment is a function of itscentroid, fu~d the second order moment gives a measure of dispersionabout a spectral peak indicating a central frequency.
If y(t) is a stationary random process with zero mean value, itsautocorrelation function R(T) is defLDed by
R(T) =E [y(t) y(t+T)] (8)The !lone-sided!? Fourier Transform pair of formulas relating
G(w) and R(T) is given by
2 Taoka

(10)R(~) == ~ G(w) cos(w~) dwo
where G(w) is the "one-sided" power spectral density function of theautocorrelation function of the zero-mean process yet). The meansquare value <y(t)2> is obtained by setting ~ = a, in Eq. (10); giving
RCa) = ~ G(w) dw
°(11)
The spectral moments are
G(w) dw
G(w) dw == ~ G(w) dwo
AO = ~ WO
°Al =. (, w'
1..2 =- ~ w2 G(w) dw
°
(12)
(14 )
(16)
(15)
the follm{ing quantities related to the
Alw ::::-
1 >"2
w :::: IAJl/22 l:~
Note that wI and w2 as defined have dimensions of circular frequency. The parameter w2 will be directly related to Wn; the na~~al
circular frequency of vibration. The follOWing dimensionless parameter
Vanmarcke has introducedspectral moments above.
will be directly related to the percentage of critical damping s ofthe Vibrating system.
If x(t) is the input and yet) the output of a linear system;the relationship between x(t) and y(t) is given by Eq.{l); where heT)is the impulse response function of the system. The system transferfunction H(w) is defL~ed to be the Fourier transform of the impulseresponse f1L~ction h(T).
If Go(w) is the power spectral density function of the stationar-J"white noise n input x(t), a.'1d G(lD) is the output- spectral densityfunction, the equation defining these relationship is -
3 Taoka
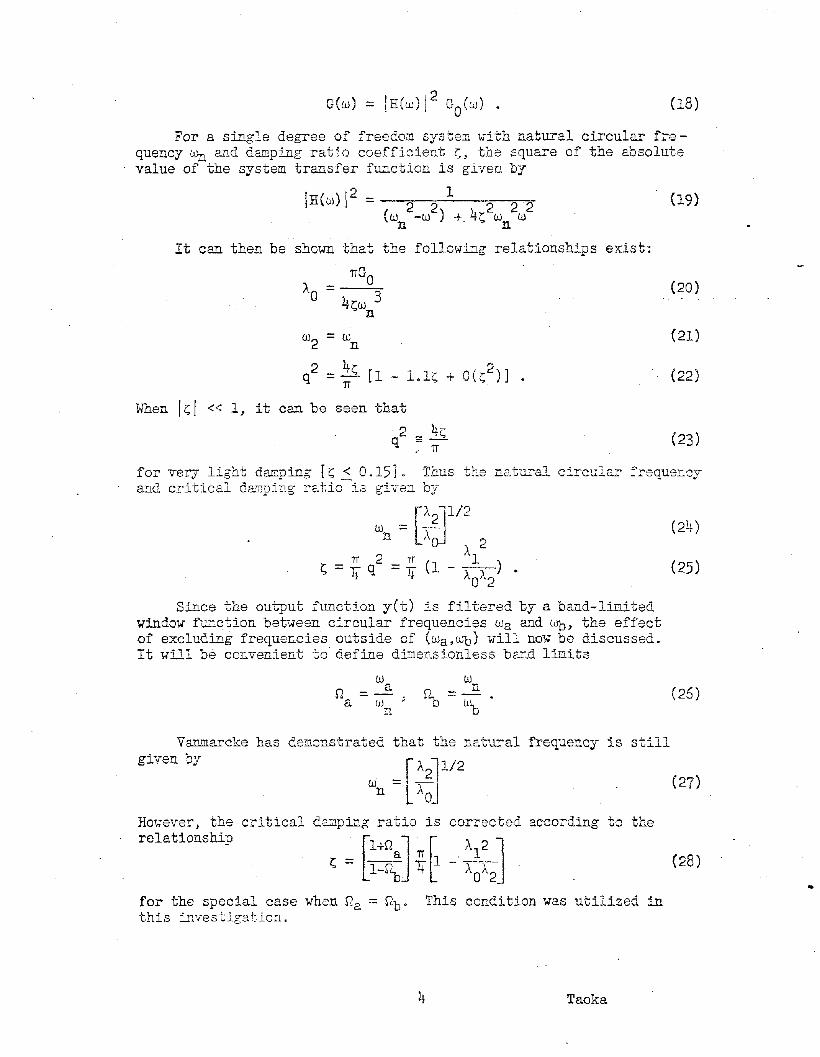
(18)
For a single degree of freedom system with natural circular frequency Wn and damping ratio coefficient 1;;, the square of the absolutevalue of the system transfer function is given by
!H(w)!2 = 2 2 1 2 2 2(wn -w ) + 4~ wn W
It can then be shown that the following relationships exist:
TIGOAO = 4z;;w 3
n
(20)
(21)
(22)
W2
= wn
q2 =~ [1 _ 1.ls + 0(s2)] .TI -
wnen 1~1 « 1, it can be seen that2 _ 4(,;
q = - (23), TI
for very light damning r1;; < 0.15]. TilUS the natural circular frequencyand critical dam.p~g ratio-is given by
w = [A~ll/2n Ao-l 2
Al;; = ~ q2 = +. (l __1_) •
'-t 't AO>"2
Since the output function yet) is filtered by a band-limitedwindow function between circular frequencies wa and ~o, the effectof excluding frequencies outside of (uJa,Wb) will now be discussed.It will be convenient to define dimensionless band limits
(24)
W
D =~a w
n
w_ n~-
~(26)
Vanmarcke has demonstrated that the natural frequency is stillgiven by
for the special case when Da = f2b . This condition was utilized inthis investigation.
However, the criticalrelationship
damping ratio is corrected according to the
, = b:~J i~ - :~~2] (28)
•
4 Taoka

III. POwER SPECTIU\L DENSITY HETEOD
This method is based on analyzing the power spectral density f~~c
tion of the response spectra. In the output power spectrum, the spectral density becomes maximum at a frequency w/1-2t;; 2 ~ and the dampiIIgcoefficient s can be calculated as follows, knowing the frequencies fland f2 where the spectral densities become l/A of its maximum.
z;: :; ~ (1 - i A2) (29 )
1.--lA-I
f 2 ~ 22 -II
A =------:f
2 ~ 22 +1 1
In practice, A = 2 is usually used for simplicity.
Equation (30) is derived from the power spectral density function
where
SoS (w) = --=-----::----,--~
( 2 2) 4r2 2 2 .Wo -w + s Wo W
This method has been used by Tanaka, Yoshizawu, Osawa, andMorishita [8] to estimate period and damping parameters of somebuildings in Japan.
The power spectral density function is defined as the FouriertransfoTQ of the true autocorrelation function derived from a vibrationrecord of ;nfinite leng~h of tiDe. ~ilien the length of the record isfinite, we cannot estimate the true autocorrelation function for arbitrarily long lags. In practical cases, therefore, we can only computethe so-called apparent autocorrelation function from a record ofrelatively short length. However, a good estimation of smoothenedvalues of the true power spectr~ can be obtained from the Fouriertransform of a modified apparent autocorrelation ~xrrction, which isthe product of the apparent autocorrelation and a suitable even function called the lag window.
In the present investigation, the so-called lhamming! type lagwindow eA~ressed by Eq. (32) was used.
for l-r! < Tmfor ITl > T
ill
where, T is a time lag and Tm is the maximum lag which we desire touse.
The corresponding frequency function is
W(w) = 0.54 WO(w) + O.23[WO(w + ; ) + WO(w - ; )] (33)ill ill
(34)sin wTmW(w) = 2T
ill uJTm
The smoothened spectral function is then expressed by
5 Taoka

p(u) = K [. __--::::--:::1_.--;::-2-::::2 [YO(u - ut)_0> (1 - u,2)2 + 41;; u'
+~ {YO(u - u' + 2flT ) + Y(u - u' - 2f
1T )}]du'
amOm
K=
where,
l.OSTmGO4!.Ln
sin w T (u-ul)y (U~Ul' = n mo I w T (u-u')
nmu =~w ~
nu· =~w
n
This method has been used by Kobayashi and Sugiyama [31 to estimate the structural dynamic parameters of the five structures investigated in this report. The results of this analysis are presentedlater.
TV. RECOFJ) DATA .A.}jlJ BUILDING DETAIlS
Data Collection Procedure
The vibration sensors used in this investigation were threehorizontal velocity meters manufactured by the Hosaka InstrumentCompany of Japan. The analog signals were subjected to low passfiltering effectively eliminating frequencies greater than 10 Hz.The resulting signals were then digitized at a constant L~verval of0.04 seconds, vhich gi.ves a N:Tquist frequency of 12.5 Hz. For theWorld Trade Center Building, a record length for each sensor ofapproxi~ately 6,000 points, or four minutes, was recorded on eachfloor. For the other t~Jee buildings, as veIl as for the TO~Jo Tower,4,500 points, or tDJee minutes of data, were continuously recorded.
The method for recording the ambient vibration data was the samefor all the structures, so the method will only be described in detailfor the World Trade Center Building. Data were collected on the 40thfloor (1st mode), 28th floor (3rd mode), and 16th floor (2nd mode) forthis bUildL~g. On each floor level, the three vibration sensors, wereplaced as shOwll in Fig. 2. Sensor #1 was placed at the geometriccenter of the cross section, facing North-South. Sensor #2 vas placedat the :Northern tip of the cross section, facing East-~·7est. Sensor #3also faced Es.st-;'7est, but was located at the Southern tip of the crosssection. Thus, if Yl (t) j Y2 (t) j and Y3 (t) T..rere the output from thethree sensors, the North-South, East-West, and Torsional responses weregiven by
YN_S(t) =yl(t) (36)
YE_W(t) =: 1/2[Y2(t) + Y3(t)] (37)
yT(t) = 112[y2(t) Y3(t)] (38)
The ambient responses for this building were subjected to a TraDezoidalFilter with passb~~ds of 0.363 Hz, 0.394 Hz, a~d 0.607 Hz for thefirst three modes, rspectively. Fi~~e 1 shows the details of theTrapezoidal Filter.
6 Taoka

Tokyo Forld Trade Center BuildL71g (HTC)
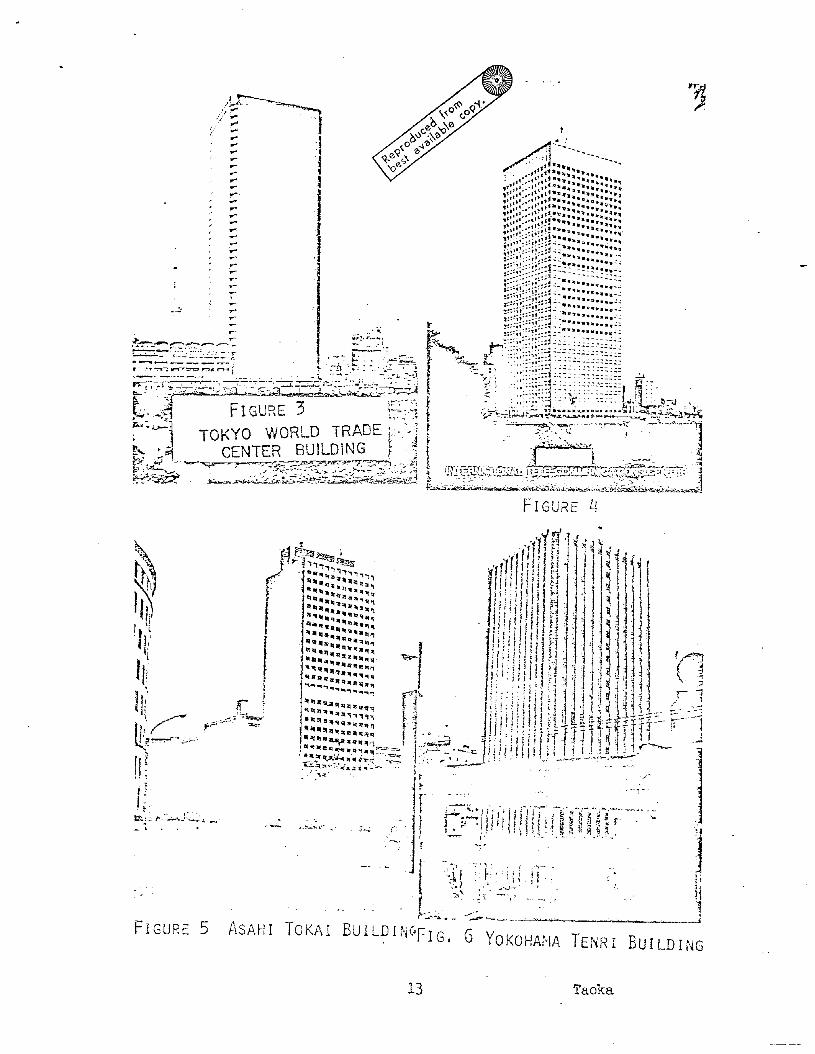
This building rises 40 stories to a height of 152.2 meters at rooflevel. A small structure on the roof raises the overall height to156.0 meters. The tower is a steel frame, almost symmetrical in planview, being 51.4 m (E-W) by 48.8 m (N-S) in cross section. rne areaof a typical floor is 2,458 m2. Details of the building are given inFigs. 2 and 3. Vibration tests on this structure have been reportedby Muto [4].
International Tele-Co~~icationsCenter (ITC)
This building is a steel frame which rises 32 stories to a heightof 170 meters. It is almost square in plan view, with plan dimensions51 m by 54 m. Its structural framing consists of closely spacedcolumns lying on the perimeter of the cross section. Its vibrationalcharacteristics and design features have also been reported by Muto [5J.Records were taken from the 32nd floor for the fundamental modes andthe nth floor for the other modes. Its details are shown in Fig. 4.Asahi Tokai Building (ATB)
The Asahi Tokai Building is a steel frame 30 storj high-risestructure with a total height of 119 ill. There is a concrete foundationof three floors below ground level. It is essentially square in crosssection, with plan dimensions 36 ill by 35 m. Each tJ~ical floor has across sectional area of 1,249 m2 . Its dJTamic characteristics are described by lchir-ose [2J. Its stD~ctllral details are sho~TI h71 Fig. 5.Data for this building were t~~en on the 22nd and 14th floors.
Yokohama Tenri Building (TIB)
The last building studied in this investigation is also a steelframe whose cross section is perfectly square, beLlg 21 meters cn eachside. Its structural framing system consists of a lltube in tube!!design. It consists of 27 stories and rises to a height of 103 ~.
There are also three basement floors below ground level. Its structur'al details are shown in Fig. 6. Vibration test for this buildingare described in a report by Tamano [7]. P~bient data were recordedon the 27th, 20th, and 13th floors.
Toh.70 Tm.rer (TT)
As can be seen in Fig. 7, the To~yo Tower is ~~ isolated freestanding steel-framed tower composed of two parts; a prLmarJ towerwith a height of 253 ill and another one of a height of 80 m beingadded on the top of the former. The latter tower may be divided intotwo parts, i.e., the super-gain-anter~71aof 60 ill in height and thesuper-turn-anterilla of 20 m in height. Thus, the total height of thetower is 333 ill above grolh~d level. The design of this tower, as wellas its dynamic response to vibration test and under typhoon canditions 2
has been reported by Naito, Nasu, Takeuchi, and Kubota [6].
7 Taoka

v. COMPARISON OF Dft~~ING R~TIO ESTn~.TES FROMDIFFERENT HETHODS OF ANALYSES
In this section, parameter estimates for the four buildings obtained from the Correlation, Spectral moments, and Spectral Densitymethods of analysis will be compared. The estimates from the SpectralDensity Method were calculated by Professor Riroyoshi Kobayashi, withthe aid of graduate student Nao Sugiyama [3]. It should be notedthat each estimate was obtained from the same ambient vibration record,subjected to a Trapezoidal Filter. Thus any differences in thesevalues would be solely due to the different method used to analyze thedata. Forced vibration estimates frem three structures are alsoincluded in the results.
Horld Trade Center (TtlTC)
The average values for the natural frequencies obtained from theseanalytical methods are 0.281, 0.861, and 1.60 Hz for the North-Southdirection, and 0.284, 0.870, ~~d 1.61 Hz for the East-West direction.The first ~~o Torsional frequencies are 0.350 and 0.977 Hz. The corresponding forced vibration natural frequency estimates for the translational modes are 0.318, 0.980 and 1.82 Hz for the North-South direction, and 0.315, 0.990, and 1.85 Hz for the East-West direction.
The critical damping ratio estimates are shoun in Table 1. Thelast coluGIn in Tables 1 through 5, labeled sm Ratio, are the signal-to-noise ratios present in the data record fro~ which the modaldamping estiDates were calculated.
. Table 1CRITICAL DAHPING R.lI..TIO (~n) FOR HTC B1TiLDDTG
Filtered Spectral Spectral Forced SINHade Correlogram Homents Density Vibration Ratio
N-S First 0.0094 0.0070 0.008 0.007 32.8N-S Second 0.0116 0.0072 0.008 0.013 17.3N-S Third 0.0183 0.0152 0.016 0.014 6.9E-W First 0.0100 0.0096 0.014 0.009 19.9E-W Second 0.0096 0.0104 0.014 0.013 16.4E-~l Third 0.0108 0.0094 0.025 0.015 17.3Torsion First 0.0128 0.0119 0.008 22.2Torsion Second 0.0138 0.0116 14.5
The correlation curves for the first three North-South modes areshow~ in Fig. 11. The corresponding forced vibration frequency curvesfor the same three modes are shown in Figs. 8, 9, and 10. Furtherdiscussion of these curves are presented in an NSF report by Taoka [91.International Telecommunications Center (ITe)
The system identification estimates are 0.324 and 0.955 Hz forNorth-South, and 0.314 and 0.929 Hz for the East-West directions,respectively. The first two torsional estimates are 0.413 and 1.05 Hz.The corresponding critical damping ratio estimates are listed inTable 2,
..
8 Taoka

Table 2CRITICAL DAl'1PING RA.TIO (sn) OF IIC BUILDING
Filtered Spectral SpectralCorrelogram Moments DensityMode
N-S FirstN-S SecondE-W FirstE-W SecondTorsion FirstTorsion Second
0.00500.00700.0112·0.00600.00760.0144
0.00480.00570.01150.00600.00910.0118
0.0040.0070.0090.0060.0050.013
SINRatio
47.222.323.022.826.39.9
As~hi Tokai Building (ATE)
The system identification estimates are 0.380 and 1.14 Hz for thefirst two Harth-South directions. The fundamental East-West estirrtateis 0.387 Hz, and the fundamental Torsional estimate is 0.389 Hz. Thecorresponding forced vibration estimates are 0.434, 1.27, 0.436, and0.562 Hz. The critical damping ratios for ATB Building are ShOIID inTable 3. The signal-to-noise ratios are generally small, Ifith theexception of the fundamental North-South mode.
Table 3CRITICAL DP..HPING RATIO (sn) FOR ATB BUILDING
Filtered Spectral Spectral Forced SiNHode Correlogram l-foments Density Vibration P.atio---
N-S First 0.0052 0.0072 0.026 0.009 26.7N-S Second 0.0209 0.0165 0.013 0.012 7.8E-\·J First 0.0455 0.0287 0.024 0.009 7.8Torsion 0.0473 0.0271 0.0073 7.7
Yokohama Tenri Building (TIB)
SIlTRatio
SpectralDensityMode
The system identification estimates are 0.460 and 1.32 Hz forNorth-South, 0.461 and 1.33 Hz for East-West, and 0.602 ana" 1.57 Hzfor Torsional modes. The damping ratios are listed in Table 4.
Table 4CRITICAL DAHP DTG fuWIO (sn) OF YTB BUILDING
Filtered SpectralCorrelogram Moments
N-S FirstN-S SecondE-W FirstE-\ol SecondTorsion FirstTorsion Second
0.00740.00730.01290.00910.01250.0175
0.00750.00590.01030.00740.00900.0173
0.0050.0050.0060.0130.0030.014
24.514.519.110.513.86.5
The Tok)ro Tower (TT)
Since the TohJTo Tower is symmetric in both North-South and EastWestdirections J only the North-South and Torsional modes ,rere analyzed. The natural frequency est~~ates for the three North-South modesare 0.358, 0.594, and 1.25 Hz, with Torsional frequency estimates of1.44 and 2.04 Hz. The forced vibration estimates for the translational
9 Taoka

modes were 0.377, 0.645, and 1.28 Hz. The damping estimates are shownin Table 5.
Table 5CRITICAL DAHPING RATIO (sn) OF TOKYO TOI-lER
Filtered Spectral SINMode Correlog-ram Homents Ratio
N-S First 0.0078 0.0109 29.1N-B Second 0.0082 0.0062 13.7N-B Third 0.0010 0.0011 78.4Torsion First 0.0025 0.0021 41.3Torsion Second 0.0020 0.0019 29.1
VI. CONCLUSIONS
The signal-noise (S~~) ratio was found to have significant effecton the resulting accuracy of damping ratio estimates obtained in thisstudy. Therefore, these ratios were listed in Tables 1 through 5.They measured the ratio of peak amplitude to the average noise amplitude in a region of 0.05 Hz on both sides of a natural frequency estimate. Generally speaking, damping estimates were accurate when theSIN ratio exceeded 15, but were ULU'eliable when the S~J was below 10.The region 10<S/N<15 was a Trgray area fT where no definitive statementcould be made about damping accuracy.
For fundamental modes of vibration, all three methods of analysisgave reasonably close damping estisates, consistent with forced vibration measuremen.ts.. For higher illods3, not./ev·er) considerable variationsexist in the estimates obtained by different methods. With theexception of the ATB Buildi~g, ~Those records exhibited 1h~favorable
signal-to-noise ratios, most damping estimates were in the range ofabout 0.5% to 1.5% of critical, under both ambient and forced vibration conditions.
VII. ACKNOlfLEDGHENTS
The author wishes to acknowledge the support and cooperation ofthe Center for Engineering Research and the Computing Center of theUniversity of Hawaii in the prep~ration of this paper. This researchproject was conducted under NSF Grant Elrl-16926 of the NationalScience Foundation. The excellent consultL'lg services of ProfessorsRobert H. Scanlan (Princeton University) &'ld Hiroyoshi Kobayashi(Tokyo Institute of Tec~~olo~J) are also gratefully appreciated.
VIII. REFERENCES
1. Cherry, S. and Brady, A. G., lrDetermination of the Strnctura1DJ~amic Properties by Statistical Analysis of Random Vibrations,NProceedL~gs of Third World Conference on Earth u~Ke Engineering,Vol. II J 19 5.
2. Ichinose, K., Fujii, K., Ito, T., Hirose, M., and Yamahara, E.,"Vibration Test of the Asahi Tokai Building, 11 Proceedings of theArchitectural Institute of Javan, November 1971.
3 -:;-·o>-'J.vasr,o H- ~1'1'"1-S 'cr"r~T7'''' !,' r:P'1 m Vl1'n cr Ch!'-racte-rl' ~"ics ~fc: t\ \..i .•,} .. l:".J-} .... d......u Uol.,) ............l.'--'~) .. \.} L'c.-:.J.l.~ ,1 ,l.. ... .J,....l.. .1.. 0lJ........ v ...
BUilding Structures by Measur~~g Oscillations due to Hicrotremors, n Tokyo Institute of Tedmology Report, February 1975.
10 Taoka

4. Muto, x., Ohta, T., Ashitate, T., and Uchiyama, M.) llVibrationTest of HTC Building, If Annual Proceedings of the ArchitecturalInstitute of Jap~~, September 1970.
5. Huto, X., Sato, X., Toyama, X., Uyeda, IT., and Nagata, S., !lEighRise Tube Design of the International Tele-Com.rnunications Center,llReport of the Architectural Institute of Japan, 1974.
6. Naito, T., Nasu, N., Ta.~euchi, H., and KUbota, G., "Constructionand Vibrational Characteristics of the Tokyo Tower, 11 Bulletin ofthe Scientific andEngineerL~gLaboratory, Waseda University, 1962.
7. Tamano, A., Asahi, K., and Abe, S., llDesign of the YokohamaTenrLJ.c-jo Building, II Report of the P...rchitecturc.l Institute of Japan,1972.
8. Tan~~a, T., Yoshizawa, S., asawa, Y., and Horishita, T., nperiodand Damping of Vibration in Actual Buildings During Earthquakes, f1
Bulletin of Earthquake Research Institute, Vol. 47, 1969, Tokyo,Japan.
9. Taoka, G.T., lfSystem Identification of Tall Vibrating Structures, II
Dept. of Civil EngL.'leering, :Cbiversity of nawaii, July 1979,NSF-E~~l 75-16926.
10. Taoka, G. and Scanlan, R.n., irA Statistical Analysis of the AmbientResponses of Some Tall Buildings, n Princeton University, April1973.
11. Va.11ITJ.arcke, E., nproperties of Spectral Homents with Applicationsto Random Vibrati.ons, lJ Journal of EngL"'lsering HechalJ.ics Division,ASCE, Vol, 98, April 1972.
:: CENTER FREQUEl'·lCY:: HALF - PO't1ER BAND'N1DTH
CUTOFF BAND'JiIlDTH
fcBC ::
B0.707
L_-+~c~TRAPEZOIDAL FILTERFIGURE 1
11 Taoka

I .'r
, r,
, '
\ . r
==;:===-+T..
lJ .-1 ',:J'~ 1·-1 .-1 .. - j..J ,,- LI~r: ...~ ,,~. 1
E.LEVATIONVIEW
OF TOWER
.~..... ' ~- ..
lI~i
. .. ~ .--J.
~•• *:•.'" f! ->.", ..... "
•• .: 1 '11":1*.111
SCHEMATIC OF THEENTIRE STRUCTURE
·.
FIGURE 2TOKYO WORLD TRADE
CENTER BUILDING ..
12 Taoka
/~._-~..""" ..-::.'~ '.
;.- ==1. ·'1' ., ....
"'";: t§i.. .j.. I... ....,.............."'"
A/;; :"'~'------- .._-.: .,.. --II"
,~.- ..."ft .. t ... ,.. - •••-.: . '''' ••'\I t - •• 1I
1I-'· I1 I11 •• -"11111
,'11:: I":~ t 1:,f: -at. Ill::: "IIIii' It:: ii_"' .- \,t •••••• ~S~Il;,.Jilt".\ "1' .. 1....... 11 ".~lI'"liI'll'--,t,I,," .. ,t ,.!llII".1I ~.i' ..~.~,f':.''':" It' t ,-S.• " II,,:·" ". _.:1:1:.11,·:.·(....":f~! •••••:··.3'lIl1":C:~, ,t :"::~;i;!! It ".Il.~::~.."..;.,,~l!·>·~-,;.P.'! ••• III Il""~ •• ,,
t '-;.::-:-.....\,........;..~~•.~.z~.. i'_._.. __ ' '-"'~.=.....,~~ _.l-:-·-~.-._~.~--.~,;· 1~ . -'~»i~f. ...~I 1 i_~-~_~. ..""L~21fl::7:i~:::~~=it~:~:~:J
FIGURE 4
FIGURE 5
.~ .
ASAHI TOKAI BUIL~INGFIG. G YOKOHA~lA TENRI BUILDING
13 Taoka

FIGURE 8.FORCED VIBR.t\TION AMPLITUDE
RESPONSE CURVE, WiC 1'1 MODE NS.
w>t=<l:..JW0::
0.30 0.32 0.34Hz
FIGURE 7 TOKYO TOWER
..Hz
1.91.81.7
FIGURE 10.FORCED VIBRATION AMPUTUDE
RESPONSE CURVE, wrc 3'd MODE NS.
Hz1.11.00.9
ww00:::J:::J~
t::J-l0-n.;E:::E<t<t
WW>>~
t=<t<t-l-lWW0::0::
FIGURE 9.FORCED VIBRATION Ai.1PLlTUDE
RESPONSE CURVE, WTC 2 nd MODE NS.
14 Taoka

I8.00 I ILAG TI~EOO 12.00 I
1'1.00 ttoo ...--1--16.00 120.00
fl1J\ V
WTCN-S 1st MODE
.WTC
V V
I".OJ I6.00
8
~c:a:t:>odc::c::ouo>,::,c:
LAG TI~too 1~.50 I20.00 1-22.50 1-25.00
I12.50 15.00 ;7.S> 110.00
12.50 1
FIGURE 11
15 Taoka
..~