
Rafaela A. Agathokleous, Soteris A. Kalogirou Cyprus ... · Rafaela A. Agathokleous, Soteris A....
8
Investigation of the flow between a PV panel and building’s outer skin comprising a naturally ventilated BIPV system Rafaela A. Agathokleous, Soteris A. Kalogirou Cyprus University of Technology, Limassol, Cyprus Abstract The installation of BIPV systems should be able to circulate cooling air at the back side of the PV panels in order to maintain high electrical conversion efficiency of the PV panels and avoid building overheating. This paper is focused on the understanding of the airflow between the building’s façade and the PV panel in naturally ventilated Building Integrated Photovoltaic (BIPV) panels. Flow visualisation measurements, hot wire anemometer measurements as well as temperature measurements were performed. These were performed in laboratory controlled environmental conditions under constant artificial solar radiation. These results are supported also with CFD simulation results. It is shown that the openings of the duct have an important role on the thermal behaviour of the system, and buoyancy effect resulted to velocities of 0.3 m/s. The optimum configuration is finally tested at building level to a demonstration building at Mons, Belgium, with very satisfactory results. Introduction The investigation of natural convection which develops in vertical open channels is of major importance since it is found in many applications in the last years such as the double skin facades and naturally ventilated building integrated photovoltaic (BIPV) systems. The use of the latter has increased recently because of the promotion made in various countries for the implementation of Renewable Energy Systems (RES) due to the need of the countries to reduce their energy consumption and emissions. Solar energy systems are the easiest among other RES for building installations and especially BIPV systems where the PV panels are part of the building’s construction. The double skin BIPV systems are part of the building’s construction since PV panels replace conventional construction materials of the building’s envelope, forming at the same time a construction element which is also an on-site energy producer. The installation of BIPV systems should be able to circulate cooling air at the back side of the PV panels in order to maintain high electrical conversion efficiency of the PV panels and avoid building overheating. The ventilation of the back side of the PV panels can be either natural or forced by external means such as fans. When the system is mechanically ventilated, the velocity of the air in the duct between the PVs and the external part of the building is known and controlled. In the case of natural ventilation, the air flow is depended on buoyancy forces where the air becomes less dense when is heated by the direct contact with the PV. Accordingly, mechanically ventilated systems are more convenient to cool the PV panels although they have various disadvantages over the naturally ventilated systems e.g. noise from the fans, extra required energy for the fans, maintenance, and difficult installation. Thus, naturally ventilated systems are preferred and examined in this paper. The considered concept and the related research topic is very important to the contribution of the EU directives for the wider adoption of the renewable energy systems, through the improvement of the BIPV technology with natural ventilation. It is believed that the advantages of the naturally ventilated systems can be maximized when correct design is done, to allow efficient PV cooling. This work presents an extensive research which is carried out to describe the behaviour of the air flow in BIPV systems. This is done with flow visualization measurements, temperature measurements and anemometry measurements, CFD simulation and TRNSYS simulation. The last is performed using the knowledge and values estimated from the other analyses. It is based on a real case BIPV system and the results referring on the performance of the system and the temperature of the PV panels are compared with real monitoring data recorded on site. There are various studies made on the heat transfer in natural convection conditions of vertical open channels, and the chimney effect, but as concluded by Agathokleous and Kalogirou (2016) very few studies are made on the naturally ventilated BIPV systems. The studies by Fossa et al. (2008); Gaillard et al. (2014), consider mainly the performance investigation and flow analysis. These are experimentally investigated by Kaiser et al. (2014); Lee et al. (2014); Ranjan et al. (2008); Zogou and Stapountzis (2011), and with simulations by Roeleveld et al. (2015); Yoo (2011); Zhang et al. (2017). There are studies focused on BIPVs on a building level as the ones presented by Kyritsis et al. (2017); Mei et al. (2003); Wang et al. (2006) or as an individual system Brinkworth (2000); Brinkworth et al. (1997); Lau et al. (2012); Yang and Athienitis (2015). Mei et al. (2003), presented a building level investigation based on the thermal characteristics of the building, Wang et al. (2006) presented the influence of the BIPV systems on the ________________________________________________________________________________________________ ________________________________________________________________________________________________ Proceedings of the 16th IBPSA Conference Rome, Italy, Sept. 2-4, 2019 4481 https://doi.org/10.26868/252708.2019.21416
Transcript of Rafaela A. Agathokleous, Soteris A. Kalogirou Cyprus ... · Rafaela A. Agathokleous, Soteris A....

Investigation of the flow between a PV panel and building’s outer skin comprising a naturally
ventilated BIPV system
Rafaela A. Agathokleous, Soteris A. Kalogirou
Cyprus University of Technology, Limassol, Cyprus
Abstract
The installation of BIPV systems should be able to
circulate cooling air at the back side of the PV panels in
order to maintain high electrical conversion efficiency of
the PV panels and avoid building overheating. This paper
is focused on the understanding of the airflow between the
building’s façade and the PV panel in naturally ventilated
Building Integrated Photovoltaic (BIPV) panels. Flow
visualisation measurements, hot wire anemometer
measurements as well as temperature measurements were
performed. These were performed in laboratory
controlled environmental conditions under constant
artificial solar radiation. These results are supported also
with CFD simulation results. It is shown that the openings
of the duct have an important role on the thermal
behaviour of the system, and buoyancy effect resulted to
velocities of 0.3 m/s. The optimum configuration is
finally tested at building level to a demonstration building
at Mons, Belgium, with very satisfactory results.
Introduction
The investigation of natural convection which develops in
vertical open channels is of major importance since it is
found in many applications in the last years such as the
double skin facades and naturally ventilated building
integrated photovoltaic (BIPV) systems. The use of the
latter has increased recently because of the promotion
made in various countries for the implementation of
Renewable Energy Systems (RES) due to the need of the
countries to reduce their energy consumption and
emissions. Solar energy systems are the easiest among
other RES for building installations and especially BIPV
systems where the PV panels are part of the building’s
construction. The double skin BIPV systems are part of
the building’s construction since PV panels replace
conventional construction materials of the building’s
envelope, forming at the same time a construction element
which is also an on-site energy producer.
The installation of BIPV systems should be able to
circulate cooling air at the back side of the PV panels in
order to maintain high electrical conversion efficiency of
the PV panels and avoid building overheating. The
ventilation of the back side of the PV panels can be either
natural or forced by external means such as fans. When
the system is mechanically ventilated, the velocity of the
air in the duct between the PVs and the external part of
the building is known and controlled. In the case of
natural ventilation, the air flow is depended on buoyancy
forces where the air becomes less dense when is heated
by the direct contact with the PV. Accordingly,
mechanically ventilated systems are more convenient to
cool the PV panels although they have various
disadvantages over the naturally ventilated systems e.g.
noise from the fans, extra required energy for the fans,
maintenance, and difficult installation.
Thus, naturally ventilated systems are preferred and
examined in this paper. The considered concept and the
related research topic is very important to the contribution
of the EU directives for the wider adoption of the
renewable energy systems, through the improvement of
the BIPV technology with natural ventilation. It is
believed that the advantages of the naturally ventilated
systems can be maximized when correct design is done,
to allow efficient PV cooling.
This work presents an extensive research which is carried
out to describe the behaviour of the air flow in BIPV
systems. This is done with flow visualization
measurements, temperature measurements and
anemometry measurements, CFD simulation and
TRNSYS simulation. The last is performed using the
knowledge and values estimated from the other analyses.
It is based on a real case BIPV system and the results
referring on the performance of the system and the
temperature of the PV panels are compared with real
monitoring data recorded on site.
There are various studies made on the heat transfer in
natural convection conditions of vertical open channels,
and the chimney effect, but as concluded by Agathokleous
and Kalogirou (2016) very few studies are made on the
naturally ventilated BIPV systems.
The studies by Fossa et al. (2008); Gaillard et al. (2014),
consider mainly the performance investigation and flow
analysis. These are experimentally investigated by Kaiser
et al. (2014); Lee et al. (2014); Ranjan et al. (2008); Zogou
and Stapountzis (2011), and with simulations by
Roeleveld et al. (2015); Yoo (2011); Zhang et al. (2017).
There are studies focused on BIPVs on a building level as
the ones presented by Kyritsis et al. (2017); Mei et al.
(2003); Wang et al. (2006) or as an individual system
Brinkworth (2000); Brinkworth et al. (1997); Lau et al.
(2012); Yang and Athienitis (2015). Mei et al. (2003),
presented a building level investigation based on the
thermal characteristics of the building, Wang et al. (2006)
presented the influence of the BIPV systems on the
________________________________________________________________________________________________
________________________________________________________________________________________________ Proceedings of the 16th IBPSA Conference Rome, Italy, Sept. 2-4, 2019
4481
https://doi.org/10.26868/25222708.2019.211416

heating and cooling loads, and Kyritsis et al. (2017)
focused on the energy coverage by the BIPV.
Regarding particularly the effect of air flow in the duct of
the naturally ventilated BIPV systems is very little
investigated. Natural flow involving low velocities is
sensitive to environmental conditions and thus difficult to
measure. The unsteady nature of this flow does not
depend only on the thermal behaviour and kinematic
activity of the air duct, but also to the pressure and
temperature conditions outside the channel.
Zogou and Stapountzis (2012) investigated the flow and
heat transfer inside a PV/T collector for building
application, for 3 cases, using a low capacity fan, a high
capacity fan and buoyancy flow created naturally. The
system investigated by Zogou and Stapountzis (2012)
considering natural flow due to buoyancy effect is very
similar to a naturally ventilated BIPV system where
natural air flow occurs in the air gap between the PV panel
and a second skin due to the increase of the air’s
temperature. It was concluded that for the buoyancy
driven air case the flow belongs in the transitional flow
regime, with air velocity of 0.1 m/s. The flow
investigation was done experimentally with flow
visualisation using particle image velocimetry (PIV)
technique, as well as with hot wire anemometry analysis.
Sanvicente et al. (2013) investigated the transitional
natural convection flow in an open channel
experimentally. A double skin PV configuration is tested
with different heating configurations. This study was
mainly focused on the kinematic characteristics of the
flow and convective heat transfer at the heated wall. It was
concluded that the flow is neither turbulent nor purely
laminar.
Sanjuan et al. carried out an experimental analysis with a
2D PIV technique on the natural convection in open joint
ventilated facades (OJVF), paying attention specifically
at the ventilation effect through the joints. It was
concluded that the heating slabs of the front surface of the
tested duct produce ventilation flow in the cavity, the
velocity of the air in the cavity increases with the
buoyancy forces e.g. temperature differences, as well as
that the air enters the cavity from the lower joints and exits
from the upper ones. Sanjuan et al. (2011b) also
developed a simulation model validated with the
experimental data from Sanjuan et al. (2011a). The results
from the PIV measurements performed in Sanjuan et al.
(2011a) are compared with simulation results from
different turbulence and radiation models applied on a
three dimensional model. The results showed that
ventilation air flow inside the cavity is enhanced by
incident radiation as well as by the height of the façade.
Tkachenko et al. (2016) investigated numerically and
experimentally the unsteady natural convection in a non-
uniformly heated vertical open-ended channel forming a
double skin BIPV system. It was concluded that staggered
arrangement of PV panels produces higher mass flow rate
of the air in the channel.
Experimental Setup
The experimental procedures are carried out in indoor
laboratory conditions with the use of a solar simulator to
provide artificial solar radiation. The laboratory has
controlled conditions without external disturbances to
affect the experimental procedures.
A custom made experimental BIPV apparatus is used in
the experimental procedures, consisting of a PV panel,
two plexiglass sheets and a wooden back wall as shown
in Figure 1. The polycrystalline PV panel used is 1.64 m
long, 0.992 m wide and 0.004 m thick, the plexiglass
sheets are 1.64 m long, 0.1 m wide and 0.01 m thick and
the back wooden wall is 1.64 m long, 0.992 m wide and
0.1 m thick. The two plexiglass sheets, the PV panel and
the wall, create a rectangular duct, open at the bottom and
the top for fresh air circulation to provide PV cooling to
avoid efficiency loss. The surface of the PV panel is
subjected to constant incident radiation from the solar
simulator of 1000 W/m2 for 3 hours in each experimental
procedure.
The air circulation in the formed duct occurs due to the
chimney effect. When the temperature of the PV panel
surface increases, the air behind the PV panel gets hotter
as well due to the direct contact with the hot surface of the
PV panel. Thus, the air becomes less dense and moves
upwards until it exits the duct from the top opening.
Simultaneously fresh air is sucked in the duct from the
bottom opening.
Figure 1: Schematic representation of the vertical
naturally ventilated BIPV system tested in the laboratory
under controlled conditions and constant artificial solar
radiation.
Flow Visualisation
Figure 2 shows a schematic representation of the flow
visualisation technique employed. The flow visualisation
was performed after the system had reached steady state
conditions. A green laser with a rotating mirror is
employed to produce a plain sheet of light as shown in
Figure 2. The laser sheet lights-up a vertical section of the
channel, parallel to the plexiglass sheets, in the middle of
the duct.
________________________________________________________________________________________________
________________________________________________________________________________________________ Proceedings of the 16th IBPSA Conference Rome, Italy, Sept. 2-4, 2019
4482
A smoke fog machine (Chauvet Hurricane 700) is
employed to produce smoke in the laboratory as shown in
Figure 2. In order to avoid forced movements of the
particles in the air duct, the smoke machine was placed at
a 2-m distance from the experimental apparatus and the
injection of the smoke particles was done in the whole
laboratory room to ensure that there is no interference
with the natural convection in the gap.
The smoke passes through the air duct and moves
upwards with the flow. The movement of the smoke is
captured with the use of a commercial high definition
(HD) camera placed next to the plexiglass sheet, outside
the channel. The camera produces high definition video
files and photo clips as well. The time lapse between each
clip is 0.1 s.
Figure 2:. x-z section of the schematic representation of
the flow visualisation experimental procedure.
The flow visualisation experiments show that the flow is
neither turbulent nor purely laminar at the lower part of
the channel. The results indicate that the flow is in the
transition flow regime. It can be observed that, the effect
of the flow entrance is significant, but no clear turbulence
flow appears.
Various flow patterns are visible in the clips that move
vertically upwards following the main flow, at average
velocity of 0.28 – 0.32 m/s. The fluid velocity is
calculated using the camera timing (Δt) and the smoke
particles displacement.
In order to see clearly the type of the air flow, the camera
was moved upwards to capture the flow at a higher level
of the channel in order to avoid the effect of the flow
entrance. From these clips, the flow is shown to be
laminar, with air velocity from 0.28 to 0.3 m/s.
Hot Wire Anemometer Measurements
The HD 2303.0 hot wire anemometer from Delta Ohm is
used with the probes AP 471 S2 to measure low air
velocities with two decimals accuracy. The HD 2303.0 is
a portable instrument with an LCD display. The AP 471
S2 probe can adjust its length with a telescopic shaft to
800 mm and this gives us the ability to measure at any
depth in the air gap. The probe diameter on the
measurement area is 8 mm.
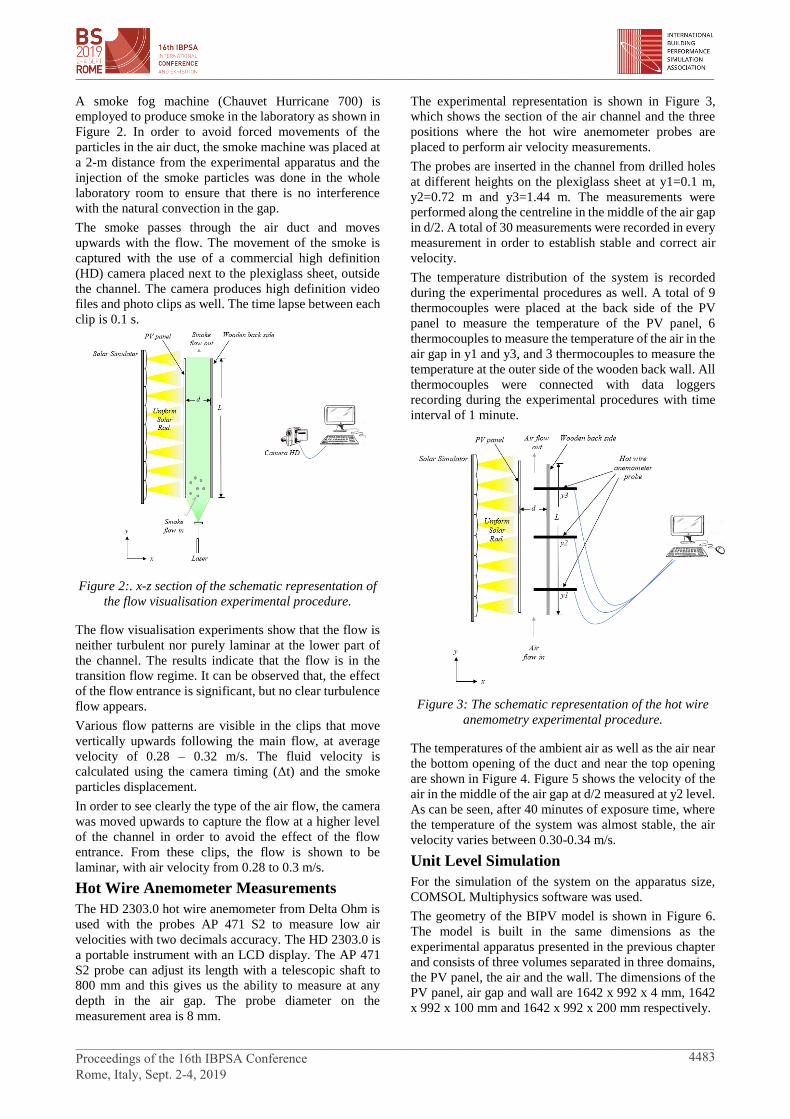
The experimental representation is shown in Figure 3,
which shows the section of the air channel and the three
positions where the hot wire anemometer probes are
placed to perform air velocity measurements.
The probes are inserted in the channel from drilled holes
at different heights on the plexiglass sheet at y1=0.1 m,
y2=0.72 m and y3=1.44 m. The measurements were
performed along the centreline in the middle of the air gap
in d/2. A total of 30 measurements were recorded in every
measurement in order to establish stable and correct air
velocity.
The temperature distribution of the system is recorded
during the experimental procedures as well. A total of 9
thermocouples were placed at the back side of the PV
panel to measure the temperature of the PV panel, 6
thermocouples to measure the temperature of the air in the
air gap in y1 and y3, and 3 thermocouples to measure the
temperature at the outer side of the wooden back wall. All
thermocouples were connected with data loggers
recording during the experimental procedures with time
interval of 1 minute.
Figure 3: The schematic representation of the hot wire
anemometry experimental procedure.
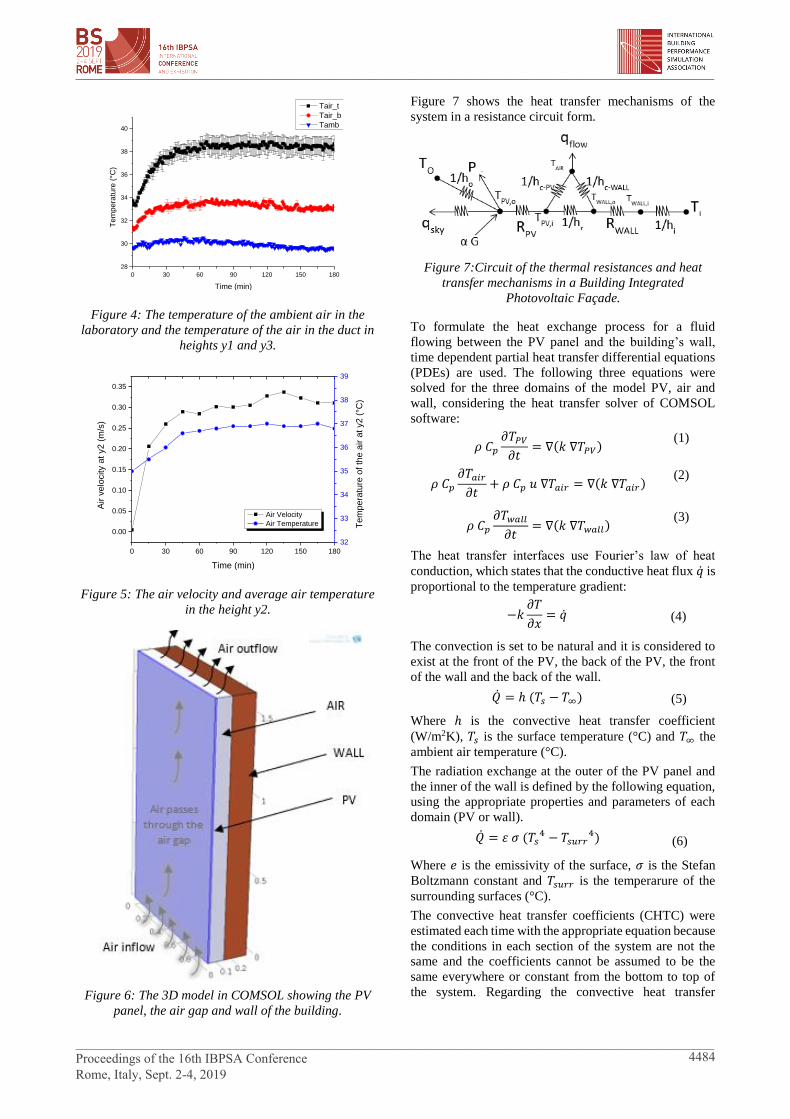
The temperatures of the ambient air as well as the air near
the bottom opening of the duct and near the top opening
are shown in Figure 4. Figure 5 shows the velocity of the
air in the middle of the air gap at d/2 measured at y2 level.
As can be seen, after 40 minutes of exposure time, where
the temperature of the system was almost stable, the air
velocity varies between 0.30-0.34 m/s.
Unit Level Simulation
For the simulation of the system on the apparatus size,
COMSOL Multiphysics software was used.
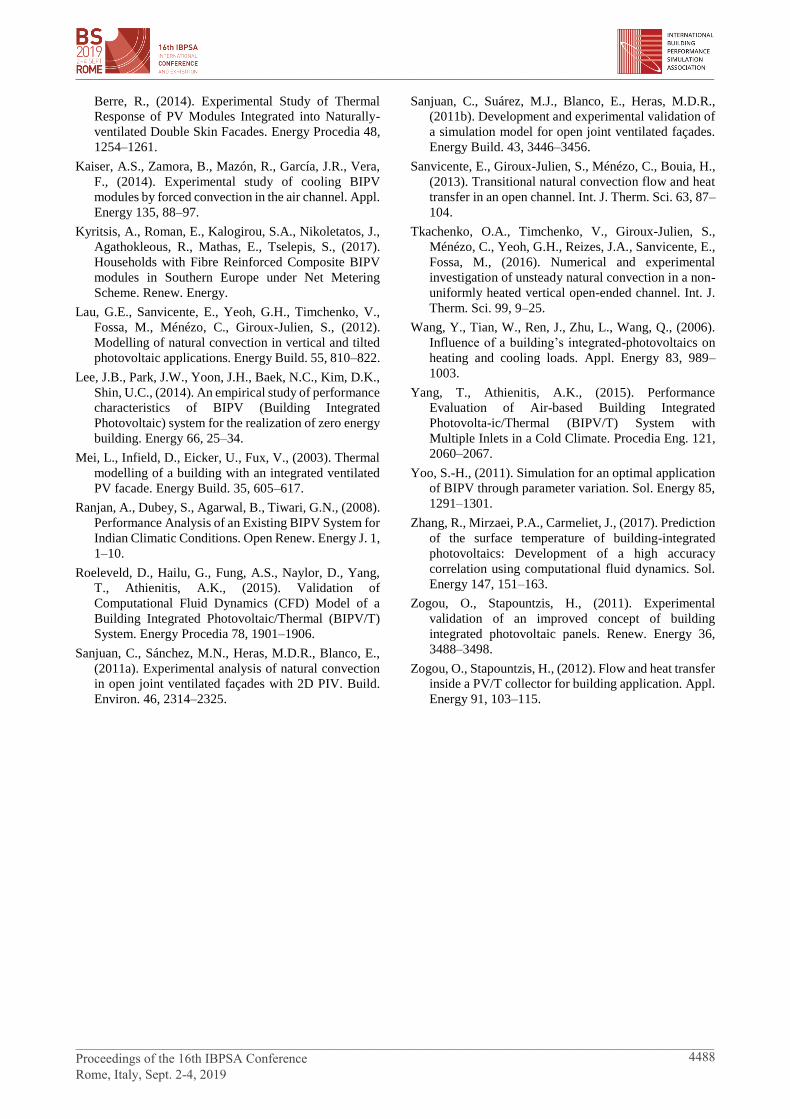
The geometry of the BIPV model is shown in Figure 6.
The model is built in the same dimensions as the
experimental apparatus presented in the previous chapter
and consists of three volumes separated in three domains,
the PV panel, the air and the wall. The dimensions of the
PV panel, air gap and wall are 1642 x 992 x 4 mm, 1642
x 992 x 100 mm and 1642 x 992 x 200 mm respectively.
________________________________________________________________________________________________
________________________________________________________________________________________________ Proceedings of the 16th IBPSA Conference Rome, Italy, Sept. 2-4, 2019
4483
0 30 60 90 120 150 180
28
30
32
34
36
38
40
Tem
pe
ratu
re (
°C)
Time (min)
Tair_t
Tair_b
Tamb
Figure 4: The temperature of the ambient air in the
laboratory and the temperature of the air in the duct in
heights y1 and y3.
0 30 60 90 120 150 180
0.00
0.05
0.10
0.15
0.20
0.25
0.30
0.35
Air Velocity
Air Temperature
Time (min)
Air v
elo
city a
t y2 (
m/s
)
32
33
34
35
36
37
38
39
Tem
pera
ture
of th
e a
ir a
t y2 (
°C)
Figure 5: The air velocity and average air temperature
in the height y2.
Figure 6: The 3D model in COMSOL showing the PV
panel, the air gap and wall of the building.
Figure 7 shows the heat transfer mechanisms of the
system in a resistance circuit form.
Figure 7:Circuit of the thermal resistances and heat
transfer mechanisms in a Building Integrated
Photovoltaic Façade.
To formulate the heat exchange process for a fluid
flowing between the PV panel and the building’s wall,
time dependent partial heat transfer differential equations
(PDEs) are used. The following three equations were
solved for the three domains of the model PV, air and
wall, considering the heat transfer solver of COMSOL
software:
𝜌 𝐶𝑝
𝜕𝑇𝑃𝑉
𝜕𝑡= ∇(𝑘 ∇𝑇𝑃𝑉)
(1)
𝜌 𝐶𝑝
𝜕𝑇𝑎𝑖𝑟
𝜕𝑡+ 𝜌 𝐶𝑝 𝑢 ∇𝑇𝑎𝑖𝑟 = ∇(𝑘 ∇𝑇𝑎𝑖𝑟)
(2)
𝜌 𝐶𝑝
𝜕𝑇𝑤𝑎𝑙𝑙
𝜕𝑡= ∇(𝑘 ∇𝑇𝑤𝑎𝑙𝑙)
(3)
The heat transfer interfaces use Fourier’s law of heat
conduction, which states that the conductive heat flux �̇� is
proportional to the temperature gradient:
−𝑘𝜕𝑇
𝜕𝑥= �̇� (4)
The convection is set to be natural and it is considered to
exist at the front of the PV, the back of the PV, the front
of the wall and the back of the wall.
�̇� = ℎ (𝑇𝑠 − 𝑇∞) (5)
Where ℎ is the convective heat transfer coefficient
(W/m2K), 𝑇𝑠 is the surface temperature (°C) and 𝑇∞ the
ambient air temperature (°C).
The radiation exchange at the outer of the PV panel and
the inner of the wall is defined by the following equation,
using the appropriate properties and parameters of each
domain (PV or wall).
�̇� = 𝜀 𝜎 (𝑇𝑠4 − 𝑇𝑠𝑢𝑟𝑟
4) (6)
Where 𝑒 is the emissivity of the surface, 𝜎 is the Stefan
Boltzmann constant and 𝑇𝑠𝑢𝑟𝑟 is the temperarure of the
surrounding surfaces (°C).
The convective heat transfer coefficients (CHTC) were
estimated each time with the appropriate equation because
the conditions in each section of the system are not the
same and the coefficients cannot be assumed to be the
same everywhere or constant from the bottom to top of
the system. Regarding the convective heat transfer
________________________________________________________________________________________________
________________________________________________________________________________________________ Proceedings of the 16th IBPSA Conference Rome, Italy, Sept. 2-4, 2019
4484

coefficient in the duct, the following correlation proposed
by Agathokleous and Kalogirou (2018a) was used:
𝑁𝑢 = 1.23 (𝑅𝑎∗(𝑑/𝐿))0.168 (7)
Where the modified Rayleigh number Ra* is given by:
Where d is the size of the air gap (m), L is the height of
the duct (m), 𝑣 (kg/m s) is the kinematic viscosity of air
(equal to μ/ρ), 𝑘 is the thermal conductivity of air
(W/mK).
Accordingly, the CHTC in the air gap can be estimated by
the following formula considering 𝐷ℎ the hydraulic
diameter of the duct which is 𝐷ℎ = 4 𝐴𝑐/𝑝:
𝑁𝑢 =ℎ𝑔𝑎𝑝 𝐷ℎ
𝑘 (9)
Due to the different heat transfer conditions in the various
parts of the system, not all the CHTC are estimated with
the use of Equation (7). Thus, the CHTC in the front
surface of the PV and the back surface of the wall (facing
indoors), are estimated by the use of empirical Nu number
equation given by Churchill and Chu (1975) for natural
convection over vertical plates:
𝑁𝑢𝑜𝑢𝑡
= {0.825 +0.387 𝑅𝑎𝐿
1/6
[1 + (0.492/𝑃𝑟)9/16]8/27}
2
(10)
Where
𝑅𝑎𝐿 =𝑔 𝛽 (𝑇𝑠 − 𝑇∞)𝐿𝑐
3
𝜈2 𝑃𝑟 (11)
Where Lc is the characteristic length of the geometry (m),
in this case the height of the PV, 𝛽 is the volumetric
coefficient of thermal expansion (1/K), and 𝑃𝑟 is the
Prandlt number.
In this section, the validated model by Agathokleous and
Kalogirou (2018b) is used to investigate the effect of the
air velocity in the temperature distribution of the system.
The model is tested under various air velocities from 0.05
m/s to 3 m/s at constant air gap of 10 cm.
Real weather data are imported in the mathematical model
with equations. The idea is to run the simulations in a
typical summer day and observe the effect of the air
velocity in the air gap between the two skins on the
temperature distribution of the system. The equations for
radiation and ambient temperature were derived in Excel,
from the weather data extracted from the Typical
Meteorological Data (TMY) files of Nicosia, Cyprus,
using TRNSYS software. Then data are imported in
COMSOL in the form of equations depended on time. The
solar radiation data used, were considering east oriented
surface, at the location of Nicosia Cyprus, vertical
position. For these conditions, the effective hours were
from 5:00 am to 13:00 pm and thus, the simulations were
carried out within this time period. Solar radiation data
and ambient air temperature data used are shown in Figure
8.
The simulations were carried out multiple times
considering various velocities from 0.05 m/s to 3 m/s at
constant air gap of 0.1 m. It should be noted that the initial
temperature value of all boundaries for all parts of the
system is set to ambient temperature.
Figure 9 shows the temperature at the boundary at the
0inner surface of the PV which faces the air gap, from
hours 5:00 to 13:00 for all the tested velocities. As can be
observed, the higher the air velocity, the lower is the
temperature distribution of the panel’s surface. The faster
the air flows into the duct, the more heated air is removed
from the duct which is created due to the hot surface of
the PV panel.
When the air velocity in the duct is the lowest, the
maximum average temperature at the inner side is 76ºC.
It is important also to observe the point at which the
maximum temperatures occur. As can be seen, this point
is around 8:00 o’clock where the solar radiation is near its
maximum, and the ambient temperature increases.
5 6 7 8 9 10 11 12 13 14 15 16 17 18 19
0
200
400
600
800
1000
Hour of the day
Sola
r R
adia
tion (
W/m
2)
y = 3.2737x3 - 104.59x
2 + 938.34x - 1624
y = -0.2431x2 + 6.6474x - 10.113
15
20
25
30
35
Am
bie
nt T
em
pera
ture
(deg C
)
Figure 8: Solar radiation on vertical surface oriented
east, and the temperature variation during a typical day
in June in Cyprus.
07:00 08:00 09:00 10:00 11:00 12:00 13:00 14:00
20
25
30
35
40
45
50
55
60
65
70
Tair_
pv (
ºC)
Hour of the day (hh:mm)
0.05 m/s
0.1 m/s
0.2 m/s
0.3 m/s
0.5 m/s
0.8 m/s
1 m/s
1.2 m/s
2 m/s
3 m/s
Figure 9: Temperature at the inner boundary surface of
the PV facing the air gap.
It is also important to observe the temperature of the
flowing air in the duct, since this is an important
parameter that affects the temperature distribution on the
system’s surfaces. As can be seen in Figure 10 the graph
has the same trend with the PV panel’s temperature
distribution showed earlier and it is affected from the air
velocity with the same way.
𝑅𝑎∗ = 𝑔 𝛽 𝑑4�̇�𝑐 𝜌 𝐶𝑝
𝑣 𝑘2
(8)
________________________________________________________________________________________________
________________________________________________________________________________________________ Proceedings of the 16th IBPSA Conference Rome, Italy, Sept. 2-4, 2019
4485

07:00 08:00 09:00 10:00 11:00 12:00 13:00 14:00
22
24
26
28
30
32
34
36
38T
air_volu
me (
ºC)
Hour of the day (hh:mm)
0.1 m/s
0.2 m/s
0.3 m/s
0.5 m/s
0.8 m/s
1 m/s
1.2 m/s
2 m/s
3 m/s
Figure 10: Average temperature of the air in the air gap
for all the tested velocities.
Building Level Simulation
The knowledge gained from the analyses above, were
finally used to suggest sizing and design of a roof BIPV
system of a house in Mons, Belgium. This work is
developed under the BFIRST (Building integrated Fibre
Reinforced Solar Technology) EU FP7 funded project.
Taking into consideration the investigation presented so
far, an air gap of 10 cm was recommended with natural
ventilation. As proved earlier, a naturally ventilated air
gap of 10 cm is adequate to keep the performance of the
system in normal levels in a typical summer day in Cyprus
and thus the same conditions would work efficiently in
Belgium as well where the climate is cooler.
To make sure this assumption will work in real Belgium
weather conditions, a BIPV simulation model in
TRNSYS was developed prior to the installation of the
BIPV system to examine the effectiveness of the proposed
design of the system regarding the size of the air gap and
the type of ventilation. It is very important to predict the
performance and thermal behavior of the system before
the installation because it will help the installers and the
engineers to make changes to optimize the installation.
Apart from the PV surface temperature and the energy
production of the system, the developed model can
estimate the mean temperature of the air in the duct
between the PV panels and the roof’s substructure, the
temperature of the air in the outlet, the thermal efficiency
of the system, the convective and radiative loses, etc. The
main components of the model used are Type 566 and
Type 109. Type 566 from the Electrical Library of
TRNSYS is used to represent the BIPV system, and Type
109 the weather data. A simulation is carried out for one
year, with one-hour time step, considering the real
dimensions of the system, Inclination angle of 40° and
orientation of 10 degrees from south.
For the estimation of the convective heat transfer
coefficients in the building level simulation model,
correlation (10) was used for the internal roof space while
equation (7) for the space between the PV panels and the
roof substructure. Since the correlation (7) was obtained
for vertical BIPV demonstration, here in this analysis it is
assumed that the sloped roof will have similar behaviour
and thus the same correlation for the convective heat
transfer coefficients is used. The validity of this
assumption will be checked from the comparison of the
temperature of the PV panels between the monitoring and
simulations results.
The simulation is carried out for one year with the use of
real hourly weather data from TMY file of Brussels,
Belgium. After one-year operation of the system, the
monitoring data were compared to the simulation data.
The roof is firstly covered with thermal insulation and a
wooden structure. Then, aluminium profiles are installed
on the wooden structure to fix the PVs. From top to the
bottom the modules overlap, to form one large continuous
PV surface to cover all the roof’s area. From left to right
there are no joints in between the panels. Although earlier
it was proposed to leave openings between the panels
when the application has a large height, in this case it was
not possible to install the panels with open joints in
between because it is a roof installation and the aim was
to keep the picture of the roof as much as closer to normal
tiles and avoid rain water leakage to the insulation. Thus,
a continuous PV surface is formed and the air duct is
ventilated with bottom and top opening as shown in
Figure 11. Additionally, the continuous surface of the PV
panels in this case is not a major problem because
Belgium has a cold climate and it is easier to avoid
overheating by leaving an optimum air gap size and
openings at the bottom and top of the system only.
Considering the size of the RS modules and the size of the
two roof parts, a total of 57 RS modules are installed as
shown in Figure 12, 49 on the big part of the roof and 8 at
the small part. The total installed nominal power of the
PV plant is 7.01 kWp. The residential house is connected
to the electric grid using a 3 x 230 V connection of 12.7
kVA (30 A).
Figure 11: The roof structure showing the way of the air
flow behind the PV panels.
Figure 12: The 57 RS modules on the roof of the
demonstration building.
________________________________________________________________________________________________
________________________________________________________________________________________________ Proceedings of the 16th IBPSA Conference Rome, Italy, Sept. 2-4, 2019
4486

Overall, there is a good agreement between the simulation
and measured monitoring data. The total numbers and the
estimated percentage differences are shown in Table 1.
The annual estimated energy production from the system
is very close to the measured one. However, in monthly,
daily or hourly based data the amount of energy is
different. This is because the TMY data are usually used
for mean annual performance evaluation of thermal
systems and does not necessarily coincide with the actual
weather data for particular days. The percentage relative
error (PRE) between the predicted and measured energy
production of the system for one year is 1.46% which is
very small. Higher PRE appears for the maximum PV
temperature values which is due to the fact that simulation
predicted higher temperature because the correlation used
to estimate the convective heat transfer coefficients in the
air gap was based on vertical system. However, even with
this assumption, a PRE of 4.47% is considered acceptable
for building level simulation, as the purpose of carrying
out this simulation was to see the annual performance of
the system before its final design and installation.
Table 1:Comparison between the simulation and
measured data and the estimated percentage relative
error (PRE).
Simulation Measured PRE
1 year energy
production
9507.40
kWh
9648.2
kWh 1.46%
Maximum PV
Temperature 67ºC 64ºC 4.47%
Maximum
Outlet Air
Temperature
36.7ºC 36.1ºC 1.66%
Most
productive
month
July July -
Less
Productive
month
December February -
Conclusion
In this study, the air flow of the air duct of a naturally
ventilated BIPV system is tested. Flow visualization
measurements were carried out, as well as, hot wire
anemometer measurements. The effect of the air velocity
in the air gap is investigated with CFD simulations and
then, a TRNSYS model was developed to predict the
performance of a real scale roof BIPV system in Belgium.
The most important conclusions are summarized below:
• The air gap plays an important role in the
performance of the BIPV since it affects the
temperature distribution of the system.
• Buoyancy effect occurs in the system as proved by
the indoor experiments. The average air velocity
measured by hot wire anemometry is 0.3 - 0.34 m/s
while from flow visualisation was 0.28 - 0.32 m/s.
• The higher the air velocity in the duct, the lower is
the temperature of the various parts of the system.
• Building simulation model results showed good
agreement with real monitoring measurements
regarding the annual energy production of the
system and the predicted maximum temperature of
the PV panels, even with the assumption that the
convective heat transfer coefficients for the vertical
system apply also to the sloped system tested.
Acknowledgement
Part of this work is carried out under the research program
Building-integrated fibre-reinforced solar technology
(BFirst), funded by the EU Seventh Framework
Programme FP7/2007-2013, under grant agreement n°
296016.
Nomenclature
BFIRST Building fibre reinforced solar technology
BIPV Building integrated photovoltaic
CFD Computational fluid dynamics
CHTC Convective heat transfer coefficients
EU European Union
OJVF Open joint ventilated façade
PV Photovoltaic
PIV Particle image velocimetry
PV/T Photovoltaic/thermal
PRE Partial relative error
RES Renewable energy systems
TMY Typical meteorological year
TRNSYS Transient simulation system
References
Agathokleous, R.A., Kalogirou, S.A., (2016). Double skin
facades (DSF) and building integrated photovoltaics
(BIPV): A review of configurations and heat transfer
characteristics. Renew. Energy 89, 743–756.
Agathokleous, R.A., Kalogirou, S.A., (2018a). Part I:
Thermal analysis of naturally ventilated BIPV system:
Experimental investigation and convective heat
transfer coefficients estimation. Sol. Energy 169, 673–
681.
Agathokleous, R.A., Kalogirou, S.A., (2018b). Part II:
Thermal analysis of naturally ventilated BIPV system:
Modeling and Simulation. Sol. Energy 169, 682–691.
Brinkworth, B.., (2000). Estimation of flow and heat
transfer for the design of PV cooling ducts. Sol.
Energy 69, 413–420.
Brinkworth, B.., Cross, B.., Marshall, R.., Yang, H.,
(1997). Thermal regulation of photovoltaic cladding.
Sol. Energy 61, 169–178.
Churchill, S.W., Chu, H.H.S., (1975). Correlating
equations for laminar and turbulent free convection
from a vertical plate. Int. J. Heat Mass Transf. 18,
1323–1329.
Fossa, M., Ménézo, C., Leonardi, E., (2008).
Experimental natural convection on vertical surfaces
for building integrated photovoltaic (BIPV)
applications. Exp. Therm. Fluid Sci. 32, 980–990.
Gaillard, L., Ménézo, C., Giroux, S., Pabiou, H., Le-
________________________________________________________________________________________________
________________________________________________________________________________________________ Proceedings of the 16th IBPSA Conference Rome, Italy, Sept. 2-4, 2019
4487
Berre, R., (2014). Experimental Study of Thermal
Response of PV Modules Integrated into Naturally-
ventilated Double Skin Facades. Energy Procedia 48,
1254–1261.
Kaiser, A.S., Zamora, B., Mazón, R., García, J.R., Vera,
F., (2014). Experimental study of cooling BIPV
modules by forced convection in the air channel. Appl.
Energy 135, 88–97.
Kyritsis, A., Roman, E., Kalogirou, S.A., Nikoletatos, J.,
Agathokleous, R., Mathas, E., Tselepis, S., (2017).
Households with Fibre Reinforced Composite BIPV
modules in Southern Europe under Net Metering
Scheme. Renew. Energy.
Lau, G.E., Sanvicente, E., Yeoh, G.H., Timchenko, V.,
Fossa, M., Ménézo, C., Giroux-Julien, S., (2012).
Modelling of natural convection in vertical and tilted
photovoltaic applications. Energy Build. 55, 810–822.
Lee, J.B., Park, J.W., Yoon, J.H., Baek, N.C., Kim, D.K.,
Shin, U.C., (2014). An empirical study of performance
characteristics of BIPV (Building Integrated
Photovoltaic) system for the realization of zero energy
building. Energy 66, 25–34.
Mei, L., Infield, D., Eicker, U., Fux, V., (2003). Thermal
modelling of a building with an integrated ventilated
PV facade. Energy Build. 35, 605–617.
Ranjan, A., Dubey, S., Agarwal, B., Tiwari, G.N., (2008).
Performance Analysis of an Existing BIPV System for
Indian Climatic Conditions. Open Renew. Energy J. 1,
1–10.
Roeleveld, D., Hailu, G., Fung, A.S., Naylor, D., Yang,
T., Athienitis, A.K., (2015). Validation of
Computational Fluid Dynamics (CFD) Model of a
Building Integrated Photovoltaic/Thermal (BIPV/T)
System. Energy Procedia 78, 1901–1906.
Sanjuan, C., Sánchez, M.N., Heras, M.D.R., Blanco, E.,
(2011a). Experimental analysis of natural convection
in open joint ventilated façades with 2D PIV. Build.
Environ. 46, 2314–2325.
Sanjuan, C., Suárez, M.J., Blanco, E., Heras, M.D.R.,
(2011b). Development and experimental validation of
a simulation model for open joint ventilated façades.
Energy Build. 43, 3446–3456.
Sanvicente, E., Giroux-Julien, S., Ménézo, C., Bouia, H.,
(2013). Transitional natural convection flow and heat
transfer in an open channel. Int. J. Therm. Sci. 63, 87–
104.
Tkachenko, O.A., Timchenko, V., Giroux-Julien, S.,
Ménézo, C., Yeoh, G.H., Reizes, J.A., Sanvicente, E.,
Fossa, M., (2016). Numerical and experimental
investigation of unsteady natural convection in a non-
uniformly heated vertical open-ended channel. Int. J.
Therm. Sci. 99, 9–25.
Wang, Y., Tian, W., Ren, J., Zhu, L., Wang, Q., (2006).
Influence of a building’s integrated-photovoltaics on
heating and cooling loads. Appl. Energy 83, 989–
1003.
Yang, T., Athienitis, A.K., (2015). Performance
Evaluation of Air-based Building Integrated
Photovolta-ic/Thermal (BIPV/T) System with
Multiple Inlets in a Cold Climate. Procedia Eng. 121,
2060–2067.
Yoo, S.-H., (2011). Simulation for an optimal application
of BIPV through parameter variation. Sol. Energy 85,
1291–1301.
Zhang, R., Mirzaei, P.A., Carmeliet, J., (2017). Prediction
of the surface temperature of building-integrated
photovoltaics: Development of a high accuracy
correlation using computational fluid dynamics. Sol.
Energy 147, 151–163.
Zogou, O., Stapountzis, H., (2011). Experimental
validation of an improved concept of building
integrated photovoltaic panels. Renew. Energy 36,
3488–3498.
Zogou, O., Stapountzis, H., (2012). Flow and heat transfer
inside a PV/T collector for building application. Appl.
Energy 91, 103–115.
________________________________________________________________________________________________
________________________________________________________________________________________________ Proceedings of the 16th IBPSA Conference Rome, Italy, Sept. 2-4, 2019
4488