Radiological Impact of Routine Discharges from UK Civil Nuclear ...
102
Radiological Impact of Routine Discharges from UK Civil Nuclear Licensed Sites During the 2000s
Transcript of Radiological Impact of Routine Discharges from UK Civil Nuclear ...
Radiological Impact of Routine Discharges from UK Civil Nuclear Licensed Sites During the 2000s

About Public Health England
Public Health England exists to protect and improve the nation’s health and wellbeing, and
reduce health inequalities. It does this through world-class science, knowledge and intelligence,
advocacy, partnerships and the delivery of specialist public health services. PHE is an
operationally autonomous executive agency of the Department of Health.
Public Health England
133–155 Waterloo Road
Wellington House
London SE1 8UG
T: 020 7654 8000
www.gov.uk/phe
Twitter: @PHE_uk
Facebook: www.facebook.com/PublicHealthEngland
© Crown copyright 2014
You may re-use this information (excluding logos) free of charge in any format or medium, under
the terms of the Open Government Licence v3.0. To view this licence, visit OGL or email
[email protected]. Where we have identified any third party copyright information
you will need to obtain permission from the copyright holders concerned.
Any enquiries regarding this publication should be sent to
Press and Information
Centre for Radiation, Chemical and Environmental Hazards
Public Health England
Chilton, Didcot, Oxfordshire OX11 0RQ
Published: November 2014
PHE publications gateway number: 2014484
PHE-CRCE-015
Centre for Radiation, Chemical and Environmental Hazards Public Health England Chilton, Didcot Oxfordshire OX11 0RQ
Approval: September 2014 Publication: November 2014 £32.00 ISBN 978-0-85951-762-1
This report from the PHE Centre for Radiation, Chemical and Environmental Hazards reflects understanding and evaluation of the current scientific evidence as presented and referenced in this document.
Radiological Impact of Routine Discharges from UK Civil Nuclear Licensed Sites During the 2000s
A L Jones, L W Ewers, S Holmes and T Cabianca
Abstract
This report presents an assessment of the radiological impact of routine atmospheric and liquid
discharges from UK civil nuclear licensed sites. It updates a previous report, NRPB-R312,
in considering discharges in the mid-2000s and using the most recent assessment methodology.
Calculations of collective effective doses integrated to 500 and 100,000 years, typical annual
individual doses and per-caput doses were performed for discharges in the mid-1990s and
mid-2000s using the updated PC-CREAM 08® software program, which implements the
EC methodology for assessing doses from routine releases from nuclear installations. Annual
discharges for the years 2003 and 2007 were taken to be typical discharges in the 2000s.
The calculations carried out for this report show that the collective doses to the European and
UK populations calculated for discharges in the mid-1990s and in 2003 and 2007 have
continued to decline from their peak values. The reduction is mainly due to a continued decline
in the liquid radioactive discharges from Sellafield. Collective doses integrated to 500 years to
the European population in 2003 and 2007 were estimated to be 41 man Sv and 19 man Sv,
respectively. Collective doses to the UK population were calculated to be 12 man Sv and
6 man Sv, respectively, in 2003 and 2007. The doses calculated in the previous report show that
the collective dose integrated to 500 years to the European and UK population from discharges
from UK civil nuclear sites peaked at around 370 man Sv and 130 man Sv, respectively, for
discharges in 1975. Collective doses to the European and UK populations for discharges in the
mid-1990s calculated using PC-CREAM 98 were 92 man Sv and 17 man Sv, respectively.
The per-caput doses to the UK population in the 100th year from discharges in 2003 ranged
across sites from 0.0013 nSv to 61 nSv; those for discharges in 2007 were between
0.00031 nSv and 16 nSv.
The average individual doses from discharges in 2003 and 2007 were estimated to be 1.0 Sv
and 0.3 Sv, respectively, and show that doses from UK civil nuclear sites continue to decrease;
the doses ranged across sites from 0.0004 Sv to 18 Sv in 2003 and 0.00009 Sv to 4.9 Sv
in 2007. Individual doses for discharges in the mid-1990s calculated using PC-CREAM 08
ranged across sites from 0.004 Sv to 16 Sv, with a mean values of 1.5 Sv. The mean typical
annual individual doses calculated in the previous report peaked at 32 Sv from discharges in
1975. Doses for discharges in 1985 and in the mid-1990s, calculated using PC-CREAM 98,
were 3.9 Sv and 1.1 Sv, respectively.

ii
This work was undertaken under the Environmental Assessment Department’s Quality Management
System, which has been approved by Lloyd's Register Quality Assurance to the Quality Management
Standards ISO 9001:2008, Certificate No. LRQ 0956546.
Report version 1.0
iii
Contents
Abstract i
1 Introduction 1
2 Sites Considered in This Study 1
3 Dosimetric Quantities 2
4 Data and Methods 5
4.1 Discharge data 5
4.2 Assessment methodology 6
4.2.1 Radionuclide dispersion 6
4.2.2 Calculation of collective doses 8
4.2.3 Calculations of per-caput doses 9
4.2.4 Calculation of individual doses 9
5 Results and Discussion 11
5.1 Collective doses to the population of Europe 11
5.2 Collective doses to the population of the UK 15
5.3 Annual individual doses to a typical individual living near a nuclear
installation in the UK 19
5.4 Average dose and dose rates per member of the UK population 22
6 Summary 27
7 References 28
Appendix A Radioactive Discharges from UK Civil Nuclear Licensed Sites in
1993–1995, 2003 and 2007 29
Appendix B Global Circulation of Radionuclides 51
Appendix C Collective Effective Doses Integrated to 500 Years per Unit Activity
Discharged 52
Appendix D Typical Annual Individual Effective Doses per Unit Activity
Discharged 82

Sites Considered in This Study
1
1 Introduction
In 2000 the National Radiological Protection Board (NRPB)* published a report on the
radiological impact of routine discharges from UK civil nuclear licensed sites in the mid-1990s
(Bexon, 2000), which provided the annual individual doses to typical adults and collective
doses to the European and UK populations due to discharges during the 1970s, 1980s
and 1990s.
The purpose of this assessment was to update the previous report (Bexon, 2000) and to
calculate collective doses to the European and UK populations, annual doses to typical
individuals residing near nuclear installations in the UK and the average dose to a member of
the UK population (also known as per-caput doses) from discharges for the years 2003 and
2007 as representative of the decade from 2000 to 2010.
Doses were calculated using a revised methodology for assessing the radiological
consequences of routine releases to the environment that was published by the Health
Protection Agency in 2009 (Smith and Simmonds, 2009) and implemented as the computer
code PC-CREAM 08® (PHE, 2014). In addition, doses due to the average annual discharges
for the period from 1993 to 1995 estimated in the previous study (Bexon, 2000) were
recalculated with PC-CREAM 08 to take account of any changes in the methodology.
Collective and individual doses in this report were compared with those published in the
previous report for discharges in the 1970s, 1980s and mid-1990s (Bexon, 2000). Doses for
the 1970s and 1980s are not directly comparable as different models and values were used to
calculate them, but were included to give an indication of the doses in those decades
compared to those in later years.
Average doses to a member of the UK population, also known as the per-caput doses, in the
100th year are also presented for discharges in 2003 and 2007, as well as per-caput dose
rates averaged over different time periods (Smith et al, 2007).
2 Sites Considered in This Study
There are 37 civil nuclear licensed sites in the UK. The sites considered in this study include
installations in the UK civil nuclear industry and facilities involved in the manufacture of
radiopharmaceuticals. Sites not considered are those in the defence industry, universities and
waste disposal facilities. As of the end of 2010, the civil nuclear industry consists of nuclear
power stations, nuclear fuel cycle facilities, and research and development facilities. The
nuclear power generation industry in the UK consists of ten operating nuclear power stations,
of which two operate Magnox reactors, seven operate advanced gas-cooled reactors (AGR)
and one operates a pressurised water reactor (PWR). Eight nuclear power stations are
presently in the defueling and/or decommissioning stage of their life cycle. Fuel cycle facilities
are located at Capenhurst, Springfields and Sellafield where uranium enrichment, fuel
fabrication, fuel reprocessing and spent fuel storage are carried out. The Sellafield site is a
large and complex facility and includes Calder Hall, a nuclear power station that generated
* The NRPB was subsequently incorporated into the Health Protection Agency (HPA). On 1 April 2013 the HPA
was abolished and its functions transferred to Public Health England.
Radiological Impact of Routine Discharges from UK Civil Nuclear Licensed Sites During the 2000s
2
electricity from 1956 to 2003. Discharges from all facilities located at Sellafield are covered by
a single permit. The former UK Atomic Energy Authority (UKAEA) has three sites that are
currently in the decommissioning stage: Dounreay, where three nuclear reactors and
fabrication and reprocessing facilities were built, Harwell and Winfrith. Two radioisotope
production sites at Cardiff and Amersham were also included in the assessment. A summary
of the sites considered in this study, including operational dates and current status, is
presented in Table 1; the locations of all sites are shown in Figure 1. The sites have been
grouped into operational types for the purpose of this report. Four types of facilities were
chosen:
a fuel fabrication installations (Capenhurst and Springfields)
b power production installations (all AGR sites, the Magnox sites and the PWR site)
c reprocessing installations as the main activity (Sellafield and Dounreay)
d other installations (Amersham and Cardiff sites, Harwell and Winfrith)
3 Dosimetric Quantities
The term ‘dose’ is used in this report to mean the dosimetric quantity of effective dose as
defined by the ICRP in its Publication 103 (ICRP, 2007) and is the sum of the annual external
effective dose and the committed effective dose to adults for intakes over one year; doses
from intakes were determined using dose coefficients given in ICRP Publication 119
(ICRP, 2012).
Annual doses to typical individuals residing near nuclear sites were calculated as a way of
providing a general perspective on the comparative radiological impact of different sites.
Doses to individuals representative of the people most likely to receive the highest dose,
otherwise referred to as the ‘representative person’ (ICRP, 2007), were not calculated in this
study. These doses are usually determined for comparison with the relevant dose criteria,
eg the annual dose limit for members of the public or the dose constraint. Doses to
representative persons based on monitoring surveys conducted at various installations in the
UK are published annually in the Radioactivity in Food and the Environment (RIFE) series
(EA et al, 2011).
Collective dose is the sum of the individual doses received by members of an exposed
population from all significant pathways. To account for the fact that radionuclides can give
rise to doses over an extended period of time, long after discharges have stopped, collective
doses are integrated over various times following the year of release. In its most recent
recommendations (ICRP, 2007) the ICRP stresses that collective effective dose is a tool for
optimisation, for comparing technologies and procedures and that it is not intended for
epidemiological studies and it is inappropriate to use in risk projections. Specifically, the ICRP
recommends that the calculation of cancer deaths based on collective effective dose involving
trivial exposures to large population is unreasonable and should be avoided. However, it is
considered that collective doses can be used more widely than ICRP Publication 103
recommends for occupational and public exposure, eg to indicate if a particular situation
warrants a detailed epidemiological study or comparison of past discharges from different
sites (HPA, 2009).
Dosimetric Quantities
3
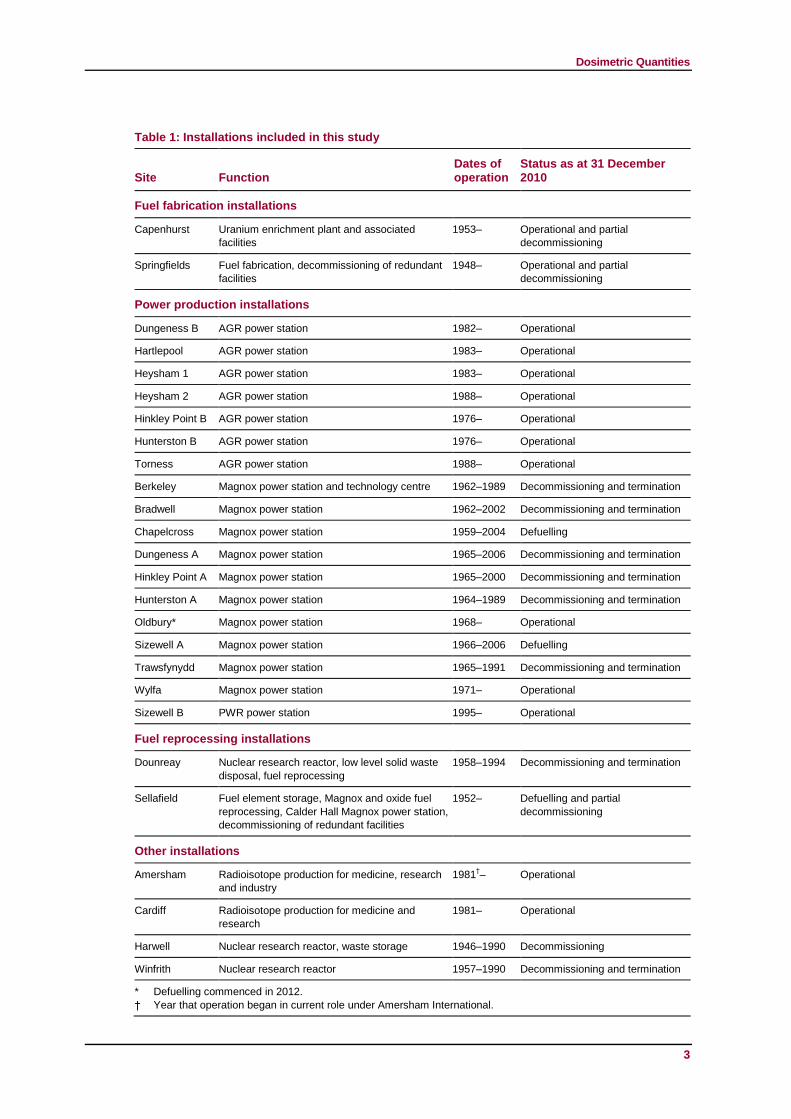
Table 1: Installations included in this study
Site Function Dates of operation
Status as at 31 December 2010
Fuel fabrication installations
Capenhurst Uranium enrichment plant and associated
facilities
1953– Operational and partial
decommissioning
Springfields Fuel fabrication, decommissioning of redundant
facilities
1948– Operational and partial
decommissioning
Power production installations
Dungeness B AGR power station 1982– Operational
Hartlepool AGR power station 1983– Operational
Heysham 1 AGR power station 1983– Operational
Heysham 2 AGR power station 1988– Operational
Hinkley Point B AGR power station 1976– Operational
Hunterston B AGR power station 1976– Operational
Torness AGR power station 1988– Operational
Berkeley Magnox power station and technology centre 1962–1989 Decommissioning and termination
Bradwell Magnox power station 1962–2002 Decommissioning and termination
Chapelcross Magnox power station 1959–2004 Defuelling
Dungeness A Magnox power station 1965–2006 Decommissioning and termination
Hinkley Point A Magnox power station 1965–2000 Decommissioning and termination
Hunterston A Magnox power station 1964–1989 Decommissioning and termination
Oldbury* Magnox power station 1968– Operational
Sizewell A Magnox power station 1966–2006 Defuelling
Trawsfynydd Magnox power station 1965–1991 Decommissioning and termination
Wylfa Magnox power station 1971– Operational
Sizewell B PWR power station 1995– Operational
Fuel reprocessing installations
Dounreay Nuclear research reactor, low level solid waste
disposal, fuel reprocessing
1958–1994 Decommissioning and termination
Sellafield Fuel element storage, Magnox and oxide fuel
reprocessing, Calder Hall Magnox power station,
decommissioning of redundant facilities
1952– Defuelling and partial
decommissioning
Other installations
Amersham Radioisotope production for medicine, research
and industry
1981†– Operational
Cardiff Radioisotope production for medicine and
research
1981– Operational
Harwell Nuclear research reactor, waste storage 1946–1990 Decommissioning
Winfrith Nuclear research reactor 1957–1990 Decommissioning and termination
* Defuelling commenced in 2012.
† Year that operation began in current role under Amersham International.

Radiological Impact of Routine Discharges from UK Civil Nuclear Licensed Sites During the 2000s
4
Figure 1: UK civil nuclear licensed sites considered in this study (contains Ordnance Survey data © Crown copyright and database right 2014)
Data and Methods
5
The UK environment agencies recommend the use of collective doses integrated to 500 years
from a single year of discharge for authorisation purposes (EA et al, 2012). It can be shown
that the collective dose integrated to a particular time from one year’s operation of a practice is
numerically equal to the maximum annual collective dose rate if the practice operated
unchanged for that time period, provided all other factors remained the same. The integration
time of 500 years has been chosen because proposed new practices are assumed to operate
unchanged for a period of not more than 500 years. Although individual facilities will not exist
for such an extended period of time, they are likely to be replaced by similar installations. In
this study the collective doses were calculated for the European and UK populations.
Although the ICRP also recommends that the distribution of individual doses in ranges should
be provided when calculating collective doses, such disaggregation is not usually possible.
For example, if ingestion of food is an important exposure pathway, disaggregation is
impossible because food is typically widely distributed and not sourced from an individual’s
immediate vicinity. As an alternative, per-caput doses, that is the average individual doses
received by each member of the UK population, provide another useful input in the decision
making process for permitting purposes. In this report, the collective doses to the population of
the UK from one year’s discharge integrated to 100 years were divided by the UK population
to obtain the per-caput dose in the 100th year. The period of 100 years is taken to represent
the typical time a nuclear facility would be discharging radionuclides into the environment:
60 years for the operational stage and 40 years in decommissioning. This value gives the
highest average annual individual dose to the UK population from discharges over this period,
assuming that the facility operates unchanged for that time period and provided that all other
factors remain the same. In addition, the indicative per-caput dose rates during selected time
periods were produced (Smith et al, 2007).
More details of the methods used to calculate these doses are given in Section 4.2.3.
4 Data and Methods
4.1 Discharge data
In 2004, the European Commission issued a recommendation on standardising information on
radioactive atmospheric and liquid discharges from nuclear reactors and reprocessing facilities
(EC, 2004). Subsequently nuclear reactor and nuclear reprocessing sites across Europe were
required to report radioactive discharges, defined by categories and individual radionuclides,
depending on their relevance in terms of radiological protection. In this study extensive use
was made of the discharges reported by UK sites under the EC recommendation. Sites that
do not operate nuclear reactors (ie Amersham, Capenhurst, Cardiff, Harwell and Springfields)
are not required to submit discharge data. Therefore for these sites discharge data was
obtained from the RIFE reports (EA et al, 2004 and 2008). The discharges for the 1990s were
taken from the previous report (Bexon, 2000).
Generally data reported to the EC includes the activity released over a year for individual
radionuclides. In other cases discharges were reported as aggregated totals, such as total
alpha or total beta/gamma radiation. In order to calculate doses it is necessary to use activity
discharged for individual radionuclides, so assumptions with regard to the composition of
aggregated total discharges were made using information contained in other reports (Bexon,
2000; EA et al, 2004, 2008; Jones et al, 2013).
Radiological Impact of Routine Discharges from UK Civil Nuclear Licensed Sites During the 2000s
6
In the previous assessment of doses from UK civil nuclear licensed sites, the beta/gamma
aggregated category for atmospheric discharges was assumed to be all 65
Zn for discharges in
1993–1995 (Bexon, 2000). For this assessment it was decided that for discharges in both
2003 and 2007 the breakdown for this category would be 77% 137
Cs and 23% 60
Co for
Magnox reactors; for AGR power stations it was assumed that beta discharges consisted
entirely of 65
Zn; and for the PWR power station at Sizewell B it was assumed to be 96% 137
Cs
and 4% 60
Co (EC, 2004).
All assumptions made for discharges are described in Appendix A, which gives the discharge
data for 1993–1995 and 2003 and 2007 for each discharge route.
4.2 Assessment methodology
4.2.1 Radionuclide dispersion
The doses presented in this report were calculated using PC-CREAM 08 (PHE, 2014) –
a computer program developed by PHE (and predecessor organisations) with endorsement
from the European Commission – which implements an updated methodology for the
assessment of the radiological consequences of routine discharges to the environment
(Smith and Simmonds, 2009). PC-CREAM is a suite of models that calculate both activity
concentrations in various media and doses.
The marine compartmental model in PC-CREAM 08 was used to calculate doses resulting
from discharges into the marine environment (Smith and Simmonds, 2009). It comprises a
generic regional model and a site-specific local model. The local model simulates the
dispersion near the site and therefore is important in assessing individual doses in the local
population, while the regional model is more important for collective doses. The local
compartments typically extend for 5 km along the coastline either side of the site. The regional
marine compartments surrounding the UK are presented in Figure 2.
PC-CREAM 08 does not have the capability to calculate collective doses for discharges to
rivers and lakes. Therefore, the multicompartmental biosphere model (BIOS) (Martin et al,
1991) was used to calculate collective doses due to discharges from Harwell and Amersham
into the river Thames and from Trawsfynydd into Trawsfynydd lake.
For discharges to atmosphere, the dispersion of the radionuclides was simulated using a
Gaussian plume model within PC-CREAM 08 (Smith and Simmonds, 2009). A generic uniform
wind rose using Pasquill 70% category D and 10% rain in C and D was assumed for each site
(Smith and Simmonds, 2009). For nuclear power plants, Amersham, Capenhurst and
Springfields, all discharges were assumed to have been emitted from a single 30 m effective
stack height, as these installations have multiple discharge points which cannot easily be
modelled within PC-CREAM; exceptions to this general rule were Dounreay (60 m), Cardiff
(25 m), Harwell (10 m) and Sellafield (100 m) (Jones et al, 2013). Although they deviate from
those used in the previous report (Bexon, 2000), the stack heights used are thought to be
more representative. Both wet and dry deposition on to the ground were considered. Dry
deposition was estimated using a source depletion model and a deposition velocity of 10–3
m s–1
,
a value appropriate for 1 m particles for all radionuclides except isotopes of iodine, which
were assumed to have a dry deposition velocity of 10–2
m s–1
(Smith and Simmonds, 2009).

Data and Methods
7
Figure 2: Regional marine compartments surrounding the UK

Radiological Impact of Routine Discharges from UK Civil Nuclear Licensed Sites During the 2000s
8
Wet deposition was accounted for by using a washout coefficient (Smith and Simmonds,
2009) of 10–4
s–1
. Noble gases (except the decay products of isotopes of 222
Rn), 3H and
14C
were assumed not to deposit under either dry or wet conditions. Tritium and 14
C in
environmental media were assumed to reach equilibrium very rapidly.
Other pathways considered were exposure to external gamma and beta radiation from
radionuclides in the air. Activity concentrations in local terrestrial foods from deposited activity
were calculated using the FARMLAND model (Smith and Simmonds, 2009). Doses were also
calculated for inhalation of resuspended material and external exposure to deposited activity.
4.2.2 Calculation of collective doses
In this study collective doses integrated to 500 years for a single year of discharge were
calculated for the populations of the UK and Europe. For the purposes of the calculations, the
population sizes were taken to be 60 million for the UK and 360 million for ‘EU12’. The
countries considered to be in EU12 in PC-CREAM 08 are the 12 countries that made up the
European Union in 1986: Belgium, Denmark, France, Germany, Greece, Ireland, Italy,
Luxembourg, Netherlands, Portugal, Spain and the UK (Smith and Simmonds, 2009).
However, in some cases doses were calculated for different European regions because data
was not available for EU12.
For atmospheric discharges the first pass contribution to collective dose was calculated for the
UK, but also for a greater European region which included all countries within a 3000 km
radius of the UK, including western Russia, Turkey, parts of North Africa and the Middle East.
This was the same as in the previous study (Bexon, 2000). Activity concentrations in
environmental media calculated on a polar grid basis were combined with default population
and agricultural production grids for the relevant region to obtain collective doses (Smith and
Simmonds, 2009). It was assumed that all the relevant food produced in an annular segment
of the polar grid was consumed by the populations of the UK and or ‘greater’ Europe. When
calculating the activity concentrations in foods, allowance was made for the decay of
radionuclides during the period between harvest and consumption using delay times given in
HPA-RPD-043 (Jones and Sherwood, 2008). For the global component the UK and EU12
populations were considered; for the previous study the UK population was used but the
European population was much larger, ie about 700 million.
For discharges to the marine environment, the activity concentrations in environmental media
were combined with seafood catch data and coastline occupancies to estimate collective
doses from the first pass dispersion (Smith and Simmonds, 2009). Seafood catch data for the
UK and EU12 was used. For the UK the data was similar to that used in the previous report;
however, for Europe the previous report included catch data for additional countries such as
Finland and Sweden. The global component of the marine collective dose in this study
considered the UK and EU12 populations, while the previous study considered the UK and
‘Europe’, the latter again comprising some 700 million people. The collective doses for
discharges to the marine environment calculated in this report include doses due to the
ingrowth of the first progeny; doses from any progeny further down the decay chain were not
significant and were not considered.
Some radionuclides, which either have long half-lives or are mobile in the environment, such
as 3H,
14C,
85Kr and
129I, become dispersed globally and lead to long-term exposure of regional
or world populations. Collective doses from the global circulation of these radionuclides
Data and Methods
9
were added to those from their initial dispersion from their discharge point, More information
on how doses from global circulation of 3H,
14C,
85Kr and
129I were calculated is given in
Appendix B.
4.2.3 Calculations of per-caput doses
The per-caput doses to the UK population were calculated by dividing the collective doses
integrated to 100 years, from single year discharges in 2003 and 2007, by the size of the UK
population (ie 60 million). Since discharges from a single installation are unlikely to continue
for more than 100 years, longer time periods were not considered.
In addition, per-caput dose rates for selected time periods were calculated by dividing the
difference between the collective dose integrated to successive times Tj + 1 and Tj by the time
period considered (Tj + 1 – Tj ) and the UK population (Smith et al, 2007). The per-caput dose
rates were calculated using the equation:
1
per caput
1 UK
j j
j
j j
S T S TD T
T T P
where S(Tj) is the collective dose to the UK population integrated to time Tj and PUK is the
population of the UK. The times selected for the calculations were 1, 50, 100, 500, 1000,
5000, 10 000, 50,000 and 100,000 years. Much longer times have been considered than were
for the individual and collective doses to indicate the effect of long-lived radionuclides.
Although this is a simplistic approach which assumes that the collective doses increase
linearly with time, it enables a broad estimate of levels of per-caput dose contributing to the
collective dose at different times.
4.2.4 Calculation of individual doses
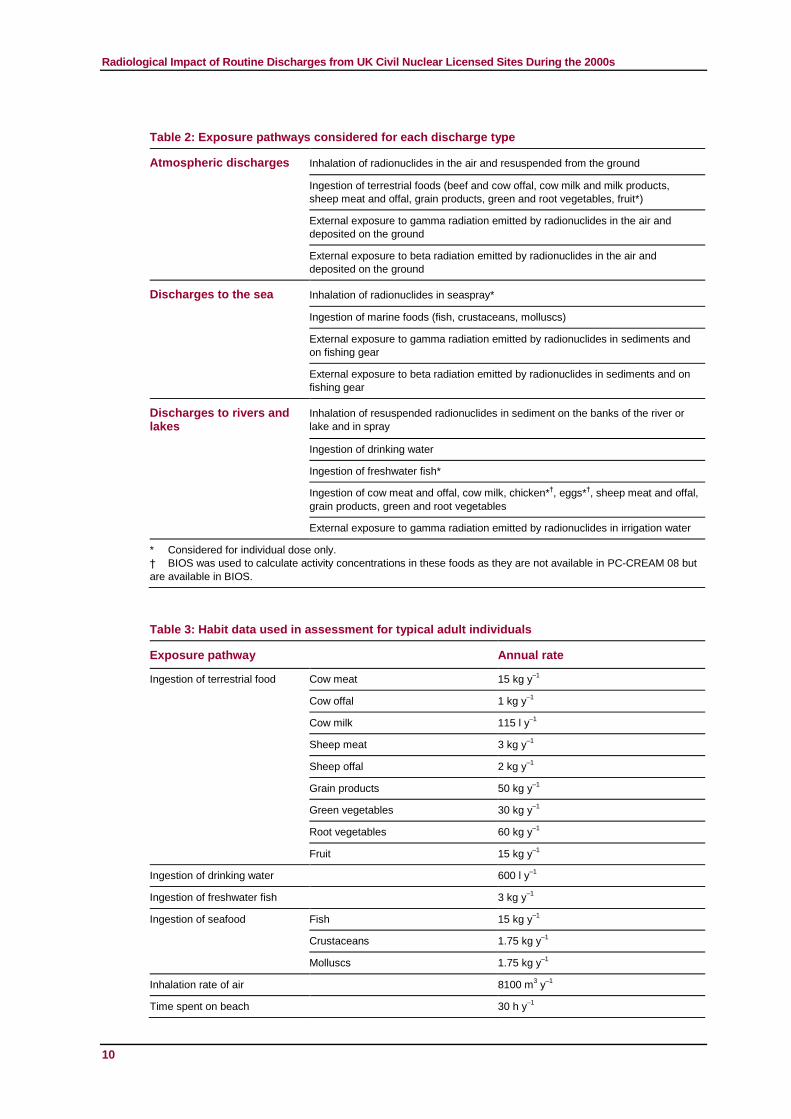
Annual doses in the year of discharge to typical adult individuals residing near nuclear sites
were calculated by selecting appropriate habit and food consumption data and using
calculated activity concentrations in environmental media near the site. The pathways and
habit data considered in this assessment are representative of people living in the UK (Bexon,
2000; Smith and Jones, 2003) and are presented in Tables 2 and 3, respectively.
In calculating doses from marine discharges, it was assumed that 10% of the fish and 25% of
the crustaceans and molluscs were caught from the local compartment and that time on the
beach was spent entirely within the local compartment (Bexon, 2000).
For exposure from atmospheric discharges, it was assumed that the typical individual lived
5 km due east of the site except for sites on the east of the UK where the individual was
assumed to live due north. It was further assumed that this individual obtained 25% of their
annual food consumption from the local area. This individual was also assumed to reside at
the chosen location throughout the year and spend 90% of this time indoors.
Radiological Impact of Routine Discharges from UK Civil Nuclear Licensed Sites During the 2000s
10
Table 2: Exposure pathways considered for each discharge type
Atmospheric discharges Inhalation of radionuclides in the air and resuspended from the ground
Ingestion of terrestrial foods (beef and cow offal, cow milk and milk products,
sheep meat and offal, grain products, green and root vegetables, fruit*)
External exposure to gamma radiation emitted by radionuclides in the air and
deposited on the ground
External exposure to beta radiation emitted by radionuclides in the air and
deposited on the ground
Discharges to the sea Inhalation of radionuclides in seaspray*
Ingestion of marine foods (fish, crustaceans, molluscs)
External exposure to gamma radiation emitted by radionuclides in sediments and
on fishing gear
External exposure to beta radiation emitted by radionuclides in sediments and on
fishing gear
Discharges to rivers and lakes
Inhalation of resuspended radionuclides in sediment on the banks of the river or
lake and in spray
Ingestion of drinking water
Ingestion of freshwater fish*
Ingestion of cow meat and offal, cow milk, chicken*†, eggs*
†, sheep meat and offal,
grain products, green and root vegetables
External exposure to gamma radiation emitted by radionuclides in irrigation water
* Considered for individual dose only.
† BIOS was used to calculate activity concentrations in these foods as they are not available in PC-CREAM 08 but
are available in BIOS.
Table 3: Habit data used in assessment for typical adult individuals
Exposure pathway Annual rate
Ingestion of terrestrial food Cow meat 15 kg y–1
Cow offal 1 kg y–1
Cow milk 115 l y–1
Sheep meat 3 kg y–1
Sheep offal 2 kg y–1
Grain products 50 kg y–1
Green vegetables 30 kg y–1
Root vegetables 60 kg y–1
Fruit 15 kg y–1
Ingestion of drinking water 600 l y–1
Ingestion of freshwater fish 3 kg y–1
Ingestion of seafood Fish 15 kg y–1
Crustaceans 1.75 kg y–1
Molluscs 1.75 kg y–1
Inhalation rate of air 8100 m3 y
–1
Time spent on beach 30 h y–1
Results and Discussion
11
5 Results and Discussion
5.1 Collective doses to the population of Europe
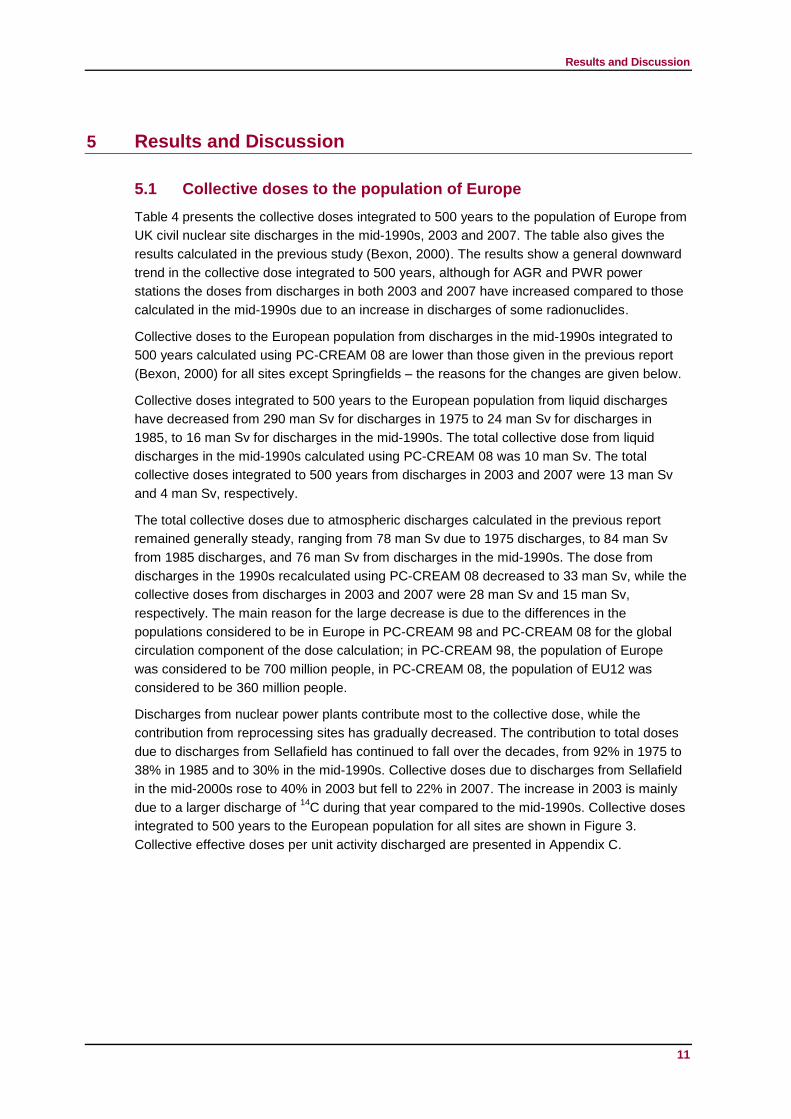
Table 4 presents the collective doses integrated to 500 years to the population of Europe from
UK civil nuclear site discharges in the mid-1990s, 2003 and 2007. The table also gives the
results calculated in the previous study (Bexon, 2000). The results show a general downward
trend in the collective dose integrated to 500 years, although for AGR and PWR power
stations the doses from discharges in both 2003 and 2007 have increased compared to those
calculated in the mid-1990s due to an increase in discharges of some radionuclides.
Collective doses to the European population from discharges in the mid-1990s integrated to
500 years calculated using PC-CREAM 08 are lower than those given in the previous report
(Bexon, 2000) for all sites except Springfields – the reasons for the changes are given below.
Collective doses integrated to 500 years to the European population from liquid discharges
have decreased from 290 man Sv for discharges in 1975 to 24 man Sv for discharges in
1985, to 16 man Sv for discharges in the mid-1990s. The total collective dose from liquid
discharges in the mid-1990s calculated using PC-CREAM 08 was 10 man Sv. The total
collective doses integrated to 500 years from discharges in 2003 and 2007 were 13 man Sv
and 4 man Sv, respectively.
The total collective doses due to atmospheric discharges calculated in the previous report
remained generally steady, ranging from 78 man Sv due to 1975 discharges, to 84 man Sv
from 1985 discharges, and 76 man Sv from discharges in the mid-1990s. The dose from
discharges in the 1990s recalculated using PC-CREAM 08 decreased to 33 man Sv, while the
collective doses from discharges in 2003 and 2007 were 28 man Sv and 15 man Sv,
respectively. The main reason for the large decrease is due to the differences in the
populations considered to be in Europe in PC-CREAM 98 and PC-CREAM 08 for the global
circulation component of the dose calculation; in PC-CREAM 98, the population of Europe
was considered to be 700 million people, in PC-CREAM 08, the population of EU12 was
considered to be 360 million people.
Discharges from nuclear power plants contribute most to the collective dose, while the
contribution from reprocessing sites has gradually decreased. The contribution to total doses
due to discharges from Sellafield has continued to fall over the decades, from 92% in 1975 to
38% in 1985 and to 30% in the mid-1990s. Collective doses due to discharges from Sellafield
in the mid-2000s rose to 40% in 2003 but fell to 22% in 2007. The increase in 2003 is mainly
due to a larger discharge of 14
C during that year compared to the mid-1990s. Collective doses
integrated to 500 years to the European population for all sites are shown in Figure 3.
Collective effective doses per unit activity discharged are presented in Appendix C.

Radiological Impact of Routine Discharges from UK Civil Nuclear Licensed Sites During the 2000s
12
Table 4: Collective effective doses to the European population integrated to 500 years from discharges from UK civil nuclear sites
Site Discharge
Collective dose (man Sv)
1975* 1985* 1993–1995† 1993–1995
‡ 2003 2007
Fuel fabrication installations
Capenhurst Atmospheric 1.3 10–2
2.9 10–4
2.0 10–1
1.1 10–1
5.8 10–4
1.7 10–5
Liquid 3.4 10–5
9.0 10–6
5.7 10–5
7.3 10–5
1.8 10–5
9.8 10–6
Total 1.3 10–2
3.0 10–4
2.0 10–1
1.1 10–1
6.0 10–4
2.6 10–5
Springfields Atmospheric 4.3 10–1
4.1 10–2
4.3 10–2
4.7 10–2
3.3 10–2
1.9 10–2
Liquid 2.0 10–2
1.1 10–2
4.6 10–3
7.0 10–3
7.3 10–3
2.3 10–3
Total 4.5 10–1
5.2 10–2
4.8 10–2
5.4 10–2
4.1 10–2
2.2 10–2
Total (fuel
fabrication)
Atmospheric 4.4 10–1
4.1 10–2
2.5 10–1
1.6 10–1
3.4 10–2
1.9 10–2
Liquid 2.0 10–2
1.1 10–2
4.7 10–3
7.1 10–3
7.3 10–3
2.3 10–3
Total 4.6 10–1
5.3 10–2
2.5 10–1
1.6 10–1
4.1 10–2
2.2 10–2
Power production installations
AGR power stations
Dungeness B Atmospheric nd§
5.0 100 4.4 10
–1 2.1 10
–1 9.5 10
–1 1.0 10
0
Liquid nd 1.4 10–3
1.4 10–3
6.5 10–4
1.1 10–3
6.8 10–4
Total nd 5.0 100 4.4 10
–1 2.1 10
–1 9.5 10
–1 1.0 10
0
Hartlepool Atmospheric nd 4.8 100 2.2 10
0 1.0 10
0 2.1 10
0 1.9 10
0
Liquid nd 3.1 10–4
1.7 10–3
1.4 10–3
9.7 10–4
7.3 10–4
Total nd 4.8 100 2.2 10
0 1.0 10
0 2.1 10
0 1.9 10
0
Heysham 1 Atmospheric nd 3.7 100 2.0 10
0 1.2 10
0 1.9 10
0 1.7 10
0
Liquid nd 2.6 10–4
1.9 10–3
1.4 10–3
1.3 10–3
8.1 10–4
Total nd 3.7 100 2.0 10
0 1.2 10
0 1.9 10
0 1.7 10
0
Heysham 2 Atmospheric nd nd 1.3 100 7.8 10
–1 1.4 10
0 1.74 10
0
Liquid nd nd 2.5 10–3
1.7 10–3
2.6 10–3
6.0 10–4
Total nd nd 1.3 100 7.8 10
–1 1.4 10
0 1.7 10
0
Hinkley Point B Atmospheric nd 5.6 100 3.7 10
0 1.5 10
0 1.6 10
0 5.9 10
–1
Liquid nd 1.5 10–3
1.4 10–3
5.7 10–4
5.6 10–4
7.5 10–5
Total nd 5.6 100 3.7 10
0 1.5 10
0 1.6 10
0 6.0 10
–1
Hunterston B Atmospheric nd 4.6 100 2.7 10
0 1.2 10
0 1.7 10
0 5.6 10
–1
Liquid nd 2.9 10–3
2.1 10–3
8.5 10–4
2.5 10–4
1.3 10–4
Total nd 4.6 100 2.7 10
0 1.2 10
0 1.7 10
0 5.6 10
–1
Torness Atmospheric nd nd 1.0 100 5.6 10
–1 7.2 10
–1 9.6 10
–1
Liquid nd nd 8.7 10–4
3.7 10–4
4.7 10–4
4.9 10–4
Total nd nd 1.0 100 5.6 10
–1 7.2 10
–1 9.6 10
–1
Results and Discussion
Table 4: continued
13
Site Discharge
Collective dose (man Sv)
1975* 1985* 1993–1995† 1993–1995
‡ 2003 2007
Magnox power stations
Berkeley Atmospheric 2.7 100 2.6 10
0 2.6 10
–3 9.3 10
–4 3.2 10
–4 3.2 10
–4
Liquid 2.3 10–2
4.1 10–3
1.4 10–3
5.9 10–4
1.3 10–6
3.6 10–7
Total 2.7 100 2.6 10
0 4.0 10
–3 1.5 10
–3 3.2 10
–4 3.2 10
–4
Bradwell Atmospheric 1.9 100 2.0 10
0 1.2 10
0 5.9 10
–1 1.1 10
–4 1.7 10
–5
Liquid 1.7 10–1
9.8 10–2
2.2 10–2
1.2 10–2
1.1 10–2
5.4 10–4
Total 2.1 100 2.1 10
0 1.2 10
0 6.0 10
–1 1.1 10
–2 5.6 10
–4
Chapelcross Atmospheric 5.6 10–1
5.6 100 4.7 10
0 2.4 10
0 6.8 10
–1 7.0 10
–2
Liquid 1.8 10–2
2.3 10–2
1.1 10–3
1.8 10–3
1.7 10–3
2.8 10–5
Total 5.8 10–1
5.6 100 4.7 10
0 2.4 10
0 6.8 10
–1 7.0 10
–2
Dungeness A Atmospheric 2.1 100 2.1 10
0 9.3 10
0 4.5 10
0 4.4 10
0 3.1 10
–1
Liquid 1.0 10–1
8.1 10–2
3.3 10–2
1.8 10–2
8.9 10–3
1.5 10–3
Total 2.2 100 2.2 10
0 9.3 10
0 4.5 10
0 4.4 10
0 3.1 10
–1
Hinkley Point A Atmospheric 2.8 100 2.8 10
0 5.0 10
0 1.9 10
0 3.1 10
–3 9.8 10
–4
Liquid 6.9 10–2
4.2 10–2
8.9 10–3
2.7 10–3
2.3 10–3
6.9 10–4
Total 2.9 100 2.8 10
0 5.0 10
0 1.9 10
0 5.5 10
–3 1.7 10
–3
Hunterston A Atmospheric 1.9 100 1.9 10
0 6.5 10
–2 2.9 10
–2 1.9 10
–4 1.9 10
–4
Liquid 1.5 10–1
1.7 10–1
7.0 10–3
2.3 10–3
4.2 10–4
1.0 10–4
Total 2.0 100 2.1 10
0 7.2 10
–2 3.1 10
–2 6.2 10
–4 2.9 10
–4
Oldbury Atmospheric 2.6 100 2.6 10
0 1.3 10
1 4.9 10
0 2.4 10
0 4.1 10
–1
Liquid 1.1 10–2
1.5 10–2
8.0 10–4
3.9 10–4
2.8 10–3
2.5 10–3
Total 2.6 100 2.6 10
0 1.3 10
1 4.9 10
0 2.4 10
0 4.1 10
–1
Sizewell A Atmospheric 2.0 100 1.9 10
0 2.2 10
0 1.2 10
0 1.8 10
0 1.5 10
–1
Liquid 3.1 10–2
3.7 10–2
7.8 10–3
3.3 10–3
1.5 10–2
6.4 10–3
Total 2.0 100 2.0 10
0 2.2 10
0 1.2 10
0 1.8 10
0 1.6 10
–1
Trawsfynydd Atmospheric 1.6 100 1.9 10
0 1.7 10
–3 9.7 10
–4 1.6 10
–3 3.2 10
–3
Liquid 4.5 10–1
1.7 10–1
2.5 10–2
5.4 10–3
1.1 10–3
5.8 10–4
Total 2.1 100 2.1 10
0 2.7 10
–2 6.4 10
–3 2.7 10
–3 3.8 10
–3
Wylfa Atmospheric 1.4 100 1.5 10
0 2.4 10
0 1.4 10
0 1.6 10
0 1.1 10
0
Liquid 3.1 10–3
2.7 10–4
5.5 10–4
9.3 10–4
6.8 10–4
3.1 10–4
Total 1.4 100 1.5 10
0 2.4 10
0 1.4 10
0 1.6 10
0 1.1 10
0
PWR power station
Sizewell B Atmospheric nd nd 2.9 10–2
1.7 10–2
3.7 10–1
3.9 10–1
Liquid nd nd 1.6 10–4
6.5 10–5
9.8 10–4
3.2 10–4
Total nd nd 3.0 10–2
1.7 10–2
3.7 10–1
3.9 10–1
Total (power
production)
Atmospheric 2.0 101 4.9 10
1 5.1 10
1 2.3 10
1 2.2 10
1 1.1 10
1
Liquid 1.0 100 6.5 10
–1 1.2 10
–1 5.5 10
–2 5.2 10
–2 1.7 10
–2
Total 2.1 101 4.9 10
1 5.1 10
1 2.3 10
1 2.2 10
1 1.1 10
1

Radiological Impact of Routine Discharges from UK Civil Nuclear Licensed Sites During the 2000s
Table 4: continued
14
Site Discharge
Collective dose (man Sv)
1975* 1985* 1993–1995† 1993–1995
‡ 2003 2007
Fuel reprocessing installations
Dounreay Atmospheric 1.6 10–1
8.4 10–2
5.0 10–2
3.2 10–2
7.8 10–3
1.9 10–3
Liquid 1.8 100 7.1 10
–1 2.3 10
–1 3.1 10
–2 6.6 10
–4 4.6 10
–6
Total 2.0 100 8.0 10
–1 2.8 10
–1 6.3 10
–2 8.5 10
–3 1.9 10
–3
Sellafield Atmospheric 5.6 101 2.3 10
1 1.6 10
1 5.9 10
0 3.5 10
0 8.6 10
–1
Liquid 2.8 102 1.9 10
1 1.2 10
1 8.4 10
0 1.3 10
1 3.4 10
0
Total 3.4 102 4.2 10
1 2.8 10
1 1.4 10
1 1.6 10
1 4.3 10
0
Total (fuel
reprocessing)
Atmospheric 5.6 101 2.3 10
1 1.6 10
1 5.9 10
0 3.5 10
0 8.6 10
–1
Liquid 2.8 102 2.0 10
1 1.3 10
1 8.5 10
0 1.3 10
1 3.4 10
0
Total 3.4 102 4.3 10
1 2.9 10
1 1.4 10
1 1.6 0
1 4.3 10
0
Other installations
Amersham Atmospheric nd 2.2 100 5.6 10
–1 2.9 10
–1 2.0 10
–1 6.2 10
–1
Liquid nd 7.3 10–1
1.5 100 6.7 10
–1 4.8 10
–2 1.5 10
–2
Total nd 3.0 100 2.0 10
0 9.6 10
–1 2.5 10
–1 6.3 10
–1
Cardiff Atmospheric nd 8.1 100 9.6 10
0 3.7 10
0 2.9 10
0 2.9 10
0
Liquid nd 1.2 100 1.3 10
0 5.9 10
–1 7.0 10
–2 7.0 10
–2
Total nd 9.3 100 1.1 10
1 4.3 10
0 3.0 10
0 3.0 10
0
Harwell Atmospheric 8.3 10–1
9.4 10–1
6.0 10–2
3.0 10–2
6.4 10–2
6.3 10–2
Liquid 1.3 100 2.3 10
–1 6.6 10
–2 3.6 10
–2 4.9 10
–3 1.6 10
–3
Total 2.1 100 1.2 10
0 1.3 10
–1 6.6 10
–2 6.9 10
–2 6.5 10
–2
Winfrith Atmospheric 7.6 10–1
8.7 10–1
4.4 10–2
1.6 10–2
5.1 10–2
1.3 10–2
Liquid 2.9 100 1.8 10
0 7.5 10
–3 4.3 10
–3 4.5 10
–3 5.7 10
–4
Total 3.6 100 2.7 10
0 5.2 10
–2 2.0 10
–2 5.6 10
–2 1.3 10
–2
Total (other
installations)
Atmospheric 1.6 100 1.2 10
1 1.0 10
1 4.0 10
0 3.2 10
0 3.6 10
0
Liquid 4.2 100 4.0 10
0 2.9 10
0 1.3 10
0 1.3 10
–1 8.7 10
–2
Total 5.7 100 1.6 10
1 1.3 10
1 5.3 10
0 3.4 10
0 3.7 10
0
Total (all sites)
Atmospheric 7.8 101 8.4 10
1 7.6 10
1 3.3 10
1 2.8 10
1 1.5 10
1
Liquid 2.9 102 2.4 10
1 1.6 10
1 9.8 10
0 1.3 10
1 3.6 10
0
Total 3.7 102 1.1 10
2 9.2 10
1 4.3 10
1 4.1 10
1 1.9 10
1
* Taken from NRPB-R312.
† Calculated using PC-CREAM 98.
‡ Calculated using PC-CREAM 08.
§ nd = no discharges.
Results and Discussion
15
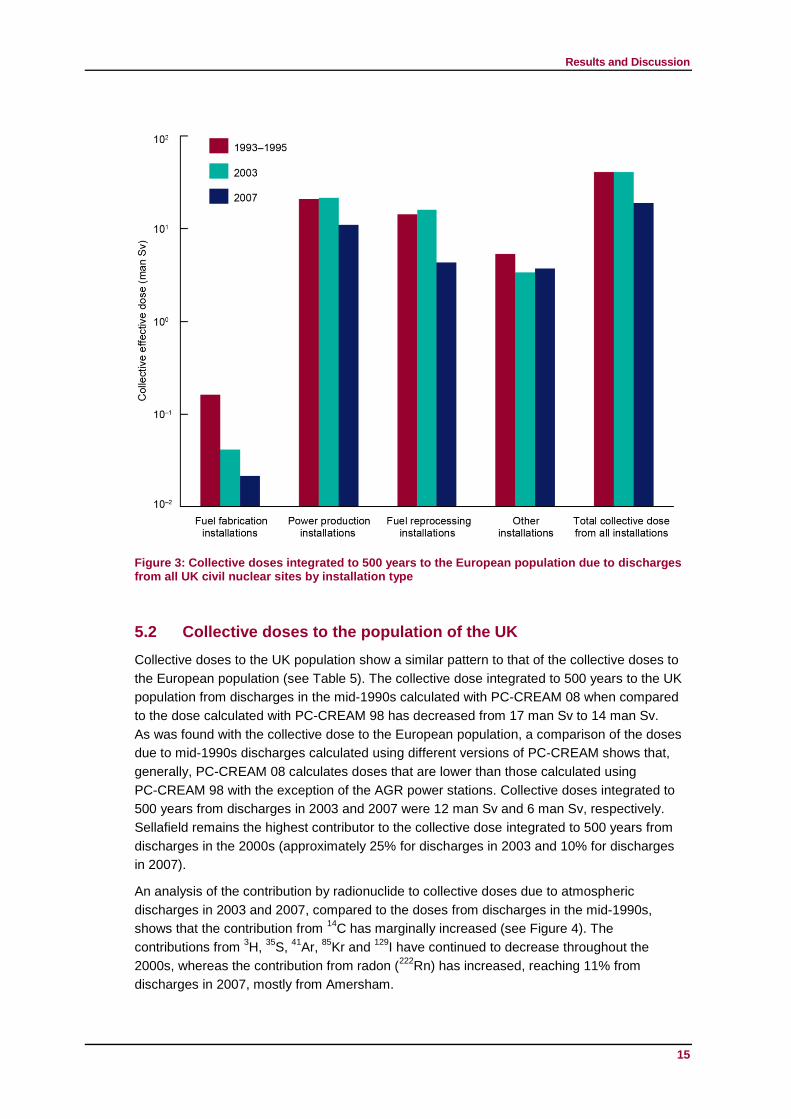
Figure 3: Collective doses integrated to 500 years to the European population due to discharges from all UK civil nuclear sites by installation type
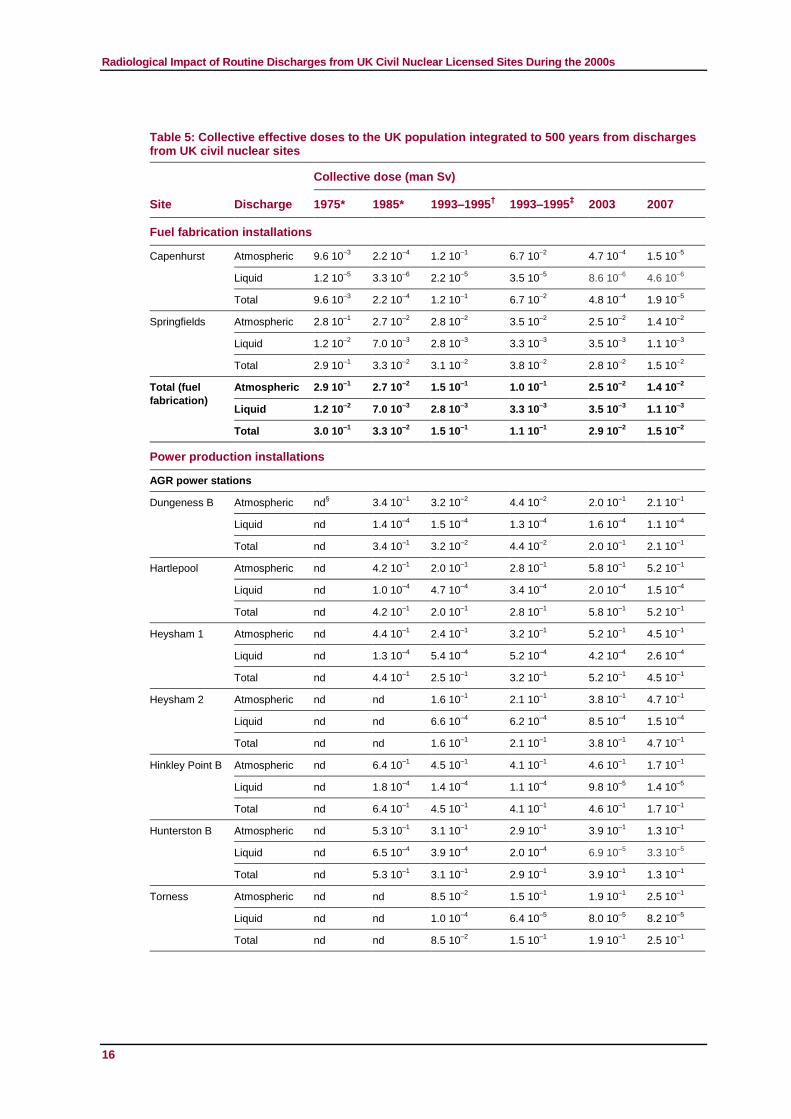
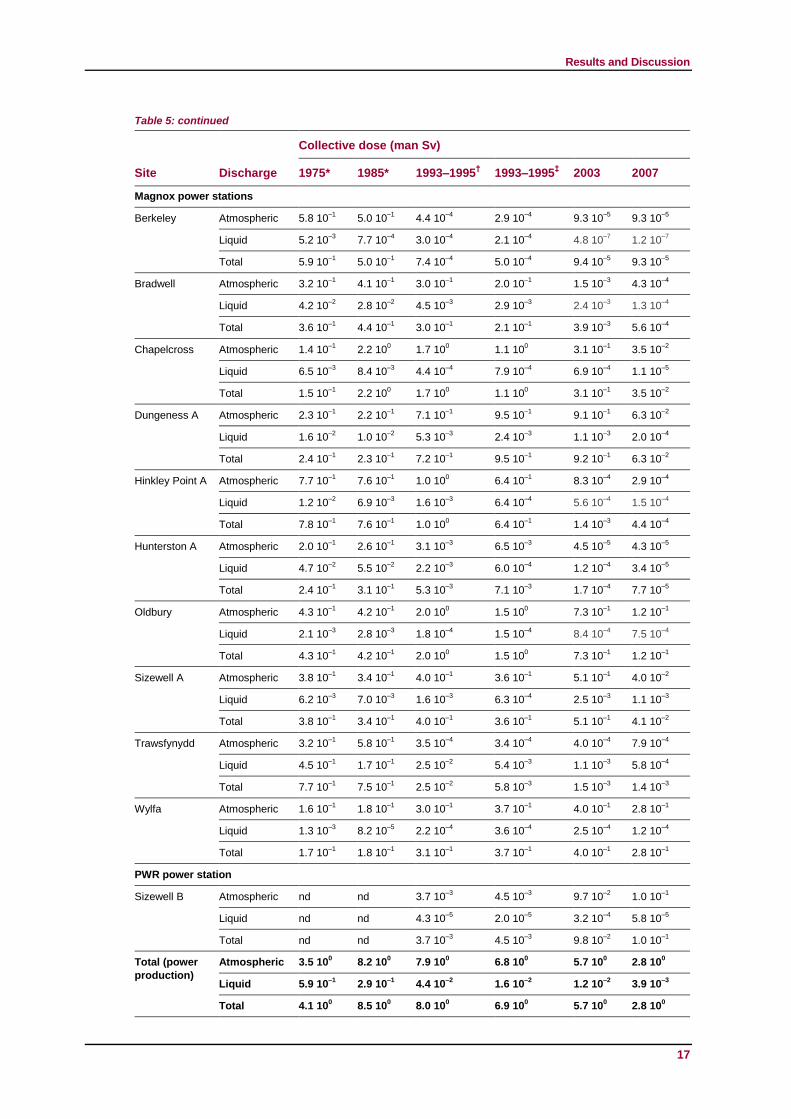
5.2 Collective doses to the population of the UK
Collective doses to the UK population show a similar pattern to that of the collective doses to
the European population (see Table 5). The collective dose integrated to 500 years to the UK
population from discharges in the mid-1990s calculated with PC-CREAM 08 when compared
to the dose calculated with PC-CREAM 98 has decreased from 17 man Sv to 14 man Sv.
As was found with the collective dose to the European population, a comparison of the doses
due to mid-1990s discharges calculated using different versions of PC-CREAM shows that,
generally, PC-CREAM 08 calculates doses that are lower than those calculated using
PC-CREAM 98 with the exception of the AGR power stations. Collective doses integrated to
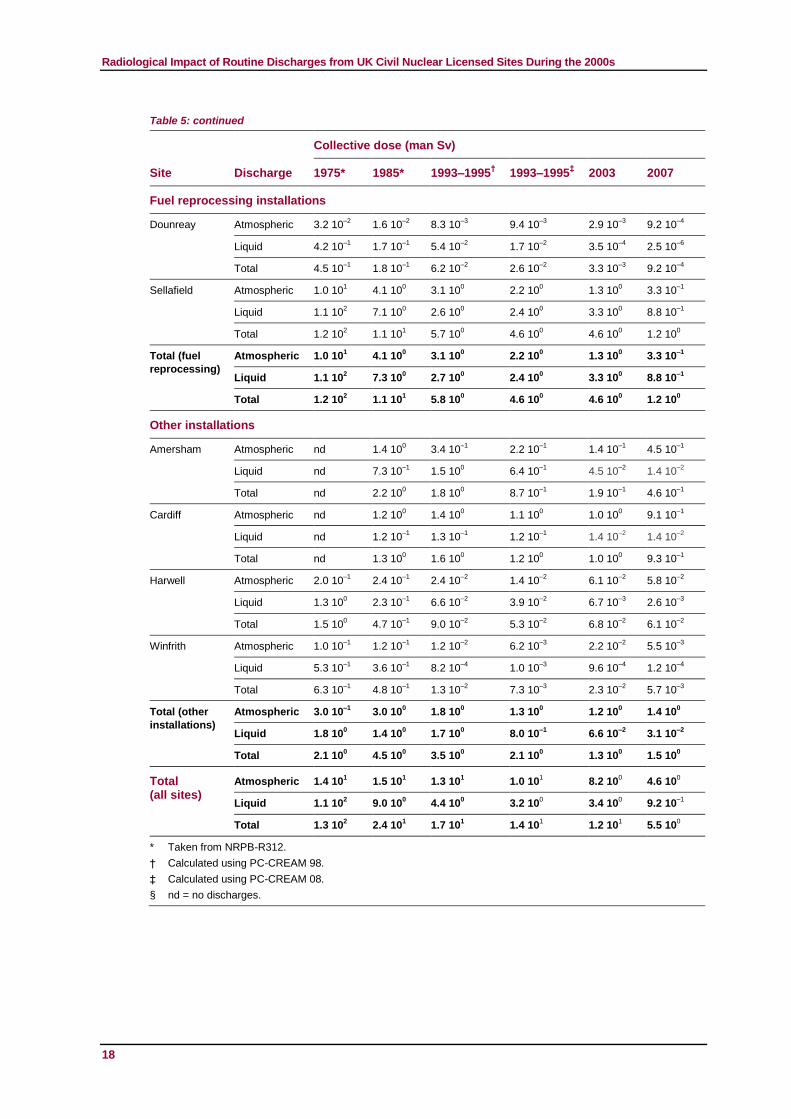
500 years from discharges in 2003 and 2007 were 12 man Sv and 6 man Sv, respectively.
Sellafield remains the highest contributor to the collective dose integrated to 500 years from
discharges in the 2000s (approximately 25% for discharges in 2003 and 10% for discharges
in 2007).
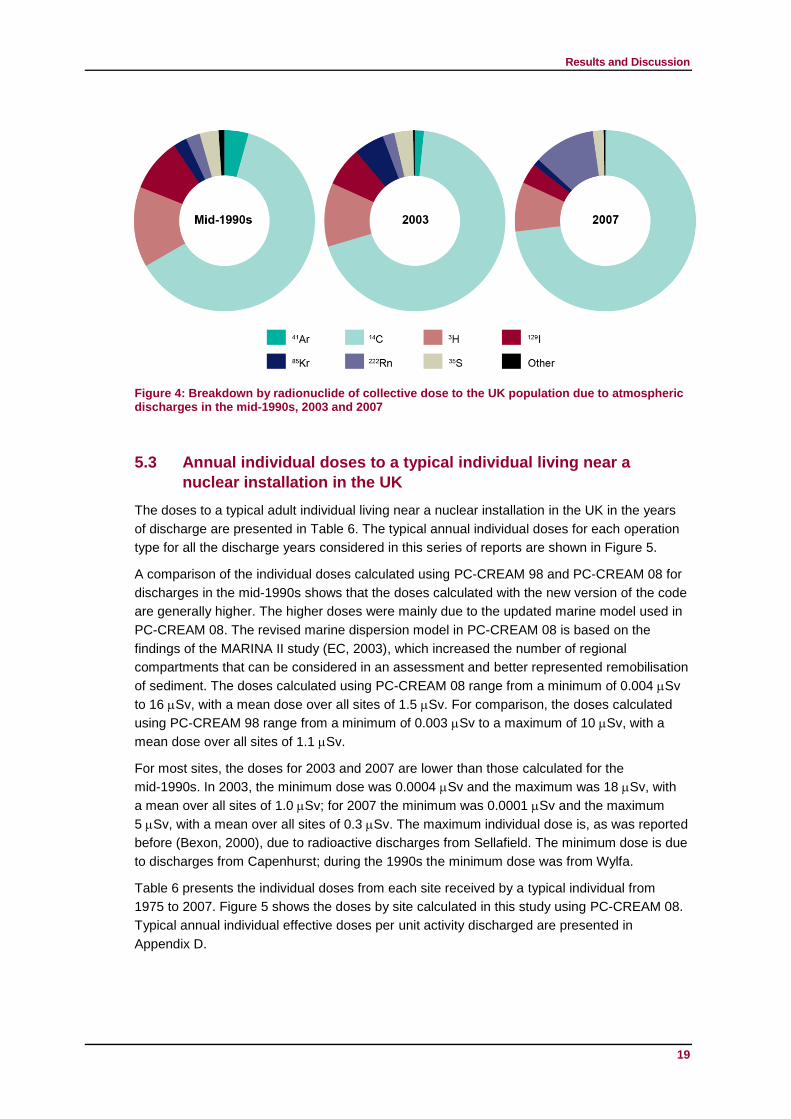
An analysis of the contribution by radionuclide to collective doses due to atmospheric
discharges in 2003 and 2007, compared to the doses from discharges in the mid-1990s,
shows that the contribution from 14
C has marginally increased (see Figure 4). The
contributions from 3H,
35S,
41Ar,
85Kr and
129I have continued to decrease throughout the
2000s, whereas the contribution from radon (222
Rn) has increased, reaching 11% from
discharges in 2007, mostly from Amersham.
Radiological Impact of Routine Discharges from UK Civil Nuclear Licensed Sites During the 2000s
16
Table 5: Collective effective doses to the UK population integrated to 500 years from discharges from UK civil nuclear sites
Site Discharge
Collective dose (man Sv)
1975* 1985* 1993–1995† 1993–1995
‡ 2003 2007
Fuel fabrication installations
Capenhurst Atmospheric 9.6 10–3
2.2 10–4
1.2 10–1
6.7 10–2
4.7 10–4
1.5 10–5
Liquid 1.2 10–5
3.3 10–6
2.2 10–5
3.5 10–5
8.6 10–6
4.6 10–6
Total 9.6 10–3
2.2 10–4
1.2 10–1
6.7 10–2
4.8 10–4
1.9 10–5
Springfields Atmospheric 2.8 10–1
2.7 10–2
2.8 10–2
3.5 10–2
2.5 10–2
1.4 10–2
Liquid 1.2 10–2
7.0 10–3
2.8 10–3
3.3 10–3
3.5 10–3
1.1 10–3
Total 2.9 10–1
3.3 10–2
3.1 10–2
3.8 10–2
2.8 10–2
1.5 10–2
Total (fuel
fabrication)
Atmospheric 2.9 10–1
2.7 10–2
1.5 10–1
1.0 10–1
2.5 10–2
1.4 10–2
Liquid 1.2 10–2
7.0 10–3
2.8 10–3
3.3 10–3
3.5 10–3
1.1 10–3
Total 3.0 10–1
3.3 10–2
1.5 10–1
1.1 10–1
2.9 10–2
1.5 10–2
Power production installations
AGR power stations
Dungeness B Atmospheric nd§ 3.4 10
–1 3.2 10
–2 4.4 10
–2 2.0 10
–1 2.1 10
–1
Liquid nd 1.4 10–4
1.5 10–4
1.3 10–4
1.6 10–4
1.1 10–4
Total nd 3.4 10–1
3.2 10–2
4.4 10–2
2.0 10–1
2.1 10–1
Hartlepool Atmospheric nd 4.2 10–1
2.0 10–1
2.8 10–1
5.8 10–1
5.2 10–1
Liquid nd 1.0 10–4
4.7 10–4
3.4 10–4
2.0 10–4
1.5 10–4
Total nd 4.2 10–1
2.0 10–1
2.8 10–1
5.8 10–1
5.2 10–1
Heysham 1 Atmospheric nd 4.4 10–1
2.4 10–1
3.2 10–1
5.2 10–1
4.5 10–1
Liquid nd 1.3 10–4
5.4 10–4
5.2 10–4
4.2 10–4
2.6 10–4
Total nd 4.4 10–1
2.5 10–1
3.2 10–1
5.2 10–1
4.5 10–1
Heysham 2 Atmospheric nd nd 1.6 10–1
2.1 10–1
3.8 10–1
4.7 10–1
Liquid nd nd 6.6 10–4
6.2 10–4
8.5 10–4
1.5 10–4
Total nd nd 1.6 10–1
2.1 10–1
3.8 10–1
4.7 10–1
Hinkley Point B Atmospheric nd 6.4 10–1
4.5 10–1
4.1 10–1
4.6 10–1
1.7 10–1
Liquid nd 1.8 10–4
1.4 10–4
1.1 10–4
9.8 10–5
1.4 10–5
Total nd 6.4 10–1
4.5 10–1
4.1 10–1
4.6 10–1
1.7 10–1
Hunterston B Atmospheric nd 5.3 10–1
3.1 10–1
2.9 10–1
3.9 10–1
1.3 10–1
Liquid nd 6.5 10–4
3.9 10–4
2.0 10–4
6.9 10–5
3.3 10–5
Total nd 5.3 10–1
3.1 10–1
2.9 10–1
3.9 10–1
1.3 10–1
Torness Atmospheric nd nd 8.5 10–2
1.5 10–1
1.9 10–1
2.5 10–1
Liquid nd nd 1.0 10–4
6.4 10–5
8.0 10–5
8.2 10–5
Total nd nd 8.5 10–2
1.5 10–1
1.9 10–1
2.5 10–1
Results and Discussion
Table 5: continued
17
Site Discharge
Collective dose (man Sv)
1975* 1985* 1993–1995† 1993–1995
‡ 2003 2007
Magnox power stations
Berkeley Atmospheric 5.8 10–1
5.0 10–1
4.4 10–4
2.9 10–4
9.3 10–5
9.3 10–5
Liquid 5.2 10–3
7.7 10–4
3.0 10–4
2.1 10–4
4.8 10–7
1.2 10–7
Total 5.9 10–1
5.0 10–1
7.4 10–4
5.0 10–4
9.4 10–5
9.3 10–5
Bradwell Atmospheric 3.2 10–1
4.1 10–1
3.0 10–1
2.0 10–1
1.5 10–3
4.3 10–4
Liquid 4.2 10–2
2.8 10–2
4.5 10–3
2.9 10–3
2.4 10–3
1.3 10–4
Total 3.6 10–1
4.4 10–1
3.0 10–1
2.1 10–1
3.9 10–3
5.6 10–4
Chapelcross Atmospheric 1.4 10–1
2.2 100 1.7 10
0 1.1 10
0 3.1 10
–1 3.5 10
–2
Liquid 6.5 10–3
8.4 10–3
4.4 10–4
7.9 10–4
6.9 10–4
1.1 10–5
Total 1.5 10–1
2.2 100 1.7 10
0 1.1 10
0 3.1 10
–1 3.5 10
–2
Dungeness A Atmospheric 2.3 10–1
2.2 10–1
7.1 10–1
9.5 10–1
9.1 10–1
6.3 10–2
Liquid 1.6 10–2
1.0 10–2
5.3 10–3
2.4 10–3
1.1 10–3
2.0 10–4
Total 2.4 10–1
2.3 10–1
7.2 10–1
9.5 10–1
9.2 10–1
6.3 10–2
Hinkley Point A Atmospheric 7.7 10–1
7.6 10–1
1.0 100 6.4 10
–1 8.3 10
–4 2.9 10
–4
Liquid 1.2 10–2
6.9 10–3
1.6 10–3
6.4 10–4
5.6 10–4
1.5 10–4
Total 7.8 10–1
7.6 10–1
1.0 100 6.4 10
–1 1.4 10
–3 4.4 10
–4
Hunterston A Atmospheric 2.0 10–1
2.6 10–1
3.1 10–3
6.5 10–3
4.5 10–5
4.3 10–5
Liquid 4.7 10–2
5.5 10–2
2.2 10–3
6.0 10–4
1.2 10–4
3.4 10–5
Total 2.4 10–1
3.1 10–1
5.3 10–3
7.1 10–3
1.7 10–4
7.7 10–5
Oldbury Atmospheric 4.3 10–1
4.2 10–1
2.0 100 1.5 10
0 7.3 10
–1 1.2 10
–1
Liquid 2.1 10–3
2.8 10–3
1.8 10–4
1.5 10–4
8.4 10–4
7.5 10–4
Total 4.3 10–1
4.2 10–1
2.0 100 1.5 10
0 7.3 10
–1 1.2 10
–1
Sizewell A Atmospheric 3.8 10–1
3.4 10–1
4.0 10–1
3.6 10–1
5.1 10–1
4.0 10–2
Liquid 6.2 10–3
7.0 10–3
1.6 10–3
6.3 10–4
2.5 10–3
1.1 10–3
Total 3.8 10–1
3.4 10–1
4.0 10–1
3.6 10–1
5.1 10–1
4.1 10–2
Trawsfynydd Atmospheric 3.2 10–1
5.8 10–1
3.5 10–4
3.4 10–4
4.0 10–4
7.9 10–4
Liquid 4.5 10–1
1.7 10–1
2.5 10–2
5.4 10–3
1.1 10–3
5.8 10–4
Total 7.7 10–1
7.5 10–1
2.5 10–2
5.8 10–3
1.5 10–3
1.4 10–3
Wylfa Atmospheric 1.6 10–1
1.8 10–1
3.0 10–1
3.7 10–1
4.0 10–1
2.8 10–1
Liquid 1.3 10–3
8.2 10–5
2.2 10–4
3.6 10–4
2.5 10–4
1.2 10–4
Total 1.7 10–1
1.8 10–1
3.1 10–1
3.7 10–1
4.0 10–1
2.8 10–1
PWR power station
Sizewell B Atmospheric nd nd 3.7 10–3
4.5 10–3
9.7 10–2
1.0 10–1
Liquid nd nd 4.3 10–5
2.0 10–5
3.2 10–4
5.8 10–5
Total nd nd 3.7 10–3
4.5 10–3
9.8 10–2
1.0 10–1
Total (power
production)
Atmospheric 3.5 100 8.2 10
0 7.9 10
0 6.8 10
0 5.7 10
0 2.8 10
0
Liquid 5.9 10–1
2.9 10–1
4.4 10–2
1.6 10–2
1.2 10–2
3.9 10–3
Total 4.1 100 8.5 10
0 8.0 10
0 6.9 10
0 5.7 10
0 2.8 10
0
Radiological Impact of Routine Discharges from UK Civil Nuclear Licensed Sites During the 2000s
Table 5: continued
18
Site Discharge
Collective dose (man Sv)
1975* 1985* 1993–1995† 1993–1995
‡ 2003 2007
Fuel reprocessing installations
Dounreay Atmospheric 3.2 10–2
1.6 10–2
8.3 10–3
9.4 10–3
2.9 10–3
9.2 10–4
Liquid 4.2 10–1
1.7 10–1
5.4 10–2
1.7 10–2
3.5 10–4
2.5 10–6
Total 4.5 10–1
1.8 10–1
6.2 10–2
2.6 10–2
3.3 10–3
9.2 10–4
Sellafield Atmospheric 1.0 101 4.1 10
0 3.1 10
0 2.2 10
0 1.3 10
0 3.3 10
–1
Liquid 1.1 102 7.1 10
0 2.6 10
0 2.4 10
0 3.3 10
0 8.8 10
–1
Total 1.2 102 1.1 10
1 5.7 10
0 4.6 10
0 4.6 10
0 1.2 10
0
Total (fuel
reprocessing)
Atmospheric 1.0 101 4.1 10
0 3.1 10
0 2.2 10
0 1.3 10
0 3.3 10
–1
Liquid 1.1 102 7.3 10
0 2.7 10
0 2.4 10
0 3.3 10
0 8.8 10
–1
Total 1.2 102 1.1 10
1 5.8 10
0 4.6 10
0 4.6 10
0 1.2 10
0
Other installations
Amersham Atmospheric nd 1.4 100 3.4 10
–1 2.2 10
–1 1.4 10
–1 4.5 10
–1
Liquid nd 7.3 10–1
1.5 100 6.4 10
–1 4.5 10
–2 1.4 10
–2
Total nd 2.2 100 1.8 10
0 8.7 10
–1 1.9 10
–1 4.6 10
–1
Cardiff Atmospheric nd 1.2 100 1.4 10
0 1.1 10
0 1.0 10
0 9.1 10
–1
Liquid nd 1.2 10–1
1.3 10–1
1.2 10–1
1.4 10–2
1.4 10–2
Total nd 1.3 100 1.6 10
0 1.2 10
0 1.0 10
0 9.3 10
–1
Harwell Atmospheric 2.0 10–1
2.4 10–1
2.4 10–2
1.4 10–2
6.1 10–2
5.8 10–2
Liquid 1.3 100 2.3 10
–1 6.6 10
–2 3.9 10
–2 6.7 10
–3 2.6 10
–3
Total 1.5 100 4.7 10
–1 9.0 10
–2 5.3 10
–2 6.8 10
–2 6.1 10
–2
Winfrith Atmospheric 1.0 10–1
1.2 10–1
1.2 10–2
6.2 10–3
2.2 10–2
5.5 10–3
Liquid 5.3 10–1
3.6 10–1
8.2 10–4
1.0 10–3
9.6 10–4
1.2 10–4
Total 6.3 10–1
4.8 10–1
1.3 10–2
7.3 10–3
2.3 10–2
5.7 10–3
Total (other
installations)
Atmospheric 3.0 10–1
3.0 100 1.8 10
0 1.3 10
0 1.2 10
0 1.4 10
0
Liquid 1.8 100 1.4 10
0 1.7 10
0 8.0 10
–1 6.6 10
–2 3.1 10
–2
Total 2.1 100 4.5 10
0 3.5 10
0 2.1 10
0 1.3 10
0 1.5 10
0
Total (all sites)
Atmospheric 1.4 101 1.5 10
1 1.3 10
1 1.0 10
1 8.2 10
0 4.6 10
0
Liquid 1.1 102 9.0 10
0 4.4 10
0 3.2 10
0 3.4 10
0 9.2 10
–1
Total 1.3 102 2.4 10
1 1.7 10
1 1.4 10
1 1.2 10
1 5.5 10
0
* Taken from NRPB-R312.
† Calculated using PC-CREAM 98.
‡ Calculated using PC-CREAM 08.
§ nd = no discharges.
Results and Discussion
19
Figure 4: Breakdown by radionuclide of collective dose to the UK population due to atmospheric discharges in the mid-1990s, 2003 and 2007
5.3 Annual individual doses to a typical individual living near a
nuclear installation in the UK
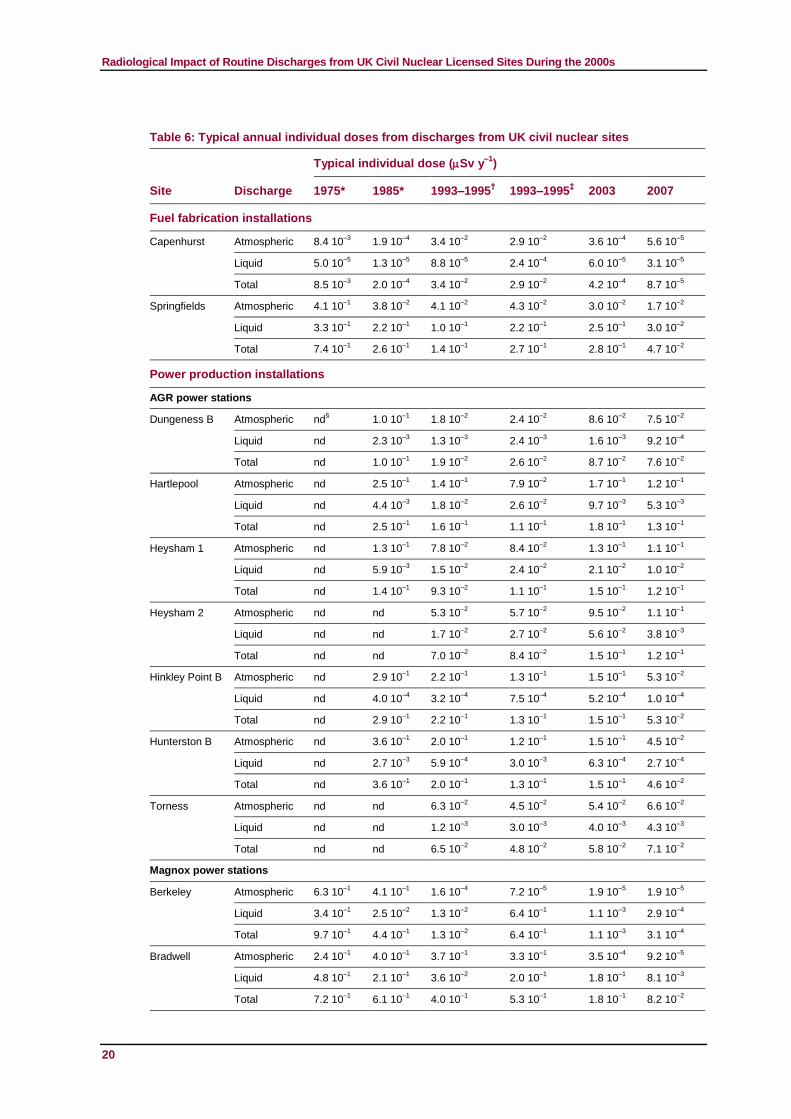
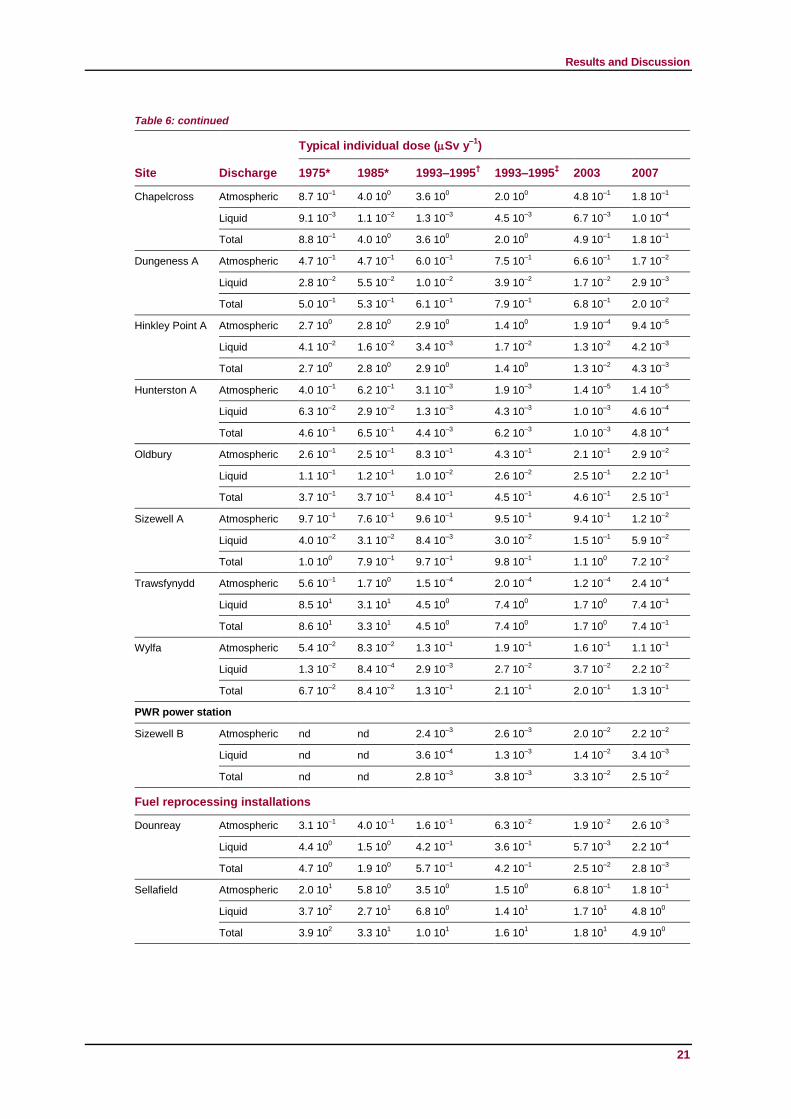
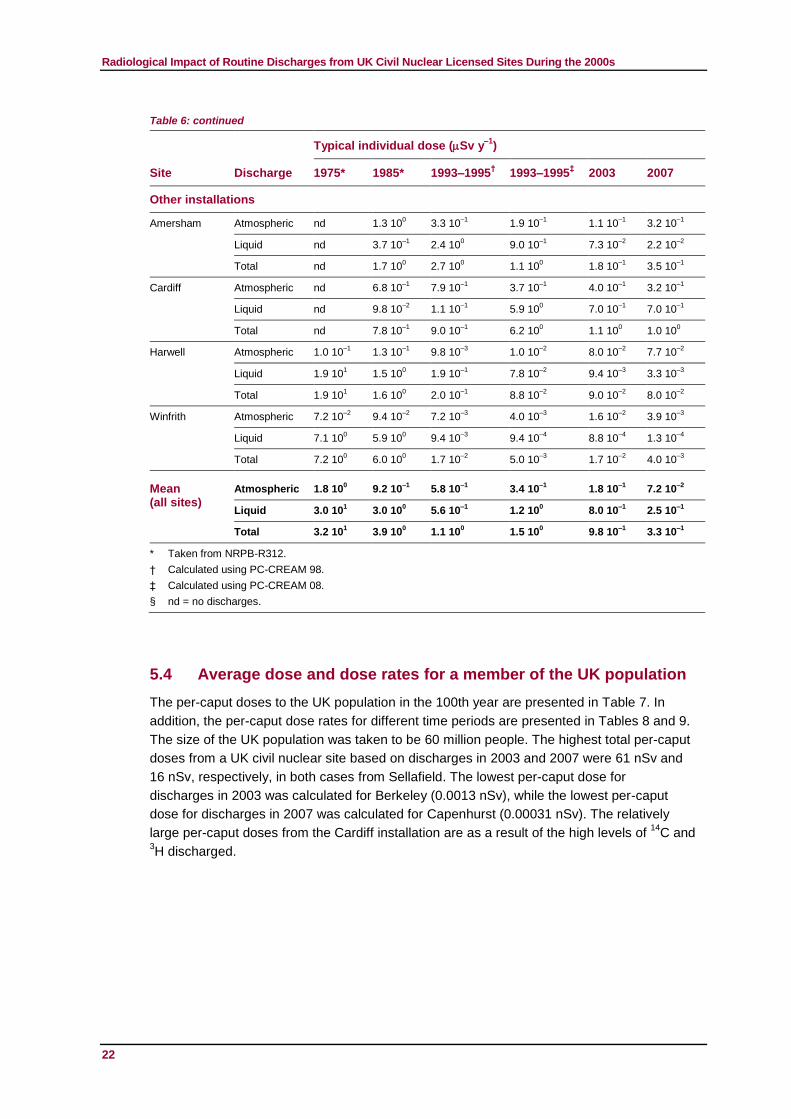
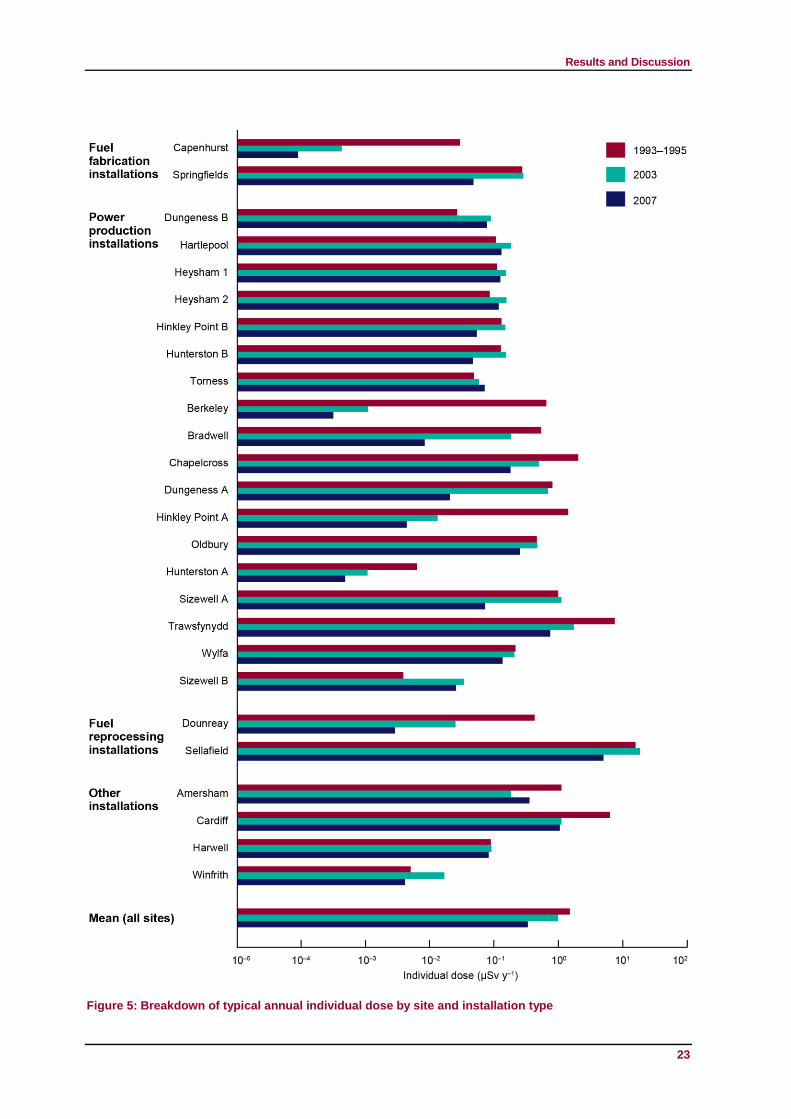
The doses to a typical adult individual living near a nuclear installation in the UK in the years
of discharge are presented in Table 6. The typical annual individual doses for each operation
type for all the discharge years considered in this series of reports are shown in Figure 5.
A comparison of the individual doses calculated using PC-CREAM 98 and PC-CREAM 08 for
discharges in the mid-1990s shows that the doses calculated with the new version of the code
are generally higher. The higher doses were mainly due to the updated marine model used in
PC-CREAM 08. The revised marine dispersion model in PC-CREAM 08 is based on the
findings of the MARINA II study (EC, 2003), which increased the number of regional
compartments that can be considered in an assessment and better represented remobilisation
of sediment. The doses calculated using PC-CREAM 08 range from a minimum of 0.004 Sv
to 16 Sv, with a mean dose over all sites of 1.5 Sv. For comparison, the doses calculated
using PC-CREAM 98 range from a minimum of 0.003 Sv to a maximum of 10 Sv, with a
mean dose over all sites of 1.1 Sv.
For most sites, the doses for 2003 and 2007 are lower than those calculated for the
mid-1990s. In 2003, the minimum dose was 0.0004 Sv and the maximum was 18 Sv, with
a mean over all sites of 1.0 Sv; for 2007 the minimum was 0.0001 Sv and the maximum
5 Sv, with a mean over all sites of 0.3 Sv. The maximum individual dose is, as was reported
before (Bexon, 2000), due to radioactive discharges from Sellafield. The minimum dose is due
to discharges from Capenhurst; during the 1990s the minimum dose was from Wylfa.
Table 6 presents the individual doses from each site received by a typical individual from
1975 to 2007. Figure 5 shows the doses by site calculated in this study using PC-CREAM 08.
Typical annual individual effective doses per unit activity discharged are presented in
Appendix D.
Radiological Impact of Routine Discharges from UK Civil Nuclear Licensed Sites During the 2000s
20
Table 6: Typical annual individual doses from discharges from UK civil nuclear sites
Site Discharge
Typical individual dose (Sv y–1
)
1975* 1985* 1993–1995† 1993–1995
‡ 2003 2007
Fuel fabrication installations
Capenhurst Atmospheric 8.4 10–3
1.9 10–4
3.4 10–2
2.9 10–2
3.6 10–4
5.6 10–5
Liquid 5.0 10–5
1.3 10–5
8.8 10–5
2.4 10–4
6.0 10–5
3.1 10–5
Total 8.5 10–3
2.0 10–4
3.4 10–2
2.9 10–2
4.2 10–4
8.7 10–5
Springfields Atmospheric 4.1 10–1
3.8 10–2
4.1 10–2
4.3 10–2
3.0 10–2
1.7 10–2
Liquid 3.3 10–1
2.2 10–1
1.0 10–1
2.2 10–1
2.5 10–1
3.0 10–2
Total 7.4 10–1
2.6 10–1
1.4 10–1
2.7 10–1
2.8 10–1
4.7 10–2
Power production installations
AGR power stations
Dungeness B Atmospheric nd§ 1.0 10
–1 1.8 10
–2 2.4 10
–2 8.6 10
–2 7.5 10
–2
Liquid nd 2.3 10–3
1.3 10–3
2.4 10–3
1.6 10–3
9.2 10–4
Total nd 1.0 10–1
1.9 10–2
2.6 10–2
8.7 10–2
7.6 10–2
Hartlepool Atmospheric nd 2.5 10–1
1.4 10–1
7.9 10–2
1.7 10–1
1.2 10–1
Liquid nd 4.4 10–3
1.8 10–2
2.6 10–2
9.7 10–3
5.3 10–3
Total nd 2.5 10–1
1.6 10–1
1.1 10–1
1.8 10–1
1.3 10–1
Heysham 1 Atmospheric nd 1.3 10–1
7.8 10–2
8.4 10–2
1.3 10–1
1.1 10–1
Liquid nd 5.9 10–3
1.5 10–2
2.4 10–2
2.1 10–2
1.0 10–2
Total nd 1.4 10–1
9.3 10–2
1.1 10–1
1.5 10–1
1.2 10–1
Heysham 2 Atmospheric nd nd 5.3 10–2
5.7 10–2
9.5 10–2
1.1 10–1
Liquid nd nd 1.7 10–2
2.7 10–2
5.6 10–2
3.8 10–3
Total nd nd 7.0 10–2
8.4 10–2
1.5 10–1
1.2 10–1
Hinkley Point B Atmospheric nd 2.9 10–1
2.2 10–1
1.3 10–1
1.5 10–1
5.3 10–2
Liquid nd 4.0 10–4
3.2 10–4
7.5 10–4
5.2 10–4
1.0 10–4
Total nd 2.9 10–1
2.2 10–1
1.3 10–1
1.5 10–1
5.3 10–2
Hunterston B Atmospheric nd 3.6 10–1
2.0 10–1
1.2 10–1
1.5 10–1
4.5 10–2
Liquid nd 2.7 10–3
5.9 10–4
3.0 10–3
6.3 10–4
2.7 10–4
Total nd 3.6 10–1
2.0 10–1
1.3 10–1
1.5 10–1
4.6 10–2
Torness Atmospheric nd nd 6.3 10–2
4.5 10–2
5.4 10–2
6.6 10–2
Liquid nd nd 1.2 10–3
3.0 10–3
4.0 10–3
4.3 10–3
Total nd nd 6.5 10–2
4.8 10–2
5.8 10–2
7.1 10–2
Magnox power stations
Berkeley Atmospheric 6.3 10–1
4.1 10–1
1.6 10–4
7.2 10–5
1.9 10–5
1.9 10–5
Liquid 3.4 10–1
2.5 10–2
1.3 10–2
6.4 10–1
1.1 10–3
2.9 10–4
Total 9.7 10–1
4.4 10–1
1.3 10–2
6.4 10–1
1.1 10–3
3.1 10–4
Bradwell Atmospheric 2.4 10–1
4.0 10–1
3.7 10–1
3.3 10–1
3.5 10–4
9.2 10–5
Liquid 4.8 10–1
2.1 10–1
3.6 10–2
2.0 10–1
1.8 10–1
8.1 10–3
Total 7.2 10–1
6.1 10–1
4.0 10–1
5.3 10–1
1.8 10–1
8.2 10–2
Results and Discussion
Table 6: continued
21
Site Discharge
Typical individual dose (Sv y–1
)
1975* 1985* 1993–1995† 1993–1995
‡ 2003 2007
Chapelcross Atmospheric 8.7 10–1
4.0 100 3.6 10
0 2.0 10
0 4.8 10
–1 1.8 10
–1
Liquid 9.1 10–3
1.1 10–2
1.3 10–3
4.5 10–3
6.7 10–3
1.0 10–4
Total 8.8 10–1
4.0 100 3.6 10
0 2.0 10
0 4.9 10
–1 1.8 10
–1
Dungeness A Atmospheric 4.7 10–1
4.7 10–1
6.0 10–1
7.5 10–1
6.6 10–1
1.7 10–2
Liquid 2.8 10–2
5.5 10–2
1.0 10–2
3.9 10–2
1.7 10–2
2.9 10–3
Total 5.0 10–1
5.3 10–1
6.1 10–1
7.9 10–1
6.8 10–1
2.0 10–2
Hinkley Point A Atmospheric 2.7 100 2.8 10
0 2.9 10
0 1.4 10
0 1.9 10
–4 9.4 10
–5
Liquid 4.1 10–2
1.6 10–2
3.4 10–3
1.7 10–2
1.3 10–2
4.2 10–3
Total 2.7 100 2.8 10
0 2.9 10
0 1.4 10
0 1.3 10
–2 4.3 10
–3
Hunterston A Atmospheric 4.0 10–1
6.2 10–1
3.1 10–3
1.9 10–3
1.4 10–5
1.4 10–5
Liquid 6.3 10–2
2.9 10–2
1.3 10–3
4.3 10–3
1.0 10–3
4.6 10–4
Total 4.6 10–1
6.5 10–1
4.4 10–3
6.2 10–3
1.0 10–3
4.8 10–4
Oldbury Atmospheric 2.6 10–1
2.5 10–1
8.3 10–1
4.3 10–1
2.1 10–1
2.9 10–2
Liquid 1.1 10–1
1.2 10–1
1.0 10–2
2.6 10–2
2.5 10–1
2.2 10–1
Total 3.7 10–1
3.7 10–1
8.4 10–1
4.5 10–1
4.6 10–1
2.5 10–1
Sizewell A Atmospheric 9.7 10–1
7.6 10–1
9.6 10–1
9.5 10–1
9.4 10–1
1.2 10–2
Liquid 4.0 10–2
3.1 10–2
8.4 10–3
3.0 10–2
1.5 10–1
5.9 10–2
Total 1.0 100 7.9 10
–1 9.7 10
–1 9.8 10
–1 1.1 10
0 7.2 10
–2
Trawsfynydd Atmospheric 5.6 10–1
1.7 100 1.5 10
–4 2.0 10
–4 1.2 10
–4 2.4 10
–4
Liquid 8.5 101 3.1 10
1 4.5 10
0 7.4 10
0 1.7 10
0 7.4 10
–1
Total 8.6 101 3.3 10
1 4.5 10
0 7.4 10
0 1.7 10
0 7.4 10
–1
Wylfa Atmospheric 5.4 10–2
8.3 10–2
1.3 10–1
1.9 10–1
1.6 10–1
1.1 10–1
Liquid 1.3 10–2
8.4 10–4
2.9 10–3
2.7 10–2
3.7 10–2
2.2 10–2
Total 6.7 10–2
8.4 10–2
1.3 10–1
2.1 10–1
2.0 10–1
1.3 10–1
PWR power station
Sizewell B Atmospheric nd nd 2.4 10–3
2.6 10–3
2.0 10–2
2.2 10–2
Liquid nd nd 3.6 10–4
1.3 10–3
1.4 10–2
3.4 10–3
Total nd nd 2.8 10–3
3.8 10–3
3.3 10–2
2.5 10–2
Fuel reprocessing installations
Dounreay Atmospheric 3.1 10–1
4.0 10–1
1.6 10–1
6.3 10–2
1.9 10–2
2.6 10–3
Liquid 4.4 100 1.5 10
0 4.2 10
–1 3.6 10
–1 5.7 10
–3 2.2 10
–4
Total 4.7 100 1.9 10
0 5.7 10
–1 4.2 10
–1 2.5 10
–2 2.8 10
–3
Sellafield Atmospheric 2.0 101 5.8 10
0 3.5 10
0 1.5 10
0 6.8 10
–1 1.8 10
–1
Liquid 3.7 102 2.7 10
1 6.8 10
0 1.4 10
1 1.7 10
1 4.8 10
0
Total 3.9 102 3.3 10
1 1.0 10
1 1.6 10
1 1.8 10
1 4.9 10
0
Radiological Impact of Routine Discharges from UK Civil Nuclear Licensed Sites During the 2000s
Table 6: continued
22
Site Discharge
Typical individual dose (Sv y–1
)
1975* 1985* 1993–1995† 1993–1995
‡ 2003 2007
Other installations
Amersham Atmospheric nd 1.3 100 3.3 10
–1 1.9 10
–1 1.1 10
–1 3.2 10
–1
Liquid nd 3.7 10–1
2.4 100 9.0 10
–1 7.3 10
–2 2.2 10
–2
Total nd 1.7 100 2.7 10
0 1.1 10
0 1.8 10
–1 3.5 10
–1
Cardiff Atmospheric nd 6.8 10–1
7.9 10–1
3.7 10–1
4.0 10–1
3.2 10–1
Liquid nd 9.8 10–2
1.1 10–1
5.9 100 7.0 10
–1 7.0 10
–1
Total nd 7.8 10–1
9.0 10–1
6.2 100 1.1 10
0 1.0 10
0
Harwell Atmospheric 1.0 10–1
1.3 10–1
9.8 10–3
1.0 10–2
8.0 10–2
7.7 10–2
Liquid 1.9 101 1.5 10
0 1.9 10
–1 7.8 10
–2 9.4 10
–3 3.3 10
–3
Total 1.9 101 1.6 10
0 2.0 10
–1 8.8 10
–2 9.0 10
–2 8.0 10
–2
Winfrith Atmospheric 7.2 10–2
9.4 10–2
7.2 10–3
4.0 10–3
1.6 10–2
3.9 10–3
Liquid 7.1 100 5.9 10
0 9.4 10
–3 9.4 10
–4 8.8 10
–4 1.3 10
–4
Total 7.2 100 6.0 10
0 1.7 10
–2 5.0 10
–3 1.7 10
–2 4.0 10
–3
Mean (all sites)
Atmospheric 1.8 100 9.2 10
–1 5.8 10
–1 3.4 10
–1 1.8 10
–1 7.2 10
–2
Liquid 3.0 101 3.0 10
0 5.6 10
–1 1.2 10
0 8.0 10
–1 2.5 10
–1
Total 3.2 101 3.9 10
0 1.1 10
0 1.5 10
0 9.8 10
–1 3.3 10
–1
* Taken from NRPB-R312.
† Calculated using PC-CREAM 98.
‡ Calculated using PC-CREAM 08.
§ nd = no discharges.
5.4 Average dose and dose rates for a member of the UK population
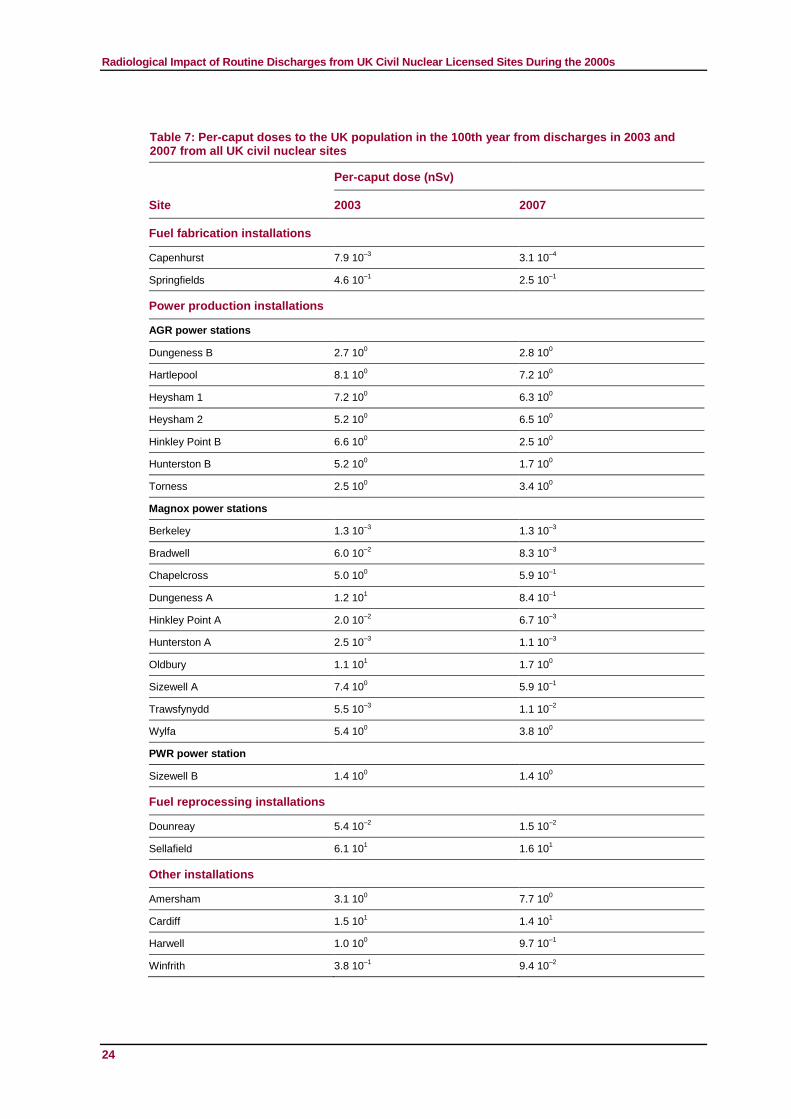
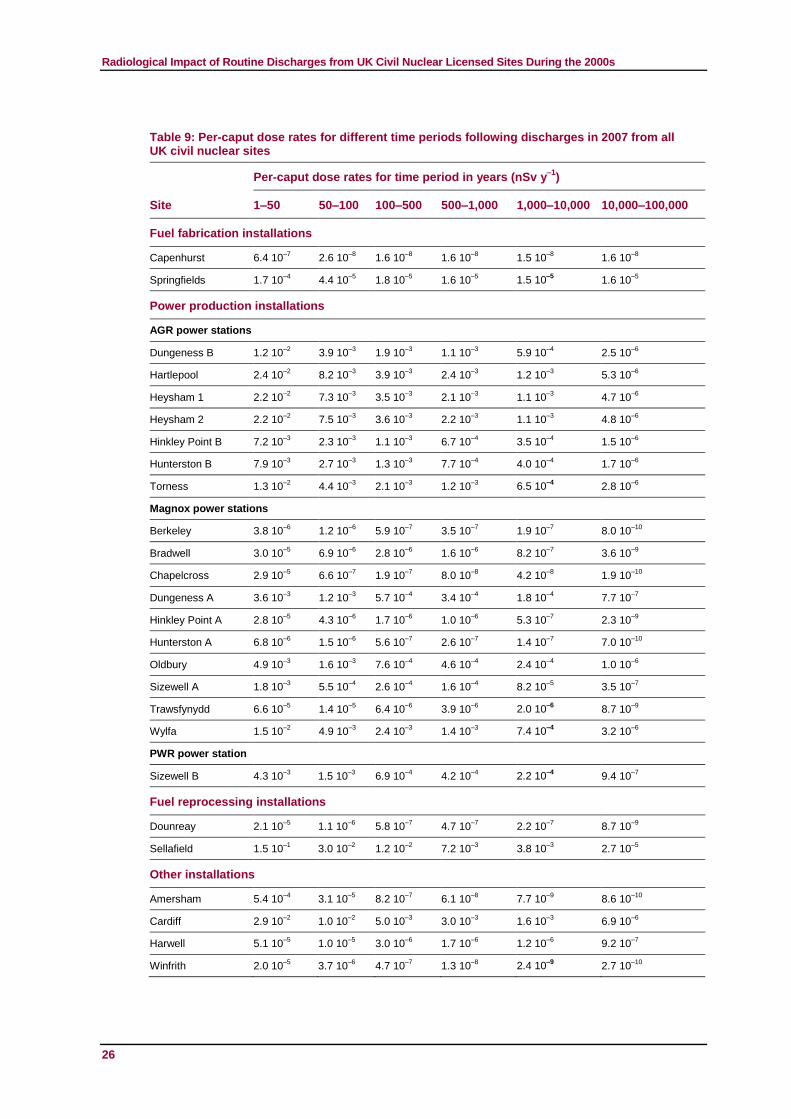
The per-caput doses to the UK population in the 100th year are presented in Table 7. In
addition, the per-caput dose rates for different time periods are presented in Tables 8 and 9.
The size of the UK population was taken to be 60 million people. The highest total per-caput
doses from a UK civil nuclear site based on discharges in 2003 and 2007 were 61 nSv and
16 nSv, respectively, in both cases from Sellafield. The lowest per-caput dose for
discharges in 2003 was calculated for Berkeley (0.0013 nSv), while the lowest per-caput
dose for discharges in 2007 was calculated for Capenhurst (0.00031 nSv). The relatively
large per-caput doses from the Cardiff installation are as a result of the high levels of 14
C and 3H discharged.
Results and Discussion
23
Figure 5: Breakdown of typical annual individual dose by site and installation type
Radiological Impact of Routine Discharges from UK Civil Nuclear Licensed Sites During the 2000s
24
Table 7: Per-caput doses to the UK population in the 100th year from discharges in 2003 and 2007 from all UK civil nuclear sites
Site
Per-caput dose (nSv)
2003 2007
Fuel fabrication installations
Capenhurst 7.9 10–3
3.1 10–4
Springfields 4.6 10–1
2.5 10–1
Power production installations
AGR power stations
Dungeness B 2.7 100 2.8 10
0
Hartlepool 8.1 100 7.2 10
0
Heysham 1 7.2 100 6.3 10
0
Heysham 2 5.2 100 6.5 10
0
Hinkley Point B 6.6 100 2.5 10
0
Hunterston B 5.2 100 1.7 10
0
Torness 2.5 100 3.4 10
0
Magnox power stations
Berkeley 1.3 10–3
1.3 10–3
Bradwell 6.0 10–2
8.3 10–3
Chapelcross 5.0 100 5.9 10
–1
Dungeness A 1.2 101 8.4 10
–1
Hinkley Point A 2.0 10–2
6.7 10–3
Hunterston A 2.5 10–3
1.1 10–3
Oldbury 1.1 101 1.7 10
0
Sizewell A 7.4 100 5.9 10
–1
Trawsfynydd 5.5 10–3
1.1 10–2
Wylfa 5.4 100 3.8 10
0
PWR power station
Sizewell B 1.4 100 1.4 10
0
Fuel reprocessing installations
Dounreay 5.4 10–2
1.5 10–2
Sellafield 6.1 101 1.6 10
1
Other installations
Amersham 3.1 100 7.7 10
0
Cardiff 1.5 101 1.4 10
1
Harwell 1.0 100 9.7 10
–1
Winfrith 3.8 10–1
9.4 10–2

Results and Discussion
25
Table 8: Per-caput dose rates for different time periods following discharges in 2003 from all UK civil nuclear sites
Site
Per-caput dose rates for time period in years (nSv y–1
)
1–50 50–100 100–500 500–1,000 1,000–10,000 10,000–100,000
Fuel fabrication installations
Capenhurst 2.6 10–6
4.0 10–7
4.2 10–7
3.9 10–7
3.8 10–7
4.2 10–7
Springfields 3.2 10–4
9.0 10–5
3.6 10–5
2.8 10–5
2.6 10–5
2.8 10–5
Power production installations
AGR power stations
Dungeness B 1.1 10–2
3.5 10–3
1.7 10–3
1.0 10–3
5.3 10–4
2.3 10–6
Hartlepool 2.7 10–2
8.9 10–3
4.2 10–3
2.6 10–3
1.3 10–3
5.7 10–6
Heysham 1 2.5 10–2
8.3 10–3
3.9 10–3
2.4 10–3
1.2 10–3
5.3 10–6
Heysham 2 1.8 10–2
6.0 10–3
2.8 10–3
1.7 10–3
9.0 10–4
3.9 10–6
Hinkley Point B 1.9 10–2
6.0 10–3
2.9 10–3
1.7 10–3
9.0 10–4
3.9 10–6
Hunterston B 2.4 10–2
8.0 10–3
3.8 10–3
2.3 10–3
1.2 10–3
5.2 10–6
Torness 9.6 10–3
3.2 10–3
1.5 10–3
9.2 10–4
4.8 10–4
2.1 10–6
Magnox power stations
Berkeley 3.9 10–6
1.3 10–6
5.9 10–7
3.6 10–7
1.9 10–7
8.0 10–10
Bradwell 3.6 10–4
5.2 10–5
1.3 10–5
5.4 10–6
2.8 10–6
1.2 10–8
Chapelcross 2.5 10–3
7.8 10–4
3.6 10–4
2.2 10–4
1.1 10–4
4.9 10–7
Dungeness A 5.0 10–2
1.7 10–2
8.0 10–3
4.8 10–3
2.5 10–3
1.1 10–5
Hinkley Point A 1.0 10–4
2.2 10–5
8.2 10–6
3.9 10–6
2.0 10–6
9.0 10–9
Hunterston A 2.4 10–5
2.9 10–6
8.0 10–7
2.9 10–7
1.4 10–7
9.2 10–10
Oldbury 2.9 10–2
9.4 10–3
4.5 10–3
2.7 10–3
1.4 10–3
6.1 10–6
Sizewell A 1.9 10–2
6.2 10–3
3.0 10–3
1.8 10–3
9.3 10–4
4.0 10–6
Trawsfynydd 4.6 10–5
7.2 10–6
3.3 10–6
2.0 10–6
1.0 10–6
4.5 10–9
Wylfa 2.1 10–2
7.0 10–3
3.3 10–3
2.0 10–3
1.0 10–3
4.5 10–6
PWR power station
Sizewell B 4.1 10–3
1.4 10–3
6.6 10–4
4.0 10–4
2.1 10–4
9.0 10–7
Fuel reprocessing installations
Dounreay 1.0 10–4
1.6 10–5
1.7 10–6
9.3 10–7
4.3 10–7
1.2 10–7
Sellafield 5.6 10–1
1.1 10–1
4.2 10–2
2.5 10–2
1.3 10–2
1.0 10–4
Other installations
Amersham 6.5 10–4
3.3 10–5
1.3 10–6
1.5 10–8
6.6 10–9
1.1 10–9
Cardiff 2.5 10–2
8.9 10–3
4.3 10–3
2.6 10–3
1.4 10–3
6.1 10–6
Harwell 1.6 10–4
2.9 10–5
1.9 10–5
4.1 10–6
1.8 10–6
1.3 10–6
Winfrith 1.3 10–4
3.3 10–5
4.3 10–6
1.1 10–7
2.2 10–8
2.2 10–9
Radiological Impact of Routine Discharges from UK Civil Nuclear Licensed Sites During the 2000s
26
Table 9: Per-caput dose rates for different time periods following discharges in 2007 from all UK civil nuclear sites
Site
Per-caput dose rates for time period in years (nSv y–1
)
1–50 50–100 100–500 500–1,000 1,000–10,000 10,000–100,000
Fuel fabrication installations
Capenhurst 6.4 10–7
2.6 10–8
1.6 10–8
1.6 10–8
1.5 10–8
1.6 10–8
Springfields 1.7 10–4
4.4 10–5
1.8 10–5
1.6 10–5
1.5 10–5
1.6 10–5
Power production installations
AGR power stations
Dungeness B 1.2 10–2
3.9 10–3
1.9 10–3
1.1 10–3
5.9 10–4
2.5 10–6
Hartlepool 2.4 10–2
8.2 10–3
3.9 10–3
2.4 10–3
1.2 10–3
5.3 10–6
Heysham 1 2.2 10–2
7.3 10–3
3.5 10–3
2.1 10–3
1.1 10–3
4.7 10–6
Heysham 2 2.2 10–2
7.5 10–3
3.6 10–3
2.2 10–3
1.1 10–3
4.8 10–6
Hinkley Point B 7.2 10–3
2.3 10–3
1.1 10–3
6.7 10–4
3.5 10–4
1.5 10–6
Hunterston B 7.9 10–3
2.7 10–3
1.3 10–3
7.7 10–4
4.0 10–4
1.7 10–6
Torness 1.3 10–2
4.4 10–3
2.1 10–3
1.2 10–3
6.5 10–4
2.8 10–6
Magnox power stations
Berkeley 3.8 10–6
1.2 10–6
5.9 10–7
3.5 10–7
1.9 10–7
8.0 10–10
Bradwell 3.0 10–5
6.9 10–6
2.8 10–6
1.6 10–6
8.2 10–7
3.6 10–9
Chapelcross 2.9 10–5
6.6 10–7
1.9 10–7
8.0 10–8
4.2 10–8
1.9 10–10
Dungeness A 3.6 10–3
1.2 10–3
5.7 10–4
3.4 10–4
1.8 10–4
7.7 10–7
Hinkley Point A 2.8 10–5
4.3 10–6
1.7 10–6
1.0 10–6
5.3 10–7
2.3 10–9
Hunterston A 6.8 10–6
1.5 10–6
5.6 10–7
2.6 10–7
1.4 10–7
7.0 10–10
Oldbury 4.9 10–3
1.6 10–3
7.6 10–4
4.6 10–4
2.4 10–4
1.0 10–6
Sizewell A 1.8 10–3
5.5 10–4
2.6 10–4
1.6 10–4
8.2 10–5
3.5 10–7
Trawsfynydd 6.6 10–5
1.4 10–5
6.4 10–6
3.9 10–6
2.0 10–6
8.7 10–9
Wylfa 1.5 10–2
4.9 10–3
2.4 10–3
1.4 10–3
7.4 10–4
3.2 10–6
PWR power station
Sizewell B 4.3 10–3
1.5 10–3
6.9 10–4
4.2 10–4
2.2 10–4
9.4 10–7
Fuel reprocessing installations
Dounreay 2.1 10–5
1.1 10–6
5.8 10–7
4.7 10–7
2.2 10–7
8.7 10–9
Sellafield 1.5 10–1
3.0 10–2
1.2 10–2
7.2 10–3
3.8 10–3
2.7 10–5
Other installations
Amersham 5.4 10–4
3.1 10–5
8.2 10–7
6.1 10–8
7.7 10–9
8.6 10–10
Cardiff 2.9 10–2
1.0 10–2
5.0 10–3
3.0 10–3
1.6 10–3
6.9 10–6
Harwell 5.1 10–5
1.0 10–5
3.0 10–6
1.7 10–6
1.2 10–6
9.2 10–7
Winfrith 2.0 10–5
3.7 10–6
4.7 10–7
1.3 10–8
2.4 10–9
2.7 10–10

Summary
27
6 Summary
This report updates and extends an earlier report (NRPB-R312 – Bexon, 2000) on the
radiological impact of routine discharges from UK civil nuclear licensed sites. Recent
discharge data (EA et al, 2004, 2008) updated dose coefficients and a new version of the
computer code PC-CREAM, called PC-CREAM 08 (PHE, 2014), were used to calculate
doses. PC-CREAM 08 includes a revised methodology (Smith and Simmonds, 2009) and
updates to the seafood catches, agricultural production and population grid data performed for
another study (Jones et al, 2013). Collective doses were calculated integrated to 500 years for
the populations of Europe and the UK and typical annual individual doses to residents living
near nuclear sites. In addition, per-caput doses and dose rates were calculated using
discharges in the years 2003 and 2007. The mid-1990s doses calculated in the previous
report (Bexon, 2000) were recalculated using PC-CREAM 08 to provide a comparison.
The total collective doses integrated to 500 years to the European population due to
discharges from UK civil nuclear sites in 2003 and 2007 were 41 man Sv and 19 man Sv,
respectively, continuing the downward trend in dose seen in the previous report (Bexon,
2000). The highest calculated collective dose integrated to 500 years to the European
population was 370 man Sv from discharges made in 1975. Reductions in discharges led to a
related decrease in the collective dose to 110 man Sv due to 1985 discharges, and to
92 man Sv using mid-1990s discharges. The mid-1990s dose was recalculated using the
updated PC-CREAM model and the collective dose was revised to 43 man Sv. Compared with
previous decades there has been a significantly lower contribution from Sellafield discharges.
The number of power production sites undergoing decommissioning has increased in the
period considered; however, power production is the main contributor to collective dose.
Reprocessing sites are the second greatest contributor to collective dose, both to the
population of Europe and to that of the UK.
The collective doses integrated to 500 years to the UK population due to discharges from UK
civil nuclear sites in in 2003 and 2007 are 12 man Sv and 6 man Sv, respectively. For the
UK population, the pattern of declining doses is the same: from 130 man Sv in 1975 to
24 man Sv in 1985 and 17 man Sv in the mid-1990s. The recalculated mid-1990s collective
dose is 14 man Sv.
The per-caput doses to the UK population in the 100th year from discharges in 2003
ranged from 0.0013 nSv to 61 nSv; those for discharges in 2007 were between 0.00031 nSv
and 16 nSv. For both years the highest per-caput dose was calculated for discharges
from Sellafield.
Annual doses calculated to typical individuals living in the vicinity of UK civil nuclear sites
were not radiologically significant. The 1990s mean dose increased to about 1.5 Sv and
the 2003 and 2007 doses were approximately 1 Sv and 0.3 Sv, respectively. The trend
in the doses is downwards, as would be expected, with the largest drop from 1975 to 1985:
in 1975 the dose was estimated to be 32 Sv, in 1985 approximately 4 Sv and 1 Sv in
the mid-1990s. Reprocessing remains the operation leading to the highest typical annual
individual doses.
Radiological Impact of Routine Discharges from UK Civil Nuclear Licensed Sites During the 2000s
28
7 References
Bexon AP (2000). Radiological impact of routine discharges from UK civil nuclear sites in the mid-1990s. Chilton,
NRPB-R312.
EC (2003). MARINA II. Update of the MARINA project on the radiological exposure of the European Community from
radioactivity in the North European marine waters. European Commission, Directorate-General Environment,
Radiation Protection, Radiation Protection 132.
EC (2004). Commission recommendation 2004/2/Euratom, of 18 December 2003 on standardised information on
radioactive airborne and liquid discharges into the environment from nuclear power reactors and reprocessing
plants in normal operation. Official Journal of the European Communities, L-2 06,12.2004, pp 36–46. European
Commission.
EA, EHS, FSA and SEPA (Environment Agency, Environment and Heritage Service, Food Standards Agency and
Scottish Environment Protection Agency) (2004). Radioactivity in Food and the Environment, 2003. RIFE-9.
EA, FSA, NIEA and SEPA (Environment Agency, Food Standards Agency, Northern Ireland Environment Agency and
Scottish Environment Protection Agency) (2008). Radioactivity in Food and the Environment, 2007. RIFE-13.
EA, FSA, NIEA and SEPA (Environment Agency, Food Standards Agency, Northern Ireland Environment Agency and
Scottish Environment Protection Agency) (2011). Radioactivity in Food and the Environment, 2010. RIFE-16.
EA, SEPA, NIEA, HPA and FSA (Environment Agency, Scottish Environment Protection Agency, Northern Ireland
Environment Agency, Health Protection Agency and Food Standards Agency) (2012). Principles for the
assessment of prospective public doses arising from authorised discharges of radioactive waste to the
environment. Cumbria, EA.
HPA (2009). Application of the 2007 recommendations of the ICRP to the UK. Doc HPA, RCE-12.
ICRP (2007). The 2007 recommendations of the International Commission on Radiological Protection. ICRP
Publication 103. Ann ICRP, 37(2–4).
ICRP (2012). Compendium of dose coefficients based on ICRP Publication 60. ICRP Publication 119. Ann ICRP,
41(Suppl).
Jones AL and Sherwood JC (2008). Delay times between harvesting or collection of food products and consumption
for use in radiological assessments. Chilton, HPA-RPD-043.
Jones KA, Smith JG, Anderson T, Harvey MP, Brown IK, Field SJ and Jones AL (2013). Implied doses to the
population of the EU arising from reported discharges from EU nuclear power stations and reprocessing sites in
the years 2004 to 2008. European Commission, Radiation Protection 176.
Martin JS, Barraclough IM, Mobbs SF, Klos RA and Lawson G (1991). User guide for BIOS_3A. Chilton, NRPB-M285.
PHE (2014). PC-CREAM radiological impact assessment software web pages. Available at
www.phe-protectionservices.org.uk/pccream.
Simmonds JR, Lawson G and Mayall A (1995). Methodology for assessing the radiological consequences of routine
releases of radionuclides to the environment. European Commission, EUR 15760.
Smith KR and Jones AL (2003). Generalised habit data for radiological assessments. Chilton, NRPB-W41.
Smith JG and Simmonds JR (2009). The methodology for assessing the radiological consequences of routine
releases of radionuclides to the environment used in PC-CREAM 08. Chilton, HPA-RPD-058.
Smith KR, Bexon AP, Sihra K, Simmonds JR, Lochard J, Schneider T and Bataille C (2007). Guidance on the
calculation, presentation and use of collective doses for routine discharges. European Commission, Radiation
Protection 144.
Appendix A
29
Appendix A Radioactive Discharges from UK Civil Nuclear Licensed Sites in
1993–1995, 2003 and 2007
The discharges used to calculate the doses in this report are presented here. Discharges to
the atmospheric and aquatic environments in 2003 and 2007 were obtained from an
EC database (EC, 2004) and RIFE reports (EA et al, 2004, 2008). Where no annual discharge
was reported, ‘nd’ was used to indicate no discharge. The discharges for the 1990s are taken
from the previous report (Bexon, 2000) and are the average of the three years 1993–1995.
The tables are grouped according to the type of installation; nuclear power stations are also
grouped according to the type of reactor. As stated in the main report (Section 4.1), some
discharges were given as aggregated totals; assumptions made when apportioning
discharges in 2003 and 2007 to different radionuclides are given in the sections below.
Assumptions for the discharges in the years 1993–1995 are given in the previous report
(Bexon, 2000) and have not been repeated here.
A1 Atmospheric radioactive discharges from UK civil nuclear licensed sites
Atmospheric radioactive discharges from UK civil nuclear licensed sites assumed in the
calculations carried out for this study are given in Tables A1 to A4 for the different types of
installation considered.
Atmospheric radioactive discharges from fuel fabrication installations are reported in Table A1.
Discharges from these installations reported as uranium were assumed to be 49% 234
U,
49% 238
U and 2% 235
U; it was also assumed that 234
Th was in secular equilibrium with 238
U.
Atmospheric radioactive discharges from nuclear power plants are reported in Table A2.
Discharges from AGR power stations reported as beta/gamma were assumed to be all 65
Zn.
Discharges from Magnox reactors reported as beta/gamma were assumed to be 23% 60
Co
and 77% 137
Cs. Discharges from Sizewell B reported as beta/gamma were assumed to be
4% 60
Co and 96% 137
Cs; discharges reported as noble gases were assumed to be all 133
Xe
(EC, 2004).
Atmospheric radioactive discharges from nuclear fuel reprocessing installations are reported
in Table A3. Discharges from Dounreay in 2003 reported as beta/gamma were assumed to be 60
Co; discharges reported as other alpha were assumed to be 16% 239
Pu and 84% 241
Am,
while discharges reported as 243
Cm + 244
Cm were assumed to be 50% of each radionuclide.
Discharges from Sellafield reported as 241
Am + 242
Cm were assumed to be all 241
Am.
Atmospheric radioactive discharges from other installations are reported in Table A4.
Discharges from Amersham in 2007 reported as radionuclides with a half-life of less than
two hours were assumed to be 18
F; discharges reported as other noble gases were assumed
to be all 133
Xe, while discharges reported as ‘other’ were assumed to be 137
Cs (Shackleton,
2012). Discharges from Harwell reported as beta were assumed to be 30% 137
Cs, 25% 90
Sr,
20% 60
Co, 20% 241
Pu and 5% 154
Eu, while discharges reported as alpha were assumed to
be 30% 239
Pu, 30% 240
Pu, 15% 238
Pu, 15% 241
Am, 2% 226
Ra, 2% 226
Th, 2% 232
Th, 2% 234
U
and 2% 238
U (Bexon, 2000). Discharges from Winfrith reported as beta/gamma were assumed
to be all 60
Co (EC, 2004).

Radiological Impact of Routine Discharges from UK Civil Nuclear Licensed Sites During the 2000s
30
Table A1: Atmospheric radioactive discharges from nuclear fuel fabrication installations
Site Radionuclide
Annual discharges (Bq)
1993–1995 2003 2007
Capenhurst 3H 6.70 10
13 1.02 10
11 5.20 10
6
234
Th 2.94 106 5.00 10
6 1.96 10
5
234
U
2.94 106 5.00 10
6 1.96 10
5
235
U 1.20 105 2.04 10
5 8.00 10
3
238
U 2.94 106 5.00 10
6 1.96 10
5
Springfields 234
Th 6.29 108 4.41 10
8 2.55 10
8
234
U 6.29 108 4.41 10
8 2.55 10
8
235
U 2.57 107 1.80 10
7 1.04 10
7
238
U 6.29 108 4.41 10
8 2.55 10
8
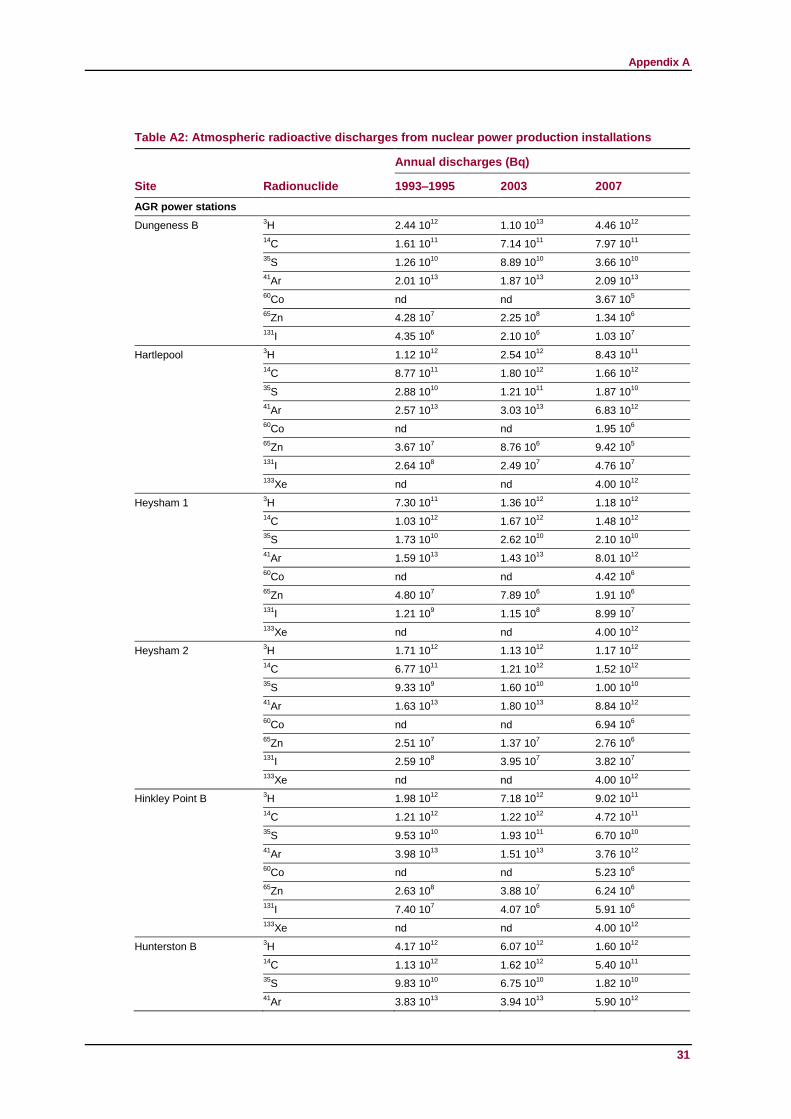
Appendix A
31
Table A2: Atmospheric radioactive discharges from nuclear power production installations
Site Radionuclide
Annual discharges (Bq)
1993–1995 2003 2007
AGR power stations
Dungeness B 3H 2.44 10
12 1.10 10
13 4.46 10
12
14
C 1.61 1011
7.14 1011
7.97 1011
35
S 1.26 1010
8.89 1010
3.66 1010
41
Ar 2.01 1013
1.87 1013
2.09 1013
60
Co nd nd 3.67 105
65
Zn 4.28 107 2.25 10
8 1.34 10
6
131
I 4.35 106 2.10 10
6 1.03 10
7
Hartlepool 3H 1.12 10
12 2.54 10
12 8.43 10
11
14
C 8.77 1011
1.80 1012
1.66 1012
35
S 2.88 1010
1.21 1011
1.87 1010
41
Ar 2.57 1013
3.03 1013
6.83 1012
60
Co nd nd 1.95 106
65
Zn 3.67 107 8.76 10
6 9.42 10
5
131
I 2.64 108 2.49 10
7 4.76 10
7
133
Xe nd nd 4.00 1012
Heysham 1 3H 7.30 10
11 1.36 10
12 1.18 10
12
14
C 1.03 1012
1.67 1012
1.48 1012
35
S 1.73 1010
2.62 1010
2.10 1010
41
Ar 1.59 1013
1.43 1013
8.01 1012
60
Co nd nd 4.42 106
65
Zn 4.80 107 7.89 10
6 1.91 10
6
131
I 1.21 109 1.15 10
8 8.99 10
7
133
Xe nd nd 4.00 1012
Heysham 2 3H 1.71 10
12 1.13 10
12 1.17 10
12
14
C 6.77 1011
1.21 1012
1.52 1012
35
S 9.33 109 1.60 10
10 1.00 10
10
41
Ar 1.63 1013
1.80 1013
8.84 1012
60
Co nd nd 6.94 106
65
Zn 2.51 107 1.37 10
7 2.76 10
6
131
I 2.59 108 3.95 10
7 3.82 10
7
133
Xe nd nd 4.00 1012
Hinkley Point B 3H 1.98 10
12 7.18 10
12 9.02 10
11
14
C 1.21 1012
1.22 1012
4.72 1011
35
S 9.53 1010
1.93 1011
6.70 1010
41
Ar 3.98 1013
1.51 1013
3.76 1012
60
Co nd nd 5.23 106
65
Zn 2.63 108 3.88 10
7 6.24 10
6
131
I 7.40 107 4.07 10
6 5.91 10
6
133
Xe nd nd 4.00 1012
Hunterston B 3H 4.17 10
12 6.07 10
12 1.60 10
12
14
C 1.13 1012
1.62 1012
5.40 1011
35
S 9.83 1010
6.75 1010
1.82 1010
41
Ar 3.83 1013
3.94 1013
5.90 1012
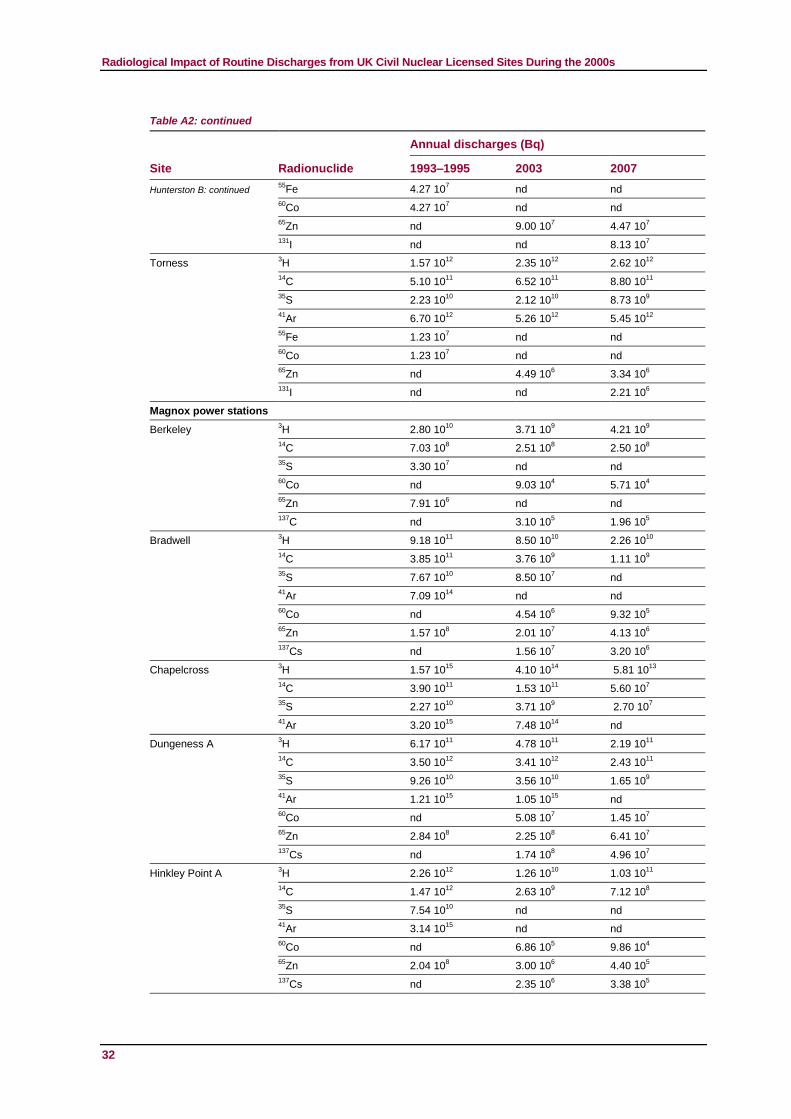
Radiological Impact of Routine Discharges from UK Civil Nuclear Licensed Sites During the 2000s
Table A2: continued
32
Site Radionuclide
Annual discharges (Bq)
1993–1995 2003 2007
Hunterston B: continued 55
Fe 4.27 107 nd nd
60
Co 4.27 107 nd nd
65
Zn nd 9.00 107 4.47 10
7
131
I nd nd 8.13 107
Torness 3H 1.57 10
12 2.35 10
12 2.62 10
12
14
C 5.10 1011
6.52 1011
8.80 1011
35
S 2.23 1010
2.12 1010
8.73 109
41
Ar 6.70 1012
5.26 1012
5.45 1012
55
Fe 1.23 107 nd nd
60
Co 1.23 107 nd nd
65
Zn nd 4.49 106 3.34 10
6
131
I nd nd 2.21 106
Magnox power stations
Berkeley 3H 2.80 10
10 3.71 10
9 4.21 10
9
14
C 7.03 108 2.51 10
8 2.50 10
8
35
S 3.30 107 nd nd
60
Co nd 9.03 104 5.71 10
4
65
Zn 7.91 106 nd nd
137
C nd 3.10 105 1.96 10
5
Bradwell 3H 9.18 10
11 8.50 10
10 2.26 10
10
14
C 3.85 1011
3.76 109 1.11 10
9
35
S 7.67 1010
8.50 107 nd
41
Ar 7.09 1014
nd nd
60
Co
nd 4.54 106 9.32 10
5
65
Zn 1.57 108 2.01 10
7 4.13 10
6
137
Cs nd 1.56 107 3.20 10
6
Chapelcross 3H 1.57 10
15 4.10 10
14 5.81 10
13
14
C 3.90 1011
1.53 1011
5.60 107
35
S 2.27 1010
3.71 109 2.70 10
7
41
Ar 3.20 1015
7.48 1014
nd
Dungeness A 3H 6.17 10
11 4.78 10
11 2.19 10
11
14
C 3.50 1012
3.41 1012
2.43 1011
35
S 9.26 1010
3.56 1010
1.65 109
41
Ar 1.21 1015
1.05 1015
nd
60
Co nd 5.08 107 1.45 10
7
65
Zn 2.84 108 2.25 10
8 6.41 10
7
137
Cs nd 1.74 108 4.96 10
7
Hinkley Point A 3H 2.26 10
12 1.26 10
10 1.03 10
11
14
C 1.47 1012
2.63 109 7.12 10
8
35
S 7.54 1010
nd nd
41
Ar 3.14 1015
nd nd
60
Co nd 6.86 105 9.86 10
4
65
Zn 2.04 108 3.00 10
6 4.40 10
5
137
Cs nd 2.35 106 3.38 10
5
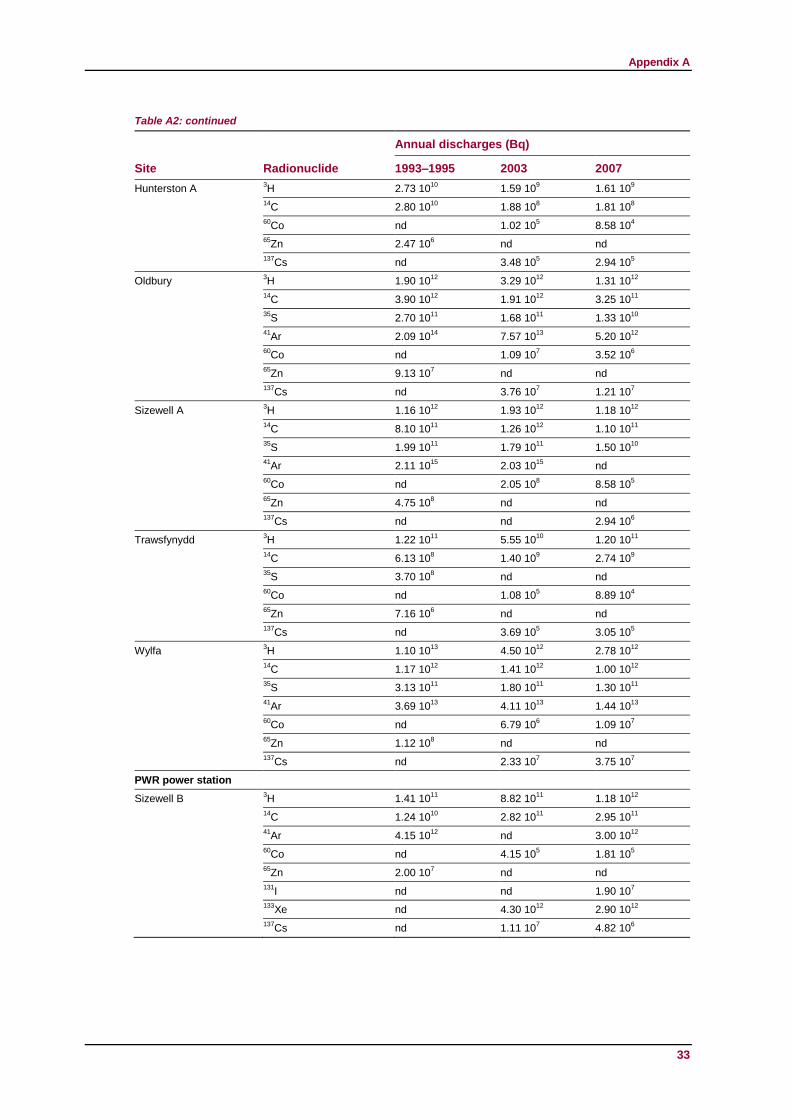
Appendix A
Table A2: continued
33
Site Radionuclide
Annual discharges (Bq)
1993–1995 2003 2007
Hunterston A 3H 2.73 10
10 1.59 10
9 1.61 10
9
14
C 2.80 1010
1.88 108 1.81 10
8
60
Co nd 1.02 105 8.58 10
4
65
Zn 2.47 106 nd nd
137
Cs nd 3.48 105 2.94 10
5
Oldbury 3H 1.90 10
12 3.29 10
12 1.31 10
12
14
C 3.90 1012
1.91 1012
3.25 1011
35
S 2.70 1011
1.68 1011
1.33 1010
41
Ar 2.09 1014
7.57 1013
5.20 1012
60
Co nd 1.09 107 3.52 10
6
65
Zn 9.13 107 nd nd
137
Cs nd 3.76 107 1.21 10
7
Sizewell A 3H 1.16 10
12 1.93 10
12 1.18 10
12
14
C 8.10 1011
1.26 1012
1.10 1011
35
S 1.99 1011
1.79 1011
1.50 1010
41
Ar 2.11 1015
2.03 1015
nd
60
Co nd 2.05 108 8.58 10
5
65
Zn 4.75 108 nd nd
137
Cs nd nd 2.94 106
Trawsfynydd 3H 1.22 10
11 5.55 10
10 1.20 10
11
14
C 6.13 108 1.40 10
9 2.74 10
9
35
S 3.70 108 nd nd
60
Co nd 1.08 105 8.89 10
4
65
Zn 7.16 106 nd nd
137
Cs nd 3.69 105 3.05 10
5
Wylfa 3H 1.10 10
13 4.50 10
12 2.78 10
12
14
C 1.17 1012
1.41 1012
1.00 1012
35
S 3.13 1011
1.80 1011
1.30 1011
41
Ar 3.69 1013
4.11 1013
1.44 1013
60
Co nd 6.79 106 1.09 10
7
65
Zn 1.12 108 nd nd
137
Cs nd 2.33 107 3.75 10
7
PWR power station
Sizewell B 3H 1.41 10
11 8.82 10
11 1.18 10
12
14
C 1.24 1010
2.82 1011
2.95 1011
41
Ar 4.15 1012
nd 3.00 1012
60
Co nd 4.15 105 1.81 10
5
65
Zn 2.00 107 nd nd
131
I nd nd 1.90 107
133
Xe nd 4.30 1012
2.90 1012
137
Cs nd 1.11 107 4.82 10
6
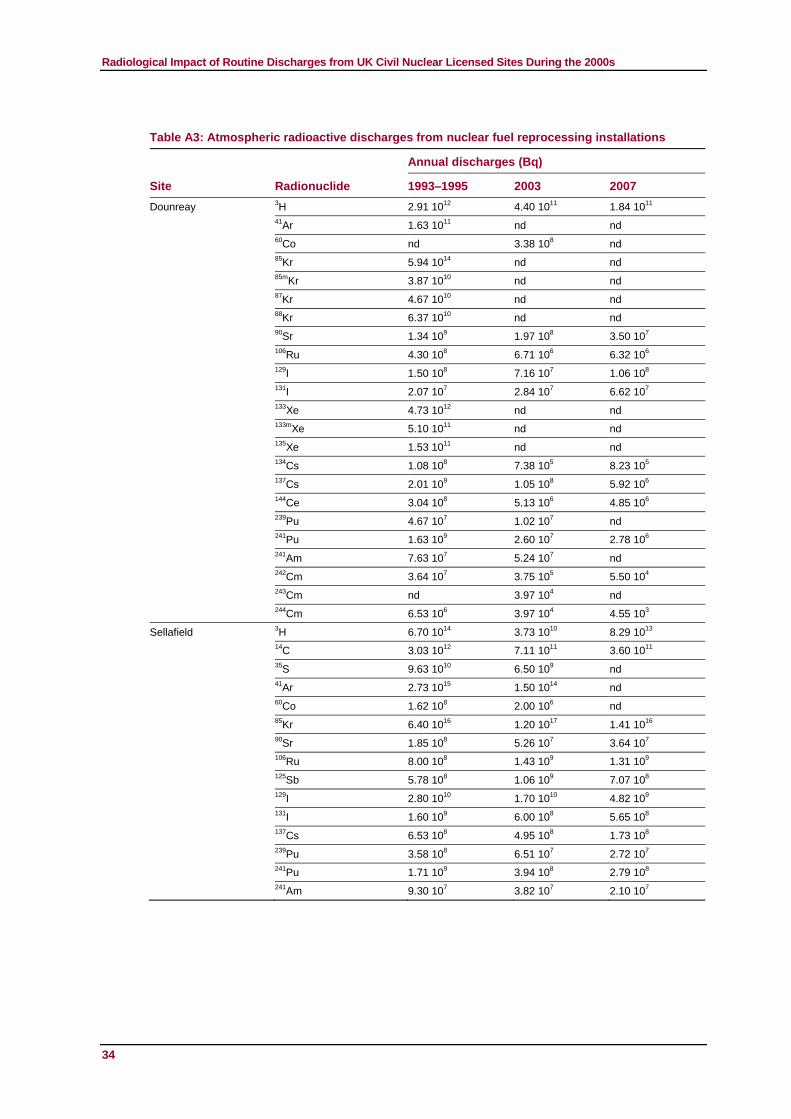
Radiological Impact of Routine Discharges from UK Civil Nuclear Licensed Sites During the 2000s
34
Table A3: Atmospheric radioactive discharges from nuclear fuel reprocessing installations
Site Radionuclide
Annual discharges (Bq)
1993–1995 2003 2007
Dounreay 3
H 2.91 1012
4.40 1011
1.84 1011
41
Ar 1.63 1011
nd nd
60
Co nd 3.38 108 nd
85
Kr 5.94 1014
nd nd
85m
Kr 3.87 1010
nd nd
87
Kr 4.67 1010
nd nd
88
Kr 6.37 1010
nd nd
90
Sr 1.34 109 1.97 10
8 3.50 10
7
106
Ru 4.30 108 6.71 10
6 6.32 10
6
129
I 1.50 108 7.16 10
7 1.06 10
8
131
I 2.07 107 2.84 10
7 6.62 10
7
133
Xe 4.73 1012
nd nd
133m
Xe 5.10 1011
nd nd
135
Xe 1.53 1011
nd nd
134
Cs 1.08 108 7.38 10
5 8.23 10
5
137
Cs 2.01 109 1.05 10
8 5.92 10
6
144
Ce 3.04 108 5.13 10
6 4.85 10
6
239
Pu 4.67 107 1.02 10
7 nd
241
Pu 1.63 109 2.60 10
7 2.78 10
6
241
Am 7.63 107 5.24 10
7 nd
242
Cm 3.64 107 3.75 10
5 5.50 10
4
243
Cm nd 3.97 104 nd
244
Cm 6.53 106 3.97 10
4 4.55 10
3
Sellafield 3H 6.70 10
14 3.73 10
10 8.29 10
13
14
C 3.03 1012
7.11 1011
3.60 1011
35
S 9.63 1010
6.50 109 nd
41
Ar 2.73 1015
1.50 1014
nd
60
Co 1.62 108 2.00 10
6 nd
85
Kr 6.40 1016
1.20 1017
1.41 1016
90
Sr 1.85 108 5.26 10
7 3.64 10
7
106
Ru 8.00 108 1.43 10
9 1.31 10
9
125
Sb 5.78 108 1.06 10
9 7.07 10
8
129
I 2.80 1010
1.70 1010
4.82 109
131
I 1.60 109 6.00 10
8 5.65 10
8
137
Cs 6.53 108 4.95 10
8 1.73 10
8
239
Pu
3.58 108 6.51 10
7 2.72 10
7
241
Pu 1.71 109 3.94 10
8 2.79 10
8
241
Am 9.30 107 3.82 10
7 2.10 10
7
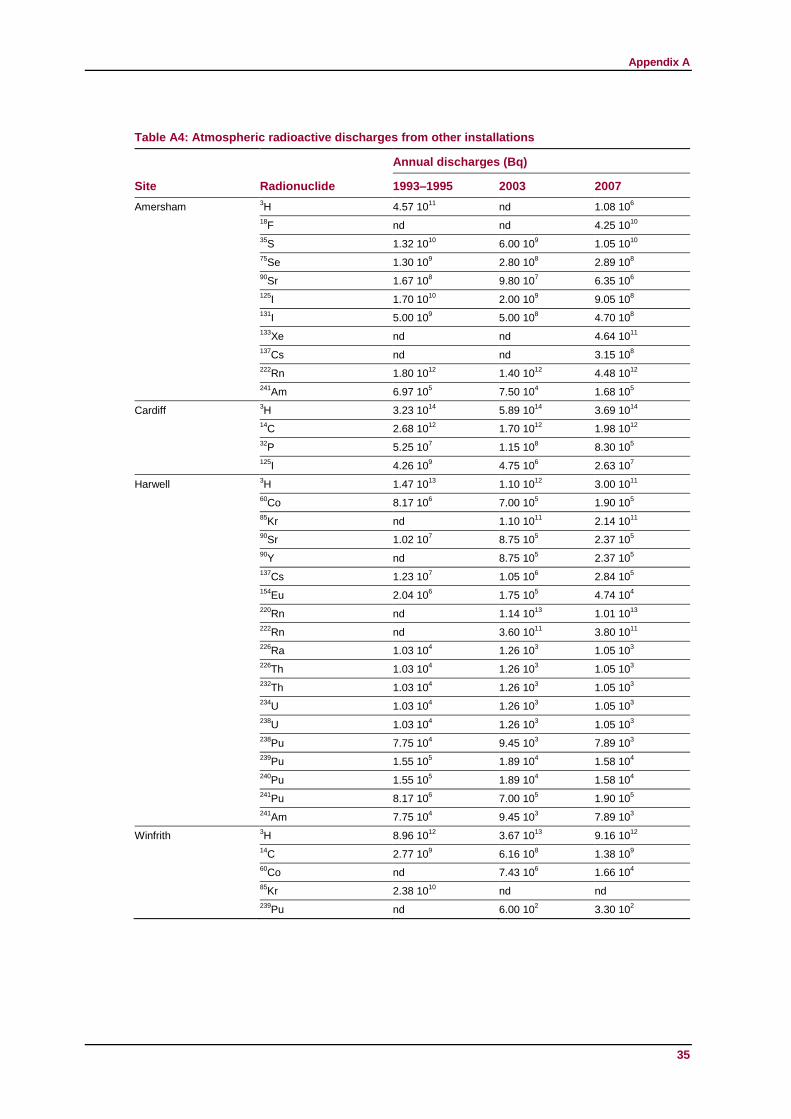
Appendix A
35
Table A4: Atmospheric radioactive discharges from other installations
Site Radionuclide
Annual discharges (Bq)
1993–1995 2003 2007
Amersham 3H 4.57 10
11 nd 1.08 10
6
18
F nd nd 4.25 1010
35
S 1.32 1010
6.00 109 1.05 10
10
75
Se 1.30 109 2.80 10
8 2.89 10
8
90
Sr 1.67 108 9.80 10
7 6.35 10
6
125
I 1.70 1010
2.00 109 9.05 10
8
131
I 5.00 109 5.00 10
8 4.70 10
8
133
Xe nd nd 4.64 1011
137
Cs nd nd 3.15 108
222
Rn 1.80 1012
1.40 1012
4.48 1012
241
Am 6.97 105 7.50 10
4 1.68 10
5
Cardiff 3
H 3.23 1014
5.89 1014
3.69 1014
14
C 2.68 1012
1.70 1012
1.98 1012
32
P 5.25 107 1.15 10
8 8.30 10
5
125
I 4.26 109 4.75 10
6 2.63 10
7
Harwell 3H 1.47 10
13 1.10 10
12 3.00 10
11
60
Co 8.17 106 7.00 10
5 1.90 10
5
85
Kr nd 1.10 1011
2.14 1011
90
Sr 1.02 107 8.75 10
5 2.37 10
5
90
Y
nd 8.75 105 2.37 10
5
137
Cs 1.23 107 1.05 10
6 2.84 10
5
154
Eu 2.04 106 1.75 10
5 4.74 10
4
220
Rn nd 1.14 1013
1.01 1013
222
Rn nd 3.60 1011
3.80 1011
226
Ra 1.03 104 1.26 10
3 1.05 10
3
226
Th 1.03 104 1.26 10
3 1.05 10
3
232
Th 1.03 104 1.26 10
3 1.05 10
3
234
U 1.03 104 1.26 10
3 1.05 10
3
238
U 1.03 104 1.26 10
3 1.05 10
3
238
Pu 7.75 104 9.45 10
3 7.89 10
3
239
Pu 1.55 105 1.89 10
4 1.58 10
4
240
Pu 1.55 105 1.89 10
4 1.58 10
4
241
Pu 8.17 106 7.00 10
5 1.90 10
5
241
Am 7.75 104 9.45 10
3 7.89 10
3
Winfrith 3
H 8.96 1012
3.67 1013
9.16 1012
14
C 2.77 109 6.16 10
8 1.38 10
9
60
Co nd 7.43 106 1.66 10
4
85
Kr 2.38 1010
nd nd
239
Pu nd 6.00 102 3.30 10
2

Radiological Impact of Routine Discharges from UK Civil Nuclear Licensed Sites During the 2000s
36
A2 Liquid radioactive discharges from UK civil nuclear licensed sites
Liquid radioactive discharges from UK civil nuclear licensed sites assumed in the
calculations carried out for this assessment are given in Tables A5 to A8 for the different
types of installation considered.
Liquid radioactive discharges from fuel fabrication installations are reported in Table A5.
Discharges from Capenhurst reported as uranium were assumed to be 50% 234
U and
49% 238
U, discharges reported as non-uranic alpha emitters were assumed to be 237
Np, while
those reported as uranium progeny were assumed to be 50% 234
Th (Bexon, 2000).
Discharges from Springfields reported as uranium were assumed to be 50% 234
U and
49% 238
U, while those reported as total alpha were assumed to be 41% 235
U, 50% 230
Th,
7.5% 228
Th and 1.5% 232
Th. Discharges from Springfields reported as total beta were assumed
to be 50% 234
Th (Bexon, 2000).
Liquid radioactive discharges from nuclear power plants are reported in Table A6. Liquid
discharges reported as beta/gamma from AGR and Magnox sites, with the exception of
Hunterston A and Chapelcross, were assumed to be 35% 137
Cs, 28% 134
Cs, 28% 144
Pr and
9% 90
Sr/90
Y; it was also assumed that 90
Y discharges were equal to 90
Sr discharges
(EC, 2004). Discharges from Hunterston A reported as beta/gamma were assumed to be
50% 90
Sr, 20% 90
Y, 10% 103
Ru, 10% 134
Cs, 4% 45
Ca, 4% 55
Fe and 2% 60
Co (EC, 2004).
Discharges from Chapelcross reported as beta/gamma were assumed to be 60% 137
Cs,
23% 90
Sr, 10% 90
Y, 3% 134
Cs, 3% 125
Sb and 1% 60
Co (EC, 2004).
Discharges from power production sites reported as alpha were assumed to be 239
Pu;
discharges from most of the Magnox reactor sites reported as 239
Pu + 240
Pu in 2003 and 2007
were assumed to be 100% 239
Pu (EC, 2004). Discharges from Bradwell, Hinkley Point A and
Sizewell A reported as 243
Cm + 244
Cm were split equally between the two radionuclides
(EC, 2004).
Liquid radioactive discharges from nuclear fuel reprocessing installations are reported in
Table A7. Discharges from Dounreay reported as alpha were assumed to be 70% 241
Am,
10% 238
Pu and 20% 239
Pu (EC, 2004). Discharges from Sellafield reported as 95
Zr/95
Nb were
assumed to be all 95
Zr, discharges reported as plutonium alpha were assumed to be
75% 239
Pu and 25% 238
Pu, discharges reported as uranium were assumed to be 92% 234
U,
3% 235
U and 5% 238
U, while discharges reported as 243
Cm + 244
Cm were split equally between
the two radionuclides (EC, 2004).
Liquid radioactive discharges from other installations are reported in Table A8. Discharges
from Amersham reported as beta were assumed to be 90
Sr, discharges reported as other were
assumed to be 65
Zn, while discharges reported as alpha were assumed to be 241
Am
(Bexon, 2000). Discharges from Harwell reported as beta were assumed to be 30% 60
Co,
30% 137
Cs, 10% 90
Sr, 10% 90
Y, 2% 56
Mn, 2% 58
Co, 2% 103
Ru, 2% 106
Ru, 2% 125
Sb, 2% 125
I,
2% 131
I, 2% 134
Cs, 2% 154
Eu and 2% 155
Eu, while discharges reported as alpha were assumed
to be 25% 234
U, 25% 238
U, 23% 226
Ra, 12% 241
Am, 8% 240
Pu and 7% 239
Pu (Bexon, 2000). In
addition, discharges from Harwell to Lydebank brook were assumed to be discharged to the
river Thames for assessment purposes. Discharges from Winfrith reported as total
beta/gamma in 2003 were assumed to be 50% 90
Sr and 50% 137
Cs; in 2007 discharges of 137
Cs were quoted separately and it was assumed that 50% of the discharge reported as total
beta/gamma was 90
Sr, while discharges reported as total alpha were assumed to be all 239
Pu
(EC, 2004).
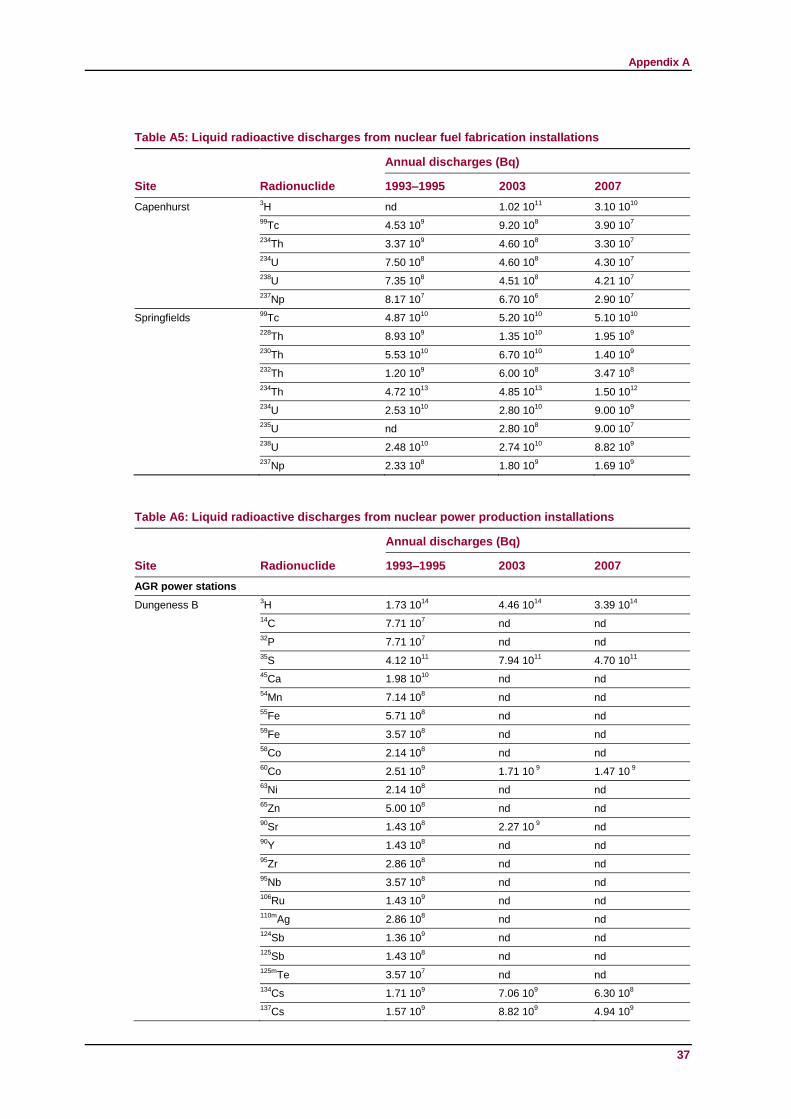
Appendix A
37
Table A5: Liquid radioactive discharges from nuclear fuel fabrication installations
Site Radionuclide
Annual discharges (Bq)
1993–1995 2003 2007
Capenhurst 3
H nd 1.02 1011
3.10 1010
99
Tc 4.53 109 9.20 10
8 3.90 10
7
234
Th 3.37 109 4.60 10
8 3.30 10
7
234
U 7.50 108 4.60 10
8 4.30 10
7
238
U 7.35 108 4.51 10
8 4.21 10
7
237
Np 8.17 107 6.70 10
6 2.90 10
7
Springfields 99
Tc 4.87 1010
5.20 1010
5.10 1010
228
Th 8.93 109 1.35 10
10 1.95 10
9
230
Th 5.53 1010
6.70 1010
1.40 109
232
Th 1.20 109 6.00 10
8 3.47 10
8
234
Th 4.72 1013
4.85 1013
1.50 1012
234
U 2.53 1010
2.80 1010
9.00 109
235
U nd 2.80 108 9.00 10
7
238
U 2.48 1010
2.74 1010
8.82 109
237
Np 2.33 108 1.80 10
9 1.69 10
9
Table A6: Liquid radioactive discharges from nuclear power production installations
Site Radionuclide
Annual discharges (Bq)
1993–1995 2003 2007
AGR power stations
Dungeness B 3
H 1.73 1014
4.46 1014
3.39 1014
14
C 7.71 107 nd nd
32
P 7.71 107 nd nd
35
S 4.12 1011
7.94 1011
4.70 1011
45
Ca 1.98 1010
nd nd
54
Mn 7.14 108 nd nd
55
Fe 5.71 108 nd nd
59
Fe 3.57 108 nd nd
58
Co 2.14 108 nd nd
60
Co 2.51 109 1.71 10
9 1.47 10
9
63
Ni 2.14 108 nd nd
65
Zn 5.00 108 nd nd
90
Sr 1.43 108 2.27 10
9 nd
90
Y 1.43 108 nd nd
95
Zr 2.86 108 nd nd
95
Nb 3.57 108 nd nd
106
Ru 1.43 109 nd nd
110m
Ag 2.86 108 nd nd
124
Sb 1.36 109 nd nd
125
Sb 1.43 108 nd nd
125m
Te 3.57 107 nd nd
134
Cs 1.71 109 7.06 10
9 6.30 10
8
137
Cs 1.57 109 8.82 10
9 4.94 10
9
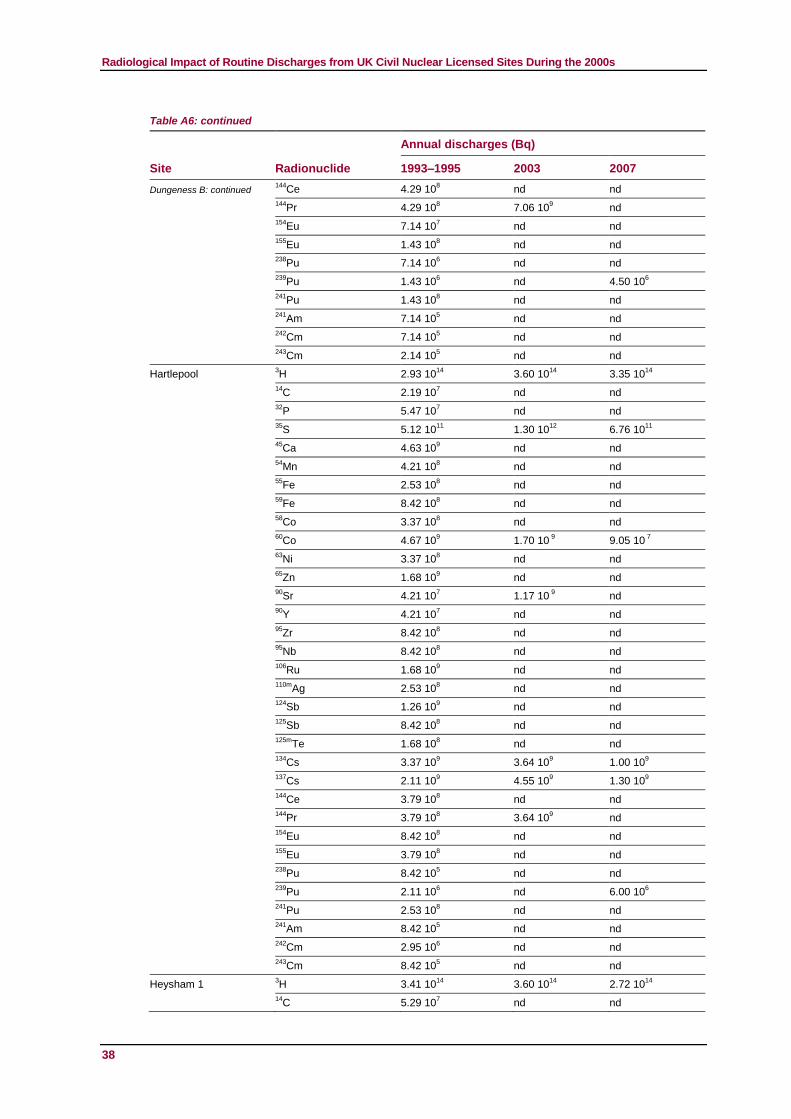
Radiological Impact of Routine Discharges from UK Civil Nuclear Licensed Sites During the 2000s
Table A6: continued
38
Site Radionuclide
Annual discharges (Bq)
1993–1995 2003 2007
Dungeness B: continued 144
Ce 4.29 108 nd nd
144
Pr 4.29 108 7.06 10
9 nd
154
Eu 7.14 107 nd nd
155
Eu 1.43 108 nd nd
238
Pu 7.14 106 nd nd
239
Pu 1.43 106 nd 4.50 10
6
241
Pu 1.43 108 nd nd
241
Am 7.14 105 nd nd
242
Cm 7.14 105 nd nd
243
Cm 2.14 105 nd nd
Hartlepool 3
H 2.93 1014
3.60 1014
3.35 1014
14
C 2.19 107 nd nd
32
P 5.47 107 nd nd
35
S 5.12 1011
1.30 1012
6.76 1011
45
Ca 4.63 109 nd nd
54
Mn 4.21 108 nd nd
55
Fe 2.53 108 nd nd
59
Fe 8.42 108 nd nd
58
Co 3.37 108 nd nd
60
Co 4.67 109 1.70 10
9 9.05 10
7
63
Ni 3.37 108 nd nd
65
Zn 1.68 109 nd nd
90
Sr 4.21 107 1.17 10
9 nd
90
Y 4.21 107 nd nd
95
Zr 8.42 108 nd nd
95
Nb 8.42 108 nd nd
106
Ru 1.68 109 nd nd
110m
Ag 2.53 108 nd nd
124
Sb 1.26 109 nd nd
125
Sb 8.42 108 nd nd
125m
Te 1.68 108 nd nd
134
Cs 3.37 109 3.64 10
9 1.00 10
9
137
Cs 2.11 109 4.55 10
9 1.30 10
9
144
Ce 3.79 108 nd nd
144
Pr 3.79 108 3.64 10
9 nd
154
Eu 8.42 108 nd nd
155
Eu 3.79 108 nd nd
238
Pu 8.42 105 nd nd
239
Pu 2.11 106 nd 6.00 10
6
241
Pu 2.53 108 nd nd
241
Am 8.42 105 nd nd
242
Cm 2.95 106 nd nd
243
Cm 8.42 105 nd nd
Heysham 1 3
H 3.41 1014
3.60 1014
2.72 1014
14
C 5.29 107 nd nd
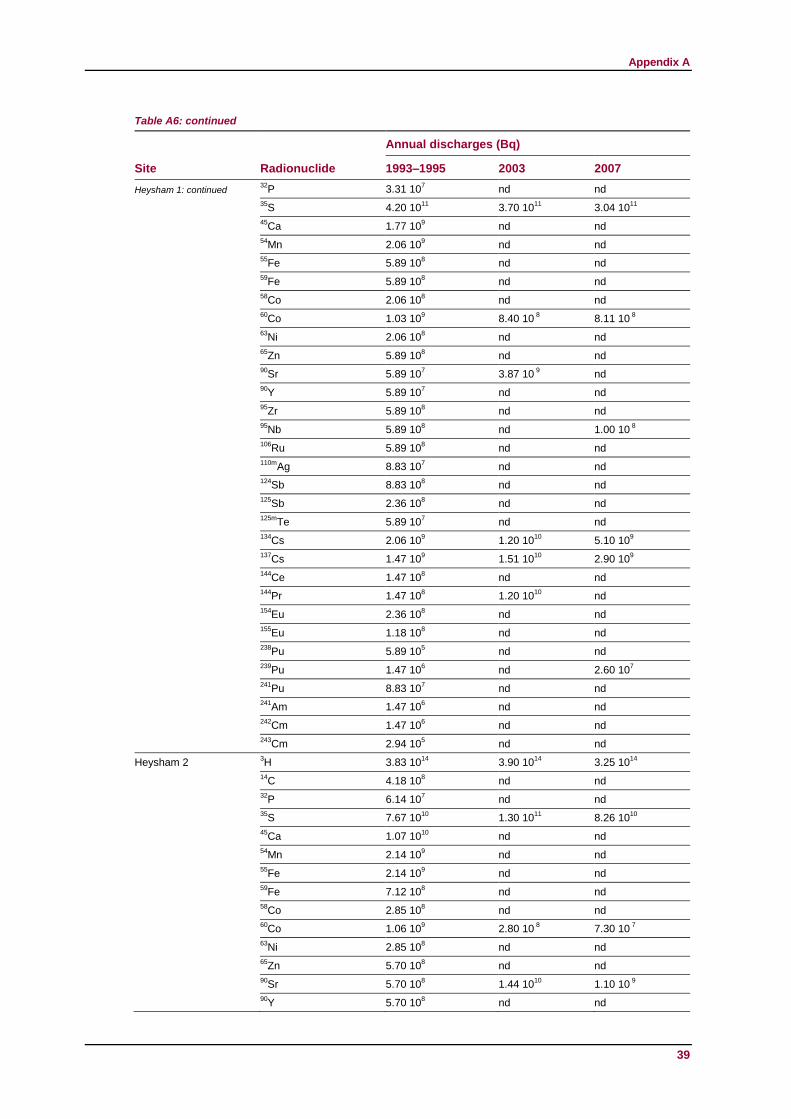
Appendix A
Table A6: continued
39
Site Radionuclide
Annual discharges (Bq)
1993–1995 2003 2007
Heysham 1: continued 32
P 3.31 107 nd nd
35
S 4.20 1011
3.70 1011
3.04 1011
45
Ca 1.77 109 nd nd
54
Mn 2.06 109 nd nd
55
Fe 5.89 108 nd nd
59
Fe 5.89 108 nd nd
58
Co 2.06 108 nd nd
60
Co 1.03 109 8.40 10
8 8.11 10
8
63
Ni 2.06 108 nd nd
65
Zn 5.89 108 nd nd
90
Sr 5.89 107 3.87 10
9 nd
90
Y 5.89 107 nd nd
95
Zr 5.89 108 nd nd
95
Nb 5.89 108 nd 1.00 10
8
106
Ru 5.89 108 nd nd
110m
Ag 8.83 107 nd nd
124
Sb 8.83 108 nd nd
125
Sb 2.36 108 nd nd
125m
Te 5.89 107 nd nd
134
Cs 2.06 109 1.20 10
10 5.10 10
9
137
Cs 1.47 109 1.51 10
10 2.90 10
9
144
Ce 1.47 108 nd nd
144
Pr 1.47 108 1.20 10
10 nd
154
Eu 2.36 108 nd nd
155
Eu 1.18 108 nd nd
238
Pu 5.89 105 nd nd
239
Pu 1.47 106 nd 2.60 10
7
241
Pu 8.83 107 nd nd
241
Am 1.47 106 nd nd
242
Cm 1.47 106 nd nd
243
Cm 2.94 105 nd nd
Heysham 2 3
H 3.83 1014
3.90 1014
3.25 1014
14
C 4.18 108 nd nd
32
P 6.14 107 nd nd
35
S 7.67 1010
1.30 1011
8.26 1010
45
Ca 1.07 1010
nd nd
54
Mn 2.14 109 nd nd
55
Fe 2.14 109 nd nd
59
Fe 7.12 108 nd nd
58
Co 2.85 108 nd nd
60
Co 1.06 109 2.80 10
8 7.30 10
7
63
Ni 2.85 108 nd nd
65
Zn 5.70 108 nd nd
90
Sr 5.70 108 1.44 10
10 1.10 10
9
90
Y 5.70 108 nd nd
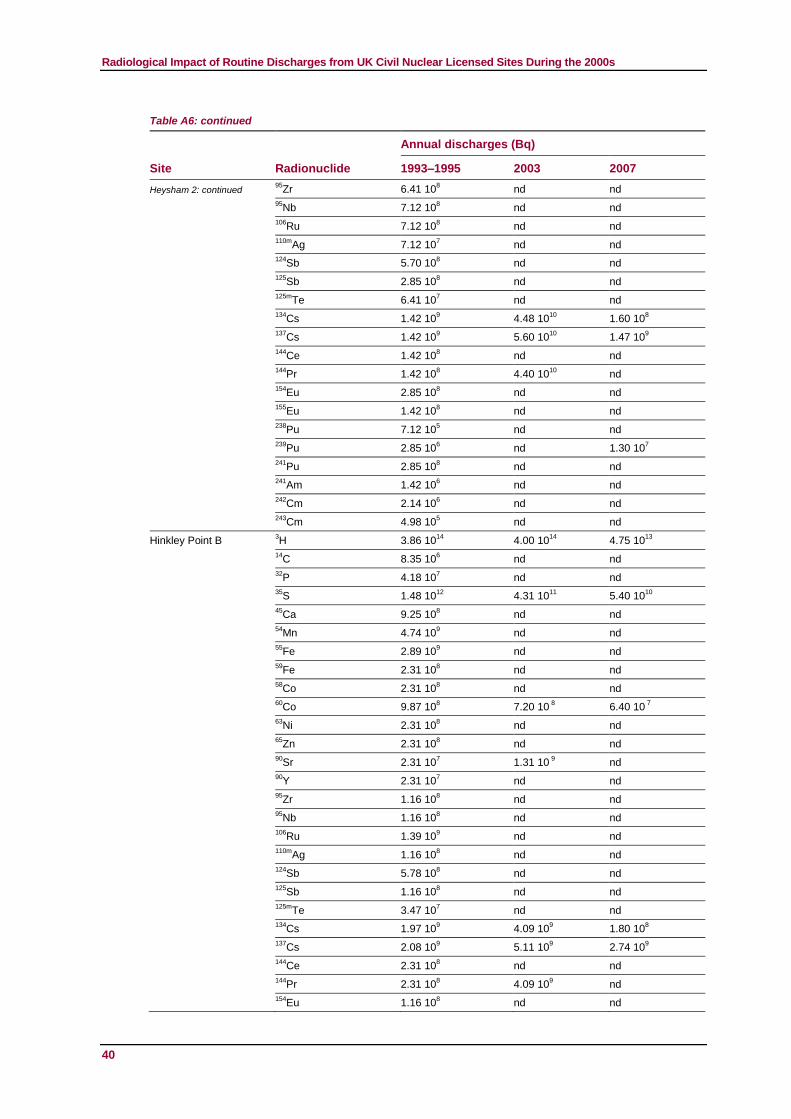
Radiological Impact of Routine Discharges from UK Civil Nuclear Licensed Sites During the 2000s
Table A6: continued
40
Site Radionuclide
Annual discharges (Bq)
1993–1995 2003 2007
Heysham 2: continued 95
Zr 6.41 108 nd nd
95
Nb 7.12 108 nd nd
106
Ru 7.12 108 nd nd
110m
Ag 7.12 107 nd nd
124
Sb 5.70 108 nd nd
125
Sb 2.85 108 nd nd
125m
Te 6.41 107 nd nd
134
Cs 1.42 109 4.48 10
10 1.60 10
8
137
Cs 1.42 109 5.60 10
10 1.47 10
9
144
Ce 1.42 108 nd nd
144
Pr 1.42 108 4.40 10
10 nd
154
Eu 2.85 108 nd nd
155
Eu 1.42 108 nd nd
238
Pu 7.12 105 nd nd
239
Pu 2.85 106 nd 1.30 10
7
241
Pu 2.85 108 nd nd
241
Am 1.42 106 nd nd
242
Cm 2.14 106 nd nd
243
Cm 4.98 105 nd nd
Hinkley Point B 3
H 3.86 1014
4.00 1014
4.75 1013
14
C 8.35 106 nd nd
32
P 4.18 107 nd nd
35
S 1.48 1012
4.31 1011
5.40 1010
45
Ca 9.25 108 nd nd
54
Mn 4.74 109 nd nd
55
Fe 2.89 109 nd nd
59
Fe 2.31 108 nd nd
58
Co 2.31 108 nd nd
60
Co 9.87 108 7.20 10
8 6.40 10
7
63
Ni 2.31 108 nd nd
65
Zn 2.31 108 nd nd
90
Sr 2.31 107 1.31 10
9 nd
90
Y 2.31 107 nd nd
95
Zr 1.16 108 nd nd
95
Nb 1.16 108 nd nd
106
Ru 1.39 109 nd nd
110m
Ag 1.16 108 nd nd
124
Sb 5.78 108 nd nd
125
Sb 1.16 108 nd nd
125m
Te 3.47 107 nd nd
134
Cs 1.97 109 4.09 10
9 1.80 10
8
137
Cs 2.08 109 5.11 10
9 2.74 10
9
144
Ce 2.31 108 nd nd
144
Pr 2.31 108 4.09 10
9 nd
154
Eu 1.16 108 nd nd
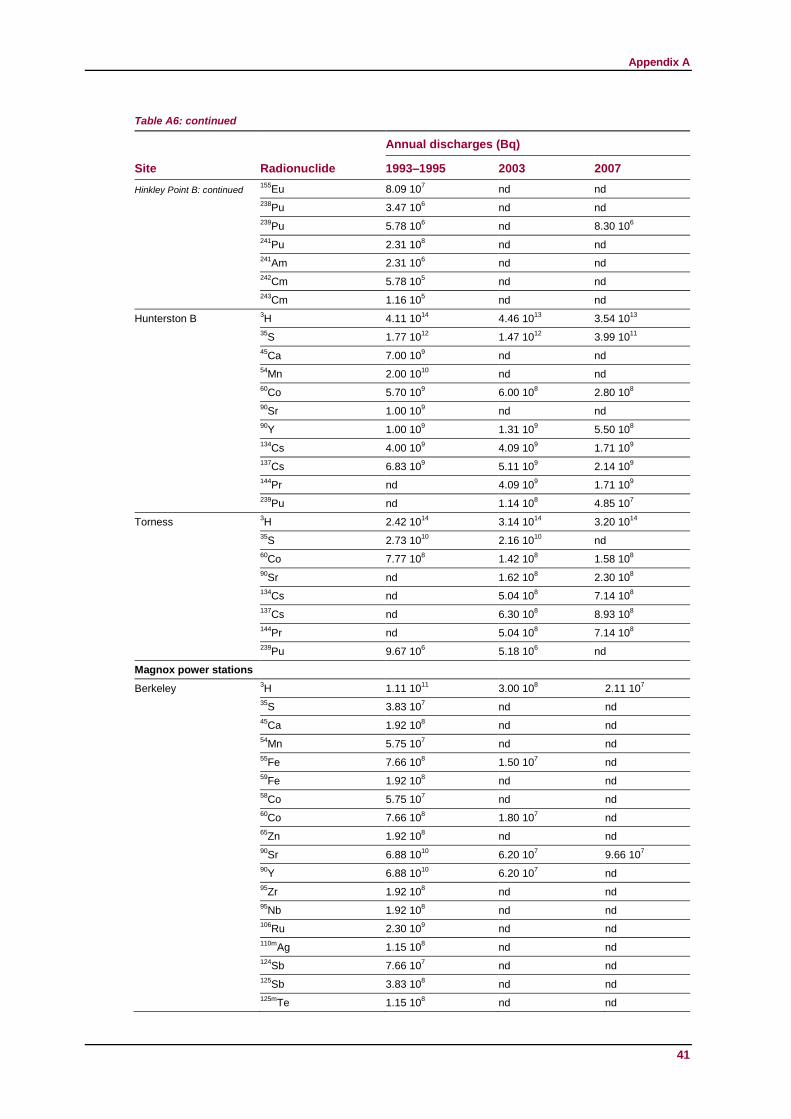
Appendix A
Table A6: continued
41
Site Radionuclide
Annual discharges (Bq)
1993–1995 2003 2007
Hinkley Point B: continued 155
Eu 8.09 107 nd nd
238
Pu 3.47 106 nd nd
239
Pu 5.78 106 nd 8.30 10
6
241
Pu 2.31 108 nd nd
241
Am 2.31 106 nd nd
242
Cm 5.78 105 nd nd
243
Cm 1.16 105 nd nd
Hunterston B 3
H 4.11 1014
4.46 1013
3.54 1013
35
S 1.77 1012
1.47 1012
3.99 1011
45
Ca 7.00 109 nd nd
54
Mn 2.00 1010
nd nd
60
Co 5.70 109 6.00 10
8 2.80 10
8
90
Sr 1.00 109 nd nd
90
Y 1.00 109 1.31 10
9 5.50 10
8
134
Cs 4.00 109 4.09 10
9 1.71 10
9
137
Cs 6.83 109 5.11 10
9 2.14 10
9
144
Pr nd 4.09 109 1.71 10
9
239
Pu nd 1.14 108 4.85 10
7
Torness 3
H 2.42 1014
3.14 1014
3.20 1014
35
S 2.73 1010
2.16 1010
nd
60
Co 7.77 108 1.42 10
8 1.58 10
8
90
Sr nd 1.62 108 2.30 10
8
134
Cs nd 5.04 108 7.14 10
8
137
Cs nd 6.30 108 8.93 10
8
144
Pr nd 5.04 108 7.14 10
8
239
Pu 9.67 106 5.18 10
6 nd
Magnox power stations
Berkeley 3
H 1.11 1011
3.00 108 2.11 10
7
35
S 3.83 107 nd nd
45
Ca 1.92 108 nd nd
54
Mn 5.75 107 nd nd
55
Fe 7.66 108 1.50 10
7 nd
59
Fe 1.92 108 nd nd
58
Co 5.75 107 nd nd
60
Co 7.66 108 1.80 10
7 nd
65
Zn 1.92 108 nd nd
90
Sr 6.88 1010
6.20 107 9.66 10
7
90
Y 6.88 1010
6.20 107 nd
95
Zr 1.92 108 nd nd
95
Nb 1.92 108 nd nd
106
Ru 2.30 109 nd nd
110m
Ag 1.15 108 nd nd
124
Sb 7.66 107 nd nd
125
Sb 3.83 108 nd nd
125m
Te 1.15 108 nd nd

Radiological Impact of Routine Discharges from UK Civil Nuclear Licensed Sites During the 2000s
Table A6: continued
42
Site Radionuclide
Annual discharges (Bq)
1993–1995 2003 2007
Berkeley: continued 134
Cs 1.15 109 nd nd
137
Cs 6.89 1010
1.57 108 4.87 10
7
144
Ce 5.75 108 nd nd
144
Pr 5.75 108 nd nd
154
Eu 1.15 108 nd nd
155
Eu 1.53 108 nd nd
238
Pu 3.83 107 nd nd
239
Pu 1.72 108 nd 9.90 10
4
241
Pu 3.45 109 2.20 10
7 nd
241
Am 1.53 108 1.40 10
6 3.38 10
5
242
Cm 3.83 106 nd nd
243
Cm 1.92 106 nd nd
Bradwell 3
H 2.43 1012
1.27 1011
2.81 1010
35
S 1.50 1011
2.30 109 1.00 10
7
45
Ca 2.14 1010
nd nd
51
Cr 3.83 1010
nd nd
54
Mn 4.74 108 nd 4.00 10
7
55
Fe 6.79 109 7.00 10
8 9.90 10
8
59
Fe 6.32 108 nd 8.00 10
7
58
Co 2.37 108 nd 3.00 10
7
60
Co 3.16 109 3.50 10
8 1.71 10
7
65
Zn 1.26 109 nd 1.10 10
8
90
Sr 2.96 1010
1.10 1011
8.57 109
90
Y 2.96 1010
1.10 1011
nd
95
Zr 6.32 108 nd 7.00 10
7
95
Nb 1.66 109 nd 8.00 10
7
106
Ru 4.75 109 nd 1.10 10
8
110m
Ag 3.16 108 nd 6.00 10
7
124
Sb 3.63 109 3.20 10
8 3.00 10
7
125
Sb 7.90 108 1.80 10
9 2.26 10
8
125m
Te 1.58 108 4.00 10
8 nd
134
Cs 6.15 1010
3.80 1010
4.50 108
137
Cs 3.46 1011
3.73 1011
1.51 1010
144
Ce 1.58 109 nd 2.00 10
8
144
Pr 1.58 109 nd nd
154
Eu 1.58 108 nd nd
155
Eu 3.95 108 nd nd
238
Pu 1.58 108 2.10 10
8 9.40 10
6
239
Pu 3.16 108 5.00 10
8 2.36 10
7
241
Pu 6.24 109 1.20 10
10 nd
241
Am 5.53 108 2.90 10
8 1.61 10
7
242
Cm 7.11 107 nd 1.00 10
6
243
Cm 7.11 106 3.35 10
6 5.00 10
5
244
Cm nd 3.35 106 5.00 10
5
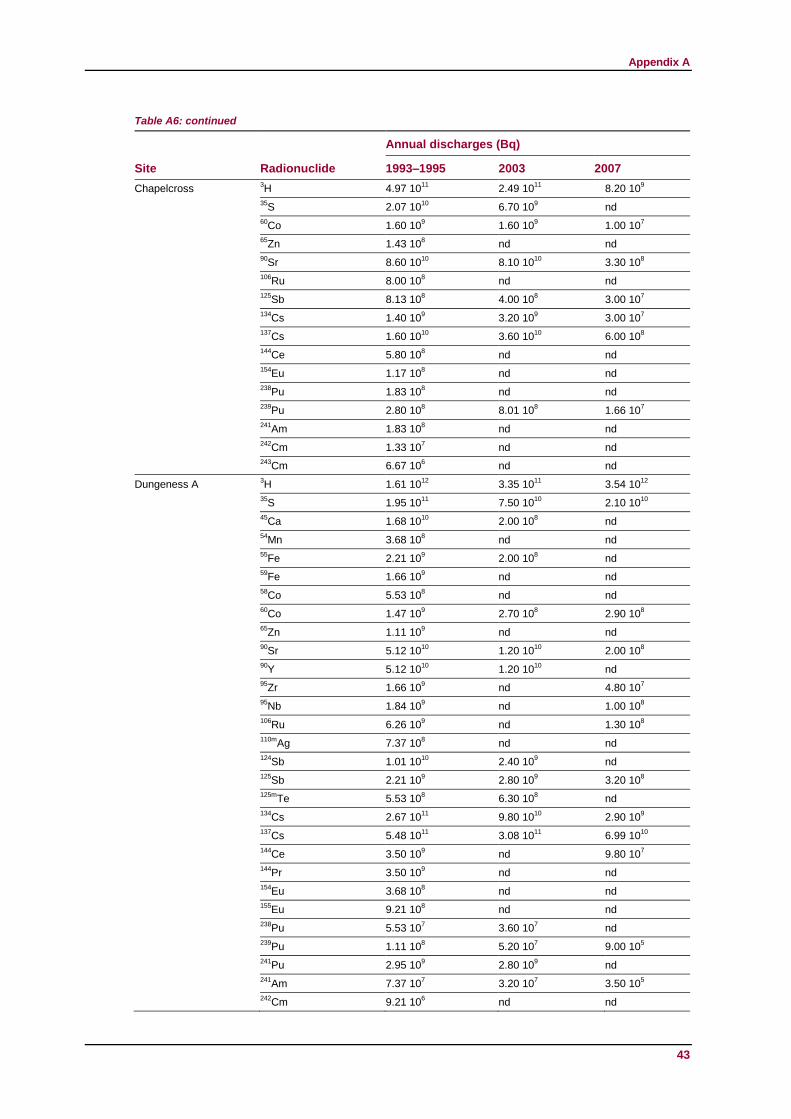
Appendix A
Table A6: continued
43
Site Radionuclide
Annual discharges (Bq)
1993–1995 2003 2007
Chapelcross 3
H 4.97 1011
2.49 1011
8.20 109
35
S 2.07 1010
6.70 109 nd
60
Co 1.60 109 1.60 10
9 1.00 10
7
65
Zn 1.43 108 nd nd
90
Sr 8.60 1010
8.10 1010
3.30 108
106
Ru 8.00 108 nd nd
125
Sb 8.13 108 4.00 10
8 3.00 10
7
134
Cs 1.40 109 3.20 10
9 3.00 10
7
137
Cs 1.60 1010
3.60 1010
6.00 108
144
Ce 5.80 108 nd nd
154
Eu 1.17 108 nd nd
238
Pu 1.83 108 nd nd
239
Pu 2.80 108 8.01 10
8 1.66 10
7
241
Am 1.83 108 nd nd
242
Cm 1.33 107 nd nd
243
Cm 6.67 106 nd nd
Dungeness A 3H 1.61 10
12 3.35 10
11 3.54 10
12
35
S 1.95 1011
7.50 1010
2.10 1010
45
Ca 1.68 1010
2.00 108 nd
54
Mn 3.68 108 nd nd
55
Fe 2.21 109 2.00 10
8 nd
59
Fe 1.66 109 nd nd
58
Co 5.53 108 nd nd
60
Co 1.47 109 2.70 10
8 2.90 10
8
65
Zn 1.11 109 nd nd
90
Sr 5.12 1010
1.20 1010
2.00 108
90
Y 5.12 1010
1.20 1010
nd
95
Zr 1.66 109 nd 4.80 10
7
95
Nb 1.84 109 nd 1.00 10
8
106
Ru 6.26 109 nd 1.30 10
8
110m
Ag 7.37 108 nd nd
124
Sb 1.01 1010
2.40 109 nd
125
Sb 2.21 109 2.80 10
9 3.20 10
8
125m
Te 5.53 108 6.30 10
8 nd
134
Cs 2.67 1011
9.80 1010
2.90 109
137
Cs 5.48 1011
3.08 1011
6.99 1010
144
Ce 3.50 109 nd 9.80 10
7
144
Pr 3.50 109 nd nd
154
Eu 3.68 108 nd nd
155
Eu 9.21 108 nd nd
238
Pu 5.53 107 3.60 10
7 nd
239
Pu 1.11 108 5.20 10
7 9.00 10
5
241
Pu 2.95 109 2.80 10
9 nd
241
Am 7.37 107 3.20 10
7 3.50 10
5
242
Cm 9.21 106 nd nd
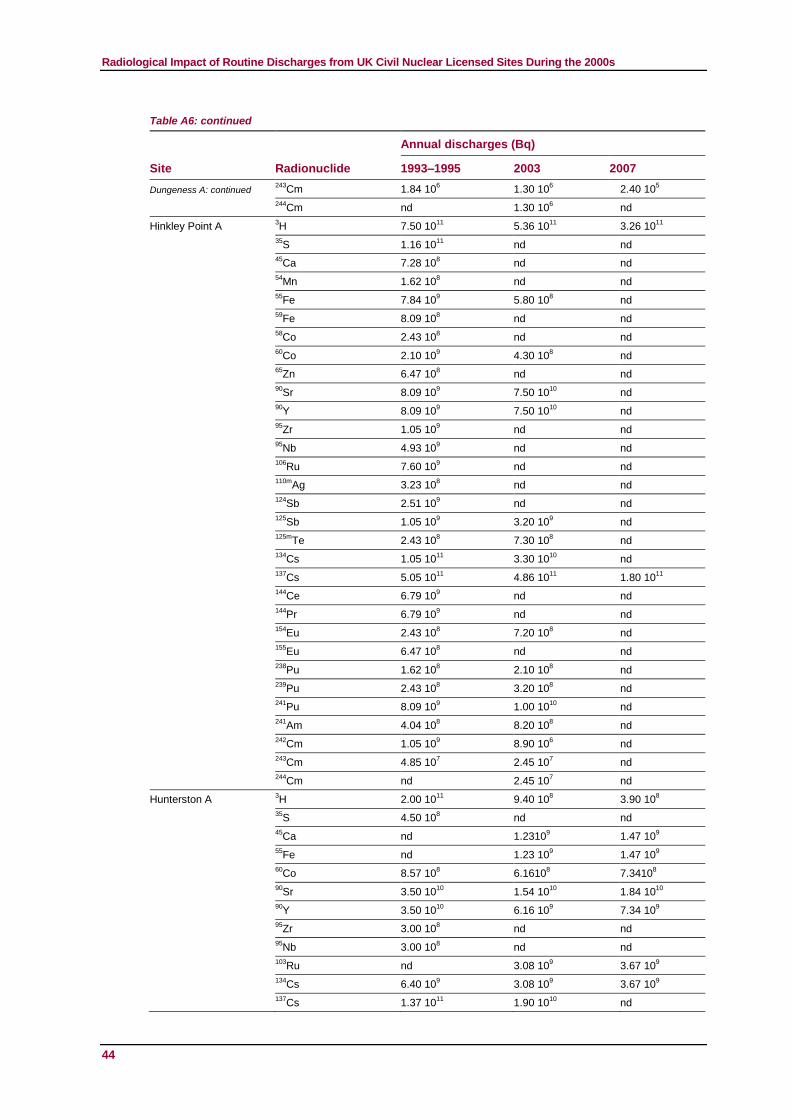
Radiological Impact of Routine Discharges from UK Civil Nuclear Licensed Sites During the 2000s
Table A6: continued
44
Site Radionuclide
Annual discharges (Bq)
1993–1995 2003 2007
Dungeness A: continued 243
Cm 1.84 106 1.30 10
6 2.40 10
5
244
Cm nd 1.30 106 nd
Hinkley Point A 3
H 7.50 1011
5.36 1011
3.26 1011
35
S 1.16 1011
nd nd
45
Ca 7.28 108 nd nd
54
Mn 1.62 108 nd nd
55
Fe 7.84 109 5.80 10
8 nd
59
Fe 8.09 108 nd nd
58
Co 2.43 108 nd nd
60
Co 2.10 109 4.30 10
8 nd
65
Zn 6.47 108 nd nd
90
Sr 8.09 109 7.50 10
10 nd
90
Y 8.09 109 7.50 10
10 nd
95
Zr 1.05 109 nd nd
95
Nb 4.93 109 nd nd
106
Ru 7.60 109 nd nd
110m
Ag 3.23 108 nd nd
124
Sb 2.51 109 nd nd
125
Sb 1.05 109 3.20 10
9 nd
125m
Te 2.43 108 7.30 10
8 nd
134
Cs 1.05 1011
3.30 1010
nd
137
Cs 5.05 1011
4.86 1011
1.80 1011
144
Ce 6.79 109 nd nd
144
Pr 6.79 109 nd nd
154
Eu 2.43 108 7.20 10
8 nd
155
Eu 6.47 108 nd nd
238
Pu 1.62 108 2.10 10
8 nd
239
Pu 2.43 108 3.20 10
8 nd
241
Pu 8.09 109 1.00 10
10 nd
241
Am 4.04 108 8.20 10
8 nd
242
Cm 1.05 109 8.90 10
6 nd
243
Cm 4.85 107 2.45 10
7 nd
244
Cm nd 2.45 107 nd
Hunterston A 3
H 2.00 1011
9.40 108 3.90 10
8
35
S 4.50 108 nd nd
45
Ca nd 1.23109 1.47 10
9
55
Fe nd 1.23 109 1.47 10
9
60
Co 8.57 108 6.1610
8 7.3410
8
90
Sr 3.50 1010
1.54 1010
1.84 1010
90
Y 3.50 1010
6.16 109
7.34 109
95
Zr 3.00 108 nd nd
95
Nb 3.00 108 nd nd
103
Ru nd 3.08 109 3.67 10
9
134
Cs 6.40 109 3.08 10
9 3.67 10
9
137
Cs 1.37 1011
1.90 1010
nd
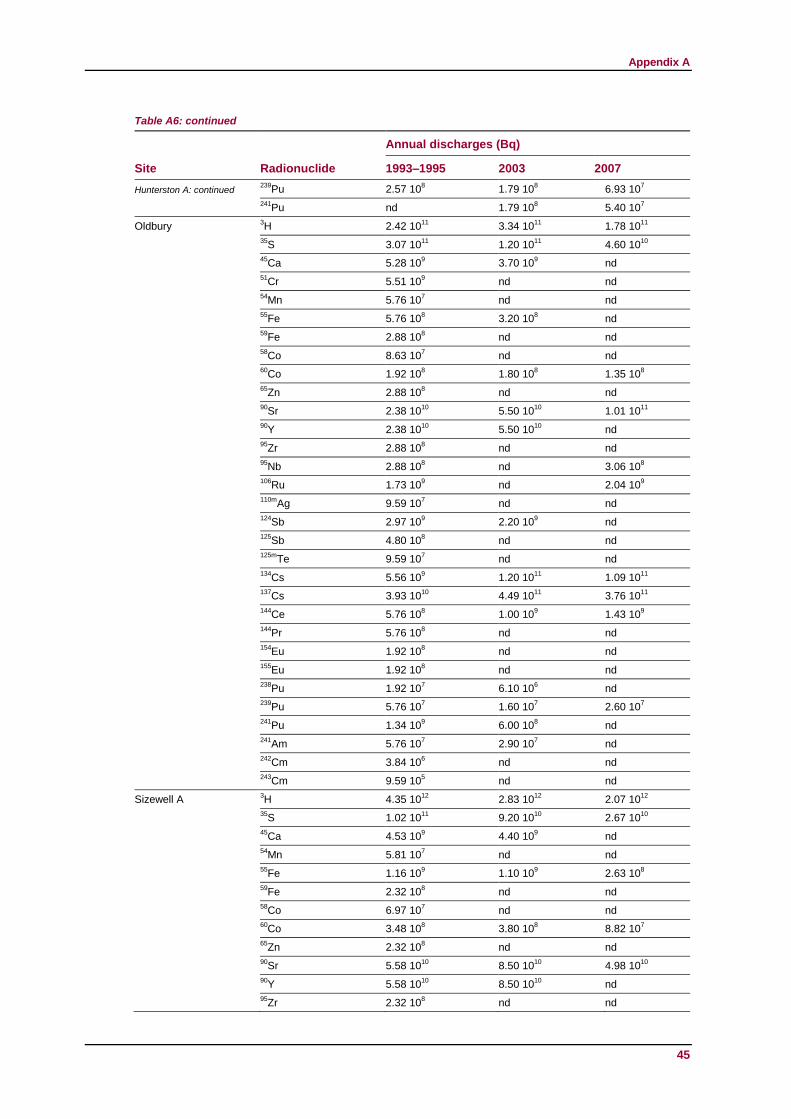
Appendix A
Table A6: continued
45
Site Radionuclide
Annual discharges (Bq)
1993–1995 2003 2007
Hunterston A: continued 239
Pu 2.57 108 1.79 10
8 6.93 10
7
241
Pu nd 1.79 108 5.40 10
7
Oldbury 3
H 2.42 1011
3.34 1011
1.78 1011
35
S 3.07 1011
1.20 1011
4.60 1010
45
Ca 5.28 109 3.70 10
9 nd
51
Cr 5.51 109 nd nd
54
Mn 5.76 107 nd nd
55
Fe 5.76 108 3.20 10
8 nd
59
Fe 2.88 108 nd nd
58
Co 8.63 107 nd nd
60
Co 1.92 108 1.80 10
8 1.35 10
8
65
Zn 2.88 108 nd nd
90
Sr 2.38 1010
5.50 1010
1.01 1011
90
Y 2.38 1010
5.50 1010
nd
95
Zr 2.88 108 nd nd
95
Nb 2.88 108 nd 3.06 10
8
106
Ru 1.73 109 nd 2.04 10
9
110m
Ag 9.59 107 nd nd
124
Sb 2.97 109 2.20 10
9 nd
125
Sb 4.80 108 nd nd
125m
Te 9.59 107 nd nd
134
Cs 5.56 109 1.20 10
11 1.09 10
11
137
Cs 3.93 1010
4.49 1011
3.76 1011
144
Ce 5.76 108 1.00 10
9 1.43 10
9
144
Pr 5.76 108 nd nd
154
Eu 1.92 108 nd nd
155
Eu 1.92 108 nd nd
238
Pu 1.92 107 6.10 10
6 nd
239
Pu 5.76 107 1.60 10
7 2.60 10
7
241
Pu 1.34 109 6.00 10
8 nd
241
Am 5.76 107 2.90 10
7 nd
242
Cm 3.84 106 nd nd
243
Cm 9.59 105 nd nd
Sizewell A 3
H 4.35 1012
2.83 1012
2.07 1012
35
S 1.02 1011
9.20 1010
2.67 1010
45
Ca 4.53 109 4.40 10
9 nd
54
Mn 5.81 107 nd nd
55
Fe 1.16 109 1.10 10
9 2.63 10
8
59
Fe 2.32 108 nd nd
58
Co 6.97 107 nd nd
60
Co 3.48 108 3.80 10
8 8.82 10
7
65
Zn 2.32 108 nd nd
90
Sr 5.58 1010
8.50 1010
4.98 1010
90
Y 5.58 1010
8.50 1010
nd
95
Zr 2.32 108 nd nd
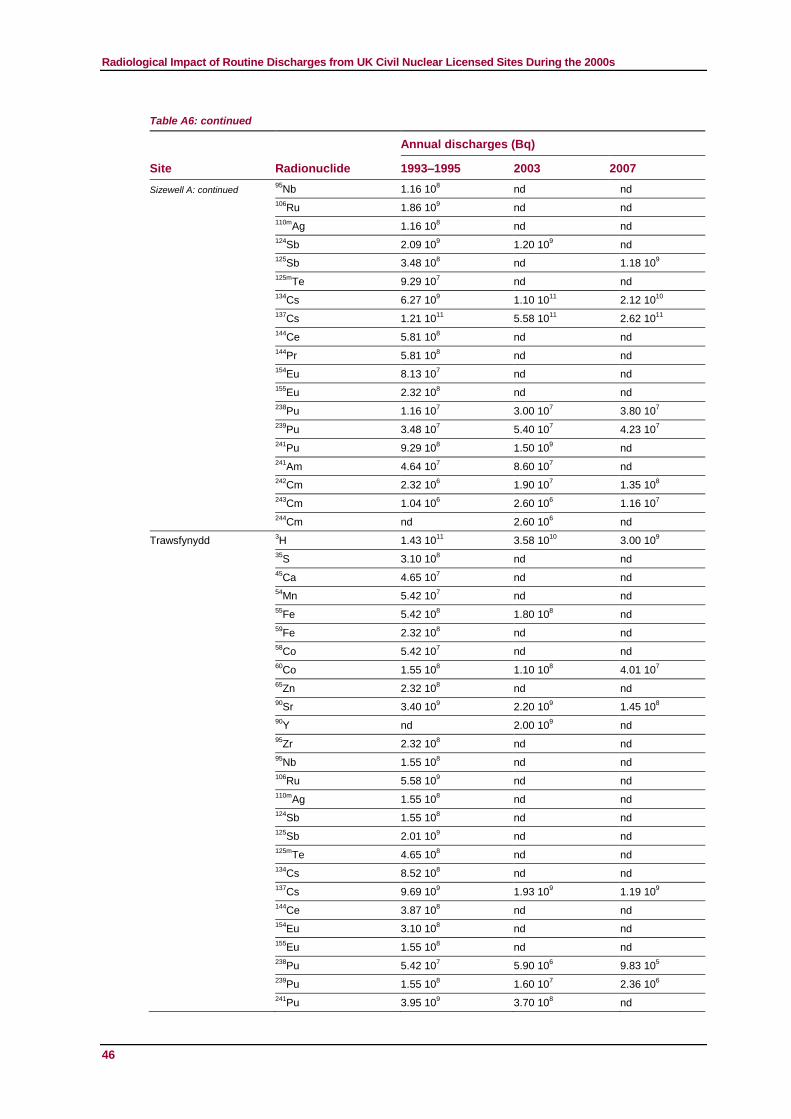
Radiological Impact of Routine Discharges from UK Civil Nuclear Licensed Sites During the 2000s
Table A6: continued
46
Site Radionuclide
Annual discharges (Bq)
1993–1995 2003 2007
Sizewell A: continued 95
Nb 1.16 108 nd nd
106
Ru 1.86 109 nd nd
110m
Ag 1.16 108 nd nd
124
Sb 2.09 109 1.20 10
9 nd
125
Sb 3.48 108 nd 1.18 10
9
125m
Te 9.29 107 nd nd
134
Cs 6.27 109 1.10 10
11 2.12 10
10
137
Cs 1.21 1011
5.58 1011
2.62 1011
144
Ce 5.81 108 nd nd
144
Pr 5.81 108 nd nd
154
Eu 8.13 107 nd nd
155
Eu 2.32 108 nd nd
238
Pu 1.16 107 3.00 10
7 3.80 10
7
239
Pu 3.48 107 5.40 10
7 4.23 10
7
241
Pu 9.29 108 1.50 10
9 nd
241
Am 4.64 107 8.60 10
7 nd
242
Cm 2.32 106 1.90 10
7 1.35 10
8
243
Cm 1.04 106 2.60 10
6 1.16 10
7
244
Cm nd 2.60 106 nd
Trawsfynydd 3
H 1.43 1011
3.58 1010
3.00 109
35
S 3.10 108 nd nd
45
Ca 4.65 107 nd nd
54
Mn 5.42 107 nd nd
55
Fe 5.42 108 1.80 10
8 nd
59
Fe 2.32 108 nd nd
58
Co 5.42 107 nd nd
60
Co 1.55 108 1.10 10
8 4.01 10
7
65
Zn 2.32 108 nd nd
90
Sr 3.40 109 2.20 10
9 1.45 10
8
90
Y nd 2.00 109 nd
95
Zr 2.32 108 nd nd
95
Nb 1.55 108 nd nd
106
Ru 5.58 109 nd nd
110m
Ag 1.55 108 nd nd
124
Sb 1.55 108 nd nd
125
Sb 2.01 109 nd nd
125m
Te 4.65 108 nd nd
134
Cs 8.52 108 nd nd
137
Cs 9.69 109 1.93 10
9 1.19 10
9
144
Ce 3.87 108 nd nd
154
Eu 3.10 108 nd nd
155
Eu 1.55 108 nd nd
238
Pu 5.42 107 5.90 10
6 9.83 10
5
239
Pu 1.55 108 1.60 10
7 2.36 10
6
241
Pu 3.95 109 3.70 10
8 nd
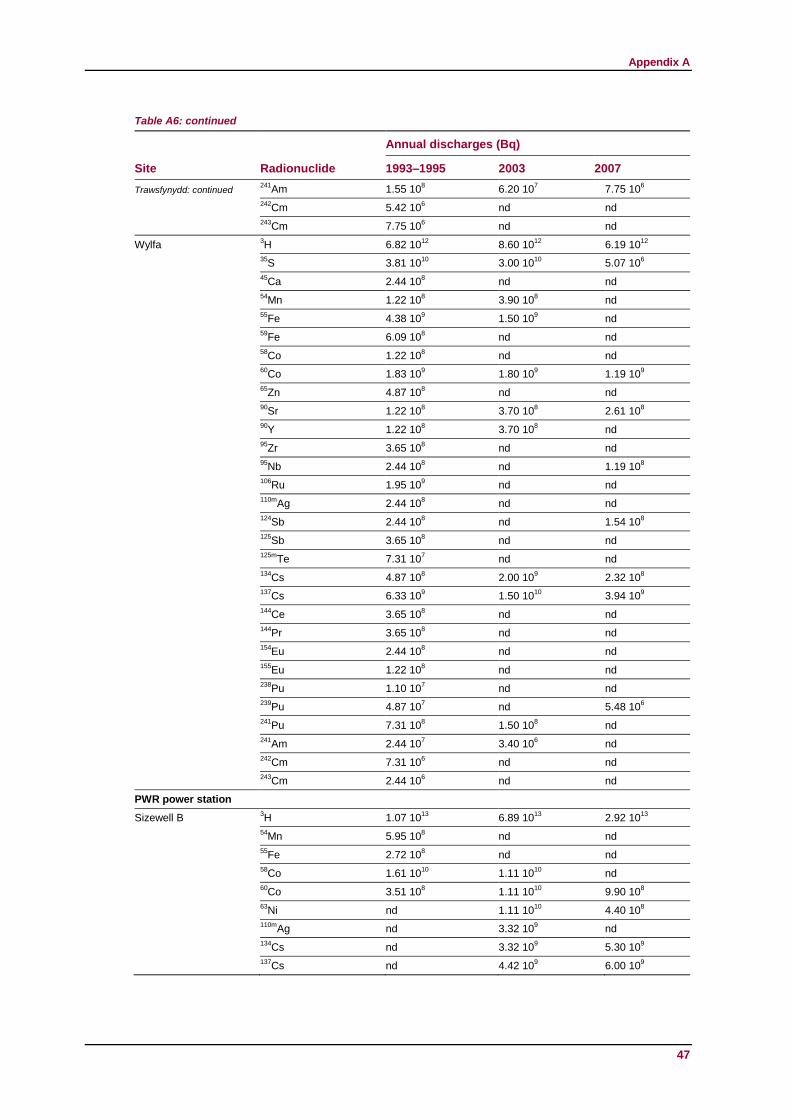
Appendix A
Table A6: continued
47
Site Radionuclide
Annual discharges (Bq)
1993–1995 2003 2007
Trawsfynydd: continued 241
Am 1.55 108 6.20 10
7 7.75 10
6
242
Cm 5.42 106 nd nd
243
Cm 7.75 106 nd nd
Wylfa 3H 6.82 10
12 8.60 10
12 6.19 10
12
35
S 3.81 1010
3.00 1010
5.07 106
45
Ca 2.44 108 nd nd
54
Mn 1.22 108 3.90 10
8 nd
55
Fe 4.38 109 1.50 10
9 nd
59
Fe 6.09 108 nd nd
58
Co 1.22 108 nd nd
60
Co 1.83 109 1.80 10
9 1.19 10
9
65
Zn 4.87 108 nd nd
90
Sr 1.22 108 3.70 10
8 2.61 10
8
90
Y 1.22 108 3.70 10
8 nd
95
Zr 3.65 108 nd nd
95
Nb 2.44 108 nd 1.19 10
8
106
Ru 1.95 109 nd nd
110m
Ag 2.44 108 nd nd
124
Sb 2.44 108 nd 1.54 10
8
125
Sb 3.65 108 nd nd
125m
Te 7.31 107 nd nd
134
Cs 4.87 108 2.00 10
9 2.32 10
8
137
Cs 6.33 109 1.50 10
10 3.94 10
9
144
Ce 3.65 108 nd nd
144
Pr 3.65 108 nd nd
154
Eu 2.44 108 nd nd
155
Eu 1.22 108 nd nd
238
Pu 1.10 107 nd nd
239
Pu 4.87 107 nd 5.48 10
6
241
Pu 7.31 108 1.50 10
8 nd
241
Am 2.44 107 3.40 10
6 nd
242
Cm 7.31 106 nd nd
243
Cm 2.44 106 nd nd
PWR power station
Sizewell B 3
H 1.07 1013
6.89 1013
2.92 1013
54
Mn 5.95 108 nd nd
55
Fe 2.72 108 nd nd
58
Co 1.61 1010
1.11 1010
nd
60
Co 3.51 108 1.11 10
10 9.90 10
8
63
Ni nd 1.11 1010
4.40 108
110m
Ag nd 3.32 109 nd
134
Cs nd 3.32 109 5.30 10
9
137
Cs nd 4.42 109 6.00 10
9
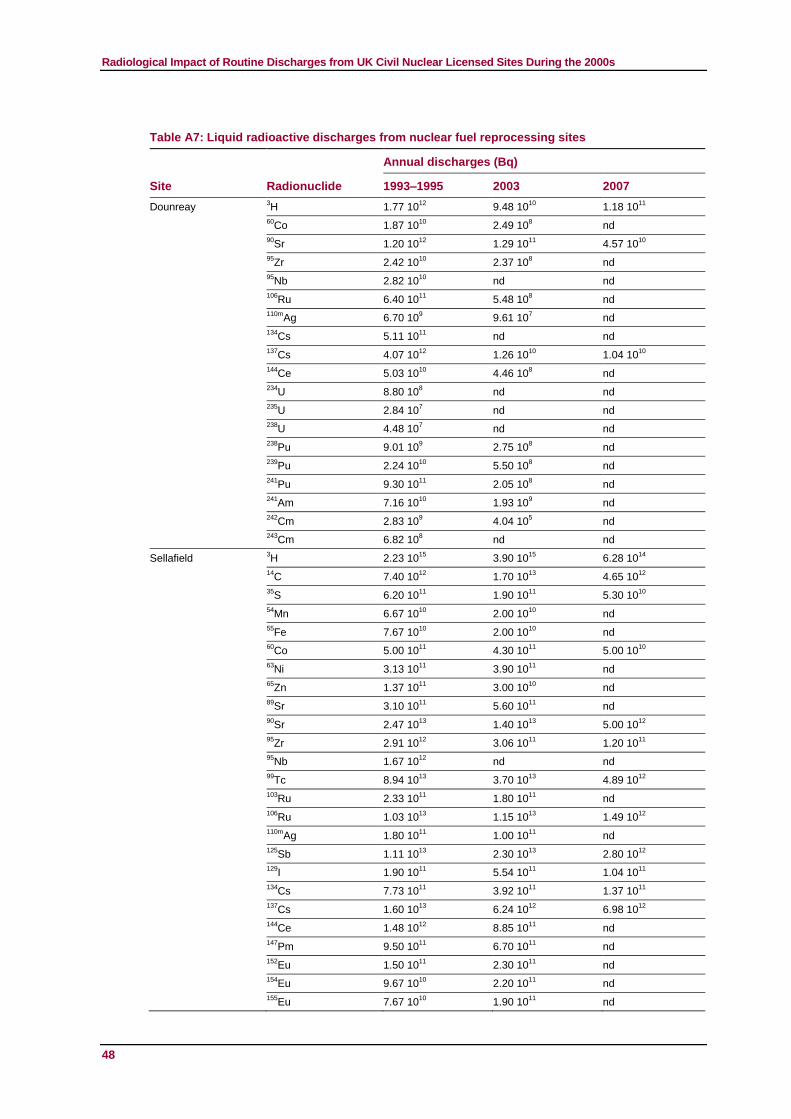
Radiological Impact of Routine Discharges from UK Civil Nuclear Licensed Sites During the 2000s
48
Table A7: Liquid radioactive discharges from nuclear fuel reprocessing sites
Site Radionuclide
Annual discharges (Bq)
1993–1995 2003 2007
Dounreay 3H 1.77 10
12 9.48 10
10 1.18 10
11
60
Co 1.87 1010
2.49 108 nd
90
Sr 1.20 1012
1.29 1011
4.57 1010
95
Zr 2.42 1010
2.37 108 nd
95
Nb 2.82 1010
nd nd
106
Ru 6.40 1011
5.48 108 nd
110m
Ag 6.70 109 9.61 10
7 nd
134
Cs 5.11 1011
nd nd
137
Cs 4.07 1012
1.26 1010
1.04 1010
144
Ce 5.03 1010
4.46 108 nd
234
U 8.80 108 nd nd
235
U 2.84 107 nd nd
238
U 4.48 107 nd nd
238
Pu 9.01 109 2.75 10
8 nd
239
Pu 2.24 1010
5.50 108 nd
241
Pu 9.30 1011
2.05 108 nd
241
Am 7.16 1010
1.93 109 nd
242
Cm 2.83 109 4.04 10
5 nd
243
Cm 6.82 108 nd nd
Sellafield 3
H 2.23 1015
3.90 1015
6.28 1014
14
C 7.40 1012
1.70 1013
4.65 1012
35
S 6.20 1011
1.90 1011
5.30 1010
54
Mn 6.67 1010
2.00 1010
nd
55
Fe 7.67 1010
2.00 1010
nd
60
Co 5.00 1011
4.30 1011
5.00 1010
63
Ni 3.13 1011
3.90 1011
nd
65
Zn 1.37 1011
3.00 1010
nd
89
Sr 3.10 1011
5.60 1011
nd
90
Sr 2.47 1013
1.40 1013
5.00 1012
95
Zr 2.91 1012
3.06 1011
1.20 1011
95
Nb 1.67 1012
nd nd
99
Tc 8.94 1013
3.70 1013
4.89 1012
103
Ru 2.33 1011
1.80 1011
nd
106
Ru 1.03 1013
1.15 1013
1.49 1012
110m
Ag 1.80 1011
1.00 1011
nd
125
Sb 1.11 1013
2.30 1013
2.80 1012
129
I 1.90 1011
5.54 1011
1.04 1011
134
Cs 7.73 1011
3.92 1011
1.37 1011
137
Cs 1.60 1013
6.24 1012
6.98 1012
144
Ce 1.48 1012
8.85 1011
nd
147
Pm 9.50 1011
6.70 1011
nd
152
Eu 1.50 1011
2.30 1011
nd
154
Eu 9.67 1010
2.20 1011
nd
155
Eu 7.67 1010
1.90 1011
nd
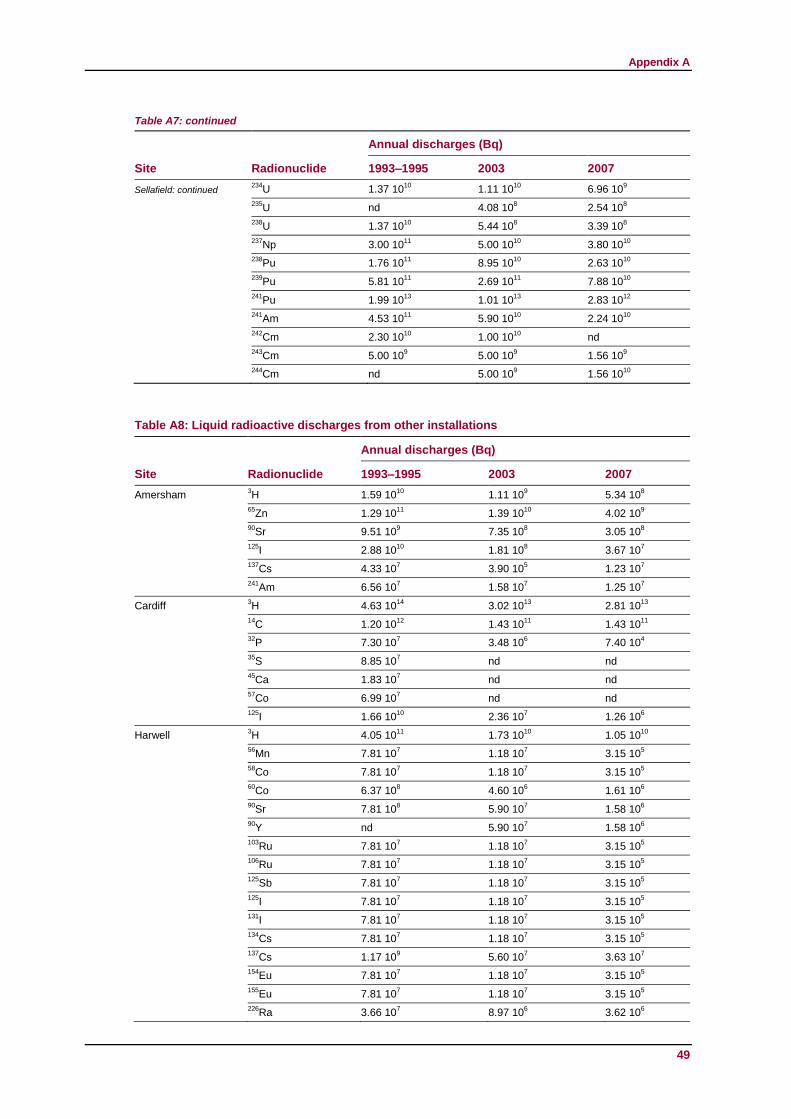
Appendix A
Table A7: continued
49
Site Radionuclide
Annual discharges (Bq)
1993–1995 2003 2007
Sellafield: continued 234
U 1.37 1010
1.11 1010
6.96 109
235
U nd 4.08 108 2.54 10
8
238
U 1.37 1010
5.44 108 3.39 10
8
237
Np 3.00 1011
5.00 1010
3.80 1010
238
Pu 1.76 1011
8.95 1010
2.63 1010
239
Pu 5.81 1011
2.69 1011
7.88 1010
241
Pu 1.99 1013
1.01 1013
2.83 1012
241
Am 4.53 1011
5.90 1010
2.24 1010
242
Cm 2.30 1010
1.00 1010
nd
243
Cm 5.00 109 5.00 10
9 1.56 10
9
244
Cm nd 5.00 109 1.56 10
10
Table A8: Liquid radioactive discharges from other installations
Site Radionuclide
Annual discharges (Bq)
1993–1995 2003 2007
Amersham 3H 1.59 10
10 1.11 10
9 5.34 10
8
65
Zn 1.29 1011
1.39 1010
4.02 109
90
Sr 9.51 109 7.35 10
8 3.05 10
8
125
I 2.88 1010
1.81 108 3.67 10
7
137
Cs 4.33 107 3.90 10
5 1.23 10
7
241
Am 6.56 107 1.58 10
7 1.25 10
7
Cardiff 3H 4.63 10
14 3.02 10
13 2.81 10
13
14
C 1.20 1012
1.43 1011
1.43 1011
32
P 7.30 107 3.48 10
6 7.40 10
4
35
S 8.85 107 nd nd
45
Ca 1.83 107 nd nd
57
Co 6.99 107 nd nd
125
I 1.66 1010
2.36 107 1.26 10
6
Harwell 3H 4.05 10
11 1.73 10
10 1.05 10
10
56
Mn 7.81 107 1.18 10
7 3.15 10
5
58
Co 7.81 107 1.18 10
7 3.15 10
5
60
Co 6.37 108 4.60 10
6 1.61 10
6
90
Sr 7.81 108 5.90 10
7 1.58 10
6
90
Y
nd 5.90 107 1.58 10
6
103
Ru 7.81 107 1.18 10
7 3.15 10
5
106
Ru 7.81 107 1.18 10
7 3.15 10
5
125
Sb 7.81 107 1.18 10
7 3.15 10
5
125
I 7.81 107 1.18 10
7 3.15 10
5
131
I 7.81 107 1.18 10
7 3.15 10
5
134
Cs 7.81 107 1.18 10
7 3.15 10
5
137
Cs 1.17 109 5.60 10
7 3.63 10
7
154
Eu 7.81 107 1.18 10
7 3.15 10
5
155
Eu 7.81 107 1.18 10
7 3.15 10
5
226
Ra 3.66 107 8.97 10
6 3.62 10
6
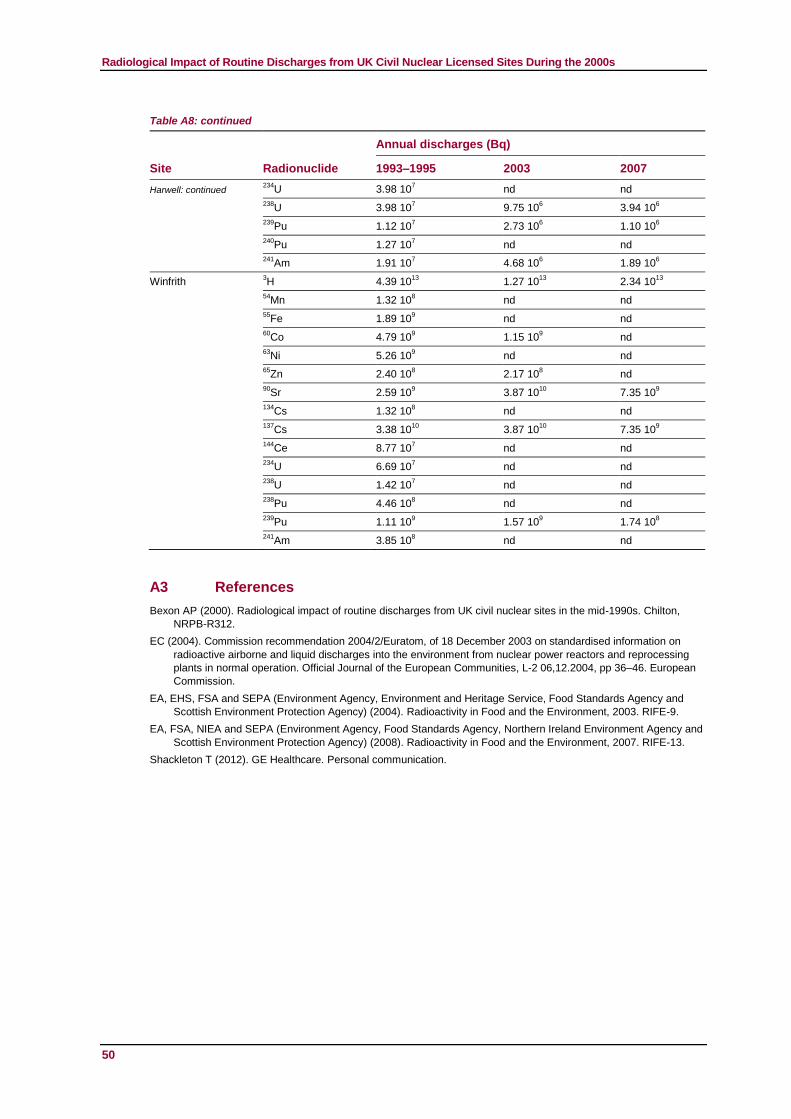
Radiological Impact of Routine Discharges from UK Civil Nuclear Licensed Sites During the 2000s
Table A8: continued
50
Site Radionuclide
Annual discharges (Bq)
1993–1995 2003 2007
Harwell: continued 234
U 3.98 107 nd nd
238
U 3.98 107 9.75 10
6 3.94 10
6
239
Pu 1.12 107 2.73 10
6 1.10 10
6
240
Pu 1.27 107 nd nd
241
Am 1.91 107 4.68 10
6 1.89 10
6
Winfrith 3H 4.39 10
13 1.27 10
13 2.34 10
13
54
Mn 1.32 108 nd nd
55
Fe 1.89 109 nd nd
60
Co 4.79 109 1.15 10
9 nd
63
Ni 5.26 109 nd nd
65
Zn 2.40 108 2.17 10
8 nd
90
Sr 2.59 109 3.87 10
10 7.35 10
9
134
Cs 1.32 108 nd nd
137
Cs 3.38 1010
3.87 1010
7.35 109
144
Ce 8.77 107 nd nd
234
U 6.69 107 nd nd
238
U 1.42 107 nd nd
238
Pu 4.46 108 nd nd
239
Pu 1.11 109 1.57 10
9 1.74 10
8
241
Am 3.85 108 nd nd
A3 References
Bexon AP (2000). Radiological impact of routine discharges from UK civil nuclear sites in the mid-1990s. Chilton,
NRPB-R312.
EC (2004). Commission recommendation 2004/2/Euratom, of 18 December 2003 on standardised information on
radioactive airborne and liquid discharges into the environment from nuclear power reactors and reprocessing
plants in normal operation. Official Journal of the European Communities, L-2 06,12.2004, pp 36–46. European
Commission.
EA, EHS, FSA and SEPA (Environment Agency, Environment and Heritage Service, Food Standards Agency and
Scottish Environment Protection Agency) (2004). Radioactivity in Food and the Environment, 2003. RIFE-9.
EA, FSA, NIEA and SEPA (Environment Agency, Food Standards Agency, Northern Ireland Environment Agency and
Scottish Environment Protection Agency) (2008). Radioactivity in Food and the Environment, 2007. RIFE-13.
Shackleton T (2012). GE Healthcare. Personal communication.
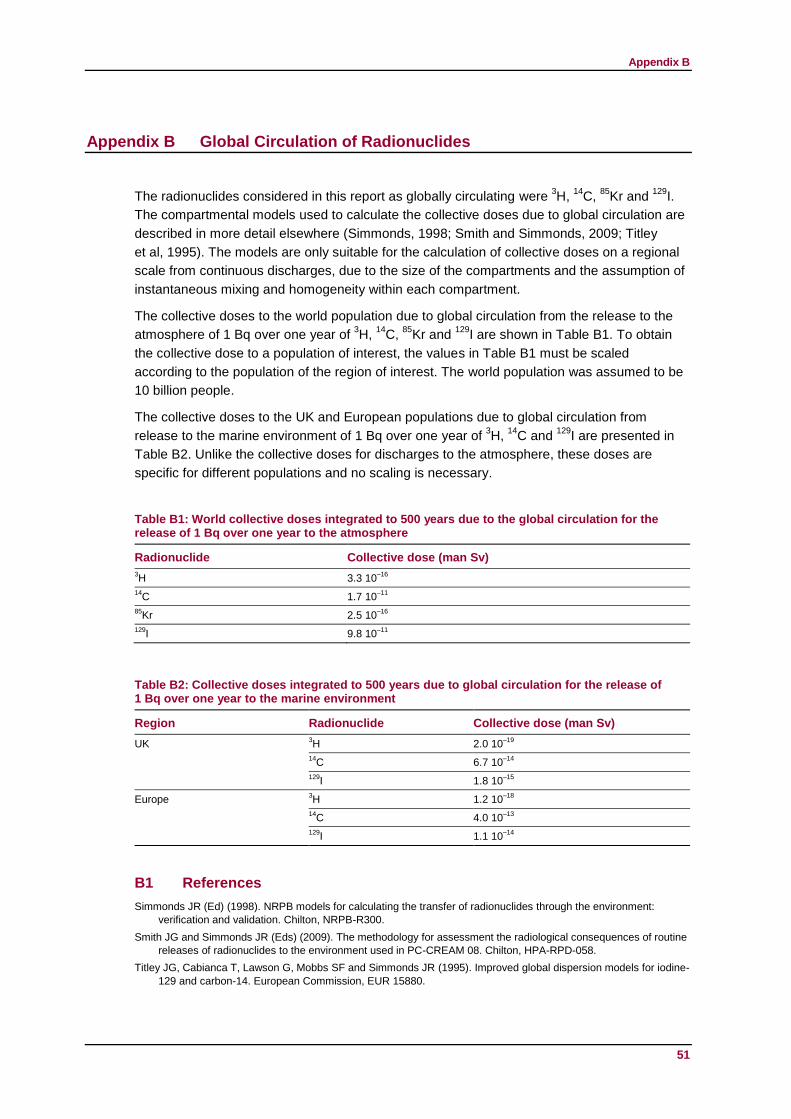
Appendix B
51
Appendix B Global Circulation of Radionuclides
The radionuclides considered in this report as globally circulating were 3H,
14C,
85Kr and
129I.
The compartmental models used to calculate the collective doses due to global circulation are
described in more detail elsewhere (Simmonds, 1998; Smith and Simmonds, 2009; Titley
et al, 1995). The models are only suitable for the calculation of collective doses on a regional
scale from continuous discharges, due to the size of the compartments and the assumption of
instantaneous mixing and homogeneity within each compartment.
The collective doses to the world population due to global circulation from the release to the
atmosphere of 1 Bq over one year of 3H,
14C,
85Kr and
129I are shown in Table B1. To obtain
the collective dose to a population of interest, the values in Table B1 must be scaled
according to the population of the region of interest. The world population was assumed to be
10 billion people.
The collective doses to the UK and European populations due to global circulation from
release to the marine environment of 1 Bq over one year of 3H,
14C and
129I are presented in
Table B2. Unlike the collective doses for discharges to the atmosphere, these doses are
specific for different populations and no scaling is necessary.
Table B1: World collective doses integrated to 500 years due to the global circulation for the release of 1 Bq over one year to the atmosphere
Radionuclide Collective dose (man Sv)
3H 3.3 10
–16
14C 1.7 10
–11
85Kr 2.5 10
–16
129I 9.8 10
–11
Table B2: Collective doses integrated to 500 years due to global circulation for the release of 1 Bq over one year to the marine environment
Region Radionuclide Collective dose (man Sv)
UK 3H 2.0 10
–19
14C 6.7 10
–14
129I 1.8 10
–15
Europe 3H 1.2 10
–18
14C 4.0 10
–13
129I 1.1 10
–14
B1 References
Simmonds JR (Ed) (1998). NRPB models for calculating the transfer of radionuclides through the environment:
verification and validation. Chilton, NRPB-R300.
Smith JG and Simmonds JR (Eds) (2009). The methodology for assessment the radiological consequences of routine
releases of radionuclides to the environment used in PC-CREAM 08. Chilton, HPA-RPD-058.
Titley JG, Cabianca T, Lawson G, Mobbs SF and Simmonds JR (1995). Improved global dispersion models for iodine-
129 and carbon-14. European Commission, EUR 15880.

Radiological Impact of Routine Discharges from UK Civil Nuclear Licensed Sites During the 2000s
52
Appendix C Collective Effective Doses Integrated to 500 Years per Unit
Activity Discharged
The unit collective effective doses integrated to 500 years calculated using an annual
discharge of 1 Bq over one year are presented here. Tables C1 to C4 give the doses to the
European population; Tables C5 to C8 give the doses to the UK population. An asterisk (*)
indicates radionuclides for which the contribution of the first progeny to the dose was included.
C1 Collective effective doses to the European population integrated to
500 years due to a discharge of 1 Bq over one year
Table C1: Collective effective doses to the European population integrated to 500 years due to a discharge of 1 Bq over one year from nuclear fuel fabrication installations
Site Radionuclide
Collective dose (man Sv)
Atmospheric discharges Liquid discharges
Capenhurst 3H 1.6 10
–15 1.6 10
–18
99
Tc – 7.4 10–15
234
Th* 7.8 10–13
3.4 10–17
234
U* 4.4 10–11
1.1 10–14
235
U* 4.0 10–11
–
238
U* 3.7 10–11
9.7 10–15
237
Np* – 3.0 10–13
Springfields 99
Tc – 1.1 10–14
228
Th* – 1.9 10–14
230
Th* – 1.7 10–14
232
Th* – 1.4 10–12
234
Th* 7.0 10–13
5.7 10–17
234
U* 4.0 10–11
1.6 10–14
235
U* 3.6 10–11
1.6 10–14
238
U* 3.4 10–11
1.5 10–14
237
Np* – 4.6 10–13
Table C2: Collective effective doses to the European population integrated to 500 years due to a discharge of 1 Bq over one year from nuclear power production installations
Site Radionuclide
Collective dose (man Sv)
Atmospheric discharges Liquid discharges
AGR power stations
Dungeness B 3
H 1.5 10–15
1.6 10–18
14
C 1.3 10–12
6.6 10–13
32
P – 1.3 10–13
35
S 3.5 10–13
1.2 10–17
41
Ar 3.9 10–17
–
45
Ca – 1.3 10–17
54
Mn – 1.0 10–14
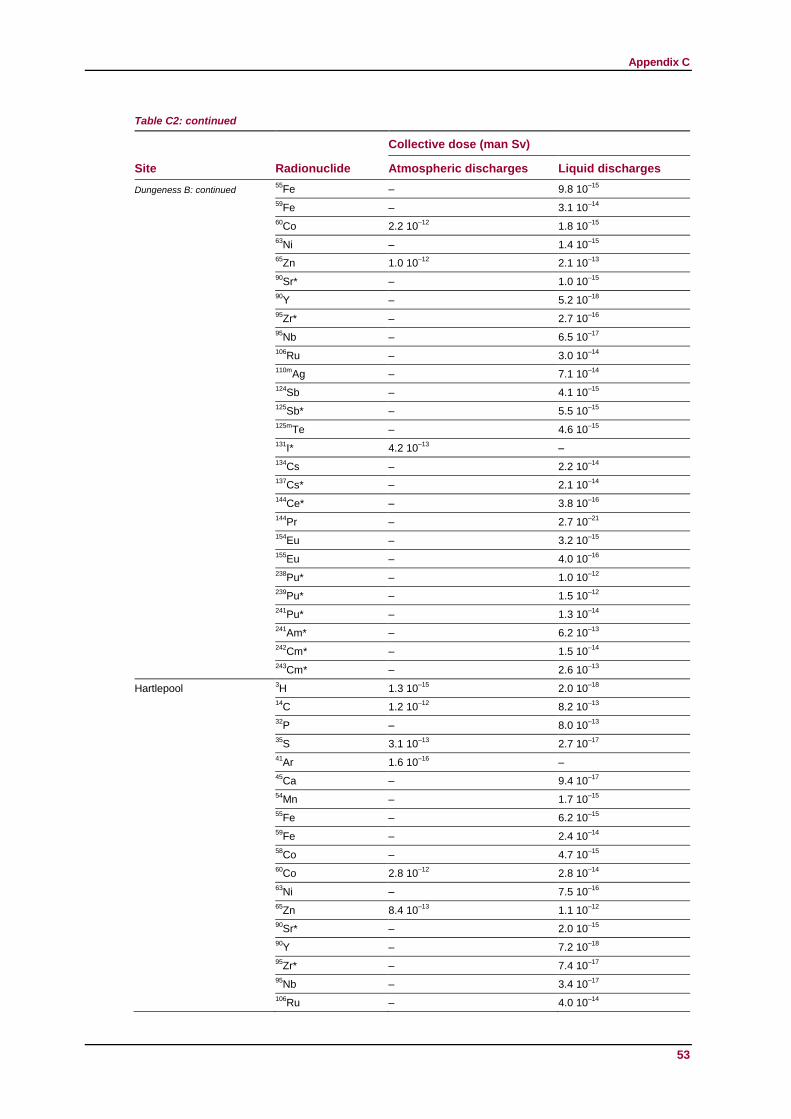
Appendix C
Table C2: continued
53
Site Radionuclide
Collective dose (man Sv)
Atmospheric discharges Liquid discharges
Dungeness B: continued 55
Fe – 9.8 10–15
59
Fe – 3.1 10–14
60
Co
2.2 10–12
1.8 10–15
63
Ni – 1.4 10–15
65
Zn 1.0 10–12
2.1 10–13
90
Sr* – 1.0 10–15
90
Y – 5.2 10–18
95
Zr* – 2.7 10–16
95
Nb – 6.5 10–17
106
Ru – 3.0 10–14
110m
Ag – 7.1 10–14
124
Sb – 4.1 10–15
125
Sb* – 5.5 10–15
125m
Te – 4.6 10–15
131
I* 4.2 10–13
–
134
Cs – 2.2 10–14
137
Cs* – 2.1 10–14
144
Ce* – 3.8 10–16
144
Pr – 2.7 10–21
154
Eu – 3.2 10–15
155
Eu – 4.0 10–16
238
Pu* – 1.0 10–12
239
Pu* – 1.5 10–12
241
Pu* – 1.3 10–14
241
Am* – 6.2 10–13
242
Cm* – 1.5 10–14
243
Cm* – 2.6 10–13
Hartlepool 3H 1.3 10
–15 2.0 10
–18
14
C 1.2 10–12
8.2 10–13
32
P – 8.0 10–13
35
S 3.1 10–13
2.7 10–17
41
Ar 1.6 10–16
–
45
Ca – 9.4 10–17
54
Mn – 1.7 10–15
55
Fe – 6.2 10–15
59
Fe – 2.4 10–14
58
Co – 4.7 10–15
60
Co
2.8 10–12
2.8 10–14
63
Ni – 7.5 10–16
65
Zn 8.4 10–13
1.1 10–12
90
Sr* – 2.0 10–15
90
Y – 7.2 10–18
95
Zr* – 7.4 10–17
95
Nb – 3.4 10–17
106
Ru – 4.0 10–14
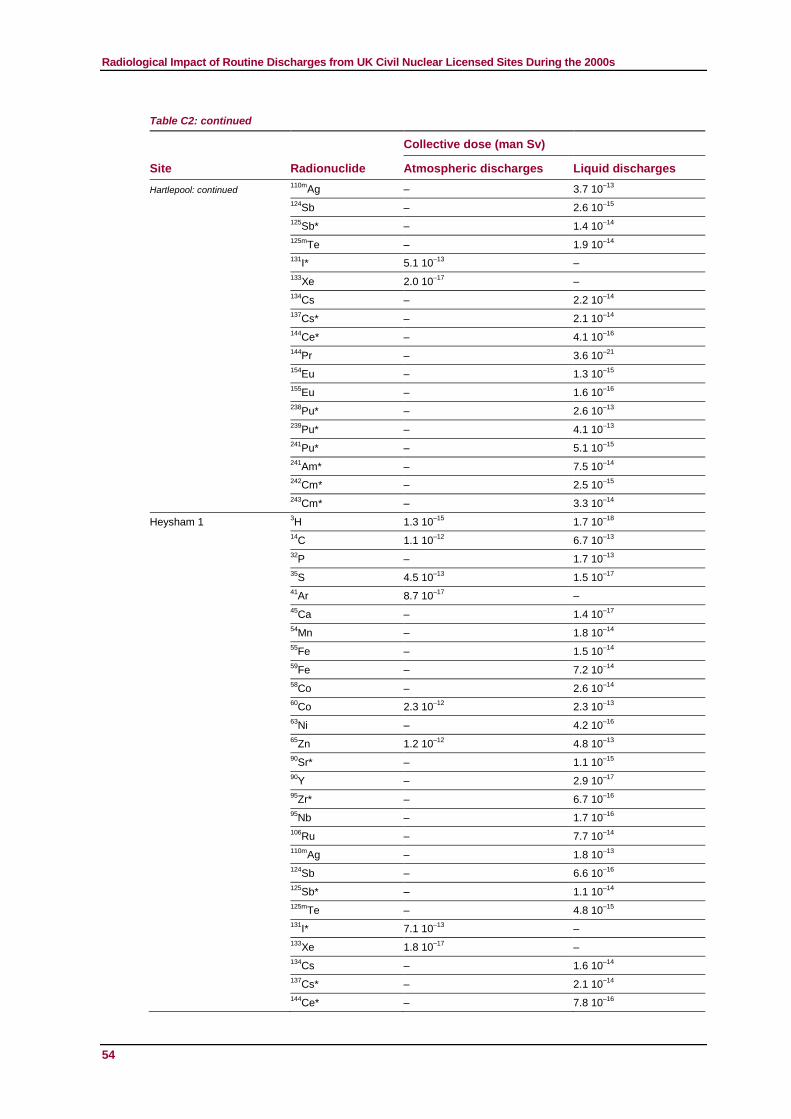
Radiological Impact of Routine Discharges from UK Civil Nuclear Licensed Sites During the 2000s
Table C2: continued
54
Site Radionuclide
Collective dose (man Sv)
Atmospheric discharges Liquid discharges
Hartlepool: continued 110m
Ag – 3.7 10–13
124
Sb – 2.6 10–15
125
Sb* – 1.4 10–14
125m
Te – 1.9 10–14
131
I* 5.1 10–13
–
133
Xe
2.0 10–17
–
134
Cs – 2.2 10–14
137
Cs* – 2.1 10–14
144
Ce* – 4.1 10–16
144
Pr – 3.6 10–21
154
Eu – 1.3 10–15
155
Eu – 1.6 10–16
238
Pu* – 2.6 10–13
239
Pu* – 4.1 10–13
241
Pu* – 5.1 10–15
241
Am* – 7.5 10–14
242
Cm* – 2.5 10–15
243
Cm* – 3.3 10–14
Heysham 1 3
H 1.3 10–15
1.7 10–18
14
C 1.1 10–12
6.7 10–13
32
P – 1.7 10–13
35
S 4.5 10–13
1.5 10–17
41
Ar 8.7 10–17
–
45
Ca – 1.4 10–17
54
Mn – 1.8 10–14
55
Fe – 1.5 10–14
59
Fe – 7.2 10–14
58
Co – 2.6 10–14
60
Co
2.3 10–12
2.3 10–13
63
Ni – 4.2 10–16
65
Zn 1.2 10–12
4.8 10–13
90
Sr* – 1.1 10–15
90
Y – 2.9 10–17
95
Zr* – 6.7 10–16
95
Nb – 1.7 10–16
106
Ru – 7.7 10–14
110m
Ag – 1.8 10–13
124
Sb – 6.6 10–16
125
Sb* – 1.1 10–14
125m
Te – 4.8 10–15
131
I* 7.1 10–13
–
133
Xe
1.8 10–17
–
134
Cs – 1.6 10–14
137
Cs* – 2.1 10–14
144
Ce* – 7.8 10–16
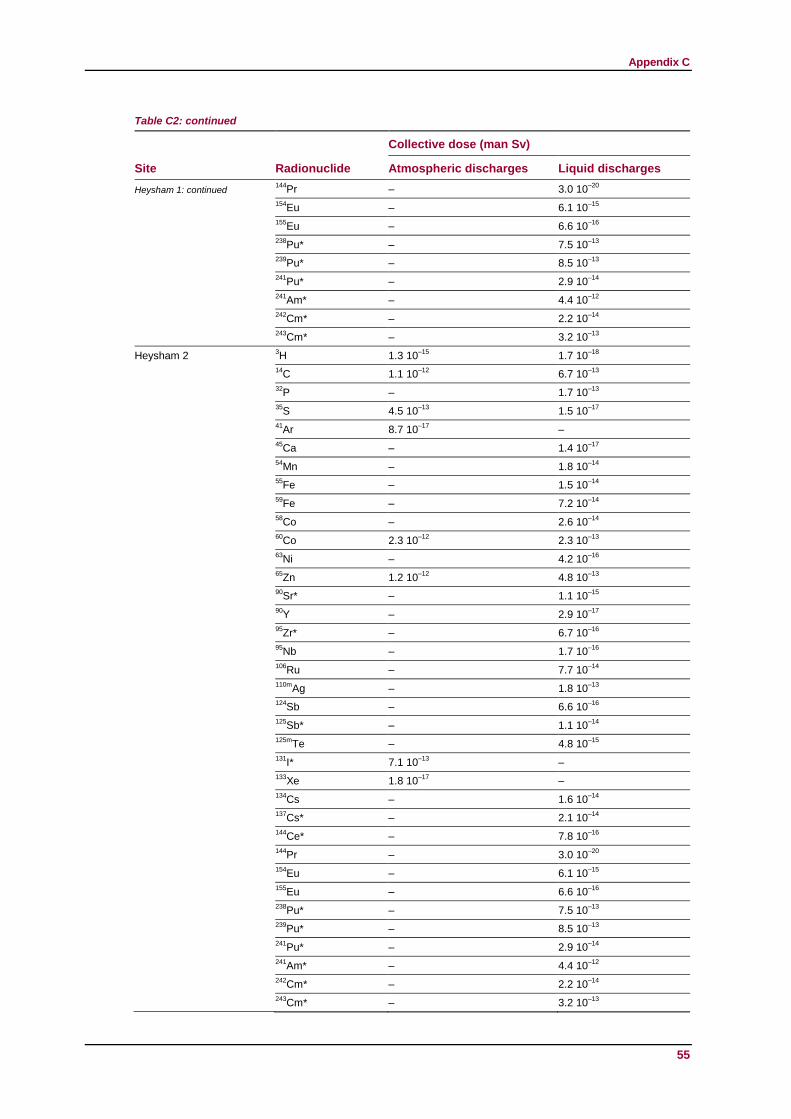
Appendix C
Table C2: continued
55
Site Radionuclide
Collective dose (man Sv)
Atmospheric discharges Liquid discharges
Heysham 1: continued 144
Pr – 3.0 10–20
154
Eu – 6.1 10–15
155
Eu – 6.6 10–16
238
Pu* – 7.5 10–13
239
Pu* – 8.5 10–13
241
Pu* – 2.9 10–14
241
Am* – 4.4 10–12
242
Cm* – 2.2 10–14
243
Cm* – 3.2 10–13
Heysham 2 3
H 1.3 10–15
1.7 10–18
14
C 1.1 10–12
6.7 10–13
32
P – 1.7 10–13
35
S 4.5 10–13
1.5 10–17
41
Ar 8.7 10–17
–
45
Ca – 1.4 10–17
54
Mn – 1.8 10–14
55
Fe – 1.5 10–14
59
Fe – 7.2 10–14
58
Co – 2.6 10–14
60
Co
2.3 10–12
2.3 10–13
63
Ni – 4.2 10–16
65
Zn 1.2 10–12
4.8 10–13
90
Sr* – 1.1 10–15
90
Y – 2.9 10–17
95
Zr* – 6.7 10–16
95
Nb – 1.7 10–16
106
Ru – 7.7 10–14
110m
Ag – 1.8 10–13
124
Sb – 6.6 10–16
125
Sb* – 1.1 10–14
125m
Te – 4.8 10–15
131
I* 7.1 10–13
–
133
Xe
1.8 10–17
–
134
Cs – 1.6 10–14
137
Cs* – 2.1 10–14
144
Ce* – 7.8 10–16
144
Pr – 3.0 10–20
154
Eu – 6.1 10–15
155
Eu – 6.6 10–16
238
Pu* – 7.5 10–13
239
Pu* – 8.5 10–13
241
Pu* – 2.9 10–14
241
Am* – 4.4 10–12
242
Cm* – 2.2 10–14
243
Cm* – 3.2 10–13
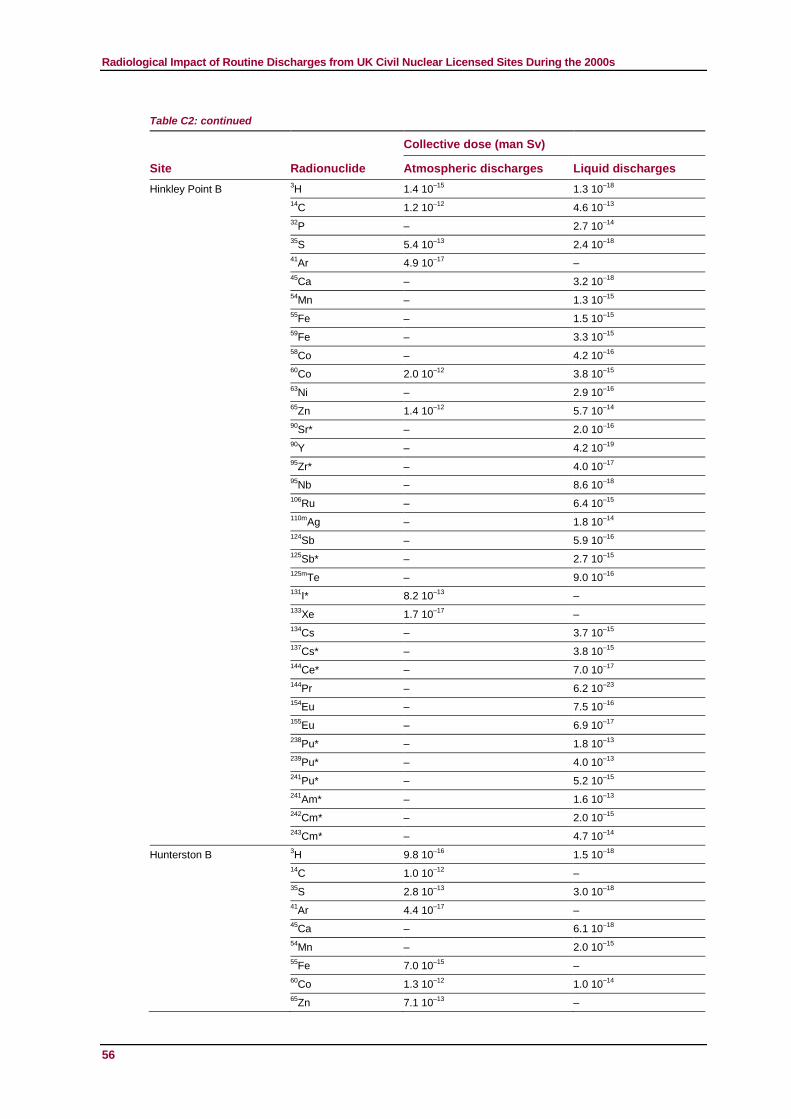
Radiological Impact of Routine Discharges from UK Civil Nuclear Licensed Sites During the 2000s
Table C2: continued
56
Site Radionuclide
Collective dose (man Sv)
Atmospheric discharges Liquid discharges
Hinkley Point B 3
H 1.4 10–15
1.3 10–18
14
C 1.2 10–12
4.6 10–13
32
P – 2.7 10–14
35
S 5.4 10–13
2.4 10–18
41
Ar 4.9 10–17
–
45
Ca – 3.2 10–18
54
Mn – 1.3 10–15
55
Fe – 1.5 10–15
59
Fe – 3.3 10–15
58
Co – 4.2 10–16
60
Co
2.0 10–12
3.8 10–15
63
Ni – 2.9 10–16
65
Zn 1.4 10–12
5.7 10–14
90
Sr* – 2.0 10–16
90
Y – 4.2 10–19
95
Zr* – 4.0 10–17
95
Nb – 8.6 10–18
106
Ru – 6.4 10–15
110m
Ag – 1.8 10–14
124
Sb – 5.9 10–16
125
Sb* – 2.7 10–15
125m
Te – 9.0 10–16
131
I* 8.2 10–13
–
133
Xe
1.7 10–17
–
134
Cs – 3.7 10–15
137
Cs* – 3.8 10–15
144
Ce* – 7.0 10–17
144
Pr – 6.2 10–23
154
Eu – 7.5 10–16
155
Eu – 6.9 10–17
238
Pu* – 1.8 10–13
239
Pu* – 4.0 10–13
241
Pu* – 5.2 10–15
241
Am* – 1.6 10–13
242
Cm* – 2.0 10–15
243
Cm* – 4.7 10–14
Hunterston B 3H 9.8 10
–16 1.5 10
–18
14
C 1.0 10–12
–
35
S 2.8 10–13
3.0 10–18
41
Ar 4.4 10–17
–
45
Ca – 6.1 10–18
54
Mn – 2.0 10–15
55
Fe
7.0 10–15
–
60
Co
1.3 10–12
1.0 10–14
65
Zn 7.1 10–13
–
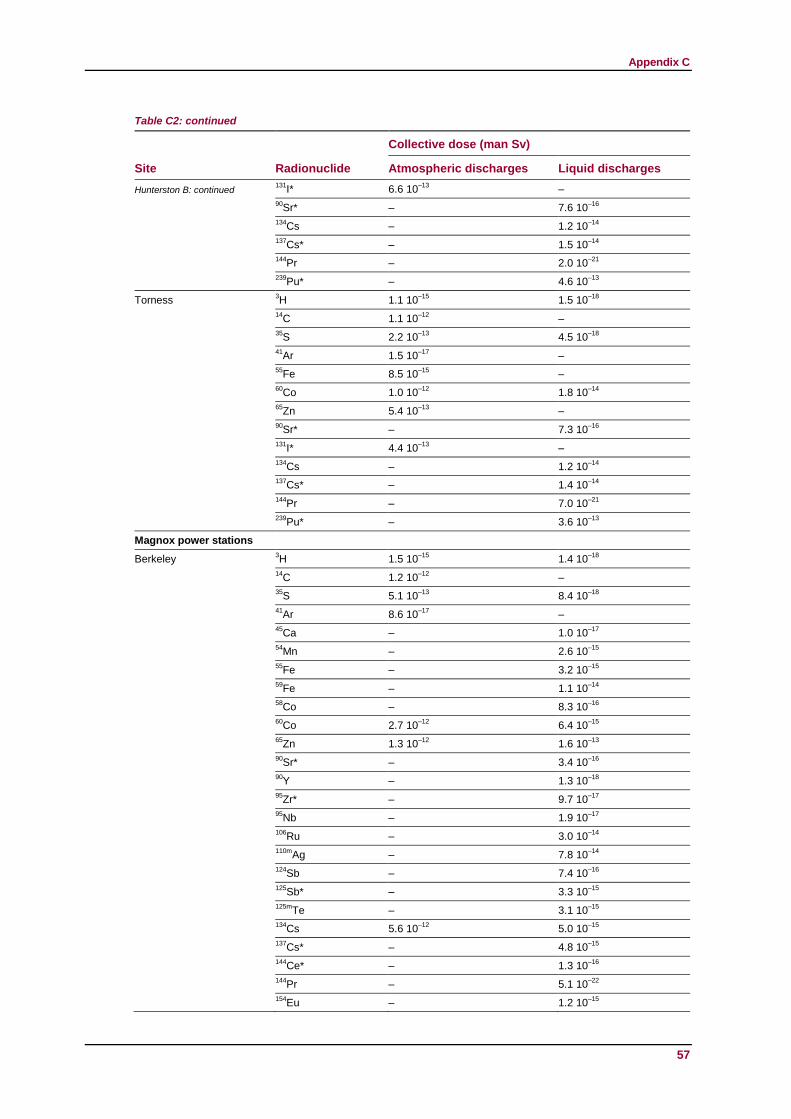
Appendix C
Table C2: continued
57
Site Radionuclide
Collective dose (man Sv)
Atmospheric discharges Liquid discharges
Hunterston B: continued 131
I* 6.6 10–13
–
90
Sr*
– 7.6 10–16
134
Cs – 1.2 10–14
137
Cs* – 1.5 10–14
144
Pr – 2.0 10–21
239
Pu* – 4.6 10–13
Torness 3
H
1.1 10–15
1.5 10–18
14
C
1.1 10–12
–
35
S
2.2 10–13
4.5 10–18
41
Ar
1.5 10–17
–
55
Fe
8.5 10–15
–
60
Co
1.0 10–12
1.8 10–14
65
Zn
5.4 10–13
–
90
Sr* – 7.3 10–16
131
I*
4.4 10–13
–
134
Cs – 1.2 10–14
137
Cs* – 1.4 10–14
144
Pr – 7.0 10–21
239
Pu* – 3.6 10–13
Magnox power stations
Berkeley 3
H 1.5 10–15
1.4 10–18
14
C 1.2 10–12
–
35
S 5.1 10–13
8.4 10–18
41
Ar
8.6 10–17
–
45
Ca – 1.0 10–17
54
Mn – 2.6 10–15
55
Fe – 3.2 10–15
59
Fe – 1.1 10–14
58
Co – 8.3 10–16
60
Co
2.7 10–12
6.4 10–15
65
Zn
1.3 10–12
1.6 10–13
90
Sr* – 3.4 10–16
90
Y – 1.3 10–18
95
Zr* – 9.7 10–17
95
Nb – 1.9 10–17
106
Ru – 3.0 10–14
110m
Ag – 7.8 10–14
124
Sb – 7.4 10–16
125
Sb* – 3.3 10–15
125m
Te – 3.1 10–15
134
Cs 5.6 10–12
5.0 10–15
137
Cs* – 4.8 10–15
144
Ce* – 1.3 10–16
144
Pr – 5.1 10–22
154
Eu – 1.2 10–15
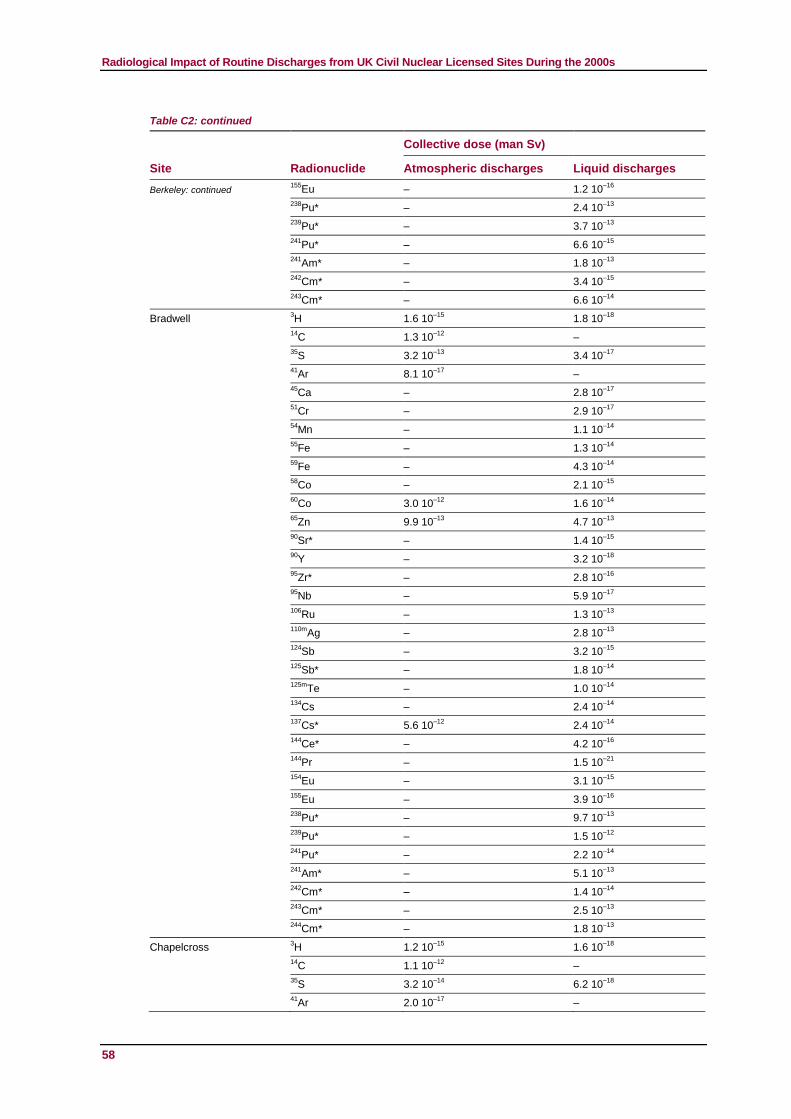
Radiological Impact of Routine Discharges from UK Civil Nuclear Licensed Sites During the 2000s
Table C2: continued
58
Site Radionuclide
Collective dose (man Sv)
Atmospheric discharges Liquid discharges
Berkeley: continued 155
Eu – 1.2 10–16
238
Pu* – 2.4 10–13
239
Pu* – 3.7 10–13
241
Pu* – 6.6 10–15
241
Am* – 1.8 10–13
242
Cm* – 3.4 10–15
243
Cm* – 6.6 10–14
Bradwell 3H 1.6 10
–15 1.8 10
–18
14
C 1.3 10–12
–
35
S 3.2 10–13
3.4 10–17
41
Ar
8.1 10–17
–
45
Ca – 2.8 10–17
51
Cr
– 2.9 10–17
54
Mn – 1.1 10–14
55
Fe – 1.3 10–14
59
Fe – 4.3 10–14
58
Co – 2.1 10–15
60
Co
3.0 10–12
1.6 10–14
65
Zn 9.9 10–13
4.7 10–13
90
Sr* – 1.4 10–15
90
Y – 3.2 10–18
95
Zr* – 2.8 10–16
95
Nb – 5.9 10–17
106
Ru – 1.3 10–13
110m
Ag – 2.8 10–13
124
Sb – 3.2 10–15
125
Sb* – 1.8 10–14
125m
Te – 1.0 10–14
134
Cs – 2.4 10–14
137
Cs*
5.6 10–12
2.4 10–14
144
Ce* – 4.2 10–16
144
Pr
– 1.5 10–21
154
Eu – 3.1 10–15
155
Eu
– 3.9 10–16
238
Pu* – 9.7 10–13
239
Pu* – 1.5 10–12
241
Pu* – 2.2 10–14
241
Am* – 5.1 10–13
242
Cm* – 1.4 10–14
243
Cm* – 2.5 10–13
244
Cm*
– 1.8 10–13
Chapelcross 3
H 1.2 10–15
1.6 10–18
14
C 1.1 10–12
–
35
S 3.2 10–14
6.2 10–18
41
Ar 2.0 10–17
–
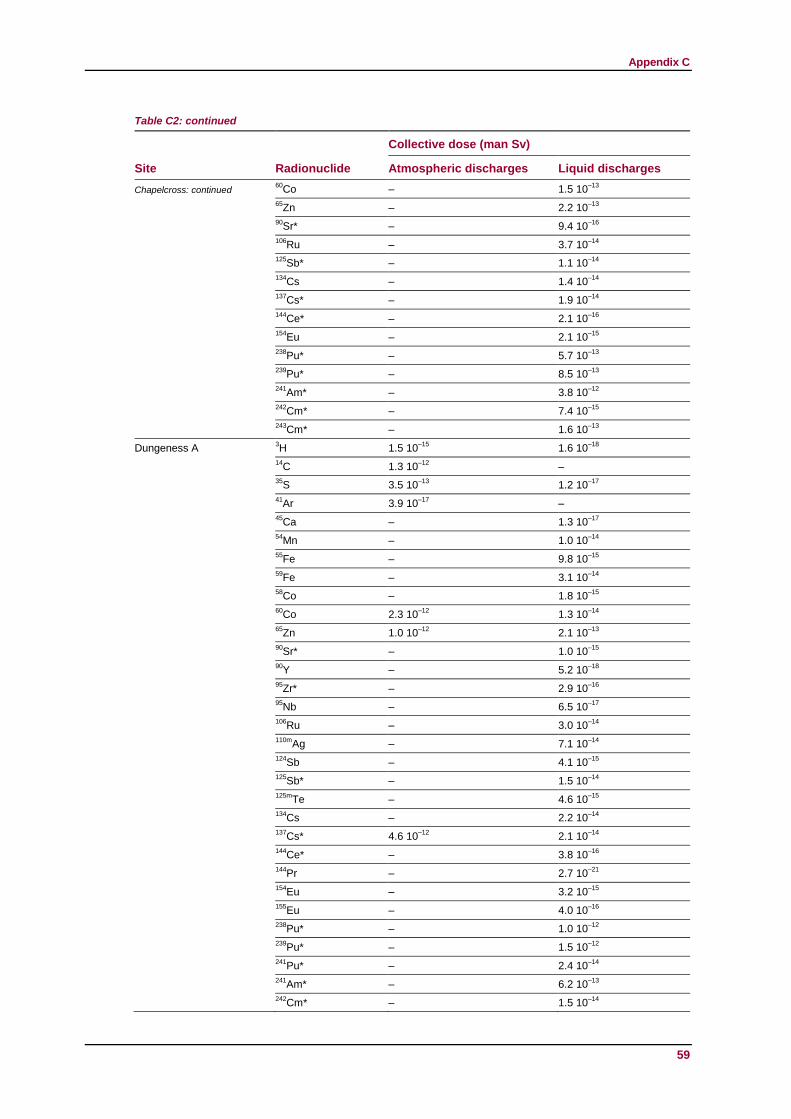
Appendix C
Table C2: continued
59
Site Radionuclide
Collective dose (man Sv)
Atmospheric discharges Liquid discharges
Chapelcross: continued 60
Co – 1.5 10–13
65
Zn
– 2.2 10–13
90
Sr* – 9.4 10–16
106
Ru
– 3.7 10–14
125
Sb* – 1.1 10–14
134
Cs – 1.4 10–14
137
Cs* – 1.9 10–14
144
Ce* – 2.1 10–16
154
Eu – 2.1 10–15
238
Pu* – 5.7 10–13
239
Pu* – 8.5 10–13
241
Am* – 3.8 10–12
242
Cm* – 7.4 10–15
243
Cm* – 1.6 10–13
Dungeness A 3
H 1.5 10–15
1.6 10–18
14
C 1.3 10–12
–
35
S 3.5 10–13
1.2 10–17
41
Ar 3.9 10–17
–
45
Ca – 1.3 10–17
54
Mn – 1.0 10–14
55
Fe – 9.8 10–15
59
Fe – 3.1 10–14
58
Co – 1.8 10–15
60
Co
2.3 10–12
1.3 10–14
65
Zn 1.0 10–12
2.1 10–13
90
Sr* – 1.0 10–15
90
Y – 5.2 10–18
95
Zr* – 2.9 10–16
95
Nb – 6.5 10–17
106
Ru – 3.0 10–14
110m
Ag – 7.1 10–14
124
Sb – 4.1 10–15
125
Sb* – 1.5 10–14
125m
Te – 4.6 10–15
134
Cs – 2.2 10–14
137
Cs*
4.6 10–12
2.1 10–14
144
Ce* – 3.8 10–16
144
Pr – 2.7 10–21
154
Eu – 3.2 10–15
155
Eu – 4.0 10–16
238
Pu* – 1.0 10–12
239
Pu* – 1.5 10–12
241
Pu* – 2.4 10–14
241
Am* – 6.2 10–13
242
Cm* – 1.5 10–14
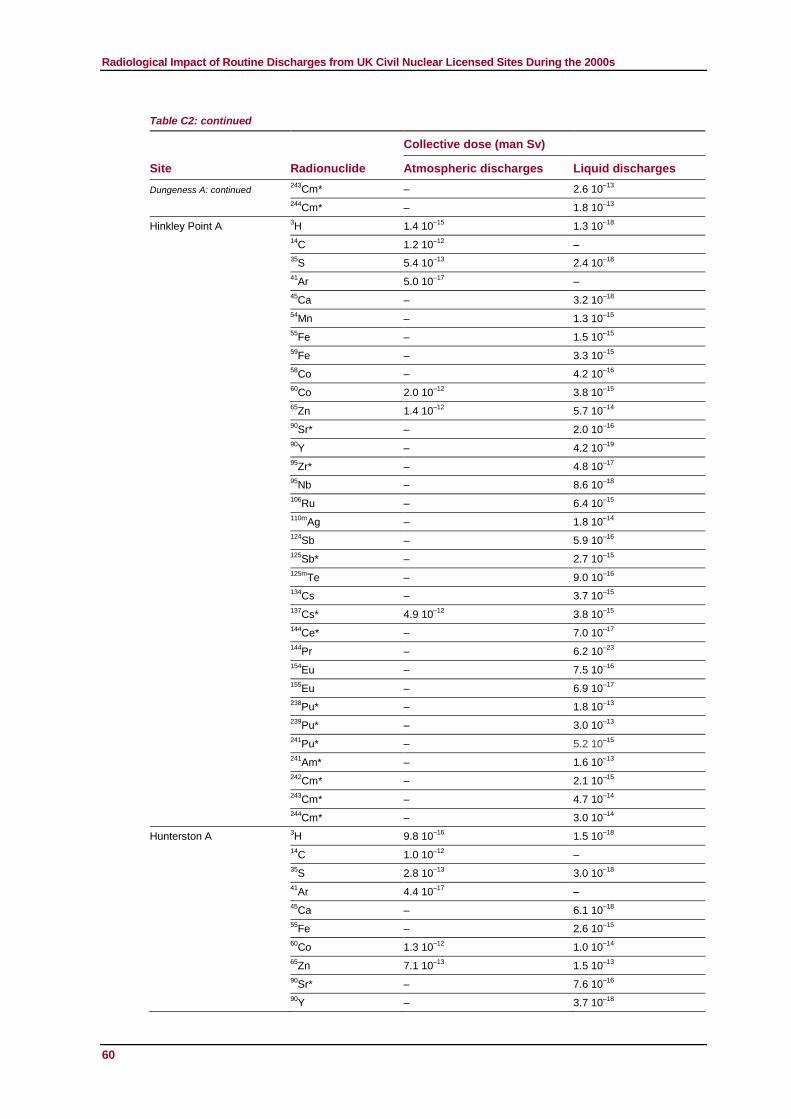
Radiological Impact of Routine Discharges from UK Civil Nuclear Licensed Sites During the 2000s
Table C2: continued
60
Site Radionuclide
Collective dose (man Sv)
Atmospheric discharges Liquid discharges
Dungeness A: continued 243
Cm* – 2.6 10–13
244
Cm*
– 1.8 10–13
Hinkley Point A 3
H 1.4 10–15
1.3 10–18
14
C 1.2 10–12
–
35
S
5.4 10–13
2.4 10–18
41
Ar
5.0 10–17
–
45
Ca – 3.2 10–18
54
Mn – 1.3 10–15
55
Fe – 1.5 10–15
59
Fe – 3.3 10–15
58
Co – 4.2 10–16
60
Co
2.0 10–12
3.8 10–15
65
Zn 1.4 10–12
5.7 10–14
90
Sr* – 2.0 10–16
90
Y – 4.2 10–19
95
Zr* – 4.8 10–17
95
Nb – 8.6 10–18
106
Ru – 6.4 10–15
110m
Ag – 1.8 10–14
124
Sb – 5.9 10–16
125
Sb* – 2.7 10–15
125m
Te – 9.0 10–16
134
Cs – 3.7 10–15
137
Cs*
4.9 10–12
3.8 10–15
144
Ce* – 7.0 10–17
144
Pr – 6.2 10–23
154
Eu – 7.5 10–16
155
Eu – 6.9 10–17
238
Pu* – 1.8 10–13
239
Pu* – 3.0 10–13
241
Pu* – 5.2 10–15
241
Am* – 1.6 10–13
242
Cm* – 2.1 10–15
243
Cm* – 4.7 10–14
244
Cm*
– 3.0 10–14
Hunterston A 3
H 9.8 10–16
1.5 10–18
14
C 1.0 10–12
–
35
S
2.8 10–13
3.0 10–18
41
Ar
4.4 10–17
–
45
Ca – 6.1 10–18
55
Fe – 2.6 10–15
60
Co
1.3 10–12
1.0 10–14
65
Zn
7.1 10–13
1.5 10–13
90
Sr* – 7.6 10–16
90
Y – 3.7 10–18
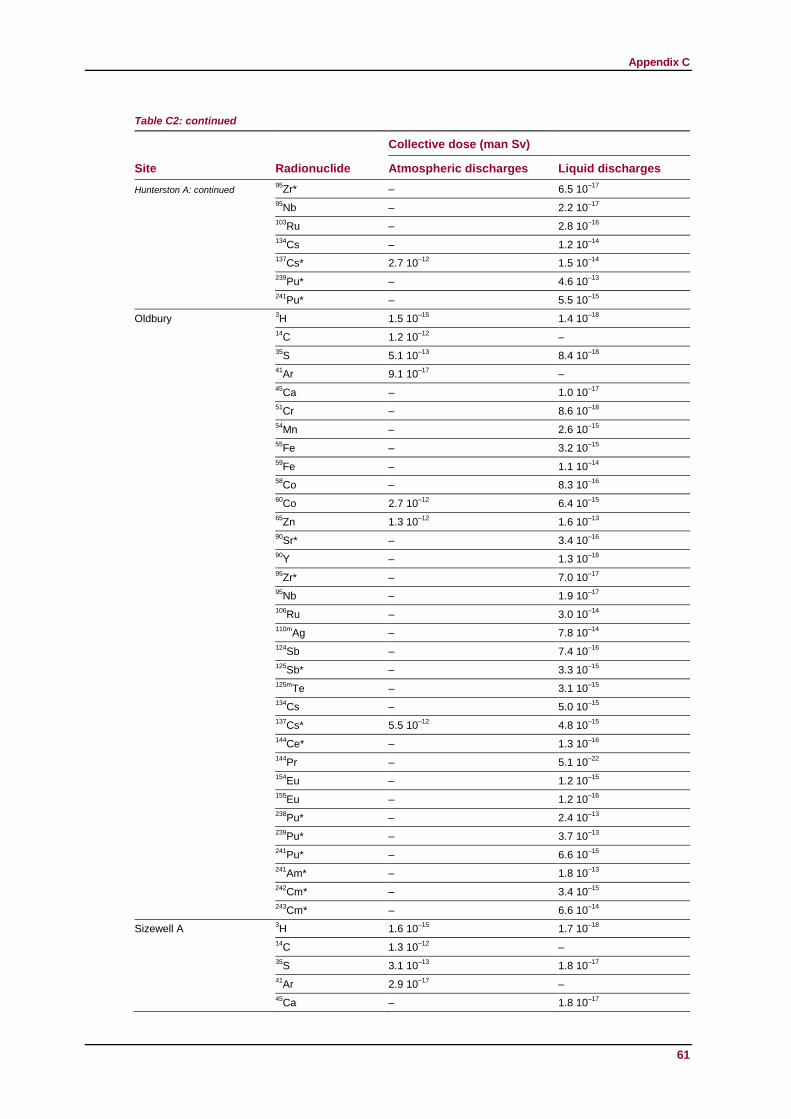
Appendix C
Table C2: continued
61
Site Radionuclide
Collective dose (man Sv)
Atmospheric discharges Liquid discharges
Hunterston A: continued 95
Zr* – 6.5 10–17
95
Nb – 2.2 10–17
103
Ru – 2.8 10–16
134
Cs – 1.2 10–14
137
Cs*
2.7 10–12
1.5 10–14
239
Pu* – 4.6 10–13
241
Pu* – 5.5 10–15
Oldbury 3
H 1.5 10–15
1.4 10–18
14
C 1.2 10–12
–
35
S 5.1 10–13
8.4 10–18
41
Ar 9.1 10–17
–
45
Ca – 1.0 10–17
51
Cr – 8.6 10–18
54
Mn – 2.6 10–15
55
Fe – 3.2 10–15
59
Fe – 1.1 10–14
58
Co – 8.3 10–16
60
Co
2.7 10–12
6.4 10–15
65
Zn
1.3 10–12
1.6 10–13
90
Sr* – 3.4 10–16
90
Y – 1.3 10–18
95
Zr* – 7.0 10–17
95
Nb – 1.9 10–17
106
Ru – 3.0 10–14
110m
Ag – 7.8 10–14
124
Sb – 7.4 10–16
125
Sb* – 3.3 10–15
125m
Te – 3.1 10–15
134
Cs – 5.0 10–15
137
Cs*
5.5 10–12
4.8 10–15
144
Ce* – 1.3 10–16
144
Pr – 5.1 10–22
154
Eu – 1.2 10–15
155
Eu – 1.2 10–16
238
Pu* – 2.4 10–13
239
Pu* – 3.7 10–13
241
Pu* – 6.6 10–15
241
Am* – 1.8 10–13
242
Cm* – 3.4 10–15
243
Cm* – 6.6 10–14
Sizewell A 3
H 1.6 10–15
1.7 10–18
14
C 1.3 10–12
–
35
S 3.1 10–13
1.8 10–17
41
Ar 2.9 10–17
–
45
Ca – 1.8 10–17

Radiological Impact of Routine Discharges from UK Civil Nuclear Licensed Sites During the 2000s
Table C2: continued
62
Site Radionuclide
Collective dose (man Sv)
Atmospheric discharges Liquid discharges
Sizewell A: continued 54
Mn
– 1.0 10–14
55
Fe – 1.1 10–14
59
Fe – 4.0 10–14
58
Co – 2.0 10–15
60
Co
1.9 10–12
1.5 10–14
65
Zn
9.3 10–13
3.9 10–13
90
Sr* – 1.2 10–15
90
Y – 4.7 10–18
95
Zr* – 2.5 10–16
95
Nb – 6.0 10–17
106
Ru – 6.3 10–14
110m
Ag – 1.5 10–13
124
Sb – 3.0 10–15
125
Sb* – 1.6 10–14
125m
Te – 6.2 10–15
134
Cs – 2.2 10–14
137
Cs*
4.8 10–12
2.2 10–14
144
Ce* – 4.0 10–16
144
Pr – 2.5 10–21
154
Eu – 3.0 10–15
155
Eu – 3.7 10–16
238
Pu* – 9.3 10–13
239
Pu* – 1.4 10–12
241
Pu* – 2.1 10–14
241
Am* – 5.0 10–13
242
Cm* – 1.3 10–14
243
Cm* – 2.4 10–13
244
Cm*
– 1.7 10–13
Trawsfynydd 3
H 1.2 10–15
7.7 10–19
14
C 1.1 10–12
–
35
S
3.8 10–13
–
41
Ar 1.9 10–17
–
65
Zn 9.3 10–13
–
60
Co
1.1 10–12
1.1 10–14
90
Sr – 5.9 10–14
134
Cs – 6.2 10–13
137
Cs*
3.4 10–12
4.8 10–13
Wylfa 3H 1.1 10
–15 1.6 10
–18
14
C 1.1 10–12
–
35
S 3.4 10–13
6.2 10–18
41
Ar 1.3 10–17
–
45
Ca – 1.0 10–17
54
Mn – 6.7 10–15
55
Fe – 7.8 10–15
59
Fe – 2.8 10–14

Appendix C
Table C2: continued
63
Site Radionuclide
Collective dose (man Sv)
Atmospheric discharges Liquid discharges
Wylfa: continued 58
Co – 1.5 10–14
60
Co
1.1 10–12
1.8 10–13
65
Zn
8.3 10–13
3.6 10–13
90
Sr* – 9.7 10–16
90
Y – 9.3 10–18
95
Zr* – 1.9 10–16
95
Nb – 5.3 10–17
106
Ru – 3.1 10–14
110m
Ag – 8.6 10–14
124
Sb – 5.5 10–16
125
Sb* – 1.1 10–14
125m
Te – 2.5 10–15
134
Cs – 1.3 10–14
137
Cs*
3.0 10–12
1.9 10–14
144
Ce* – 3.6 10–16
144
Pr – 6.0 10–21
154
Eu – 2.1 10–15
155
Eu – 2.6 10–16
238
Pu* – 4.9 10–13
239
Pu* – 7.0 10–13
241
Pu* – 4.9 10–14
241
Am* – 3.1 10–12
242
Cm* – 8.4 10–15
243
Cm* – 1.4 10–13
PWR power station
Sizewell B 3
H 1.6 10–15
1.7 10–18
14
C 1.3 10–12
–
35
S 3.1 10–13
–
41
Ar 2.9 10–17
–
54
Mn – 1.0 10–14
55
Fe – 1.1 10–14
58
Co – 2.0 10–15
60
Co
1.9 10–12
1.5 10–14
63
Ni – 1.2 10–15
65
Zn 9.3 10–13
–
110m
Ag – 1.5 10–13
131
I* 4.0 10–13
–
133
Xe
2.0 10–17
–
134
Cs – 2.2 10–14
137
Cs*
4.8 10–12
2.2 10–14
239
Pu* – 1.4 10–12
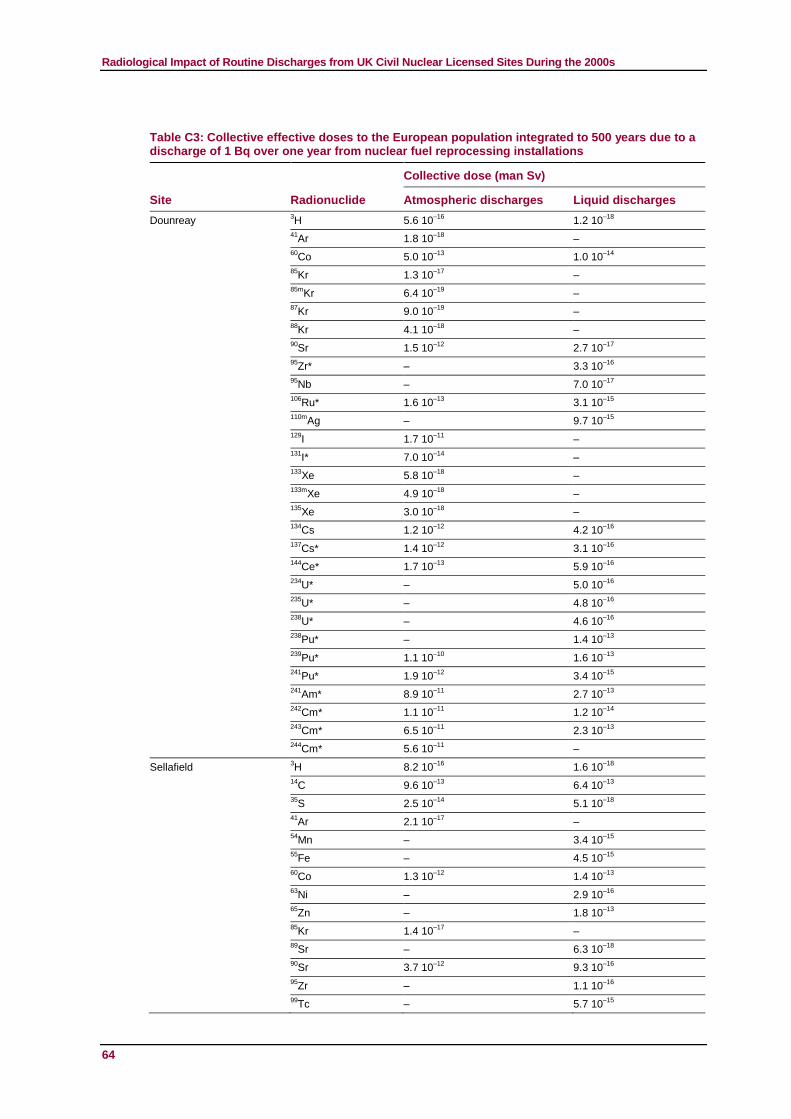
Radiological Impact of Routine Discharges from UK Civil Nuclear Licensed Sites During the 2000s
64
Table C3: Collective effective doses to the European population integrated to 500 years due to a discharge of 1 Bq over one year from nuclear fuel reprocessing installations
Site Radionuclide
Collective dose (man Sv)
Atmospheric discharges Liquid discharges
Dounreay 3H 5.6 10
–16 1.2 10
–18
41
Ar
1.8 10–18
–
60
Co 5.0 10–13
1.0 10–14
85
Kr 1.3 10–17
–
85m
Kr 6.4 10–19
–
87
Kr 9.0 10–19
–
88
Kr 4.1 10–18
–
90
Sr 1.5 10–12
2.7 10–17
95
Zr* – 3.3 10–16
95
Nb – 7.0 10–17
106
Ru* 1.6 10–13
3.1 10–15
110m
Ag – 9.7 10–15
129
I 1.7 10–11
–
131
I* 7.0 10–14
–
133
Xe 5.8 10–18
–
133m
Xe 4.9 10–18
–
135
Xe 3.0 10–18
–
134
Cs 1.2 10–12
4.2 10–16
137
Cs* 1.4 10–12
3.1 10–16
144
Ce* 1.7 10–13
5.9 10–16
234
U* – 5.0 10–16
235
U* – 4.8 10–16
238
U* – 4.6 10–16
238
Pu* – 1.4 10–13
239
Pu* 1.1 10–10
1.6 10–13
241
Pu* 1.9 10–12
3.4 10–15
241
Am* 8.9 10–11
2.7 10–13
242
Cm* 1.1 10–11
1.2 10–14
243
Cm* 6.5 10–11
2.3 10–13
244
Cm* 5.6 10–11
–
Sellafield 3
H 8.2 10–16
1.6 10–18
14
C 9.6 10–13
6.4 10–13
35
S 2.5 10–14
5.1 10–18
41
Ar 2.1 10–17
–
54
Mn – 3.4 10–15
55
Fe – 4.5 10–15
60
Co 1.3 10–12
1.4 10–13
63
Ni – 2.9 10–16
65
Zn – 1.8 10–13
85
Kr 1.4 10–17
–
89
Sr – 6.3 10–18
90
Sr 3.7 10–12
9.3 10–16
95
Zr – 1.1 10–16
99
Tc – 5.7 10–15
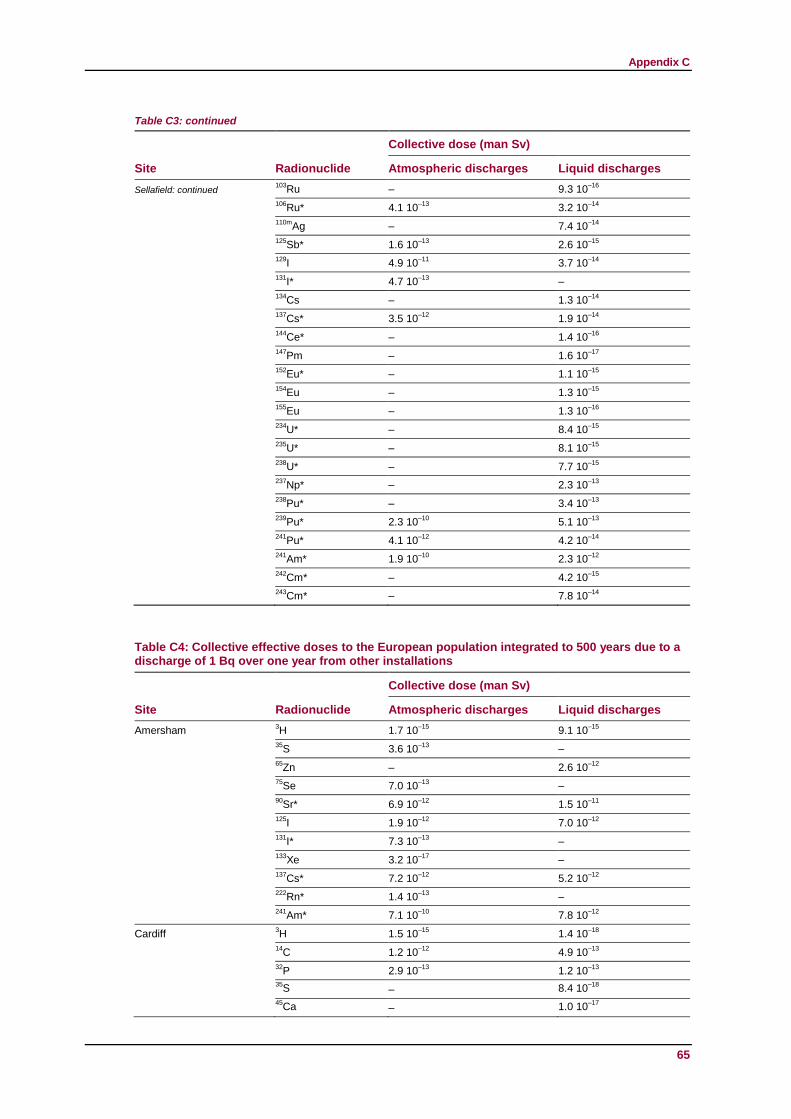
Appendix C
Table C3: continued
65
Site Radionuclide
Collective dose (man Sv)
Atmospheric discharges Liquid discharges
Sellafield: continued 103
Ru – 9.3 10–16
106
Ru* 4.1 10–13
3.2 10–14
110m
Ag – 7.4 10–14
125
Sb* 1.6 10–13
2.6 10–15
129
I 4.9 10–11
3.7 10–14
131
I* 4.7 10–13
–
134
Cs – 1.3 10–14
137
Cs* 3.5 10–12
1.9 10–14
144
Ce* – 1.4 10–16
147
Pm – 1.6 10–17
152
Eu* – 1.1 10–15
154
Eu – 1.3 10–15
155
Eu – 1.3 10–16
234
U* – 8.4 10–15
235
U* – 8.1 10–15
238
U* – 7.7 10–15
237
Np* – 2.3 10–13
238
Pu* – 3.4 10–13
239
Pu* 2.3 10–10
5.1 10–13
241
Pu* 4.1 10–12
4.2 10–14
241
Am* 1.9 10–10
2.3 10–12
242
Cm* – 4.2 10–15
243
Cm* – 7.8 10–14
Table C4: Collective effective doses to the European population integrated to 500 years due to a discharge of 1 Bq over one year from other installations
Site Radionuclide
Collective dose (man Sv)
Atmospheric discharges Liquid discharges
Amersham 3
H
1.7 10–15
9.1 10–15
35
S 3.6 10–13
–
65
Zn – 2.6 10–12
75
Se 7.0 10–13
–
90
Sr* 6.9 10–12
1.5 10–11
125
I 1.9 10–12
7.0 10–12
131
I* 7.3 10–13
–
133
Xe
3.2 10–17
–
137
Cs* 7.2 10–12
5.2 10–12
222
Rn* 1.4 10–13
–
241
Am* 7.1 10–10
7.8 10–12
Cardiff 3H
1.5 10
–15 1.4 10
–18
14
C 1.2 10–12
4.9 10–13
32
P 2.9 10–13
1.2 10–13
35
S – 8.4 10–18
45
Ca – 1.0 10–17
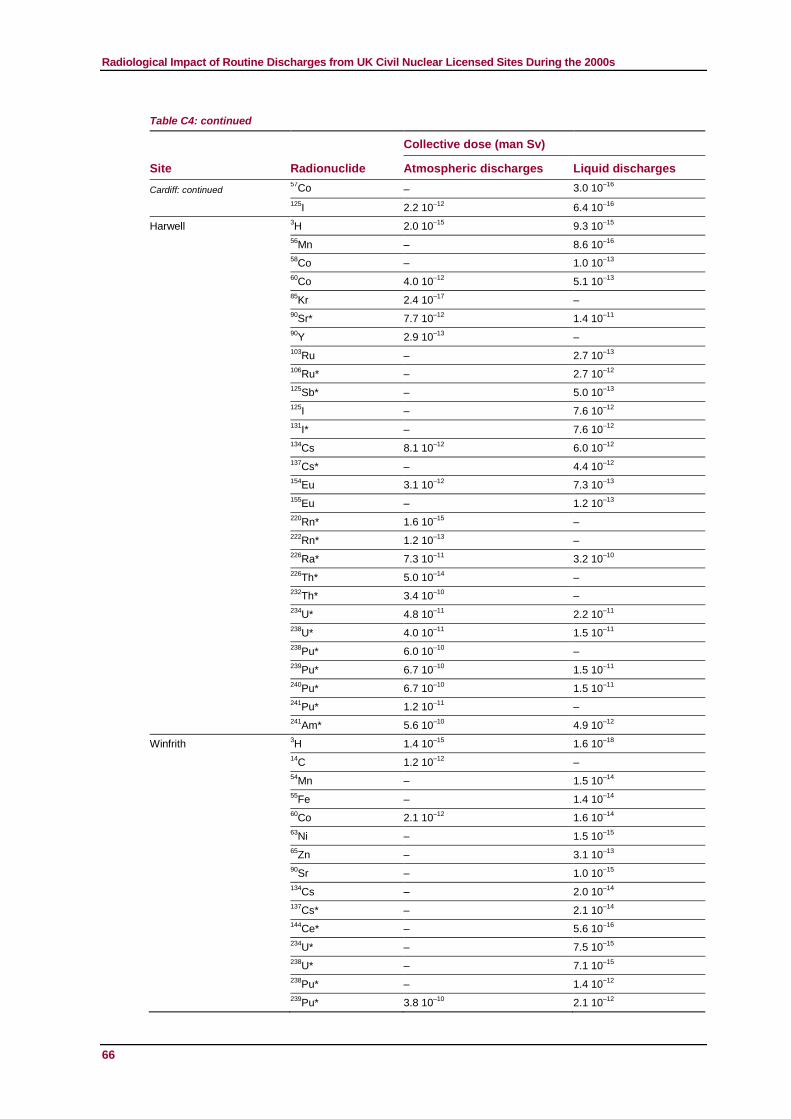
Radiological Impact of Routine Discharges from UK Civil Nuclear Licensed Sites During the 2000s
Table C4: continued
66
Site Radionuclide
Collective dose (man Sv)
Atmospheric discharges Liquid discharges
Cardiff: continued 57
Co – 3.0 10–16
125
I 2.2 10–12
6.4 10–16
Harwell 3H 2.0 10
–15 9.3 10
–15
56
Mn – 8.6 10–16
58
Co – 1.0 10–13
60
Co 4.0 10–12
5.1 10–13
85
Kr 2.4 10–17
–
90
Sr* 7.7 10–12
1.4 10–11
90
Y
2.9 10–13
–
103
Ru – 2.7 10–13
106
Ru* – 2.7 10–12
125
Sb* – 5.0 10–13
125
I – 7.6 10–12
131
I* – 7.6 10–12
134
Cs 8.1 10–12
6.0 10–12
137
Cs* – 4.4 10–12
154
Eu 3.1 10–12
7.3 10–13
155
Eu – 1.2 10–13
220
Rn*
1.6 10–15
–
222
Rn*
1.2 10–13
–
226
Ra* 7.3 10–11
3.2 10–10
226
Th* 5.0 10–14
–
232
Th* 3.4 10–10
–
234
U* 4.8 10–11
2.2 10–11
238
U* 4.0 10–11
1.5 10–11
238
Pu* 6.0 10–10
–
239
Pu* 6.7 10–10
1.5 10–11
240
Pu* 6.7 10–10
1.5 10–11
241
Pu* 1.2 10–11
–
241
Am* 5.6 10–10
4.9 10–12
Winfrith 3
H 1.4 10–15
1.6 10–18
14
C
1.2 10–12
–
54
Mn – 1.5 10–14
55
Fe – 1.4 10–14
60
Co 2.1 10–12
1.6 10–14
63
Ni – 1.5 10–15
65
Zn – 3.1 10–13
90
Sr – 1.0 10–15
134
Cs – 2.0 10–14
137
Cs* – 2.1 10–14
144
Ce* – 5.6 10–16
234
U* – 7.5 10–15
238
U* – 7.1 10–15
238
Pu* – 1.4 10–12
239
Pu* 3.8 10–10
2.1 10–12
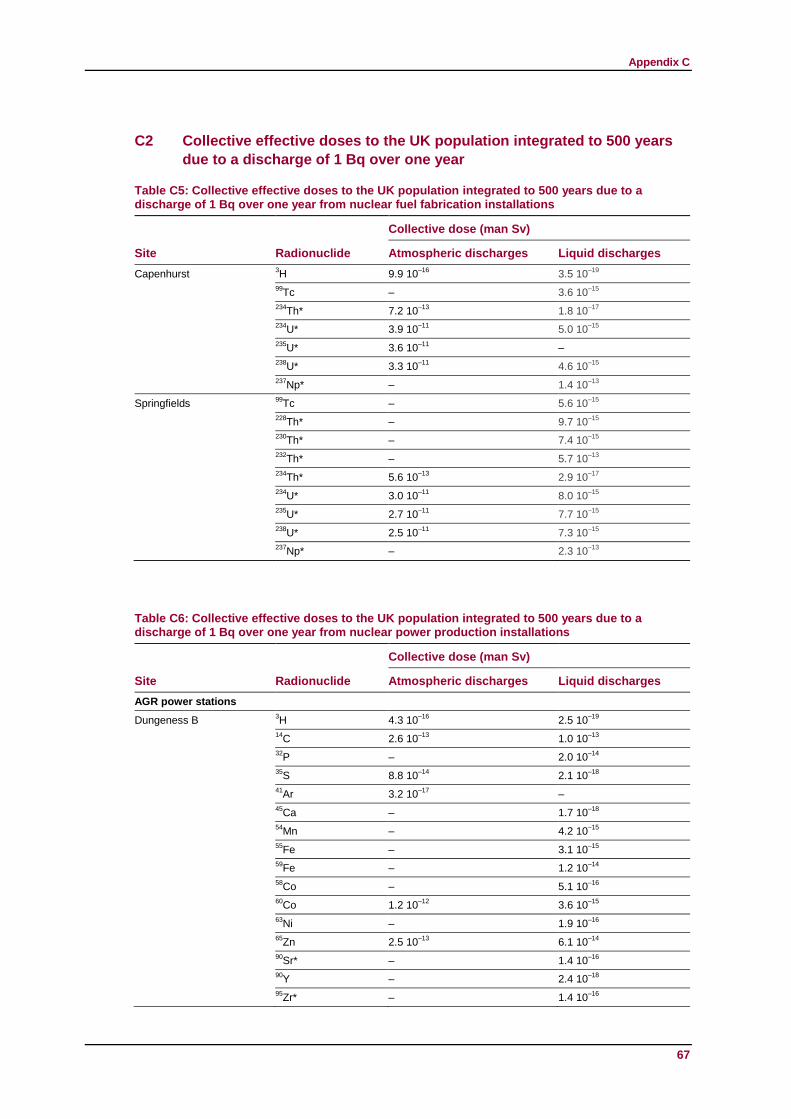
Appendix C
67
C2 Collective effective doses to the UK population integrated to 500 years
due to a discharge of 1 Bq over one year
Table C5: Collective effective doses to the UK population integrated to 500 years due to a discharge of 1 Bq over one year from nuclear fuel fabrication installations
Site Radionuclide
Collective dose (man Sv)
Atmospheric discharges Liquid discharges
Capenhurst 3H 9.9 10
–16 3.5 10
–19
99
Tc – 3.6 10–15
234
Th* 7.2 10–13
1.8 10–17
234
U* 3.9 10–11
5.0 10–15
235
U* 3.6 10–11
–
238
U* 3.3 10–11
4.6 10–15
237
Np* – 1.4 10–13
Springfields 99
Tc – 5.6 10–15
228
Th* – 9.7 10–15
230
Th* – 7.4 10–15
232
Th* – 5.7 10–13
234
Th* 5.6 10–13
2.9 10–17
234
U* 3.0 10–11
8.0 10–15
235
U* 2.7 10–11
7.7 10–15
238
U* 2.5 10–11
7.3 10–15
237
Np* – 2.3 10–13
Table C6: Collective effective doses to the UK population integrated to 500 years due to a discharge of 1 Bq over one year from nuclear power production installations
Site Radionuclide
Collective dose (man Sv)
Atmospheric discharges Liquid discharges
AGR power stations
Dungeness B 3
H 4.3 10–16
2.5 10–19
14
C 2.6 10–13
1.0 10–13
32
P – 2.0 10–14
35
S 8.8 10–14
2.1 10–18
41
Ar 3.2 10–17
–
45
Ca – 1.7 10–18
54
Mn – 4.2 10–15
55
Fe – 3.1 10–15
59
Fe – 1.2 10–14
58
Co – 5.1 10–16
60
Co 1.2 10–12
3.6 10–15
63
Ni – 1.9 10–16
65
Zn 2.5 10–13
6.1 10–14
90
Sr* – 1.4 10–16
90
Y – 2.4 10–18
95
Zr* – 1.4 10–16
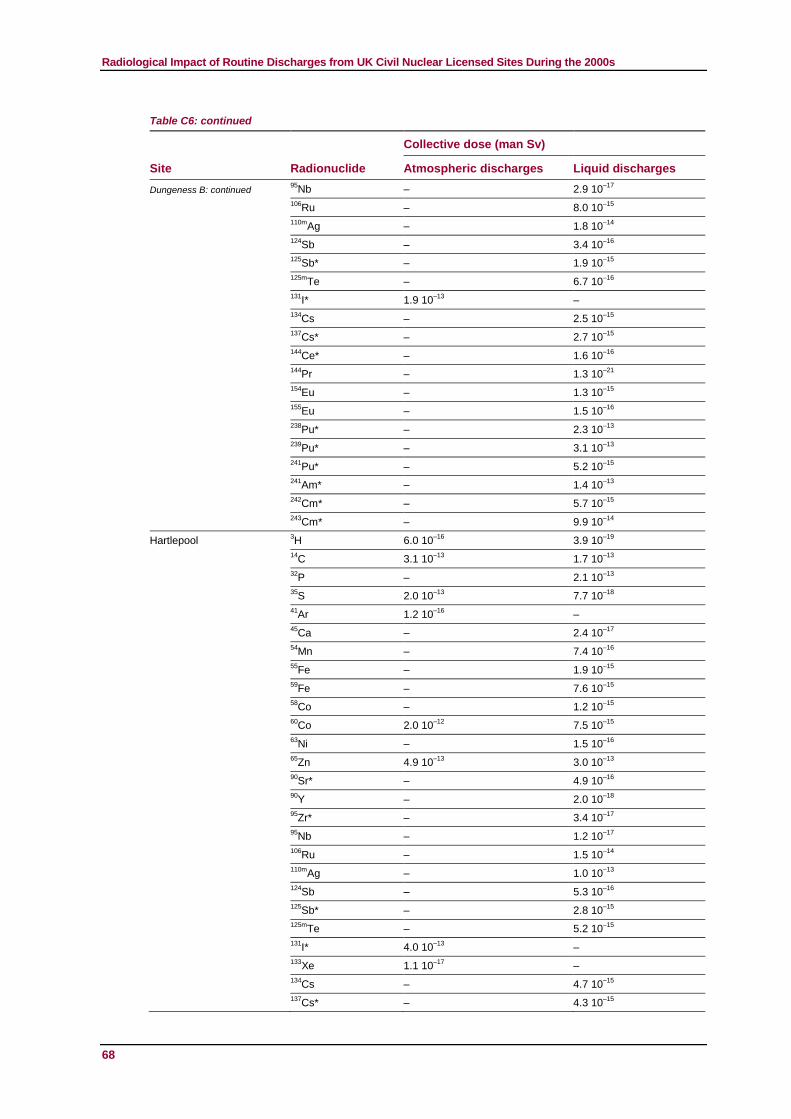
Radiological Impact of Routine Discharges from UK Civil Nuclear Licensed Sites During the 2000s
Table C6: continued
68
Site Radionuclide
Collective dose (man Sv)
Atmospheric discharges Liquid discharges
Dungeness B: continued 95
Nb – 2.9 10–17
106
Ru – 8.0 10–15
110m
Ag – 1.8 10–14
124
Sb – 3.4 10–16
125
Sb* – 1.9 10–15
125m
Te – 6.7 10–16
131
I* 1.9 10–13
–
134
Cs – 2.5 10–15
137
Cs* – 2.7 10–15
144
Ce* – 1.6 10–16
144
Pr – 1.3 10–21
154
Eu – 1.3 10–15
155
Eu – 1.5 10–16
238
Pu* – 2.3 10–13
239
Pu* – 3.1 10–13
241
Pu* – 5.2 10–15
241
Am* – 1.4 10–13
242
Cm* – 5.7 10–15
243
Cm* – 9.9 10–14
Hartlepool 3
H 6.0 10–16
3.9 10–19
14
C 3.1 10–13
1.7 10–13
32
P – 2.1 10–13
35
S 2.0 10–13
7.7 10–18
41
Ar 1.2 10–16
–
45
Ca – 2.4 10–17
54
Mn – 7.4 10–16
55
Fe – 1.9 10–15
59
Fe – 7.6 10–15
58
Co – 1.2 10–15
60
Co 2.0 10–12
7.5 10–15
63
Ni – 1.5 10–16
65
Zn 4.9 10–13
3.0 10–13
90
Sr* – 4.9 10–16
90
Y – 2.0 10–18
95
Zr* – 3.4 10–17
95
Nb – 1.2 10–17
106
Ru – 1.5 10–14
110m
Ag – 1.0 10–13
124
Sb – 5.3 10–16
125
Sb* – 2.8 10–15
125m
Te – 5.2 10–15
131
I* 4.0 10–13
–
133
Xe
1.1 10–17
–
134
Cs – 4.7 10–15
137
Cs* – 4.3 10–15
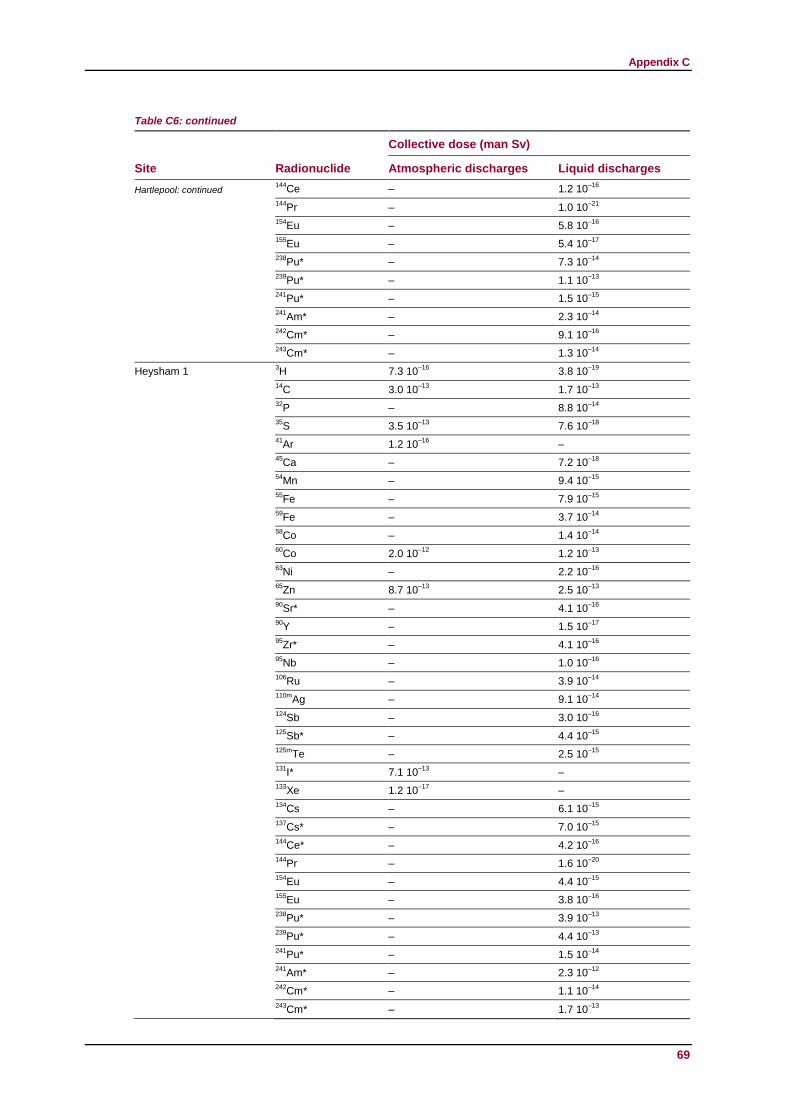
Appendix C
Table C6: continued
69
Site Radionuclide
Collective dose (man Sv)
Atmospheric discharges Liquid discharges
Hartlepool: continued 144
Ce – 1.2 10–16
144
Pr – 1.0 10–21
154
Eu – 5.8 10–16
155
Eu – 5.4 10–17
238
Pu* – 7.3 10–14
239
Pu* – 1.1 10–13
241
Pu* – 1.5 10–15
241
Am* – 2.3 10–14
242
Cm* – 9.1 10–16
243
Cm* – 1.3 10–14
Heysham 1 3
H 7.3 10–16
3.8 10–19
14
C 3.0 10–13
1.7 10–13
32
P – 8.8 10–14
35
S 3.5 10–13
7.6 10–18
41
Ar 1.2 10–16
–
45
Ca – 7.2 10–18
54
Mn – 9.4 10–15
55
Fe – 7.9 10–15
59
Fe – 3.7 10–14
58
Co – 1.4 10–14
60
Co 2.0 10–12
1.2 10–13
63
Ni – 2.2 10–16
65
Zn 8.7 10–13
2.5 10–13
90
Sr* – 4.1 10–16
90
Y – 1.5 10–17
95
Zr* – 4.1 10–16
95
Nb – 1.0 10–16
106
Ru – 3.9 10–14
110m
Ag – 9.1 10–14
124
Sb – 3.0 10–16
125
Sb* – 4.4 10–15
125m
Te – 2.5 10–15
131
I* 7.1 10–13
–
133
Xe
1.2 10–17
–
134
Cs – 6.1 10–15
137
Cs* – 7.0 10–15
144
Ce* – 4.2 10–16
144
Pr – 1.6 10–20
154
Eu – 4.4 10–15
155
Eu – 3.8 10–16
238
Pu* – 3.9 10–13
239
Pu* – 4.4 10–13
241
Pu* – 1.5 10–14
241
Am* – 2.3 10–12
242
Cm* – 1.1 10–14
243
Cm* – 1.7 10–13
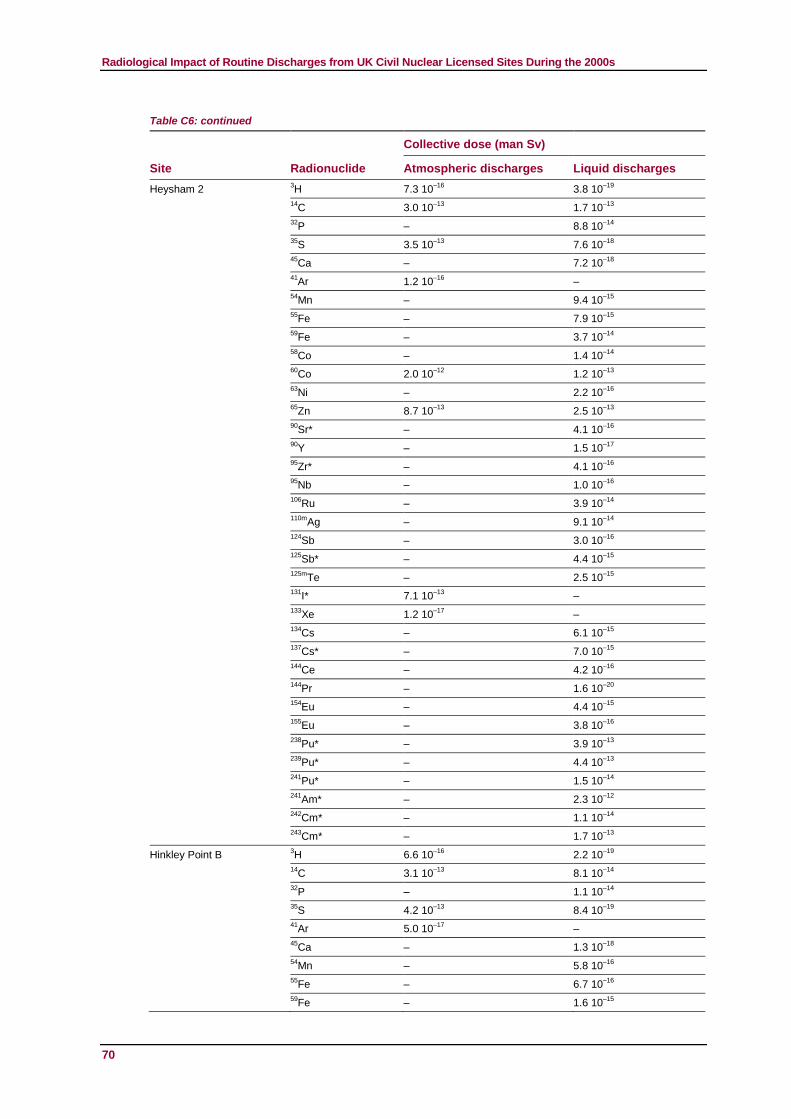
Radiological Impact of Routine Discharges from UK Civil Nuclear Licensed Sites During the 2000s
Table C6: continued
70
Site Radionuclide
Collective dose (man Sv)
Atmospheric discharges Liquid discharges
Heysham 2 3
H 7.3 10–16
3.8 10–19
14
C 3.0 10–13
1.7 10–13
32
P – 8.8 10–14
35
S 3.5 10–13
7.6 10–18
45
Ca – 7.2 10–18
41
Ar 1.2 10–16
–
54
Mn – 9.4 10–15
55
Fe – 7.9 10–15
59
Fe – 3.7 10–14
58
Co – 1.4 10–14
60
Co 2.0 10–12
1.2 10–13
63
Ni
– 2.2 10–16
65
Zn 8.7 10–13
2.5 10–13
90
Sr* – 4.1 10–16
90
Y – 1.5 10–17
95
Zr* – 4.1 10–16
95
Nb – 1.0 10–16
106
Ru – 3.9 10–14
110m
Ag – 9.1 10–14
124
Sb – 3.0 10–16
125
Sb* – 4.4 10–15
125m
Te – 2.5 10–15
131
I* 7.1 10–13
–
133
Xe
1.2 10–17
–
134
Cs – 6.1 10–15
137
Cs* – 7.0 10–15
144
Ce – 4.2 10–16
144
Pr – 1.6 10–20
154
Eu – 4.4 10–15
155
Eu – 3.8 10–16
238
Pu* – 3.9 10–13
239
Pu* – 4.4 10–13
241
Pu* – 1.5 10–14
241
Am* – 2.3 10–12
242
Cm* – 1.1 10–14
243
Cm* – 1.7 10–13
Hinkley Point B 3
H 6.6 10–16
2.2 10–19
14
C 3.1 10–13
8.1 10–14
32
P – 1.1 10–14
35
S 4.2 10–13
8.4 10–19
41
Ar 5.0 10–17
–
45
Ca – 1.3 10–18
54
Mn – 5.8 10–16
55
Fe – 6.7 10–16
59
Fe – 1.6 10–15

Appendix C
Table C6: continued
71
Site Radionuclide
Collective dose (man Sv)
Atmospheric discharges Liquid discharges
Hinkley Point B: continued 58
Co – 2.1 10–16
60
Co 1.4 10–12
2.0 10–15
63
Ni – 7.9 10–17
65
Zn 1.1 10–12
3.1 10–14
90
Sr* – 5.4 10–17
90
Y – 2.3 10–19
95
Zr* – 2.2 10–17
95
Nb – 4.7 10–18
106
Ru – 2.8 10–15
110m
Ag – 8.5 10–15
124
Sb – 1.3 10–16
125
Sb* – 6.4 10–16
125m
Te – 3.3 10–16
131
I* 8.1 10–13
–
133
Xe
9.2 10–18
–
134
Cs – 8.6 10–16
137
Cs* – 8.3 10–16
144
Ce* – 3.6 10–17
144
Pr – 3.5 10–23
154
Eu – 4.9 10–16
155
Eu – 3.4 10–17
238
Pu* – 6.5 10–14
239
Pu* – 9.9 10–14
241
Pu* – 2.0 10–15
241
Am* – 6.5 10–14
242
Cm* – 8.7 10–16
243
Cm* – 2.1 10–14
Hunterston B 3
H 4.4 10–16
2.7 10–19
14
C 2.3 10–13
–
35
S 2.1 10–13
1.2 10–18
41
Ar 4.0 10–17
–
45
Ca – 2.7 10–18
54
Mn – 8.5 10–16
55
Fe
4.3 10–15
–
60
Co
9.3 10–13
5.7 10–15
65
Zn 5.0 10–13
–
90
Sr* – 2.1 10–16
90
Y – 2.0 10–18
131
I* 6.1 10–13
–
134
Cs – 3.4 10–15
137
Cs* – 3.9 10–15
144
Pr – 1.1 10–21
239
Pu* – 1.6 10–13
Torness 3
H 4.7 10–16
2.4 10–19
14
C 2.8 10–13
–

Radiological Impact of Routine Discharges from UK Civil Nuclear Licensed Sites During the 2000s
Table C6: continued
72
Site Radionuclide
Collective dose (man Sv)
Atmospheric discharges Liquid discharges
Torness: continued 35
S 1.3 10–13
8.6 10–19
41
Ar 1.4 10–17
–
55
Fe
5.4 10–15
–
60
Co
6.4 10–13
4.8 10–15
65
Zn 2.7 10–13
–
90
Sr* – 1.3 10–16
131
I* 3.1 10–13
–
134
Cs – 2.0 10–15
137
Cs* – 2.3 10–15
144
Pr – 1.9 10–21
239
Pu* – 8.6 10–14
Magnox power stations
Berkeley 3H 7.2 10
–16 2.6 10
–19
14
C 3.6 10–13
–
35
S 3.7 10–13
3.9 10–18
41
Ar
8.1 10–17
–
45
Ca – 5.8 10–18
54
Mn – 1.2 10–15
55
Fe – 1.5 10–15
59
Fe – 5.3 10–15
58
Co – 4.6 10–16
60
Co 2.1 10–12
3.7 10–15
65
Zn
9.3 10–13
9.4 10–14
90
Sr* – 1.3 10–16
90
Y – 7.2 10–19
95
Zr* – 5.8 10–17
95
Nb – 1.1 10–17
106
Ru – 1.4 10–14
110m
Ag – 4.1 10–14
124
Sb – 2.2 10–16
125
Sb* – 9.6 10–16
125m
Te – 1.6 10–15
134
Cs – 1.6 10–15
137
Cs*
4.1 10–12
1.4 10–15
144
Ce* – 7.0 10–17
144
Pr – 2.9 10–22
154
Eu – 8.5 10–16
155
Eu – 6.2 10–17
238
Pu* – 9.5 10–14
239
Pu* – 1.3 10–13
241
Pu* – 2.7 10–15
241
Am* – 7.5 10–14
242
Cm* – 1.5 10–15
243
Cm* – 3.0 10–14
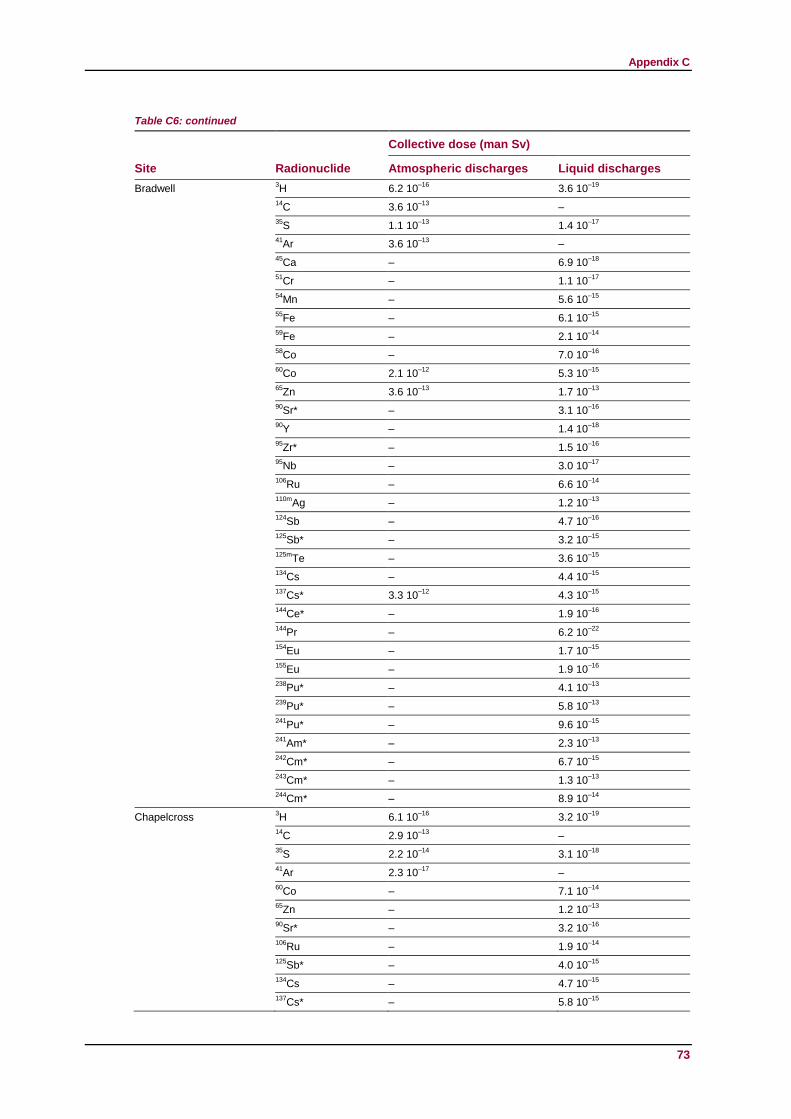
Appendix C
Table C6: continued
73
Site Radionuclide
Collective dose (man Sv)
Atmospheric discharges Liquid discharges
Bradwell 3
H 6.2 10–16
3.6 10–19
14
C 3.6 10–13
–
35
S 1.1 10–13
1.4 10–17
41
Ar
3.6 10–13
–
45
Ca – 6.9 10–18
51
Cr – 1.1 10–17
54
Mn – 5.6 10–15
55
Fe – 6.1 10–15
59
Fe – 2.1 10–14
58
Co – 7.0 10–16
60
Co 2.1 10–12
5.3 10–15
65
Zn 3.6 10–13
1.7 10–13
90
Sr* – 3.1 10–16
90
Y – 1.4 10–18
95
Zr* – 1.5 10–16
95
Nb – 3.0 10–17
106
Ru – 6.6 10–14
110m
Ag – 1.2 10–13
124
Sb – 4.7 10–16
125
Sb* – 3.2 10–15
125m
Te – 3.6 10–15
134
Cs – 4.4 10–15
137
Cs*
3.3 10–12
4.3 10–15
144
Ce* – 1.9 10–16
144
Pr – 6.2 10–22
154
Eu – 1.7 10–15
155
Eu – 1.9 10–16
238
Pu* – 4.1 10–13
239
Pu* – 5.8 10–13
241
Pu* – 9.6 10–15
241
Am* – 2.3 10–13
242
Cm* – 6.7 10–15
243
Cm* – 1.3 10–13
244
Cm*
– 8.9 10–14
Chapelcross 3
H 6.1 10–16
3.2 10–19
14
C 2.9 10–13
–
35
S 2.2 10–14
3.1 10–18
41
Ar 2.3 10–17
–
60
Co – 7.1 10–14
65
Zn – 1.2 10–13
90
Sr* – 3.2 10–16
106
Ru – 1.9 10–14
125
Sb* – 4.0 10–15
134
Cs – 4.7 10–15
137
Cs* – 5.8 10–15
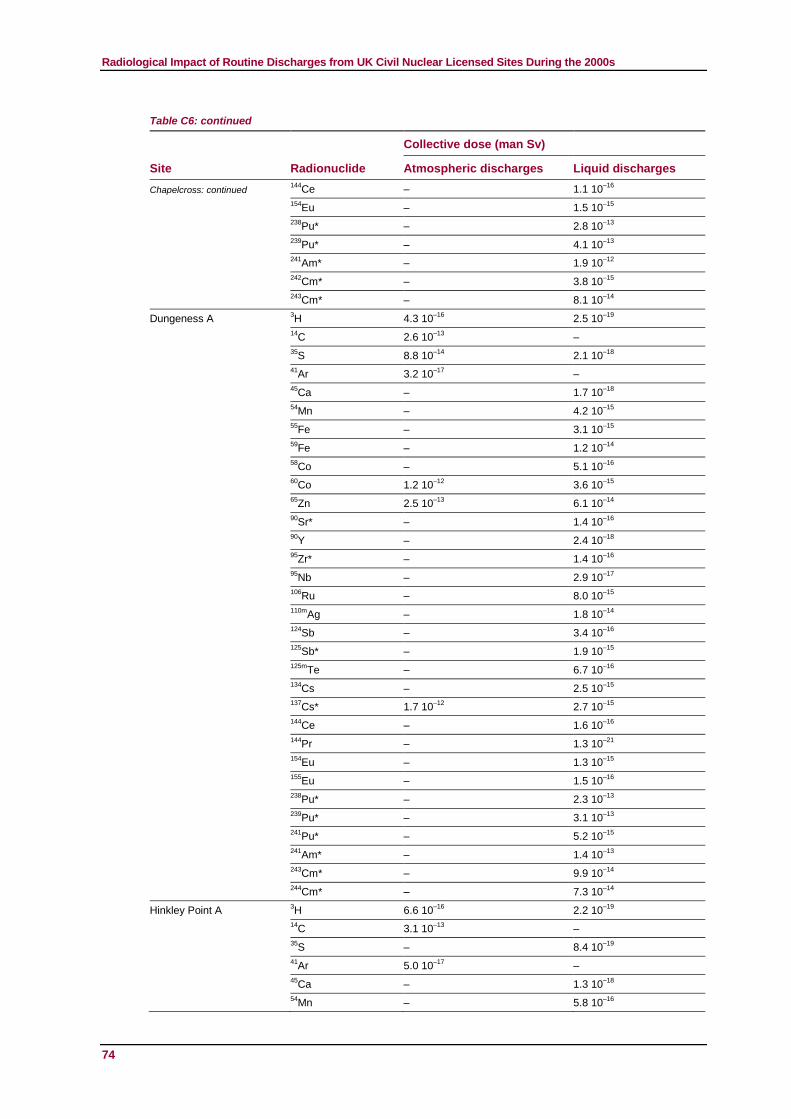
Radiological Impact of Routine Discharges from UK Civil Nuclear Licensed Sites During the 2000s
Table C6: continued
74
Site Radionuclide
Collective dose (man Sv)
Atmospheric discharges Liquid discharges
Chapelcross: continued 144
Ce – 1.1 10–16
154
Eu – 1.5 10–15
238
Pu* – 2.8 10–13
239
Pu* – 4.1 10–13
241
Am* – 1.9 10–12
242
Cm* – 3.8 10–15
243
Cm* – 8.1 10–14
Dungeness A 3
H 4.3 10–16
2.5 10–19
14
C 2.6 10–13
–
35
S 8.8 10–14
2.1 10–18
41
Ar 3.2 10–17
–
45
Ca – 1.7 10–18
54
Mn – 4.2 10–15
55
Fe – 3.1 10–15
59
Fe – 1.2 10–14
58
Co – 5.1 10–16
60
Co 1.2 10–12
3.6 10–15
65
Zn 2.5 10–13
6.1 10–14
90
Sr* – 1.4 10–16
90
Y – 2.4 10–18
95
Zr* – 1.4 10–16
95
Nb – 2.9 10–17
106
Ru – 8.0 10–15
110m
Ag
– 1.8 10–14
124
Sb – 3.4 10–16
125
Sb* – 1.9 10–15
125m
Te – 6.7 10–16
134
Cs – 2.5 10–15
137
Cs*
1.7 10–12
2.7 10–15
144
Ce – 1.6 10–16
144
Pr – 1.3 10–21
154
Eu – 1.3 10–15
155
Eu – 1.5 10–16
238
Pu* – 2.3 10–13
239
Pu* – 3.1 10–13
241
Pu* – 5.2 10–15
241
Am* – 1.4 10–13
243
Cm* – 9.9 10–14
244
Cm*
– 7.3 10–14
Hinkley Point A 3
H 6.6 10–16
2.2 10–19
14
C 3.1 10–13
–
35
S – 8.4 10–19
41
Ar
5.0 10–17
–
45
Ca – 1.3 10–18
54
Mn – 5.8 10–16
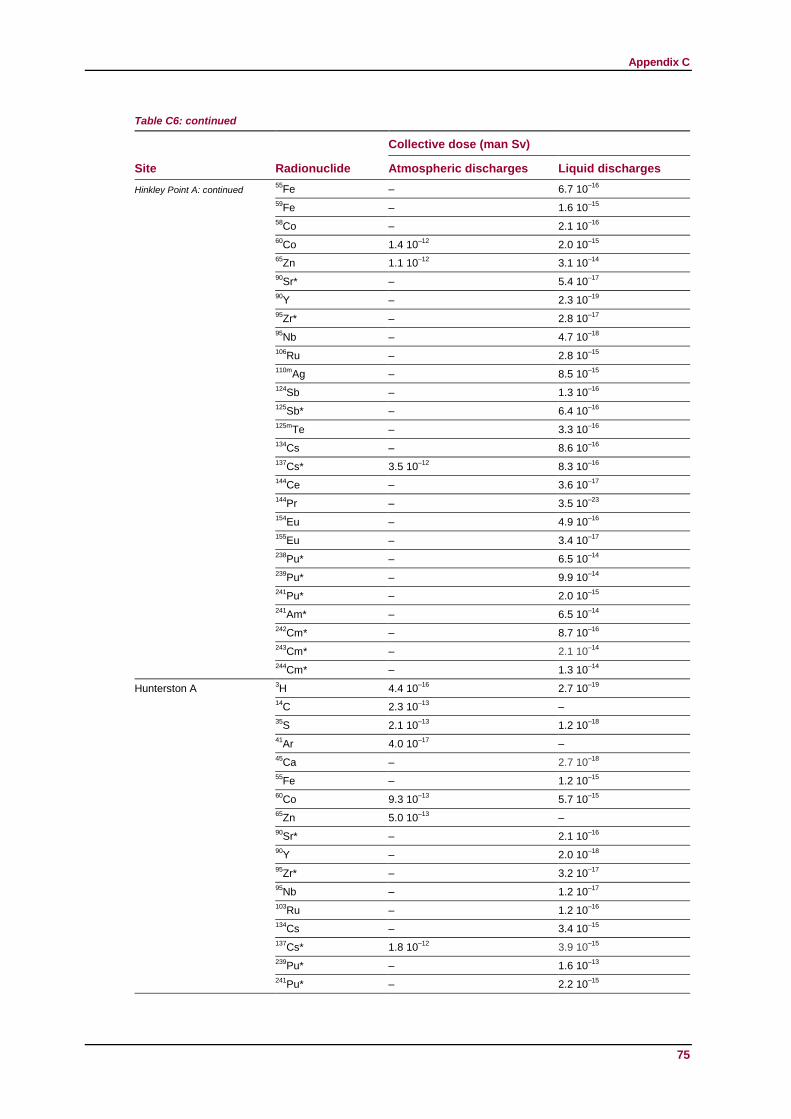
Appendix C
Table C6: continued
75
Site Radionuclide
Collective dose (man Sv)
Atmospheric discharges Liquid discharges
Hinkley Point A: continued 55
Fe – 6.7 10–16
59
Fe
– 1.6 10–15
58
Co
– 2.1 10–16
60
Co 1.4 10–12
2.0 10–15
65
Zn 1.1 10–12
3.1 10–14
90
Sr* – 5.4 10–17
90
Y – 2.3 10–19
95
Zr* – 2.8 10–17
95
Nb – 4.7 10–18
106
Ru – 2.8 10–15
110m
Ag – 8.5 10–15
124
Sb – 1.3 10–16
125
Sb* – 6.4 10–16
125m
Te – 3.3 10–16
134
Cs – 8.6 10–16
137
Cs*
3.5 10–12
8.3 10–16
144
Ce – 3.6 10–17
144
Pr – 3.5 10–23
154
Eu – 4.9 10–16
155
Eu
– 3.4 10–17
238
Pu* – 6.5 10–14
239
Pu* – 9.9 10–14
241
Pu* – 2.0 10–15
241
Am* – 6.5 10–14
242
Cm* – 8.7 10–16
243
Cm* – 2.1 10–14
244
Cm*
– 1.3 10–14
Hunterston A 3
H 4.4 10–16
2.7 10–19
14
C 2.3 10–13
–
35
S 2.1 10–13
1.2 10–18
41
Ar
4.0 10–17
–
45
Ca – 2.7 10–18
55
Fe – 1.2 10–15
60
Co 9.3 10–13
5.7 10–15
65
Zn
5.0 10–13
–
90
Sr* – 2.1 10–16
90
Y – 2.0 10–18
95
Zr* – 3.2 10–17
95
Nb – 1.2 10–17
103
Ru – 1.2 10–16
134
Cs – 3.4 10–15
137
Cs*
1.8 10–12
3.9 10–15
239
Pu* – 1.6 10–13
241
Pu* – 2.2 10–15
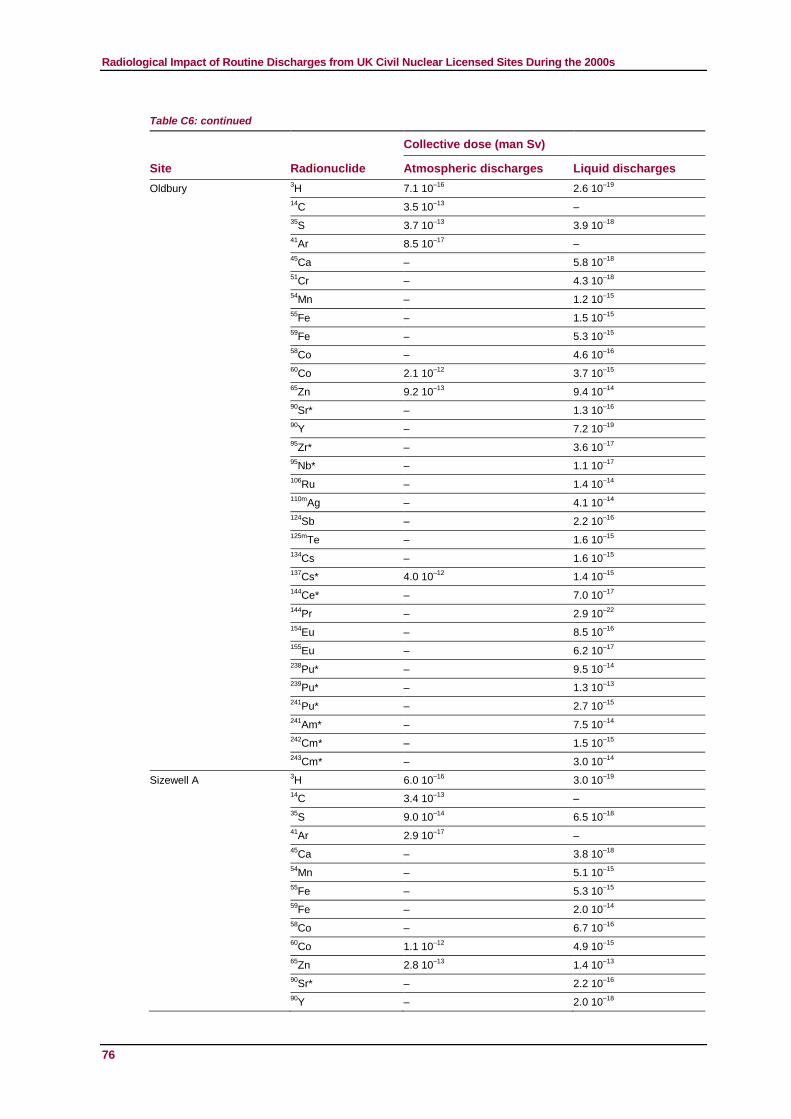
Radiological Impact of Routine Discharges from UK Civil Nuclear Licensed Sites During the 2000s
Table C6: continued
76
Site Radionuclide
Collective dose (man Sv)
Atmospheric discharges Liquid discharges
Oldbury 3
H 7.1 10–16
2.6 10–19
14
C 3.5 10–13
–
35
S 3.7 10–13
3.9 10–18
41
Ar 8.5 10–17
–
45
Ca – 5.8 10–18
51
Cr – 4.3 10–18
54
Mn – 1.2 10–15
55
Fe – 1.5 10–15
59
Fe – 5.3 10–15
58
Co – 4.6 10–16
60
Co 2.1 10–12
3.7 10–15
65
Zn
9.2 10–13
9.4 10–14
90
Sr* – 1.3 10–16
90
Y – 7.2 10–19
95
Zr*
– 3.6 10–17
95
Nb* – 1.1 10–17
106
Ru – 1.4 10–14
110m
Ag
– 4.1 10–14
124
Sb – 2.2 10–16
125m
Te
– 1.6 10–15
134
Cs – 1.6 10–15
137
Cs*
4.0 10–12
1.4 10–15
144
Ce* – 7.0 10–17
144
Pr – 2.9 10–22
154
Eu – 8.5 10–16
155
Eu – 6.2 10–17
238
Pu* – 9.5 10–14
239
Pu* – 1.3 10–13
241
Pu* – 2.7 10–15
241
Am* – 7.5 10–14
242
Cm* – 1.5 10–15
243
Cm* – 3.0 10–14
Sizewell A 3
H 6.0 10–16
3.0 10–19
14
C 3.4 10–13
–
35
S 9.0 10–14
6.5 10–18
41
Ar 2.9 10–17
–
45
Ca – 3.8 10–18
54
Mn
– 5.1 10–15
55
Fe – 5.3 10–15
59
Fe – 2.0 10–14
58
Co – 6.7 10–16
60
Co 1.1 10–12
4.9 10–15
65
Zn
2.8 10–13
1.4 10–13
90
Sr* – 2.2 10–16
90
Y – 2.0 10–18
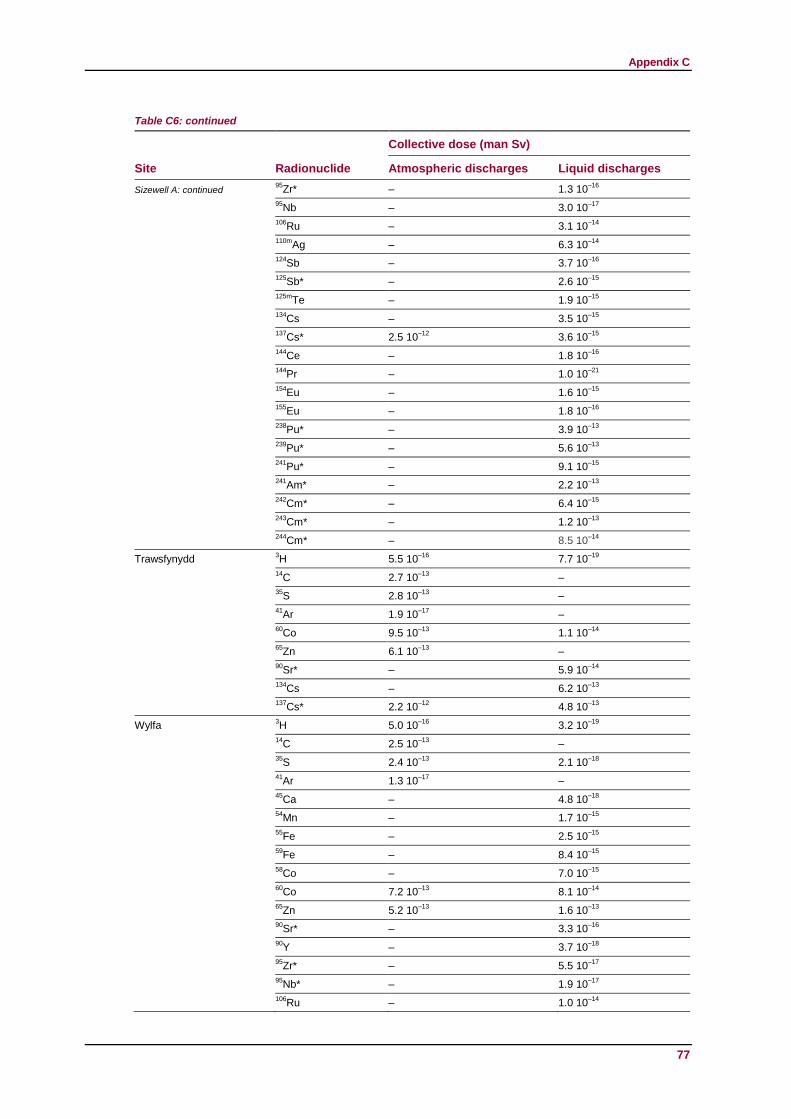
Appendix C
Table C6: continued
77
Site Radionuclide
Collective dose (man Sv)
Atmospheric discharges Liquid discharges
Sizewell A: continued 95
Zr* – 1.3 10–16
95
Nb – 3.0 10–17
106
Ru – 3.1 10–14
110m
Ag – 6.3 10–14
124
Sb – 3.7 10–16
125
Sb* – 2.6 10–15
125m
Te
– 1.9 10–15
134
Cs – 3.5 10–15
137
Cs*
2.5 10–12
3.6 10–15
144
Ce – 1.8 10–16
144
Pr – 1.0 10–21
154
Eu – 1.6 10–15
155
Eu – 1.8 10–16
238
Pu* – 3.9 10–13
239
Pu* – 5.6 10–13
241
Pu* – 9.1 10–15
241
Am* – 2.2 10–13
242
Cm* – 6.4 10–15
243
Cm* – 1.2 10–13
244
Cm*
– 8.5 10–14
Trawsfynydd 3H 5.5 10
–16 7.7 10
–19
14
C 2.7 10–13
–
35
S
2.8 10–13
–
41
Ar
1.9 10–17
–
60
Co 9.5 10–13
1.1 10–14
65
Zn
6.1 10–13
–
90
Sr* – 5.9 10–14
134
Cs
– 6.2 10–13
137
Cs*
2.2 10–12
4.8 10–13
Wylfa 3
H 5.0 10–16
3.2 10–19
14
C 2.5 10–13
–
35
S 2.4 10–13
2.1 10–18
41
Ar 1.3 10–17
–
45
Ca
– 4.8 10–18
54
Mn – 1.7 10–15
55
Fe – 2.5 10–15
59
Fe – 8.4 10–15
58
Co – 7.0 10–15
60
Co 7.2 10–13
8.1 10–14
65
Zn
5.2 10–13
1.6 10–13
90
Sr* – 3.3 10–16
90
Y – 3.7 10–18
95
Zr*
– 5.5 10–17
95
Nb* – 1.9 10–17
106
Ru – 1.0 10–14
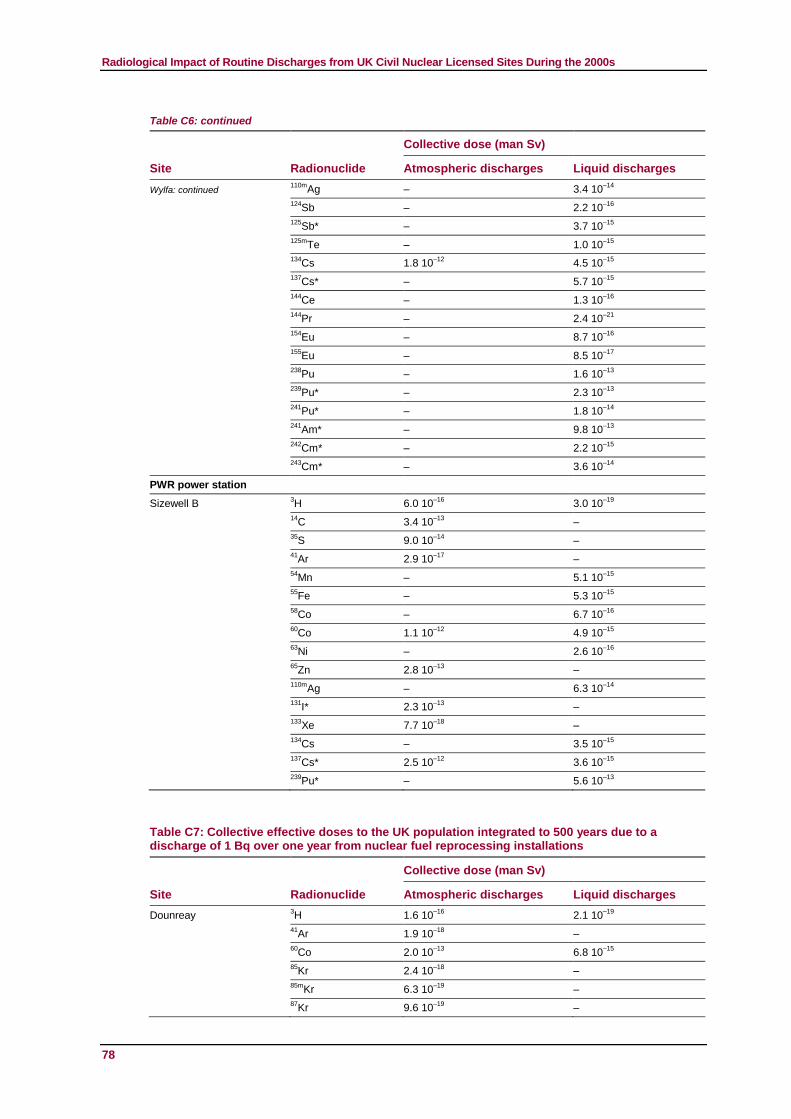
Radiological Impact of Routine Discharges from UK Civil Nuclear Licensed Sites During the 2000s
Table C6: continued
78
Site Radionuclide
Collective dose (man Sv)
Atmospheric discharges Liquid discharges
Wylfa: continued 110m
Ag – 3.4 10–14
124
Sb – 2.2 10–16
125
Sb* – 3.7 10–15
125m
Te – 1.0 10–15
134
Cs 1.8 10–12
4.5 10–15
137
Cs* – 5.7 10–15
144
Ce – 1.3 10–16
144
Pr – 2.4 10–21
154
Eu – 8.7 10–16
155
Eu – 8.5 10–17
238
Pu – 1.6 10–13
239
Pu* – 2.3 10–13
241
Pu* – 1.8 10–14
241
Am* – 9.8 10–13
242
Cm* – 2.2 10–15
243
Cm* – 3.6 10–14
PWR power station
Sizewell B 3
H 6.0 10–16
3.0 10–19
14
C 3.4 10–13
–
35
S 9.0 10–14
–
41
Ar 2.9 10–17
–
54
Mn – 5.1 10–15
55
Fe – 5.3 10–15
58
Co – 6.7 10–16
60
Co 1.1 10–12
4.9 10–15
63
Ni – 2.6 10–16
65
Zn 2.8 10–13
–
110m
Ag – 6.3 10–14
131
I* 2.3 10–13
–
133
Xe
7.7 10–18
–
134
Cs – 3.5 10–15
137
Cs*
2.5 10–12
3.6 10–15
239
Pu* – 5.6 10–13
Table C7: Collective effective doses to the UK population integrated to 500 years due to a discharge of 1 Bq over one year from nuclear fuel reprocessing installations
Site Radionuclide
Collective dose (man Sv)
Atmospheric discharges Liquid discharges
Dounreay 3
H 1.6 10–16
2.1 10–19
41
Ar
1.9 10–18
–
60
Co 2.0 10–13
6.8 10–15
85
Kr 2.4 10–18
–
85m
Kr 6.3 10–19
–
87
Kr 9.6 10–19
–
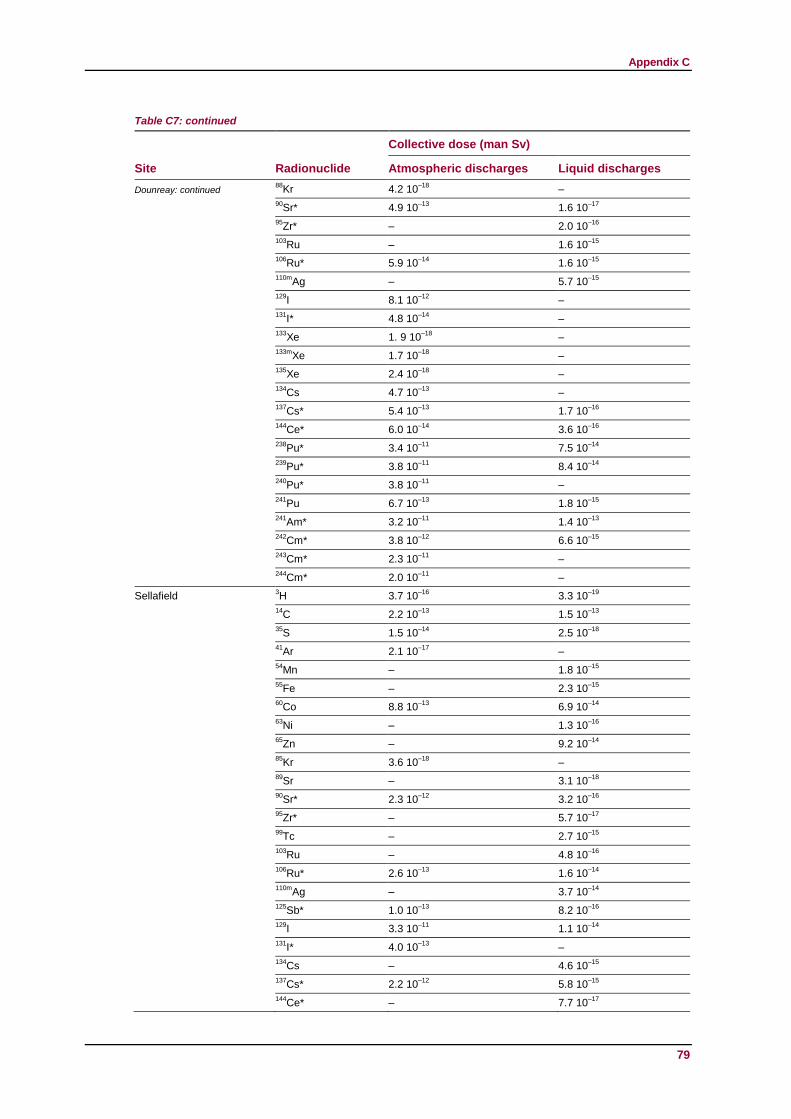
Appendix C
Table C7: continued
79
Site Radionuclide
Collective dose (man Sv)
Atmospheric discharges Liquid discharges
Dounreay: continued 88
Kr 4.2 10–18
–
90
Sr* 4.9 10–13
1.6 10–17
95
Zr* – 2.0 10–16
103
Ru – 1.6 10–15
106
Ru* 5.9 10–14
1.6 10–15
110m
Ag – 5.7 10–15
129
I 8.1 10–12
–
131
I* 4.8 10–14
–
133
Xe 1. 9 10–18
–
133m
Xe 1.7 10–18
–
135
Xe 2.4 10–18
–
134
Cs 4.7 10–13
–
137
Cs* 5.4 10–13
1.7 10–16
144
Ce* 6.0 10–14
3.6 10–16
238
Pu* 3.4 10–11
7.5 10–14
239
Pu* 3.8 10–11
8.4 10–14
240
Pu* 3.8 10–11
–
241
Pu 6.7 10–13
1.8 10–15
241
Am* 3.2 10–11
1.4 10–13
242
Cm* 3.8 10–12
6.6 10–15
243
Cm* 2.3 10–11
–
244
Cm* 2.0 10–11
–
Sellafield 3H 3.7 10
–16 3.3 10
–19
14
C 2.2 10–13
1.5 10–13
35
S 1.5 10–14
2.5 10–18
41
Ar 2.1 10–17
–
54
Mn – 1.8 10–15
55
Fe – 2.3 10–15
60
Co 8.8 10–13
6.9 10–14
63
Ni – 1.3 10–16
65
Zn – 9.2 10–14
85
Kr 3.6 10–18
–
89
Sr – 3.1 10–18
90
Sr* 2.3 10–12
3.2 10–16
95
Zr* – 5.7 10–17
99
Tc – 2.7 10–15
103
Ru – 4.8 10–16
106
Ru* 2.6 10–13
1.6 10–14
110m
Ag – 3.7 10–14
125
Sb* 1.0 10–13
8.2 10–16
129
I 3.3 10–11
1.1 10–14
131
I* 4.0 10–13
–
134
Cs – 4.6 10–15
137
Cs* 2.2 10–12
5.8 10–15
144
Ce* – 7.7 10–17
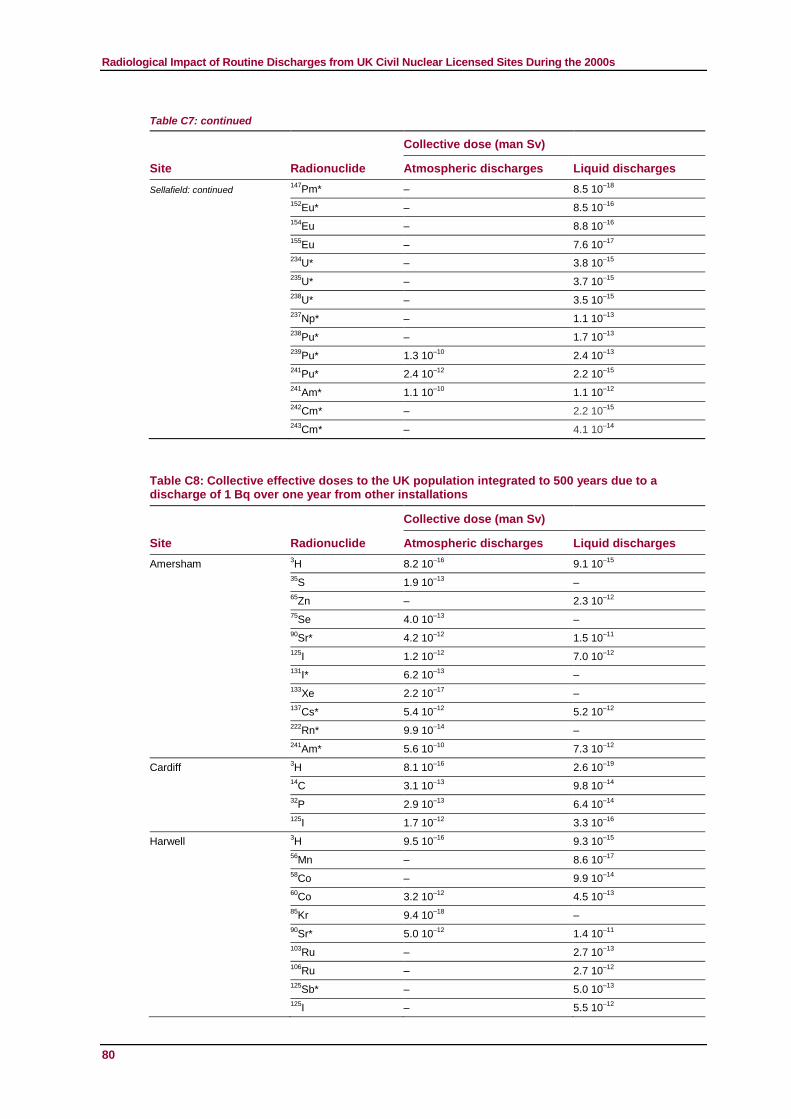
Radiological Impact of Routine Discharges from UK Civil Nuclear Licensed Sites During the 2000s
Table C7: continued
80
Site Radionuclide
Collective dose (man Sv)
Atmospheric discharges Liquid discharges
Sellafield: continued 147
Pm* – 8.5 10–18
152
Eu* – 8.5 10–16
154
Eu – 8.8 10–16
155
Eu – 7.6 10–17
234
U* – 3.8 10–15
235
U* – 3.7 10–15
238
U* – 3.5 10–15
237
Np* – 1.1 10–13
238
Pu* – 1.7 10–13
239
Pu* 1.3 10–10
2.4 10–13
241
Pu* 2.4 10–12
2.2 10–15
241
Am* 1.1 10–10
1.1 10–12
242
Cm* – 2.2 10–15
243
Cm* – 4.1 10–14
Table C8: Collective effective doses to the UK population integrated to 500 years due to a discharge of 1 Bq over one year from other installations
Site Radionuclide
Collective dose (man Sv)
Atmospheric discharges Liquid discharges
Amersham 3H
8.2 10
–16 9.1 10
–15
35
S 1.9 10–13
–
65
Zn
– 2.3 10–12
75
Se 4.0 10–13
–
90
Sr* 4.2 10–12
1.5 10–11
125
I 1.2 10–12
7.0 10–12
131
I* 6.2 10–13
–
133
Xe 2.2 10–17
–
137
Cs* 5.4 10–12
5.2 10–12
222
Rn* 9.9 10–14
–
241
Am* 5.6 10–10
7.3 10–12
Cardiff 3
H
8.1 10–16
2.6 10–19
14
C 3.1 10–13
9.8 10–14
32
P 2.9 10–13
6.4 10–14
125
I 1.7 10–12
3.3 10–16
Harwell 3H 9.5 10
–16 9.3 10
–15
56
Mn
– 8.6 10–17
58
Co – 9.9 10–14
60
Co 3.2 10–12
4.5 10–13
85
Kr 9.4 10–18
–
90
Sr* 5.0 10–12
1.4 10–11
103
Ru – 2.7 10–13
106
Ru – 2.7 10–12
125
Sb* – 5.0 10–13
125
I – 5.5 10–12
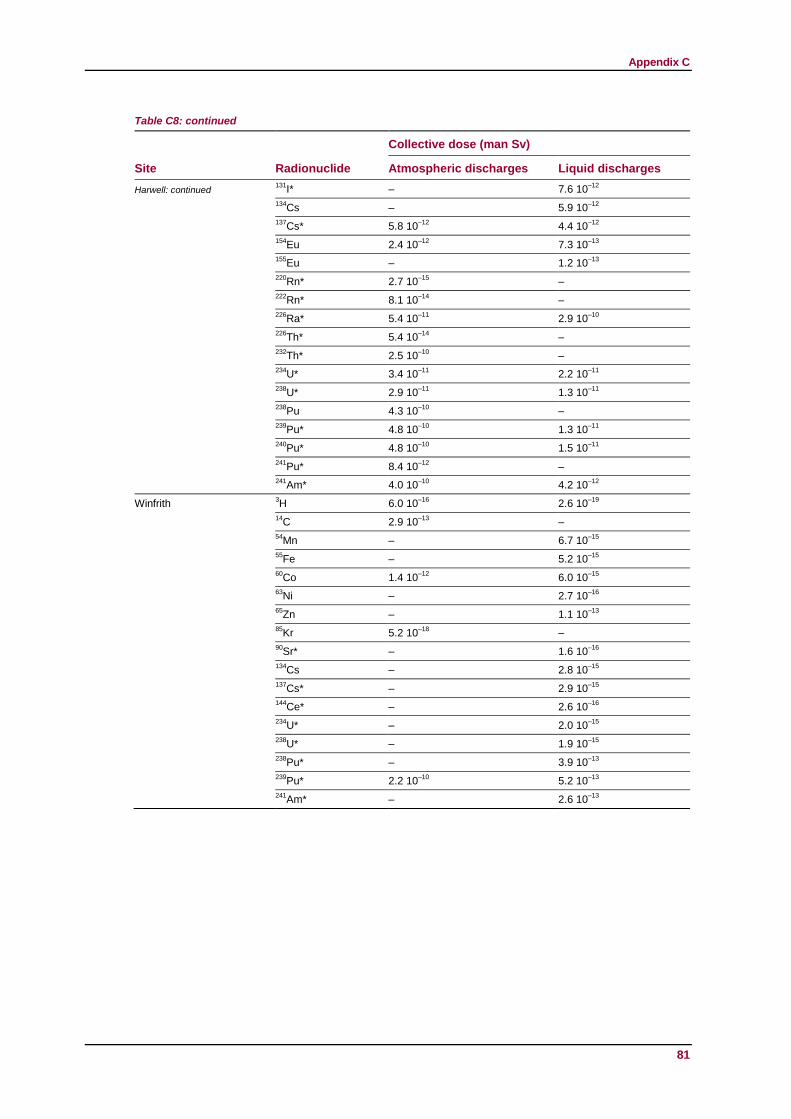
Appendix C
Table C8: continued
81
Site Radionuclide
Collective dose (man Sv)
Atmospheric discharges Liquid discharges
Harwell: continued 131
I* – 7.6 10–12
134
Cs – 5.9 10–12
137
Cs* 5.8 10–12
4.4 10–12
154
Eu 2.4 10–12
7.3 10–13
155
Eu – 1.2 10–13
220
Rn* 2.7 10–15
–
222
Rn* 8.1 10–14
–
226
Ra* 5.4 10–11
2.9 10–10
226
Th* 5.4 10–14
–
232
Th* 2.5 10–10
–
234
U* 3.4 10–11
2.2 10–11
238
U* 2.9 10–11
1.3 10–11
238
Pu 4.3 10–10
–
239
Pu* 4.8 10–10
1.3 10–11
240
Pu* 4.8 10–10
1.5 10–11
241
Pu* 8.4 10–12
–
241
Am* 4.0 10–10
4.2 10–12
Winfrith 3
H 6.0 10–16
2.6 10–19
14
C
2.9 10–13
–
54
Mn – 6.7 10–15
55
Fe – 5.2 10–15
60
Co 1.4 10–12
6.0 10–15
63
Ni – 2.7 10–16
65
Zn – 1.1 10–13
85
Kr
5.2 10–18
–
90
Sr* – 1.6 10–16
134
Cs – 2.8 10–15
137
Cs* – 2.9 10–15
144
Ce* – 2.6 10–16
234
U* – 2.0 10–15
238
U* – 1.9 10–15
238
Pu* – 3.9 10–13
239
Pu* 2.2 10–10
5.2 10–13
241
Am* – 2.6 10–13
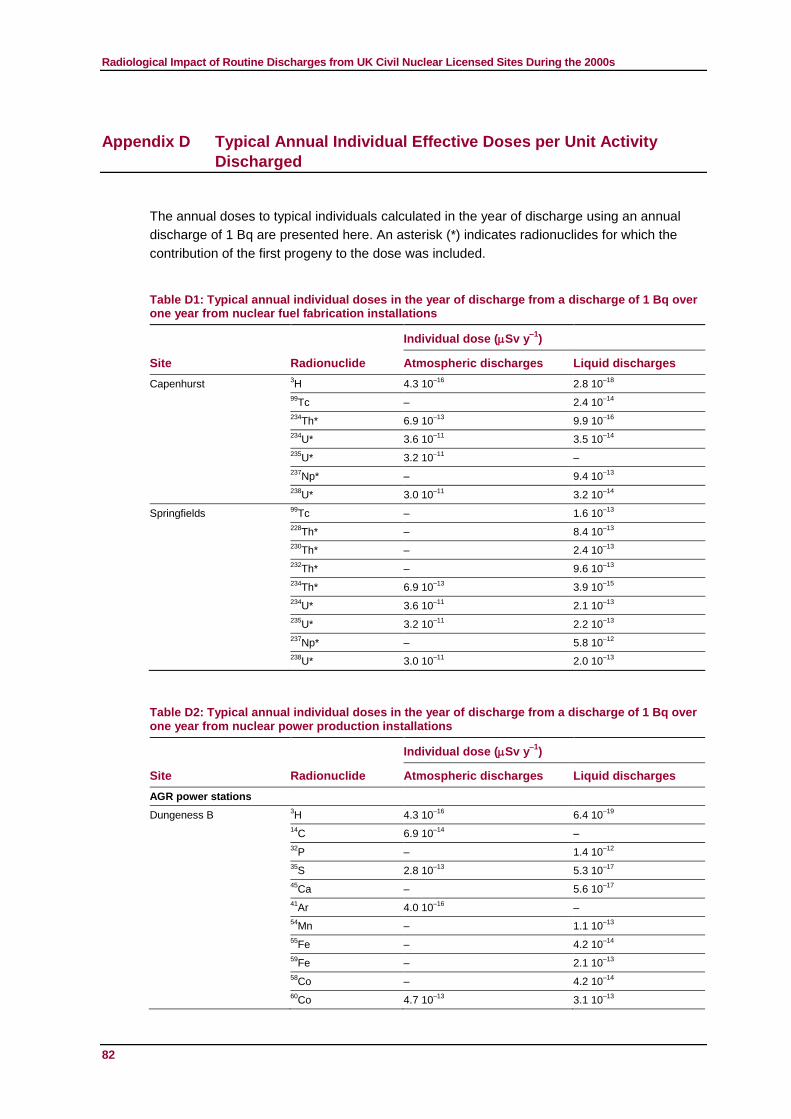
Radiological Impact of Routine Discharges from UK Civil Nuclear Licensed Sites During the 2000s
82
Appendix D Typical Annual Individual Effective Doses per Unit Activity
Discharged
The annual doses to typical individuals calculated in the year of discharge using an annual
discharge of 1 Bq are presented here. An asterisk (*) indicates radionuclides for which the
contribution of the first progeny to the dose was included.
Table D1: Typical annual individual doses in the year of discharge from a discharge of 1 Bq over one year from nuclear fuel fabrication installations
Site Radionuclide
Individual dose (Sv y–1
)
Atmospheric discharges Liquid discharges
Capenhurst 3H 4.3 10
–16 2.8 10
–18
99
Tc – 2.4 10–14
234
Th* 6.9 10–13
9.9 10–16
234
U* 3.6 10–11
3.5 10–14
235
U* 3.2 10–11
–
237
Np*
– 9.4 10–13
238
U* 3.0 10–11
3.2 10–14
Springfields 99
Tc
– 1.6 10–13
228
Th* – 8.4 10–13
230
Th* – 2.4 10–13
232
Th* – 9.6 10–13
234
Th* 6.9 10–13
3.9 10–15
234
U* 3.6 10–11
2.1 10–13
235
U* 3.2 10–11
2.2 10–13
237
Np*
– 5.8 10–12
238
U* 3.0 10–11
2.0 10–13
Table D2: Typical annual individual doses in the year of discharge from a discharge of 1 Bq over one year from nuclear power production installations
Site Radionuclide
Individual dose (Sv y–1
)
Atmospheric discharges Liquid discharges
AGR power stations
Dungeness B 3H 4.3 10
–16 6.4 10
–19
14
C 6.9 10–14
–
32
P – 1.4 10–12
35
S 2.8 10–13
5.3 10–17
45
Ca – 5.6 10–17
41
Ar 4.0 10–16
–
54
Mn – 1.1 10–13
55
Fe – 4.2 10–14
59
Fe – 2.1 10–13
58
Co – 4.2 10–14
60
Co
4.7 10–13
3.1 10–13
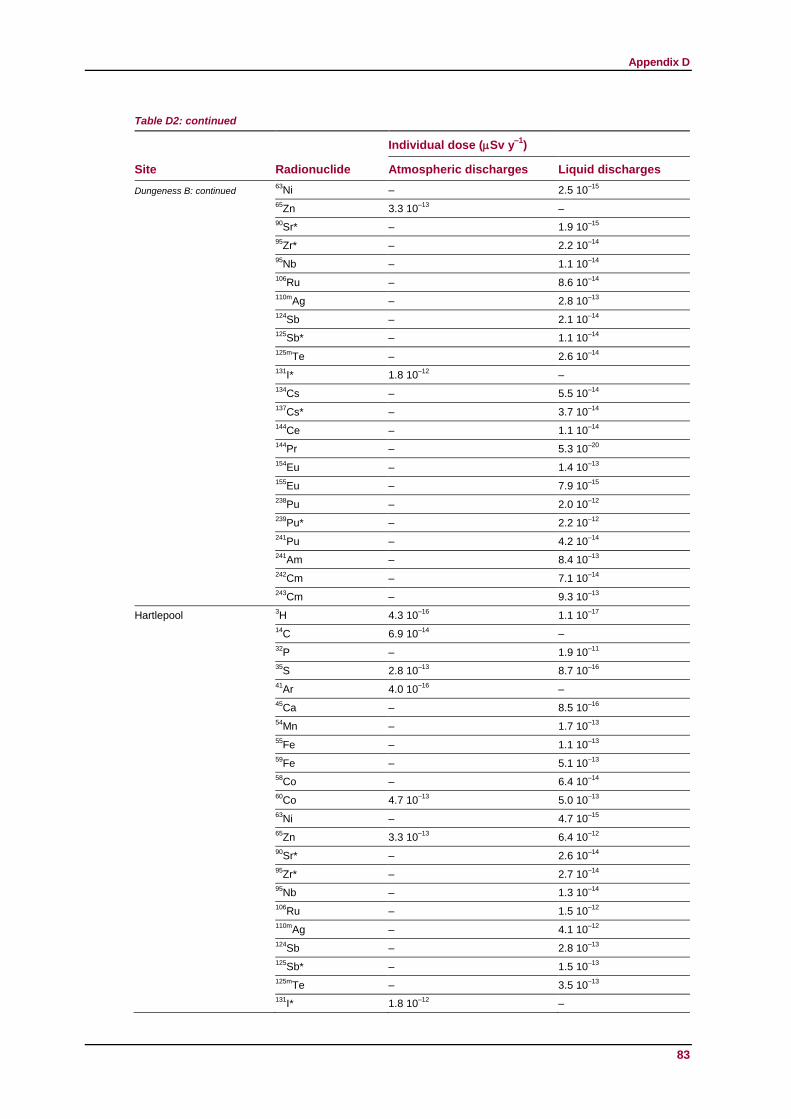
Appendix D
Table D2: continued
83
Site Radionuclide
Individual dose (Sv y–1
)
Atmospheric discharges Liquid discharges
Dungeness B: continued 63
Ni
– 2.5 10–15
65
Zn 3.3 10–13
–
90
Sr*
– 1.9 10–15
95
Zr* – 2.2 10–14
95
Nb – 1.1 10–14
106
Ru – 8.6 10–14
110m
Ag – 2.8 10–13
124
Sb – 2.1 10–14
125
Sb* – 1.1 10–14
125m
Te – 2.6 10–14
131
I* 1.8 10–12
–
134
Cs – 5.5 10–14
137
Cs* – 3.7 10–14
144
Ce
– 1.1 10–14
144
Pr – 5.3 10–20
154
Eu – 1.4 10–13
155
Eu – 7.9 10–15
238
Pu – 2.0 10–12
239
Pu* – 2.2 10–12
241
Pu – 4.2 10–14
241
Am – 8.4 10–13
242
Cm – 7.1 10–14
243
Cm – 9.3 10–13
Hartlepool 3H 4.3 10
–16 1.1 10
–17
14
C 6.9 10–14
–
32
P
– 1.9 10–11
35
S 2.8 10–13
8.7 10–16
41
Ar 4.0 10–16
–
45
Ca – 8.5 10–16
54
Mn – 1.7 10–13
55
Fe – 1.1 10–13
59
Fe – 5.1 10–13
58
Co – 6.4 10–14
60
Co
4.7 10–13
5.0 10–13
63
Ni
– 4.7 10–15
65
Zn 3.3 10–13
6.4 10–12
90
Sr*
– 2.6 10–14
95
Zr* – 2.7 10–14
95
Nb – 1.3 10–14
106
Ru – 1.5 10–12
110m
Ag – 4.1 10–12
124
Sb – 2.8 10–13
125
Sb* – 1.5 10–13
125m
Te – 3.5 10–13
131
I* 1.8 10–12
–

Radiological Impact of Routine Discharges from UK Civil Nuclear Licensed Sites During the 2000s
Table D2: continued
84
Site Radionuclide
Individual dose (Sv y–1
)
Atmospheric discharges Liquid discharges
Hartlepool: continued 133
Xe
1.5 10–17
–
134
Cs – 5.8 10–13
137
Cs* – 3.8 10–13
144
Ce
– 1.3 10–14
144
Pr – 2.8 10–20
154
Eu – 2.0 10–13
155
Eu – 1.1 10–14
238
Pu – 4.0 10–12
239
Pu* – 4.3 10–12
241
Pu – 8.2 10–14
241
Am – 1.1 10–12
242
Cm – 8.7 10–14
243
Cm – 1.2 10–12
Heysham 1 3H 4.3 10
–16 7.6 10
–18
14
C 6.9 10–14
–
32
P
– 1.7 10–11
35
S 2.8 10–13
6.0 10–16
45
Ca
– 6.4 10–16
41
Ar 4.0 10–16
–
54
Mn – 1.3 10–12
55
Fe – 3.5 10–13
59
Fe – 2.0 10–12
58
Co – 7.9 10–13
60
Co
4.7 10–13
4.1 10–12
63
Ni – 1.8 10–14
65
Zn 3.3 10–13
–
90
Sr* – 2.6 10–14
95
Zr* – 2.7 10–14
95
Nb – 1.3 10–14
106
Ru – 1.5 10–12
110m
Ag – 4.1 10–12
124
Sb – 2.8 10–13
125
Sb* – 1.5 10–13
125m
Te – 3.5 10–13
131
I* 1.8 10–12
–
133
Xe
1.5 10–17
–
134
Cs – 6.2 10–13
137
Cs* – 4.3 10–13
144
Ce
– 1.5 10–13
144
Pr – 1.1 10–18
154
Eu – 2.3 10–12
155
Eu – 1.1 10–13
238
Pu – 1.5 10–11
239
Pu* – 1.7 10–11
241
Pu – 3.2 10–13

Appendix D
Table D2: continued
85
Site Radionuclide
Individual dose (Sv y–1
)
Atmospheric discharges Liquid discharges
Heysham 1: continued 241
Am – 5.0 10–12
242
Cm – 5.0 10–13
243
Cm – 6.6 10–12
Heysham 2 3H 4.3 10
–16 7.6 10
–18
14
C 6.9 10–14
–
32
P
– 1.7 10–11
35
S 2.8 10–13
6.0 10–16
45
Ca
– 6.4 10–16
41
Ar 4.0 10–16
–
54
Mn – 1.3 10–12
55
Fe – 3.5 10–13
59
Fe – 2.0 10–12
58
Co – 7.9 10–13
60
Co
4.7 10–13
4.1 10–12
63
Ni – 1.8 10–14
65
Zn 3.3 10–13
–
90
Sr* – 2.6 10–14
95
Zr* – 2.7 10–14
95
Nb – 1.3 10–14
106
Ru – 1.5 10–12
110m
Ag – 4.1 10–12
124
Sb – 2.8 10–13
125
Sb* – 1.5 10–13
125m
Te – 3.5 10–13
131
I* 1.8 10–12
–
133
Xe
1.5 10–17
–
134
Cs – 6.2 10–13
137
Cs* – 4.3 10–13
144
Ce
– 1.5 10–13
144
Pr – 1.1 10–18
154
Eu – 2.3 10–12
155
Eu – 1.1 10–13
238
Pu – 1.5 10–11
239
Pu* – 1.7 10–11
241
Pu – 3.2 10–13
241
Am – 5.0 10–12
242
Cm – 5.0 10–13
243
Cm – 6.6 10–12
Hinkley Point B 3H 4.3 10
–16 5.7 10
–19
14
C 6.9 10–14
–
32
P
– 8.1 10–13
35
S 2.8 10–13
4.0 10–17
45
Ca
– 4.1 10–17
41
Ar 4.0 10–16
–
54
Mn – 1.0 10–14
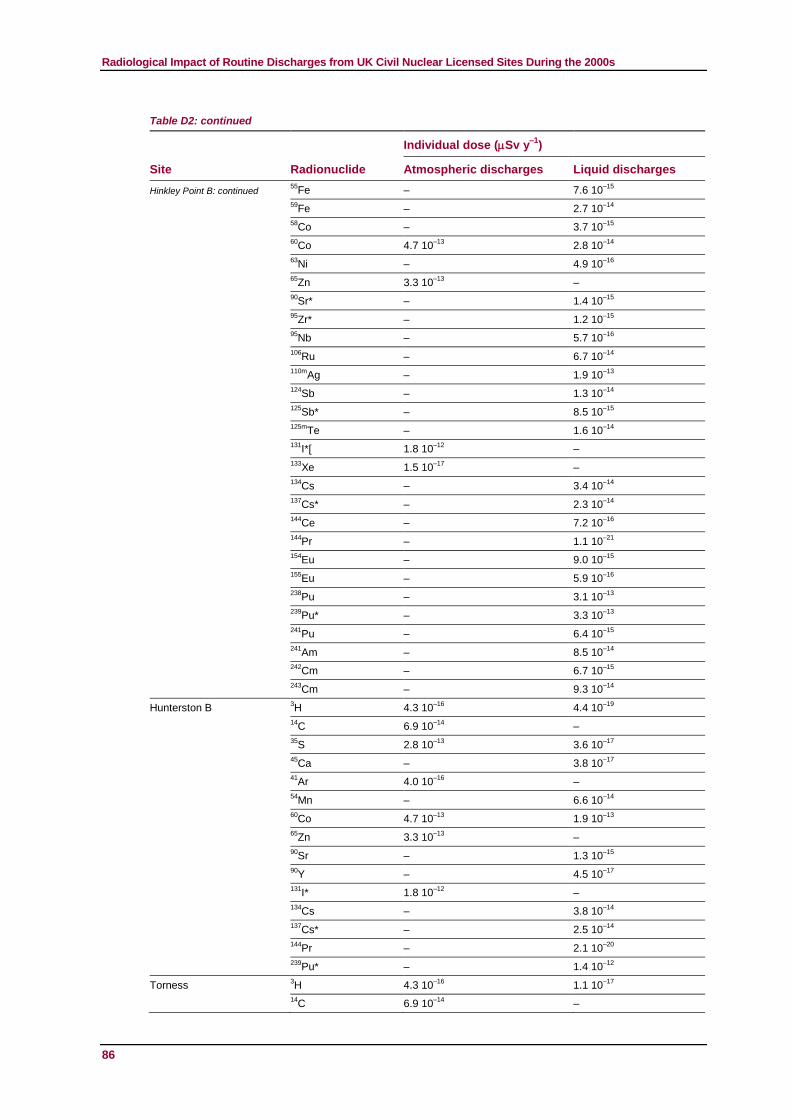
Radiological Impact of Routine Discharges from UK Civil Nuclear Licensed Sites During the 2000s
Table D2: continued
86
Site Radionuclide
Individual dose (Sv y–1
)
Atmospheric discharges Liquid discharges
Hinkley Point B: continued 55
Fe – 7.6 10–15
59
Fe – 2.7 10–14
58
Co – 3.7 10–15
60
Co
4.7 10–13
2.8 10–14
63
Ni
– 4.9 10–16
65
Zn 3.3 10–13
–
90
Sr*
– 1.4 10–15
95
Zr* – 1.2 10–15
95
Nb – 5.7 10–16
106
Ru – 6.7 10–14
110m
Ag – 1.9 10–13
124
Sb – 1.3 10–14
125
Sb* – 8.5 10–15
125m
Te – 1.6 10–14
131
I*[ 1.8 10–12
–
133
Xe
1.5 10–17
–
134
Cs – 3.4 10–14
137
Cs* – 2.3 10–14
144
Ce – 7.2 10–16
144
Pr – 1.1 10–21
154
Eu – 9.0 10–15
155
Eu – 5.9 10–16
238
Pu – 3.1 10–13
239
Pu* – 3.3 10–13
241
Pu – 6.4 10–15
241
Am – 8.5 10–14
242
Cm – 6.7 10–15
243
Cm – 9.3 10–14
Hunterston B 3H 4.3 10
–16 4.4 10
–19
14
C 6.9 10–14
–
35
S 2.8 10–13
3.6 10–17
45
Ca
– 3.8 10–17
41
Ar 4.0 10–16
–
54
Mn
– 6.6 10–14
60
Co
4.7 10–13
1.9 10–13
65
Zn 3.3 10–13
–
90
Sr – 1.3 10–15
90
Y – 4.5 10–17
131
I* 1.8 10–12
–
134
Cs – 3.8 10–14
137
Cs* – 2.5 10–14
144
Pr – 2.1 10–20
239
Pu* – 1.4 10–12
Torness 3H 4.3 10
–16 1.1 10
–17
14
C 6.9 10–14
–
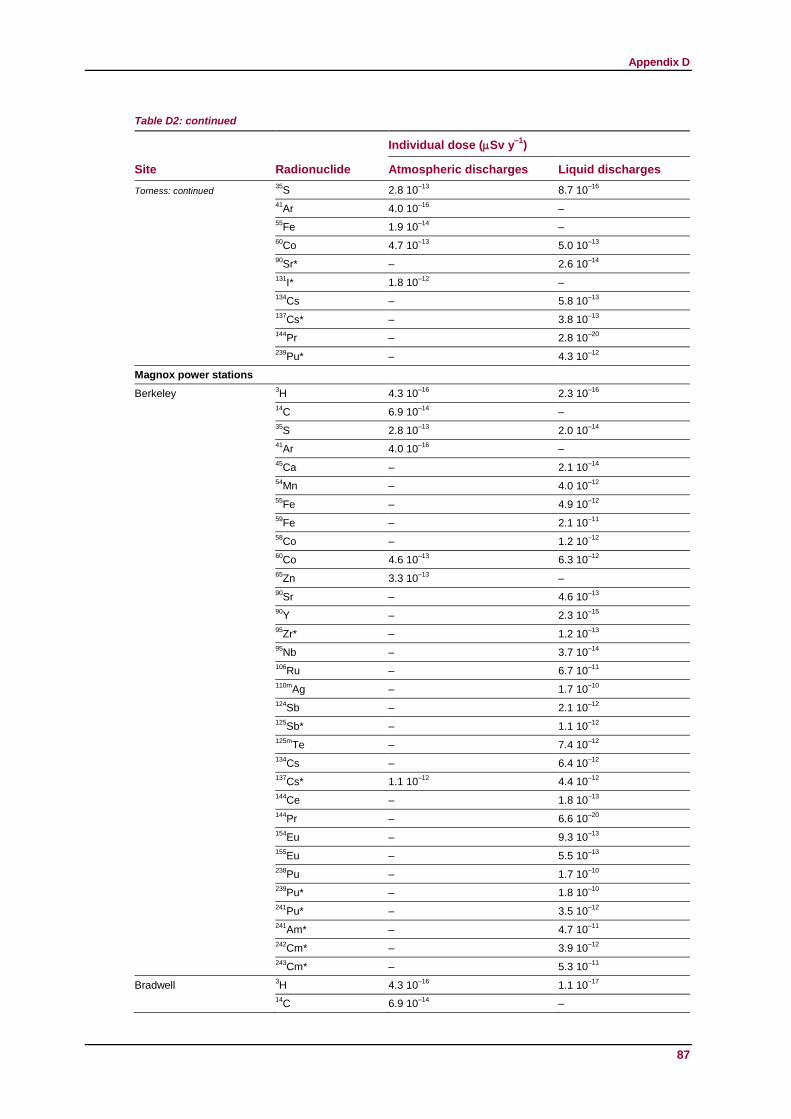
Appendix D
Table D2: continued
87
Site Radionuclide
Individual dose (Sv y–1
)
Atmospheric discharges Liquid discharges
Torness: continued 35
S 2.8 10–13
8.7 10–16
41
Ar 4.0 10–16
–
55
Fe
1.9 10–14
–
60
Co
4.7 10–13
5.0 10–13
90
Sr*
– 2.6 10–14
131
I* 1.8 10–12
–
134
Cs – 5.8 10–13
137
Cs* – 3.8 10–13
144
Pr – 2.8 10–20
239
Pu* – 4.3 10–12
Magnox power stations
Berkeley 3H 4.3 10
–16 2.3 10
–16
14
C 6.9 10–14
–
35
S 2.8 10–13
2.0 10–14
41
Ar
4.0 10–16
–
45
Ca
– 2.1 10–14
54
Mn
– 4.0 10–12
55
Fe
– 4.9 10–12
59
Fe – 2.1 10–11
58
Co – 1.2 10–12
60
Co
4.6 10–13
6.3 10–12
65
Zn
3.3 10–13
–
90
Sr – 4.6 10–13
90
Y – 2.3 10–15
95
Zr* – 1.2 10–13
95
Nb – 3.7 10–14
106
Ru – 6.7 10–11
110m
Ag – 1.7 10–10
124
Sb – 2.1 10–12
125
Sb* – 1.1 10–12
125m
Te – 7.4 10–12
134
Cs – 6.4 10–12
137
Cs*
1.1 10–12
4.4 10–12
144
Ce – 1.8 10–13
144
Pr – 6.6 10–20
154
Eu – 9.3 10–13
155
Eu – 5.5 10–13
238
Pu – 1.7 10–10
239
Pu* – 1.8 10–10
241
Pu* – 3.5 10–12
241
Am*
– 4.7 10–11
242
Cm* – 3.9 10–12
243
Cm* – 5.3 10–11
Bradwell 3H 4.3 10
–16 1.1 10
–17
14
C 6.9 10–14
–
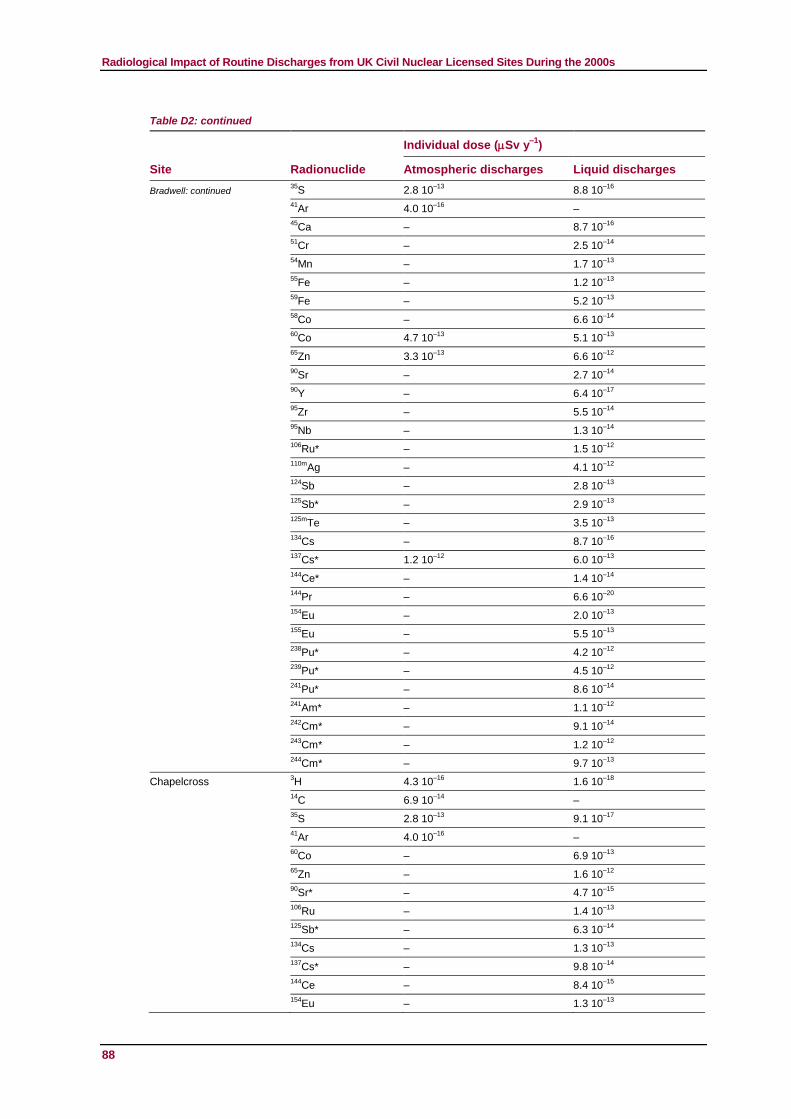
Radiological Impact of Routine Discharges from UK Civil Nuclear Licensed Sites During the 2000s
Table D2: continued
88
Site Radionuclide
Individual dose (Sv y–1
)
Atmospheric discharges Liquid discharges
Bradwell: continued 35
S 2.8 10–13
8.8 10–16
41
Ar
4.0 10–16
–
45
Ca
– 8.7 10–16
51
Cr
– 2.5 10–14
54
Mn – 1.7 10–13
55
Fe – 1.2 10–13
59
Fe – 5.2 10–13
58
Co – 6.6 10–14
60
Co
4.7 10–13
5.1 10–13
65
Zn 3.3 10–13
6.6 10–12
90
Sr – 2.7 10–14
90
Y – 6.4 10–17
95
Zr – 5.5 10–14
95
Nb – 1.3 10–14
106
Ru* – 1.5 10–12
110m
Ag – 4.1 10–12
124
Sb – 2.8 10–13
125
Sb* – 2.9 10–13
125m
Te – 3.5 10–13
134
Cs – 8.7 10–16
137
Cs* 1.2 10–12
6.0 10–13
144
Ce* – 1.4 10–14
144
Pr – 6.6 10–20
154
Eu – 2.0 10–13
155
Eu – 5.5 10–13
238
Pu* – 4.2 10–12
239
Pu* – 4.5 10–12
241
Pu* – 8.6 10–14
241
Am* – 1.1 10–12
242
Cm* – 9.1 10–14
243
Cm* – 1.2 10–12
244
Cm* – 9.7 10–13
Chapelcross 3H 4.3 10
–16 1.6 10
–18
14
C 6.9 10–14
–
35
S 2.8 10–13
9.1 10–17
41
Ar 4.0 10–16
–
60
Co – 6.9 10–13
65
Zn
– 1.6 10–12
90
Sr*
– 4.7 10–15
106
Ru
– 1.4 10–13
125
Sb* – 6.3 10–14
134
Cs – 1.3 10–13
137
Cs* – 9.8 10–14
144
Ce – 8.4 10–15
154
Eu
– 1.3 10–13
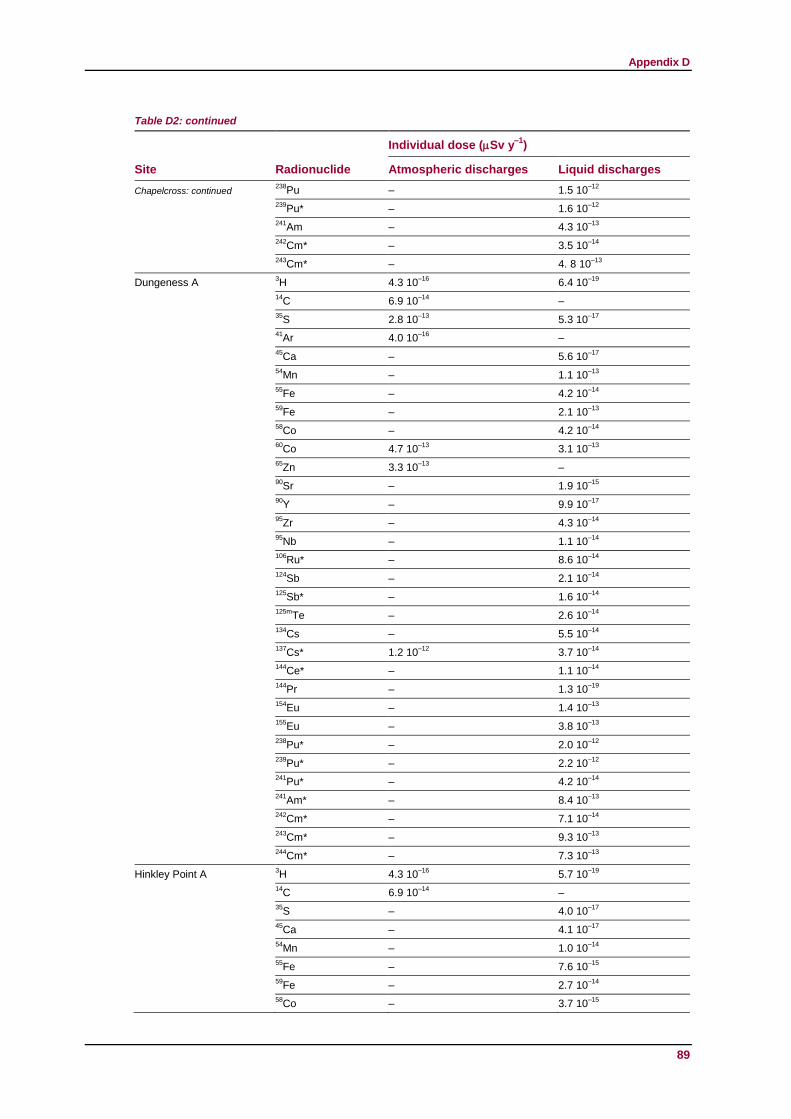
Appendix D
Table D2: continued
89
Site Radionuclide
Individual dose (Sv y–1
)
Atmospheric discharges Liquid discharges
Chapelcross: continued 238
Pu
– 1.5 10–12
239
Pu* – 1.6 10–12
241
Am – 4.3 10–13
242
Cm* – 3.5 10–14
243
Cm* – 4. 8 10–13
Dungeness A 3H 4.3 10
–16 6.4 10
–19
14
C 6.9 10–14
–
35
S 2.8 10–13
5.3 10–17
41
Ar 4.0 10–16
–
45
Ca – 5.6 10–17
54
Mn
– 1.1 10–13
55
Fe – 4.2 10–14
59
Fe
– 2.1 10–13
58
Co
– 4.2 10–14
60
Co
4.7 10–13
3.1 10–13
65
Zn 3.3 10–13
–
90
Sr – 1.9 10–15
90
Y – 9.9 10–17
95
Zr – 4.3 10–14
95
Nb – 1.1 10–14
106
Ru* – 8.6 10–14
124
Sb – 2.1 10–14
125
Sb* – 1.6 10–14
125m
Te – 2.6 10–14
134
Cs – 5.5 10–14
137
Cs*
1.2 10–12
3.7 10–14
144
Ce* – 1.1 10–14
144
Pr – 1.3 10–19
154
Eu – 1.4 10–13
155
Eu – 3.8 10–13
238
Pu* – 2.0 10–12
239
Pu* – 2.2 10–12
241
Pu* – 4.2 10–14
241
Am* – 8.4 10–13
242
Cm* – 7.1 10–14
243
Cm* – 9.3 10–13
244
Cm* – 7.3 10–13
Hinkley Point A 3H 4.3 10
–16 5.7 10
–19
14
C 6.9 10–14
–
35
S – 4.0 10–17
45
Ca – 4.1 10–17
54
Mn
– 1.0 10–14
55
Fe – 7.6 10–15
59
Fe – 2.7 10–14
58
Co – 3.7 10–15
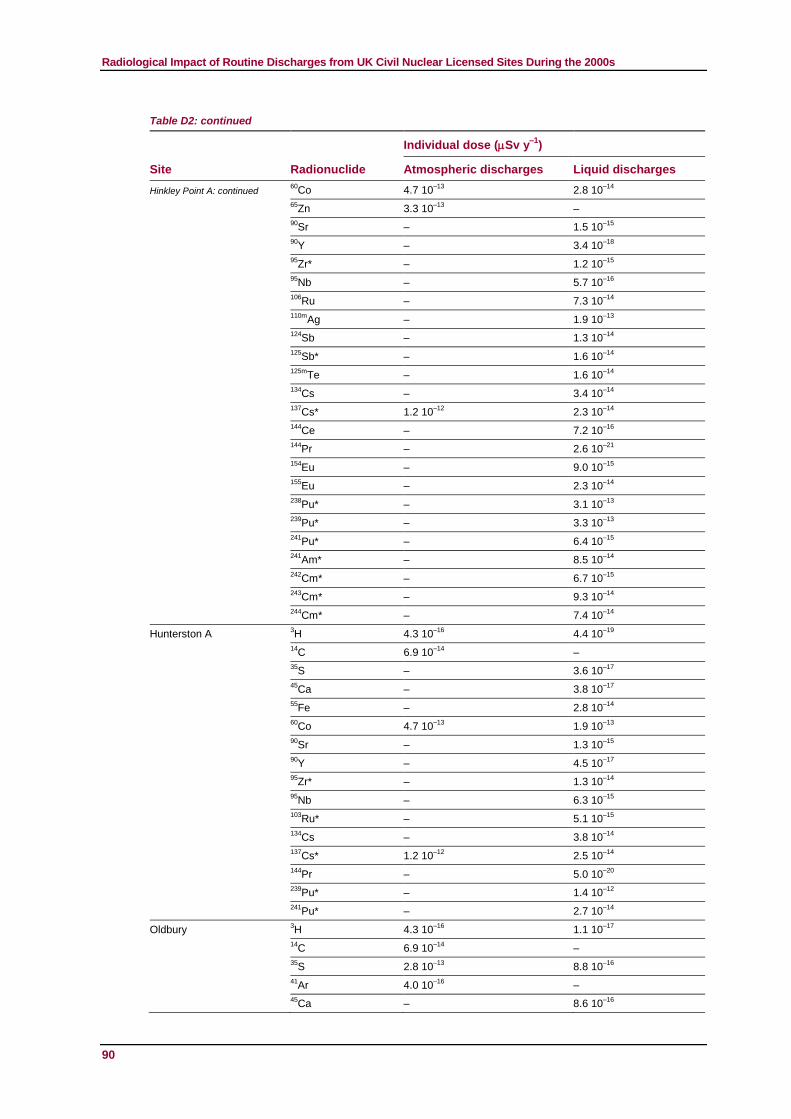
Radiological Impact of Routine Discharges from UK Civil Nuclear Licensed Sites During the 2000s
Table D2: continued
90
Site Radionuclide
Individual dose (Sv y–1
)
Atmospheric discharges Liquid discharges
Hinkley Point A: continued 60
Co
4.7 10–13
2.8 10–14
65
Zn 3.3 10–13
–
90
Sr – 1.5 10–15
90
Y – 3.4 10–18
95
Zr* – 1.2 10–15
95
Nb – 5.7 10–16
106
Ru – 7.3 10–14
110m
Ag – 1.9 10–13
124
Sb – 1.3 10–14
125
Sb* – 1.6 10–14
125m
Te – 1.6 10–14
134
Cs – 3.4 10–14
137
Cs*
1.2 10–12
2.3 10–14
144
Ce – 7.2 10–16
144
Pr – 2.6 10–21
154
Eu – 9.0 10–15
155
Eu – 2.3 10–14
238
Pu* – 3.1 10–13
239
Pu* – 3.3 10–13
241
Pu* – 6.4 10–15
241
Am* – 8.5 10–14
242
Cm* – 6.7 10–15
243
Cm* – 9.3 10–14
244
Cm* – 7.4 10–14
Hunterston A 3H 4.3 10
–16 4.4 10
–19
14
C 6.9 10–14
–
35
S
– 3.6 10–17
45
Ca – 3.8 10–17
55
Fe – 2.8 10–14
60
Co
4.7 10–13
1.9 10–13
90
Sr – 1.3 10–15
90
Y – 4.5 10–17
95
Zr* – 1.3 10–14
95
Nb – 6.3 10–15
103
Ru*
– 5.1 10–15
134
Cs – 3.8 10–14
137
Cs*
1.2 10–12
2.5 10–14
144
Pr
– 5.0 10–20
239
Pu* – 1.4 10–12
241
Pu* – 2.7 10–14
Oldbury 3H 4.3 10
–16 1.1 10
–17
14
C 6.9 10–14
–
35
S 2.8 10–13
8.8 10–16
41
Ar 4.0 10–16
–
45
Ca
– 8.6 10–16
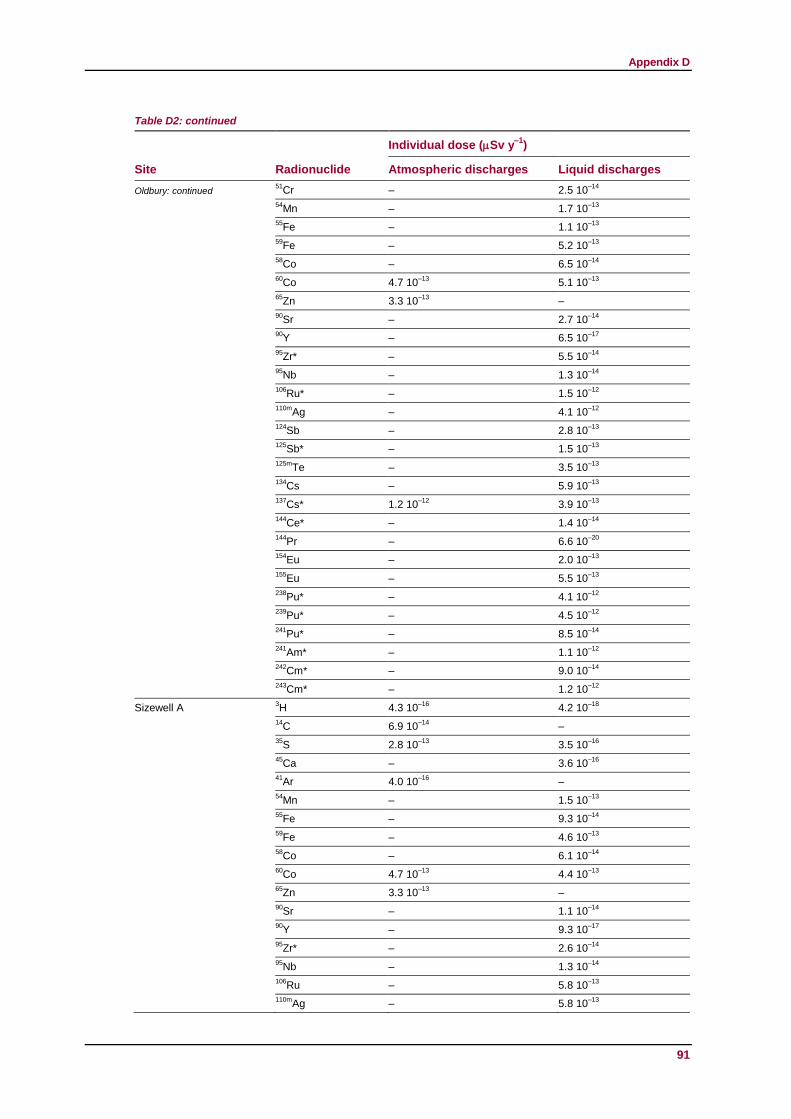
Appendix D
Table D2: continued
91
Site Radionuclide
Individual dose (Sv y–1
)
Atmospheric discharges Liquid discharges
Oldbury: continued 51
Cr
– 2.5 10–14
54
Mn
– 1.7 10–13
55
Fe
– 1.1 10–13
59
Fe
– 5.2 10–13
58
Co
– 6.5 10–14
60
Co
4.7 10–13
5.1 10–13
65
Zn 3.3 10–13
–
90
Sr
– 2.7 10–14
90
Y
– 6.5 10–17
95
Zr*
– 5.5 10–14
95
Nb
– 1.3 10–14
106
Ru*
– 1.5 10–12
110m
Ag
– 4.1 10–12
124
Sb
– 2.8 10–13
125
Sb* – 1.5 10–13
125m
Te – 3.5 10–13
134
Cs
– 5.9 10–13
137
Cs*
1.2 10–12
3.9 10–13
144
Ce* – 1.4 10–14
144
Pr – 6.6 10–20
154
Eu – 2.0 10–13
155
Eu – 5.5 10–13
238
Pu* – 4.1 10–12
239
Pu* – 4.5 10–12
241
Pu* – 8.5 10–14
241
Am* – 1.1 10–12
242
Cm* – 9.0 10–14
243
Cm* – 1.2 10–12
Sizewell A 3H 4.3 10
–16 4.2 10
–18
14
C 6.9 10–14
–
35
S 2.8 10–13
3.5 10–16
45
Ca
– 3.6 10–16
41
Ar 4.0 10–16
–
54
Mn
– 1.5 10–13
55
Fe
– 9.3 10–14
59
Fe – 4.6 10–13
58
Co – 6.1 10–14
60
Co
4.7 10–13
4.4 10–13
65
Zn 3.3 10–13
–
90
Sr – 1.1 10–14
90
Y – 9.3 10–17
95
Zr* – 2.6 10–14
95
Nb – 1.3 10–14
106
Ru – 5.8 10–13
110m
Ag – 5.8 10–13
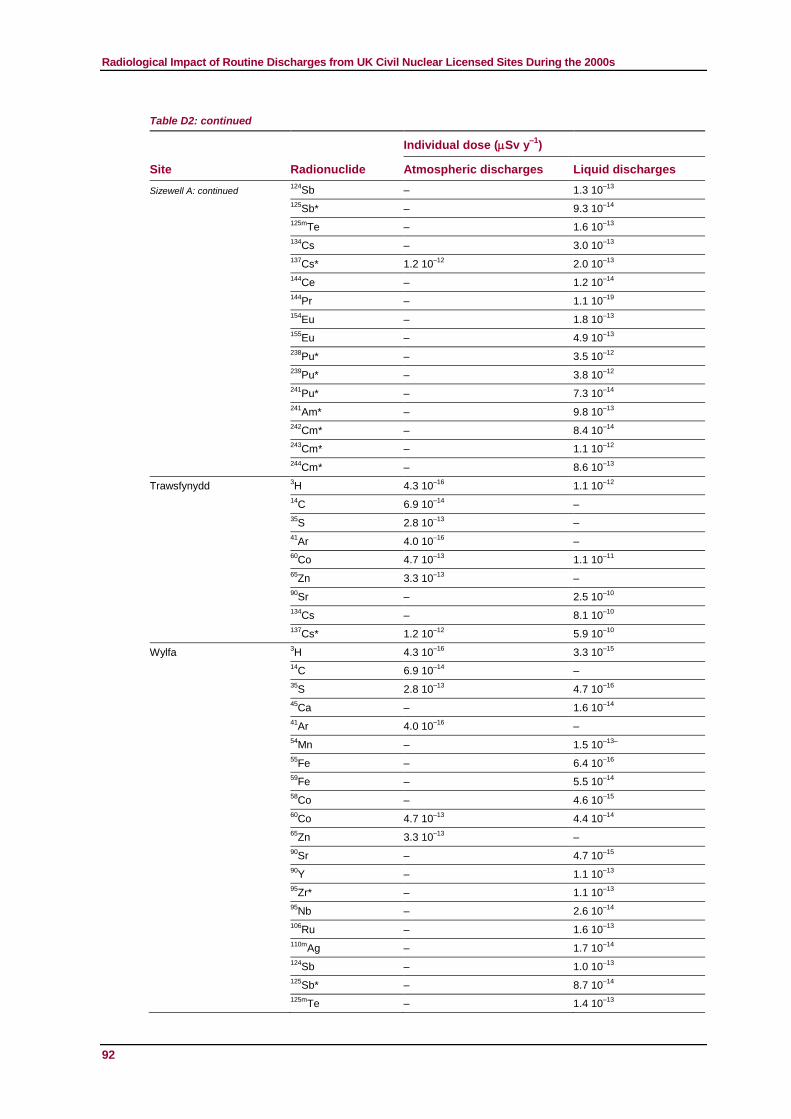
Radiological Impact of Routine Discharges from UK Civil Nuclear Licensed Sites During the 2000s
Table D2: continued
92
Site Radionuclide
Individual dose (Sv y–1
)
Atmospheric discharges Liquid discharges
Sizewell A: continued 124
Sb – 1.3 10–13
125
Sb* – 9.3 10–14
125m
Te
– 1.6 10–13
134
Cs – 3.0 10–13
137
Cs*
1.2 10–12
2.0 10–13
144
Ce – 1.2 10–14
144
Pr – 1.1 10–19
154
Eu – 1.8 10–13
155
Eu – 4.9 10–13
238
Pu* – 3.5 10–12
239
Pu* – 3.8 10–12
241
Pu* – 7.3 10–14
241
Am* – 9.8 10–13
242
Cm* – 8.4 10–14
243
Cm* – 1.1 10–12
244
Cm*
– 8.6 10–13
Trawsfynydd 3H 4.3 10
–16 1.1 10
–12
14
C 6.9 10–14
–
35
S 2.8 10–13
–
41
Ar 4.0 10–16
–
60
Co
4.7 10–13
1.1 10–11
65
Zn 3.3 10–13
–
90
Sr – 2.5 10–10
134
Cs
– 8.1 10–10
137
Cs*
1.2 10–12
5.9 10–10
Wylfa 3H 4.3 10
–16 3.3 10
–15
14
C 6.9 10–14
–
35
S 2.8 10–13
4.7 10–16
45
Ca
– 1.6 10–14
41
Ar 4.0 10–16
–
54
Mn – 1.5 10–13–
55
Fe – 6.4 10–16
59
Fe – 5.5 10–14
58
Co – 4.6 10–15
60
Co
4.7 10–13
4.4 10–14
65
Zn 3.3 10–13
–
90
Sr – 4.7 10–15
90
Y – 1.1 10–13
95
Zr*
– 1.1 10–13
95
Nb
– 2.6 10–14
106
Ru – 1.6 10–13
110m
Ag – 1.7 10–14
124
Sb
– 1.0 10–13
125
Sb*
– 8.7 10–14
125m
Te
– 1.4 10–13
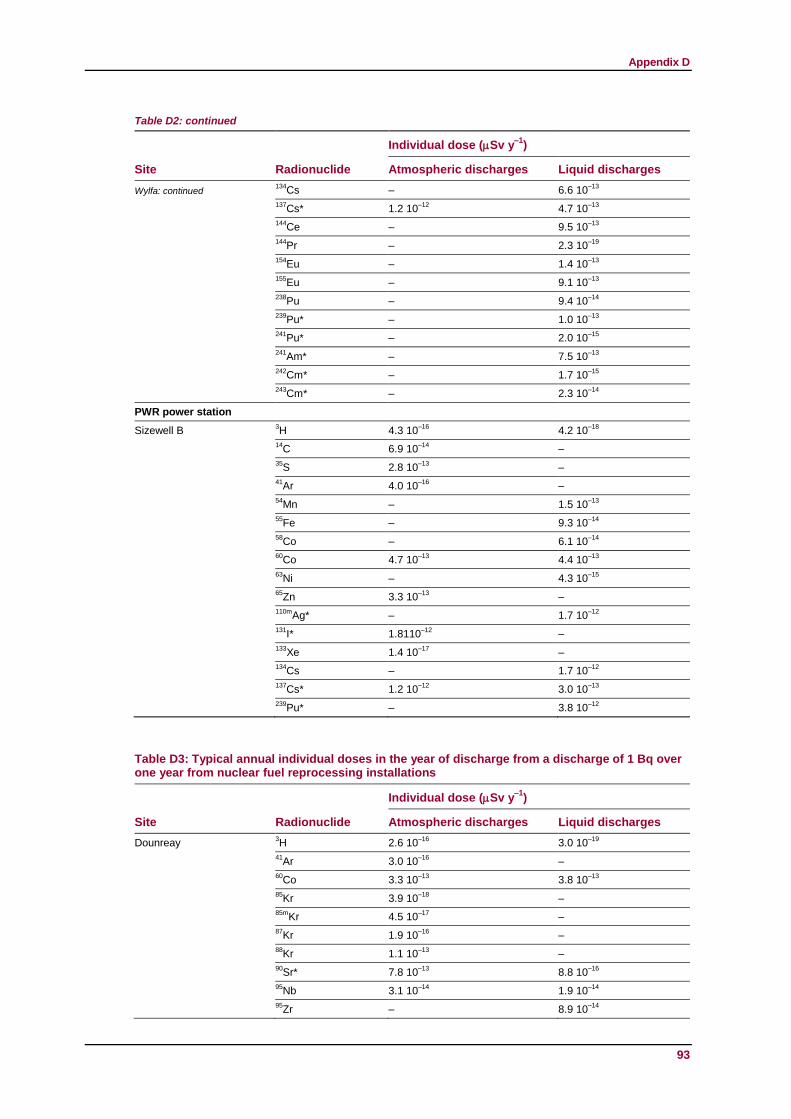
Appendix D
Table D2: continued
93
Site Radionuclide
Individual dose (Sv y–1
)
Atmospheric discharges Liquid discharges
Wylfa: continued 134
Cs – 6.6 10–13
137
Cs*
1.2 10–12
4.7 10–13
144
Ce – 9.5 10–13
144
Pr – 2.3 10–19
154
Eu – 1.4 10–13
155
Eu – 9.1 10–13
238
Pu – 9.4 10–14
239
Pu* – 1.0 10–13
241
Pu* – 2.0 10–15
241
Am* – 7.5 10–13
242
Cm* – 1.7 10–15
243
Cm* – 2.3 10–14
PWR power station
Sizewell B 3H 4.3 10
–16 4.2 10
–18
14
C 6.9 10–14
–
35
S 2.8 10–13
–
41
Ar 4.0 10–16
–
54
Mn
– 1.5 10–13
55
Fe
– 9.3 10–14
58
Co
– 6.1 10–14
60
Co
4.7 10–13
4.4 10–13
63
Ni
– 4.3 10–15
65
Zn 3.3 10–13
–
110m
Ag*
– 1.7 10–12
131
I* 1.8110–12
–
133
Xe
1.4 10–17
–
134
Cs – 1.7 10–12
137
Cs*
1.2 10–12
3.0 10–13
239
Pu*
– 3.8 10–12
Table D3: Typical annual individual doses in the year of discharge from a discharge of 1 Bq over one year from nuclear fuel reprocessing installations
Site Radionuclide
Individual dose (Sv y–1
)
Atmospheric discharges Liquid discharges
Dounreay 3H 2.6 10
–16 3.0 10
–19
41
Ar
3.0 10–16
–
60
Co 3.3 10–13
3.8 10–13
85
Kr 3.9 10–18
–
85m
Kr 4.5 10–17
–
87
Kr 1.9 10–16
–
88
Kr 1.1 10–13
–
90
Sr* 7.8 10–13
8.8 10–16
95
Nb 3.1 10–14
1.9 10–14
95
Zr
– 8.9 10–14
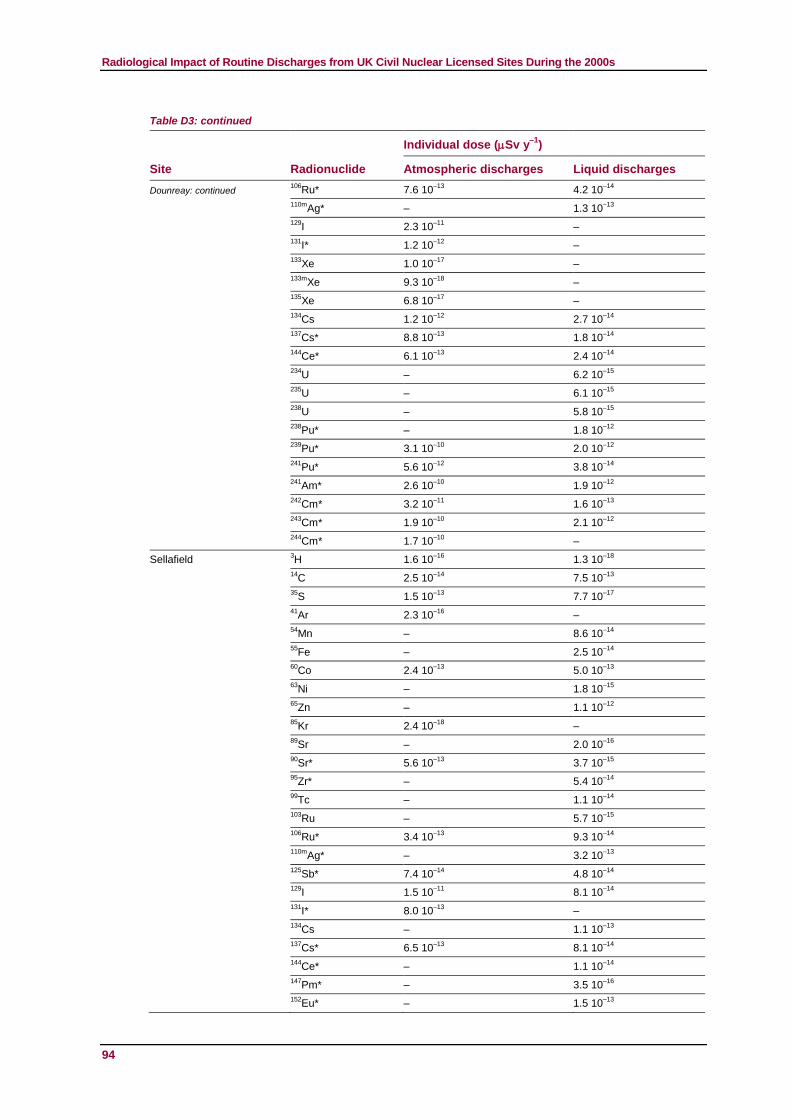
Radiological Impact of Routine Discharges from UK Civil Nuclear Licensed Sites During the 2000s
Table D3: continued
94
Site Radionuclide
Individual dose (Sv y–1
)
Atmospheric discharges Liquid discharges
Dounreay: continued 106
Ru* 7.6 10–13
4.2 10–14
110m
Ag*
– 1.3 10–13
129
I 2.3 10–11
–
131
I* 1.2 10–12
–
133
Xe 1.0 10–17
–
133m
Xe 9.3 10–18
–
135
Xe 6.8 10–17
–
134
Cs 1.2 10–12
2.7 10–14
137
Cs* 8.8 10–13
1.8 10–14
144
Ce* 6.1 10–13
2.4 10–14
234
U – 6.2 10–15
235
U – 6.1 10–15
238
U – 5.8 10–15
238
Pu* – 1.8 10–12
239
Pu* 3.1 10–10
2.0 10–12
241
Pu* 5.6 10–12
3.8 10–14
241
Am* 2.6 10–10
1.9 10–12
242
Cm* 3.2 10–11
1.6 10–13
243
Cm*
1.9 10–10
2.1 10–12
244
Cm* 1.7 10–10
–
Sellafield 3H 1.6 10
–16 1.3 10
–18
14
C 2.5 10–14
7.5 10–13
35
S 1.5 10–13
7.7 10–17
41
Ar 2.3 10–16
–
54
Mn
– 8.6 10–14
55
Fe
– 2.5 10–14
60
Co 2.4 10–13
5.0 10–13
63
Ni – 1.8 10–15
65
Zn – 1.1 10–12
85
Kr 2.4 10–18
–
89
Sr
– 2.0 10–16
90
Sr* 5.6 10–13
3.7 10–15
95
Zr* – 5.4 10–14
99
Tc – 1.1 10–14
103
Ru
– 5.7 10–15
106
Ru* 3.4 10–13
9.3 10–14
110m
Ag*
– 3.2 10–13
125
Sb* 7.4 10–14
4.8 10–14
129
I 1.5 10–11
8.1 10–14
131
I* 8.0 10–13
–
134
Cs
– 1.1 10–13
137
Cs* 6.5 10–13
8.1 10–14
144
Ce* – 1.1 10–14
147
Pm* – 3.5 10–16
152
Eu* – 1.5 10–13
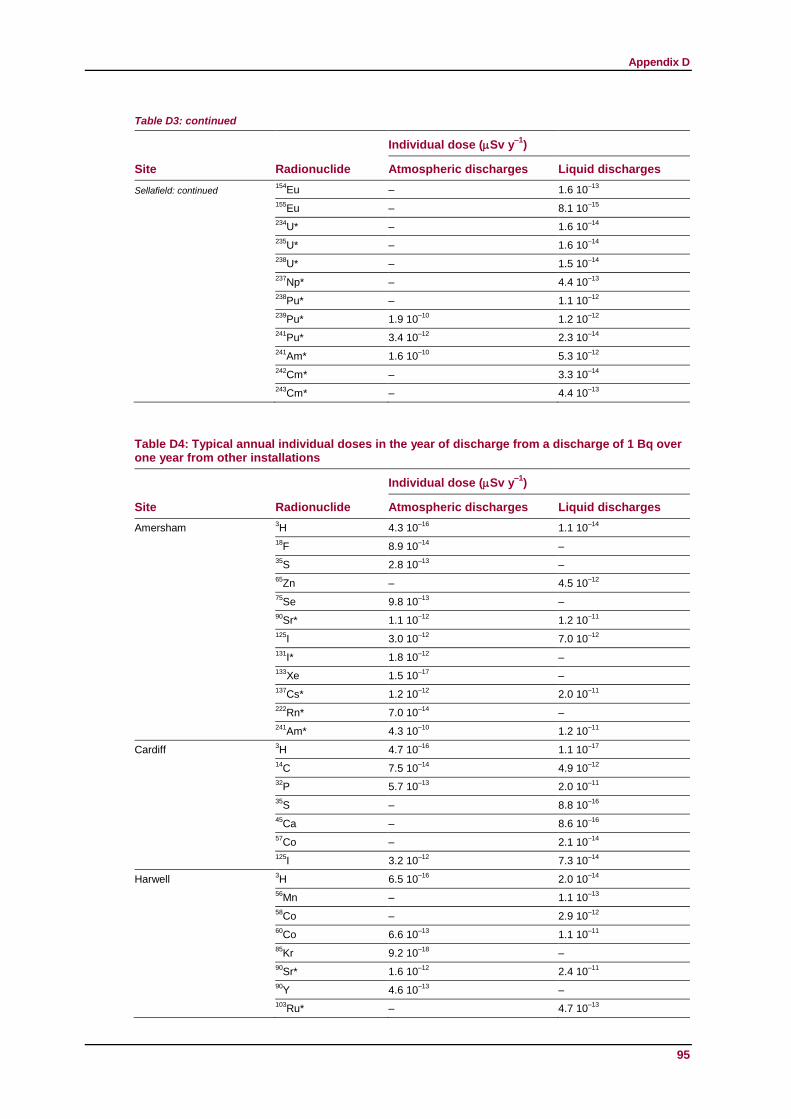
Appendix D
Table D3: continued
95
Site Radionuclide
Individual dose (Sv y–1
)
Atmospheric discharges Liquid discharges
Sellafield: continued 154
Eu – 1.6 10–13
155
Eu – 8.1 10–15
234
U* – 1.6 10–14
235
U* – 1.6 10–14
238
U* – 1.5 10–14
237
Np* – 4.4 10–13
238
Pu* – 1.1 10–12
239
Pu* 1.9 10–10
1.2 10–12
241
Pu* 3.4 10–12
2.3 10–14
241
Am* 1.6 10–10
5.3 10–12
242
Cm* – 3.3 10–14
243
Cm* – 4.4 10–13
Table D4: Typical annual individual doses in the year of discharge from a discharge of 1 Bq over one year from other installations
Site Radionuclide
Individual dose (Sv y–1
)
Atmospheric discharges Liquid discharges
Amersham 3H
4.3 10
–16 1.1 10
–14
18
F
8.9 10–14
–
35
S 2.8 10–13
–
65
Zn
– 4.5 10–12
75
Se 9.8 10–13
–
90
Sr* 1.1 10–12
1.2 10–11
125
I 3.0 10–12
7.0 10–12
131
I* 1.8 10–12
–
133
Xe
1.5 10–17
–
137
Cs* 1.2 10–12
2.0 10–11
222
Rn* 7.0 10–14
–
241
Am* 4.3 10–10
1.2 10–11
Cardiff 3H
4.7 10
–16 1.1 10
–17
14
C 7.5 10–14
4.9 10–12
32
P 5.7 10–13
2.0 10–11
35
S – 8.8 10–16
45
Ca – 8.6 10–16
57
Co – 2.1 10–14
125
I 3.2 10–12
7.3 10–14
Harwell 3H 6.5 10
–16 2.0 10
–14
56
Mn
– 1.1 10–13
58
Co
– 2.9 10–12
60
Co 6.6 10–13
1.1 10–11
85
Kr 9.2 10–18
–
90
Sr* 1.6 10–12
2.4 10–11
90
Y
4.6 10–13
–
103
Ru* – 4.7 10–13
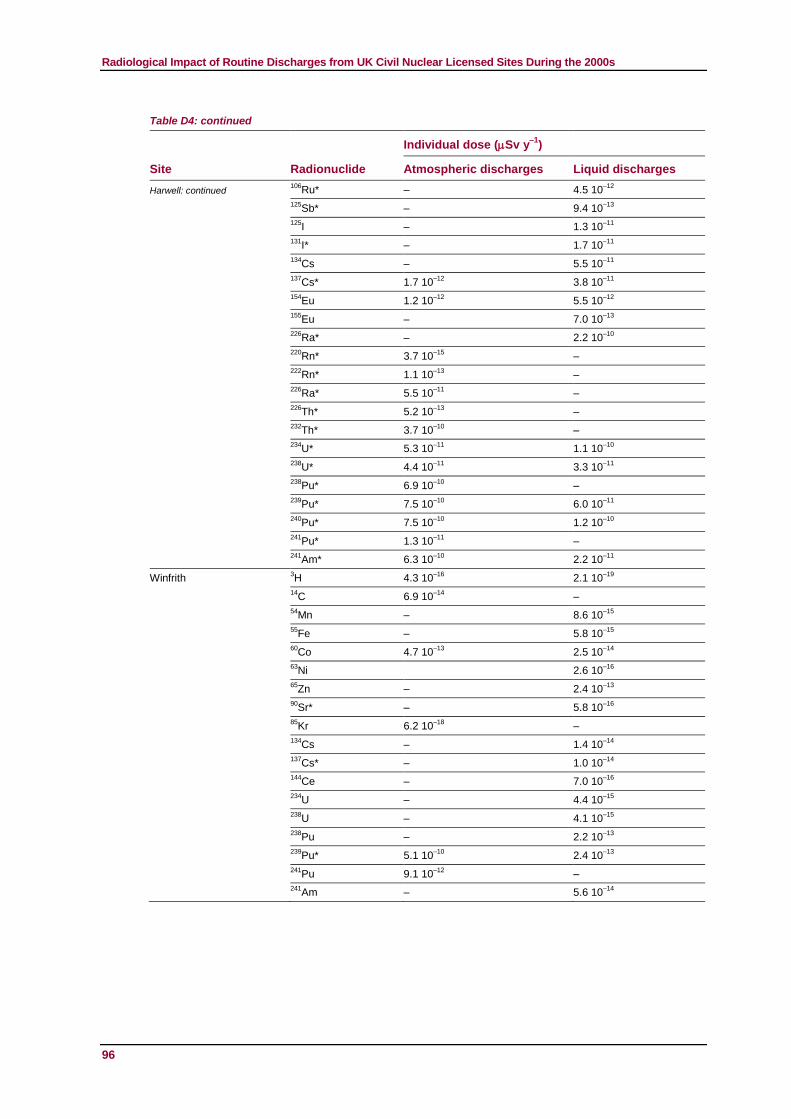
Radiological Impact of Routine Discharges from UK Civil Nuclear Licensed Sites During the 2000s
Table D4: continued
96
Site Radionuclide
Individual dose (Sv y–1
)
Atmospheric discharges Liquid discharges
Harwell: continued 106
Ru* – 4.5 10–12
125
Sb* – 9.4 10–13
125
I – 1.3 10–11
131
I* – 1.7 10–11
134
Cs – 5.5 10–11
137
Cs* 1.7 10–12
3.8 10–11
154
Eu 1.2 10–12
5.5 10–12
155
Eu – 7.0 10–13
226
Ra* – 2.2 10–10
220
Rn*
3.7 10–15
–
222
Rn*
1.1 10–13
–
226
Ra* 5.5 10–11
–
226
Th* 5.2 10–13
–
232
Th* 3.7 10–10
–
234
U* 5.3 10–11
1.1 10–10
238
U* 4.4 10–11
3.3 10–11
238
Pu* 6.9 10–10
–
239
Pu* 7.5 10–10
6.0 10–11
240
Pu* 7.5 10–10
1.2 10–10
241
Pu* 1.3 10–11
–
241
Am* 6.3 10–10
2.2 10–11
Winfrith 3H 4.3 10
–16 2.1 10
–19
14
C
6.9 10–14
–
54
Mn
– 8.6 10–15
55
Fe
– 5.8 10–15
60
Co 4.7 10–13
2.5 10–14
63
Ni
2.6 10–16
65
Zn – 2.4 10–13
90
Sr* – 5.8 10–16
85
Kr 6.2 10–18
–
134
Cs
– 1.4 10–14
137
Cs*
– 1.0 10–14
144
Ce
– 7.0 10–16
234
U
– 4.4 10–15
238
U – 4.1 10–15
238
Pu – 2.2 10–13
239
Pu* 5.1 10–10
2.4 10–13
241
Pu 9.1 10–12
–
241
Am
– 5.6 10–14