Radiologic clinics of norteamerica woman's oncology
295
Radiologic Clinics of North America Register or Login: Password: Auto-Login [ Reminder] Search for Advanced Search - MEDLINE - My Recent Searches - My Saved Searches - Search Tips CLINIC HOME CURRENT ISSUE PREVIOUS ISSUES SEARCH THIS CLINIC FORTHCOMING ISSUES CLINIC INFORMATION • Author Information • Abstracting/Indexing • Contact Information • Media Information • Permissions • Buy Back Issues RELATED SITES More periodicals: FIND A PERIODICAL FIND A PORTAL GO TO PRODUCT CATALOG Issue Alert me when new journal issues are available. Add TOC Alert May 2002 ( Vol. 40, Issue 3) View Selected Abstracts Display: Preface Women's imaging: an oncologic focus by Liberman L, Hricak H pages xi-xii Full Text | PDF (46 KB) Screening mammography: proven benefit, continued controversy by Lee CH pages 395-407 Full Text | PDF (138 KB) Breast imaging reporting and data system (BI-RADS) by Liberman L, Menell JH pages 409-430 Full Text | PDF (757 KB) Ultrasound for breast cancer screening and staging by Gordon PB pages 431-441 Full Text | PDF (278 KB) Breast cancer imaging with MRI by Morris EA pages 443-466 Full Text | PDF (912 KB) New modalities in breast imaging: digital mammography, positron emission tomography, and sestamibi scintimammography by Leung JWT pages 467-482 Full Text | PDF (425 KB) Percutaneous image-guided core breast biopsy by Liberman L pages 483-500 Full Text | PDF (526 KB) Breast imaging and the conservative treatment of breast cancer by Dershaw D D pages 501-516 Full Text | PDF (971 KB) Breast imaging: a breast surgeon's perspective by Van Zee KJ pages 517-520 Full Text | PDF (59 KB) What do we expect from imaging? by Barakat RR, Hricak H pages 521-526 Full Text | PDF (74 KB) file:///C|/temporal/Radiologic%20Clinics%20of%20North%20America%20MAYO%202002.html (1 de 2)07/03/2004 0:45:41
-
Upload
scu-hospital -
Category
Health & Medicine
-
view
27 -
download
3
Transcript of Radiologic clinics of norteamerica woman's oncology

Radiologic Clinics of North America
Register or Login: Password: Auto-Login [Reminder]
Search for
Advanced Search - MEDLINE - My Recent Searches - My Saved Searches - Search Tips
CLINIC HOME
CURRENT ISSUE
PREVIOUS ISSUES
SEARCH THIS CLINIC
FORTHCOMING ISSUES
CLINIC INFORMATION
• Author Information
• Abstracting/Indexing
• Contact Information
• Media Information
• Permissions
• Buy Back IssuesRELATED SITES
More periodicals:FIND A PERIODICAL
FIND A PORTAL
GO TO PRODUCT CATALOG
IssueAlert me when new journal issues are available. Add TOC Alert
May 2002 (Vol. 40, Issue 3)
View Selected Abstracts Display:
PrefaceWomen's imaging: an oncologic focusby Liberman L, Hricak Hpages xi-xiiFull Text | PDF (46 KB)Screening mammography: proven benefit, continued controversyby Lee CHpages 395-407Full Text | PDF (138 KB)Breast imaging reporting and data system (BI-RADS)by Liberman L, Menell JHpages 409-430Full Text | PDF (757 KB)Ultrasound for breast cancer screening and stagingby Gordon PBpages 431-441Full Text | PDF (278 KB)Breast cancer imaging with MRIby Morris EApages 443-466Full Text | PDF (912 KB)New modalities in breast imaging: digital mammography, positron emission tomography, and sestamibi scintimammographyby Leung JWTpages 467-482Full Text | PDF (425 KB)Percutaneous image-guided core breast biopsyby Liberman Lpages 483-500Full Text | PDF (526 KB)Breast imaging and the conservative treatment of breast cancerby Dershaw D Dpages 501-516Full Text | PDF (971 KB)Breast imaging: a breast surgeon's perspectiveby Van Zee KJpages 517-520Full Text | PDF (59 KB)What do we expect from imaging?by Barakat RR, Hricak Hpages 521-526Full Text | PDF (74 KB)
file:///C|/temporal/Radiologic%20Clinics%20of%20North%20America%20MAYO%202002.html (1 de 2)07/03/2004 0:45:41

Radiologic Clinics of North America
Postmenopausal bleeding: value of imagingby Reinhold C, Khalili Ipages 527-562Full Text | PDF (2137 KB)Imaging of cancer of the endometriumby Ascher SM, Reinhold Cpages 563-576Full Text | PDF (636 KB)Imaging of cancer of the cervixby Scheidler J, Heuck AFpages 577-590Full Text | PDF (719 KB)Detection and characterization of adnexal massesby Funt SA, Hann LEpages 591-608Full Text | PDF (866 KB)Staging ovarian cancer: role of imagingby Coakley FVpages 609-636Full Text | PDF (1664 KB)Imaging of the vagina and vulvaby Chang SDpages 637-658Full Text | PDF (1601 KB)Postsurgical pelvis: treatment follow-upby Sugimura K, Okizuka Hpages 659-680Full Text | PDF (1227 KB)Indexpages 681-687PDF (55 KB)View Selected Abstracts Display:
© 2004 Elsevier, Inc. | Privacy Policy | Terms & Conditions | Feedback | About Us | Help | Contact Us
file:///C|/temporal/Radiologic%20Clinics%20of%20North%20America%20MAYO%202002.html (2 de 2)07/03/2004 0:45:41

Preface
Women’s imaging: an oncologic focus
Laura Liberman, MD Hedvig Hricak, MD, PhD
Guest Editors
Advances in imaging technology have expanded
the radiologist’s role in detection, diagnosis, staging,
and follow-up of women with cancer. The American
Cancer Society estimates that there will be 647,400
new cases of cancer in women in the United States in
2002, of which over half will be cancers of the breast
or genital organs. Breast cancer will be diagnosed in
257,800 women (invasive in 203,500 and in situ in
54,300); an additional 81,400 women will be diag-
nosed with gynecologic malignancies. This issue of
the Radiologic Clinics of North America focuses on
the role of modern imaging techniques in treating
women with breast and gynecologic cancers.
Controversies remain regarding many aspects of
breast imaging. Does screening mammography reduce
breast cancer mortality? How useful is the stand-
ardized language used to describe mammograms?
Can other modalities such as ultrasound or MR
imaging supplement mammography in breast cancer
screening and staging? What is the role of digital
imaging and other new technologies? Articles
addressing these issues should be of value to radiol-
ogists and clinicians who refer women for screening
or diagnostic examinations of the breast.
The diagnosis and treatment of breast cancer
are often minimally invasive, with percutaneous
biopsy for diagnosis and breast conserving therapy.
How does one select the appropriate percutaneous
biopsy method, and which lesions warrant excision
after percutaneous biopsy? How does one track the
patient after breast conservation, to assess adequacy
of excision and diagnose recurrent disease? Analysis
of these issues should be of use to practitioners. Close
coordination is necessary between the radiologist and
clinicians caring for the patient, as illustrated in the
article on the role of breast imaging from the per-
spective of a dedicated breast surgeon.
The articles on imaging gynecologic cancers brief
the reader on what clinicians expect to learn from
imaging and provide insight into the imaging findings
and staging of these neoplasms. Interpretation of
imaging studies of the pelvis after surgery, a complex
subject, is addressed in a separate article. An array of
cross-sectional imaging modalities is now available;
information regarding the appropriate use of ultra-
sound, CT, and MR imaging should provide guidance
for the reader.
Cancer is the leading cause of death in American
women age 40 to 79. The American Cancer Society
estimates that there will be 267,300 deaths in women
due to cancer in the United States in 2002, of which
approximately one-fourth will be due to breast or
gynecologic cancers. They project 39,600 deaths
from breast cancer and 26,200 from gynecologic
cancers. We hope that this issue of the Radiologic
Clinics provides information that will be valuable to
0033-8389/02/$ – see front matter D 2002, Elsevier Science (USA). All rights reserved.
PII: S0033 -8389 (02 )00016 -7
Radiol Clin N Am 40 (2002) xi–xii

colleagues in all specialties who share the goal of
improving the outcome and quality of life for women
with breast and gynecologic cancers. We are grateful
to our contributors for their scholarly work, and to
Barton Dudlick and the WB Saunders staff for their
invaluable support.
Laura Liberman, MD
Hedvig Hricak, MD, PhD
Department of Radiology
Memorial Sloan-Kettering Cancer Center
1275 York Avenue
New York, NY 10021, USA
Preface / Radiol Clin N Am 40 (2002) xi–xiixii

Screening mammography: proven benefit,
continued controversy
Carol H. Lee, MD
Department of Diagnostic Radiology, Yale University School of Medicine, PO Box 208042, New Haven, CT 06520, USA
Breast cancer is the most frequently diagnosed
malignancy among American women, accounting
for 32% of all cancers in this population [1]. It is the
second leading cause of cancer death (after lung can-
cer) among women of all ages and the leading cause of
cancer death among women aged 40 to 59 years [1].
Mammography has been shown to be efficacious in
detecting breast cancer before it becomes clinically
evident [2], and screening of asymptomatic women
has become widespread as a means of achieving early
detection. Routine screening with mammography
is now generally accepted as a valuable tool for de-
creasing mortality from breast cancer.
The use of screening mammography has not been
without controversy, however. Although the role of
screening mammography in reducing breast cancer
mortality is widely accepted, continuing areas of con-
troversy include lack of consensus as to the age at
which regular screening should start, the age at which
screening should stop, the appropriate interval be-
tween screenings, and the value of screening young
women at high risk. In addition, much attention
has been paid recently to the so-called risks of
screening mammography, which include observer var-
iability in interpretation and false-negative and false-
positive readings.
Proven benefit of screening mammography
Evidence for the benefit of screening mammog-
raphy in reducing mortality from breast cancer largely
derives from several large randomized controlled
trials (RCTs) conducted in North America and
Europe beginning in the 1960s and involving a
combined total of nearly 500,000 women [3–7].
These studies varied greatly in terms of study design.
Most enrolled women as young as age 40, whereas
others used 45 or 50 years as the lower age limit.
Some performed two-view mammograms and others
a single view. The screening interval varied from 12
to 33 months, and the number of rounds of screening
ranged from 2 to 6. Some included clinical breast
examination in the screening process. Despite the
varying research designs, meta-analysis of the results
from these studies has shown a statistically signifi-
cant reduction in mortality from breast cancer on the
order of 25% to 30% among screened groups com-
pared with controls after 5 to 7 years [8]. The results
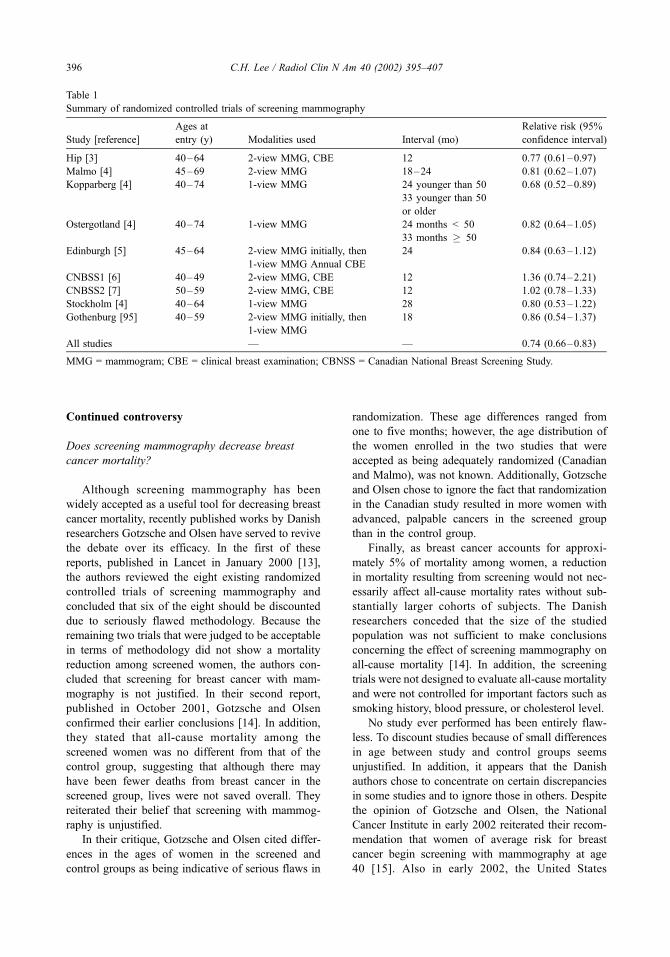
of the RCTs are summarized in Table 1. Based on the
results of these trials, routine mammography has
become established as a valuable screening tool for
breast cancer detection.
In addition to decreasing mortality from breast
cancer, the use of screening mammography has been
shown to result in the diagnosis of smaller and more
node-negative tumors [9,10]. In a recent update of the
experience of the Swedish two-county screening trial,
Tabar et al [11] reported that 50% of screen-detected
cancers were in the good prognostic category (gen-
erally stage 0 or 1, depending on histologic type)
as opposed to 19% in the clinically detected group.
For the woman whose cancer is detected by mam-
mography before it becomes palpable, this translates
into less aggressive therapy options—lumpectomy
followed by radiation therapy rather than mas-
tectomy and decreased need for systemic chemo-
therapy [9].
0033-8389/02/$ – see front matter D 2002, Elsevier Science (USA). All rights reserved.
PII: S0033 -8389 (01 )00015 -X
E-mail address: [email protected] (C.H. Lee).
Radiol Clin N Am 40 (2002) 395–407
Continued controversy
Does screening mammography decrease breast
cancer mortality?
Although screening mammography has been
widely accepted as a useful tool for decreasing breast
cancer mortality, recently published works by Danish
researchers Gotzsche and Olsen have served to revive
the debate over its efficacy. In the first of these
reports, published in Lancet in January 2000 [13],
the authors reviewed the eight existing randomized
controlled trials of screening mammography and
concluded that six of the eight should be discounted
due to seriously flawed methodology. Because the
remaining two trials that were judged to be acceptable
in terms of methodology did not show a mortality
reduction among screened women, the authors con-
cluded that screening for breast cancer with mam-
mography is not justified. In their second report,
published in October 2001, Gotzsche and Olsen
confirmed their earlier conclusions [14]. In addition,
they stated that all-cause mortality among the
screened women was no different from that of the
control group, suggesting that although there may
have been fewer deaths from breast cancer in the
screened group, lives were not saved overall. They
reiterated their belief that screening with mammog-
raphy is unjustified.
In their critique, Gotzsche and Olsen cited differ-
ences in the ages of women in the screened and
control groups as being indicative of serious flaws in
randomization. These age differences ranged from
one to five months; however, the age distribution of
the women enrolled in the two studies that were
accepted as being adequately randomized (Canadian
and Malmo), was not known. Additionally, Gotzsche
and Olsen chose to ignore the fact that randomization
in the Canadian study resulted in more women with
advanced, palpable cancers in the screened group
than in the control group.
Finally, as breast cancer accounts for approxi-
mately 5% of mortality among women, a reduction
in mortality resulting from screening would not nec-
essarily affect all-cause mortality rates without sub-
stantially larger cohorts of subjects. The Danish
researchers conceded that the size of the studied
population was not sufficient to make conclusions
concerning the effect of screening mammography on
all-cause mortality [14]. In addition, the screening
trials were not designed to evaluate all-cause mortality
and were not controlled for important factors such as
smoking history, blood pressure, or cholesterol level.
No study ever performed has been entirely flaw-
less. To discount studies because of small differences
in age between study and control groups seems
unjustified. In addition, it appears that the Danish
authors chose to concentrate on certain discrepancies
in some studies and to ignore those in others. Despite
the opinion of Gotzsche and Olsen, the National
Cancer Institute in early 2002 reiterated their recom-
mendation that women of average risk for breast
cancer begin screening with mammography at age
40 [15]. Also in early 2002, the United States
Table 1
Summary of randomized controlled trials of screening mammography
Study [reference]
Ages at
entry (y) Modalities used Interval (mo)
Relative risk (95%
confidence interval)
Hip [3] 40–64 2-view MMG, CBE 12 0.77 (0.61–0.97)
Malmo [4] 45–69 2-view MMG 18–24 0.81 (0.62–1.07)
Kopparberg [4] 40–74 1-view MMG 24 younger than 50 0.68 (0.52–0.89)
33 younger than 50
or older
Ostergotland [4] 40–74 1-view MMG 24 months < 50 0.82 (0.64–1.05)
33 months � 50
Edinburgh [5] 45–64 2-view MMG initially, then
1-view MMG Annual CBE
24 0.84 (0.63–1.12)
CNBSS1 [6] 40–49 2-view MMG, CBE 12 1.36 (0.74–2.21)
CNBSS2 [7] 50–59 2-view MMG, CBE 12 1.02 (0.78–1.33)
Stockholm [4] 40–64 1-view MMG 28 0.80 (0.53–1.22)
Gothenburg [95] 40–59 2-view MMG initially, then
1-view MMG
18 0.86 (0.54–1.37)
All studies — — 0.74 (0.66–0.83)
MMG = mammogram; CBE = clinical breast examination; CBNSS = Canadian National Breast Screening Study.
C.H. Lee / Radiol Clin N Am 40 (2002) 395–407396
Preventive Services Task Force, a respected panel of
experts who issue guidelines for preventive health
measures based on review of available evidence,
reviewed the same studies as the Danish researchers
and actually lowered their recommendation for when
regular screening with mammography should start
from age 50 to age 40 [16].
What should be remembered in the controversy
surrounding the efficacy of screening mammography
is that mortality from breast cancer in the United
States has been decreasing steadily in recent years
[17,18]. Although some of this decrease may be
related to improvements in treatment, it is difficult
to believe that some of the decrease is not related to
earlier detection. Mammography remains the single
most valuable tool for achieving early detection of
breast cancer.
At what age should screening begin?
A continued point of controversy surrounding
screening mammography centers on the age at which
regular screening should begin. The debate over this
point has been heated and sometimes acrimonious on
both sides. The controversy stems from the finding of
the RCTs that mortality reduction for women in their
40s was less than that of women aged 50 and older
and that the benefits, if any, did not reach statistical
significance after 7 to 9 years of follow-up [8].
Possible explanations as to why screening may
not be as effective for younger women include the
fact that breast density is generally greater in younger
women and breast cancer may be obscured by over-
lying dense tissue [19]. Therefore, the sensitivity of
mammography may not be as high as in older women
with less dense breasts. In addition, tumor biology
may be a factor because tumors in younger women
tend to be faster growing [20]. Therefore, early
detection may not lead to decreased mortality because
these tumors may already have spread by the time
they are found by mammography.
Another argument against routine screening of
women in their 40s relates to cost. Because the
incidence of breast cancer is lower in younger women,
a greater number must be screened to detect one
cancer. One study of cost-effectiveness by Salzmann
et al [21] reported that the incremental cost-effective-
ness of screening women aged 40 to 49 years was
nearly five times that of screening women aged 50 to
69 years ($105,000 per year of life saved compared to
$21,400). However, Rosenquist and Lindfors [22]
used a Markov model to compare the relative cost-
effectiveness of four different age-related screening
strategies. They found that screening women aged 40
to 79 years at differing intervals would result in
marginal cost per year of life saved of $18,800 for
the most expensive strategy (annually from age 40) to
$16,100 for the least expensive (annually for 40 to
49 years, biennially from 50 to 79 years). These costs
are well within the range of cost generally accepted as
reasonable for life-saving interventions [23].
Evidence in favor of using mammography to
screen women in their 40s include the fact that
mammography has been shown to be efficacious in
detecting small, early-stage tumors in this age group
[24,25]. In addition, several series have reported no
statistically significant difference in size, stage, or
lymph node status among invasive cancers detected
by screening mammography in women aged 40 to 49
compared to women aged 50 to 64 years [10,26–29],
suggesting that screening in the younger age group
should be as efficacious as that observed in older
women. Finally, the proportion of screening detected
cancers that are ductal carcinoma in situ (DCIS) in
women 40 to 49 years of age is significantly higher
than it is in older women [30,31]. DCIS has been
reported to account for 37% to 47% of all screen-
detected cancers among women aged 40 to 49 com-
pared with 21% to 37% in women older than 50
[26,31,32].
The increased detection of DCIS has been cited as
an advantage and a disadvantage to screening of
younger women [30,31]. DCIS is primarily detected
through mammography. With the increased use of
screening, the incidence of DCIS has risen to account
for nearly 15% of all breast cancers, up from 3% to
4% in the 1970s and early 1980s [32]. What is
controversial about DCIS is how often it progresses
in the absence of treatment to become invasive
cancer. Several autopsy series in which women died
of causes other that breast cancer have reportedly
shown an incidence of occult DCIS between 0.2%
and 14%, which is higher than the incidence of breast
cancer diagnosed in the general population [33–36].
This has been cited as evidence that DCIS may not
progress to invasive disease [30]. Studies of women
in whom breast biopsy specimens were initially
interpreted as benign but later were classified as
DCIS and who were not treated further have shown
subsequent development of invasive disease in 20%
to 60% after prolonged follow-up [37–40].
Because it is impossible to determine which cases
of DCIS will progress to become invasive if untreated
and which will not, nearly all cases of DCIS are
treated aggressively with lumpectomy, usually com-
bined with radiation, or with mastectomy. It has been
argued that many women, particularly younger
women in whom DCIS is more likely to be diagnosed,
C.H. Lee / Radiol Clin N Am 40 (2002) 395–407 397

undergo treatment that may be unnecessary. This
argument ignores the fact that occult DCIS uncovered
at autopsy may be a different disease from that
detectable mammographically. Similarly, the women
in whom DCIS was treated by biopsy alone had small,
low-grade tumors that were initially considered
benign. None had the comedo form of DCIS. The
solution to possible overtreatment of some patients
with DCIS is the development of ways to distinguish
those cases that will progress to invasive disease from
those that will not rather than to stop diagnosing DCIS
by avoidance of screening mammography.
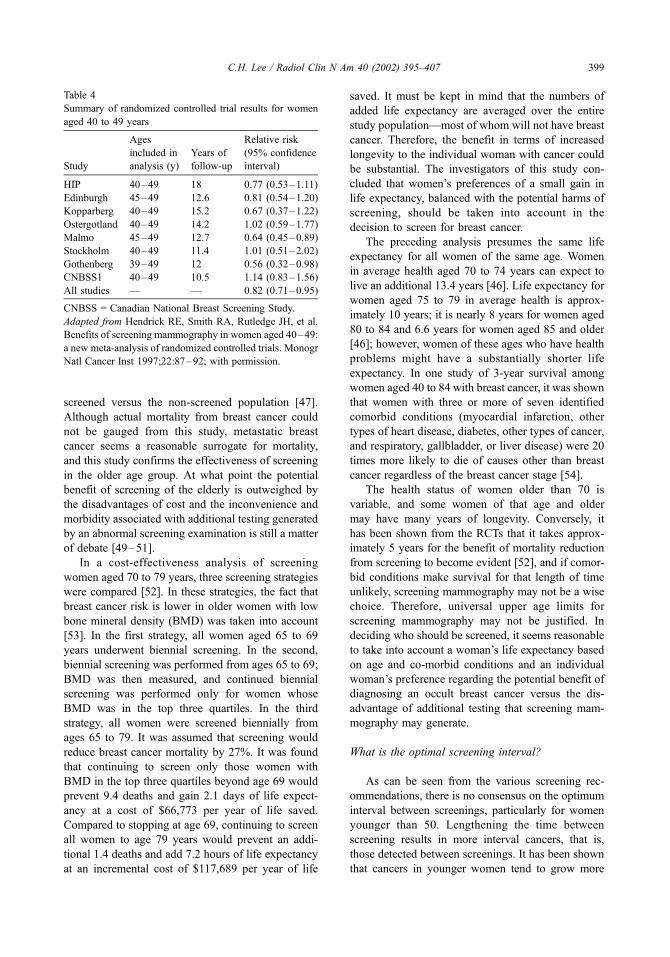
Finally, in the most recent meta-analyses of the
RCTs specifically concerning the 40- to 49-year-old
age group, statistically significant reductions in breast
cancer mortality were found [40,41]. In one of these
analyses, an 18% reduction in mortality was found
after an average of 12.7 years of follow-up [40]. In the
second, a 16% mortality reduction was observed after
10 to 14 years of follow-up [41]. Despite these results,
controversy remains. Summaries of guidelines for
screening mammography of various medical organi-
zations in the United States are presented in Table 2,
and national policy concerning screening mammogra-
phy of several foreign countries is outlined in Table 3.
When should screening stop?
Although there has been much debate about when
regular screening mammography should start, rel-
atively little attention has been paid to when it should
end. Only 2 of 8 large RCTs examining screening
efficacy included women older than 69, and the
number of women 70 and older included in these
trials is insufficient to make meaningful conclusions
as to the value of mammographic screening in this age
group. Despite the lack of information, and perhaps
because of it, most guidelines for mammographic
screening issued by professional societies in the
United States do not specify an age limit after which
screening should cease (Table 4). The recommended
upper age limit for screening in several foreign coun-
tries ranges from 59 to 74 years [45] (see Table 3).
The incidence of breast cancer in the United States
increases until approximately age 80 and plateaus
thereafter [46]. Nearly half of all cases of breast
cancer diagnosed annually occur in women aged 65
and older [47]. It has been shown that the sensitivity
and positive predictive value of mammography in
diagnosing breast cancer increases with increasing
age [24,32,48]; therefore, mammography would be
expected to be of benefit to older women. In a recently
reported retrospective cohort study of more than
690,000 women aged 66 to 79 years, the incidence
of metastatic breast cancer was reduced by 43% in the
Table 2
Current screening mammography guidelines of professional organizations in the United States
Organization
Age at which screening
should begin (y) Upper age limit Interval
American Cancer Society [42] 40 None Yearly
American College of Obstetricians
and Gynecologists [43]
40 None Every 1–2 y,
ages 40–49
Yearly starting
at age 50
American College of Radiology [44] 40 None Yearly
National Cancer Institute [15] 40 None Every 1–2 y
United States Preventive Services Task Force [16] 50 None Every 1–2 y
Based on women at average risk for breast cancer.
Table 3
Screening mammography guidelines in foreign countries
Country
Lower age
limit (y)
Upper age
limit (y) Interval
Australia 40 69 Every 2 y
Denmark 50 69 Every 2 y
Finland 50 59 Every 2 y
France 50 65–69 Every 2–3 y
Hungary 50 64 Yearly
Israel 50 74 Every 2 y
Italy 50 69 Every 2 y
Japan 30 None Yearly
The Netherlands 50 69 Every 2 y
Sweden 40–50a 64–74a Every 18 mos
for ages 40–49,
Every 2 y for 50
and older
United Kingdom 50 64 Every 3 y
Adapted from Shapiro S, Coleman EA, Broeders M, et al.
Breast cancer screening program in 22 countries: current
policies, administration and guidelines. Int J Epidemiol
1998;27:735–742; with permission.a Recommended ages for screening decided by each
county.
C.H. Lee / Radiol Clin N Am 40 (2002) 395–407398
screened versus the non-screened population [47].
Although actual mortality from breast cancer could
not be gauged from this study, metastatic breast
cancer seems a reasonable surrogate for mortality,
and this study confirms the effectiveness of screening
in the older age group. At what point the potential
benefit of screening of the elderly is outweighed by
the disadvantages of cost and the inconvenience and
morbidity associated with additional testing generated
by an abnormal screening examination is still a matter
of debate [49–51].
In a cost-effectiveness analysis of screening
women aged 70 to 79 years, three screening strategies
were compared [52]. In these strategies, the fact that
breast cancer risk is lower in older women with low
bone mineral density (BMD) was taken into account
[53]. In the first strategy, all women aged 65 to 69
years underwent biennial screening. In the second,
biennial screening was performed from ages 65 to 69;
BMD was then measured, and continued biennial
screening was performed only for women whose
BMD was in the top three quartiles. In the third
strategy, all women were screened biennially from
ages 65 to 79. It was assumed that screening would
reduce breast cancer mortality by 27%. It was found
that continuing to screen only those women with
BMD in the top three quartiles beyond age 69 would
prevent 9.4 deaths and gain 2.1 days of life expect-
ancy at a cost of $66,773 per year of life saved.
Compared to stopping at age 69, continuing to screen
all women to age 79 years would prevent an addi-
tional 1.4 deaths and add 7.2 hours of life expectancy
at an incremental cost of $117,689 per year of life
saved. It must be kept in mind that the numbers of
added life expectancy are averaged over the entire
study population—most of whom will not have breast
cancer. Therefore, the benefit in terms of increased
longevity to the individual woman with cancer could
be substantial. The investigators of this study con-
cluded that women’s preferences of a small gain in
life expectancy, balanced with the potential harms of
screening, should be taken into account in the
decision to screen for breast cancer.
The preceding analysis presumes the same life
expectancy for all women of the same age. Women
in average health aged 70 to 74 years can expect to
live an additional 13.4 years [46]. Life expectancy for
women aged 75 to 79 in average health is approx-
imately 10 years; it is nearly 8 years for women aged
80 to 84 and 6.6 years for women aged 85 and older
[46]; however, women of these ages who have health
problems might have a substantially shorter life
expectancy. In one study of 3-year survival among
women aged 40 to 84 with breast cancer, it was shown
that women with three or more of seven identified
comorbid conditions (myocardial infarction, other
types of heart disease, diabetes, other types of cancer,
and respiratory, gallbladder, or liver disease) were 20
times more likely to die of causes other than breast
cancer regardless of the breast cancer stage [54].
The health status of women older than 70 is
variable, and some women of that age and older
may have many years of longevity. Conversely, it
has been shown from the RCTs that it takes approx-
imately 5 years for the benefit of mortality reduction
from screening to become evident [52], and if comor-
bid conditions make survival for that length of time
unlikely, screening mammography may not be a wise
choice. Therefore, universal upper age limits for
screening mammography may not be justified. In
deciding who should be screened, it seems reasonable
to take into account a woman’s life expectancy based
on age and co-morbid conditions and an individual
woman’s preference regarding the potential benefit of
diagnosing an occult breast cancer versus the dis-
advantage of additional testing that screening mam-
mography may generate.
What is the optimal screening interval?
As can be seen from the various screening rec-
ommendations, there is no consensus on the optimum
interval between screenings, particularly for women
younger than 50. Lengthening the time between
screening results in more interval cancers, that is,
those detected between screenings. It has been shown
that cancers in younger women tend to grow more
Table 4
Summary of randomized controlled trial results for women
aged 40 to 49 years
Study
Ages
included in
analysis (y)
Years of
follow-up
Relative risk
(95% confidence
interval)
HIP 40–49 18 0.77 (0.53–1.11)
Edinburgh 45–49 12.6 0.81 (0.54–1.20)
Kopparberg 40–49 15.2 0.67 (0.37–1.22)
Ostergotland 40–49 14.2 1.02 (0.59–1.77)
Malmo 45–49 12.7 0.64 (0.45–0.89)
Stockholm 40–49 11.4 1.01 (0.51–2.02)
Gothenberg 39–49 12 0.56 (0.32–0.98)
CNBSS1 40–49 10.5 1.14 (0.83–1.56)
All studies — — 0.82 (0.71–0.95)
CNBSS = Canadian National Breast Screening Study.
Adapted from Hendrick RE, Smith RA, Rutledge JH, et al.
Benefits of screening mammography in women aged 40–49:
a new meta-analysis of randomized controlled trials. Monogr
Natl Cancer Inst 1997;22:87–92; with permission.
C.H. Lee / Radiol Clin N Am 40 (2002) 395–407 399
rapidly than cancers in older women [20]. Therefore,
it is postulated that the screening interval in the RCTs,
which was generally 18 to 24 months, was too long to
allow early detection of faster growing tumors,
thereby decreasing the realized benefit from screen-
ing in the 40-to 49-year age group [55,56].
It has also been shown that interval cancers are
more likely to be of higher nuclear grade and, in
women in their 40s, less likely to be small and node-
negative than screen-detected cancers [56]. Finally, in
a study of the sensitivity of first screening mammog-
raphy as a function of age and breast density, Kerli-
kowski et al [32] reported that the sensitivity of
screening mammography decreased from 83% to
71% when the interval from a previously normal
mammogram increased from 13 to 25 months. Sur-
prisingly, in their series, breast density in women aged
40 to 49 years did not significantly affect sensitivity of
screening mammography. In a study of screening
mammography in women aged 65 and older, it was
found that annual screening diagnosed tumors that
were significantly smaller and of lower stage than did
biennial screening [57]. These data argue for a shorter
(ie, 12-month) rather than longer screening intervals,
particularly for younger women.
Screening of high-risk women younger than 40
For young women who are at high risk for breast
cancer because of a history of breast cancer or a
biopsy-proven diagnosis of lobular carcinoma in situ,
annual mammography begins after the diagnosis is
made. Controversy remains regarding screening
guidelines for other young women at increased risk
for breast cancer, including those with a significant
family history of breast cancer, those who have
mutations for the BRCA-1 or BRCA-2 gene, and
women with a history of Hodgkin’s disease treated
with radiation.
Women who have a first-degree relative with
breast cancer are at approximately twice the risk of
women who do not [58]. This risk increases with
the number of first-degree relatives affected and
with decreasing age at diagnosis in the relative
[58]. For carriers of the BRCA-1 mutation, the risk
for breast cancer has been reported to be approxi-
mately 3% by age 30, 19% by age 40, 50% by age
50, 54% by age 60, and 85% by age 70 [59].
The risk for women with the BRCA-2 gene is similar
[60]. Unfortunately, no data on the efficacy of
screening these high-risk women with mammo-
graphy exist. Because there is such a high risk at
a relatively young age, however, many experts re-
commend that regular screening with breast self-
examination, clinical breast examination, and annual
mammography begin at an early age [61–64].
A survey was performed of 16 clinics run by the
European Familial Breast Cancer Collaborative
Group in 9 European countries (Denmark, Finland,
France, Germany, Italy, The Netherlands, Norway,
Sweden, and the United Kingdom) to determine
recommended surveillance protocols for women at
high risk [65]. Fourteen of the 16 recommended that
surveillance be performed for women with a lifetime
risk for breast cancer that was more than double that
of the general population. All 16 centers recom-
mended that for women at high risk, regular mam-
mography be performed, but the age at which
screening with mammography should begin varied
from 25 to 35 years. In six centers, the recommenda-
tion was for screening to start 5 years before the
earliest age of breast cancer diagnosis in the family.
There was similar disagreement among the centers
as to the recommended interval for screening (1 or
2 years). In the United States in 1997, a consensus
statement concerning recommendations for surveil-
lance of women with BRCA-1 and BRCA-2 mutations
was issued by a task force convened by the Cancer
Genetics Studies Consortium [61]. They recom-
mended annual mammography screening of this
population beginning at age 25 to 35 years. They
cautioned, however, that this recommendation was
based on expert opinion only and that the risks and
benefits of annual mammography in women younger
than 50 has not been proved. Those who disagreed
with this consensus recommendation cited the pos-
sibility of increased radiation risk in women with the
BRCA-1 and BRCA-2 mutations because of impaired
DNA repair capabilities [66,67].
In Canada and the United Kingdom, studies on
screening mammography in high-risk women under
the age of 50 report success in detecting early cancers
[62]. However, the reported numbers are small, and
the women studied were generally in their 40s. Larger
studies and those including younger women at high
risk will be needed before definitive data are available
on the efficacy of screening mammography in
decreasing mortality in these women. Until then,
expert opinion, without the benefit of supporting
data, recommends screening women who have a
significant family history for breast cancer and
screening those with mutations for the BRCA-1 and
BRCA-2 genes beginning at age 25 to 35, or 5 to 10
years younger than the earliest age of diagnosis of an
affected relative, but not before age 25 [62].
In addition to women with a genetic predisposi-
tion for breast cancer, it has been shown that women
C.H. Lee / Radiol Clin N Am 40 (2002) 395–407400

previously treated for Hodgkin’s disease with mantle
radiation are at a significantly increased risk for
breast cancer after a latency period [68–71]. Because
Hodgkin’s disease occurs in children, adolescents,
and young adults, the age of onset of breast cancer
in this group of women can be quite young. The risk
for subsequent development of breast cancer appears
to be highest among women who were treated
between age 10 and age 30 years [68]. In one report,
the relative risk for women treated before the age of
15 was 136 times that of the general population [70].
Other series have reported a relative risk of 2 to 75
times that of the general population [68–71]. The risk
for breast cancer in women older than 30 at the time
of treatment of Hodgkin’s disease does not appear to
be significantly increased [68,70]. The latency period
before breast cancer is diagnosed in women treated
with mantle radiation has been reported to be between
4 and 34 years, with a median of approximately 15 to
18 years [68].
Mammography has been shown to be successful
in detecting breast cancer in women previously
treated for Hodgkin’s disease, despite the young age
of many of these women [71,72]. In one series
reported by Tardivon et al [71], the average age at
diagnosis among 23 women was 40 years (range, 23
to 70 years). In a series of 27 women reported by
Dershaw et al [72], the average age was 47 years.
Both these reported means are significantly younger
than the mean age for breast cancer occurrence in the
general population, which is 57 years [72]. In addi-
tion, 55% of the women in the series by Dershaw et al
[72] were younger than 45 years, and 31% were
younger than 40 years. The mean latency period for
both studies was 18 years, with ranges in the two
studies between 15 months and 35 years. Both studies
reported that mammography had a sensitivity of 90%
for depicting malignancy (52 of 58 cancers, com-
bined). Of the total of 58 cancers in the two studies,
18 (31%) were not palpable and were detected only
by mammography. The cancers occurred most com-
monly in the upper outer quadrant of the breast and
were equally divided in laterality.
Although these studies demonstrate that mam-
mography is indeed useful for detecting breast cancer
in women previously irradiated for Hodgkin’s dis-
ease, no data support the efficacy of screening young
women in this population. However, based on the
data of incidence and latency of breast cancer in
these women, it has been recommended that these
women undergo careful surveillance for the devel-
opment of breast cancer, including annual screening
mammography beginning 8 to 10 years after the
radiation exposure.
Accuracy of screening mammography
The overall accuracy of mammographic inter-
pretation, in terms of sensitivity and specificity, has
been another area of controversy surrounding the
issue of screening mammography. False-negative
and false-positive interpretations have been called
risks of screening mammography and have been cited
as reasons against routine screening of various pop-
ulations of women [73–75].
Observer variability
Observer variability in mammographic interpreta-
tion has generated controversy in recent years. Several
studies have reported variability that is sometimes
‘‘substantial’’ among radiologists’ interpretation of
screening mammograms [76–80]. All the studies
were enriched with more abnormal cases than would
be found in a normal screening population, and in all
but one, only two views of each breast were supplied
without previous films for comparison. In all but one
of the studies, the participating radiologists were
asked to make recommendations and final assess-
ments based only on the two views in each case.
In the study by Elmore et al [79], 10 radiologists of
varying levels of experience and numbers of mammo-
grams interpreted yearly in their practices were asked
to read 150 selected cases. The radiologists were asked
to make management recommendations and to give a
diagnostic interpretation for each case. The choices for
management recommendation included routine mam-
mography in 1 year, another mammogram within
6 months, or immediate follow-up, which could con-
sist of additional mammographic views, ultrasound, or
biopsy. The choices for diagnostic interpretation were
normal, abnormal – probably benign, abnormal –
indeterminate, and abnormal–suggestive of cancer.
The management recommendations and diagnostic
interpretations were not linked so a radiologist could
potentially choose a recommendation of biopsy but
indicate an interpretation of abnormal –probably
benign if he or she thought the likelihood of a positive
result was low. The agreement among the 10 radiol-
ogists was found to be moderate (k values of 0.47
for diagnostic interpretation and 0.49 for biopsy
recommendation). Sensitivity for cancer cases
(defined as a recommendation of immediate work-
up) ranged from 74% to 96%. Elmore et al [79]
concluded that ‘‘radiologists can differ, sometimes
substantially, in their mammographic interpretations
and recommendations for management’’ (p. 1478).
This study, however, and the others that are
similar to it have several flaws in study design.
C.H. Lee / Radiol Clin N Am 40 (2002) 395–407 401

Among the major criticisms is the fact that asking
radiologists to reach a diagnostic impression for
findings based on only the two standard views of
the breast does not reflect actual clinical practice. In
addition, the methods used for data analysis in the
study by Elmore et al [79] and others tended to
exaggerate the amount of variability actually ob-
served. For example, in the report by Elmore et al
[79], substantial diagnostic disagreement occurred in
only 2% of pair-wise comparisons. In addition, in a
study reported by Kerlikowske et al [80], an assess-
ment of ‘‘suspicious abnormality’’ was considered to
be in disagreement with an assessment of ‘‘highly
suggestive of malignancy’’. In actual practice, how-
ever, both these assessments would likely lead to a
similar outcome for the patient, which would be
biopsy. In the study by Berg et al [77], which is the
only evaluation of observer variability in which
work-up views and previous films were supplied,
the k statistic for agreement in final assessment was
poor at 0.38. However, the five participating radiol-
ogists recommended further evaluation or biopsy for
between 21 and 22 of the 23 cancer cases in the
series, suggesting that they did not miss the cancers
even though their final assessments disagreed.
The discrepancy between the artificial testing
situation of the reported studies on observer variabil-
ity and performance in actual clinical practice was
confirmed by a study reported by Rutter and Taplin
[81]. They found that there was moderate correlation
in radiologists’ tendency to call an examination
positive in both the testing and the clinical setting
but that test performance did not correlate with actual
clinical accuracy. They cautioned against extrapol-
ating the results from one setting to the other.
In the field of diagnostic radiology, the interpreta-
tion of mammograms is particularly challenging
because there is no standard anatomy of the breast,
there is wide variability in what constitutes a normal
examination and the overlap between the appearance
of benign and malignant lesions is large. Clearly,
there is variability in the interpretation of mammo-
grams among radiologists; however, it has been
demonstrated that screening mammography reduces
breast cancer mortality despite this variability. Per-
haps the take-home message from the studies of
observer variability in mammography should be that
individual radiologists who interpret mammograms
should track their results, as is now recommended
within the mandates of the Mammography Quality
Standards Act, and strive to improve performance
with the help of this feedback. It should be empha-
sized, however, particularly to the lay public, that
despite observer variability in interpretation, screen-
ing mammography has been demonstrated to reduce
mortality from breast cancer.
False-negative interpretations
False-negative interpretations have been cited as a
risk of screening mammography because they might
give ‘‘false reassurance’’ to women. It is argued that
if a woman with undiagnosed breast cancer has
screening examination results falsely interpreted as
normal, she may not seek attention for symptoms that
subsequently develop, possibly delaying diagnosis
[75,82]. It has also been stated that if a woman
knows she is scheduled to have a screening examina-
tion in the future, she may not seek immediate
attention for a symptom and may wait instead for
the mammogram to be performed, again potentially
delaying diagnosis [82]. Although these scenarios are
certainly possible, it has not been established how
often they occur or to what extent they contribute to
the efficacy of screening mammography in decreas-
ing breast cancer mortality.
In a meta-analysis of the published RCTs and
large case-control studies of screening mammography
reported by Mushlin et al [83] in 1998, the sensitivity
ranged from 83% to 95%. These investigators found
the reported sensitivity in these studies to be approx-
imately 10 percentage points lower in women
younger than 50 years of age and suggest that this
decreased sensitivity may partially explain the de-
creased effectiveness of screening in these younger
women. On the other hand, a review of more than
183,000 screening mammograms performed in New
Mexico found no statistically significant difference in
screening sensitivity among women aged 40 to 49
years compared with those 50 and older [29].
False-negative interpretations are caused by a
variety of reasons. Mammograms may be truly nega-
tive despite the presence of breast cancer because the
malignancy may be obscured by overlying dense
parenchyma or because a noncalcified tumor may
not form a visible mass or distortion, as is sometimes
seen with invasive lobular carcinoma [23]. False-
negatives may also result from poor mammographic
technique, causing the malignancy to be undetectable
[19]. Breast cancer may be overlooked by the inter-
preting radiologist or mistakenly classified as benign
[19]. Finally, false-negative mammograms can occur
because rapidly growing cancers may be below the
detection threshold at the time of the mammogram
but may grow to become palpable before the next
screening examination is performed [55]. Some of
these reasons are potentially avoidable or correctable.
Strict attention to maintaining optimum mammo-
C.H. Lee / Radiol Clin N Am 40 (2002) 395–407402
graphic technique, double reading, computer-aided
detection, participation in continuing education in
mammographic interpretation, optimizing mam-
mographic technique, and decreasing the interval
between screening examinations may all serve to de-
crease the false-negative rate [19,55,84–88]. Some
level of false-negative interpretation, however, is
unavoidable and is inherent in the nature of x-ray
mammography. Despite the fact that mammography
has a less than perfect sensitivity for the detection of
breast cancer, it has been shown to reduce mortality
from this disease, and to call the possibility of a false-
negative interpretation a ‘‘risk’’ of the procedure
seems unwarranted.
False-positive interpretations
Because screening mammography is just that, a
screening tool to separate women with normal exam-
ination results from all others, screening will gen-
erate the need for additional evaluation in women
with inconclusive, indeterminate, or suspicious find-
ings on the screening examination. These women
will be recalled for additional testing, such as extra
mammographic views, ultrasound, or biopsy. When
recalled examinations do not lead to a diagnosis of
cancer, they have been termed ‘‘false positives’’ by
most of the reports. The issue of false-positive
interpretations is another source of controversy con-
cerning screening mammography that has received
much attention recently.
The recall rate associated with screening mam-
mography varies among reports. In a recent meta-
analysis of the large RCTs and case-controlled studies
of screening efficacy, most of which were performed
in Europe, recall rates varied between 1% and 6.5%
[83]. Review of several community-based practices in
the United States revealed recall rates that varied
between 3% and 57% with a mean of 11% overall
[85]. Other reports from community and academic
practices in the US report recall rates of approxi-
mately 6% to 8% [87,89–91]. Most of these recalls
do not result in a diagnosis of breast cancer and can
therefore be termed false-positive.
Elmore et al [92], in a retrospective study of
nearly 10,000 screening mammograms performed
on 2400 women, estimated the cumulative 10-year
risk of a false-positive mammogram to be 49.1% and
the number undergoing benign biopsy because of a
mammographic abnormality to be 18.6% [92]. These
figures were extrapolated to yield a 10-year estimated
risk. In actuality, the average number of mam-
mograms performed per patient in their study was
four. The authors cited the increased cost, anxiety,
and possible morbidity associated with these false-
positive readings.
In a follow-up to this study by Christiansen et al
[73] using the same cohort of women, factors con-
tributing to the risk of a false-positive screening
mammogram were described. The risk increased with
number of breast biopsies, family history of breast
cancer, estrogen use, time between screenings, lack of
comparison mammograms, and tendency of the inter-
preting radiologist to call mammogram results abnor-
mal. Many of these factors are also associated with an
increased risk for true-positive examination results.
Risk for false-positive mammogram results decreased
with increasing age. The estimated 10-year cumulat-
ive risk ranged from 5% for those women at lowest
risk for a false-positive reading to 100% with highest-
risk variables. Both this report and that of Elmore
et al [92] cite psychological distress as a problem
associated with false-positive mammographic inter-
pretations. However, a review of several studies
evaluating the psychological impact of abnormal
screening mammogram results in women without
breast cancer reported that the most common con-
sequence was anxiety, which can be considered a
normal reaction to the situation [93]. Although the
adverse psychological consequences of a false-pos-
itive screening mammogram have been emphasized
by some, other studies have reported that this anxiety
is short-lived and does not prevent women from
returning for future screening mammograms [94–
98]. Most significantly, a survey of attitudes regard-
ing false-positive results conducted among 479
American women showed that 99% were aware that
false-positives occurred and that 63% thought 500
false-positives to save one life would be acceptable
and 37% thought that 10,000 false-positives per life
saved was an acceptable number [99]. Therefore, it
seems the perception of false-positive interpretations
as a serious risk associated with screening mammog-
raphy is greater for some health professionals than for
the general public.
The report by Elmore et al [92] that by Christian-
sen et al [73] call for efforts to decrease the false-
positive rate of screening mammography. Although
certainly a desirable goal, neither addresses the issue
of trade-off between sensitivity for detecting breast
cancer and recall rate. Indeed, the study on observer
variability by Elmore et al [79] showed that the
radiologist with the highest sensitivity for calling
cancer cases abnormal also had the highest false-
positive rate. Elmore et al [92] call for ways to reduce
false-positive interpretations to decrease the associ-
ated psychological and economic costs. They propose
immediate work-up of abnormal screening examina-
C.H. Lee / Radiol Clin N Am 40 (2002) 395–407 403

tions to decrease anxiety. However, this practice,
while beneficial, is impractical in many clinical set-
tings because of equipment and personnel constraints
and could lead to increased cost associated with
screening mammography [100].
Christiansen et al [73] suggest that an equation
could be developed to predict a woman’s risk for a
false-positive mammogram. This could be used, they
state, along with predictive models for the same
woman’s risk for breast cancer, such as the Gail
model [101], and the woman can then decide whether
to undergo screening. This proposal ignores the fact,
however, that the woman would be comparing her
risk of a recall that might involve nothing more than
having a few additional mammographic views or
ultrasound against the risk of having breast cancer
and the possible benefit of early detection.
The other proposal by Elmore et al [92] that
women be educated about their chances of having
abnormal screening results and the small likelihood
that such a recall will result in a diagnosis of ma-
lignancy, seems the best solution to the perceived
problem of false-positive screening mammograms,
especially given the fact that it appears that many
women would tolerate many more false-positives to
detect one breast cancer than it currently takes.
False-positive mammographic interpretations
occur despite efforts to eliminate them. Perhaps the
best way of dealing with false-positive results is to try
to minimize them by having prior mammograms
available for comparison at the time of interpretation,
by emphasizing to patients that recalls are a possibil-
ity and that most do not lead to a diagnosis of breast
cancer, and by performing the needed evaluation in
recalled women in a timely fashion.
Summary
Screening mammography, despite its limitations,
remains the best means for diagnosing breast cancer in
asymptomatic women. Regarding the continuing con-
troversies concerning the age at which screening
should start, evidence supports beginning regular
screening at age 40 in women at average risk [12,
24,26,40,41]. Similarly, evidence suggests that the
screening interval should be yearly, especially in
younger women [43,55]. Rather than an arbitrary
age at which screening should stop, the decision on
screening elderly women should be made on an
individual basis, taking into account level of health
and life expectancy. More work needs to be done on
determining the optimum screening strategies for
high-risk women. As to the interpretation of screening
mammography, a certain level of observer variability
and of false-negative and false-positive readings are
inherent in the process. These should be kept to a
minimum through efforts by the interpreting radiolo-
gist to improve performance through auditing of
individual results and continuing education. The
impact of double reading and computer-aided detec-
tion in the interpretation of screening mammograms
warrants further evaluation in terms of efficacy and
cost-effectiveness.
Despite these continuing controversies, mortality
from breast cancer in the United States has been
decreasing steadily for the past 25 years [17]. The
magnitude of the decrease has been reported to range
from 8% to 25% [18,102]. Although some of this
decrease may be attributable to improvements in the
treatment of breast cancer, early detection through
screening mammography has undoubtedly played a
role in this mortality reduction. The controversies that
surround the issue of screening should not detract
from the fact that screening mammography has
proved to save lives.
References
[1] Greenlee RT, Hill-Harmon MB, Murray T, Thun M,
et al. Cancer statistics, 2001. CA Cancer J Clin 2001;
51:15–36.
[2] Baker LH. Breast cancer detection demonstration
project: five-year summary report. CA Cancer J Clin
1982;32:194–224.
[3] Shapiro S, Venet W, Strax P, Venet L, Roeser R. 10-to
14-year effect of screening on breast cancer mortality.
J Natl Cancer Inst 1982;69:349–55.
[4] Nystrom L, Rutqvist LE, Wall S, Lindgren A,
Lindqvist M, Ryden S, et al. Breast cancer screening
with mammography: overview of Swedish random-
ized trials. Lancet 1993;341:973–8.
[5] Roberts MM, Alexander FE, Anderson TJ, Chetty U,
Donnan PT, Forrest P, et al. Edinburgh trial of screen-
ing for breast cancer: mortality at seven years. Lancet
1990;335:241–6.
[6] Miller AB, Baines CJ, To T, Wall C. Canadian na-
tional breast screening study: 1: breast cancer detec-
tion and death rates among women aged 40 to
49 years. Can Med Assoc J 1992;147:1459–76.
[7] Miller AB, To T, Baines CJ, Wall C. Canadian na-
tional breast screening study: 2: breast cancer detec-
tion and death rates among women aged 50 to 59
years. Can Med Assoc J 1992;147:1477–88.
[8] Kerlikowske K, Grady D, Rubin SM, Sandrock C,
Ernster VL. Efficacy of screening mammography: a
meta-analysis. JAMA 1995;273:149–54.
[9] Chang HR, Cole B, Bland KI. Nonpalpable breast
cancer in women aged 40–49 years: a surgeon’s view
C.H. Lee / Radiol Clin N Am 40 (2002) 395–407404

of benefits from screening mammography. Monogr
Natl Cancer Inst 1997;22:145–9.
[10] Yokoe T, Iino Y, Maemura M, Takei H, Horiguchi J,
Matsumoto H, et al. Efficacy of mammography for
detecting early breast cancer in women under 50.
Anticancer Res 1998;18:4709–12.
[11] Tabar L, Vitak B, Chen H-H, Duffy SW, Yen MF,
Chiang CF, et al. The Swedish two-county trial
twenty years later. Radiol Clin North Am 2000;38:
625–52.
[12] Bjurstam N, Bjorneld L, Duffy SW, Smith TC, Cahlin
E, Eriksson O, et al. The Gothenburg breast screening
trial: first results on mortality, incidence, and mode of
detection for women ages 39–49 years at randomiza-
tion. Cancer 1997;80:2091–9.
[13] Gotzsche PC, Olsen O. Is screening for breast cancer
with mammography justifiable? Lancet 2000;355:
129–34.
[14] Olsen O, Gotzsche PC. Cochrane review on screening
for breast cancer with mammography. Lancet 2001;
358:1340–2.
[15] NCI statement on mammography screening. Office of
Communications/ Mass Media Branch. Bethesda,
MD: National Institutes of Health; February 21, 2002.
[16] Screening for breast cancer. Recommendations and
rationale. Rockville, MD: Agency for Healthcare Re-
search and Quality; February, 2002.
[17] Chu KC, Tarone RE, Kessler LG, Ries LAG, Hankey
BF, Miller BA, et al. Recent trends in U.S. breast
cancer incidence, survival, and mortality rates. J Natl
Cancer Inst 1996;88:1571–9.
[18] Peto R, Boreham J, Clarke M, Davies C, Beral V. UK
and USA breast cancer deaths down 25% in year 2000
at ages 20–69 years [letter]. Lancet 2000;355:1822.
[19] Huynh PT, Jarolimek AM, Daye S. The false-negative
mammogram. Radiographics 1998;18:1137–54.
[20] MoskowitzM. Breast cancer: age-specific growth rates
and screening strategies. Radiology 1986;161:37–41.
[21] Salzman P, Kerlikowske K, Phillips K. Cost-effec-
tiveness of extending screening mammography
guidelines to include women 40–49 years of age.
Ann Intern Med 1997;127:955–65.
[22] Rosenquist CJ, Lindfors KK. Screening mammogra-
phy beginning at age 40 years – a reappraisal of cost-
effectiveness. Cancer 1998;82:2235–40.
[23] Tengs TO, Adams ME, Pliskin JS, Safran DG, Siegel
JE, Weinstein MC, et al. Five-hundred life-saving
interventions and their cost-effectiveness. Risk Anal
1995;15:369–90.
[24] Kopans DB, Moore RH, McCarthy KA, Hall DA,
Hulka CA, Whitman GJ, et al. Positive predictive
value of breast biopsy performed as a result of mam-
mography: there is no abrupt change at age 50 years.
Radiology 1996;200:357–60.
[25] Sickles EA. Breast cancer screening outcomes in
women ages 40–49: clinical experience with service
screening using modern mammography. Monogr Natl
Cancer Inst 1997;22:99–104.
[26] Curpen BN, Sickles EA, Sollitto RA, Ominsky SH,
Galvin HB, Frankel SD. The comparative value of
mammographic screening for women 40–49 years
old versus women 50–64 old. AJR Am J Roentgenol
1995;164:1099–103.
[27] Heimann R, Bradley J, Hellman S. The benefits of
mammography are not limited to women of ages old-
er than 50 years. Cancer 1998;82:2221–6.
[28] Maibenco D, Daoud Y, Phillips E, Saxe A. Relation-
ship between method of detection of breast cancer
and stage of disease, method of treatment, and sur-
vival in women aged 40–49 years. Am Surg 1999;65:
1061–6.
[29] Rosenberg RD, Hunt WC, Williamson MR, Gilliland
FD, Wiest PW, Kelsey CA, et al. Effects of age, breast
density, ethnicity, and estrogen replacement therapy
on screening mammographic sensitivity and cancer
stage at diagnosis: review of 183,134 screening mam-
mograms in Albuquerque, New Mexico. Radiology
1998;209:511–8.
[30] Ernster VA, Barclay J. Increases in ductal carcinoma
in situ (DCIS) of the breast in relation to mam-
mography: a dilemma. Monogr Natl Cancer Inst
1997;22:151–6.
[31] Evans WP, Starr AL, Bennos ES. Comparison of the
relative incidence of impalpable invasive breast car-
cinoma and ductal carcinoma in situ in cancers de-
tected in patients older and younger than 50 years of
age. Radiology 1997;204:489–91.
[32] Kerlikowske K, Grady D, Barclay J, Sickles EA,
Ernster V. Effect of age, breast density, and family
history on the sensitivity of first screening mammog-
raphy. JAMA 1996;276:33–8.
[33] Bartow SA, Pathak DR, Black WC, Key CR, Teaf
SR. Prevalence of benign, atypical, and malignant
breast lesions in populations at different risk for breast
cancer: a forensic autopsy study. Cancer 1987;60:
2751–60.
[34] Bhathal PS, Brown RW, Lesueur GC, Russell IS.
Frequency of benign and malignant breast lesions in
207 consecutive autopsies in Australian women. Br J
Cancer 1985;51:271–8.
[35] Nielsen M, Jensen J, Andersen J. Precancerous and
cancerous breast lesions during lifetime and at autop-
sy: a study of 83 women. Cancer 1984;54:612–5.
[36] Sakorafas GH, Tsiotou AG. Ductal carcinoma in situ
(DCIS) of the breast: evolving perspectives. Cancer
Treat Rev 2000;26:103–25.
[37] Betsill WL, Rosen PP, Lieberman PH, Robbins GF.
Intraductal carcinoma: long-term follow-up after
treatment by biopsy alone. JAMA 1978;239:1863–7.
[38] Eusebi V, Fischini MP, Cook MG, Berrino F, Azzo-
pardi JG. Long term follow-up of in situ carcinoma of
the breast with special emphasis on clinging carci-
noma. Semin Diagn Pathol 1994;11:223–35.
[39] Page DL, Dupont WD, Rogers LW, Jensen RA,
Schuyler PA. Continued local recurrence of carcino-
ma 15–25 years after a diagnosis of low grade ductal
carcinoma in situ of the breast treated only by biopsy.
Cancer 1995;76:1197–200.
C.H. Lee / Radiol Clin N Am 40 (2002) 395–407 405

[40] Hendrick RE, Smith RA, Rutledge JH, Smart CR.
Benefit of screening mammography in women aged
40–49: a new meta-analysis of randomized con-
trolled trials. Monogr Natl Cancer Inst 1997;22:
87–92.
[41] Kerlikowske K. Efficacy of screening mammography
among women aged 40 to 49 years and 50 to 69
years: comparison of relative and absolute benefit.
Monogr J Natl Cancer Inst 1997;22:79–86.
[42] Leitch AM, Dodd GD, Costanza M, Linver M, Press-
man P, McGinnis L, et al. American cancer society
guidelines for the early detection of breast cancer:
update 1997. CA Cancer J Clin 1997;47:150–3.
[43] Committee opinion number 247. Washington, DC:
American College of Obstetrics and Gynecology;
December, 2000.
[44] Standards 2000–2001. Reston, VA: American Col-
lege of Radiology; 2000.
[45] Shapiro S, Coleman EA, Broeders M, Codd M, de-
Koning H, Fracheboud J, et al. Breast cancer screen-
ing programmes in 22 countries: current policies,
administration and guidelines. Int J Epidemiol 1998;
27:735–42.
[46] Mandelblatt JS, Wheat ME, Monane M, Moshief RD,
Hollenberg JP, Tang J. Breast cancer screening for
elderly women with and without comorbid condi-
tions: a decision analysis model. Ann Intern Med
1992;116:722–30.
[47] Smith-Bindman R, Kerlikowske K, Gebretsadik T. Is
screening mammography effective in elderly women?
Am J Med 2000;108:112–9.
[48] Kerlikowske K, Grady D, Barclay J, Sickles EA, Ea-
ton A, Ernster V. Positive predictive value of screen-
ing mammography by age and family history of breast
cancer. JAMA 1993;270:2444–50.
[49] Nattinger AB. Older women, mammography, and
mortality from breast cancer. Am J Med 2000;108:
174–5.
[50] Smith-Bindman R, Kerlikowske K. Is there a down-
side to elderly women undergoing screening mam-
mography? J Natl Cancer Inst 1998;90:1322–3.
[51] Welch HG, Fisher ES. Diagnostic testing following
screening mammography in the elderly. J Natl Cancer
Inst 1998;90:1389–92.
[52] Kerlikowske K, Salzmann P, Phillips KA, Cauley
JA, Cummings SR. Continuing screening mammog-
raphy in women aged 70 to 79 years: impact on life
expectancy and cost-effectiveness. JAMA 1999;282:
2156–63.
[53] Zhang Y, Kiel DP, Kreger BE, Cupples LA, Ellison
RC, Dorgan JF, et al. Bone mass and the risk of breast
cancer among postmenopausal women. N Engl J Med
1997;336:611–7.
[54] Satariano WA, Ragland DR. The effect of comorbid-
ity on 3-year survival of women with primary breast
cancer. Ann Intern Med 1994;120:104–10.
[55] Tabar L, Faberberg G, Day NE, Holmberg. What
is the optimum interval between mammographic
screening examinations? an analysis based on the lat-
est results of the Swedish two-country breast cancer
screening trial. Br J Cancer 1987;55:547–51.
[56] Tabar L, Fagerberg G, Chen H-H, Duffy SW, Smart
CR, Gad A, et al. Efficacy of breast cancer screening
by age. Cancer 1995;75:2507–17.
[57] Field LR, Wilson TE, Strawderman M, Gabriel H,
Helvie MA. Mammographic screening in women
more then 64 years old: a comparison of 1- and 2-year
intervals. AJR Am J Roentgenol 1998;170:961–5.
[58] Hoskins KF, Stopfer JE, Calzone KA, Merajver SD,
Rebbeck TR, Garber JE, et al. Assessment and coun-
seling for women with a family history of breast
cancer. JAMA 1995;273:577–85.
[59] Easton DF, Ford D, Bishop P, et al. Breast and ovar-
ian cancer incidence in BRCA-1 mutation carriers.
Am J Hum Genet 1995;56:265–71.
[60] Ford D, Easton DF. The genetics of breast and ovar-
ian cancer. Br J Cancer 1995;72:805–12.
[61] Burke W, Daly M, Garber J, Botkin J, Kahn ME,
Lynch P, et al. Recommendations for follow-up care
of individuals with an inherited predisposition to
cancer. JAMA 1997;227:997–1003.
[62] Chart PL, Fanssen E. Management of women at in-
creased risk for breast cancer: preliminary results from
a new program. CanMed Assoc J 1997;157:1235–42.
[63] Lalloo F, Boggis CRM, Evans DGR, Shenton A,
Threlfall AG, Howell A. Screening by mammogra-
phy, women with a family history of breast cancer.
Eur J Cancer 1998;34:937–40.
[64] Tilanus-Linthorst MMA, Bartels CCM, Obdeijn AIM,
Oudkerk M. Earlier detection of breast cancer by sur-
veillance of women at familial risk. Eur J Cancer
2000;36:514–9.
[65] Vasen HFA, Haites NE, Evans DGR, Steel CM,
Moller P, Hodgson S, et al. Current policies for
surveillance and management in women at risk of
breast and ovarian cancer: a survey among 16 Euro-
pean family cancer clinics. Eur J Cancer 1998;34:
1922–6.
[66] Gilson E. Benefits and risks of screening mammog-
raphy in women with BRCA1 and BRCA2 mutations
[letter]. JAMA 1997;278:289–90.
[67] Vaidya JS. Benefits and risks of screening mammog-
raphy in women with BRCA1 and BRCA2 mutations
[letter]. JAMA 1997;278:290.
[68] Clemons M, Loijens L, Goss P. Breast cancer risk
following irradiation for Hodgkin’s disease. Cancer
Treat Rev 2000;26:291–302.
[69] Goss PE, Sierra S. Current perspectives on radiation-
induced breast cancer. J Clin Oncol 1998;16:338–47.
[70] Hancock SL, Tucker MA, Hoppe RT. Breast cancer
after treatment of Hodgkin’s disease. J Natl Cancer
Inst 1993;85:25–31.
[71] Tardivon AA, Garnier ML, Beaudre A, Girinsky T.
Breast carcinoma in women previously treated for
Hodgkin’s disease: clinical and mammographic find-
ings. Eur Radiol 1999;9:1666–71.
[72] Dershaw DD, Yahalom J, Petrek JA. Breast carcino-
ma in women previously treated for Hodgkin disease:
C.H. Lee / Radiol Clin N Am 40 (2002) 395–407406

mammographic evaluation. Radiology 1992;184:
421–3.
[73] Christiansen CL, Wang F, Barton MB, Kreuter W,
Elmore JG, Gelfand AE, et al. Predicting the cumu-
lative risk of false-positive mammograms. J Natl
Cancer Inst 2000;92:1657–66.
[74] Harris R. Variation of benefits and harms of breast
cancer screening with age. Monogr Natl Cancer Inst
1997;22:139–43.
[75] Sirovich BE, Sox HC. Breast cancer screening. Surg
Clin North Am 1999;79:961–91.
[76] Beam CA, Layde PM, Sullivan DC. Variability in the
interpretation of screening mammograms by US radi-
ologists. Arch Intern Med 1996;156:209–13.
[77] Berg WA, Campassi C, Langenberg P, et al. Breast
imaging reporting and data system: inter- and intraob-
server variability in feature analysis and final assess-
ment. AJR Am J Roentgenol 2000;174:1769–77.
[78] Ciccone G, Vineis P, Frigerio A, Howard DH,
Feinstein AR. Inter-observer and intra-observer var-
iability of mammogram interpretation: a field study.
Eur J Cancer 1992;28A:1054–8.
[79] Elmore JG, Wells CK, Lee CH, et al. Variability in
radiologists’ interpretations of mammograms. N Engl
J Med 1994;331:1493–9.
[80] Kerlikowske K, Grady D, Barclay J, Frankel SD,
Ominsky SH, Sickles EA. Variability and accuracy
in mammographic interpretation using the American
College of Radiology Breast Imaging Reporting and
Data System. J Natl Cancer Inst 1998;90:1801–9.
[81] Rutter CM, Taplin S. Assessing mammographers’ ac-
curacy: a comparison of clinical and test performance.
J Clin Epidemiol 2000;53:443–50.
[82] Pelikan S, Moskowitz M. Effects of lead time, length
bias, and false-negative assurance on screening for
breast cancer. Cancer 1993;71:1998–2005.
[83] Mushlin AI, Kouides RW, Shapiro DE. Estimating the
accuracy of screening mammography: a meta-analy-
sis. Am J Prev Med 1998;14:143–53.
[84] Beam CA, Sullivan DC, Layde PM. Effect of human
variability on independent double reading in screen-
ing mammography. Acad Radiol 1996;3:891–7.
[85] Brown ML, Houn F, Sickles EA, et al. Screening
mammography in community practice: positive pre-
dictive value of abnormal findings and yield of fol-
low-up diagnostic procedures. AJR Am J Roentgenol
1995;165:1373–7.
[86] Jiang Y, Nishikawa RM, Schmidt RA, Metz CE,
Giger ML, Doi K. Improving breast cancer diagnosis
with computer-aided diagnosis. Acad Radiol 1999;
6:22–33.
[87] Warren Burhenne LJ, Wood SA, D’Orsi CJ, Feig SA,
Kopanhhs D, O’Shaughnessy KF, et al. Potential con-
tribution of computer-aided detection to the sensitiv-
ity of screening mammography. Radiology 2000;215:
554–62.
[88] Linver MN, Paster SB, Rosenberg RD, Key CR, Stid-
ley CA, King WV. Improvement in mammography
interpretation skills in a community radiology practice
after dedicated teaching courses: 2-year medical audit
of 38,633 cases. Radiology 1992;184:39–43.
[89] Poplack SP, Tosteson AN, Grove MR, Wells WA,
Carney PA. Mammography in 53,803 women from
the New Hampshire Mammography Network. Radi-
ology 2000;217:832–40.
[90] Sickles EA, Ominsky SH, Sollitto RA, Galvin HB,
Monitcciolo DL. Medical audit of a rapid-throughput
mammography screening practice: methodology and
results of 27,114 examinations. Radiology 1990;175:
323–7.
[91] Robertson CL. A private breast imaging practice:
medical audit of 25,788 screening and 1,077 diagnos-
tic examinations. Radiology 1993;187:75–9.
[92] Elmore JG, BartonMB,Moceri VM, Polk S, Arena PJ,
Fletcher SW. Ten-year risk of false positive screening
mammograms and clinical breast examinations. N
Engl J Med 1998;338:1089–96.
[93] Steggles S, Lightfoot N, Sellick SM. Psychological
distress associated with organized breast cancer
screening. Cancer Prev Control 1998;2:213–20.
[94] Aro AR, Pilvikki Absetz S, van Elderen TM, van der
Ploeg E , van der Kamp LJTh. False-positive findings
in mammography screening induces short-term dis-
tress–breast cancer-specific concern prevails longer.
Eur J Cancer 2000;36:1089–97.
[95] Burman ML, Taplin SH, Herta DF, Elmore JG. Effect
of false-positive mammograms on interval breast can-
cer screening in a health maintenance organization.
Ann Intern Med 1999;131:1–6.
[96] Gilbert FJ, Cordiner CM, Affleck IR, Hood DB,
Mathieson D, Walker LG. Breast screening: the psy-
chological sequelae of false-positive recall in women
with and without a family history of breast cancer.
Eur J Cancer 1998;34:2010–4.
[97] Pisano ED, Earp J, Gallant TL. Screening mammog-
raphy behavior after a false-positive mammogram.
Cancer Detect Prev 1998;22:161–7.
[98] Lerman C, Trock B, Rimer BK, Boyce A, Jepson C,
Engstron PF. Psychological and behavioral implica-
tions of abnormal mammograms. Ann Intern Med
1991;114:657–61.
[99] Schwartz LM, Woloshin S, Sox HC, Fischhoff B,
Welch HG. US women’s attitudes to false positive
mammography results and detection of ductal carci-
noma in situ: cross sectional survey. BMJ 2000;320:
1635–40.
[100] Margolin FR, Radovich N, Jacobs RP, Denny S. Im-
proving efficiency in a breast imaging practice: a
community radiologist’s experience. Seminars in
Breast Disease 2001;4:27–35.
[101] Gail MH, Brinton LA, Byar DP, Corle DK, Green SB,
Schairer C, et al. Projecting individualized probabil-
ities of developing breast cancer for white females
who are being examined annually. J Natl Cancer Inst
1989;81:1879–86.
[102] Welch HG, Schwartz LM, Woloshin S. Are increasing
5-year survival rates evidence of success against can-
cer? JAMA 2000;283:2975–8.
C.H. Lee / Radiol Clin N Am 40 (2002) 395–407 407

Breast imaging reporting and data system (BI-RADS)
Laura Liberman, MD*, Jennifer H. Menell, MD
Department of Radiology, Memorial Sloan-Kettering Cancer Center, 1275 York Avenue, New York, New York 10021, USA
The Breast Imaging Reporting and Data System
(BI-RADS) lexicon was developed by the American
College of Radiology (ACR) to standardize mammo-
graphic reporting [1–3]. The lexicon includes terms
for describing breast parenchymal patterns, features of
masses and calcifications, associated findings, and
final assessment categories. Potential benefits of the
lexicon include increased clarity in reporting, im-
proved communication, and facilitation of research,
particularly across different institutions. This article
reviews the terms defined in the BI-RADS lexicon for
mammography, describes strengths and limitations of
the lexicon, and discusses the preliminary work relat-
ing to the development of standardized lexicons for
breast sonography and breast MRI.
BI-RADS lexicon for mammography
The BI-RADS lexicon describes four classes of
breast parenchymal density: class 1, almost entirely
fat; class 2, scattered fibroglandular densities; class 3,
heterogeneously dense; and class 4, dense (Fig. 1). A
mass is defined as a space-occupying lesion seen in
two different projections; if a potential mass is seen in
only a single projection, it should be called a density
until its three-dimensionality is confirmed. Mass
margins are described as circumscribed, microlobu-
lated (undulate in short cycles), obscured (hidden by
superimposed adjacent tissue), indistinct (poor def-
inition not caused by superimposed tissue, raising the
possibility of infiltration of the lesion into adjacent
tissue), and spiculated (lines radiate from the mar-
gins) (Fig. 2). Mass shape can be described as round,
oval, lobular, or irregular. Architectural distortion is
shape with radiating spicules but no definite mass
visible (Fig. 3). Mass density can be described as
high, equal, low, or fat containing.
The lexicon also defines special cases, including:
intramammary lymph node (typically reniform or
with radiolucent notch because of fat in the hilum,
most often seen in the upper outer quadrant) (Fig. 4);
solitary dilated duct (usually of minor significance
unless it represents an interval change from prior
mammograms); asymmetric breast tissue (judged rel-
ative to the corresponding area in the contralateral
breast, usually a normal variant, but may be important
when it corresponds to a palpable asymmetry); focal
asymmetric density (a density that cannot be accu-
rately described using the other shapes, could repre-
sent an island of fibroglandular tissue, but may
warrant additional evaluation)
The lexicon defines specific terms to describe the
shapes (morphology) of calcifications and the pat-
terns in which they are arrayed in the breast pa-
renchyma (distribution). Morphologic descriptors are
typically benign, intermediate concern, and higher
probability of malignancy. Typically benign calcifi-
cations include skin, vascular, coarse or popcorn-
like, large rod-like, round (or punctate if smaller
than 0.5 mm), lucent-centered, eggshell or rim, milk
of calcium, suture, and dystrophic (Fig. 5). Inter-
mediate concern calcifications are amorphous or
indistinct; these calcifications are often round or
‘‘flake’’ shaped and are sufficiently small or hazy
that a more specific morphologic classification can-
not be determined. Calcifications with a higher
probability of malignancy include pleomorphic or
heterogeneous calcifications (formerly called granu-
lar) and fine linear or fine, linear, branching (cast-
ing) calcifications (Fig. 6). The distribution of
0033-8389/02/$ – see front matter D 2002, Elsevier Science (USA). All rights reserved.
PII: S0033 -8389 (01 )00017 -3
* Corresponding author.
E-mail address: [email protected] (L. Liberman).
Radiol Clin N Am 40 (2002) 409–430

calcifications has been described as grouped or clus-
tered (multiple calcifications in less than 2 mL tissue),
linear, segmental (suggesting deposits in a duct), re-
gional (large volume not necessarily conforming to a
duct distribution), diffuse/scattered (random distri-
bution), or multiple.
In addition, the lexicon defines associated find-
ings, used with masses or calcifications or alone when
no other abnormality is present, including skin or
nipple retraction, skin or trabecular thickening, skin
lesion, axillary adenopathy, or architectural distortion.
The lexicon suggests that the location of the lesion be
Fig. 1. Breast parenchymal density as seen on mediolateral oblique view mammograms. (A) Fatty (ACR class 1); (B) Mildly
dense (ACR class 2); (C) Moderately dense (ACR class 3); (D) Dense (ACR class 4).
L. Liberman, J.H. Menell / Radiol Clin N Am 40 (2002) 409–430410

expressed by indicating the side (left, right, or both),
the location (according to the face of the clock and
subareolar, central, or axillary tail, if appropriate) and
the depth of the lesion (anterior, middle, or posterior).
Perhaps most important, the lexicon defines
assessment categories to describe the radiologist’s
level of suspicion regarding the mammographic find-
ing (Table 1). As of April 1999, it has been required
by law that all mammography reports in the United
States contain a BI-RADS assessment category, with
its description in layman’s terms. Note that although
there are six assessment categories, there are only
four possible outcomes: additional imaging studies
(category 0), routine annual mammography (category
1 or 2), 6-month follow-up (category 3), and biopsy
(category 4 or 5).
Potential usefulness of the lexicon
Final assessment categories
Final assessment categories of the BI-RADS lex-
icon are useful predictors of malignancy. In three
published series, the frequency of carcinoma was
significantly higher for BI-RADS category 5 (highly
Fig. 2. Mass margin characteristics as defined by the BI-RADS lexicon. (A) Circumscribed mass, shown to be a simple cyst at
sonography. (B) Partially obscured mass; sonography showed as simple cyst. (C) Microlobulated mass corresponding to palpable
lump denoted by radiopaque skin marker; biopsy showed infiltrating ductal carcinoma and ductal carcinoma in situ (DCIS). (D)
Spiculated mass; biopsy showed infiltrating ductal carcinoma and DCIS.
L. Liberman, J.H. Menell / Radiol Clin N Am 40 (2002) 409–430 411
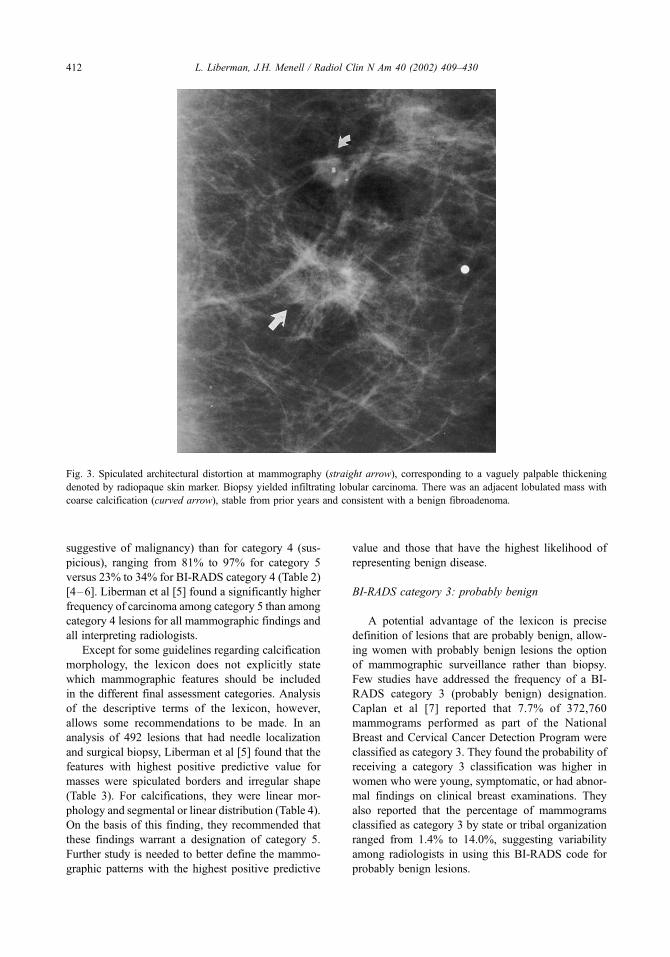
suggestive of malignancy) than for category 4 (sus-
picious), ranging from 81% to 97% for category 5
versus 23% to 34% for BI-RADS category 4 (Table 2)
[4–6]. Liberman et al [5] found a significantly higher
frequency of carcinoma among category 5 than among
category 4 lesions for all mammographic findings and
all interpreting radiologists.
Except for some guidelines regarding calcification
morphology, the lexicon does not explicitly state
which mammographic features should be included
in the different final assessment categories. Analysis
of the descriptive terms of the lexicon, however,
allows some recommendations to be made. In an
analysis of 492 lesions that had needle localization
and surgical biopsy, Liberman et al [5] found that the
features with highest positive predictive value for
masses were spiculated borders and irregular shape
(Table 3). For calcifications, they were linear mor-
phology and segmental or linear distribution (Table 4).
On the basis of this finding, they recommended that
these findings warrant a designation of category 5.
Further study is needed to better define the mammo-
graphic patterns with the highest positive predictive
value and those that have the highest likelihood of
representing benign disease.
BI-RADS category 3: probably benign
A potential advantage of the lexicon is precise
definition of lesions that are probably benign, allow-
ing women with probably benign lesions the option
of mammographic surveillance rather than biopsy.
Few studies have addressed the frequency of a BI-
RADS category 3 (probably benign) designation.
Caplan et al [7] reported that 7.7% of 372,760
mammograms performed as part of the National
Breast and Cervical Cancer Detection Program were
classified as category 3. They found the probability of
receiving a category 3 classification was higher in
women who were young, symptomatic, or had abnor-
mal findings on clinical breast examinations. They
also reported that the percentage of mammograms
classified as category 3 by state or tribal organization
ranged from 1.4% to 14.0%, suggesting variability
among radiologists in using this BI-RADS code for
probably benign lesions.
Fig. 3. Spiculated architectural distortion at mammography (straight arrow), corresponding to a vaguely palpable thickening
denoted by radiopaque skin marker. Biopsy yielded infiltrating lobular carcinoma. There was an adjacent lobulated mass with
coarse calcification (curved arrow), stable from prior years and consistent with a benign fibroadenoma.
L. Liberman, J.H. Menell / Radiol Clin N Am 40 (2002) 409–430412

Although one series in the surgical literature noted
that almost half the lesions referred for biopsy were in
category 3 (probably benign) [4], published studies in
the radiology literature indicate that approximately
70% of lesions referred for biopsy are in category 4
and that approximately 20% are in category 5, with
only a small number of category 3 lesions referred for
biopsy [5,6]. Several studies published before and
after introduction of the BI-RADS lexicon support
the use of short-term follow-up mammography for
probably benign lesions.
Sickles [8] prospectively evaluated the value of
short-term follow-up mammography in 3184 pa-
tients with baseline mammographic lesions classified
as probably benign in a study published before the
BI-RADS lexicon. Lesions were only classified as
probably benign after careful evaluation, including
magnification images. All probably benign lesions
were evaluated with a short-term follow-up mammo-
graphy protocol that included imaging the ipsilateral
breast 6 months after the initial mammogram, and
then both breasts 12, 24, and 36 months after the
initial mammogram, to document stability.
Of the 3184 probably benign lesions included in
the study, cancer was subsequently discovered in 17
(0.5%) [8]. Fifteen of the 17 cancers were diagnosed
by means of interval change at follow-up mammog-
raphy before they were palpable; all 17 were stage 0
or stage I at the time of diagnosis (one positive axillary
lymph node was present in two patients; one had
a circumscribed solid nodule and one had an asym-
metric area of fibroglandular tissue). Cancer was
discovered in 1 of 1234 (0.1%) clusters of round or
punctate calcifications, 12 of 589 (2%) solitary solid
circumscribed masses, 2 of 448 (0.4%) focal asym-
metric densities, 1 of 522 (0.2%) scattered or ran-
domly clustered calcifications, and 1 of 253 (0.4%)
multiple solid circumscribed nodules.
Sickles [9] has also addressed the question of
whether patient age or lesion size should prompt
immediate biopsy of nonpalpable, circumscribed,
solid nodules. Of 1403 cases included in this study,
cancer was found in 19 (1.4%). Only small differ-
ences in the frequency of cancer were found for
various patient age and lesion size subgroups. Even
in the group of women aged 50 and older, the
frequency of cancer was 1 of 560 (1.7%). These
data suggest that lesion size and patient age should
not deter from recommending short-interval follow-
up mammography for nonpalpable circumscribed
solid masses.
A second large-scale prospective study evaluating
the use of short-term follow-up for probably benign
lesions was published before the BI-RADS lexicon
Fig. 4. A benign intramammary lymph node (BI-RADS category 2). Note the notch corresponding to the fatty hilum.
L. Liberman, J.H. Menell / Radiol Clin N Am 40 (2002) 409–430 413

by Varas et al [10]. Probably benign lesions in this
study included single or multiple circumscribed
masses, multiple rounded, clustered, or scattered cal-
cifications within less than one quadrant of the breast,
and abnormal parenchymal opacities (areas of lo-
calized dense tissue, without definable margins or
architectural distortion, identified on two views).
Carcinoma was found in 9 of 535 (1.7%) probably
benign lesions, including 4 of 289 (1.4%) solitary
circumscribed masses, 4 of 104 (3.8%) lesions evident
as microcalcifications, and 1 of 54 (1.9%) abnormal
parenchymal opacities. Of the nine carcinomas iden-
tified, two were ductal carcinoma in situ (DCIS) and
seven were invasive carcinomas (including one DCIS
with microinvasion); two had positive axillary nodes.
These data also support the use of short-term follow-
up as an alternative to biopsy for probably benign
(BI-RADS category 3) lesions.
If short-term follow-up is selected, interval pro-
gression (increase in size of a mass or increase in
number of calcifications) at follow-up should prompt
a biopsy. In Sickles’ [8] study, carcinoma was iden-
tified in 15 of 131 (11%) biopsies performed for
mammographic progression; in the study of Varas
et al [10], 9 of 16 (56%) lesions that demonstrated
mammographic progression were found to represent
carcinoma. In both studies, no carcinomas were
identified in probably benign lesions that remained
Fig. 5. Typically benign calicifications. (A) Variety of benign calcifications: peripherally calcified oil cysts of fat necrosis, large
rod-like calcifications of secretory disease, and vascular calcifications. (B) Milk of calcium. Note the layering or ‘‘teacup’’
appearance of this 90� lateral magnification view (arrows). (C) Popcorn calcification typical of fibroadenoma. (D) Eggshell
calcifications associated with architectural distortion in area of postoperative fat necrosis.
L. Liberman, J.H. Menell / Radiol Clin N Am 40 (2002) 409–430414
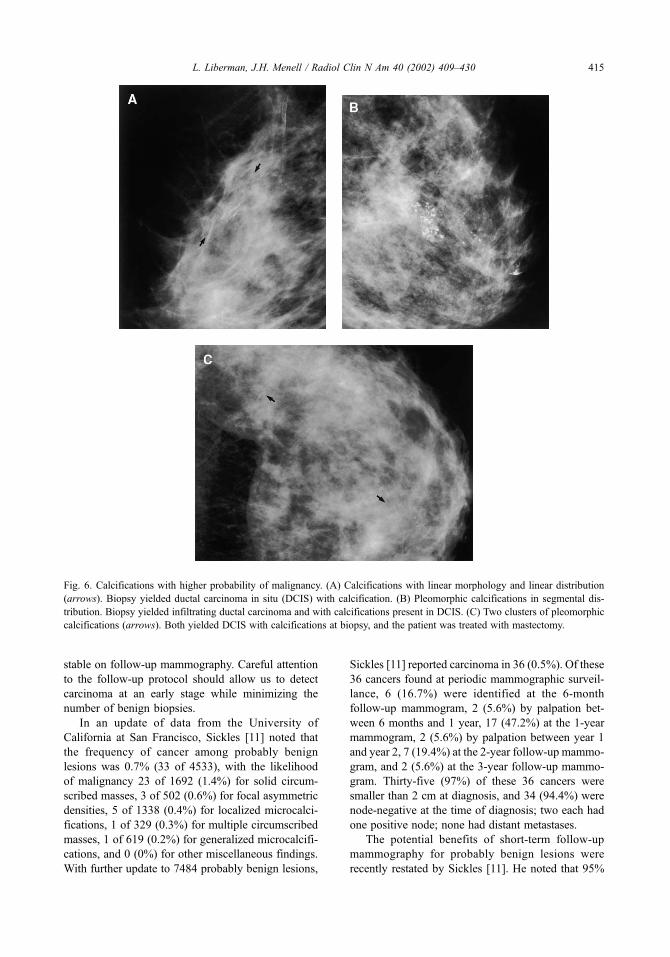
stable on follow-up mammography. Careful attention
to the follow-up protocol should allow us to detect
carcinoma at an early stage while minimizing the
number of benign biopsies.
In an update of data from the University of
California at San Francisco, Sickles [11] noted that
the frequency of cancer among probably benign
lesions was 0.7% (33 of 4533), with the likelihood
of malignancy 23 of 1692 (1.4%) for solid circum-
scribed masses, 3 of 502 (0.6%) for focal asymmetric
densities, 5 of 1338 (0.4%) for localized microcalci-
fications, 1 of 329 (0.3%) for multiple circumscribed
masses, 1 of 619 (0.2%) for generalized microcalcifi-
cations, and 0 (0%) for other miscellaneous findings.
With further update to 7484 probably benign lesions,
Sickles [11] reported carcinoma in 36 (0.5%). Of these
36 cancers found at periodic mammographic surveil-
lance, 6 (16.7%) were identified at the 6-month
follow-up mammogram, 2 (5.6%) by palpation bet-
ween 6 months and 1 year, 17 (47.2%) at the 1-year
mammogram, 2 (5.6%) by palpation between year 1
and year 2, 7 (19.4%) at the 2-year follow-up mammo-
gram, and 2 (5.6%) at the 3-year follow-up mammo-
gram. Thirty-five (97%) of these 36 cancers were
smaller than 2 cm at diagnosis, and 34 (94.4%) were
node-negative at the time of diagnosis; two each had
one positive node; none had distant metastases.
The potential benefits of short-term follow-up
mammography for probably benign lesions were
recently restated by Sickles [11]. He noted that 95%
Fig. 6. Calcifications with higher probability of malignancy. (A) Calcifications with linear morphology and linear distribution
(arrows). Biopsy yielded ductal carcinoma in situ (DCIS) with calcification. (B) Pleomorphic calcifications in segmental dis-
tribution. Biopsy yielded infiltrating ductal carcinoma and with calcifications present in DCIS. (C) Two clusters of pleomorphic
calcifications (arrows). Both yielded DCIS with calcifications at biopsy, and the patient was treated with mastectomy.
L. Liberman, J.H. Menell / Radiol Clin N Am 40 (2002) 409–430 415

of patients complied with at least half of the recom-
mended examinations in the follow-up protocol, and
50% completed the entire protocol. He also noted that
only approximately 2% of women chose biopsy rather
than follow-up. Compared to percutaneous core
biopsy, follow-up lowers the cost by a factor of 8,
with savings of $1040 per probably benign lesion; it is
also associated with lower patient stress. Although
existing data support that probably benign lesions can
be identified and safely managed with short-term
follow-up mammography, the management of BI-
RADS category 3 lesions continues to be debated [12].
Breast parenchymal density
Literature before the BI-RADS lexicon defined
different breast density parenchymal patterns and
evaluated the frequency of carcinoma among women
with different breast densities [13–15]. Analysis of
the impact of breast density on breast cancer incidence
are complicated by the inverse relationship between
age and breast parenchymal density and by the lower
sensitivity of mammography in women with dense
breasts. The BI-RADS lexicon potentially allows
standardization of reporting of breast parenchymal
density, facilitating further research in this area.
Dense breast tissue interferes with interpretation
of mammograms. Mandelson et al [16] evaluated
breast density as a predictor of mammographic detec-
tion. Mammographic sensitivity was 80% among
women with predominantly fatty breasts (ACR class
1) but 30% in women with extremely dense breasts
(ACR class 4). The odds ratio for interval cancer
among women with extremely dense breasts was 6.14
(95% confidence interval [CI], 1.95–19.4), compared
with women with extremely fatty breasts, after adjust-
ment for age at index mammogram, menopausal
status, use of hormone replacement therapy, and body
mass index. When only those interval cancer cases
confirmed by retrospective review of index mammo-
grams were considered, the odds ratio rose to 9.47
(95% CI, 2.78–32.3).
Although it remains controversial, it has been
suggested that mammographic density may be an
independent risk factor for development of breast
cancer. Satija et al [17] reviewed results of 82,391
screening mammograms among 36,495 women aged
40 to 80 with no history of breast cancer. They
found that ACR class 1 and 2 breasts, at age 40,
were associated with a relative risk of 0.39 with
respect to the general population at the same age,
whereas at age 80 the relative risk was 0.61. The
relative risk for ACR class 3 was 0.72 at age 40
Table 1
Assessment categories of the BI-RADS lexicon
Stage Result
0 Assessment incomplete. Need
additional imaging evaluation.
1 Negative. Routine mammogram
in 1 year recommended.
2 Benign finding. Routine mammogram
in 1 year recommended.
3 Probably benign finding. Short-interval
follow-up suggested.
4 Suspicious. Biopsy should
be considered.
5 Highly suggestive of malignancy.
Appropriate action should be taken.
Data from American College of Radiology. Breast Imaging
Reporting and Data System (BI-RADS). Reston, VA: College
of Radiology; 1995; with permission.
Table 2
Final assessment categories: number of lesions referred for biopsy and positive predictive value
BI-RADS category
Investigator 3 4 5
No. lesions referred for biopsy
Liberman [5] 8/492 (2) 355/492 (72) 129/492 (26)
Orel [6] 141/1312 (11) 936/1312 (71) 170/1312 (13)
Lacquement [4] 322/688 (47) 234/688 (34) 106/688 (15)
PPV
Liberman [5] 0/8 (0) 120/355 (34) 105/129 (81)
Orel [6] 3/141 (2) 279/936 (30) 165/170 (97)
Lacquement [4] 9/322 (3) 54/234 (23) 97/106 (92)
Numbers in parentheses are percentages.
PPV = positive predictive value, which is equal to the number of cancers divided by total number of lesions that underwent
biopsy in that category.
L. Liberman, J.H. Menell / Radiol Clin N Am 40 (2002) 409–430416
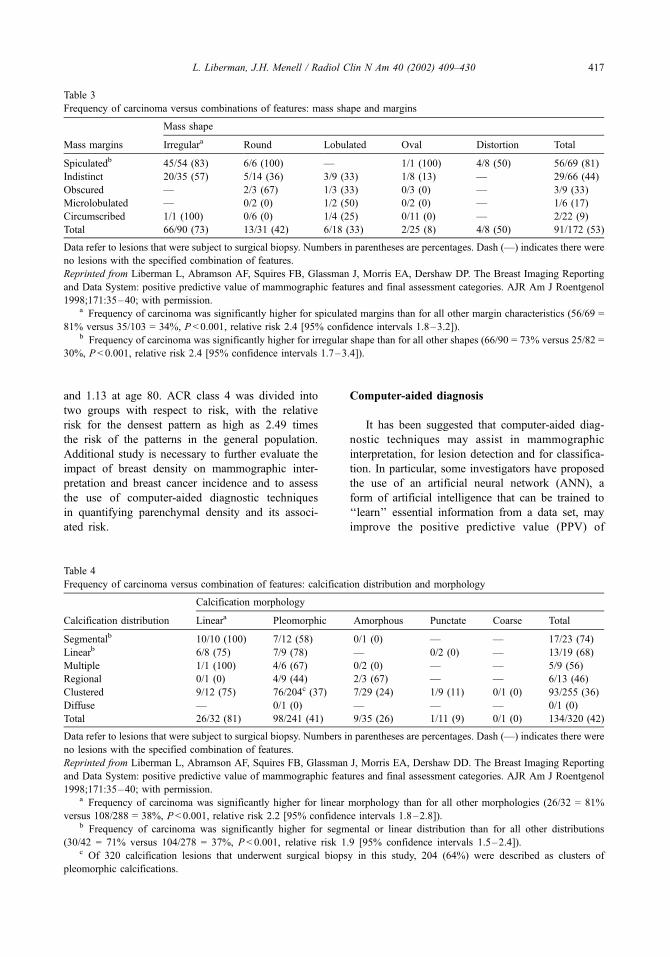
and 1.13 at age 80. ACR class 4 was divided into
two groups with respect to risk, with the relative
risk for the densest pattern as high as 2.49 times
the risk of the patterns in the general population.
Additional study is necessary to further evaluate the
impact of breast density on mammographic inter-
pretation and breast cancer incidence and to assess
the use of computer-aided diagnostic techniques
in quantifying parenchymal density and its associ-
ated risk.
Computer-aided diagnosis
It has been suggested that computer-aided diag-
nostic techniques may assist in mammographic
interpretation, for lesion detection and for classifica-
tion. In particular, some investigators have proposed
the use of an artificial neural network (ANN), a
form of artificial intelligence that can be trained to
‘‘learn’’ essential information from a data set, may
improve the positive predictive value (PPV) of
Table 3
Frequency of carcinoma versus combinations of features: mass shape and margins
Mass shape
Mass margins Irregulara Round Lobulated Oval Distortion Total
Spiculatedb 45/54 (83) 6/6 (100) — 1/1 (100) 4/8 (50) 56/69 (81)
Indistinct 20/35 (57) 5/14 (36) 3/9 (33) 1/8 (13) — 29/66 (44)
Obscured — 2/3 (67) 1/3 (33) 0/3 (0) — 3/9 (33)
Microlobulated — 0/2 (0) 1/2 (50) 0/2 (0) — 1/6 (17)
Circumscribed 1/1 (100) 0/6 (0) 1/4 (25) 0/11 (0) — 2/22 (9)
Total 66/90 (73) 13/31 (42) 6/18 (33) 2/25 (8) 4/8 (50) 91/172 (53)
Data refer to lesions that were subject to surgical biopsy. Numbers in parentheses are percentages. Dash (—) indicates there were
no lesions with the specified combination of features.
Reprinted from Liberman L, Abramson AF, Squires FB, Glassman J, Morris EA, Dershaw DP. The Breast Imaging Reporting
and Data System: positive predictive value of mammographic features and final assessment categories. AJR Am J Roentgenol
1998;171:35–40; with permission.a Frequency of carcinoma was significantly higher for spiculated margins than for all other margin characteristics (56/69 =
81% versus 35/103 = 34%, P < 0.001, relative risk 2.4 [95% confidence intervals 1.8–3.2]).b Frequency of carcinoma was significantly higher for irregular shape than for all other shapes (66/90 = 73% versus 25/82 =
30%, P < 0.001, relative risk 2.4 [95% confidence intervals 1.7–3.4]).
Table 4
Frequency of carcinoma versus combination of features: calcification distribution and morphology
Calcification morphology
Calcification distribution Lineara Pleomorphic Amorphous Punctate Coarse Total
Segmentalb 10/10 (100) 7/12 (58) 0/1 (0) — — 17/23 (74)
Linearb 6/8 (75) 7/9 (78) — 0/2 (0) — 13/19 (68)
Multiple 1/1 (100) 4/6 (67) 0/2 (0) — — 5/9 (56)
Regional 0/1 (0) 4/9 (44) 2/3 (67) — — 6/13 (46)
Clustered 9/12 (75) 76/204c (37) 7/29 (24) 1/9 (11) 0/1 (0) 93/255 (36)
Diffuse — 0/1 (0) — — — 0/1 (0)
Total 26/32 (81) 98/241 (41) 9/35 (26) 1/11 (9) 0/1 (0) 134/320 (42)
Data refer to lesions that were subject to surgical biopsy. Numbers in parentheses are percentages. Dash (—) indicates there were
no lesions with the specified combination of features.
Reprinted from Liberman L, Abramson AF, Squires FB, Glassman J, Morris EA, Dershaw DD. The Breast Imaging Reporting
and Data System: positive predictive value of mammographic features and final assessment categories. AJR Am J Roentgenol
1998;171:35–40; with permission.a Frequency of carcinoma was significantly higher for linear morphology than for all other morphologies (26/32 = 81%
versus 108/288 = 38%, P< 0.001, relative risk 2.2 [95% confidence intervals 1.8–2.8]).b Frequency of carcinoma was significantly higher for segmental or linear distribution than for all other distributions
(30/42 = 71% versus 104/278 = 37%, P < 0.001, relative risk 1.9 [95% confidence intervals 1.5–2.4]).c Of 320 calcification lesions that underwent surgical biopsy in this study, 204 (64%) were described as clusters of
pleomorphic calcifications.
L. Liberman, J.H. Menell / Radiol Clin N Am 40 (2002) 409–430 417

biopsy recommendations. Previous work in this area
was limited by lack of standardization of terminology,
diminishing the potential applicability of a common
artificial neural network to multiple institutions. By
providing standardized terminology, the BI-RADS
lexicon may facilitate progress in computer-aided
diagnostic techniques.
Baker et al [18] constructed an artificial neural
network based on the BI-RADS lexicon. Eighteen
inputs to the network included 10 BI-RADS lesion
descriptors and eight input values from the patient’s
medical history. The network was trained and tested
on 206 cases, of which 73 were malignant. They
found that at a specified output threshold, the ANN
would have improved the PPVof biopsy from 35% to
61%, with a relative sensitivity of 100%. At a fixed
sensitivity of 95%, the specificity of the ANN (62%)
was significantly higher than that of the radiologists
(30%) (P < 0.01). These data suggest that the BI-
RADS lexicon provides a standardized language
between mammographers and an ANN that can
improve the PPV of breast biopsy.
In a subsequent study, Baker et al [19] studied the
performance and interobserver and intraobserver vari-
ability of an artificial neural network for predicting
breast biopsy outcome. Five radiologists used the
BI-RADS terminology to describe 60 mammograph-
ically detected lesions, including 23 cancers. Interob-
server and intraobserver variability were evaluated
with the k statistic. They found that the ANN main-
tained 100% sensitivity while improving the PPV of
biopsy from 38% (23 of 60) to between 58% (23 of
40) and 66% (23 of 35; P< 0.001). Interobserver
variability for interpretation of the lesions was sig-
nificantly reduced by the ANN (P < 0.001); there was
no statistically significant effect on nearly perfect
intraobserver reproducibility. The authors concluded
that use of an ANN with radiologists’ descriptions of
abnormal findings might improve the interpretation
of mammographic abnormalities.
Limitations of the lexicon
Interobserver and intraobserver variability
The issue of variability in mammographic inter-
pretation has been a subject of intense scrutiny.
Elmore et al [20] published a study in which 10
radiologists reviewed 150 mammograms, including
27 in women with breast cancer. Immediate work-up
was recommended for 74% to 96% of women with
cancer and 11% to 65% of women without cancer.
Beam et al [21] reported results of 108 radiologists
who reviewed screening mammograms from 79
women, 45 of whom had cancer. Screening sensitiv-
ities ranged from 47% to 100%, and specificity
ranged from 36% to 99%. The wide variation noted
in these studies may be multifactorial, likely reflect-
ing differences in detection, intervention threshold,
and inclusion of subtle cases [22,23]. Reduction of
interobserver and intraobserver variability is a poten-
tial benefit of the BI-RADS lexicon.
Observer variability in the use of the BI-RADS
lexicon was first evaluated by Baker et al [24]. In that
study, 60 mammograms were evaluated independ-
ently by five radiologists; one radiologist read each
case twice. Readers were asked to select a single term
from the BI-RADS lexicon for a variety of lesion
descriptors. Interobserver and intraobserver variabil-
ity was assessed by means of the k statistic, with k �0.2 indicating slight agreement; k = 0.21–0.4, fair
agreement; k = 0.41–0.6, moderate agreement; k =
0.61–0.8, substantial agreement; and k = 0.81–1.0,
almost perfect agreement. Baker et al [24] noted
substantial agreement between readers for choosing
terms to describe masses and calcifications and sim-
ilar intraobserver agreement (Table 5). Considerable
interobserver and intraobserver variabilities were
noted for associated findings and special cases. Use
of terms to describe calcifications did not always
conform to BI-RADS–defined levels of suspicion.
Variability in mammographic interpretation has
also been assessed by Kerlikowske et al in a study
of 2616 mammograms, including 267 (10.2%) with
cancer, with agreement assessed using the k statistic
(Table 5). They found moderate agreement between
the two radiologist readers in reporting the presence of
a finding when cancer was present (k = 0.54) and
substantial agreement when cancer was not present
(k = 0.62). Agreement was moderate in assigning one
of the five assessment categories but was significantly
lower when cancer was present relative to when
cancer was not present (k = 0.46 vs 0.56; P = 0.02).
Agreement for reporting the presence of a finding and
mammographic assessment was 2-fold more likely for
examinations with less dense breasts. Intraobserver
agreement in final assessment (86%, k = 0.73) was
higher than interobserver agreement (78%, k = 0.58).
Berg et al [26] analyzed interobserver and intra-
observer variability in use of BI-RADS terminology.
Five experienced mammographers used the lexicon to
describe and assess 103 screening mammograms, of
which 30 (29%) showed cancer, and a subset of 86
diagnostic mammograms, including 23 (27%) that
showed cancer. A subset of 13 mammograms was
reviewed by each radiologist 2 months later. Agree-
ment, as measured by the k statistic, showed a wide
L. Liberman, J.H. Menell / Radiol Clin N Am 40 (2002) 409–430418
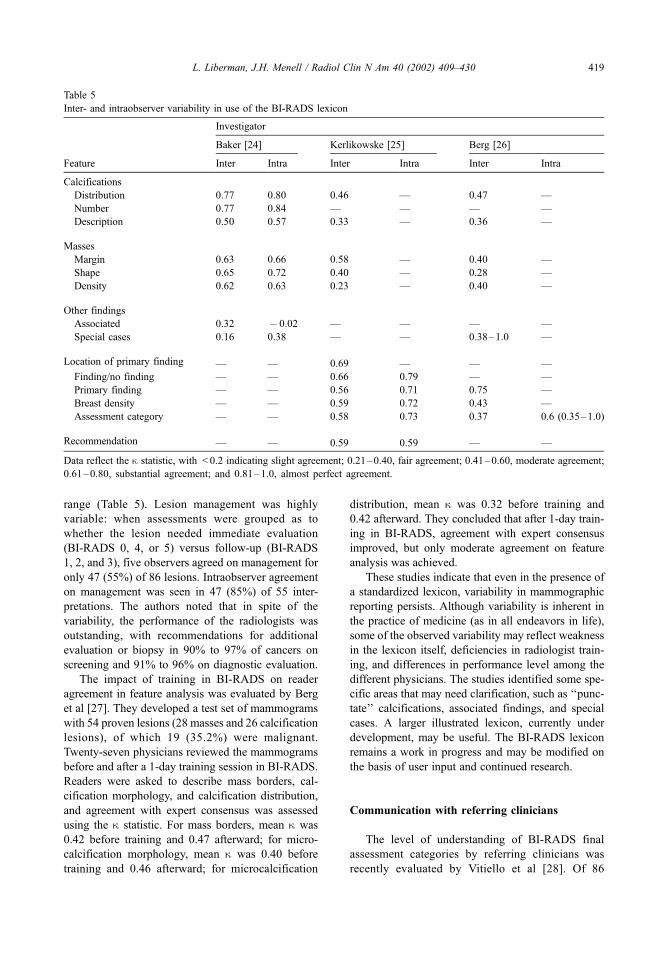
range (Table 5). Lesion management was highly
variable: when assessments were grouped as to
whether the lesion needed immediate evaluation
(BI-RADS 0, 4, or 5) versus follow-up (BI-RADS
1, 2, and 3), five observers agreed on management for
only 47 (55%) of 86 lesions. Intraobserver agreement
on management was seen in 47 (85%) of 55 inter-
pretations. The authors noted that in spite of the
variability, the performance of the radiologists was
outstanding, with recommendations for additional
evaluation or biopsy in 90% to 97% of cancers on
screening and 91% to 96% on diagnostic evaluation.
The impact of training in BI-RADS on reader
agreement in feature analysis was evaluated by Berg
et al [27]. They developed a test set of mammograms
with 54 proven lesions (28 masses and 26 calcification
lesions), of which 19 (35.2%) were malignant.
Twenty-seven physicians reviewed the mammograms
before and after a 1-day training session in BI-RADS.
Readers were asked to describe mass borders, cal-
cification morphology, and calcification distribution,
and agreement with expert consensus was assessed
using the k statistic. For mass borders, mean k was
0.42 before training and 0.47 afterward; for micro-
calcification morphology, mean k was 0.40 before
training and 0.46 afterward; for microcalcification
distribution, mean k was 0.32 before training and
0.42 afterward. They concluded that after 1-day train-
ing in BI-RADS, agreement with expert consensus
improved, but only moderate agreement on feature
analysis was achieved.
These studies indicate that even in the presence of
a standardized lexicon, variability in mammographic
reporting persists. Although variability is inherent in
the practice of medicine (as in all endeavors in life),
some of the observed variability may reflect weakness
in the lexicon itself, deficiencies in radiologist train-
ing, and differences in performance level among the
different physicians. The studies identified some spe-
cific areas that may need clarification, such as ‘‘punc-
tate’’ calcifications, associated findings, and special
cases. A larger illustrated lexicon, currently under
development, may be useful. The BI-RADS lexicon
remains a work in progress and may be modified on
the basis of user input and continued research.
Communication with referring clinicians
The level of understanding of BI-RADS final
assessment categories by referring clinicians was
recently evaluated by Vitiello et al [28]. Of 86
Table 5
Inter- and intraobserver variability in use of the BI-RADS lexicon
Investigator
Baker [24] Kerlikowske [25] Berg [26]
Feature Inter Intra Inter Intra Inter Intra
Calcifications
Distribution 0.77 0.80 0.46 — 0.47 —
Number 0.77 0.84 — — — —
Description 0.50 0.57 0.33 — 0.36 —
Masses
Margin 0.63 0.66 0.58 — 0.40 —
Shape 0.65 0.72 0.40 — 0.28 —
Density 0.62 0.63 0.23 — 0.40 —
Other findings
Associated 0.32 � 0.02 — — — —
Special cases 0.16 0.38 — — 0.38–1.0 —
Location of primary finding — — 0.69 — — —
Finding/no finding — — 0.66 0.79 — —
Primary finding — — 0.56 0.71 0.75 —
Breast density — — 0.59 0.72 0.43 —
Assessment category — — 0.58 0.73 0.37 0.6 (0.35–1.0)
Recommendation — — 0.59 0.59 — —
Data reflect the k statistic, with < 0.2 indicating slight agreement; 0.21–0.40, fair agreement; 0.41–0.60, moderate agreement;
0.61–0.80, substantial agreement; and 0.81–1.0, almost perfect agreement.
L. Liberman, J.H. Menell / Radiol Clin N Am 40 (2002) 409–430 419

clinicians who responded to a survey, 46% were not
aware that radiologists were required to report mam-
mograms using BI-RADS terminology, 64% had no
information or education regarding BI-RADS, and
only 35% were comfortable with reports using BI-
RADS. For patients with a BI-RADS category 3 (pro-
bably benign) reading, 93% of clinicians followed the
radiologist’s recommendation for short-term radio-
logic follow-up; in addition, 62% of clinicians sent
BI-RADS 3 patients for further work-up, including
physical examination in their offices, surgical consul-
tation, or both. These results indicate that many re-
ferring clinicians have little knowledge of BI-RADS
and are not comfortable with it. If the goal of improv-
ing communication is to be achieved, further edu-
cation is needed.
Toward a lexicon for breast sonography
Lesion characterization
The classic teaching has been that breast sono-
graphy can provide excellent differentiation of cystic
(Fig. 7) from solid (Fig. 8) masses but that it is of
limited usefulness in distinguishing benign from
malignant solid masses in the breast. Data from
Stavros et al [29] challenge this paradigm.
Stavros et al [29] published results of 750 sono-
graphically solid breast nodules that were prospec-
tively classified as benign, indeterminate, or malignant
(Fig. 9). They defined specific features they con-
sidered malignant (Table 6) and other specific
features they considered benign (Table 7). If a sin-
gle malignant feature was present, the nodule was
excluded from the benign classification. If one of
the three combinations of benign characteristics was
found (Table 7), the lesion was classified as benign.
If no malignant features were found and none of
the combinations of benign characteristics was
present, the lesion was classified as indeterminate.
In 1 of 5 groups, mammograms were also classified
as negative, probably benign, indeterminate, prob-
ably malignant, and malignant, a classification that
preceded the BI-RADS lexicon. All lesions under-
went biopsy.
Of the 750 nodules, 625 (83%) were benign and
125 (17%) were malignant. The sonographic clas-
sification had a sensitivity of 98.4% (123 of 125),
specificity of 67.8% (424 of 625), positive predictive
value of 38.0% (123 of 324), negative predictive
value of 99.5% (424 of 426), and accuracy of
Fig. 7. Sonography of a simple cyst. Characteristics of a simply cyst include a thin wall, no internal echoes, round/oval shape,
and posterior acoustic enhancement.
L. Liberman, J.H. Menell / Radiol Clin N Am 40 (2002) 409–430420

72.9% (547 of 750). Of particular interest is the
negative predictive value of 99.5%. This indicates
that of lesions classified as benign by sonographic
criteria, only 0.5% were cancer; note that this is
identical to the frequency of cancer among probably
benign (BI-RADS category 3) lesions in the study by
Sickles [8]. These data suggest that ultrasound may
help identify lesions that have an overwhelmingly
high likelihood of benignity and can be safely eval-
uated with short-term follow-up imaging.
The study of Stavros et al [29] also indicates that
sonography can increase the radiologist’s level of
suspicion for lesions that prove to be cancer. Among
125 cancers, 64 (51.2%) were classified as benign
(n = 20) or indeterminate (n = 44) by mammography
but malignant by sonography. Among 44 palpable
cancers, 32 (72.3%) were classified as benign (n = 16)
or indeterminate (n = 16) by mammography but
malignant by sonography.
Berg et al [30] correlated sonographic features
with risk of malignancy in 588 lesions that under-
went biopsy in the Radiologic Diagnostic Oncology
Group V study, of which 116 (20%) were malig-
nant. The shape feature most predictive of malig-
nancy was irregular, with PPV of 65% for irregular,
13% for lobular, 12% for round, and 8% for oval
masses. The posterior attenuation feature most pre-
dictive of malignancy was shadowing, present in
half the malignant lesions; PPV was 32% for
shadowing, 15% for no posterior characteristics,
and 8% for posterior acoustic enhancement. Malig-
nancy was present in 34% of lesions that had
heterogeneous echotexture without cysts, 14% of
homogeneous lesions, and 13% of heterogeneous
lesions with cysts. Echogenicity did not discrim-
inate between benign and malignant lesions, with
PPV of 21%, 18%, and 9% for hypoechoic, hyper-
echoic, and isoechoic lesions, respectively. These
data lend further support to the role of sonography
in lesion characterization and help provide a scient-
ific basis for the development of a BI-RADS
lexicon for ultrasound.
Lexicon development
The ACR has developed an initial draft of a
breast ultrasound lexicon [31], supported by the
Office on Women’s Health, Department of Health
Fig. 8. Biopsy-proven fibroadenoma at sonography. Note the circumscribed borders, oval shape that is wider than it is tall, and
echogenic capsule. Minimal posterior acoustic shadowing is present.
L. Liberman, J.H. Menell / Radiol Clin N Am 40 (2002) 409–430 421
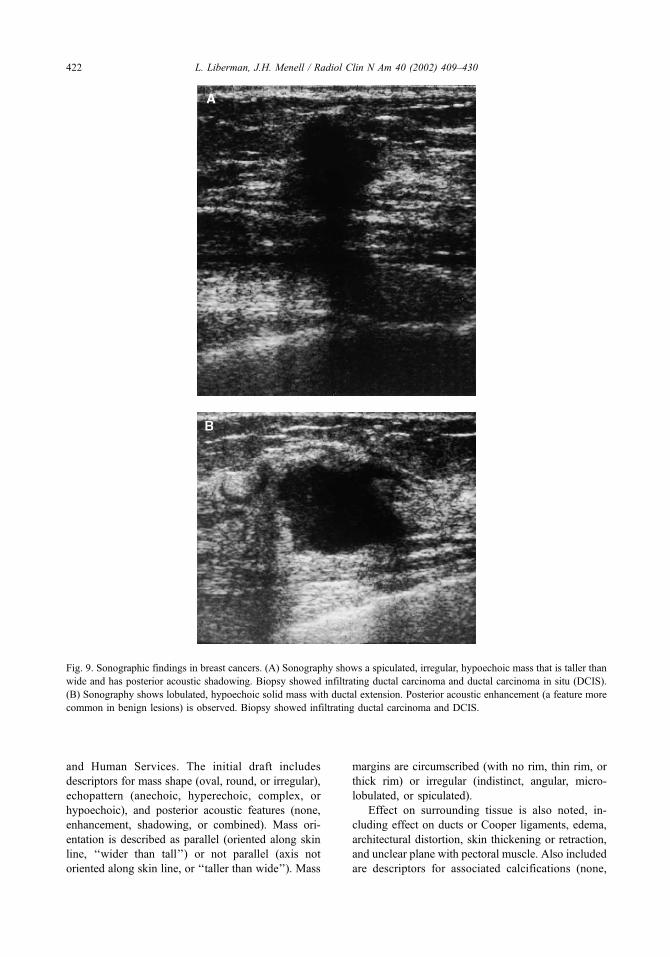
and Human Services. The initial draft includes
descriptors for mass shape (oval, round, or irregular),
echopattern (anechoic, hyperechoic, complex, or
hypoechoic), and posterior acoustic features (none,
enhancement, shadowing, or combined). Mass ori-
entation is described as parallel (oriented along skin
line, ‘‘wider than tall’’) or not parallel (axis not
oriented along skin line, or ‘‘taller than wide’’). Mass
margins are circumscribed (with no rim, thin rim, or
thick rim) or irregular (indistinct, angular, micro-
lobulated, or spiculated).
Effect on surrounding tissue is also noted, in-
cluding effect on ducts or Cooper ligaments, edema,
architectural distortion, skin thickening or retraction,
and unclear plane with pectoral muscle. Also included
are descriptors for associated calcifications (none,
Fig. 9. Sonographic findings in breast cancers. (A) Sonography shows a spiculated, irregular, hypoechoic mass that is taller than
wide and has posterior acoustic shadowing. Biopsy showed infiltrating ductal carcinoma and ductal carcinoma in situ (DCIS).
(B) Sonography shows lobulated, hypoechoic solid mass with ductal extension. Posterior acoustic enhancement (a feature more
common in benign lesions) is observed. Biopsy showed infiltrating ductal carcinoma and DCIS.
L. Liberman, J.H. Menell / Radiol Clin N Am 40 (2002) 409–430422
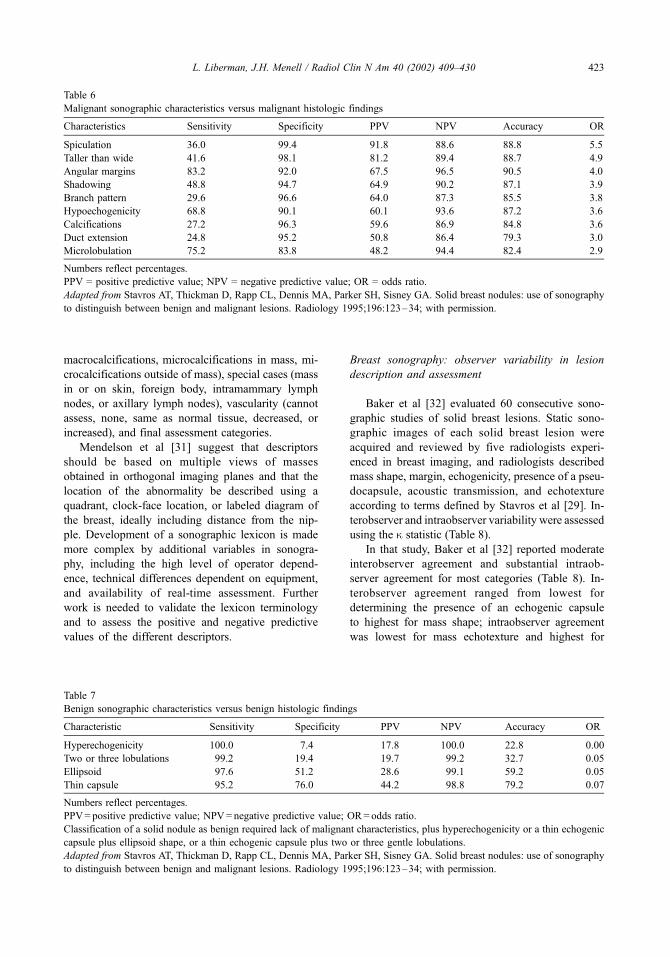
macrocalcifications, microcalcifications in mass, mi-
crocalcifications outside of mass), special cases (mass
in or on skin, foreign body, intramammary lymph
nodes, or axillary lymph nodes), vascularity (cannot
assess, none, same as normal tissue, decreased, or
increased), and final assessment categories.
Mendelson et al [31] suggest that descriptors
should be based on multiple views of masses
obtained in orthogonal imaging planes and that the
location of the abnormality be described using a
quadrant, clock-face location, or labeled diagram of
the breast, ideally including distance from the nip-
ple. Development of a sonographic lexicon is made
more complex by additional variables in sonogra-
phy, including the high level of operator depend-
ence, technical differences dependent on equipment,
and availability of real-time assessment. Further
work is needed to validate the lexicon terminology
and to assess the positive and negative predictive
values of the different descriptors.
Breast sonography: observer variability in lesion
description and assessment
Baker et al [32] evaluated 60 consecutive sono-
graphic studies of solid breast lesions. Static sono-
graphic images of each solid breast lesion were
acquired and reviewed by five radiologists experi-
enced in breast imaging, and radiologists described
mass shape, margin, echogenicity, presence of a pseu-
docapsule, acoustic transmission, and echotexture
according to terms defined by Stavros et al [29]. In-
terobserver and intraobserver variability were assessed
using the k statistic (Table 8).
In that study, Baker et al [32] reported moderate
interobserver agreement and substantial intraob-
server agreement for most categories (Table 8). In-
terobserver agreement ranged from lowest for
determining the presence of an echogenic capsule
to highest for mass shape; intraobserver agreement
was lowest for mass echotexture and highest for
Table 6
Malignant sonographic characteristics versus malignant histologic findings
Characteristics Sensitivity Specificity PPV NPV Accuracy OR
Spiculation 36.0 99.4 91.8 88.6 88.8 5.5
Taller than wide 41.6 98.1 81.2 89.4 88.7 4.9
Angular margins 83.2 92.0 67.5 96.5 90.5 4.0
Shadowing 48.8 94.7 64.9 90.2 87.1 3.9
Branch pattern 29.6 96.6 64.0 87.3 85.5 3.8
Hypoechogenicity 68.8 90.1 60.1 93.6 87.2 3.6
Calcifications 27.2 96.3 59.6 86.9 84.8 3.6
Duct extension 24.8 95.2 50.8 86.4 79.3 3.0
Microlobulation 75.2 83.8 48.2 94.4 82.4 2.9
Numbers reflect percentages.
PPV = positive predictive value; NPV = negative predictive value; OR = odds ratio.
Adapted from Stavros AT, Thickman D, Rapp CL, Dennis MA, Parker SH, Sisney GA. Solid breast nodules: use of sonography
to distinguish between benign and malignant lesions. Radiology 1995;196:123–34; with permission.
Table 7
Benign sonographic characteristics versus benign histologic findings
Characteristic Sensitivity Specificity PPV NPV Accuracy OR
Hyperechogenicity 100.0 7.4 17.8 100.0 22.8 0.00
Two or three lobulations 99.2 19.4 19.7 99.2 32.7 0.05
Ellipsoid 97.6 51.2 28.6 99.1 59.2 0.05
Thin capsule 95.2 76.0 44.2 98.8 79.2 0.07
Numbers reflect percentages.
PPV= positive predictive value; NPV= negative predictive value; OR= odds ratio.
Classification of a solid nodule as benign required lack of malignant characteristics, plus hyperechogenicity or a thin echogenic
capsule plus ellipsoid shape, or a thin echogenic capsule plus two or three gentle lobulations.
Adapted from Stavros AT, Thickman D, Rapp CL, Dennis MA, Parker SH, Sisney GA. Solid breast nodules: use of sonography
to distinguish between benign and malignant lesions. Radiology 1995;196:123–34; with permission.
L. Liberman, J.H. Menell / Radiol Clin N Am 40 (2002) 409–430 423

mass shape. Variability in descriptions contributed
to interobserver and intraobserver inconsistency in
assessing the likelihood of malignancy. It is likely
the interobserver variability would be even higher
if real-time imaging were incorporated into the
analysis. Additional work will be necessary to
evaluate the interobserver and intraobserver vari-
ability in the finalized version of the ACR breast
ultrasound lexicon.
Toward a lexicon for breast MRI
Lexicon development
Magnetic resonance imaging of the breast has
high sensitivity in the detection of breast cancer,
reported as up to 100% in some series, but has
lower specificity, ranging from 37% to 97% [33].
Parenchymal breast MRI is also an expensive exa-
Table 8
Inter- and intraobserver variability in evaluation of sonography of solid breast masses
Interobserver Reproducibility Intraobserver Reproducibility
Echogenic pseudocapsule 0.09 Slight 0.63 Substantial
Echogenicity 0.40 Fair 0.69 Substantial
Margin 0.43 Moderate 0.62 Substantial
Echotexture 0.44 Moderate 0.24 Fair
Acoustic transmission 0.55 Moderate 0.63 Substantial
Shape 0.80 Substantial 0.79 Substantial
Final assessment 0.51 Moderate 0.66 Substantial
Data reflect the k statistic, with < 0.2 indicating slight agreement; 0.21–0.40, fair agreement; 0.41–0.60, moderate agreement;
0.61–0.80, substantial agreement; and 0.81–1.0, almost perfect agreement.
Adapted from Baker JA, Kornguth PJ, Soo MS, Walsh R, Mengoni P. Sonography of solid breast lesions: observer variability of
lesion description and assessment. AJR Am J Roentgenol 1999;172:1621–5; with permission.
Fig. 10. MRI of fibroadenoma. Sagittal, T1-weighted, contrast-enhanced image shows a lobulated enhancing mass with non-
enhancing internal septations.
L. Liberman, J.H. Menell / Radiol Clin N Am 40 (2002) 409–430424

mination that requires the injection of intravenous
contrast material. Published work supports the use-
fulness of MRI in specific scenarios, such as
identification of occult carcinoma, problem-solving,
local staging of breast cancer (including skin or
pectoral muscle involvement), and (potentially) high-
risk screening [33,34]. Progress in breast MRI has
been limited by lack of standardization in image
acquisition and image interpretation, with some
methods focusing on morphology (spatial res-
olution) and others stressing kinetics (tempo-
ral resolution).
Fig. 11. MRI patterns of breast cancers in sagittal, T1-weighted, contrast-enhanced images. (A) Spiculated, irregular enhanced
mass in superior breast; biopsy yielded infiltrating ductal carcinoma and ductal carcinoma in situ (DCIS). Note suboptimal fat
suppression inferiorly. (B) Lobulated mass with heterogeneous and rim enhancement; histologic analysis yielded infiltrating
ductal carcinoma and DCIS. (C) Extensive linear and segmental clumped enhancement; biopsy yielded DCIS.
L. Liberman, J.H. Menell / Radiol Clin N Am 40 (2002) 409–430 425

In 1997, Nunes et al [35] analyzed the diagnostic
accuracy of specific architectural (morphologic) fea-
tures identified during breast MRI in 93 women.
Architectural features that were highly predictive of
benign disease included smooth or lobulated borders
(97% to 100%), the absence of mass enhancement
(100%), and enhancement that was less than the
enhancement of surrounding fibroglandular tissue
(93% to 100%). Nonenhancing internal septations,
present in 9 of 14 (64%) fibroadenomas in a sub-
sequent study, were specific for the diagnosis of fib-
roadenoma and correlated with collagenous bands at
histologic analysis (Fig. 10). Architectural features
that were highly predictive of carcinoma included
spiculated borders (76–88%) and peripheral rim
enhancement in the presence of central lesion
enhancement (79–92%) (Fig. 11).
In 1999, Kuhl et al [36] assessed the relevance of
signal-intensity time-course analysis (kinetics) for the
differential diagnosis of enhancing lesions in breast
MRI in a study of 266 breast lesions, of which 101
(40.0%) were malignant. They classified enhance-
ment curves as type 1, steady; type 2, plateau; or
type 3, washout (Fig. 12). A washout pattern was sig-
nificantly more frequently observed in cancers than
in benign lesions (Table 9). The diagnostic indices
for time signal intensity curves were sensitivity, 91%;
specificity, 83%; and diagnostic accuracy, 86%. There
was almost perfect interobserver agreement in categor-
izing the shape of the time signal intensity curve, with
k = 0.85. The shape of the time signal intensity curve
was a more useful predictor of malignancy than the
rate of enhancement (Table 9).
Supported by the Office of Women’s Health and
the ACR, The International Working Group on Breast
MRI Imaging is developing a lexicon of terms for
breast MRI reporting, the first version of which was
published in 1999 [37]. Schnall and Ikeda [37] sug-
gested that MRI reports include descriptions of clin-
ical abnormalities, previous biopsies, hormonal status,
Fig. 12. Schematic drawing of time-signal intensity curve types. Type 1 (persistent or steady) corresponds to a straight (1a) or
curved (1b) line; enhancement continues over the entire dynamic study. Type II is a plateau curve with a sharp bend after the
initial upstroke. Type III is a washout time course. SIc = signal intensity after contrast enhancement; SI = signal intensity before
contrast injection. (Data from Kuhl CK, Mielcareck P, Klaschik S, et al. Dynamic breast MR imaging: are signal intensity time
course data useful for differential diagnosis of enhancing lesions? Radiology 1999;211:101–110; with permission.)
L. Liberman, J.H. Menell / Radiol Clin N Am 40 (2002) 409–430426

and comparison with prior studies. Technical factors
should be stated, including the location of markers and
significance, magnet field strength, use of a dedicated
breast coil, contrast media, pulse sequence, anatomy
(including slice thickness and scan orientation and
plane), and post-processing techniques. Findings
described should include mention of artifacts that
affect interpretation, breast composition, implants,
and presence or absence of abnormal enhancement,
with specific descriptors defined for focal enhance-
ment, kinetics, summary impression, and recommen-
dations. Descriptive terms for breast MRI were
elegantly illustrated by Morris [38].
Although limited data validate the assignment of
final assessment categories based on MRI findings,
guidelines were suggested by Kuhl et al [39] in an
investigation of breast MRI for high-risk screening.
In that study, BI-RADS category 1 was assigned to
lesions without any contrast material enhancement.
BI-RADS category 2 was assigned to lesions in
which enhancement was detected but was classified
as benign (focal masses with well-circumscribed
morphology, internal septations but otherwise homo-
geneous enhancement, steady time-signal intensity
course, and centrifugal progression of enhancement;
or non-mass-related gradual enhancement). BI-RADS
category 3 was assigned to lesions compatible with
‘‘unidentified bright objects’’ or UBOs (spontaneous,
hormone-induced enhancement) and in lesions with
presumably benign masses that lacked some of the
BI-RADS category 2 features.
BI-RADS category 4 was assigned to lesions with
a washout time course, irrespective or morphology, or
lesions with suspicious morphology, irrespective of
Table 9
Breast MRI: time signal intensity curves as predictors of
malignancy
Cancers
(n = 101)
Benign lesions
(n = 165)
Time signal intensity curve
Type I (steady) 8.9 83.0
Type II (plateau) 33.6 11.5
Type III (washout) 57.4 5.5
Enhancement rate
Slow 9.0 36.9
Intermediate 25.7 28.5
Fast 65.3 34.5
Numbers reflect the proportion of cancers or benign lesions
that had the kinetic features shown. Enhancement rate was
defined as the signal intensity increase on the first
postcontrast image, with slow being an increase less than
or equal to 60%, intermediate being an increase of more than
60% and less than or equal to 80%, and fast being an
increase of more than 80%.
Adapted from Kuhl CK, Mielcareck P, Klaschik S, et al.
Dynamic breast MR imaging: are signal intensity time
course data useful for differential diagnosis of enhancing
lesions? Radiology 1999;211:101–110; with permission.
Descriptive terms for breast MRI
Focus/foci
Mass marginSmoothIrregularSpiculated
Mass shapeOvalRoundLobulatedIrregular
Mass enhancementHomogeneousHeterogeneousRimDark internal septationsEnhancing internal septationsCentral enhancement
Non-mass enhancementLinear (smooth, irregular, or clumped)SegmentalRegionalMultiple regionsDiffuse
Non-mass enhancement descriptors for allother types
HomogeneousHeterogeneousStippled/punctateClumpedSeptal/dendritic
Symmetric versus asymmetric for bi-lateral studies
Adapted from Morris EA. Illustratedbreast MR lexicon. In: Miller WT, BertWA, editors. Seminars in roentgenology.Breast imaging. Vol. 36. Philadelphia: WBSaunders; 2001. p. 238–49; with per-mission.
L. Liberman, J.H. Menell / Radiol Clin N Am 40 (2002) 409–430 427

kinetics. Morphology was suspect if there was spicu-
lated or irregular lesion configuration, heterogeneous
internal architecture (particularly rim enhancement),
and asymmetric segmental or linear enhancement (see
Fig. 11). BI-RADS category 5 was attributed to
lesions in which morphologic and architectural fea-
tures were suggestive of malignancy. Further work is
needed to validate this approach.
Potential usefulness of the breast MRI lexicon
Preliminary work supports the usefulness of a BI-
RADS lexicon for MRI-detected lesions. Kim et al
[40] described the magnetic resonance appearance of
72 focally enhancing infiltrating breast carcinomas.
They reported that mass margins were spiculated in
34 (47%), indistinct in 22 (31%), circumscribed in 15
(21%), and obscured in 1 (1%). Mass shape was
irregular in 41 (57%), lobular in 16 (22%), round in
10 (14%), and oval in 5 (7%). Enhancement pattern
was heterogeneous in 43 (60%), homogeneous in 15
(21%), and rim in 14 (19%). BI-RADS final impres-
sion was 3 in 3 (4%), 4 in 26 (36%), and 5 in 43
(60%). There was moderate interobserver agreement
for mass margins (k = 0.46), mass shape (k = 0.41),
and enhancement pattern (k = 0.56).
Siegmann et al [41] reviewed MRI and histologic
findings in 70 exclusively MRI-detected lesions that
were prospectively classified as BI-RADS analogous
class 3 (probably benign), class 4 (suspicious), or
class 5 (highly suggestive of malignancy). The
frequency of carcinoma was 0% (0 of 4) for class
3, 23.7% (14 of 59) for class 4, and 85.7% (6 of 7)
for class 5, comparable to the frequency of carcino-
ma for analogous classes in studies of the BI-RADS
lexicon for mammography [42–44]. Few details are
given regarding criteria for assigning different final
assessment categories; this should be clarified in
future work.
Precise definition of terms facilitates studies into
PPV of specific MRI features. Morakkabati et al [45]
reported a pattern of segmental or ductal enhance-
ment in 19 (3.8%) of 500 consecutive patients who
underwent dynamic breast MRI. Segmental enhance-
ment occurred in 14 of 19 patients, 10 of whom had
DCIS and 4 of whom had fibrocystic change. Ductal
enhancement was seen in 5 of 19 patients, 1 of
whom had DCIS and 4 of whom had benign findings
(1 papilloma and 3 fibrocystic change). The PPV of
segmental or ductal enhancement was 58% (11 of
19), and the specificity of this criterion was 98% (481
of 489). The authors concluded that ductal or seg-
mental enhancement was an infrequent finding on
breast MRI but that it had high PPV for malignancy.
The breast MRI lexicon is a work in evolution.
Standardization of technique would help in the devel-
opment of the breast MRI lexicon. Further research
into the positive and negative predictive values of
specific MRI features will be of great value in the
complex business of interpreting breast MR images
and would allow more women to benefit from the use
of breast MRI in the detection and local staging of
breast cancer.
Summary and future directions
The BI-RADS lexicon was created to standardize
mammographic reporting, thereby enabling better
communication, improving clarity in reporting, and
facilitating research. The lexicon has enabled studies
that have better defined the positive predictive value
of specific mammographic features and has contrib-
uted to progress in computer-aided diagnosis. In spite
of the lexicon’s goal of standardization, considerable
interobserver and intraobserver variability in mammo-
graphic interpretation persists. Further work is neces-
sary to refine the lexicon, to assess training techniques
for lexicon use, and to further develop and validate
lexicons for breast sonography, breast MRI, and other
new imaging modalities as they become available.
References
[1] American College of Radiology. Breast imaging re-
porting and data system (BI-RADS). Reston, VA:
American College of Radiology; 1995.
[2] American College of Radiology. Illustrated breast
imaging reporting and data system (BI-RADSTM). Re-
ston, VA: American College of Radiology; 1998.
[3] D’Orsi CJ, Kopans DB. Mammographic feature anal-
ysis. Semin Roentgenol 1993;28:204–30.
[4] Lacquement MA, Mitchell D, Hollingsworth AB. Pos-
itive predictive value of the Breast Imaging Reporting
and Data System. J Am Coll Surg 1999;189:34–40.
[5] Liberman L, Abramson AF, Squires FB, Glassman J,
Morris EA, Dershaw DD. The Breast Imaging Report-
ing and Data System: positive predictive value of
mammographic features and final assessment catego-
ries. AJR Am J Roentgenol 1998;171:35–40.
[6] Orel SG, Kay N, Reynolds C, Sullivan DC. BI-RADS
categorization as a predictor of malignancy. Radiology
1999;211:845–50.
[7] Caplan LS, Blackman D, Nadel M, Monticciolo DL.
Coding mammograms using the classification ‘‘prob-
ably benign’’ finding short interval follow-up sug-
gested. AJR Am J Roentgenol. 1999;172:339–42.
[8] Sickles EA. Periodic mammographic follow-up of
L. Liberman, J.H. Menell / Radiol Clin N Am 40 (2002) 409–430428

probably benign lesions: results of 3,184 consecutive
cases. Radiology 1991;179:463–8.
[9] Sickles EA. Nonpalpable, circumscribed, noncalcified
solid breast masses: likelihood of malignancy based on
lesion size and age of patient. Radiology 1994;192:
439–42.
[10] Varas X, Leborgne F, Leborgne JH. Nonpalpable,
probably benign lesions: role of follow-up mammog-
raphy. Radiology 1992;184:409–14.
[11] Sickles EA. Probably benign breast lesions: when
should follow-up be recommended and what is the op-
timal follow-up protocol? Radiology 1999;213:11–4.
[12] Rubin E. Six-month follow-up: an alternative view.
Radiology 1999;213:15–8.
[13] Saftlas AF, Wolfe JN, Hoover RN, Brinton LA,
Schairer C, Salane M, et al. Mammographic parenchy-
mal patterns as indicators of breast cancer risk. Am J
Epidemiol 1989;129:518–26.
[14] Whitehead J, Carlile T, Kopecky KJ, Thompson DJ,
Gilbert FI Jr, Present AJ, et al. The relationship be-
tween Wolfe’s classification of mammograms, accep-
ted breast cancer risk factors, and the incidence of
breast cancer. Am J Epidemiol 1985;122:994–1006.
[15] Wolfe JN. Breast patterns as an index of risk for devel-
oping breast cancer. AJR Am J Roentgenol 1976;126:
1130–9.
[16] Mandelson MT, Oestreicher N, Porter PL, White D,
Finder CA, Taplin SH, et al. Breast density as a pre-
dictor of mammographic detection: comparison of in-
terval- and screen-detected cancers. J Natl Cancer Inst
2000;92:1081–7.
[17] Satija S, Moore RH, Michaelson JS, Halpern E, Slanetz
PJ, Kopans DB. Breast tissue patterns as a risk factor
for developing cancer [abstract]. Radiology 2000;
217(P):446.
[18] Baker JA, Kornguth PJ, Lo JY, Williford ME, Floyd
CE Jr. Breast cancer: prediction with artificial neural
network based on BI-RADS standardized lexicon. Ra-
diology 1995;196:817–22.
[19] Baker JA, Kornguth PJ, Lo JY, Floyd CE Jr. Artificial
neural network: improving the quality of breast biopsy
recommendations. Radiology 1996;198:131–5.
[20] Elmore JG, Wells CK, Lee CH, Howard DH, Feinstein
AR. Variability in radiologists’ interpretations of mam-
mograms. N Engl J Med 1994;331:1493–9.
[21] Beam CA, Layde PM, Sullivan DC. Variability in the
interpretation of screening mammograms by US radi-
ologists: findings from a national sample. Arch Intern
Med 1996;156:209–13.
[22] D’Orsi CJ, Swets JA. Variability in the interpretation of
mammograms [letter]. N Engl J Med 1995;332:1172.
[23] Kopans DB. The accuracy of mammographic interpre-
tation. N Engl J Med 1994;331:1521–2.
[24] Baker JA, Kornguth PJ, Floyd CE Jr. Breast Imaging
Reporting and Data System standardized mammogra-
phy lexicon: observer variability in lesion description.
AJR Am J Roentgenol 1996;166:773–8.
[25] Kerlikowske K, Grady D, Barclay J, Fraakel SD,
Dminsky SH, Sickles EA, et al. Variability and accu-
racy in mammographic interpretation using the Amer-
ican College of Radiology Breast Imaging Reporting
and Data System. J Natl Cancer Inst 1998;90:1801–9.
[26] Berg WA, Campassi C, Langenberg P, Sexton MJ.
Breast Imaging Reporing and Data System: inter-
and intraobserver variability in feature analysis and
final assessment. AJR Am J Roentgenol 2000;174:
1769–77.
[27] Berg WA, D’Orsi CJ, Jackson VP, Bassett LW, Beam
CA, Crewson PE. Effect of training in BI-RADStm on
reader agreement in feature analysis in mammography
[abstract]. Radiology 2000;217(P):571.
[28] Vitiello SM, Philpotts LE, Tocino I, Horvath LJ, Lee
CH. Understanding of BI-RADS among referring clini-
cians: do they get it [abstract]? AJR Am J Roentgen-
ol 2000;174(Suppl):64.
[29] Stavros AT, Thickman D, Rapp CL, Dennis MA,
Parker SH, Sisney GA. Solid breast nodules: use of
sonography to distinguish between benign and malig-
nant lesions. Radiology 1995;196:123–34.
[30] Berg WA, Fajardo LL, Pisano ED, Gatsonis C, McNeil
BJ. Correlation of sonographic findings with risk of
malignancy: the RDOGV experience [abstract]. Radi-
ology 1999;213(P):107.
[31] Mendelson EB, Berg WA, Merrit CRB. Toward a
standardized breast ultrasound lexicon, BI-RADS: ul-
trasound. In: Miller WT, Berg WA, editors. Seminars
in roentgenology, vol 36: breast imaging. Philadelphia,
PA: WB Saunders; 2001. p. 217–25.
[32] Baker JA, Kornguth PJ, Soo MS, Walsh R, Mengoni P.
Sonography of solid breast lesions: observer variability
of lesion description and assessment. AJR Am J Roent-
genol. 1999;172:1621–5.
[33] Orel SG, Schnall MD. MR imaging of the breast for
the detection, diagnosis, and staging of breast cancer.
Radiology 2001;220:13–30.
[34] Morris EA. Review of breast MRI: indications and
limitations. In: Miller WT, Berg WA, editors. Seminars
in roentgenology, vol. 36: breast imaging. Philadel-
phia, PA: WB Saunders; 2001. p. 226–37.
[35] Nunes LW, Schnall MD, Orel SG, Hachman MG, Lan-
glotz CP, Reynolds CA, et al. Breast MR imaging:
interpretation model. Radiology 1997;202:833–41.
[36] Kuhl CK, Mielcareck P, Klaschik S, Leutner C, War-
delmann E, Gieseke J, et al. Dynamic breast MR imag-
ing: are signal intensity time course data useful for
differential diagnosis of enhancing lesions? Radiology
1999;211:101–10.
[37] Schnall MD, Ikeda DM. Lesion diagnosis working
group report. J Magn Reson Imaging 1999;10:982–90.
[38] Morris EA. Illustrated breast MR lexicon. In: Miller
WT, Berg WA, editors. Seminars in roentgenology,
vol. 36: breast imaging. Philadelphia, PA: WB Saun-
ders; 2001. p. 238–49.
[39] Kuhl CK, Schmutzler RK, Leutner CC, Kempe A,
Wardelmann E, Hocke A, et al. Breast MR imaging
screening in 192 women proved or suspected to be
carriers of a breast cancer susceptibility gene: prelimi-
nary results. Radiology 2000;215:267–79.
L. Liberman, J.H. Menell / Radiol Clin N Am 40 (2002) 409–430 429

[40] Kim SJ, Morris EA, Liberman L, Ballon DJ, LaTrenta
LR, Hadar O, et al. Magnetic resonance appearance of
focal infiltrating carcinomas [abstract]. Radiology
1999;213(P):454.
[41] SiegmannKC, Fersis N, Ruck P, Claussen CD,Mueller-
Schimpfle MP. Positive predictive value of MR cha-
racteristics and BI-RADS-analogous categories of
exclusively MR detected breast lesions [abstract]. Radi-
ology 2000;217(P):524.
[42] Lacquement MA, Mitchell D, Hollingsworth AB. Pos-
itive predictive value of the Breast Imaging Reporting
and Data System. J Am Coll Surg 1999;189:34–40.
[43] Liberman L, Abramson AF, Squires FB, Glassman J,
Morris EA, Dershaw DD. The Breast Imaging Report-
ing and Data System: positive predictive value of
mammographic features and final assessment catego-
ries. AJR Am J Roentgenol. 1998;171:35–40.
[44] Orel SG, Kay N, Reynolds C, Sullivan DC. BI-RADS
categorization as a predictor of malignancy. Radiology
1999;211:845–50.
[45] Morakkabati N, Schmiedel A, Leutner C, Kuhl CK.
Diagnostic usefulness of ductal or segmental enhance-
ment in dynamic breast MR imaging [abstract]. Radi-
ology 2000;217(P):526–27.
L. Liberman, J.H. Menell / Radiol Clin N Am 40 (2002) 409–430430

Ultrasound for breast cancer screening and staging
Paula B. Gordon, MD, FRCPC
Department of Radiology, University of British Columbia, 505-750 West Broadway Vancouver,
British Columbia, Canada V5Z 1H4
Ultrasound (US) is well accepted as the most
useful adjunct to mammography for the diagnosis
of breast abnormalities. US is most often used to
assess palpable masses and nonpalpable masses that
have been detected during screening mammography
[1–5]. Mammographic sensitivity for detection of
a mass is excellent when the mass is surrounded
partially or entirely by fat; however, mammo-
graphic sensitivity is impaired for noncalcified
masses in radiographically dense breast tissue and
for masses at locations in the breast that may not
be included because of the limitations of mammo-
graphic positioning. In these settings, US may
demonstrate malignancies and other masses that
are not visible mammographically. It is not surpris-
ing, then, that US can also detect cancers that are
both mammographically occult and too small to
be palpable.
Efforts to replace screening mammography with
US in the 1970s were prompted by the concern
raised by Bailar [6], who suggested that the use of
ionizing radiation in mammography could be car-
cinogenic. Automated prone and supine US units
were developed, and most operated at low frequen-
cies. Early studies found few, if any, cancers with
US that were not palpable or mammographically
visible, and US screening was also shown to have a
high false-positive rate [7–10]. Later, higher fre-
quency probes for hand-held real-time US became
available. These transducers were usually small
field-of-view instruments that were light and easy
to hold. These small footprint probes are adequate
for problem-solving examinations; the transducer
can be placed directly on a palpable abnormality
or can be used to scan a region in which a mass has
been seen at mammography. Whole-breast scanning
with these probes is more time consuming, labor
intensive, and operator dependent than with auto-
mated devices.
In North America, breast ultrasound is most often
a targeted examination, limited to the area of concern
based on palpation or mammography. On the other
hand, survey (whole-breast) real-time scanning has
been more prevalent in Europe.
With higher frequency transducers, ultrasound’s
usefulness for breast diagnosis slowly increased.
Initially, US was used to demonstrate palpable
masses that were not visible on mammograms
because of surrounding dense tissue and to assess
nonpalpable masses detected at screening mammog-
raphy. In these settings it was used mainly to confirm
the presence of a discrete mass and to distinguish
cysts from solid masses. US has become the primary
imaging modality for younger women and pregnant
or lactating patients, and it is important for guiding
interventional procedures [4]. More recently, sono-
graphic features have been described to contribute in
the differentiation of benign, indeterminate, and
malignant masses [11]. However, because of its
inability to demonstrate microcalcifications, sonogra-
phy cannot replace mammography for the purpose of
mass screening.
With US, unexpected findings are extremely com-
mon. This is particularly true for cysts. If a patient is
referred for ultrasound because of a palpable or
mammographic finding that ultimately proves to be
a cyst on sonography, it is highly likely that other
cysts that are neither palpable nor visible on the
mammogram will be detected during the course of
the US examination. Cysts are common and are
frequently encountered regardless of the indication
for referral.
The same is true for incidental solid masses. Most
solid-appearing masses that are detected unexpect-
0033-8389/02/$ – see front matter D 2002, Elsevier Science (USA). All rights reserved.
PII: S0033 -8389 (01 )00014 -8
Radiol Clin N Am 40 (2002) 431–441

edly during breast US are benign. Most are fibroade-
nomas, some are complex or inspissated cysts with
internal echoes, and a small but significant percentage
are malignancies. These incidentalomas [12] should
not be ignored.
Staging
It is not surprising to find incidental cancer(s)
when performing US in a patient with a known
malignancy elsewhere in the ipsilateral breast, espe-
P.B. Gordon / Radiol Clin N Am 40 (2002) 431–441432
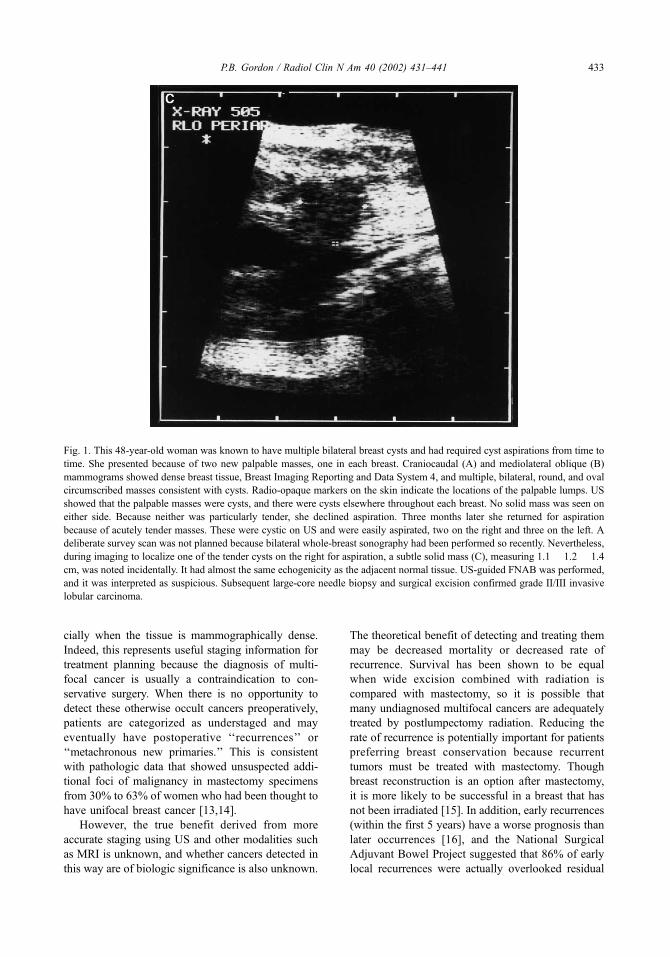
cially when the tissue is mammographically dense.
Indeed, this represents useful staging information for
treatment planning because the diagnosis of multi-
focal cancer is usually a contraindication to con-
servative surgery. When there is no opportunity to
detect these otherwise occult cancers preoperatively,
patients are categorized as understaged and may
eventually have postoperative ‘‘recurrences’’ or
‘‘metachronous new primaries.’’ This is consistent
with pathologic data that showed unsuspected addi-
tional foci of malignancy in mastectomy specimens
from 30% to 63% of women who had been thought to
have unifocal breast cancer [13,14].
However, the true benefit derived from more
accurate staging using US and other modalities such
as MRI is unknown, and whether cancers detected in
this way are of biologic significance is also unknown.
The theoretical benefit of detecting and treating them
may be decreased mortality or decreased rate of
recurrence. Survival has been shown to be equal
when wide excision combined with radiation is
compared with mastectomy, so it is possible that
many undiagnosed multifocal cancers are adequately
treated by postlumpectomy radiation. Reducing the
rate of recurrence is potentially important for patients
preferring breast conservation because recurrent
tumors must be treated with mastectomy. Though
breast reconstruction is an option after mastectomy,
it is more likely to be successful in a breast that has
not been irradiated [15]. In addition, early recurrences
(within the first 5 years) have a worse prognosis than
later occurrences [16], and the National Surgical
Adjuvant Bowel Project suggested that 86% of early
local recurrences were actually overlooked residual
Fig. 1. This 48-year-old woman was known to have multiple bilateral breast cysts and had required cyst aspirations from time to
time. She presented because of two new palpable masses, one in each breast. Craniocaudal (A) and mediolateral oblique (B)
mammograms showed dense breast tissue, Breast Imaging Reporting and Data System 4, and multiple, bilateral, round, and oval
circumscribed masses consistent with cysts. Radio-opaque markers on the skin indicate the locations of the palpable lumps. US
showed that the palpable masses were cysts, and there were cysts elsewhere throughout each breast. No solid mass was seen on
either side. Because neither was particularly tender, she declined aspiration. Three months later she returned for aspiration
because of acutely tender masses. These were cystic on US and were easily aspirated, two on the right and three on the left. A
deliberate survey scan was not planned because bilateral whole-breast sonography had been performed so recently. Nevertheless,
during imaging to localize one of the tender cysts on the right for aspiration, a subtle solid mass (C), measuring 1.1 � 1.2 � 1.4
cm, was noted incidentally. It had almost the same echogenicity as the adjacent normal tissue. US-guided FNAB was performed,
and it was interpreted as suspicious. Subsequent large-core needle biopsy and surgical excision confirmed grade II/III invasive
lobular carcinoma.
P.B. Gordon / Radiol Clin N Am 40 (2002) 431–441 433

cancer [17]. Thus, more accurate staging before
surgery could prompt mastectomy earlier for these
patients, allowing more successful reconstruction and
possibly improving prognosis.
Berg and Gilbreath [18] used whole-breast US to
evaluate the ipsilateral breast preoperatively in
women with known cancer or in whom there was a
high suspicion of cancer. They found 9 of 64 (14%)
cancers with US only. These included invasive and in
situ ductal carcinomas and invasive lobular carcino-
mas. This led to a change in the planned management
for seven patients, including four women with mam-
mographically occult disease whose cancer was
depicted by US and 3 of 20 (15%) women with
mammographically unifocal disease in whom US
revealed multifocal disease requiring wider excision.
Kolb et al [19] used bilateral whole-breast sono-
graphy (BWBS) to evaluate 150 consecutive women
with dense tissue who were known to have cancer.
They found 16 additional cancers in 10 women, 13
ipsilateral and 3 contralateral. These findings altered
the planned management for 8 (80%) of these 10
patients, constituting 5% of the 150 women in the
study. Palpability and size of the index tumor were
associated with a greater likelihood of detecting
additional cancers with BWBS.
Moon et al [20] performed BWBS in 201 patients
known to have breast cancer. Only 52% of these were
thought to have dense breast tissue. Thirty-six cancers
were seen only on US, 28 in the ipsilateral breast and
8 in the contralateral breast. These included invasive
and in situ ductal carcinoma and invasive lobular
carcinoma. Surprisingly, three of the cancers seen
only with US were in mammographically fatty
breasts, but the authors did not indicate the Breast
Imaging Reporting and Data System (BI-RADS)
density category or whether the location of the cancer
was in a dense area in an otherwise fatty breast. Their
findings altered planned management in 32 women
originally thought to have unifocal disease.
Screening
US may depict cancers that are mammographi-
cally occult and nonpalpable during imaging of a
patient whose index lesion is ultimately shown to be
benign (Fig. 1). There is some disagreement among
experts as to how the unexpected finding of an
‘‘incidental’’ solid mass during US should be
handled. Some laboratories [12] have a policy that
only the index area is to be scanned. This is simple
enough for palpable masses. For mammographic
findings, the matter is more problematic. Because of
the inexact task of triangulation, a preliminary search
with US to find the index lesion is usually required.
In the process of searching, other masses may
unavoidably be seen; however, if our goal as breast
imagers is to diagnose cancers as early as possible,
this kind of discovery is potentially lifesaving. Some
of the cancers detected in this manner are the interval
cancers that would be diagnosed clinically before the
next scheduled screening mammogram.
In the 1980s and early 1990s, there were sporadic
reports in the literature [7,8,21–26] of cancers de-
tected incidentally during US (Table 1). Some inves-
tigators performed survey scans whenever a patient
had been referred for a particular indication. Others
undertook ultrasound for no indication other than
mammographically dense breasts. Not all incidental
cancers were detected during intentional survey scan-
ning; some were found even when the intention was to
target the examination to a particular quadrant [27].
Gordon et al [28], in a 1993 study on the use of
US-guided fine-needle aspiration biopsy (FNAB)
of solid breast masses, reported their experience of
finding 15 of 225 breast cancers that were detected
only with US. In 1995, these authors [29] updated
their experience. They retrospectively reviewed
whole-breast US performed on the ipsilateral breast
in 12,706 women referred because of palpable or
mammographically detected masses and found incid-
ental solid masses in 1575 (12%). Of these, 279
underwent FNAB; 44 masses were cancerous, and
Table 1
Cancers detected only on ultrasound
Study
No.
patients
No.
cancers
No. US
only
No. US only
cancers/no.
patients (%)
Gordon [28] 7,322 213 15 0.2
Egan [23] 2,530 107 3 0.1
Egan [8] 786 31 1 0.1
Bassett [7] 1,212 45 1 0.1
Dempsey [21] NS 381 3 NS
Vilaro [26] 73 10 2 2.7
Croll [22] NS 173 8 NS
Rothchild [25] 796 1 1 0.1
Giuseppetti [24] 11,254 57 10 0.1
Parker [27] NS 34 2 NS
Gordon [29] 12,706 NS 44 0.3
Kolb [19] 3,626 NA 11 0.3
Buchberger [31] 6,113 NA 23 0.3
Kaplan [33] 1,350 NA 6 0.4
US = ultrasound; NS = not stated, NA = not applicable
(represents a study of US screening).
Adapted from Gordon PB, Goldenberg SL. Malignant breast
masses detected only by ultrasound: a retrospective review.
Cancer 1995;76:626–30; with permission.
P.B. Gordon / Radiol Clin N Am 40 (2002) 431–441434

the median size was 1 cm (range, 0.4–2.5 cm). Thus,
cancer was identified in 44 of 279 (16%) lesions by
FNAB, in 44 of 1575 (3%) incidental solid masses,
and during 44 of 12,706 (0.3%) sonographic exami-
nations. The 44 nonpalpable, mammographically
occult cancers were found in 30 women. In 15 women,
the index lesion that led to the US examination was
malignant (ie, unsuspected multifocal disease, essen-
tially a staging finding); in 15 women, the index lesion
proved to be benign (a serendipitous finding, in effect
the result of ‘‘screening’’ the remainder of the breast).
Stavros et al [11] did not set out to perform
screening US, but, in the process of their study, they
encountered 44 incidental solid masses, 11 (25%) of
which proved to be cancers. Five of these were
second foci in women with other ipsilateral malig-
nancy, and six were unsuspected primaries that were
neither palpable nor visible mammographically. Of
11,220 consecutive patients referred for screening
mammography, Kolb et al [30] offered sonographic
screening of 3626 asymptomatic women whose
mammogram findings were negative but who had
mammographically dense breast tissue. They iden-
tified 215 solid masses in the 3626 patients. Biopsy
was performed on 123 solid masses (ie, in 57% of the
215 solid masses identified, or in 3% of the patients
who had screening sonography) using FNAB in 111
patients and surgical biopsy in 12 patients. Cancer
was identified in 11 lesions, as follows: 11 of 123
(9%) solid lesions for which biopsy samples were
taken, 11 of 215 (5%) solid masses, and 11 of 3626
(0.3%) sonographic examinations.
The 11 US-only cancers identified by Kolb et al
[30] were similar in size and stage to the mammog-
raphically detected cancers and smaller and lower in
stage than the palpable cancers in their referred
symptomatic patients. In women with dense breasts,
use of screening US as a supplement to mammog-
raphy resulted in increased cancer detection by 17%
(from 63 to 74 tumors), and the number of tumors
detected only with imaging increased by 37% (from
30 to 41 tumors). The frequency of detecting cancer
by screening US was 0.6% (6 of 1043) in high-risk
women versus 0.2% (5 of 2583) in average-risk
women (P = 0.09).
Buchberger et al [31] scanned 6113 asymptomatic
patients with mammographically negative, but dense
breasts, and detected 23 malignancies in 21 women
(0.31%). They compared these lesions to those in
687 patients who were referred because of palpable
or mammographically detected masses. The mean
size of the US-only cancers was not significantly
different than the mean size of the invasive cancers
found by mammography.
Levy et al [32] retrospectively reviewed 110
consecutive cases of breast cancer that had been
assessed with mammography and BWBS. Twenty-
four (21.8%) breast cancers were seen only with US.
This resulted in a 28.2% enhancement of the detec-
tion of nonpalpable invasive cancer. Their criteria for
performing BWBS were moderately dense breast and
either high-risk profile, mammogram categorized as
BI-RADS 0, 4, or 5, or abnormal findings on physical
examination. Hence, this was a combined screening–
staging population.
Kaplan [33] studied 1350 women using BWBS
who had negative findings on clinical breast exami-
nations and negative mammograms with BI-RADS
density of 3 or 4. This was a pure screening popu-
lation. One hundred seventy-seven patients had sono-
graphic findings, but most were not thought to require
intervention. Fifty-one biopsies were recommended
in 50 patients (3.7%). Six cancers were diagnosed,
indicating that cancers were detected by US only in 6
of 1350 (0.4%) women in the study.
Barriers to clinical acceptance
There remains understandable reluctance to
embrace BWBS for its potential value as a screening
tool [12,34]. This can be attributed to several reasons.
Lack of proof of benefit
Screening mammography has been subjected to
intense scrutiny during the last four decades. The true
independent contribution of US to breast cancer
screening cannot be determined other than by the
performance of a randomized, blinded, controlled
trial using death as the endpoint [35]. It is unlikely
that a clinical trial of sufficient magnitude could be
performed to assess the potential benefits of US
screening and to allow subgroup analysis. A large
cohort would be required because the incidence of
US-only cancers is low. ‘‘Contamination’’ would
prove challenging unless the study was population
based. One of the many lessons learned from the
Canadian National Breast Screening Study [36] is
that women who volunteer for a trial and are assigned
to the control group frequently seek the examination
evaluated outside the trial setting. This occurred in
26% of the women aged 40 to 49 years in that study
[36], and it can dramatically affect the difference in
mortality between the two groups. Furthermore, well-
informed women offered US because of known
mammographic parenchymal density, who may be
at higher cancer risk, might be even less likely than
P.B. Gordon / Radiol Clin N Am 40 (2002) 431–441 435

average-risk women to comply with their assignment
to a control group. The use of ‘‘surrogate endpoints’’
is an indirect measurement of benefit, but it is less
robust than the proof of decreased mortality, and it
has been rejected in the context of mammographic
screening because of lead-time bias and length bias
sampling [37]. Allowing for expected contamination
would require an even larger cohort.
Nature of the examination
The lack of global images in breast US and the
operator dependence of the procedure have contrib-
uted to its mystique among non-sonologist physi-
cians. Whether an abnormality is detected at US is
completely dependent on the perception and skill of
the person performing the procedure. If a mass is
subtle and at the limit of perceptibility on US but is
not noticed at the time of the examination, it cannot
be detected afterward by reviewing hard copy images
except, perhaps, on videotape. Having representative
normal images is not proof that a mass was not
present. This is a limitation of ultrasound in general.
(eg, the same situation occurs with malignancies in
other organs in which it is possible to obtain normal
images from a plane different than the one where the
mass is visible). In this regard, US is more akin to
clinical examinations than to other radiographic stud-
ies. If a patient detects a breast lump 1 month after
her physician has performed a clinical breast exam-
ination with negative results, no one can state with
certainty whether that mass became palpable during
that month or whether it was detectable but missed on
the initial physical examination. We can acknowledge
the limitations of US without abandoning it. Even
more standardized examinations such as mammogra-
phy have a component that is operator dependent; the
quality of the study depends to a large extent on the
skill of the technologist in positioning. These poten-
tial challenges could be minimized to a great extent
by having physicians, rather than technologists, per-
form screening US examinations, as has been sug-
gested by Mendelson [38], but this requirement could
possibly act as a further deterrent because of the cost.
Indeed, it may be that the current impending shortage
of specialized breast radiologists would limit the
availability for this relatively labor-intensive task.
Difficulty with reproducibility inherent in
US techniques
Difficulty with reproducibility potentially limits
the ability to accurately monitor the ‘‘US-only’’
masses that are thought to be probably benign and
suitable for surveillance with follow-up examina-
tions. A certain amount of intraobserver, interob-
server, or both variability is to be expected. Having
the previous images available at the time of the
examination is critical. In addition to the location
indicated in the text of the report (ideally including
location on the clock face and distance from the
nipple in centimeters), the sonographer can then use
the appearance of the mass on the images, the mass
depth relative to the skin, and especially the pattern of
the surrounding normal tissues as a guide. In many
patients the adjacent subcutaneous fat and Cooper
ligaments and the distance from the skin and pectoral
muscle can act as landmarks to ensure that the same
mass is being examined and compared.
Small footprint probes are suboptimal for
survey scans
Commercially available, wider field-of-view
transducers minimize scan time, allowing a thorough
examination without omitting any tissue. Whole-
breast imaging can take as little as 2 to 3 minutes
when the breast is normal [29,30], though Buch-
berger et al [31] reported 10 to 15 minutes per patient,
Kaplan [33] reported 10 minutes, and Berg and
Gilbreath [18] reported 15 minutes on average (range,
10 to 45 minutes). More time is required to measure
and record masses, when they are encountered. These
time requirements are considerably greater than the
time spent, on average, reading a screening mammo-
gram. If the use of US as a second-level screening test
is to be implemented, automated scanners with higher
frequency transducers would ideally be developed.
Potential false-positives and subjective or
nonstandard thresholds for intervention
From a public health perspective, false-positive
findings and subjective or nonstandard intervention
thresholds are regarded as a harm to patients. How-
ever, all screening modalities with acceptable sen-
sitivity, including mammography, will result in the
detection of abnormalities that are not cancer. The
extent of false-positivity of US must be addressed
because the technique will not be practical if it is
unacceptably high. Stavros [11] and others [39,40]
have defined sonographic characteristics that allow
classification of masses, even when mammographic
criteria cannot be applied if masses are not mammo-
graphically visible. These could minimize the need for
percutaneous biopsy and allow surveillance for most.
Of the 424 of 750 masses that Stavros [11] predicted
would be benign based on US criteria, only 2 were
P.B. Gordon / Radiol Clin N Am 40 (2002) 431–441436

malignant. This 99.5% negative predictive value does
not significantly differ from the 98% negative pre-
dictive value possible for ‘‘probably benign masses’’
based on mammographic criteria [41,42], which is the
accepted standard of care.
In the studies conducted as screening examina-
tions, Kolb [30] performed 30 FNABs on complex
cysts and FNAB (n = 111) or surgical biopsy (n = 12)
in 123 of the 215 solid masses, leading to the
diagnosis of 11 cancers. Buchberger et al [31] per-
formed biopsies on all solid nodules: percutaneous
14-gauge core biopsies on 196 lesions and 24 surgical
biopsies after US-guided wire localization, leading to
the diagnosis of 23 cancers. Gordon and Golden-
berg’s [29] study was retrospective, and their patient
population comprised mixed screening and staging.
They did not indicate separate biopsy rates for masses
seen in these two groups of patients, but they did
perform FNAB on 279 of the 1575 solid masses seen
only on US, leading to the diagnosis of 30 cancers.
Hence, biopsy of a solid mass was performed on the
basis of US findings in 2% to 4% of examinations in
these studies, and the frequency of carcinoma among
US-only solid lesions for which biopsy samples were
taken was 7% to 11%.
Additional masses found in women known to
have breast cancer have a higher probability of
malignancy, regardless of their appearances, so a
lower threshold for recommending biopsy is appro-
priate in US performed for staging. Berg and Gil-
breath [18] performed US-guided, 14-gauge core
biopsy on all discrete solid lesions identified on US
of the ipsilateral breast in women with known breast
cancer or with high suspicion of breast cancer.
Ultimately, as with mammography, few masses
detected in this manner required surgical excision
because even those requiring tissue diagnosis because
of indeterminate imaging characteristics can be accu-
rately diagnosed with percutaneous biopsy [28].
Among 13 US-only lesions detected in the series of
Berg and Gilbreath [18], five (38%) were malignant.
In spite of the limitations described above, it
behooves us to continue searching for a second-level
screening test for breast cancer. Clinical breast exami-
nations and mammography are the gold standards,
but they are far from ideal. Delay in the diagnosis of
breast cancer is now the most frequent reason for
medical malpractice litigation in the United States.
For the sake of the women who are not optimally
served by screening mammography alone, to improve
our ability to find breast cancers as early as possible
and to live up to the public’s high expectations, we
must continue investigating new technologies. Feig
[43] has shown that even if women complied with
annual screening mammography, the calculated mor-
tality reduction would be only approximately 50%.
Other modalities for supplementary screening
and staging
It is hoped that full-field digital mammography,
with its higher contrast resolution, will mature into a
screening tool that misses fewer cancers than film-
screen mammography. So far this has not proved to
be the case. In a recent study in which 4945 full-field
digital mammography examinations were performed
in women 40 years and older presenting for screen-
ing, Lewin et al [44] found no difference in the cancer
detection rate when this procedure was compared
with film-screen mammography.
MRI for high-risk screening and preoperative
staging is under investigation, and it appears to be
sensitive but not specific. A significant limitation is
the inability to take biopsy samples easily of abnor-
malities found on MRI but not visible on mammog-
raphy or US. Biopsy-guidance devices are not
standard equipment on MRI units yet, though proto-
types are in development. Even when needle biopsy
or wire localization can be guided, some lesions are
seen only after contrast enhancement. With closed
magnets it is cumbersome to remove the patient from
the magnet to advance the needle or wire. Further-
more, by the time the patient is replaced in the
magnet, the contrast may wash out and the lesion
may no longer be visible. Additionally, the require-
ment of contrast for visualization of the lesion pre-
cludes the confirmation of adequate excision by the
use of specimen evaluation because the excised tissue
cannot be perfused ex vivo. It is interesting that US,
though not yet embraced for secondary screening or
even preoperative staging, has been recommended as
a ‘‘second-look’’ procedure for intervention when a
lesion is detected by MRI. Panizza et al [45], using
US in this manner, were able to find 11 masses,
including five cancers that had been found on MRI.
MRI demonstrates high sensitivity for breast can-
cer detection. Currently, however, its high cost,
variable specificity [46–50], and difficulties with
MRI-guided intervention may make it impractical
for widespread use as a supplementary screen for
high-risk women. Some of the same issues related to
breast MRI apply to positron-emission tomography
(PET). US appears to be less sensitive than MRI, but
it is lower in cost, more widely available, and readily
used to guide biopsies.
Technetium 99m sestamibi has been shown to be
74% sensitive and 89% specific for tumors larger
P.B. Gordon / Radiol Clin N Am 40 (2002) 431–441 437
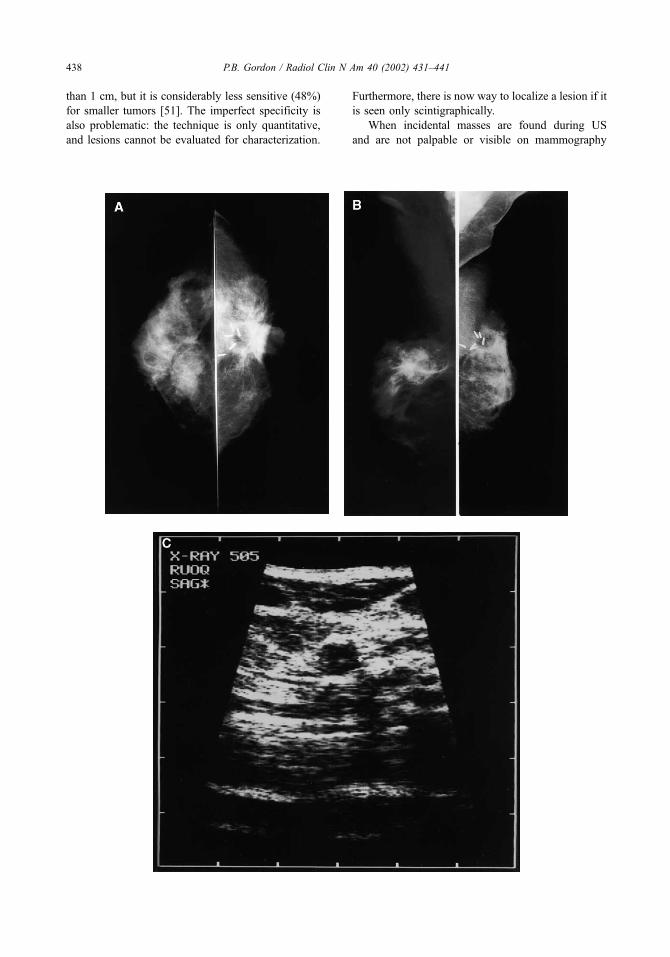
than 1 cm, but it is considerably less sensitive (48%)
for smaller tumors [51]. The imperfect specificity is
also problematic: the technique is only quantitative,
and lesions cannot be evaluated for characterization.
Furthermore, there is now way to localize a lesion if it
is seen only scintigraphically.
When incidental masses are found during US
and are not palpable or visible on mammography
P.B. Gordon / Radiol Clin N Am 40 (2002) 431–441438
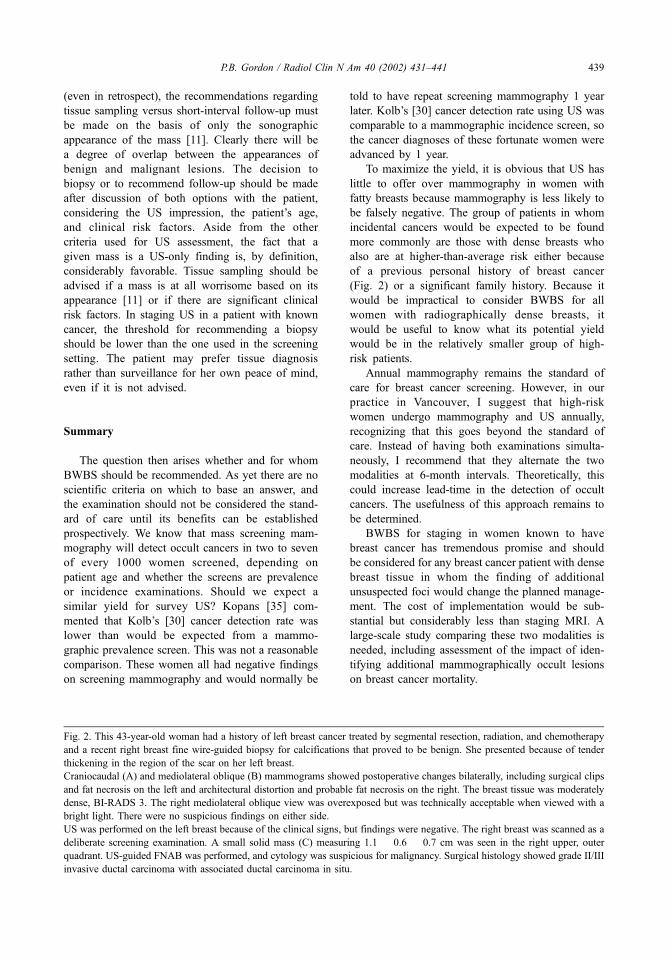
(even in retrospect), the recommendations regarding
tissue sampling versus short-interval follow-up must
be made on the basis of only the sonographic
appearance of the mass [11]. Clearly there will be
a degree of overlap between the appearances of
benign and malignant lesions. The decision to
biopsy or to recommend follow-up should be made
after discussion of both options with the patient,
considering the US impression, the patient’s age,
and clinical risk factors. Aside from the other
criteria used for US assessment, the fact that a
given mass is a US-only finding is, by definition,
considerably favorable. Tissue sampling should be
advised if a mass is at all worrisome based on its
appearance [11] or if there are significant clinical
risk factors. In staging US in a patient with known
cancer, the threshold for recommending a biopsy
should be lower than the one used in the screening
setting. The patient may prefer tissue diagnosis
rather than surveillance for her own peace of mind,
even if it is not advised.
Summary
The question then arises whether and for whom
BWBS should be recommended. As yet there are no
scientific criteria on which to base an answer, and
the examination should not be considered the stand-
ard of care until its benefits can be established
prospectively. We know that mass screening mam-
mography will detect occult cancers in two to seven
of every 1000 women screened, depending on
patient age and whether the screens are prevalence
or incidence examinations. Should we expect a
similar yield for survey US? Kopans [35] com-
mented that Kolb’s [30] cancer detection rate was
lower than would be expected from a mammo-
graphic prevalence screen. This was not a reasonable
comparison. These women all had negative findings
on screening mammography and would normally be
told to have repeat screening mammography 1 year
later. Kolb’s [30] cancer detection rate using US was
comparable to a mammographic incidence screen, so
the cancer diagnoses of these fortunate women were
advanced by 1 year.
To maximize the yield, it is obvious that US has
little to offer over mammography in women with
fatty breasts because mammography is less likely to
be falsely negative. The group of patients in whom
incidental cancers would be expected to be found
more commonly are those with dense breasts who
also are at higher-than-average risk either because
of a previous personal history of breast cancer
(Fig. 2) or a significant family history. Because it
would be impractical to consider BWBS for all
women with radiographically dense breasts, it
would be useful to know what its potential yield
would be in the relatively smaller group of high-
risk patients.
Annual mammography remains the standard of
care for breast cancer screening. However, in our
practice in Vancouver, I suggest that high-risk
women undergo mammography and US annually,
recognizing that this goes beyond the standard of
care. Instead of having both examinations simulta-
neously, I recommend that they alternate the two
modalities at 6-month intervals. Theoretically, this
could increase lead-time in the detection of occult
cancers. The usefulness of this approach remains to
be determined.
BWBS for staging in women known to have
breast cancer has tremendous promise and should
be considered for any breast cancer patient with dense
breast tissue in whom the finding of additional
unsuspected foci would change the planned manage-
ment. The cost of implementation would be sub-
stantial but considerably less than staging MRI. A
large-scale study comparing these two modalities is
needed, including assessment of the impact of iden-
tifying additional mammographically occult lesions
on breast cancer mortality.
Fig. 2. This 43-year-old woman had a history of left breast cancer treated by segmental resection, radiation, and chemotherapy
and a recent right breast fine wire-guided biopsy for calcifications that proved to be benign. She presented because of tender
thickening in the region of the scar on her left breast.
Craniocaudal (A) and mediolateral oblique (B) mammograms showed postoperative changes bilaterally, including surgical clips
and fat necrosis on the left and architectural distortion and probable fat necrosis on the right. The breast tissue was moderately
dense, BI-RADS 3. The right mediolateral oblique view was overexposed but was technically acceptable when viewed with a
bright light. There were no suspicious findings on either side.
US was performed on the left breast because of the clinical signs, but findings were negative. The right breast was scanned as a
deliberate screening examination. A small solid mass (C) measuring 1.1 � 0.6 � 0.7 cm was seen in the right upper, outer
quadrant. US-guided FNAB was performed, and cytology was suspicious for malignancy. Surgical histology showed grade II/III
invasive ductal carcinoma with associated ductal carcinoma in situ.
P.B. Gordon / Radiol Clin N Am 40 (2002) 431–441 439

References
[1] Bassett LW, Kimme-Smith C. Breast sonography. AJR
Am J Roentgenol 1991;156:449–55.
[2] Durfee SM, Selland DLG, Smith DN, et al. Sono-
graphic evaluation of clinically palpable breast cancers
invisible on mammography. The Breast Journal 2000;
6:247–51.
[3] Frazier TG, Murphy JT, Furlong A. The selected use of
ultrasound mammography to improve diagnostic accu-
racy in carcinoma of the breast. J Surg Oncol 1985;29:
231–2.
[4] Jackson VP. The role of US in breast imaging. Radi-
ology 1990;177:3051.
[5] Jackson VP, Hendrick RE, Feig SA, et al. Imaging of
the radiographically dense breast. Radiology 1993;188:
297–301.
[6] Bailar JC. Mammography: a contrary view. Ann Intern
Med 1976;84:77–84.
[7] Bassett LW, Kimme-Smith C, Sutherland LK, et al.
Automated and hand-held breast ultrasound: effect on
patient management. Radiology 1987;165:103–8.
[8] Egan RL, Egan K. Detection of breast carcinoma: com-
parison of automated water-path whole breast sono-
graphy, mammography and physical examination.
AJR Am J Roentgenol 1984;143:493–7.
[9] Kopans DB, Meyer JE, Lindfors KK. Whole-breast US
imaging: four-year follow-up. Radiology 1985;157:
505–7.
[10] Sickles EA, Filly RA, Callen PW. Breast cancer detec-
tion with ultrasonography and mammography: compar-
ison using state-of-the-art equipment. AJR Am J
Roentgenol 1983;140:843–5.
[11] Stavros AT, Thickman D, Rapp CL, et al. Solid breast
nodules: use of ultrasonography to distinguish between
benign and malignant lesions. Radiology 1995;196:
123–34.
[12] Hall FM. Sonography of the breast: controversies and
opinions. AJR Am J Roentgenol 1997;169:1635–6.
[13] Holland R, Veling SHJ, Mravunac M, et al. Histologic
multifocality of Tis, T1–2 breast carcinomas: implica-
tions for clinical trials of breast-conserving surgery.
Cancer 1985;56:979–90.
[14] Lagios MD, Westdahl PR, Rose MR. The concept and
implications of multicentricity in breast carcinoma. In:
Sommers S, Rosen P, editors. Pathology annual. New
York: Appleton-Century-Crofts; 1981.
[15] Kraemer O, Anderson M, Siim E. Breast reconstruc-
tion and tissue expansion in irradiated vs. not irradiated
women after mastectomy. Scand J Plast Reconstr Surg
Hand Surg 1996;30:201–6.
[16] Kurtz JM, Spitalier JM, Amalric R, et al. The prog-
nostic significance of late local recurrence after breast-
conserving therapy. Int J Radiat Oncol Biol Phys 1990;
18:87–93.
[17] Fisher ER, Sass R, Fisher B, et al. Pathological find-
ings from the National Surgical Adjuvant Bowel Proj-
ect (project 6), II: relation of local breast recurrence to
multicentricity. Cancer 1986;57:1717–24.
[18] Berg WA, Gilbreath PL. Multicentric and multifocal
cancer: whole-breast US in preoperative evaluation.
Radiology 2000;214:59–66.
[19] Kolb TM, Lichy J, Newhouse JH. The impact of bi-
lateral whole breast ultrasound in women with dense
breasts and recently diagnosed breast cancer [abstract].
Radiology 2000;217(P):318.
[20] Moon WK, Im J, Noh D. Multifocal, multicentric, and
contralateral breast cancer: bilateral whole breast ultra-
sound in preoperative assessment [abstract]. Radiology
2000;217(P):318–319.
[21] Dempsey PJ. The importance of resolution in the clin-
ical application of breast sonography. Ultrasound Med
Biol 1988;14(Suppl):43–8.
[22] Croll J, Kotevich J, Tbreti M. The diagnosis of benign
disease and the exclusion of malignancy in patients
with breast symptoms. Semin Ultrasound CT MR
1982;3:38–50.
[23] Egan RL, Egan K. Automated water-path full-breast
sonography: correlation with histology of 176 solid
lesions. AJR Am J Roentgenol 1984;143:499–507.
[24] Giuseppetti GM, Rizatto G, Gozzi G, et al. Role of
ultrasonics in the diagnosis of subclinical carcinoma
of the breast [in Italian]. Radiol Med (Torino) 1989;
78:339–42.
[25] Rothschild P, Kimme-Smith C, Bassett LW, et al. Ul-
trasound breast examination of asymptomatic patients
with normal but radiodense mammograms. Ultrasound
Med Biol 1988;14(Suppl 1):113–9.
[26] Vilaro MM, Kurtz AB, Needleman, et al. Hand-held
and automated sonomammography: clinical role rela-
tive to x-ray mammography. J Ultrasound Med 1989;
8:95–100.
[27] Parker SH, Jobe WE, Dennis MA, et al. US-guided
automated large-core breast biopsy. Radiology 1993;
187:507–11.
[28] Gordon PB, Goldenberg SL, Chan NH. Solid breast
lesions: diagnosis with US-guided fine-needle aspira-
tion biopsy. Radiology 1993;189:573–80.
[29] Gordon PB, Goldenberg SL. Malignant breast masses
detected only by ultrasound: a retrospective review.
Cancer 1995;76:626–30.
[30] Kolb TM, Lichy J, Newhouse JH. Occult cancer in
women with dense breasts: detection with screening
US–diagnostic yield and tumor characteristics. Radi-
ology 1998;207:191–9.
[31] Buchberger W, DeKoekkoek-Doll P, Springer P, et al.
Incidental findings on sonography of the breast: clin-
ical significance and diagnostic workup. AJR Am J
Roentgenol 1999;173:921–7.
[32] Levy M, Herman ZW, Tapper HR, et al. Bilateral
whole breast sonography significantly enhances the
mammographic detection of breast cancer. Radiology
2000;217(P):318.
[33] Kaplan SS. The clinical utility of bilateral whole breast
ultrasound in the evaluation of women with dense
breast tissue. Radiology 2000;217(P):318.
[34] Kopans DB, Feig SA, Sickles EA. Correspond-
ence: malignant breast masses detected only by ul-
P.B. Gordon / Radiol Clin N Am 40 (2002) 431–441440

trasound: a retrospective review. Cancer 1996;77:
208–9.
[35] Kopans DB. Breast cancer screening using sonogra-
phy. Lancet 2000;354:2096–7.
[36] Miller AB, Baines CJ, To T, et al. Canadian national
breast screening study, 1: breast cancer detection and
death rates amomg women aged 40–49 years. Can
Med Assoc J 1992;147:1459–76.
[37] Kopans DB. Mammography screening and the contro-
versy concerning women aged 40–49. Radiol Clin N
Am 1995;33:1273–90.
[38] Mendelson, EB. Personal communication, 1998.
[39] Rahbar G, Sie AC, Hansen JS, et al. Benign versus
malignant solid breast masses. US Differentiation. Ra-
diology 1999;213:889–94.
[40] Taylor KJW, et al. Unpublished data, 1995.
[41] Sickles EA. Periodic mammographic follow-up of
probably benign lesions: results in 3,184 consecutive
cases. Radiology 1991;179:463–8.
[42] Sickles EA. Nonpalpable, circumscribed, noncalcified
breast masses: likelihood of malignancy based on
lesion size and the age of the patient. Radiology 1994;
192:439–42.
[43] Feig S. Estimation of currently attainable benefit from
mammographic screening of women aged 40 – 49
years. Cancer 1995;75:2412–9.
[44] Lewin JM, Hendrick RE, D’Orsi CJ, et al. Compar-
ison of full-field digital mammography with film-
screen mammography for cancer detection: results
of 4,945 paired examinations. Radiology 2001;218:
73–324.
[45] Panizza P, DeGaspari A, Vanzulli A, et al. Accuracy of
post-MR imaging second-look sonography in previ-
ously undetected breast lesions [abstract]. Radiology
1997;205(P):489.
[46] Boetes C, Barentsz JO, Mus RD, et al. MR character-
ization of suspicious breast lesions with a gadolinium-
enhanced turbo-FLASH subtraction technique. Radiol-
ogy 1994;193:777–81.
[47] Gilles R, Guinebreyiere JM, Lucidarme O, et al.
Nonpalpable breast tumors: diagnosis with contrast-
enhanced subtraction dynamic MR imaging. Radioloy
1994;191:625–31.
[48] Harms SE, Flamig DP, Hesley KL. MR imaging of the
breast with rotating delivery of excitation off reso-
nance: clinical experience with pathological correla-
tion. Radiology 1993;187:493–501.
[49] Morris EA, Schwartz LH, Dershaw DD, et al. MR
imaging of the breast in patients with occult primary
breast carcinoma. Radiology 1997;205:437–40.
[50] Orel SG, Schnall MD, LiVolsi VA, et al. Suspicious
breast lesions: MR imaging with radiologic-pathologic
correlation. Radiology 1994;190:485–93.
[51] Taillefer R. The role of technetium 99m sestamibi and
other conventional radiopharmaceuticals in breast can-
cer diagnosis. Semin Nucl Med 1999;29:16–40.
P.B. Gordon / Radiol Clin N Am 40 (2002) 431–441 441

Breast cancer imaging with MRI
Elizabeth A. Morris, MD*
Weill Medical College, Cornell University, 525 East 68th Street, New York, NY 10021, USA
Department of Radiology, Memorial Sloan-Kettering Cancer Center, 1275 York Avenue, New York, NY 10021, USA
The use of breast MRI for cancer detection has the
potential to change our current algorithms in the
detection and treatment of breast cancer. By being
able to detect cancer that is occult on conventional
imaging methods, such as mammography and sonog-
raphy, MRI can provide valuable information about
breast cancer that was up to this point unimaginable.
The robustness of this technique has generated con-
siderable enthusiasm, although this enthusiasm is
somewhat tempered by the fact that many unan-
swered questions remain regarding the integration
of MRI into clinical practice.
Many studies [1–6] suggest that breast MRI is best
used for situations where there is a high prior proba-
bility of cancer. For example, in the preoperative
evaluation of the patient with a known cancer, the
ability of MRI to detect multifocal and multicentric
disease that was previously unsuspected (Fig. 1) facili-
tates accurate staging [4–9]. Incidental contralateral
carcinomas have also been detected (Figs. 2, 3) [7,8].
Another indication that is promising, although not yet
established, is the use of MRI for high-risk screening
(Fig. 4), which is further discussed.
This article addresses current and evolving trends
in breast MRI for cancer detection. Terminology used
when describing lesions is reviewed, and examples
are presented. Emphasis is placed on image analysis
and potential pitfalls in image acquisition and inter-
pretation. Suggestions on how to perform optimal
studies are made, and clinical situations where MRI is
valuable in the work-up of breast lesions is discussed.
MRI for cancer detection
Breast MRI for cancer detection relies almost
exclusively on the fact that tumors generate neovascu-
larity to support their growth. The administration of an
intravenous contrast agent such as gadolinium-diethy-
lenetriamine penta-acetic acid (Gd-DTPA) allows
lesions to be well visualized, particularly if fat-sup-
pressed, T1-weighted images are used. Malignant
angiogenesis results in leaky capillaries and arterio-
venous shunts that allow the contrast agent to leave the
lesion rapidly, resulting in the wash-out time intensity
curves that can be seen with most but not all malig-
nancies. Detection of invasive breast carcinoma is
extremely reliable on MRI, with sensitivity approach-
ing 100%. False negatives have been reported with
well differentiated, invasive ductal carcinomas and
invasive lobular carcinoma [10]. Although the sensi-
tivity is high for invasive carcinoma, the same may
not be true for ductal carcinoma in situ (DCIS), for
which the sensitivity has been reported as low as 40%
[11–13], possibly secondary to more variable angio-
genesis in these lesions. Although more work needs to
be performed in the MR assessment of in situ disease,
the use of MRI to exclude preinvasive carcinoma is
imprudent with current technology. With these limi-
tations, breast MRI is best used as an adjunct test to
conventional imaging, complementing but not replac-
ing mammography and sonography. Mammographi-
cally suspicious findings, such as areas of distortion,
spiculation, or calcification, warrant appropriate
biopsy, regardless of a negative MR examination [14].
False positives may pose a problem in interpreta-
tion and are listed in Table 1, accounting for the lower
specificity that is reported with breast MRI. Reliance
on morphologic features may help reduce false-pos-
itive findings in some cases. If classic morphologic
0033-8389/02/$ – see front matter D 2002, Elsevier Science (USA). All rights reserved.
PII: S0033 -8389 (01 )00005 -7
* Department of Radiology, Memorial Sloan-Kettering
Cancer Center, 1275 York Avenue Northwest, New York,
NY 10021.
E-mail address: [email protected] (E.A. Morris).
Radiol Clin N Am 40 (2002) 443–466

signs are seen, such as non-enhancing bands in a
fibroadenoma (Fig. 5) or the reniform shape of a lymph
node (Fig. 6), the interpreter can be confident that the
lesion is benign. If classic benign lesion morphology is
not seen, time-intensity curves can be helpful in
deciding whether to biopsy a lesion (Fig. 7). If the
time-intensity curve does not exhibit wash-out (a
characteristic of malignant lesions), careful watchful
waiting may be an option over biopsy, although this
approach has yet to be validated clinically. A proposed
algorithm for image analysis is presented in Table 2.
Image acquisition
Proposed minimal requirements
Minimal technical requirements have been pro-
posed by the International Working Group for Breast
Fig. 2. A 58-year-old woman presented with a suspicious
mass at 6 o’clock in the right breast that was percutaneously
biopsied under ultrasound guidance yielding infiltrating
ductal carcinoma. (A) At the time of the ultrasound exam-
ination, there was a questionable second satellite lesion that
was confirmed on MRI (arrow). A single focus of infiltrating
ductal carcinomameasuring 1.9 cmwas found surgically with
abundant surrounding ductal carcinoma in situ (DCIS).
Margins were negative. (B) Contralateral screening MRI
depicts clumped of enhancement (arrow) that proved to be
incidental contralateral DCIS after MRI guided localization.
Fig. 1. A 45-year-old woman presented with new nipple
retraction and vague architectural distortion at 12 o’clock in
an extremely dense breast on mammography. Directed
ultrasound demonstrated multiple simple cysts but no solid
mass. (A) MRI depicts multiple heterogeneously enhancing
irregular masses in one quadrant compatible with multifocal
carcinoma. (B) MRI guided-needle localization with three
wires (arrowheads) brackets the region for attempt at con-
servation. Pathology yielded mixed lobular and ductal
carcinoma with positive margins for which the patient
underwent mastectomy. Note that the masses are not visible
on this delayed image because the masses have washed out
and the background parenchyma has slowly enhanced over
time. This and all subsequent images are post-Gd-DTPA
(0.1 mMol/kg) sagittal, fat-suppressed three-dimensional
FSPGR, T1-weighted images TR 17/TE 2.4, flip angle 35�,slice thickness � 2 mm, no gap, matrix 256 � 192.
E.A. Morris / Radiol Clin N Am 40 (2002) 443–466444

MRI [15] with the aim of detecting small lesions by
assessing lesion morphology and enhancement kinet-
ics. A dedicated breast coil must be used, preferably
one with localization or biopsy capability for MRI-
only detected lesions. So far in the literature, only
1.5-T systems have been validated; these systems
provide a high signal-to-noise ratio and allow fat
suppression to be performed. To detect lesions and
analyze morphology, high spatial resolution is rec-
ommended—1 mm in all planes. High temporal
resolution is recommended to facilitate enhancement
kinetic data gathering; each sequence should be
performed in less than 2 minutes. New imaging
sequences that are in development may allow both
high spatial and temporal resolution so that neither
one need be sacrificed [16,17]. To detect small
lesions and to decrease volume averaging, slice thick-
ness should be approximately 2 mm with no gap.
Fat suppression
The suppression of signal from fat is important for
increasing conspicuity of contrast-enhanced breast
lesions relative to the breast background tissue that
can contain variable amounts of high-signal fat. One
can suppress signal from fat by performing a fat
suppression technique or subtracting the precontrast
image from the postcontrast image. For diagnostic
purposes, if subtraction is the only method used,
misregistration from patient movement between the
pre- and the postcontrast images may result, possibly
rendering the examination uninterpretable. For this
reason, chemical-selective fat suppression is often
preferred and can be performed without excessively
increasing the imaging time. Fat suppression by
selectively identifying and suppressing the fat peak
can be performed manually or automatically. To
optimize fat suppression in the breasts, fat suppression
should be performed manually because the relative
water and fat content in women is highly variable. In
fatty breasts, the auto-pre-scan may erroneously iden-
tify the fat peak as water when setting the frequency,
resulting in incomplete fat suppression. Generally, this
problem is solved if manual prescan is used.
Memorial Sloan-Kettering Cancer Center protocol
At Memorial Sloan-Kettering Cancer Center, an
immobilization/biopsy coil from MRI Devices (Wau-
kesha, WI) is used to perform breast MRI on a 1.5-T
GE Signa (Milwaukee, WI) magnet. This system
allows for compression for diagnostic imaging and
interventional procedures. Sagittal fat-suppressed
T2-weighted images are initially obtained to assess
for cystic changes in the breast, manifested as high-
signal intensity. Then the entire breast is imaged
using a fat-suppressed, three-dimensional FSPGR
T1-weighted sequence. After Gd-DTPA administra-
tion (0.1mMol/kg), the same sequence is then repeated
three times immediately following one another. Slice
thickness is 2 to 3 mm without gap, depending on
breast thickness in compression; TR 17.1; TE 2.4;
flip angle 35�; bandwidth 31.25; matrix 256 � 192;
1 NEX; frequency in the AP direction. Image acquisi-
tion takes approximately 90 to 120 seconds. Com-
pression of the breast allows for a smaller volume of
breast tissue to be imaged, which can translate into
Fig. 3. A 50-year old-woman presented with vague thicken-
ing in the 12 o’clock axis of the right breast that was identified
on ultrasound and biopsied yielding infiltrating lobular carci-
noma. MRI was performed for to assess multicentricity and
bilaterality given the histology. (A) The index lesion is iden-
tified as a spiculated heterogeneously enhancing mass. (B) In
the contralateral breast, an unsuspected mass was identified
(arrow) that was not seen on ultrasound examination. MRI-
guided localization of the contralateral region was performed,
and pathology yielded infiltrating lobular carcinoma.
E.A. Morris / Radiol Clin N Am 40 (2002) 443–466 445

shorter imaging time. Subtraction imaging is per-
formed in addition to fat suppression to evaluate
possible enhancement of high signal areas on the
TI-weighted images. Images are read out on a GE
picture archiving and communication system (PACS),
which is ideal for comparing prior studies and for
windowing-appropriately. Prior mammograms and
breast ultrasound examinations are available. If a
time-intensity curve needs to be generated, a work-
station is available. It is helpful to train an MRI
technologist to perform time-intensity curves so that
the radiologist’s workflow is not interrupted.
For performing diagnostic MR examinations, an
MRI technologist, who can be trained in positioning
of the breast within the breast coil, is essential. As
with mammography, image quality depends on opti-
mal positioning. The breast should be pulled away
from the chest wall by the MRI technologist as much
as possible and placed in the center of the coil to
image the entire breast and reduce artifacts. If a
compression plate is used for immobilization, this
can be adjusted so that the medial breast tissue and
axillary tail are not excluded. It is helpful for the MRI
technologist to have a calm and reassuring manner to
facilitate patient cooperation. For interventional pro-
cedures, it is helpful to include the mammography
technologist who is trained in interventional breast
procedures in addition to the MRI technologist who is
trained in image acquisition.
Fig. 4. Screen-detected cancer. A high-risk 50-year-old woman who had undergone contralateral mastectomy was on
chemoprevention and studied yearly with breast MRI. Screening MR examination depicts an interval heterogeneously enhancing
irregular mass (arrow) in the axillary tail. A directed ultrasound of this region yielded a subtle solid mass that underwent
ultrasound-guided core biopsy. Pathology yielded infiltrating ductal carcinoma, histologically different from the contralateral
carcinoma. Nodal status was negative.
Table 1
False positive on breast MRI
Fibroadenoma
Lobular carcinoma in situ
Ductal atypia
Fibrocystic changes
Proliferative changes
Papilloma
Sclerosing adenosis
Duct hyperplasia
E.A. Morris / Radiol Clin N Am 40 (2002) 443–466446
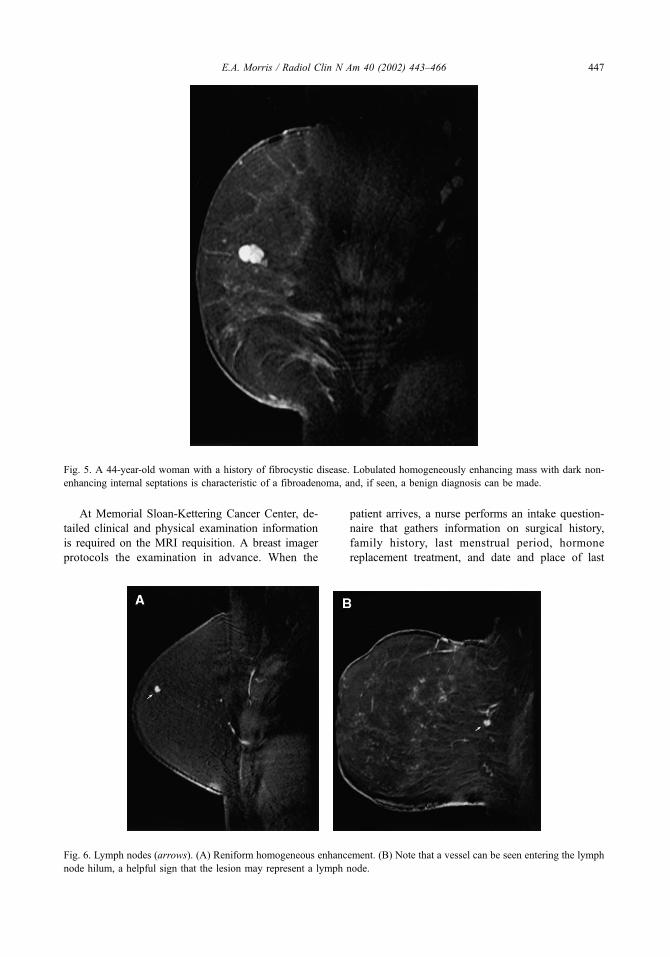
At Memorial Sloan-Kettering Cancer Center, de-
tailed clinical and physical examination information
is required on the MRI requisition. A breast imager
protocols the examination in advance. When the
patient arrives, a nurse performs an intake question-
naire that gathers information on surgical history,
family history, last menstrual period, hormone
replacement treatment, and date and place of last
Fig. 5. A 44-year-old woman with a history of fibrocystic disease. Lobulated homogeneously enhancing mass with dark non-
enhancing internal septations is characteristic of a fibroadenoma, and, if seen, a benign diagnosis can be made.
Fig. 6. Lymph nodes (arrows). (A) Reniform homogeneous enhancement. (B) Note that a vessel can be seen entering the lymph
node hilum, a helpful sign that the lesion may represent a lymph node.
E.A. Morris / Radiol Clin N Am 40 (2002) 443–466 447

mammogram and ultrasound, if not brought with the
patient or not performed at our institution. The nurse
draws on a preprinted diagram any scars, areas of
discoloration, or lumps and then marks the breast
with vitamin E capsules over any areas of palpable
abnormality and sites of prior surgery. The patient’s
prior films are available at the time of interpretation
so that correlation with the mammogram and sono-
gram can be made.
Image analysis
Breast MRI lexicon
Breast MRI analysis relies on both the morphol-
ogy and kinetics of the lesion. The American College
of Radiology (ACR) is supporting a group of interna-
tional experts to develop a lexicon to standardize
terminology and reporting [18–20]. The ACR breast
Fig. 7. Time intensity curves. Type I curve is continuous enhancement. Type II curve reaches a plateau. Type III curve washes out
where there is a decrease in signal intensity after peak enhancement.
Table 2
Suggested algorithm for image interpretation
E.A. Morris / Radiol Clin N Am 40 (2002) 443–466448

MRI lexicon is a work in progress and is modeled on
the BI-RADSTM lexicon [21] for morphology and
also incorporating the dynamic enhancement proper-
ties of the lesion. Although the lexicon is still in
evolution, several descriptions are presented in this
paper so that readers can acquaint themselves with
pertinent terminology (Table 3).
When reporting findings, the International Work-
ing Group on Breast MRI recommends that a clinical
statement and a description of the technique used be
included in the report. Lesions should be described
using standardized terminology from the developing
breast MRI lexicon, and a final assessment recom-
mendation should be made so that the referring
clinician understands the next appropriate step in
the work-up of the lesion.
Morphology
When analyzing an enhancing lesion on MRI,
the first distinction is to decide if the finding is a
focus, mass, or nonmass (Table 3). Further descrip-
tion of the lesion will depend on this distinction. It
is often difficult to define what is a focus or a mass.
A focus is defined as a tiny spot of enhancement
that is a dot and does not occupy space (Fig. 8).
Most of the tiny foci of enhancement are a few
millimeters in size and appear round and smooth.
Some examples of small areas of enhancement that
are not smoothly marginated and are slightly larger
than true ‘‘foci’’ are shown in Fig. 9. These exam-
ples represent DCIS at surgery following MR-
guided needle localization. When innumerable foci
are present, the breast has a characteristically benign
‘‘stippled’’ appearance (Fig. 10).
What should one do with foci of enhancement?
If the lesion meets the criteria of a focus and is not a
space-occupying mass, then one may elect to do
nothing, although long-term follow-up studies have
not documented this approach, and these studies
need to be performed. If at all concerned when
interpreting an examination, short-term follow-up
may be warranted, although this has yet to be
proven as cost effective and efficacious. Follow-up
may be an option in a premenopausal patient or a
postmenopausal patient on hormones in whom there
is suspicion that the foci are hormone related.
Studies have shown that small areas of enhance-
ment, when present in patients with a known pri-
mary breast carcinoma [22], are more likely to
represent malignancy, but further study is necessary
to address this issue.
Investigators have analyzed architectural features
of MR-detected masses and nonmass lesions, result-
ing in the development of interpretation models
[23,24]. These studies have shown that smooth
(Fig. 11) or lobulated borders (Fig. 5) have a high
negative predictive value for carcinoma (95% and
90%, respectively). Spiculated (Fig. 12) and irregular
(Fig. 13) margins have high positive predictive value
for malignancy (91% and 81%, respectively). Rim
enhancement (Fig. 14) has an 86% predictive value
for malignancy [24]. To demonstrate that these
descriptors may co-exist, a carcinoma is shown with
lobulated shape, a benign finding, and rim enhance-
ment, a malignant finding (Fig. 15). This illustrates
that the most suspicious feature, in this case rim
enhancement, is the most pertinent morphologic
finding directing further work-up.
Nonmass enhancement, such as ductal enhance-
ment, has a positive predictive value of malignancy
of 85% [24] (Fig. 16). Clumped enhancement can be
arranged within a single ductal system, generating a
segmental enhancement pattern on MRI (Fig. 17);
when seen, this is suspicious for DCIS (Fig. 18).
Table 3
Preliminary ACR breast MRI lexicon (work in progress)a
Focus/foci
Mass enhancement Non-mass enhancement
Linear
Segmental
Regional
Diffuse
Margins Descriptors linear
Smooth Smooth
Irregular Irregular
Spiculated Clumped
Shape
Oval
Descriptors segmental/
regional/diffuse
Round Homogeneous
Lobulated Heterogeneous
Irregular Clumped
Septal/dendritic
Enhancement pattern
Homogeneous
Heterogeneous
Rim
Non-enhancing septations
Enhancing septations
Central enhancement
a Members of the lexicon working group: Debra Ikeda,
MD; Nola Hylton, PhD; Mitchell Schnall, MD, PhD; Steven
Harms, MD; Jeffrey Weinreb, MD; Werner Kaiser, MD,
PhD; Mary Hochman, MD; Karen Kinkel, MD; Christiane
Kuhl, MD, PhD; John Lewin, MD; Elizabeth Morris, MD;
Petra Wiehweg, MD, PhD; Hadassa Degani, PhD, Stanley
Smazal, MD.
E.A. Morris / Radiol Clin N Am 40 (2002) 443–466 449

Regional enhancement (Fig. 19) can be seen with
both benign and malignant disease and has a negative
predictive value of 53% [24]. A unique descriptor
that is used in the case of inflammatory carcinoma
with diffuse enhancement is reticular (Fig. 20), where
there is no underlying mass and the enhancement
pattern appears lace-like.
Kinetics
Enhancement kinetic analysis evaluates what hap-
pens to the intravenous contrast within a lesion over a
period of time. Signal intensity (SI) increase follow-
ing contrast administration (SIpost) is measured rela-
tive to precontrast level (SIpre):
½ðSIpost�SIpreÞ� � 100%
When plotted, time/signal intensity curves are gen-
erated and can provide further information about the
vascular properties of a lesion. They generally require
at least several time points, with the first being at time
zero when there is no contrast within the lesion. To
generate these time points, the breast must be scanned
and rescanned many times following intravenous con-
trast bolus injection. The more time points desired in a
certain time frame, the faster the acquisition. Just what
Fig. 8. Foci of enhancement (arrows) in two patients with dense breasts on mammography.
Fig. 9. Suspicious areas of enhancement that are not foci. (A) Spiculated solitary tiny area of enhancement (arrow) in a woman
with a strong family history proved to represent DCIS at surgery following MR-guided needle localization. (B) Two small areas
of spiculated enhancement (arrows) also proved to represent DCIS in a 59-year-old woman with documented infiltrating ductal
carcinoma in a separate quadrant.
E.A. Morris / Radiol Clin N Am 40 (2002) 443–466450

constitutes an adequate time/signal curve is a matter
of debate. Most imagers agree that each dynamic
scan should be less than 2 minutes; however, the
faster the dynamic scan, the less the resolution.
Therefore, a compromise must be reached.
There are three general types of time-intensity
curves (Fig. 7) [25]. Type I is continuous progressive
enhancement over time, indicating that contrast accu-
mulates within the lesion, typically seen with benign
findings. Type III is a washout curve, indicating that
after the lesion takes up contrast, the contrast
promptly washes out, presumably by leaky capillaries
and shunts found in malignant lesions. Type II is a
plateau curve that is a combination of a Type I and a
Type III curve and can be seen with both benign and
malignant lesions.
Pitfalls in analysis
Clip artifact
Clips in the breast can cause difficulties in inter-
pretation. Clips used in surgery are generally made of
titanium and cause susceptibility artifact that presents
as a signal void with adjacent linear high signal that
Fig. 10. Examples of benign stippled enhancement in three pre-menopausal women. Note the low signal cyst (arrow) in panel A.
E.A. Morris / Radiol Clin N Am 40 (2002) 443–466 451

should not be misinterpreted as residual or recurrent
disease at the lumpectomy site (Fig. 21). Surgical clips
that are placed at the time of lumpectomy will produce
more artifact than a clip placed at the time of stereo-
Fig. 11. Round homogeneously enhancing masses (arrows) with smooth borders. (A) Fibroadenoma at biopsy. (B) Fat
necrosis at biopsy
Fig. 12. Spiculated heterogeneously enhancing mass corresponding to infiltrating ductal carcinoma.
E.A. Morris / Radiol Clin N Am 40 (2002) 443–466452

tactic biopsy because they are larger and usually more
numerous. The detection of recurrence when the
patient is months to years out from surgery will there-
fore be limited in a patient with a large number of clips
in the lumpectomy bed. Detection of residual disease
following surgery, however, is not as compromised
(Fig. 22) because a seroma is generally present in the
immediate postoperative period. Although seroma
cavities are variable in size, they are fluid filled,
generally allowing detection of residual disease along
the margin of the seroma cavity. Similarly, with stereo-
tactically placed clips, it is possible to detect small
amounts of residual disease adjacent to the biopsy site
because the amount of artifact is almost negligible.
Fat suppression
Inhomogeneous fat suppression (Fig. 23) can se-
verely compromise image quality and generally results
in a scan that is uninterpretable. Technologists should
perform manual fat suppression, if possible. In our
practice, if all efforts fall short of adequate fat sup-
pression, the patient will be brought back on another
day to repeat the examination at no extra charge. Inter-
preting a study that is technically suboptimal leads to
interpretation errors and possibly to legal redress.
Window levels
When interpreting breast MR examinations, appro-
priate windowing is essential for accurate morphologic
analysis. Fig. 24 shows how appropriate windowing
may change the diagnosis from a potentially suspi-
cious lesion to an obviously benign fibroadenoma.
When reading images on a monitor, such as PACS,
manipulation of the contrast and brightness levels is
feasible and allows the radiologist greater freedom to
window appropriately. When reading hard-copy film,
where the brightness and contrast levels are set, there is
less freedom, although one should not hesitate to
interpret from the MR monitor or work station.
Misregistration
We have found it very helpful to perform sub-
traction imaging because it can be difficult to deter-
Fig. 13. Irregular heterogeneously enhancing mass in a 41-year-old woman. Pathology yielded infiltrating ductal carcinoma.
E.A. Morris / Radiol Clin N Am 40 (2002) 443–466 453

mine whether high-signal masses on the precontrast,
T1-weighted images enhance the postcontrast T1-
weighted images. Because the masses appear bright
on both the pre-and postcontrast images, subtle
enhancement may be missed. It should be realized
that when performing subtraction, a small degree of
movement of the patient translates into signal mis-
registration (Fig. 25). A non-enhancing lesion may
erroneously appear to show enhancement because
the high signals on the pre- and postcontrast images
do not get subtracted as the patient changes posi-
tion between the two acquisitions. If one relies
solely on subtraction for image interpretation,
image quality is not as reliable, and lesions may
be missed as well as over-read. For this reason, fat-
suppressed images may be preferred for lesion
analysis, and subtraction images may be used for
supplemental information.
Delayed imaging time
If image acquisition is delayed more than 2minutes
(Fig. 26) or if the image sequence itself takes more
than 2 minutes, there may be a problem with diffuse
parenchymal enhancement obscuring an underlying
lesion. If the scan is delayed for more than 2 minutes
after giving the contrast bolus, the diagnostic quality
of the examination is questionable. In our practice, if a
mishap occurs after contrast injection and we are
Fig. 14. Irregular rim-enhancing mass proved to represent infiltrating ductal carcinoma. Note the adjacent satellite lesion (arrow).
Fig. 15. Lobulated rim-enhancing infiltrating ductal carci-
noma in a 46-year-old woman who underwent MRI to assess
if breast conservation was feasible.
E.A. Morris / Radiol Clin N Am 40 (2002) 443–466454
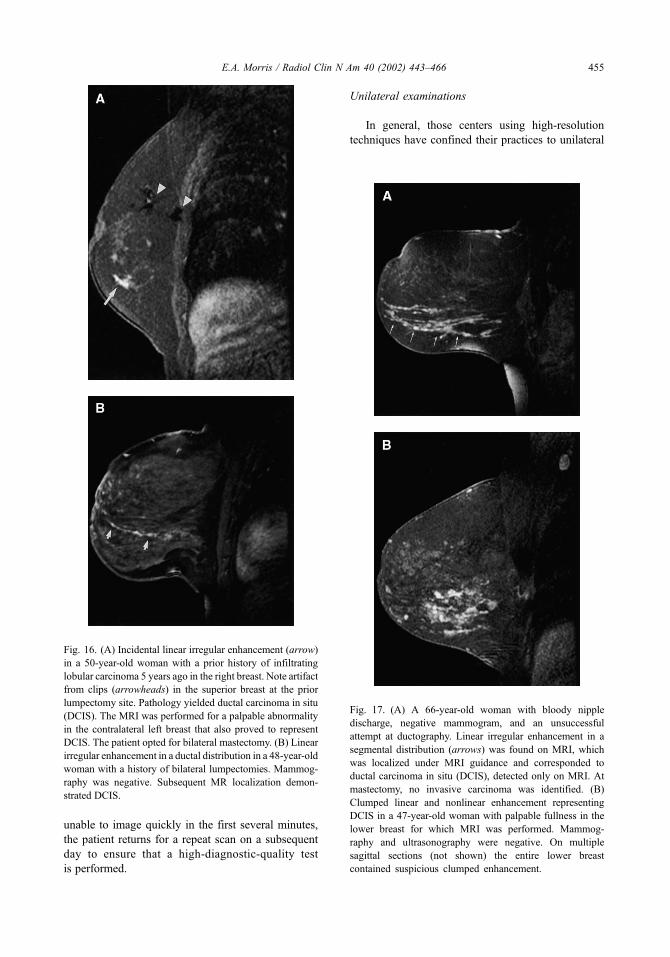
unable to image quickly in the first several minutes,
the patient returns for a repeat scan on a subsequent
day to ensure that a high-diagnostic-quality test
is performed.
Unilateral examinations
In general, those centers using high-resolution
techniques have confined their practices to unilateral
Fig. 16. (A) Incidental linear irregular enhancement (arrow)
in a 50-year-old woman with a prior history of infiltrating
lobular carcinoma 5 years ago in the right breast. Note artifact
from clips (arrowheads) in the superior breast at the prior
lumpectomy site. Pathology yielded ductal carcinoma in situ
(DCIS). The MRI was performed for a palpable abnormality
in the contralateral left breast that also proved to represent
DCIS. The patient opted for bilateral mastectomy. (B) Linear
irregular enhancement in a ductal distribution in a 48-year-old
woman with a history of bilateral lumpectomies. Mammog-
raphy was negative. Subsequent MR localization demon-
strated DCIS.
Fig. 17. (A) A 66-year-old woman with bloody nipple
discharge, negative mammogram, and an unsuccessful
attempt at ductography. Linear irregular enhancement in a
segmental distribution (arrows) was found on MRI, which
was localized under MRI guidance and corresponded to
ductal carcinoma in situ (DCIS), detected only on MRI. At
mastectomy, no invasive carcinoma was identified. (B)
Clumped linear and nonlinear enhancement representing
DCIS in a 47-year-old woman with palpable fullness in the
lower breast for which MRI was performed. Mammog-
raphy and ultrasonography were negative. On multiple
sagittal sections (not shown) the entire lower breast
contained suspicious clumped enhancement.
E.A. Morris / Radiol Clin N Am 40 (2002) 443–466 455
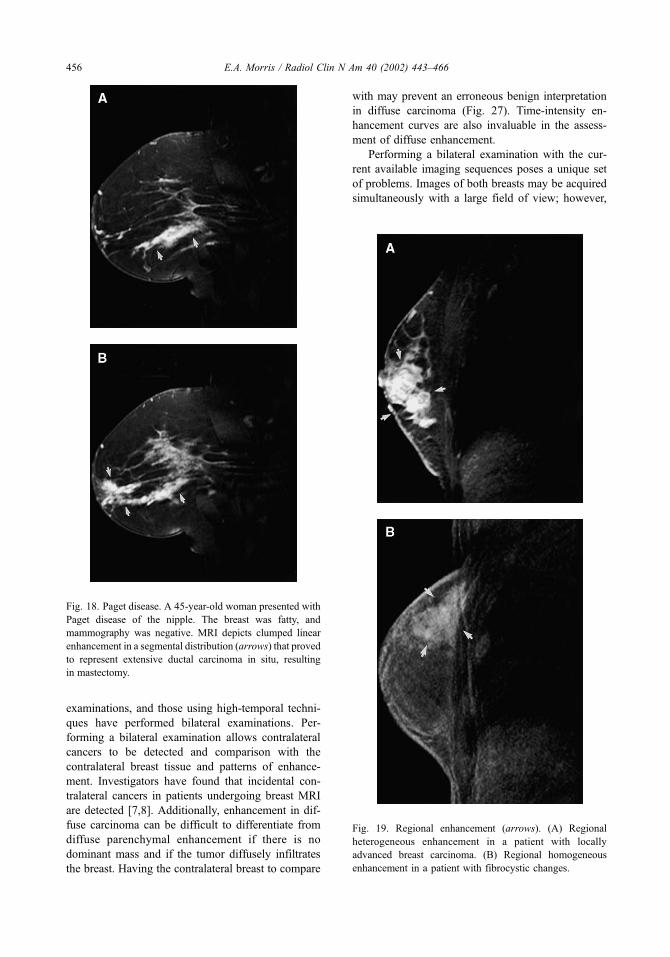
examinations, and those using high-temporal techni-
ques have performed bilateral examinations. Per-
forming a bilateral examination allows contralateral
cancers to be detected and comparison with the
contralateral breast tissue and patterns of enhance-
ment. Investigators have found that incidental con-
tralateral cancers in patients undergoing breast MRI
are detected [7,8]. Additionally, enhancement in dif-
fuse carcinoma can be difficult to differentiate from
diffuse parenchymal enhancement if there is no
dominant mass and if the tumor diffusely infiltrates
the breast. Having the contralateral breast to compare
with may prevent an erroneous benign interpretation
in diffuse carcinoma (Fig. 27). Time-intensity en-
hancement curves are also invaluable in the assess-
ment of diffuse enhancement.
Performing a bilateral examination with the cur-
rent available imaging sequences poses a unique set
of problems. Images of both breasts may be acquired
simultaneously with a large field of view; however,
Fig. 18. Paget disease. A 45-year-old woman presented with
Paget disease of the nipple. The breast was fatty, and
mammography was negative. MRI depicts clumped linear
enhancement in a segmental distribution (arrows) that proved
to represent extensive ductal carcinoma in situ, resulting
in mastectomy.
Fig. 19. Regional enhancement (arrows). (A) Regional
heterogeneous enhancement in a patient with locally
advanced breast carcinoma. (B) Regional homogeneous
enhancement in a patient with fibrocystic changes.
E.A. Morris / Radiol Clin N Am 40 (2002) 443–466456
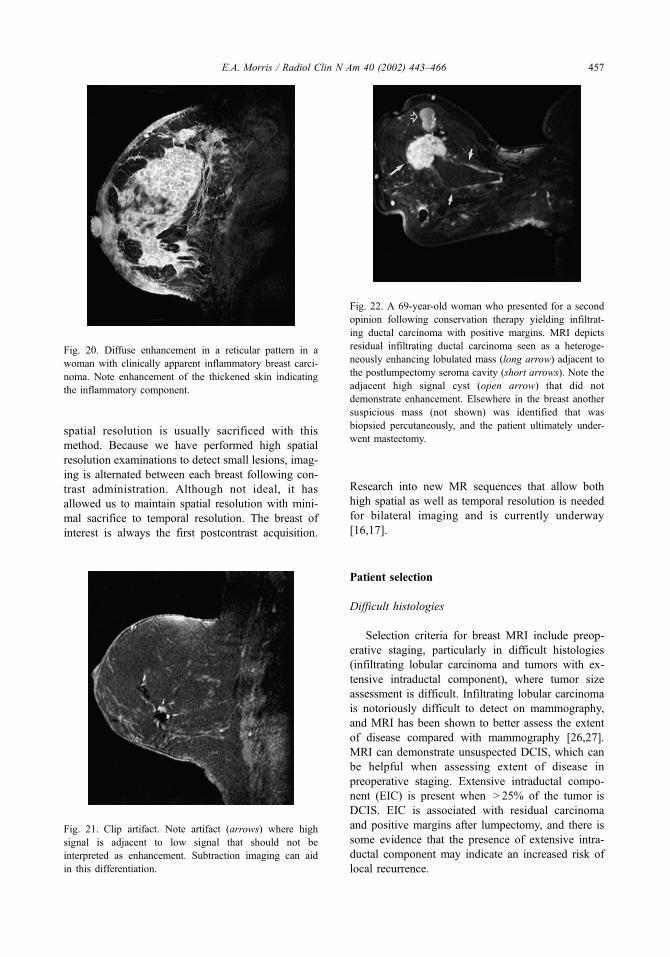
spatial resolution is usually sacrificed with this
method. Because we have performed high spatial
resolution examinations to detect small lesions, imag-
ing is alternated between each breast following con-
trast administration. Although not ideal, it has
allowed us to maintain spatial resolution with mini-
mal sacrifice to temporal resolution. The breast of
interest is always the first postcontrast acquisition.
Research into new MR sequences that allow both
high spatial as well as temporal resolution is needed
for bilateral imaging and is currently underway
[16,17].
Patient selection
Difficult histologies
Selection criteria for breast MRI include preop-
erative staging, particularly in difficult histologies
(infiltrating lobular carcinoma and tumors with ex-
tensive intraductal component), where tumor size
assessment is difficult. Infiltrating lobular carcinoma
is notoriously difficult to detect on mammography,
and MRI has been shown to better assess the extent
of disease compared with mammography [26,27].
MRI can demonstrate unsuspected DCIS, which can
be helpful when assessing extent of disease in
preoperative staging. Extensive intraductal compo-
nent (EIC) is present when > 25% of the tumor is
DCIS. EIC is associated with residual carcinoma
and positive margins after lumpectomy, and there is
some evidence that the presence of extensive intra-
ductal component may indicate an increased risk of
local recurrence.
Fig. 20. Diffuse enhancement in a reticular pattern in a
woman with clinically apparent inflammatory breast carci-
noma. Note enhancement of the thickened skin indicating
the inflammatory component.
Fig. 22. A 69-year-old woman who presented for a second
opinion following conservation therapy yielding infiltrat-
ing ductal carcinoma with positive margins. MRI depicts
residual infiltrating ductal carcinoma seen as a heteroge-
neously enhancing lobulated mass (long arrow) adjacent to
the postlumpectomy seroma cavity (short arrows). Note the
adjacent high signal cyst (open arrow) that did not
demonstrate enhancement. Elsewhere in the breast another
suspicious mass (not shown) was identified that was
biopsied percutaneously, and the patient ultimately under-
went mastectomy.
Fig. 21. Clip artifact. Note artifact (arrows) where high
signal is adjacent to low signal that should not be
interpreted as enhancement. Subtraction imaging can aid
in this differentiation.
E.A. Morris / Radiol Clin N Am 40 (2002) 443–466 457
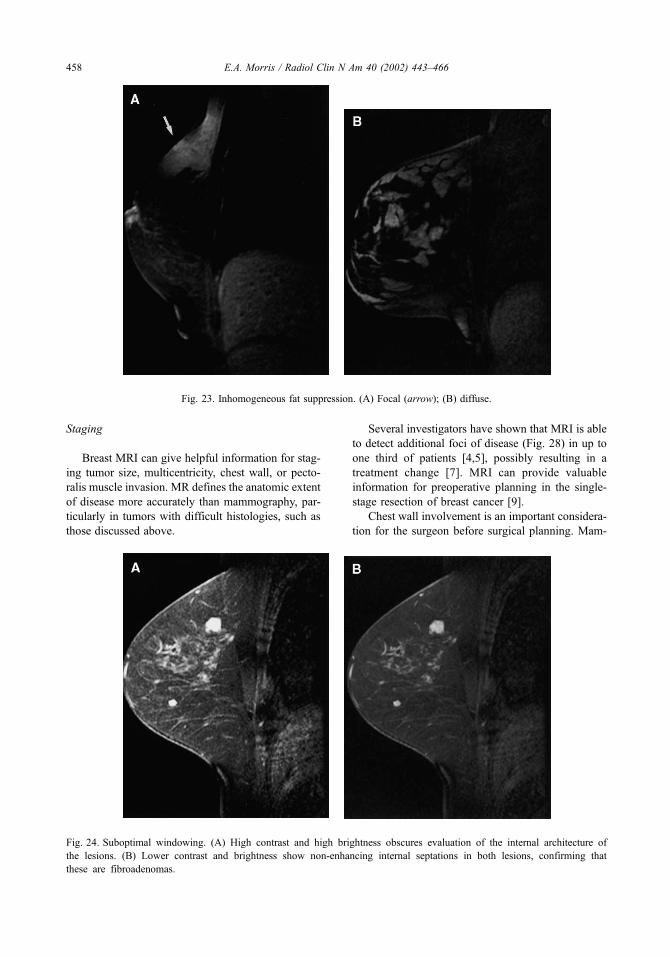
Staging
Breast MRI can give helpful information for stag-
ing tumor size, multicentricity, chest wall, or pecto-
ralis muscle invasion. MR defines the anatomic extent
of disease more accurately than mammography, par-
ticularly in tumors with difficult histologies, such as
those discussed above.
Several investigators have shown that MRI is able
to detect additional foci of disease (Fig. 28) in up to
one third of patients [4,5], possibly resulting in a
treatment change [7]. MRI can provide valuable
information for preoperative planning in the single-
stage resection of breast cancer [9].
Chest wall involvement is an important considera-
tion for the surgeon before surgical planning. Mam-
Fig. 23. Inhomogeneous fat suppression. (A) Focal (arrow); (B) diffuse.
Fig. 24. Suboptimal windowing. (A) High contrast and high brightness obscures evaluation of the internal architecture of
the lesions. (B) Lower contrast and brightness show non-enhancing internal septations in both lesions, confirming that
these are fibroadenomas.
E.A. Morris / Radiol Clin N Am 40 (2002) 443–466458

mography does not image the ribs, intercostal
muscles, and serratus anterior muscle that comprise
the chest wall. Tumor involvement of the chest wall
changes the patient’s stage to IIIB, indicating that the
patient may benefit from neo-adjuvant chemotherapy
before surgery (Fig. 29). Tumor involvement of the
pectoralis muscle does not alter staging, and surgery
can usually proceed; however, knowledge that the
muscle is involved may alter the surgeon’s plan. For
example, if the full thickness of the pectoralis major
muscle is involved with tumor, the surgeon may be
more inclined to perform a radical instead of a
modified radical mastectomy [28].
Controversies about MR staging include the pos-
sibility that MRI may identify cancer that is currently
adequately treated with adjuvant chemotherapy and
Fig. 25. Misregistration artifact caused by patient motion between the precontrast and postcontrast images. (A) precontrast image
demonstrates high signal in a duct in the retroareolar location, possibly representing proteinaceous debris or hemorrhage.
(B) Postcontrast image shows the same high signal. It is not clear if enhancement has occurred. (C) Subtraction image documents
no significant enhancement. The interpreter should not misinterpret the thin high signal (arrows), which is caused by mis-
registration as enhancement.
E.A. Morris / Radiol Clin N Am 40 (2002) 443–466 459

radiation therapy, especially DCIS. If that is true, then
what size lesion can we safely ignore on MRI? These
questions lead to a broader question: Is MRI too
sensitive in detecting cancer in general? For our
current treatment algorithms, this may be the case in
certain situations. MRI may detect subclinical disease
that may never have been clinically relevant. On the
other hand, MRI does detect additional disease that
would clearly not be treated with adjuvant therapy.
The challenge is in knowing what is significant and
what is not so that the patient is counseled on
appropriate therapy options. Trials that involve radi-
ologists, radiation oncologists, and surgeons are
needed to answer these perplexing questions.
Fig. 26. Importance of early imaging. Image acquisition should occur within the (A) first 2 minutes after contrast administration.
If delayed, early enhancement and rapid washout in malignancy may be missed, and the background enhancement may obscure
any significant lesion as seen on this 6 minutes postcontrast image (B).
Fig. 27. Bilateral examination. (A) A 50-year-old woman with diffuse enhancement throughout the breast but no focal mass. This
image may be mistaken for diffuse parenchymal enhancement without the benefit of comparison with the contralateral breast.
(B) The contralateral breast demonstrates no enhancement, therefore suggesting that the diffuse enhancement is suspicious.
Subsequent biopsy demonstrated diffuse infiltrating ductal carcinoma.
E.A. Morris / Radiol Clin N Am 40 (2002) 443–466460

With our current treatment protocols it is imper-
ative to verify all suspicious breast MRI lesions as
cancer before submitting the patient to a mastectomy.
If preoperative histologic verification of additional
lesions is not performed, there is the potential to deny
breast conservation to women who would have oth-
erwise been candidates.
Neo-adjuvant chemotherapy response
MRI can assess response to neo-adjuvant chemo-
therapy for locally advanced breast cancer. A com-
plete pathologic response (elimination of tumor)
following neo-adjuvant therapy is strongly predictive
of excellent long-term survival. Minimal response
(Fig. 30) suggests a poor long-term survival regard-
less of postoperative therapy. MRI may be able to
predict earlier than is now possible which patients are
responding to neo-adjuvant chemotherapy because the
mammogram and physical examination may be com-
promised because of fibrosis. Investigators [29,30]
are assessing if residual tumor measurements corre-
late with the pathologic residual disease following
neo-adjuvant chemotherapy. Patterns of response are
Fig. 28. A 46-year-old woman with a strong family history and dense breasts underwent screening ultrasound, which demonstrated
a solitary solid mass. MRI was performed for assessment of disease extent. (A) Multiple irregular heterogeneously enhancing
masses proved to represent sites of mammographically occult carcinoma. (B) Another mass in the ipsilateral breast proved to
represent additional areas of infiltrating ductal carcinoma. (C) Incidental contralateral ductal carcinoma in situ was also found.
E.A. Morris / Radiol Clin N Am 40 (2002) 443–466 461

being evaluated in the hope that these findings may
predict recurrence and survival [31].
Assessment of residual disease
For patients who have undergone lumpectomy
and have positive margins and no evidence of resid-
ual disease on mammography, MRI can be helpful in
the assessment of residual tumor load (Fig. 31).
Postoperative mammography detects residual calcifi-
cations [32], although it is limited for the evaluation
of residual mass. MRI detects residual masses and
determines whether the patient would be best served
with re-excision or whether the patient warrants
mastectomy. Before mastectomy, it is important to
verify other suspicious sites seen only on MRI. In one
study [33], MRI detected residual disease in 23/33
(70%) and alone identified multifocal or multicentric
disease in 9/33 (27%).
Tumor recurrence at the lumpectomy site
Tumor recurrence after conservation occurs at a
rate of 1% to 2% per year. Recurrence at the lumpec-
tomy site occurs earlier than elsewhere in the breast.
Evaluation of the lumpectomy site is limited because
of postoperative scarring, and physical examination
may have greater sensitivity than mammography in
the detection of recurrence. Mammography detects
25% to 45% of recurrences and is more likely to
detect noninvasive recurrences with calcifications
than invasive recurrences without calcifications,
although histology of most recurrences is invasive
[34]. All recurrences in one study [35] with nodular
enhancement in all cases of invasive carcinoma
(Fig. 32), and linear enhancement was observed in
the cases of DCIS recurrence. The majority of scars
showed no enhancement [36].
When to image for potential recurrence is problem-
atic because scar tissue can enhance for years follow-
ing surgery. Recurrence peaks in the first few years
following surgery, and the most likely site of recur-
rence is the lumpectomy site; therefore, the usefulness
of the information obtained from a costly MRI study
needs to be weighed against that obtained from a
potentially less expensive needle biopsy of the area.
Occult primary breast cancer
Patients presenting with axillary metastases sus-
picious for primary breast cancer and a negative
physical examination and negative mammogram are
Fig. 29. A 53-year-old woman presents with a 5-cm palpable mass that was seen mammographically. MRI was performed for
extent of disease assessment because it was not clear if the patient was a candidate for conservation therapy. (A) MRI depicts the
dominant mass (arrow), pectoralis muscle invasion (curved arrow), and chest wall invasion (open arrow) where the tumor
extends into the intercostal muscles. It was decided to give the patient neoadjuvant therapy before surgery. (B) Follow-up MRI
shows that the patient did not respond to chemotherapy as the mass has increased in size. There is now tumor involving the skin,
compatible with inflammatory cancer.
E.A. Morris / Radiol Clin N Am 40 (2002) 443–466462

Fig. 31. A 45-year-old woman who presented with thickening and a negative mammogram showing extremely dense breasts.
Biopsy done revealed ductal carcinoma in situ with multiple positive margins. MRI, performed 2 weeks after surgery and depicts
a seroma (small arrows) with abundant surrounding clumped enhancement in a segmental distribution (large arrows) involving
an entire quadrant from the pectoralis muscle to the nipple. Re-excision yielded positive margins. Because the patient refused
mastectomy, a third excision was performed that obtained negative margins.
Fig. 30. Response to neo-adjuvant chemotherapy for stage III breast cancer. (A) Multiple irregular and spiculated masses are seen
in the upper breast in this 57-year-old woman with biopsy-proven infiltrating lobular carcinoma who presented with a palpable
mass but with a mammogram that demonstrated diffuse increase in density in the upper outer quadrant. MRI was performed for
assessment of disease extent. Findings on MRI confirmed the presence of a 9-cm mass. (B) Following three cycles of
chemotherapy, there is no appreciable response.
E.A. Morris / Radiol Clin N Am 40 (2002) 443–466 463

ideal candidates for MRI because of the high
sensitivity of MRI for invasive carcinoma [37]. In
patients with this presentation, MRI has been able to
detect cancer in 90% to 100% of cases if a tumor is
indeed present [38,39]. The tumors are generally
small in size (< 2 cm) and may evade detection by
conventional imaging.
The ability to detect a site of malignancy in this
rare presentation of breast cancer is important ther-
apeutically. Patients traditionally undergo mastec-
tomy because the primary site is unknown. Whole-
breast radiation can be given, although it is generally
not recommended because, although the survival rate
is equal to that for mastectomy, the recurrence rate is
up to 23% higher [40]. The results of MRI can have a
significant impact on patient management. In one
study, the results of the MR examination changed
therapy in approximately one half of cases, usually
allowing conservation in lieu of mastectomy [41].
High-risk screening
A potential future use of breast MRI is high-risk
screening for patients who are premenopausal with
dense breasts. Because mammography has a false-
negative rate of up to 15% and is perhaps more
limited in this population, there has been exploration
into alternative screening methods. Of the available
methods, MRI holds the most promise, mostly
because the high-resolution capabilities and the
potential to detect preinvasive DCIS. The use of
breast MRI in this population is experimental at the
time of this writing. The data to determine the
appropriateness of MR for screening high-risk
patients are presently being acquired in several
ongoing studies in the United States and elsewhere,
and the use of MR for screening is currently unjus-
tified outside a study protocol. Furthermore, no
information exists for screening ‘‘dense, difficult to
examine’’ breasts in patients for whom there is no
significant family or personal history of breast cancer.
Screening by MRI in this population where the
incidence of breast cancer is low would likely result
in too many false-positive interpretations to justify
its use.
BRCA 1 or 2 carriers are a group of high-risk
patients who have an up to 85% risk of developing
breast cancer over their lifetime. The onset of
inherited breast cancer is earlier than sporadic cases,
and the prevalence of bilaterality is higher. One study
[42] showed that MRI was able to detect, mammo-
graphically and sonographically occult breast cancers
in a group of patients who were known or suspected
carriers of either the BRCA 1 or 2 gene. Nine cancers
were detected in a group of 192 women; three of
these cancers were detected on MRI only, indicating a
frequency of ‘‘MRI-only’’ cancers of 2%. All were
pT1 and node negative. Although these results are
Fig. 32. Evaluation of recurrence at the lumpectomy site following breast conservation 3 years prior in a 34-year-old woman.
(A) MR examination following lumpectomy depicts a linear enhancing scar (arrow) between two clips (arrowheads) visualized
as signal void. Recurrence at the lumpectomy site is demonstrated in another patient. (B) A different 36-year-old woman
underwent lumpectomy 1 year ago and had a screening ultrasound that found a small mass adjacent to the lumpectomy site. MR
examination confirmed the recurrence as a rim-enhancing mass (arrow). Mammography was unremarkable in both patients.
E.A. Morris / Radiol Clin N Am 40 (2002) 443–466464

encouraging, applying this technology to the high-
risk population at large is not advocated at this time.
Larger studies need to be performed to validate these
data. If validated, a definition of what constitutes
‘‘high-risk’’ is needed. Ultimately, MRI needs to be
shown not to result in too many false-positive inter-
pretations and needs to be cost-effective, important
criteria for a screening test.
Summary
Breast MRI is an emerging technology that may
revolutionize our management of women with known
or suspected breast cancer. MRI examinations should
be interpreted with an awareness of the pitfalls and
artifacts that can affect on image evaluation. Develop-
ment of an MRI lexicon will assist by providing
standardized terminology that may improve our under-
standing of the positive predictive value of different
MRI features. To date, breast MRI has proven most
useful in patients with proven breast cancer to assess
for multifocal/multicentric disease, chest wall involve-
ment, chemotherapy response, or tumor recurrence or
to identify the primary site in patients with occult
breast cancer. Further work is necessary to assess the
utility of breast MRI in other settings, such as screen-
ing of women at high risk for breast cancer.
References
[1] Kaiser WA, Zeitler E. MR imaging of the breast: fast
imaging sequences with and without Gd-DTPA. Radi-
ology 1989;170:681–6.
[2] Heywang SH, Wolf A, Pruss E, Hilbertz T, Eiermann
W, Permanetter W. MR imaging of the breast with
Gd-DTPA: use and limitations. Radiology 1989;171:
95–103.
[3] Orel SG, Schnall MD, LiVolsi VA, et al. Suspicious
breast lesions: MR imaging with radiologic-pathologic
correlation. Radiology 1994;190:485–92.
[4] Harms SE, Flamig DP, Hesley KL, et al. MR imaging
of the breast with rotating delivery of excitation off
resonance: clinical experience with pathologic correla-
tion. Radiology 1993;187:493–501.
[5] Orel SG, Schnall MD, Powell CM, et al. Staging of
suspected breast cancer: effect of MR imaging and
MR-guided biopsy. Radiology 1995;196:115–22.
[6] Mumtaz H, Hall-Craggs MA, Davidson T, et al. Stag-
ing of symptomatic primary breast cancer with MR
imaging. AJR 1997;169:417–24.
[7] Fischer U, Kopka L, Grabbe E. Breast carcinoma:
Effect of preoperative contrast-enhanced MR imaging
on the therapeutic approach. Radiology 1999;213:
881–8.
[8] Slanetz PJ, Edmister WB, Weisskoff RM, et al. Oc-
cult contralateral breast cancer detected by breast MR
[abstract]. Radiology 1998;209:467.
[9] Esserman L, Hylton NM, Yassa L, et al. Utility of
magnetic resonance imaging in the management of
breast cancer: evidence for improved preoperative
staging. J Clin Oncol 1999;17:110–9.
[10] Boetes C, Strijk SP, Holland R, et al. False-negative
MR imaging of malignant breast tumors. Eur Radiol
1997;7:1231–4.
[11] Soderstrom CE, Harms SE, Copit DS, et al. Three-
dimensional RODEO breast MR imaging of lesions
containing ductal carcinoma in situ. Radiology 1996;
201:427–32.
[12] Orel SG, Medonca MH, Reynolds C, et al. MR imag-
ing of ductal in situ. Radiology 1997;202:413–20.
[13] Gilles R, Zafrani B, Guinebretiere JM, et al. Ductal
carcinoma in situ: MR imaging-histopathologic corre-
lation. Radiology 1995;196:415–9.
[14] Westerhof JP, Fischer U, Moritz JD, Oestmann JW. MR
imaging of mammographically detected clustered mi-
crocalcifications: is there any value? Radiology 1998;
207:675–81.
[15] Harms SE. Technical report of the international work-
ing group on breast MRI. JMRI 1999;10:987–1015.
[16] Greenman RL, Lenkinski RE, Schnall MD. Bilateral
imaging using separate interleaved 3D volumes and
dynamically switched multiple receive coil arrays.
Magn Reson Med 1998;39:108–15.
[17] Yen YF, Ikeda DM, Herflens RF, et al. Pharmakoki-
netic analysis of breast disease with dynamic spiral
MRI [abstract]. In: Proceedings of the fourth meeting
of the International Society for Magnetic Resonance in
Medicine 1996. p. 745.
[18] Ikeda DM, Baker DR, Daniel BL. Magnetic reso-
nance imaging of breast cancer: clinical indications
and breast MRI reporting system. JMRI 2000;12:
975–83.
[19] Ikeda DM, Hylton NM, Kinkel K, et al. Development,
standardization and testing of a lexicon for reporting
contrast-enhanced breast MRI studies [abstract]. Radi-
ology 1999;213:370.
[20] Schnall MD, Ikeda DM. Lesion diagnosis working
group report. JMRI 1999;10:982–90.
[21] American College of Radiology (ACR). Breast imag-
ing reporting and data system (BI-RADS) (3rd ed).
Reston, VA: American College of Radiology; 1998.
[22] Brown J, Smith RC, Lee CH. Incidental enhancing le-
sions found on MR imaging of the breast. AJR 2001;
176:1249–54.
[23] Nunes LW, Schnall MD, Siegelman ES, et al. Diagnos-
tic performance characteristics of architectural features
revealed by high spatial-resolution MR imaging of the
breast. AJR 1997;169:409–15.
[24] Nunes LW, Schnall MD, Orel SG. Update of breast
MR imaging architectural interpretation model. Radi-
ology 2001;219:484–94.
[25] Kuhl CK, Mielcareck P, Klaschik S, et al. Dynamic
breast MR imaging: are signal intensity time course
E.A. Morris / Radiol Clin N Am 40 (2002) 443–466 465

data useful for differential diagnosis of enhancing le-
sions? Radiology 1999;211:101–10.
[26] Rodenko GN, Harms SE, Prineda JM, et al. MR imag-
ing in the management before surgery of lobular carci-
noma of the breast: correlation with pathology. AJR
1996;167:1415–9.
[27] Weinstein SP, Orel SG, Heller R, et al. MR imaging of
the breast in patients with invasive lobular breast can-
cer. AJR 2001;176:399–406.
[28] Morris EA, Schwartz LH, Drotman MB, et al. Evalua-
tion of pectoralis major muscle in patients with poste-
rior breast tumors on breast MR imaging: preliminary
experience. Radiology 2000;214:67–72.
[29] Rieber A, Zeitler H, Rosenthal H, et al. MRI of breast
cancer: influence of chemotherapy on sensitivity. Br J
Radiol 1997;70:452–8.
[30] Knopp MV, Brix G, Junkermann HJ, et al. MR mam-
mography with pharmocokinetic mapping for monitor-
ing of breast cancer treatment during neoadjuvant
therapy. MRI Clin North Am 1997;2:633–58.
[31] Hylton NM, Esserman LJ, Partridge SC, et al. Contrast
MRI for characterization of tumor response to neoad-
juvant chemotherapy and prediction of recurrence in
stage III breast cancer [abstract]. Eur Radiol 2000;
10:F10–1.
[32] Gluck BS, Dershaw DD, Liberman L, Deutch BM.
Microcalcifications on postoperative mammograms as
an indicator of adequacy of tumor excision. Radiology
1993;188:469–72.
[33] Orel SG, Reynolds C, Schnall MD, et al. Breast carci-
noma: MR imaging before reexcisional biopsy. Radi-
ology 1997;205:429–36.
[34] Dershaw DD, McCormick B, Osborne MP. Detection
of local recurrence after conservative therapy for breast
cancer. Cancer 1992;70:493–6.
[35] Gilles R, Guinebretiere JM, Shapeero LG, et al. As-
sessment of breast cancer recurrence with contrast-
enhanced subtraction MR imaging: preliminary results
in 26 patients. Radiology 1993;188:473–8.
[36] Dao TH, Rahmouni A, Campana F, et al. Tumor re-
currence versus fibrosis in the irradiated breast: differ-
entiation with dynamic gadolinium-enhanced MR
imaging. Radiology 1993;187:751–5.
[37] Schorn C, Fischer U, Luftner N, Westerhof JP, Grabbe
E. MRI of the breast in patients with metastatic disease
of unknown primary. Eur Radiol 1999;9:470–3.
[38] Campana F, Fourquet A, Ashby MA, et al. Presentation
of axillary lymphadenopathy without detectable breast
primary (T0N1b breast cancer): experience at Institut
Curie. Radiother Oncol 1989;15:321–5.
[39] Morris EA, Schwartz LH, Dershaw DD, et al. MR
imaging of the breast in patients with occult primary
breast cancer. Radiology 1997;205:437–40.
[40] Orel SG, Weinstein SP, Schnall MD, et al. Breast imag-
ing in patients with axillary node metastases and un-
known primary malignancy. Radiology 1999;212:
543–9.
[41] Olson JA, MorrisEA, Van Zee KJ, et al. Magnetic
resonance imaging facilitates breast conservation for
occult breast cancer. Ann Surg Oncol 2000;7:411–5.
[42] Kuhl CK, Schmutzler RK, Leutner CC, et al. Breast MR
Imaging screening in 192women proved or suspected to
be carriers of a breast cancer susceptibility gene: pre-
liminary results. Radiology 2000;215:267–79.
E.A. Morris / Radiol Clin N Am 40 (2002) 443–466466

New modalities in breast imaging: digital mammography,
positron emission tomography, and
sestamibi scintimammography
Jessica W.T. Leung, MD
Department of Radiology, Brigham and Women’s Hospital, Harvard Medical School,
75 Francis Street, Boston, MA 02115, USA
With an incidence of more than 180,000 cases per
year, breast cancer is the second leading cause of
cancer deaths among women in the United States.
The wi-despread implementation of screening mam-
mography has resulted in earlier detection of breast
cancer, reducing both the morbidity and mortality of
the disease. Several large-scale controlled trials have
shown that screening mammography is efficacious
and can reduce breast cancer mortality by 18% to
30% [1,2].
Conventional screening mammography consists
of screen-film images. Screen-film mammography
(SFM) fails to detect 10% to 20% of palpable breast
cancers, particularly in the dense breast where there is
insufficient contrast difference between normal and
cancerous tissues [3,4]. Furthermore, the positive
predictive value of SFM for cancer is less than 50%
(range of 5% to 40%) [5,6], so more than half of the
biopsies performed result in benign diagnoses. Even
if a biopsy is not performed, excessive recall imaging
decreases the cost-effectiveness of screening mam-
mography and increases patient anxiety.
This article is devoted to three new modalities in
breast cancer screening. It focuses on digital mam-
mography (DM), which has received much attention
and interest within both the radiology community and
the general public. This chapter also examines the
roles of positron emission tomography (PET) and
sestamibi scintimammography in breast cancer
screening and breast imaging.
Digital mammography
Broadly speaking, DM encompasses two distinct
technologies. One use of the term refers to the
digitization (by means of optical scanners and
computers) of screen-film mammograms. Whereas
this technique allows for computerized processing
and storage, the original image must be obtained
initially using analog screen-film techniques. Hence,
the digitized image remains limited by the quality
of the original analog mammogram. True DM refers
to the use of dedicated equipment for obtaining the
initial image in the digital form, using detector and
display systems that are distinct from those of
SFM. This latter meaning of DM is the subject of
this chapter.
Functional components
In SFM, the emulsion film serves multiple func-
tions: image acquisition mechanism, display unit, and
storage device. In DM, these tasks are performed by
separate components, enabling the optimal perform-
ance of each component. This decoupling is the key
underlying the technical success of DM.
Image acquisition
In SFM, x-ray photons cause light emission from
a phosphor screen, which then imprints a latent image
upon the film emulsion. Photographic processing
produces a permanent film image that is the final
mammogram. In DM, x-ray photons strike the digital
detector, and the photons are absorbed by a phosphor
0033-8389/02/$ – see front matter D 2002, Elsevier Science (USA). All rights reserved.
PII: S0033 -8389 (01 )00004 -5
E-mail address: [email protected] (J.W.T. Leung).
Radiol Clin N Am 40 (2002) 467–482
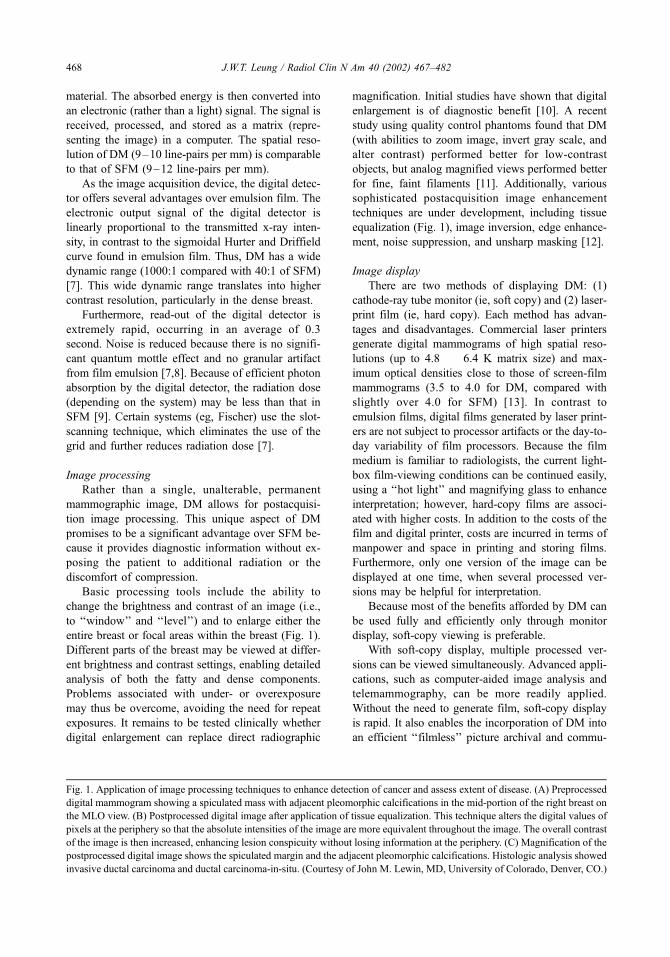
material. The absorbed energy is then converted into
an electronic (rather than a light) signal. The signal is
received, processed, and stored as a matrix (repre-
senting the image) in a computer. The spatial reso-
lution of DM (9–10 line-pairs per mm) is comparable
to that of SFM (9–12 line-pairs per mm).
As the image acquisition device, the digital detec-
tor offers several advantages over emulsion film. The
electronic output signal of the digital detector is
linearly proportional to the transmitted x-ray inten-
sity, in contrast to the sigmoidal Hurter and Driffield
curve found in emulsion film. Thus, DM has a wide
dynamic range (1000:1 compared with 40:1 of SFM)
[7]. This wide dynamic range translates into higher
contrast resolution, particularly in the dense breast.
Furthermore, read-out of the digital detector is
extremely rapid, occurring in an average of 0.3
second. Noise is reduced because there is no signifi-
cant quantum mottle effect and no granular artifact
from film emulsion [7,8]. Because of efficient photon
absorption by the digital detector, the radiation dose
(depending on the system) may be less than that in
SFM [9]. Certain systems (eg, Fischer) use the slot-
scanning technique, which eliminates the use of the
grid and further reduces radiation dose [7].
Image processing
Rather than a single, unalterable, permanent
mammographic image, DM allows for postacquisi-
tion image processing. This unique aspect of DM
promises to be a significant advantage over SFM be-
cause it provides diagnostic information without ex-
posing the patient to additional radiation or the
discomfort of compression.
Basic processing tools include the ability to
change the brightness and contrast of an image (i.e.,
to ‘‘window’’ and ‘‘level’’) and to enlarge either the
entire breast or focal areas within the breast (Fig. 1).
Different parts of the breast may be viewed at differ-
ent brightness and contrast settings, enabling detailed
analysis of both the fatty and dense components.
Problems associated with under- or overexposure
may thus be overcome, avoiding the need for repeat
exposures. It remains to be tested clinically whether
digital enlargement can replace direct radiographic
magnification. Initial studies have shown that digital
enlargement is of diagnostic benefit [10]. A recent
study using quality control phantoms found that DM
(with abilities to zoom image, invert gray scale, and
alter contrast) performed better for low-contrast
objects, but analog magnified views performed better
for fine, faint filaments [11]. Additionally, various
sophisticated postacquisition image enhancement
techniques are under development, including tissue
equalization (Fig. 1), image inversion, edge enhance-
ment, noise suppression, and unsharp masking [12].
Image display
There are two methods of displaying DM: (1)
cathode-ray tube monitor (ie, soft copy) and (2) laser-
print film (ie, hard copy). Each method has advan-
tages and disadvantages. Commercial laser printers
generate digital mammograms of high spatial reso-
lutions (up to 4.8 � 6.4 K matrix size) and max-
imum optical densities close to those of screen-film
mammograms (3.5 to 4.0 for DM, compared with
slightly over 4.0 for SFM) [13]. In contrast to
emulsion films, digital films generated by laser print-
ers are not subject to processor artifacts or the day-to-
day variability of film processors. Because the film
medium is familiar to radiologists, the current light-
box film-viewing conditions can be continued easily,
using a ‘‘hot light’’ and magnifying glass to enhance
interpretation; however, hard-copy films are associ-
ated with higher costs. In addition to the costs of the
film and digital printer, costs are incurred in terms of
manpower and space in printing and storing films.
Furthermore, only one version of the image can be
displayed at one time, when several processed ver-
sions may be helpful for interpretation.
Because most of the benefits afforded by DM can
be used fully and efficiently only through monitor
display, soft-copy viewing is preferable.
With soft-copy display, multiple processed ver-
sions can be viewed simultaneously. Advanced appli-
cations, such as computer-aided image analysis and
telemammography, can be more readily applied.
Without the need to generate film, soft-copy display
is rapid. It also enables the incorporation of DM into
an efficient ‘‘filmless’’ picture archival and commu-
Fig. 1. Application of image processing techniques to enhance detection of cancer and assess extent of disease. (A) Preprocessed
digital mammogram showing a spiculated mass with adjacent pleomorphic calcifications in the mid-portion of the right breast on
the MLO view. (B) Postprocessed digital image after application of tissue equalization. This technique alters the digital values of
pixels at the periphery so that the absolute intensities of the image are more equivalent throughout the image. The overall contrast
of the image is then increased, enhancing lesion conspicuity without losing information at the periphery. (C) Magnification of the
postprocessed digital image shows the spiculated margin and the adjacent pleomorphic calcifications. Histologic analysis showed
invasive ductal carcinoma and ductal carcinoma-in-situ. (Courtesy of John M. Lewin, MD, University of Colorado, Denver, CO.)
J.W.T. Leung / Radiol Clin N Am 40 (2002) 467–482468

nications system (PACS). On the other hand, costly
high-resolution monitors (4 � 5 K pixel) are required
for proper viewing. The soft-copy display worksta-
tion is also less efficient than the current lightbox
film-viewing conditions when comparing multiple
studies [7,13].
J.W.T. Leung / Radiol Clin N Am 40 (2002) 467–482 469
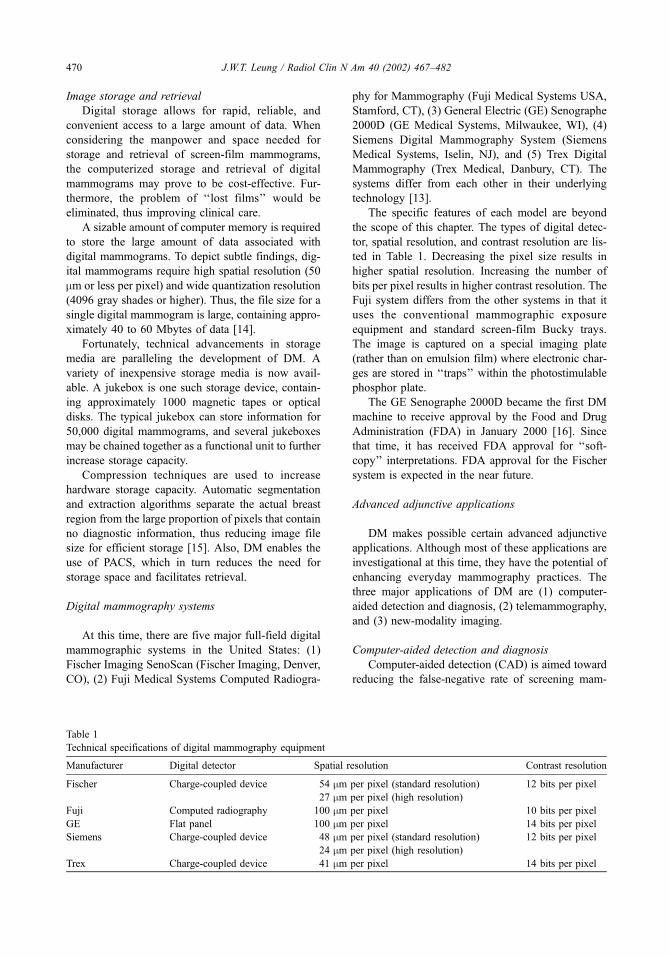
Image storage and retrieval
Digital storage allows for rapid, reliable, and
convenient access to a large amount of data. When
considering the manpower and space needed for
storage and retrieval of screen-film mammograms,
the computerized storage and retrieval of digital
mammograms may prove to be cost-effective. Fur-
thermore, the problem of ‘‘lost films’’ would be
eliminated, thus improving clinical care.
A sizable amount of computer memory is required
to store the large amount of data associated with
digital mammograms. To depict subtle findings, dig-
ital mammograms require high spatial resolution (50
mm or less per pixel) and wide quantization resolution
(4096 gray shades or higher). Thus, the file size for a
single digital mammogram is large, containing appro-
ximately 40 to 60 Mbytes of data [14].
Fortunately, technical advancements in storage
media are paralleling the development of DM. A
variety of inexpensive storage media is now avail-
able. A jukebox is one such storage device, contain-
ing approximately 1000 magnetic tapes or optical
disks. The typical jukebox can store information for
50,000 digital mammograms, and several jukeboxes
may be chained together as a functional unit to further
increase storage capacity.
Compression techniques are used to increase
hardware storage capacity. Automatic segmentation
and extraction algorithms separate the actual breast
region from the large proportion of pixels that contain
no diagnostic information, thus reducing image file
size for efficient storage [15]. Also, DM enables the
use of PACS, which in turn reduces the need for
storage space and facilitates retrieval.
Digital mammography systems
At this time, there are five major full-field digital
mammographic systems in the United States: (1)
Fischer Imaging SenoScan (Fischer Imaging, Denver,
CO), (2) Fuji Medical Systems Computed Radiogra-
phy for Mammography (Fuji Medical Systems USA,
Stamford, CT), (3) General Electric (GE) Senographe
2000D (GE Medical Systems, Milwaukee, WI), (4)
Siemens Digital Mammography System (Siemens
Medical Systems, Iselin, NJ), and (5) Trex Digital
Mammography (Trex Medical, Danbury, CT). The
systems differ from each other in their underlying
technology [13].
The specific features of each model are beyond
the scope of this chapter. The types of digital detec-
tor, spatial resolution, and contrast resolution are lis-
ted in Table 1. Decreasing the pixel size results in
higher spatial resolution. Increasing the number of
bits per pixel results in higher contrast resolution. The
Fuji system differs from the other systems in that it
uses the conventional mammographic exposure
equipment and standard screen-film Bucky trays.
The image is captured on a special imaging plate
(rather than on emulsion film) where electronic char-
ges are stored in ‘‘traps’’ within the photostimulable
phosphor plate.
The GE Senographe 2000D became the first DM
machine to receive approval by the Food and Drug
Administration (FDA) in January 2000 [16]. Since
that time, it has received FDA approval for ‘‘soft-
copy’’ interpretations. FDA approval for the Fischer
system is expected in the near future.
Advanced adjunctive applications
DM makes possible certain advanced adjunctive
applications. Although most of these applications are
investigational at this time, they have the potential of
enhancing everyday mammography practices. The
three major applications of DM are (1) computer-
aided detection and diagnosis, (2) telemammography,
and (3) new-modality imaging.
Computer-aided detection and diagnosis
Computer-aided detection (CAD) is aimed toward
reducing the false-negative rate of screening mam-
Table 1
Technical specifications of digital mammography equipment
Manufacturer Digital detector Spatial resolution Contrast resolution
Fischer Charge-coupled device 54 mm per pixel (standard resolution) 12 bits per pixel
27 mm per pixel (high resolution)
Fuji Computed radiography 100 mm per pixel 10 bits per pixel
GE Flat panel 100 mm per pixel 14 bits per pixel
Siemens Charge-coupled device 48 mm per pixel (standard resolution) 12 bits per pixel
24 mm per pixel (high resolution)
Trex Charge-coupled device 41 mm per pixel 14 bits per pixel
J.W.T. Leung / Radiol Clin N Am 40 (2002) 467–482470

mography by marking the perceived ‘‘abnormal’’
areas and directing the interpreting radiologist to re-
review these areas [17]. Image analysis algorithms
are used to search for suspicious findings. The areas
that lie above some probability threshold are relayed
to the radiologist. Typically, the radiologist would
interpret the mammograms in the standard fashion,
followed by re-examination of the areas indicated by
the CAD device. CAD is not designed to replace the
radiologist. Rather, it is intended to aid the radiologist
in avoiding the ‘‘misses’’ associated with inattention
or fatigue when viewing a large number of mammo-
graphic studies.
Several groups using prototype machines have
shown improved radiologist performance when CAD
is applied to digitized screen-film mammograms [18–
20], and Congress recently approved $15 incremental
Medicare reimbursement for the use of CAD in screen-
ing mammograms. At this time, CAD is best for de-
tecting clustered calcifications and spiculated masses
and is less good for poorly defined masses and asym-
metric densities.
ImageChecker M1000 is the only FDA-approved
CAD device (R2 Technology, Los Altos, CA) cur-
rently. In June 1998, it received FDA approval for
screen-film mammograms that are subsequently digi-
tized but not yet for direct digital mammograms.
Another CAD device, Mammex TR (Scanis, Inc,
Foster City, CA), is currently under consideration
for FDA approval. GE Medical Systems has licensed
the R2 software for exclusive use in its FDA-
approved digital units. Fischer and Trex are similarly
working with other CAD companies, and Fuji is
currently testing its own CAD product [13].
A blinded, retrospective study of 427 cancers
found a false-negative rate of 21% in screening
mammography and concluded that CAD (using Im-
ageChecker M1000) could have potentially reduced
this rate by 77% without increasing the recall rate
[21]. In a separate study using a similar cohort, CAD
retrospectively marked 88 of 115 cancers that were
not identified by the interpreting radiologist [22]. The
only prospective data available at this time was pre-
sented at the 2000 meeting of the Radiologic Society
of North America. In this study, CAD was prospec-
tively applied to 12,860 screening mammograms,
and CAD increased the cancer detection rate by
20% (from 41 cancers to 49 cancers) [23]. This was
achieved with only a slight increase in recall rate from
6.5% to 7.7%.
The recent data suggest that CAD is a promising
technique. It would be most beneficial in small rural
practices where there are few radiologists and where
the radiologist is less subspecialized. Nevertheless,
its cost-effectiveness remains to be tested. It also
needs to be compared with second reading by
another radiologist and by the same radiologist at a
different sitting.
Computer-aided diagnosis goes beyond detection
in that the computer employs algorithms to classify
breast lesions as benign or malignant [24]. It aims to
reduce not only the false-negative but also the false-
positive rate of screening mammography, thereby
reducing the number of biopsies performed of benign
lesions. The classification schemes used in computer-
aided diagnosis require greater spatial resolution than
do the detection schemes in computer-aided detection
[25]. Artificial intelligence techniques are used,
including discriminant analysis methods, expert rule-
based systems, and artificial neural networks [26]. At
this time, there is no commercially available com-
puter-aided diagnosis device, and computer-aided
diagnosis has not been shown to improve the diag-
nostic accuracy of an experienced mammographer.
Telemammography
Telemammography refers to the rapid transmis-
sion of high-quality mammographic images in dig-
ital format from one site to another. As breast
imaging becomes more subspecialized, telemam-
mography offers the potential of expert interpreta-
tions and consultation, much of which can be
performed under near real-time circumstances. Tele-
mammography can be used to enhance the perform-
ance of mobile mammography units by eliminating
the need to transport films and by allowing the off-
site radiologist to monitor image quality and direct
the technologist in obtaining additional views. It
also plays a potentially important role in the daily
clinical work of a multi-site practice and in multi-
site conferencing.
Because mammography requires very high reso-
lution, the technical aspects of telemammography are
particularly challenging. For the large amount of data
to be transmitted in a reasonable amount of time,
special compression techniques are used. Automatic
extraction techniques are being developed so that
image file sizes can be reduced to contain only
information from the breast region for efficient trans-
mission [15]. Patient privacy during data transmission
must be protected vigilantly. Furthermore, convenient
mechanisms for image retrieval, image viewing, and
remote consultation are needed.
At the University of California, San Francisco,
Sickles and colleagues are conducting two ongoing
studies on the technical feasibility and clinical ef-
fectiveness of two specific aspects of telemammogra-
phy: (1) telemanagement—comparing the diagnostic
J.W.T. Leung / Radiol Clin N Am 40 (2002) 467–482 471

accuracy of an expert breast imager at a remote site
with that of the on-site general radiologist, and (2)
teleconsultation—measuring the additional clinical
utility of real-time consultation with an off-site expert
breast imager [27]. Preliminary data indicate that tele-
mammography is time efficient: 300 seconds are
required for conventional screen-film mammograms
to be displayed on-site, compared with 120 seconds for
digital mammograms to be viewed at a remote location
across the city of San Francisco (E.A. Sickles, personal
communication, 2001).
New-modality imaging
Digital imaging allows multiple images to be
shifted electronically, combined into three-dimen-
sional views, and subtracted from one another. Areas
of active research include tomosynthesis, stereomam-
mography, dual-energy subtraction mammography,
and contrast-medium mammography. Tomosynthesis
refers to the acquisition of low-dose mammographic
images as the radiation source moves in an arc above
the stationary breast and digital detector in a ‘‘step-
and-expose’’ fashion [28]. The planes above and
below the lesion are blurred to increase the conspi-
cuity of the lesion, similar to the use of conventional
tomography, but without the associated time and
radiation exposure.
In stereomammography, two images are obtained
at slightly different angles, usually 2 to 5 degrees
apart. They are then fused together on soft-copy
display, allowing the reader to perceive the relative
depths of structures within the image. This technique
may be useful in reducing obscuration by super-
imposed structures.
Dual-energy subtraction mammography refers to
the acquisition of two images in which the effective
energy of the detected radiation differs [29]. The
lower-exposure image is typically obtained at 20 to
30 kVp, and the higher-exposure image at 40 to 80
kVp. Alternatively, dual-energy subtraction mam-
mography may be performed by means of a single
exposure using two stacked detectors, with one detec-
tor preferentially absorbing the low-energy photons
and the other detector absorbing the high-energy
photons. This technique may be used to remove
undesirable masking contrast while preserving the
contrast of the relevant structures, such as calcifica-
tions within a dense breast [7].
Contrast-enhancement mammography is based on
the theory that new and abnormal vessels (ie, an-
giogenesis) occur in breast cancers. Two images of
the same view are obtained before and after the
administration of intravenous contrast. DM enables
subtraction of the non-enhanced image from the
contrast-enhanced image, similar to the performance
of contrast-enhanced MRI. The spatial resolution in
DM is higher than that in MRI, potentially detecting
very small cancers. This tool may also be useful in
assessing extent of disease, particularly in patients
with dense breasts or an infiltrative process such as
invasive lobular carcinoma [13].
Clinical trials
To date, there have been two major clinical trials
funded by nonindustrial sources. The International
Digital Mammography Development Group Digital
Mammography Pilot Study consists of 210 women
from the diagnostic population who were imaged in
eight centers using the Fischer, GE, and Trex digital
mammographic units. This pilot study is the basis of a
larger clinical trial in which 1075 women from the
diagnostic cohort will be enrolled at six centers [13].
The Colorado/Massachusetts Full-Field Digital Mam-
mography Screening Trial is the first and only pub-
lished study comparing the performance of DM and
SFM in the screening population. It aims to enroll
15,000 asymptomatic patients from a screening pop-
ulation at two sites (University of Colorado and
University of Massachusetts), using only a single
system (GE Senographe 2000 D).
Initial results from the Colorado/Massachusetts
Full-Field Digital Mammography Screening Trial
were published in March 2001. Lewin et al [30]
prospectively imaged 3890 asymptomatic women,
each of whom underwent both SFM and DM, for a
total of 4945 paired (SFM and DM) mammographic
exams. The study was designed to minimize both
entry and verification bias. Because the patients
originated from the screening population, entry into
the study was not predicated on having an abnormal
screen-film mammogram. Because recall exams and
biopsy recommendations were based on findings at
either SFM or DM, preferential verification of SFM
(versus DM) findings did not occur.
In this study, DM was equal to SFM in cancer
detection (60% for DM and 63% for SFM). DM had
a statistically significant lower recall rate (11.5%)
than SFM (13.8%). This improvement in recall rate
may have been related to the ability to manipulate
images on soft-copy display. The positive predictive
value of mammographic screening was similar
between the two studies: 3.7% for DM and 3.2%
for SFM. The positive biopsy yield was higher for
DM (30%) than for SFM (19%), but this difference
was not statistically significant. Interestingly, most
(19/31) cancers were identified on one modality only
(Figs. 2, 3). In other words, cancer detection was
J.W.T. Leung / Radiol Clin N Am 40 (2002) 467–482472

increased when DM was performed in addition to,
but not in place of, SFM. SFM detected 4.5 cancers
per 1000 women. This rate increased to 6.3 cancers
per 1000 women when DM was performed in addi-
tion to SFM. The primary cause of discordance
between DM and SFM appeared to be visibility
differences, most commonly caused by fortuitous
positioning [31], and not related to technical differ-
ences underlying the two modalities. Because the
number of cancers in a screening population is
inherently small, a large study cohort is required
for statistically significant results. Thus, the Colo-
rado/Massachusetts Full-Field Digital Mammography
Screening Trial is continuing with patient accrual,
and a third site has been added.
In a recent study of interpretation differences
between DM and SFM, Venta et al [32] found only
a 4% difference in interpretation that affected manage-
ment. The most common cause of interpretation
variation was difference in management approach
Fig. 2. Invasive ductal carcinoma prospectively identified on digital mammogram only. (A) Digital mammogram showing
spiculated mass in the midposterior right breast. (B) Magnified view of the digital mammogram showing the spiculated margin to
greater detail. (C) Corresponding screen-film mammogram shows a poorly defined density in the same location that was not
identified prospectively (perhaps due to a slight projection difference). (D) On the magnified view of the screen-film
mammogram, the density remains difficult to visualize. (Courtesy of John M. Lewin, MD, University of Colorado, Denver, CO.)
J.W.T. Leung / Radiol Clin N Am 40 (2002) 467–482 473
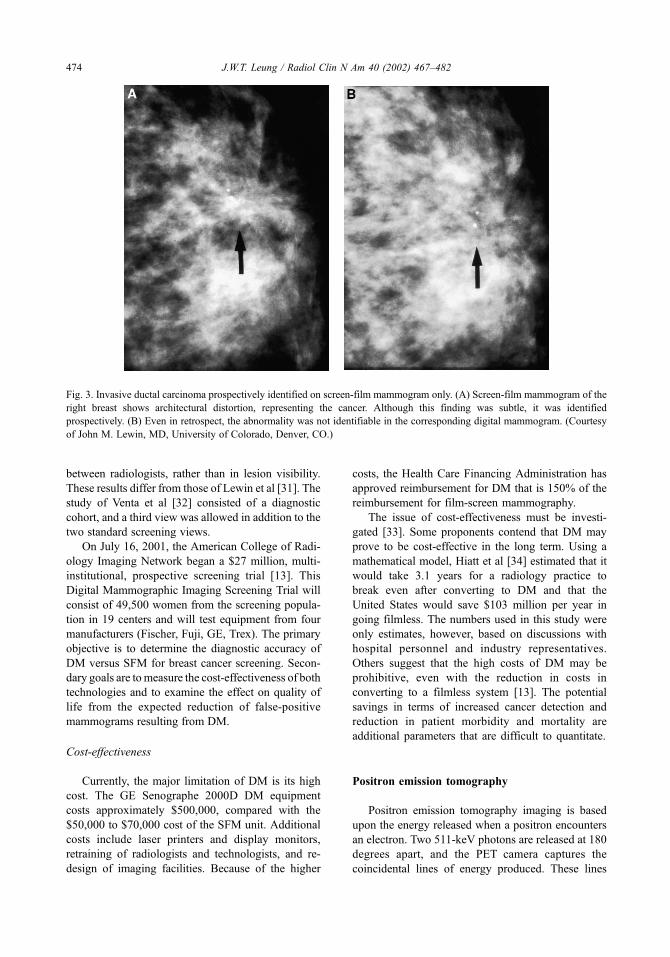
between radiologists, rather than in lesion visibility.
These results differ from those of Lewin et al [31]. The
study of Venta et al [32] consisted of a diagnostic
cohort, and a third view was allowed in addition to the
two standard screening views.
On July 16, 2001, the American College of Radi-
ology Imaging Network began a $27 million, multi-
institutional, prospective screening trial [13]. This
Digital Mammographic Imaging Screening Trial will
consist of 49,500 women from the screening popula-
tion in 19 centers and will test equipment from four
manufacturers (Fischer, Fuji, GE, Trex). The primary
objective is to determine the diagnostic accuracy of
DM versus SFM for breast cancer screening. Secon-
dary goals are tomeasure the cost-effectiveness of both
technologies and to examine the effect on quality of
life from the expected reduction of false-positive
mammograms resulting from DM.
Cost-effectiveness
Currently, the major limitation of DM is its high
cost. The GE Senographe 2000D DM equipment
costs approximately $500,000, compared with the
$50,000 to $70,000 cost of the SFM unit. Additional
costs include laser printers and display monitors,
retraining of radiologists and technologists, and re-
design of imaging facilities. Because of the higher
costs, the Health Care Financing Administration has
approved reimbursement for DM that is 150% of the
reimbursement for film-screen mammography.
The issue of cost-effectiveness must be investi-
gated [33]. Some proponents contend that DM may
prove to be cost-effective in the long term. Using a
mathematical model, Hiatt et al [34] estimated that it
would take 3.1 years for a radiology practice to
break even after converting to DM and that the
United States would save $103 million per year in
going filmless. The numbers used in this study were
only estimates, however, based on discussions with
hospital personnel and industry representatives.
Others suggest that the high costs of DM may be
prohibitive, even with the reduction in costs in
converting to a filmless system [13]. The potential
savings in terms of increased cancer detection and
reduction in patient morbidity and mortality are
additional parameters that are difficult to quantitate.
Positron emission tomography
Positron emission tomography imaging is based
upon the energy released when a positron encounters
an electron. Two 511-keV photons are released at 180
degrees apart, and the PET camera captures the
coincidental lines of energy produced. These lines
Fig. 3. Invasive ductal carcinoma prospectively identified on screen-film mammogram only. (A) Screen-film mammogram of the
right breast shows architectural distortion, representing the cancer. Although this finding was subtle, it was identified
prospectively. (B) Even in retrospect, the abnormality was not identifiable in the corresponding digital mammogram. (Courtesy
of John M. Lewin, MD, University of Colorado, Denver, CO.)
J.W.T. Leung / Radiol Clin N Am 40 (2002) 467–482474
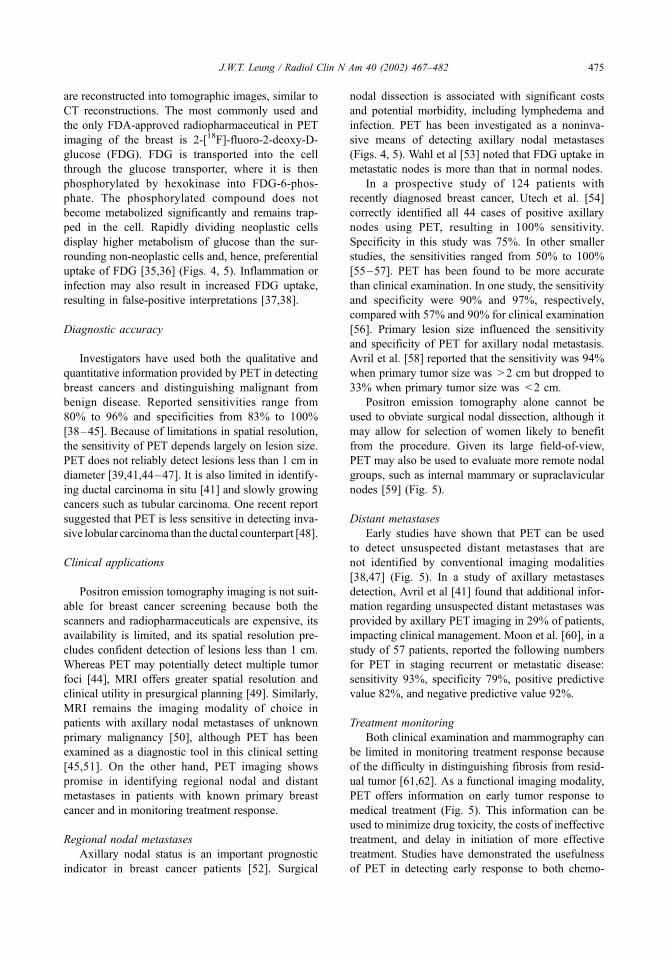
are reconstructed into tomographic images, similar to
CT reconstructions. The most commonly used and
the only FDA-approved radiopharmaceutical in PET
imaging of the breast is 2-[18F]-fluoro-2-deoxy-D-
glucose (FDG). FDG is transported into the cell
through the glucose transporter, where it is then
phosphorylated by hexokinase into FDG-6-phos-
phate. The phosphorylated compound does not
become metabolized significantly and remains trap-
ped in the cell. Rapidly dividing neoplastic cells
display higher metabolism of glucose than the sur-
rounding non-neoplastic cells and, hence, preferential
uptake of FDG [35,36] (Figs. 4, 5). Inflammation or
infection may also result in increased FDG uptake,
resulting in false-positive interpretations [37,38].
Diagnostic accuracy
Investigators have used both the qualitative and
quantitative information provided by PET in detecting
breast cancers and distinguishing malignant from
benign disease. Reported sensitivities range from
80% to 96% and specificities from 83% to 100%
[38–45]. Because of limitations in spatial resolution,
the sensitivity of PET depends largely on lesion size.
PET does not reliably detect lesions less than 1 cm in
diameter [39,41,44–47]. It is also limited in identify-
ing ductal carcinoma in situ [41] and slowly growing
cancers such as tubular carcinoma. One recent report
suggested that PET is less sensitive in detecting inva-
sive lobular carcinoma than the ductal counterpart [48].
Clinical applications
Positron emission tomography imaging is not suit-
able for breast cancer screening because both the
scanners and radiopharmaceuticals are expensive, its
availability is limited, and its spatial resolution pre-
cludes confident detection of lesions less than 1 cm.
Whereas PET may potentially detect multiple tumor
foci [44], MRI offers greater spatial resolution and
clinical utility in presurgical planning [49]. Similarly,
MRI remains the imaging modality of choice in
patients with axillary nodal metastases of unknown
primary malignancy [50], although PET has been
examined as a diagnostic tool in this clinical setting
[45,51]. On the other hand, PET imaging shows
promise in identifying regional nodal and distant
metastases in patients with known primary breast
cancer and in monitoring treatment response.
Regional nodal metastases
Axillary nodal status is an important prognostic
indicator in breast cancer patients [52]. Surgical
nodal dissection is associated with significant costs
and potential morbidity, including lymphedema and
infection. PET has been investigated as a noninva-
sive means of detecting axillary nodal metastases
(Figs. 4, 5). Wahl et al [53] noted that FDG uptake in
metastatic nodes is more than that in normal nodes.
In a prospective study of 124 patients with
recently diagnosed breast cancer, Utech et al. [54]
correctly identified all 44 cases of positive axillary
nodes using PET, resulting in 100% sensitivity.
Specificity in this study was 75%. In other smaller
studies, the sensitivities ranged from 50% to 100%
[55–57]. PET has been found to be more accurate
than clinical examination. In one study, the sensitivity
and specificity were 90% and 97%, respectively,
compared with 57% and 90% for clinical examination
[56]. Primary lesion size influenced the sensitivity
and specificity of PET for axillary nodal metastasis.
Avril et al. [58] reported that the sensitivity was 94%
when primary tumor size was > 2 cm but dropped to
33% when primary tumor size was < 2 cm.
Positron emission tomography alone cannot be
used to obviate surgical nodal dissection, although it
may allow for selection of women likely to benefit
from the procedure. Given its large field-of-view,
PET may also be used to evaluate more remote nodal
groups, such as internal mammary or supraclavicular
nodes [59] (Fig. 5).
Distant metastases
Early studies have shown that PET can be used
to detect unsuspected distant metastases that are
not identified by conventional imaging modalities
[38,47] (Fig. 5). In a study of axillary metastases
detection, Avril et al [41] found that additional infor-
mation regarding unsuspected distant metastases was
provided by axillary PET imaging in 29% of patients,
impacting clinical management. Moon et al. [60], in a
study of 57 patients, reported the following numbers
for PET in staging recurrent or metastatic disease:
sensitivity 93%, specificity 79%, positive predictive
value 82%, and negative predictive value 92%.
Treatment monitoring
Both clinical examination and mammography can
be limited in monitoring treatment response because
of the difficulty in distinguishing fibrosis from resid-
ual tumor [61,62]. As a functional imaging modality,
PET offers information on early tumor response to
medical treatment (Fig. 5). This information can be
used to minimize drug toxicity, the costs of ineffective
treatment, and delay in initiation of more effective
treatment. Studies have demonstrated the usefulness
of PET in detecting early response to both chemo-
J.W.T. Leung / Radiol Clin N Am 40 (2002) 467–482 475

Fig. 4. PET imaging of an invasive ductal carcinomawith bilobed morphology, correlating with the mammographic and ultrasound
findings. (A) A 2-cm bilobed mass was identified in the left upper breast on the MLO view, corresponding to a palpable lump. (B)
Sonography demonstrated a hypoechoic solid mass with similar morphology. (C) Coronal whole-body PET projection view shows
a corresponding bilobed focus of increased uptake (closed arrow) and a focus of increased uptake in left axilla (open arrow). Four of
23 axillary nodes were found to be positive for metastases at surgery. (D) Selected sagittal PET image shows the bilobed breast mass
(closed arrow) and the axillary nodal pathology (open arrow). (E) Selected axial PET image also depicts the morphology of this
bilobed cancer (arrow). (Courtesy of Annick D. Van den Abbeele, MD, Dana-Farber Cancer Institute, Boston, MA.)
J.W.T. Leung / Radiol Clin N Am 40 (2002) 467–482476
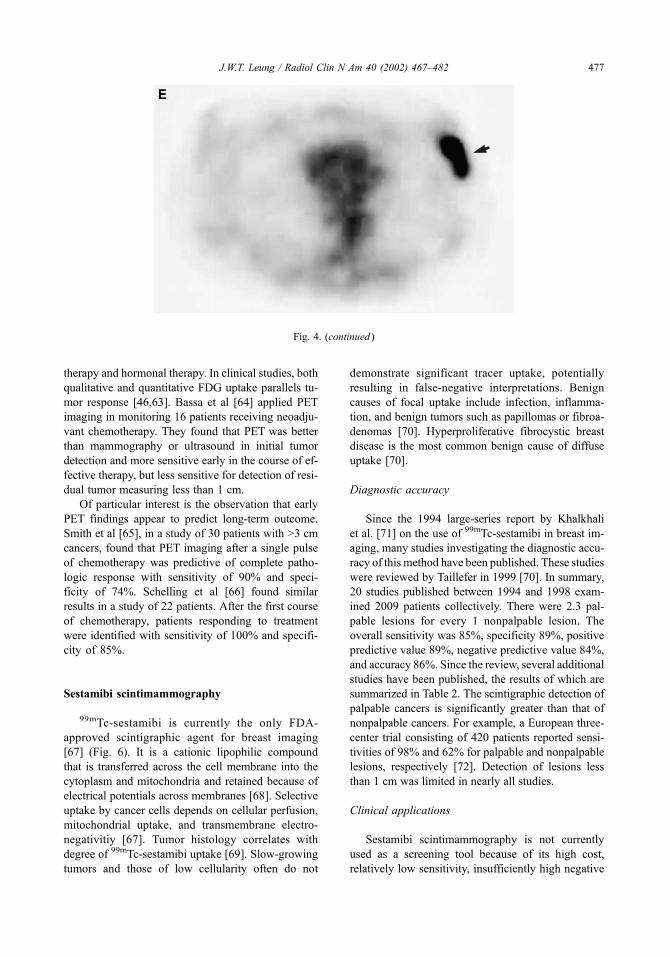
therapy and hormonal therapy. In clinical studies, both
qualitative and quantitative FDG uptake parallels tu-
mor response [46,63]. Bassa et al [64] applied PET
imaging in monitoring 16 patients receiving neoadju-
vant chemotherapy. They found that PET was better
than mammography or ultrasound in initial tumor
detection and more sensitive early in the course of ef-
fective therapy, but less sensitive for detection of resi-
dual tumor measuring less than 1 cm.
Of particular interest is the observation that early
PET findings appear to predict long-term outcome.
Smith et al [65], in a study of 30 patients with >3 cm
cancers, found that PET imaging after a single pulse
of chemotherapy was predictive of complete patho-
logic response with sensitivity of 90% and speci-
ficity of 74%. Schelling et al [66] found similar
results in a study of 22 patients. After the first course
of chemotherapy, patients responding to treatment
were identified with sensitivity of 100% and specifi-
city of 85%.
Sestamibi scintimammography
99mTc-sestamibi is currently the only FDA-
approved scintigraphic agent for breast imaging
[67] (Fig. 6). It is a cationic lipophilic compound
that is transferred across the cell membrane into the
cytoplasm and mitochondria and retained because of
electrical potentials across membranes [68]. Selective
uptake by cancer cells depends on cellular perfusion,
mitochondrial uptake, and transmembrane electro-
negativitiy [67]. Tumor histology correlates with
degree of 99mTc-sestamibi uptake [69]. Slow-growing
tumors and those of low cellularity often do not
demonstrate significant tracer uptake, potentially
resulting in false-negative interpretations. Benign
causes of focal uptake include infection, inflamma-
tion, and benign tumors such as papillomas or fibroa-
denomas [70]. Hyperproliferative fibrocystic breast
disease is the most common benign cause of diffuse
uptake [70].
Diagnostic accuracy
Since the 1994 large-series report by Khalkhali
et al. [71] on the use of 99mTc-sestamibi in breast im-
aging, many studies investigating the diagnostic accu-
racy of this method have been published. These studies
were reviewed by Taillefer in 1999 [70]. In summary,
20 studies published between 1994 and 1998 exam-
ined 2009 patients collectively. There were 2.3 pal-
pable lesions for every 1 nonpalpable lesion. The
overall sensitivity was 85%, specificity 89%, positive
predictive value 89%, negative predictive value 84%,
and accuracy 86%. Since the review, several additional
studies have been published, the results of which are
summarized in Table 2. The scintigraphic detection of
palpable cancers is significantly greater than that of
nonpalpable cancers. For example, a European three-
center trial consisting of 420 patients reported sensi-
tivities of 98% and 62% for palpable and nonpalpable
lesions, respectively [72]. Detection of lesions less
than 1 cm was limited in nearly all studies.
Clinical applications
Sestamibi scintimammography is not currently
used as a screening tool because of its high cost,
relatively low sensitivity, insufficiently high negative
Fig. 4. (continued )
J.W.T. Leung / Radiol Clin N Am 40 (2002) 467–482 477

predictive value, and limited ability to detect lesions
less than 1 cm. There is no published report eval-
uating its use in breast cancer screening [73]. Inves-
tigators have examined the utility of sestamibi
scintimammography as an adjunct to conventional
imaging modalities in obviating benign biopsies and
in detecting axillary nodal metastases and monitor-
ing treatment.
Several studies have shown that sestamibi scinti-
mammography is more specific than mammography,
ultrasound, or MRI, particularly for the palpable mass
[74–78]. However, the negative predictive value re-
mains insufficiently high to replace biopsy. In particu-
lar, it is unlikely that sestamibi scintimammography
can assume the role of percutaneous large-core needle
biopsy, which is of high accuracy and low morbidity.
Sestamibi scintimammography can also detect
axillary nodal metastases in patients with primary
breast cancer (Fig. 6). Taillefer reviewed reports
published between 1994 and 1998 on its diagnostic
performance [70]. In a total of 350 patients, the
cumulative sensitivity of the test was 77%, specificity
89%, positive predictive value 86%, and negative
predictive value 84%. In a separate report of 31
patients, the sensitivity of sestamibi scintimammog-
raphy was 75%, specificity 82%, positive predictive
value 88%, and negative predictive value 64% [79].
In a recent report of 38 patients, both the sensitivity
Fig. 5. Coronal whole-body positron emission tomography (PET) projection views demonstrating the utility of PET in
monitoring patient response to treatment and in assessing metastatic disease. (A) Pretreatment image demonstrates multiple areas
of nodular uptake in the right breast centrally representing the primary cancer. Additionally, increased uptake is identified in the
right axilla, the supraclavicular regions bilaterally, and the right internal mammary chain, representing nodal metastases. Bony
metastases are identified as foci of increased uptake in T9, L3, L4, and the left acetabulum. (B) After chemotherapy and stem-cell
transplantation, there is significant interval resolution of disease in right breast, with minimal residual uptake. The abnormal foci
of uptake in the lymph nodes and bones have resolved. Note the normal distribution of radioactivity within the heart, kidneys,
and bladder. (Courtesy of Annick D. Van den Abbeele, MD, Dana-Farber Cancer Institute, Boston, MA.)
J.W.T. Leung / Radiol Clin N Am 40 (2002) 467–482478

and specificity of MIBI-SPECT for axillary nodal
metastases were poor [57], likely reflecting the small
size ( < 1 cm) of the primary lesions and the lack of
prone imaging in the study. No correlation has been
found between the number of nodes demonstrating
scintigraphic uptake and the number of positive
nodes at pathologic examination [80]. Overall, the
negative predictive value is not sufficiently high for
sestamibi scintimammography to replace surgical
nodal dissection.
Similar to PET, sestamibi scintimammography is a
functional imaging test and may be used to monitor
tumor response to treatment. Maini et al [81] studied
20 patients with locally advanced breast carcinoma
who underwent sestamibi scintimammography before
and after three cycles of neoadjuvant chemotherapy.
The test showed sensitivity of 65% for the presence
of tumor and specificity of 100% for the absence of
tumor. These results were superior to clinical exami-
nation alone. Scintimammography performed the
same as mammography in patients without response
but better than mammography in patients with pos-
itive response.
Summary
Digital mammography, PET, and sestamibi scinti-
mammography are three new modalities in breast
imaging. DM has advantages over film-screen mam-
mography in image storage, retrieval, and processing
and may lower the recall rate. Computer-aided detec-
tion may increase the sensitivity of mammographic
screening without a substantial reduction in specific-
ity. Whereas PET and sestambi scintimammography
are not useful in breast cancer screening, PET may
play a role in detecting nodal metastases and mon-
itoring treatment response, and sestamibi scintimam-
mography in selected cases may serve as an adjunct
to conventional imaging. The cost-effectiveness of
these new modalities remains to be evaluated, but all
Fig. 6. Sestamibi scintimammogram (left and right lateral projections) acquired on a standard gamma camera system in planar
format. Foci of increased uptake are identified in the left mid-breast (corresponding to a 3-cm palpable mass) and in the left
axilla. Surgery revealed stage 3 invasive ductal carcinoma, with 4 of 12 axillary nodes positive for metastases. (Courtesy of Iraj
Khalkhali, MD, Harbor-UCLA Medical Center, Torrance, CA.)
Table 2
Diagnostic accuracy of sestamibi scintimammography
Study/year
(reference)
Patients
(n)
Sensitivity
(%)
Specificity
(%)
PPV
(%)
NPV
(%)
Taillerfer/
1998 [70]
2009 85 89 89 84
Flanagan/
1998 [82]
79 81 81 61 92
Cwikla/
1998 [83]
70 89 52 84 67
Prats/
1999 [84]
90 85 79 74 88
Buscombe/
2001 [85]
353 89 71 79 84
Abbreviations: PPV, positive predictive value; NPV, neg-
ative predictive value.
J.W.T. Leung / Radiol Clin N Am 40 (2002) 467–482 479
have the potential to significantly advance the diag-
nosis and management of women with breast cancer.
Acknowledgments
The author is indebted to Drs. John M. Lewin
(University of Colorado, Denver, CO) and Annick D.
Van den Abbeele (Dana-Farber Cancer Institute,
Boston, MA) for contributing their expertise and
clinical images to this article. The author also thanks
Dr. Alan S.L. Yu (Brigham and Women’s Hospital,
Boston, MA) for his critical reading during manu-
script preparation.
References
[1] Hendrick RE, Smith RA, Rutledge JH 3rd, Smart CR.
Benefit of screening mammography in women ages
40–49: a new meta-analysis of randomized controlled
trials. J Natl Cancer Inst Monogr 1997;22:87–92.
[2] Nystrom L, Rutqvist LE, Wall S, Lindgren A, Lindqvist
M, Ryden S, et al. Breast cancer screening with mam-
mography: overview of Swedish randomized trials.
Lancet 1993;342:973–8.
[3] Burrell HC, Sibbering DM, Wilson AR, Pinder SE,
Evans AJ, Yeoman LJ, et al. Screening interval breast
cancers: mammographic features and prognosis fac-
tors. Radiology 1996;199:811–7.
[4] Hollingsworth AB, Taylor LD, Rhodes DC. Establish-
ing a histologic basis for false-negative mammograms.
Am J Surg 1993;166:643–7.
[5] Burrell HC, Pinder SE, Wilson AR, Evans AJ, Yeoman
LJ, Elston CW, et al. The positive predictive value of
mammographic signs: a review of 425 nonpalpable
breast lesions. Clin Radiol 1996;51:277–81.
[6] Lidbrink E, Elfving J, Frisell J, Jonsson E. Neglected
aspects of false positive findings of mammography in
breast cancer screening: analysis of false positive cases
from the Stockholm trial. BMJ 1996;312:273–6.
[7] Feig SA, Yaffe MJ. Current status of digital mammog-
raphy. Semin Ultrasound CT MR 1996;17:424–43.
[8] Pisano ED, Yaffe MJ. Digital mammography. Breast
Dis 1998;10:127–36.
[9] Cowen AR, Parkin GJS, Hawkridge P. Direct digital
mammography image acquisition. Eur J Radiol 1997;
7:918–30.
[10] Newstead GM, Josein M, Gelfand CA, et al. Compar-
ison of analog and digital spot magnified mammogra-
phy. In: Karssemeijer N, Thijssen M, Hendriks J,
Erning LV, editors. Proceedings on the 4th Internation-
al Workshop on Digital Mammography. Dordrecht,
NL: Kluwer Academic Publishers; 1998. p. 423–6.
[11] Undrill PE, O’Kane AD, Gilbert FJ. A comparison of
digital and screen-film mammography using quality
control phantoms. Clin Radiol 2000;55:782–90.
[12] Pisano ED, Cole EB, Hemminger BM, Yaffe MJ, Ayl-
ward SR, Maidment AD, et al. Image processing algo-
rithms for digital mammography: a pictorial essay.
Radiographics 2000;20:1479–91.
[13] Pisano ED, Yaffe MJ, Hemminger BM, Hendrick RE,
Niklason LT, Maidment AD, et al. Current status of
full-field digital mammography. Acad Radiol 2000;7:
266–80.
[14] Williams MB, Pisano ED, Schnall MD, Fajardo LL.
Future directions in imaging of breast diseases. Radiol-
ogy 1998;206:297–300.
[15] Lou SL, Lin HD, Lin KP, Hoogstrate D. Automatic
breast region extraction from digital mammograms
for PACS and telemammography applications. Comput
Med Imaging Graph 2000;24:205–20.
[16] White J. FDA approves system for digital mammog-
raphy. J Natl Cancer Inst 2000;92:442.
[17] Roehrig J, Castellino RA. The promise of computer
aided detection in digital mammography. Eur J Radiol
1997;31:35–9.
[18] Chan HP, Doi K, Vyborny CJ, Schmidt RA, Metz CE,
Lam KL, et al. Improvement in radiologists’ detection
of clustered microcalcifications on mammograms: the
potential of computer-aided diagnosis. Invest Radiol
1990;25:1102–10.
[19] Jiang Y, Nishikawa RM, Schmidt RA, Metz CE, Giger
ML, Doi K. Improving breast cancer diagnosis with
computer-aided diagnosis. Acad Radiol 1999;6:22–33.
[20] Kegelmeyer WP, Pruneda JM, Bourland PD, Hillis A,
Riggs MW, Nipper ML. Computer-aided mammo-
graphic screening for spiculated lesions. Radiology
1994;191:331–7.
[21] Warren Burhenne LJ, Wood SA, D’Orsi CJ, Feig SA,
Kopans DB, O’Shaughnessy KF, et al. Potential con-
tribution of computer-aided detection to the sensitivity
of screening mammography. Radiology 2000;215:
554–62.
[22] Birdwell RL, Ikeda DM, O’Shaughnessy KF, Sickles
EA. Mammographic characteristics of 115 missed can-
cers later detected with screening mammography and
the potential utility of computer-aided detection. Radi-
ology 2001;219:192–202.
[23] Freer TW, Ulissey MJ. Computer-aided detection
(CAD) in screening mammography: a prospective
study of 12,860 patients in a community breast center.
Radiology 2000;217:400.
[24] Nawano S, Murakami K, Moriyama N, Kobatake H,
Takeo H, Shimura K. Computer-aided diagnosis in
full digital mammography. Invest Radiol 1999;34:
310–6.
[25] Adler DD, Wahl RL. New methods for imaging the
breast: techniques, findings, and potential. AJR 1995;
164:19–30.
[26] te Brake GM, Karssemeijer N, Hendriks JH. An auto-
matic method to discriminate malignant masses from
tissue in digital mammograms. Phys Med Biol 2000;
45:2843–57.
[27] Lou SL, Sickles EA, Huang HK, Hoogstrate D, Cao F,
Wang J, et al. Full-field direct digital mammograms:
J.W.T. Leung / Radiol Clin N Am 40 (2002) 467–482480
technical components, study protocols, and prelimi-
nary results. IEEE Trans Inform Tech Biomed 1997;
1:270–8.
[28] Niklason LT, Christian BT, Niklason LE, Kopans DB,
CastleberryDE,Opsahl-OngBH, et al. Digital tomosyn-
thesis in breast imaging. Radiology 1997;205:399–406.
[29] Boone JM, Tecotzky MT, Alexander GM. A binary
screen detector system for single pulse, dual energy
radiography. Radiology 1992;183:863–70.
[30] Lewin JM, Hendrick RE, D’Orsi CJ, Isaacs PK, Moss
LJ, Karellas A, et al. Comparison of full-field digital
mammography with screen-film mammography for
cancer detection: results of 4,945 paired examinations.
Radiology 2001;218:873–80.
[31] Lewin JM, D’Orsi CJ, Issacs P, Moss LJ, Hendrick
RE. Causes of differences between full-field digital
mammography and screen-film mammography inter-
pretations in the Colorado/Massachusetts full-field
digital mammography screening trial. Radiology
2000;217(P):199.
[32] Venta LA, Hendrick RE, Adler YT, DeLeon P, Mengoni
PM, Scharl AM, et al. Rates and causes of disagreement
in interpretation of full-field digital mammography and
film-screen mammography in a diagnostic setting. AJR
2001;176:1241–8.
[33] Nields MW, Galaty Jr RR. Digital mammography: a
model for assessing cost effectiveness. Acad Radiol
1998;5(Suppl 2):S310–3.
[34] Hiatt MD, Carr JJ, Manning RL. The length of time
necessary to break even after converting to digital
mammography. J Telemed Telecare 2000;6:222–4.
[35] Brown RS, Leung JY, Fisher SJ, Frey KA, Ethier SP,
Wahl RL. Intratumoral distribution of tritiated-FDG in
breast carcinoma: correlation between GLUT-1 expres-
sion and FDG uptake. J Nucl Med 1996;37:1042–7.
[36] Higashi K, Clavo AC, Wahl RL. Does FDG uptake
measure proliferative activity of human cancer cells?
In vitro comparison with DNA flow cytometry and tri-
tiated thymidine uptake. J Nucl Med 1993;34:414–9.
[37] Bakheet SMB, Powe J, Kandil A, Essat A, Rostom A,
Amartey J. F-18 FDG uptake in breast infection and
inflammation. Clin Nucl Med 2000;25:100–3.
[38] Hoh CK, Hawkins RA, Glaspy JA, Dahlbom M, Tse
NY, Hoffman EJ, et al. Cancer detection with whole-
body PET using [18F]fluoro-2-deoxy-D-glucose. J
Comput Assist Tomogr 1993;17:582–9.
[39] Adler LP, Crowe JP, al-Kaisi NK, Sunshine JL. Eval-
uation of breast masses and axillary lymph nodes with
[18F] 2-deoxy-2-fluoro-D-glucose PET. Radiology
1993;187:743–50.
[40] Avril N, Bense S, Ziegler SI, Dose J, Weber W, Lau-
benbacher C, et al. Breast imaging with fluorine-18-
FDG PET: quantitative image analysis. J Nucl Med
1997; 38:1186–91.
[41] Avril N, Dose J, Janicke F, Bense S, Ziegler S, Lauben-
bacher C, et al. Metabolic characterization of breast
tumors with positron emission tomography using F-18
fluorodeoxyglucose. J Clin Oncol 1996;14:1848–57.
[42] Crowe Jr JP, Adler LP, Shenk RR, Sunshine J. Positron
emission tomography and breast masses: comparison
with clinical, mammographic, and pathological find-
ings. Ann Surg Oncol 1994;1:132–40.
[43] Dehdashti F, Mortimer JE, Siegel BA, Griffeth LK,
Bonasera TJ, Fusselman MJ, et al. Positron tomo-
graphic assessment of estrogen receptors in breast can-
cer: comparison with FDG-PET and in vitro receptor
assays. J Nucl Med 1995;36:1766–74.
[44] Scheidhauer K, Scharl A, Pietrzyk U, Wagner R, Gohr-
ing UJ, Schomacker K, et al. Qualitative [18F]FDG
positron emission tomography in primary breast cancer:
clinical relevance and predictability. Eur J Nucl Med
1996;23:618–23.
[45] TseNY,HohCK,HawkinsRA, ZinnerMJ, DahlbomM,
Choi Y, et al. The application of positron emission tomo-
graphic imaging with fluorodeoxyglucose to the evalu-
ation of breast disease. Ann Surg 1992;216:27–34.
[46] Nieweg OE, Kim EE, Wong WH, Broussard WF, Sin-
gletary SE, Hortobagyi GN, et al. Positron emission
tomography with fluorine-18-deoxyglucose in the de-
tection and staging of breast cancer. Cancer 1993;71:
3920–5.
[47] Wahl RL, Cody RL, Hutchins GD, Mudgett EE. Pri-
mary and metastatic breast carcinoma: initial clinical
evaluation with PET with the radiolabeled glucose
analogue 2-[F-18]-fluoro-2-deoxy-D-glucose. Radiol-
ogy 1991;179:765–70.
[48] Avril N, Rose CA, Schelling M, Dose J, Kuhn W,
Bense S, et al. Breast imaging with positron emission
tomography and fluorine-18 fluorodeoxyglucose: use
and limitations. J Clin Oncol 2000;18:3495–502.
[49] Esserman L, Hylton N, Yassa L, Barclay J, Frankel S,
Sickles E. Utility of magnetic resonance imaging in the
management of breast cancer: evidence for improved
preoperative staging. J Clin Oncol 1999;17:110–9.
[50] Orel SG, Weinstein SP, Schnall MD, Reynolds CA,
Schuchter LM, Fraker DL, et al. Breast MR imaging
in patients with axillary node metastases and unknown
primary malignancy. Radiology 1999;212:543–9.
[51] Bohuslavizki KH, Klutmann S, Kroger S, Sonnemann
U, Buchert R, Werner JA, et al. FDG PET detection
of unknown primary tumors. J Nucl Med 2000;41:
816–22.
[52] Carter CL, Allen C, Henson DE. Relation of tumor
size, lymph node status, and survival in 24,740 breast
cancer cases. Cancer 1989;63:181–7.
[53] Wahl RL, Hutchins GD, Buchsbaum DJ, Liebert M,
Grossman HB, Fisher S. 18FDG uptake in human tu-
mor xenografts: feasibility studies for cancer imaging.
Cancer 1991;67:1544–50.
[54] Utech CI, Young CS, Winter P. Prospective evaluation
of fluorine-18 fluorodeoxyglucose positron emission
tomography in breast cancer for staging of the axilla
related to surgery and immunocytochemistry. Eur J
Nucl Med 1996;22:1588–93.
[55] Crippa F, Agresti R, Seregni E, Greco M, Pascali C,
Bogni A, et al. Prospective evaluation of fluorine-18-
FDG PET in presurgical staging of the axilla in breast
cancer. J Nucl Med 1998;39:4–8.
J.W.T. Leung / Radiol Clin N Am 40 (2002) 467–482 481

[56] Smith IC, Ogston KN, Whitford P, Smith FW, Sharp P,
Norton M, et al. Staging of the axilla in breast cancer:
accurate in vivo assessment using positron emission
tomography with 2-(fluorine-18)-fluoro-2-deoxy-D-
glucose. Ann Surg 1998;228:220–7.
[57] Yutani K, Shiba E, Kusuoka H, Tatsumi M, Uehara T,
Taguchi T, et al. Comparison of FDG-PET with MIBI-
SPECT in the detection of breast cancer and axillary
lymph node metastasis. J Comput Assist Tomogr 2000;
24:274–80.
[58] Avril N, Dose J, Janicke F, Ziegler S, Romer W, Weber
W, et al. Assessment of axillary lymph node involve-
ment in breast cancer patients with positron emission
tomography using radiolabeled 2-(fluorine-18)-fluoro-
2-deoxy-D-glucose. J Natl Cancer Inst 1996;88:
1204–9.
[59] Flanagan FL, Dehdashti F, Siegel BA. PET in breast
cancer. Semin Nucl Med 1998;28:290–302.
[60] Moon DH, Maddahi J, Silverman DHS, Glaspy JA,
Phelps ME, Hoh CK. Accuracy of whole-body fluo-
rine-18-FDGPET for the detection of recurrent or meta-
static breast carcinoma. J Nucl Med 1998;39:431–5.
[61] Moskovic EC, Mansi JL, King DM, Murch CR, Smith
IE. Mammography in the assessment of response to
medical treatment of large primary breast cancer. Clin
Radiol 1993;47:339–44.
[62] Segal MC, Paulus DD, Hortobagyi GN. Advanced pri-
mary breast cancer: assessment at mammography of res-
ponse to induction chemotherapy. Radiology 1988;169:
49–54.
[63] Jansson T, Westlin JE, Ahlstrom H, Lilja A, Langstrom
B, Bergh J. Positron emission tomography studies in
patients with locally advanced and/or metastatic breast
cancer: a method for early therapy evaluation? J Clin
Oncol 1995;13:1470–7.
[64] Bassa P, Kim EE, Inoue T, Wong FC, Korkmaz M,
Yang DJ, et al. Evaluation of preoperative chemother-
apy using PET with fluorine-18-fluorodeoxyglucose in
breast cancer. J Nucl Med 1996;37:931–8.
[65] Smith IC, Welch AE, Hutcheon AW, Miller ID, Payne
S, Chilcott F, et al. Positron emission tomography using
[18F]-fluorodeoxy-D-glucose to predict the pathologic
response of breast cancer to primary chemotherapy. J
Clin Oncol 2000;18:1676–88.
[66] Schelling M, Avril N, Nahrig J, Kuhn W, Romer W,
Sattler D, et al. Positron emission tomography using
[18F] fluorodeoxyglucose for monitoring primary che-
motherapy in breast cancer. J Clin Oncol 2000;18:
1689–95.
[67] Kakuda JT, Stuntz ME, Vargas HI, Khalkhali I. Status
of scintimammography and its relationship to other
detection methods for breast cancer. Cancer Biother
Radiopharm 1999;14:435–42.
[68] Chiu ML, Kronauge JF, Piwnica-Worms D. Effects of
mitochondrial and plasma membrane potentials on ac-
cumulation of hexakis-(2-methoxyisobutyl isonitrile)
technetium (I) in cultured mouse fibroblasts. J Nucl
Med 1990;31:1646–53.
[69] Buscombe JR, Cwikla JB, Thakrar DS, Hilson AJ.
Uptake of Tc-99m MIBI related to tumor size and type.
Anticancer Res 1997;17:1693–4.
[70] Taillefer R. The role of 99mTc-sestamibi and other con-
ventional radiopharmaceuticals in breast cancer diag-
nosis. Semin Nucl Med 1999;29:16–40.
[71] Khalkhali I, Mena I, Jouanne E, Diggles L, Venegas R,
Block J, et al. Prone scintimammography in patients
with suspicion of carcinoma of the breast. J Am Coll
Surg 1994;178:491–7.
[72] Scopinaro F, Schillaci O, Ussof W, Nordling K, Capo-
ferro R, De Vincentis G, et al. A three center study on
the diagnostic accuracy of 99mTc-MIBI scintimam-
mography. Anticancer Res 1997;17:1631–4.
[73] Pisano ED, Parham CA. Digital mammography, sesta-
mibi breast scintigraphy, and positron emission tomog-
raphy breast imaging. Radiol Clin North Am 2000;38:
861–9.
[74] Helbich TH, Becherer A, Trattnig S, Leitha T, Kelkar P,
Seifert M, et al. Differentiation of benign and malignant
breast lesions: MR imaging versus Tc-99m-sestamibi
scintimammography. Radiology 1997;202:421–9.
[75] Imbriaco M, Del Vecchio S, Riccardi A, Pace L, Di
Salle F, De Gennaro F, et al. Scintimammography with99m-Tc-MIBI versus dynamic MRI for non-invasive
characterization of breast masses. Eur J Nucl Med
2001;28:56–63.
[76] Klaus AJ, Klingensmith WC, Parker SH, Stavros AT,
Sutherland JD, Aldrete KD. Comparative value of99mTc-sestamibi scintimammography and sonography
in the diagnostic workup of breast masses. AJR
2000;174:1779–83.
[77] Palmedo H, Grunwald F, Bender H, Schomburg A,
Mallmann P, Krebs D, et al. Scintimammography with
technetium-99m methoxyisobutylisonitrile: compari-
son with mammography and magnetic resonance imag-
ing. Eur J Nucl Med 1996;23:940–6.
[78] Tiling R, Sommer H, Pechmann M, Moser R, Kress K,
Pfluger T, et al. Comparison of technetium-99m-sesta-
mibi scintimammography with contrast-enhanced MRI
for diagnosis of breast lesions. J Nucl Med 1997;
38:58–62.
[79] Tolmos J, Khalkhali I, Vargas H, Stuntz M, Cutrone J,
Mishkin F, et al. Detection of axillary lymph node me-
tastasis of breast carcinoma with technetium-99m sesta-
mibi scintimammography. Am Surg 1997;63:850–3.
[80] Taillefer R, Robidoux A, Turpin S, Lambert R, Cantin
J, Leveille J. Metastatic axillary lymph node techneti-
um-99m-MIBI imaging in primary breast cancer. J
Nucl Med 1998;39:459–64.
[81] Maini CL, Tofani A, Sciuto R, SemprebeneA, Cavaliere
R, Mottolese M, et al. Technetium-99m-MIBI scinti-
graphy in the assessment of neoadjuvant chemotherapy
in breast carcinoma. J Nucl Med 1997;38:1546–51.
J.W.T. Leung / Radiol Clin N Am 40 (2002) 467–482482
Percutaneous image-guided core breast biopsy
Laura Liberman, MD
Breast Imaging Section, Department of Radiology, Memorial Sloan-Kettering Cancer Center,
1275 York Avenue, New York, NY 10021, USA
Percutaneous image-guided biopsy is increasingly
an alternative to surgical biopsy for the histologic
assessment of breast lesions [1,2]. Guidance for
percutaneous biopsy is usually provided by stereo-
taxis or ultrasound; recently, there has been prelimi-
nary experience with percutaneous core biopsy under
the guidance of magnetic resonance imaging. Tissue
acquisition for percutaneous biopsy is usually accom-
plished with automated core needles (Fig. 1) or
directional vacuum-assisted biopsy probes (Fig. 2).
This article reviews advantages, limitations, contro-
versies, and future directions of percutaneous image-
guided core breast biopsy.
Guidance
Stereotaxis
Stereotactic biopsy is based on the principle that
the precise location of a lesion in three dimensions
can be determined based on its apparent change in
position on two angled (stereotactic) images. In early
validation studies, concordance between results of
stereotactic 14-gauge automated core biopsy and
surgical biopsy was 87% to 96%; the best results
were achieved by obtaining multiple specimens using
a long excursion gun with the patient prone on a
dedicated table (Table 1) [3–9].
Stereotactic biopsy can be performed with the
patient prone or upright. Advantages of the prone
table include more working room and decreased
likelihood of patient motion and vasovagal reaction;
the table also provides a psychological barrier
between the patient and the procedure. The main
disadvantages of the prone table are expense and
space. Use of recumbent positioning may improve
results with the upright method [10]. Digital imaging
may improve outcome by decreasing procedure time
[11]. Stereotactic guidance can be used for all types
of mammographic lesions (masses and calcifications)
but is most often used for calcifications.
Ultrasound
Ultrasound-guided 14-gauge automated core biop-
sy was first described by Parker et al in 1993 [7]. In
that study, one hundred eighty-one lesions had ultra-
sound-guided core biopsy with a 14-gauge automated
needle. Among 49 lesions with surgical correlation,
there was 100% concordance between results of ultra-
sound-guided 14-gauge automated core biopsy and
surgery; among 132 lesions yielding benign results,
no carcinomas were identified at 12- to 36-month
follow-up. Since that time, other investigators have
also demonstrated that ultrasound-guided 14-gauge
automated core biopsy is fast, safe, accurate, and cost-
saving [12–16]. Ultrasound-guided biopsy can also be
performed with an 11-gauge vacuum-assisted biopsy
device [17–19].
Advantages of ultrasound as a guidance modality
for percutaneous breast biopsy include lack of ioniz-
ing radiation, use of nondedicated equipment, acces-
sibility of all areas of the breast and axilla, real-time
visualization of the needle, multi-directional sam-
pling, and low cost [7,12,14,16]. The main disadvan-
tage of ultrasound guidance is that the lesion must be
sonographically evident to undergo ultrasound-
guided biopsy. Thus, ultrasound-guided core biopsy
may not be feasible for calcifications or for the small
subset of solid masses that are sonographically inap-
0033-8389/02/$ – see front matter D 2002, Elsevier Science (USA). All rights reserved.
PII: S0033 -8389 (01 )00011 -2
E-mail address: [email protected] (L. Liberman).
Radiol Clin N Am 40 (2002) 483–500
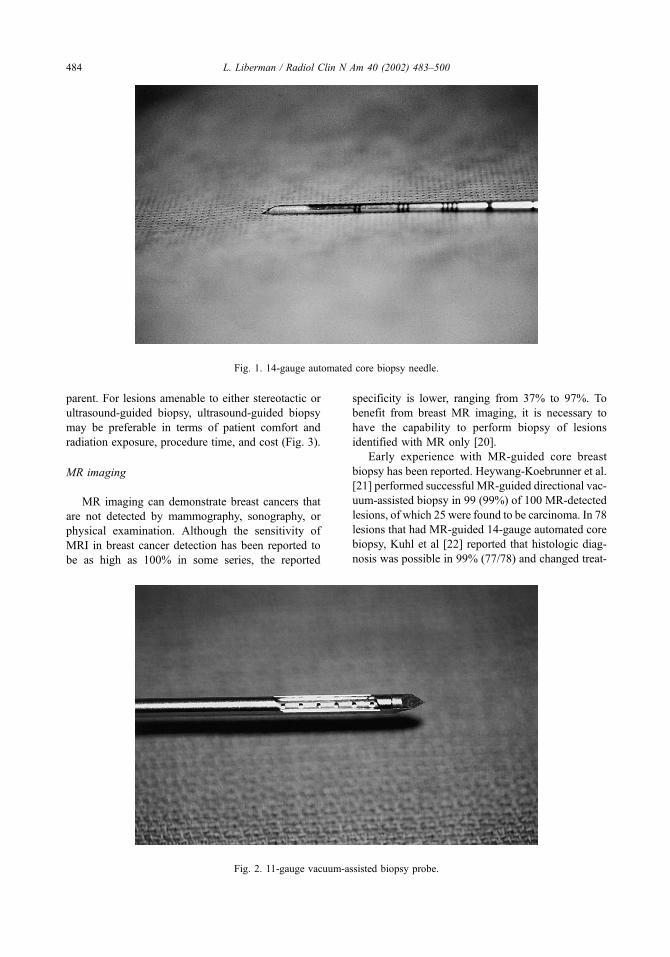
parent. For lesions amenable to either stereotactic or
ultrasound-guided biopsy, ultrasound-guided biopsy
may be preferable in terms of patient comfort and
radiation exposure, procedure time, and cost (Fig. 3).
MR imaging
MR imaging can demonstrate breast cancers that
are not detected by mammography, sonography, or
physical examination. Although the sensitivity of
MRI in breast cancer detection has been reported to
be as high as 100% in some series, the reported
specificity is lower, ranging from 37% to 97%. To
benefit from breast MR imaging, it is necessary to
have the capability to perform biopsy of lesions
identified with MR only [20].
Early experience with MR-guided core breast
biopsy has been reported. Heywang-Koebrunner et al.
[21] performed successful MR-guided directional vac-
uum-assisted biopsy in 99 (99%) of 100 MR-detected
lesions, of which 25 were found to be carcinoma. In 78
lesions that had MR-guided 14-gauge automated core
biopsy, Kuhl et al [22] reported that histologic diag-
nosis was possible in 99% (77/78) and changed treat-
Fig. 1. 14-gauge automated core biopsy needle.
Fig. 2. 11-gauge vacuum-assisted biopsy probe.
L. Liberman / Radiol Clin N Am 40 (2002) 483–500484

ment in 70% (54/77); in 59 lesions with established
validation, the diagnostic accuracy of MR-guided core
biopsy was 98% (58/59).
MR-guided percutaneous breast biopsy poses
several challenges, including the necessity to remove
the patient from the closed magnet to perform the
biopsy, limited access to the medial breast tissue, the
transient nature of contrast enhancement, and diffi-
culty in confirming lesion retrieval [23]. Develop-
ment of dedicated MR-guided biopsy equipment
would be invaluable, including coils, breast immobi-
lization and compression devices, needle guides,
localizing markers, and nonferromagnetic needles
with minimal artifact.
Advantages of percutaneous breast biopsy
The patient care advantages of percutaneous
breast biopsy have been well documented. Percuta-
neous biopsy is fast, less invasive than surgery, does
not deform the breast, and causes minimal to no
scarring on subsequent mammograms [11,24–26].
Complications are unusual, with the frequency of
hematoma and infection in two large series each less
than 1 per 1000 [27,28]. Women who have percuta-
neous biopsy undergo fewer operations [29–36] and
have a lower cost of diagnosis [37–41,45].
Fewer operations
The goal of percutaneous breast biopsy is to
obtain a histologic diagnosis of a lesion that is of
sufficient concern to warrant biopsy. Approximately
70 to 80% of lesions referred for biopsy are benign. If
percutaneous image-guided biopsy yields a benign
diagnosis concordant with the imaging characteris-
tics, surgery can usually be avoided.
Percutaneous biopsy can also decrease the number
of operations performed in women with breast cancer.
Smith et al [35] found that the average number of
surgeries performed was 1.25 in women with percu-
taneously-diagnosed cancer versus 2.01 in women
with surgically-diagnosed cancer. Other investigators
have reported a single operation was performed in 75
to 100% of women with percutaneously-diagnosed
cancer versus 0 to 38% of women with surgically-
diagnosed cancer (Table 2) [29–36]. The likelihood
of clear margins at the first operation is also higher
among women with cancers diagnosed percutane-
ously (75 to 100%) rather than surgically (45% to
64%) [29–33,35,36].
Some women with percutaneously-diagnosed
invasive breast cancer may undergo breast conserving
surgery with sentinel lymph node biopsy, a minimally
invasive approach to diagnosis and treatment [42].
Percutaneous biopsy results may also indicate the
presence of carcinoma that is multifocal (multiple
sites in the same quadrant) or multicentric (multiple
sites in different quadrants), altering treatment rec-
ommendations [43].
The surgeon’s approach is different when per-
forming a diagnostic surgical biopsy as compared to
a therapeutic operation after a percutaneous diagnosis
of breast cancer. The goal of a surgical biopsy is to
obtain a tissue diagnosis. Many surgeons prefer to
excise the minimal amount of tissue necessary in
order to minimize potential cosmetic deformity for a
Table 1
14-Gauge automated core breast biopsy studies with surgical correlation
Investigator/Year # Cases Concordance Insufficient # Passes Needle Gun Guidance
Parker/1993 [7] 49 100% 0% 4–5 14G Long Ultrasound
Parker/1991 [8] 102 96% 0% 3–4 14G Long Stereotactica
Elvecrog/1993 [5] 100 94% 0% � 5 14G Long Stereotactica
Gisvold/1994 [6] 104 90% 0% � 5 14G Long Stereotactica
Dronkers/1992 [4] 53 91% 6% 2 18G Short Stereotacticb
Parker/1990 [9] 102 87% 1% 3–4 18G (n = 65) Short (n = 2) Stereotacticc
16G (n = 9) Long (n = 101)
14G (n = 29)
Gisvold/1994 [6] 56 80% 2% < 5 14G Long Stereotactica
Dowlatshahi 1991 [3] 250 67–69% 17% 2–3 20G Short (n = 120) Stereotactica
Long (n = 130)
From Liberman L. Clinical management issues in percutaneous core breast biopsy. Radiol Clin N Am 2000;38(4):791–807;
with permission.a Prone.b Upright.c Upright in 30, prone in 73.
L. Liberman / Radiol Clin N Am 40 (2002) 483–500 485

lesion that may be benign. The goal of a therapeutic
operation to remove all of the cancer with clear
histologic margins, a procedure that usually requires
excision of a greater volume of tissue. A percuta-
Fig. 3. Asymptomatic woman with abnormal screening mammogram. (A) Craniocaudal view right mammogram shows an
irregular, spiculated mass (arrow) measuring approximately 1 cm at maximal diameter in the upper outer quadrant. (B)
Ultrasound of the right upper outer quadrant shows hypoechoic, solid, irregular mass which is taller than wide. (C) After
identifying the mass with ultrasound, cleansing the breast with iodine soap, and injecting local anesthesia, the radiologist inserts
the 14-gauge automated needle into the breast. (D) Ultrasound image confirms that the needle tip is immediately adjacent to the
mass. (E) Ultrasound image obtained after ‘‘firing’’ the automated gun shows that the needle has traversed the mass. An average
of four specimens are obtained per lesion through the same incision. Histologic analysis showed infiltrating ductal carcinoma. (F)
Specimen radiograph from the patient’s single therapeutic operation (needle localization, wide excision, and sentinel lymph node
biopsy) shows the localizing wire, spiculated mass, and faint calcifications in the specimen. Surgical histology showed
infiltrating ductal carcinoma (1.5 cm) and ductal carcinoma in situ with clear margins, and negative sentinel nodes.
L. Liberman / Radiol Clin N Am 40 (2002) 483–500486

neous diagnosis of cancer facilitates operative plan-
ning, usually allowing the surgeon to achieve a
therapeutic result in a single procedure [32].
Lower cost of diagnosis
Percutaneous biopsy can decrease the cost of
diagnosis of indeterminate or suspicious nonpalpable
breast lesions. Lindfors and Rosenquist [41] found
that use of stereotactic 14-gauge automated biopsy
rather than surgical biopsy reduced the marginal cost
per year of life saved by 23%. In other studies,
stereotactic 14-gauge automated core biopsy spared
a surgical procedure in 76 to 81% lesions, decreasing
cost of diagnosis by 40 to 58% (Table 3). Liberman
et al [38] estimated that use of stereotactic 14-gauge
automated core biopsy rather than surgical biopsy for
nonpalpable breast lesions could lead to potential
national savings approaching $200 million.
Ultrasound-guided 14-gauge automated core
biopsy also yields substantial cost savings. Liberman
et al [12] found that ultrasound-guided 14-gauge
automated core biopsy spared a surgical procedure
in 128 (85%) of 151 lesions, yielding a 56% decrease
in the cost of diagnosis (Table 3). The authors found
that for masses amenable to either stereotactic or
ultrasound-guided biopsy, cost savings are likely to
be greater if the biopsy is performed under ultra-
sound guidance.
Vacuum-assisted biopsy devices are more expen-
sive than automated needles but may in fact be cost
saving. Liberman et al [40] studied 200 consecutive
solitary nonpalpable lesions that had stereotactic
11-gauge vacuum-assisted breast biopsy. Stereotactic
11-gauge vacuum-assisted biopsy spared a surgical
Fig. 3 (continued ).
Table 2
Frequency of 1 operation after diagnosis of cancer
Frequency ofBiopsy method
1 operation Percutaneous # (%) Surgical # (%)
Jackman [29] 121/135 (90) 27/111 (24)a
Yim [36] 21/21 (100) 0/31 (0)a
Liberman [32] 76/90 (84) 31/107 (29)a
Smith [35] 49/65 (75) 57/610 (9)a
Lind [33] 43/48 (90) 26/69 (38)a
Kaufman [30] 52/66 (79) 10/47 (21)a
Morrow [34] 225/267 (84) 47/142 (33)a
a P< 0.001.
Table 3
Percutaneous breast biopsy: frequency of sparing surgery
and cost savings
Study Method
Frequency of
sparing surgery
(%)
Cost savings
(%)a
Liberman Stereotactic 140/182 (77) 893/1626 (55)
[38] 14G ALCBB
Lee Stereotactic 328/405 (81) 741/1278 (58)
[37] 14G ALCBB
Hillner Stereotactic 757/1000 (76) 804/2000 (40)
[105] 14G ALCBB
Liberman Ultrasound 128/151 (85) 744/1332 (56)
[12] 14G ALCBB
Liberman Stereotactic 151/200 (76) 182/1180 (15)
[40] 11G DVABB
Abbreviations: ALCBB, automated large core breast biopsy;
DVABB, directional vacuum-assisted breast biopsy.
From Liberman L. Clinical management issues in percuta-
neous core breast biopsy. Radiol Clin N Am 2000;38(4):
791–807; with permission.a Ratio of cost saving (in dollars) attributable to per-
cutaneous biopsy to the cost of diagnostic surgical biopsy.
L. Liberman / Radiol Clin N Am 40 (2002) 483–500 487

L. Liberman / Radiol Clin N Am 40 (2002) 483–500488
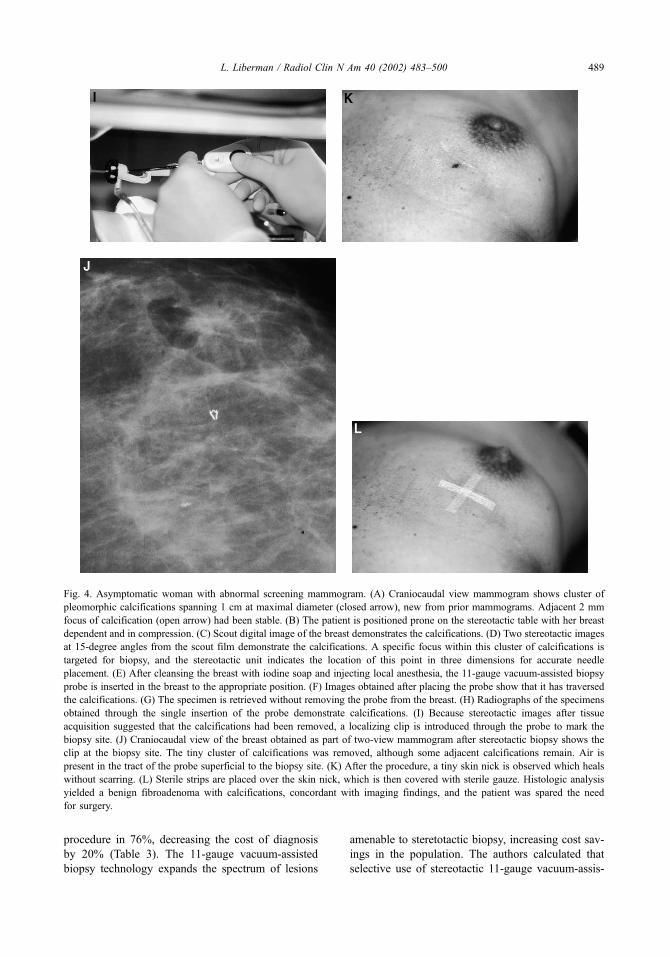
procedure in 76%, decreasing the cost of diagnosis
by 20% (Table 3). The 11-gauge vacuum-assisted
biopsy technology expands the spectrum of lesions
amenable to steretotactic biopsy, increasing cost sav-
ings in the population. The authors calculated that
selective use of stereotactic 11-gauge vacuum-assis-
Fig. 4. Asymptomatic woman with abnormal screening mammogram. (A) Craniocaudal view mammogram shows cluster of
pleomorphic calcifications spanning 1 cm at maximal diameter (closed arrow), new from prior mammograms. Adjacent 2 mm
focus of calcification (open arrow) had been stable. (B) The patient is positioned prone on the stereotactic table with her breast
dependent and in compression. (C) Scout digital image of the breast demonstrates the calcifications. (D) Two stereotactic images
at 15-degree angles from the scout film demonstrate the calcifications. A specific focus within this cluster of calcifications is
targeted for biopsy, and the stereotactic unit indicates the location of this point in three dimensions for accurate needle
placement. (E) After cleansing the breast with iodine soap and injecting local anesthesia, the 11-gauge vacuum-assisted biopsy
probe is inserted in the breast to the appropriate position. (F) Images obtained after placing the probe show that it has traversed
the calcifications. (G) The specimen is retrieved without removing the probe from the breast. (H) Radiographs of the specimens
obtained through the single insertion of the probe demonstrate calcifications. (I) Because stereotactic images after tissue
acquisition suggested that the calcifications had been removed, a localizing clip is introduced through the probe to mark the
biopsy site. (J) Craniocaudal view of the breast obtained as part of two-view mammogram after stereotactic biopsy shows the
clip at the biopsy site. The tiny cluster of calcifications was removed, although some adjacent calcifications remain. Air is
present in the tract of the probe superficial to the biopsy site. (K) After the procedure, a tiny skin nick is observed which heals
without scarring. (L) Sterile strips are placed over the skin nick, which is then covered with sterile gauze. Histologic analysis
yielded a benign fibroadenoma with calcifications, concordant with imaging findings, and the patient was spared the need
for surgery.
L. Liberman / Radiol Clin N Am 40 (2002) 483–500 489

ted biopsy could yield annual national cost savings of
$50 million [40].
The reductions in surgeries and cost savings of
percutaneous biopsy in clinical practice were recently
demonstrated by Rubin et al [15]. They found that
incorporation of percutaneous image-guided breast
biopsy into their practice increased the breast carci-
noma yield for needle localization biopsies from 21%
in 1984 to 68% in 1998 (P< 0.0001). Selective use of
ultrasound alone and percutaneous fine- and large-
core needle biopsy resulted in a substantial reduction
in benign open surgical biopsies. Cost analysis
showed a 50% reduction in the mean cost of breast
cancer diagnosis. The breast cancers detected after
introduction of percutaneous biopsy had good prog-
nosis, with 66% measuring less than 1 cm and 88%
measuring 1.5 cm or less [15].
Limitations
Calcification retrieval
Stereotactic 14-gauge automated core biopsy has
recognized limitations in the assessment of calcific
lesions [44]. Diagnosis of calcific lesions (as opposed
to masses) often requires a larger volume of tissue.
Failure to sample the lesion, histologic underestima-
tion, and failure to spare a surgical procedure are more
frequently observed in calcific lesions rather than ma-
sses: in previous studies, stereotactic 14-gauge auto-
mated core biopsy spared a surgical procedure in
84% to 87% of mass lesions versus 66 to 72% of le-
sions evident as calcifications [37,38]. The difficulties
encountered at stereotactic breast biopsy of calcifica-
tions reflect lesion geometry and histologic hetero-
geneity [44].
Directional vacuum-assisted biopsy instruments
are helpful in the assessment of calcific lesions
(Fig. 4) [45]. The vacuum-assisted probes obtain
larger tissue specimens: the median specimen weights
approximately 17 mg for the 14-gauge automated
needle, 35 mg for the 14-gauge directional vacuum-
assisted biopsy probe, and 100 mg for the 11-gauge
directional vacuum-assisted biopsy probe [45–47].
The vacuum device allows multiple specimens to be
obtained with a single insertion, facilitates contiguous
sampling, and enables the operator to suction blood
from the biopsy cavity. Calcification retrieval rates of
99 to 100% have been reported for 14- or 11-gauge
directional vacuum-assisted breast biopsy, signifi-
cantly higher than the 86 to 94% calcification
retrieval rate observed with 14-gauge automated large
core biopsy (Table 4) [37,44,48–52].
Histologic underestimates
Histologic underestimation occurs when percuta-
neous biopsy identifies the presence of a high risk or
malignant lesion but incompletely characterizes the
pathology. Examples of histologic underestimation
include lesions yielding a stereotactic biopsy diag-
Table 4
Calcification retrieval at stereotactic breast biopsy
No. of lesions with Ca++ retrieved
at 14-gauge automated large-core
No. of lesions with Ca+ retrieved at
vacuum-assisted breast biopsy
Investigator breast biopsy (%) 14-gauge 11-gauge
Liberman [49] 65/72 (90)
Lee [37] 133/151 (88)
Liberman [50] 50/55 (91)a
Meyer [51] 118/130 (91) 106/106 (100)b
Jackman [48] 1122/1196 (94) 1195/1209 (99) 720/723 ( > 99)c
Liberman [44] 106/112 (95)d
Reynolds [52] 36/42 (86) 64/64 (100)
From Liberman L. Clinical management issues in percutaneous core breast biopsy. Radiol Clin N Am 2000;38(4):791–807;
with permission.a Frequency of calcification retrieval was 19/24 (79%) in the first half of the eight month study period and 31/31 (100%) in
the second half.b P= 0.0006.c Frequency of retrieving calcifications was significantly higher for 14-gauge directional vacuum-assisted biopsy versus
14-gauge automated large core biopsy (P < 0.0001), and significantly higher for 11-gauge directional vacuum-assisted biopsy
versus 14-gauge automated large core biopsy (P< 0.0001), but did not differ significantly for 11- versus 14-gauge directional
vacuum assisted biopsy (P= 0.15).d P= 0.003
L. Liberman / Radiol Clin N Am 40 (2002) 483–500490
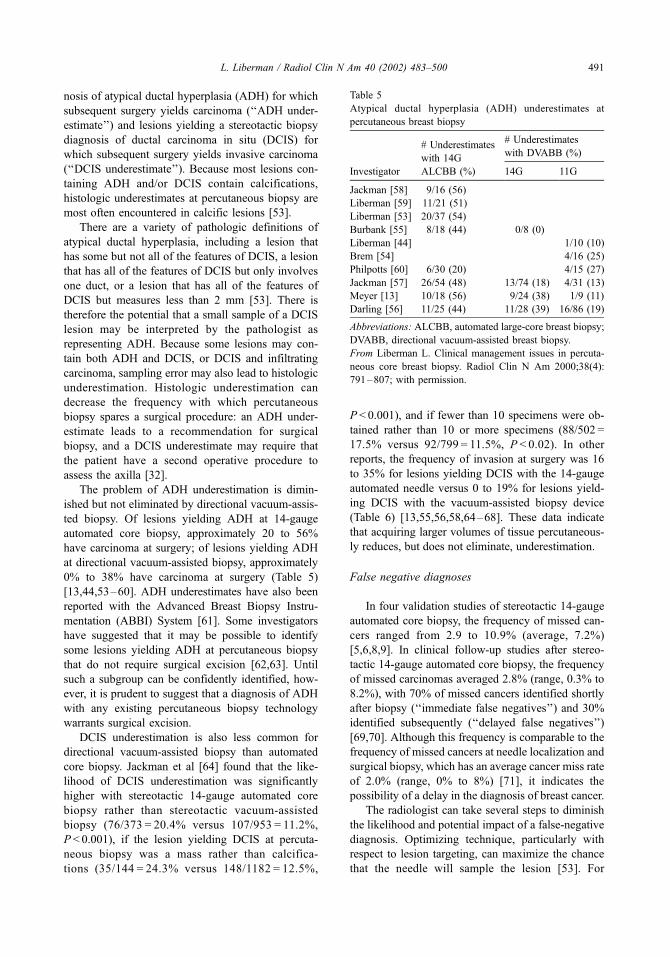
nosis of atypical ductal hyperplasia (ADH) for which
subsequent surgery yields carcinoma (‘‘ADH under-
estimate’’) and lesions yielding a stereotactic biopsy
diagnosis of ductal carcinoma in situ (DCIS) for
which subsequent surgery yields invasive carcinoma
(‘‘DCIS underestimate’’). Because most lesions con-
taining ADH and/or DCIS contain calcifications,
histologic underestimates at percutaneous biopsy are
most often encountered in calcific lesions [53].
There are a variety of pathologic definitions of
atypical ductal hyperplasia, including a lesion that
has some but not all of the features of DCIS, a lesion
that has all of the features of DCIS but only involves
one duct, or a lesion that has all of the features of
DCIS but measures less than 2 mm [53]. There is
therefore the potential that a small sample of a DCIS
lesion may be interpreted by the pathologist as
representing ADH. Because some lesions may con-
tain both ADH and DCIS, or DCIS and infiltrating
carcinoma, sampling error may also lead to histologic
underestimation. Histologic underestimation can
decrease the frequency with which percutaneous
biopsy spares a surgical procedure: an ADH under-
estimate leads to a recommendation for surgical
biopsy, and a DCIS underestimate may require that
the patient have a second operative procedure to
assess the axilla [32].
The problem of ADH underestimation is dimin-
ished but not eliminated by directional vacuum-assis-
ted biopsy. Of lesions yielding ADH at 14-gauge
automated core biopsy, approximately 20 to 56%
have carcinoma at surgery; of lesions yielding ADH
at directional vacuum-assisted biopsy, approximately
0% to 38% have carcinoma at surgery (Table 5)
[13,44,53–60]. ADH underestimates have also been
reported with the Advanced Breast Biopsy Instru-
mentation (ABBI) System [61]. Some investigators
have suggested that it may be possible to identify
some lesions yielding ADH at percutaneous biopsy
that do not require surgical excision [62,63]. Until
such a subgroup can be confidently identified, how-
ever, it is prudent to suggest that a diagnosis of ADH
with any existing percutaneous biopsy technology
warrants surgical excision.
DCIS underestimation is also less common for
directional vacuum-assisted biopsy than automated
core biopsy. Jackman et al [64] found that the like-
lihood of DCIS underestimation was significantly
higher with stereotactic 14-gauge automated core
biopsy rather than stereotactic vacuum-assisted
biopsy (76/373 = 20.4% versus 107/953 = 11.2%,
P< 0.001), if the lesion yielding DCIS at percuta-
neous biopsy was a mass rather than calcifica-
tions (35/144 = 24.3% versus 148/1182 = 12.5%,
P < 0.001), and if fewer than 10 specimens were ob-
tained rather than 10 or more specimens (88/502 =
17.5% versus 92/799 = 11.5%, P < 0.02). In other
reports, the frequency of invasion at surgery was 16
to 35% for lesions yielding DCIS with the 14-gauge
automated needle versus 0 to 19% for lesions yield-
ing DCIS with the vacuum-assisted biopsy device
(Table 6) [13,55,56,58,64–68]. These data indicate
that acquiring larger volumes of tissue percutaneous-
ly reduces, but does not eliminate, underestimation.
False negative diagnoses
In four validation studies of stereotactic 14-gauge
automated core biopsy, the frequency of missed can-
cers ranged from 2.9 to 10.9% (average, 7.2%)
[5,6,8,9]. In clinical follow-up studies after stereo-
tactic 14-gauge automated core biopsy, the frequency
of missed carcinomas averaged 2.8% (range, 0.3% to
8.2%), with 70% of missed cancers identified shortly
after biopsy (‘‘immediate false negatives’’) and 30%
identified subsequently (‘‘delayed false negatives’’)
[69,70]. Although this frequency is comparable to the
frequency of missed cancers at needle localization and
surgical biopsy, which has an average cancer miss rate
of 2.0% (range, 0% to 8%) [71], it indicates the
possibility of a delay in the diagnosis of breast cancer.
The radiologist can take several steps to diminish
the likelihood and potential impact of a false-negative
diagnosis. Optimizing technique, particularly with
respect to lesion targeting, can maximize the chance
that the needle will sample the lesion [53]. For
Table 5
Atypical ductal hyperplasia (ADH) underestimates at
percutaneous breast biopsy
# Underestimates
with 14G
# Underestimates
with DVABB (%)
Investigator ALCBB (%) 14G 11G
Jackman [58] 9/16 (56)
Liberman [59] 11/21 (51)
Liberman [53] 20/37 (54)
Burbank [55] 8/18 (44) 0/8 (0)
Liberman [44] 1/10 (10)
Brem [54] 4/16 (25)
Philpotts [60] 6/30 (20) 4/15 (27)
Jackman [57] 26/54 (48) 13/74 (18) 4/31 (13)
Meyer [13] 10/18 (56) 9/24 (38) 1/9 (11)
Darling [56] 11/25 (44) 11/28 (39) 16/86 (19)
Abbreviations: ALCBB, automated large-core breast biopsy;
DVABB, directional vacuum-assisted breast biopsy.
From Liberman L. Clinical management issues in percuta-
neous core breast biopsy. Radiol Clin N Am 2000;38(4):
791–807; with permission.
L. Liberman / Radiol Clin N Am 40 (2002) 483–500 491

calcific lesions, retrieval of calcifications on speci-
men radiographs is important; if calcifications are not
identified on specimen radiographs and the diagnosis
is benign, additional tissue sampling may be war-
ranted even if calcifications are identified histologi-
cally [49]. Careful imaging-histologic correlation will
allow the radiologist to identify discordant lesions
prospectively and recommend prompt rebiopsy,
avoiding delay in diagnosis [72]. The radiologist
should emphasize to the patient the importance of
follow-up mammography after benign percutaneous
biopsy, so that any interval change can be identified
and evaluated [69].
Learning curve
A learning curve exists for all endeavors in life,
and percutaneous breast biopsy is no exception.
Liberman et al [73] recently reviewed 923 consec-
utive lesions that had stereotactic biopsy by one of six
radiologists with 14-gauge automated (n = 414) or
vacuum-assisted (n = 509) equipment. Significantly
higher technical success rates and lower false-nega-
tive rates were observed after the first 5 to 20 cases
for 14-gauge automated core biopsy and after the first
5 to 15 cases for 11-gauge vacuum-assisted biopsy.
Even after the radiologists had experience with ster-
eotactic biopsy, changes in equipment resulted in a
new learning curve. These data indicate the need for
adequate training, with phantoms and under the
guidance of more experienced individuals, so that
we can appropriately disseminate this technology
while delivering high quality care.
Controversies
Lesion selection
Percutaneous core biopsy is most often used to
evaluate nonpalpable lesions that are suspicious for
malignancy, that is, Breast Imaging Reporting and
Data System (BI-RADS) category 4 [74]. Carcinoma
is identified in approximately 20% to 40% of BI-
RADS of BI-RADS category 4 lesions [75,76]. If
percutaneous core biopsy of a category 4 lesion
yields a benign diagnosis concordant with the imag-
ing characteristics, diagnostic surgical biopsy usually
can be avoided [38].
The utility of percutaneous core biopsy in the
evaluation of lesions that are highly suggestive of
malignancy (BI-RADS category 5) has been de-
bated. Approximately 75 to 90% of BI-RADS cat-
egory 5 lesions are malignant [75,76]. The utility of
percutaneous core biopsy for category 5 lesions
depends on the surgical protocol. If the protocol in
the absence of percutaneous biopsy would be to
perform a diagnostic surgical biopsy followed by a
second (therapeutic) surgery if cancer is found,
percutaneous biopsy can spare a surgical procedure.
If the protocol in the absence of percutaneous
biopsy would be to confirm the diagnosis of cancer
with frozen section and then to perform a 1-stage
therapeutic operation, percutaneous biopsy would
not spare a surgical procedure.
In prior studies of stereotactic 14-gauge auto-
mated core biopsy, the frequency of sparing surgery
was higher for BI-RADS category 5 masses (76% to
77%), which usually represent invasive cancer, than
for BI-RADS category 5 calcifications (42% to 55%),
which usually represent DCIS [37,77,78]. Stereotac-
tic 11-gauge vacuum-assisted biopsy may be more
useful for women with calcifications highly sugges-
tive of malignancy. Liberman et al [39] found that
women with BIRADS category 5 calcifications who
had stereotactic biopsy, as opposed to surgical biopsy,
Table 6
Ductal carcinoma in situ underestimates at percutaneous
breast biopsy
# Underestimates
with 14G
# Underestimates
with DVABB (%)
Investigator ALCBB (%) 14G 11G
Jackman [58] 8/43 (19)
Liberma [66] 3/15 (20)
Burbank [55] 9/55 (16) 0/32 (0)
Liberman [44] 1/21 (5)
Liberman [67] 4/28 (14)
Won [68] 7/20 (35) 3/20 (15)
Meyer [13] NS (19)a NS (19)a 1/28 (4)
Lee [65] 11/25 (44) 6/34 (18)b
Darling [56] 14/67 (21) 8/47 (17) 18/175 (10)
Jackman [64] 76/373 (20) 38/348 (11) 69/605 (11)
Abbreviations: ALCBB, automated large-core breast biopsy;
DVABB, directional vacuum-assisted breast biopsy.
From Liberman L. Clinical management issues in percuta-
neous core breast biopsy. Radiol Clin N Am 2000;38(4):
791–807; with permission.a In 19/105 (19%) lesions yielding DCIS at 14G
ALCBB or 14G DVABB, surgery revealed infiltrating
carcinoma.b Among 74 lesions evident as calcifications that had
surgical biopsy yielding DCIS as the initial procedure, sub-
sequent re-excision showed invasion in six (6/74 = 8% all
cases and 6/56 = 11% lesions that had re-excision). The
frequency of histologic underestimation at 11-gauge vacuum-
assisted biopsy did not differ significantly from the frequen-
cy of underestimation in lesions that were diagnosed at
surgical biopsy.
L. Liberman / Radiol Clin N Am 40 (2002) 483–500492

were significantly more likely to undergo a single sur-
gical procedure (61/89 = 68.5% versus 19/50 = 38.0%,
P< 0.001) and to obtain clear histologic margins at the
first operation (58/77 = 75.3% versus 8/37 = 21.6%,
P < 0.001). Stereotactic 11-gauge vacuum-assisted
biopsy, as opposed to stereotactic 14-gauge automated
core or 14-gauge vacuum-assisted biopsy, was sig-
nificantly more likely to spare surgery (36/47 = 76.6%
versus 16/42 = 38.1%, P < 0.001) and had higher cost
savings ($315 per case, a 22.2% decrease in cost of
diagnosis) [39].
Controversy exists regarding the role of percuta-
neous core biopsy in the evaluation of ‘‘probably
benign’’ (BI-RADS category 3) lesions, which have
a 0.5% to 2% frequency of carcinoma [79,80].
The traditional management of BI-RADS category
3 lesions is short-term follow-up mammography,
which is less invasive and less expensive (by a
factor of eight) than percutaneous core biopsy
[81]. Biopsy could be considered in a small subset
of category 3 lesions, for example if follow-up is
unavailable or compromised (due to geographic
considerations, an impending pregnancy, or impend-
ing breast augmentation or reduction surgery), if a
synchronous carcinoma is present (especially in the
ipsilateral breast and breast conserving surgery is
planned), if the patient is at high risk for developing
breast cancer, or if the patient’s anxiety precludes
short-term follow-up.
Percutaneous imaging-guided core biopsy may
also be used in the evaluation of selected palpable
lesions. Liberman et al [82] reported 115 palpable
lesions that had percutaneous imaging-guided core
biopsy, including lesions that were small, deep,
mobile, vaguely palpable, or multiple. Biopsy was
performed under ultrasound guidance in 100 and
under stereotactic guidance in 15. Among these 115
lesions, 98 (85%) were referred by surgeons and 88
(77%) underwent percutaneous biopsy on the day of
the initial evaluation. Percutaneous imaging-guided
core biopsy spared the need for additional tissue
sampling in 79 (74%) cases.
Complete lesion removal
Complete removal of the lesion identified at
imaging may occur during percutaneous breast
biopsy. In studies of stereotactic 14-gauge direc-
tional vacuum-assisted biopsy, complete removal of
the mammographic target occurred in 13% to 48%
of all lesions and in 58% to 93% of lesions
measuring 5 mm or less [83]. In studies of sono-
graphically-guided 11-gauge vacuum-assisted biop-
sy, complete removal of the sonographic target
occurred in 55% to 89% [17,18].
Complete removal of all imaging evidence of the
lesion does not ensure complete excision of the
pathologic abnormality. In prior reports of carcino-
mas in which the imaging finding was removed at
11-gauge vacuum-assisted biopsy, surgery revealed
residual carcinoma in 50% to 73% [83,18]. There-
fore, if the lesion identified on imaging studies is
removed, it is desirable to place a localizing clip at
the biopsy site to facilitate subsequent localization if
necessary (Fig. 4) [84,85].
Although complete lesion removal is generally
not the goal of percutaneous biopsy, it may be
advantageous. Complete lesion removal may de-
crease the likelihood of growth on follow-up,
which has been reported in 7% to 9% of lesions
yielding benign results at 14-gauge automated core
biopsy [69,70]. Perhaps complete lesion removal
can reduce sampling error, with resultant decrease
in the frequency of histologic underestimation,
imaging-histologic discordance, and rebiopsy. With
the increased use of larger tissue acquisition devi-
ces, additional study is needed to assess the bene-
fits of complete removal of the imaging finding
versus sampling.
Advanced breast biopsy instrumentation
The Advanced Breast Biopsy Instrumentation
(ABBI) system (US Surgical, Norwalk, CT) is a
stereotactic table coupled with a tissue acquisition
device available with cannulas ranging in size up to
2 cm. The ABBI device can obtain a specimen ex-
tending from the subcutaneous tissue to beyond the
lesion, potentially removing the entirety of a small
mammographic target in a single specimen. In spite
of initial enthusiasm for this device, the ABBI system
has many disadvantages, including large (up to
13 cm3) volume of tissue with potential for scarring
and deformity, high (1.1%) complication rate, high
(64% to 100%) frequency of tumor at the margins of
the biopsy specimen, excision, and high cost (over
$500 for ABBI cannulas, versus $215 for 11-gauge
vacuum-assisted biopsy probes and $15 to $25 for
14-gauge automated needles) [86].
Epithelial displacement
Breast needling procedures (anesthetic injection,
suture placement, needle localization, fine needle
aspiration, core biopsy, or vacuum-assisted biopsy)
can displace benign or malignant epithelium into
tissue away from the target lesion. Epithelial dis-
L. Liberman / Radiol Clin N Am 40 (2002) 483–500 493

placement can cause interpretive problems for the
pathologist because displaced DCIS can mimic
invasive cancer. Specific histologic findings suggest-
ing epithelial displacement include morphologic
evidence of a needle track hemorrhage, fat necrosis,
inflammation, hemosiderin-laden macrophages, or
granulation tissue), fragments of epithelium in arti-
factual spaces, and absence of surrounding tissue
reaction. Epithelial displacement may be less fre-
quent after vacuum-assisted biopsy than after auto-
mated core biopsy [67].
In a study of 352 surgical excision specimens
in women with a prior diagnosis of cancer by
large-core needle biopsy, Diaz et al [87] found
displacement of malignant epithelium in 32%. The
frequencyof tumor displacement was 37% after
automated gun biopsy, 38% after palpation-guided
biopsy, and 23% after vacuum-assisted biopsy.
Tumor displacement was seen in 42% of patients
with less than 15 days biopsy and excision, in
31% of patients with an interval of 15 to 28 days,
and in 15% of tumors excised more than 28 days
after core biopsy (P < 0.005). The inverse relation
between time to excision and observed tumor
displacement suggests that tumor cells do not sur-
vive displacement.
Although there is no evidence that epithelial
displacement is of biological importance, few data
address the issue. Berg and Robbins [88] noted no
difference in 15-year survival between women diag-
nosed by aspiration biopsy as compared to open
surgical biopsy in a study of stage-matched palpable
invasive breast cancers treated with mastectomy.
Kopans et al [89] found no evidence of local re-
currence attributable to needle localization in a study
of 74 women with nonpalpable breast cancer diag-
nosed by needle localization and surgical biopsy.
Limited conclusions can be drawn from these two
studies because mastectomy was performed in
most [89] or all [88] of the patients. Other inves-
tigators have reported no significant difference in the
frequency of recurrence when comparing cancers
diagnosed by percutaneous biopsy versus surgical
biopsy [90].
Management after percutaneous breast biopsy
Rebiopsy
In published series, repeat biopsy has been rec-
ommended after percutaneous image-guided core
breast biopsy in 9% to 18% of cases [12,13,60,
91,92]. The diagnosis of atypical ductal hyperplasia,
which accounted for 16% to 56% of lesions referred
for repeat biopsy in prior reports, was the most
common reason for rebiopsy after stereotactic core
biopsy (Table 5). Other reasons for repeat biopsy
include discordance between imaging and histologic
findings, possible phyllodes tumor, pathologist’s rec-
ommendation, and (rarely) inadequate tissue [93–97].
Among lesions referred for rebiopsy after percutane-
ous biopsy, surgery revealed carcinoma in 0% to 44%
(Table 7) [12,13,60,91,92].
Controversy exists regarding the need for surgical
excision after percutaneous core biopsy diagnosis
of other specific histologies, including papillary
lesions [14,96,98], radial scar [69,92,96,100], atyp-
ical lobular hyperplasia [94–96,99], and lobular car-
cinoma in situ [1] (Table 8) [93–97,99]. Because of
Table 7
Rebiopsy after percutaneous breast biopsy
Investigator/Year Method Rebiopsy rate (%) Malignancy at rebiopsy (%)
Dershaw [91] 14G Stereo ALCBB 56/314 (18) 22/50 (44)
Meyer [92] Variablea 112/1032 (14) 18/112 (16)
Liberman [12] 14G US ALCBB 15/151 (10) 2/15 (13)
Philpotts [60] 14G Stereo ALCBB 88/592 (15) 10/73 (14)
Philpotts [60] 11G Stereo DVABB 32/354 (9) 5/27 (19)
Meyer [13] Variableb 202/1836 (11) 32/202 (16)
Liberman [40] 11G Stereo DVABB 35/200 (18) 5/35 (14)
Abbreviations: ALCBB, automated large core breast biopsy; US, ultrasound.
From Liberman L. Clinical management issues in percutaneous core breast biopsy. Radiol Clin N Am 2000;38(4):791–807;
with permission.a Guidance was stereotaxis in 824 (80%) of 1032 lesions and ultrasound in 208 (20%); tissue was acquired with a 14-gauge
automated needle in 926 (90%) and a 14-gauge directional vacuum-assisted biopsy probe in 106 (10%).b Guidance was stereotaxis in 1388 (76%) and ultrasound in 448 (24%); tissue was acquired with acquisition device was a
14-gauge automated needle in 1333 (73%), a 14-gauge vacuum-assisted device in 372 (20%), and an 11-gauge vacuum-assisted
device in 131 (7%).
L. Liberman / Radiol Clin N Am 40 (2002) 483–500494

the low frequency of each of these diagnoses, these
issues may best be addressed in multi-institutional
collaborations. Philpotts et al [60] found that the rate
of repeat biopsy was significantly lower after stereo-
tactic 11-gauge directional vacuum-assisted biopsy
(9%) rather than 14-gauge automated core biopsy
(15%), suggesting that the larger volume of tissue
or more contiguous sampling provided by vacuum-
assisted biopsy may improve lesion characterization.
Imaging-histologic discordance
Imaging-histologic discordance occurs when the
histologic findings do not provide a sufficient expla-
nation for the imaging features [72]. In published
reports, percutaneous biopsy has yielded discordant
results in up to 6% of cases; among discordant
lesions, subsequent surgical excision has demonstrat-
ed carcinoma in 0% to 64% [72]. At our institution,
the radiologist does not finalize the percutaneous
biopsy report until the histologic analysis is complete.
The radiologist then puts an addendum on the report,
discussing the histologic findings and stating whether
they are concordant; if discordance exists, a repeat
biopsy (usually surgical excision) is suggested. Care-
ful imaging-histologic correlation by an individual
with expertise in breast imaging is necessary to
minimize the likelihood of delayed diagnosis of
breast cancer.
Fibroepithelial tumors
Phyllodes tumors account for less than 1% of
all breast neoplasms and approximately 2% to 3%
of fibroepithelial tumors of the breast [101].
Although 50% to 75% of phyllodes tumors are
benign, they can be locally aggressive. In core
biopsy specimens, it may not be possible for the
pathologist to distinguish between a cellular fibroa-
denoma and a phyllodes tumor. If the percutaneous
biopsy findings suggest the possibility of phyllodes
tumor, surgical excision is warranted: in one series,
the diagnosis ‘‘fibroepithelial tumor: fibroadenoma
versus phyllodes tumor’’ was the most common
reason for recommending surgical excision after
ultrasound-guided core biopsy [12]. In prior reports
of fibroepithelial neoplasms thought to possibly
represent phyllodes tumors at percutaneous biopsy,
surgery revealed phyllodes tumors in 22 to 43%
(Table 8).
Radial scars
Radial scars (radial sclerosing lesions) are char-
acterized by a sclerotic central nidus composed of
fibrosis and elastosis, elastin in duct walls and
stroma, and partial or complete obliteration of ductal
structures. Radial scars may be an independent risk
factor for subsequent development of breast cancer
and may be associated with an adjacent cancer, such
as DCIS or tubular carcinoma [102]. In two series
including a total of 13 radial scars at percutaneous
biopsy that had subsequent excision, carcinoma was
found in two (15%) [69,103], including DCIS in one
and infiltrating ductal carcinoma in one. Although
data are limited, it has been suggested that excision
may be appropriate when percutaneous biopsy yields
a diagnosis of radial scar.
Table 8
Lesions for which surgical excision was suggested after
percutaneous biopsy in larger published seriesa
Percutaneous
biopsy findings Frequency (%)
# Malignant at
excision (%)
Discordance
Liberman [72] 56/1785 (3) 11/45 (24)
Meyer [92] 65/1032 (6) 2/65 (3)
Philpotts [60] 23/946 (2) 0/14 (0)
Fibroepithelial tumor
Possible phyllodes
Dershaw [91] 7/314 (2) 0/7 (0)a
Meyer [92] 9/1032 (1) 2/9 (22)b
Liberman [12] 5/151 (3) 1/3 (33)b
Radial scar
Jackman [69] 5/483 (1) 2/5 (40)
Philpotts [103] 9/1236 ( < 1) 0/8 (0)
Papillary lesions
Rubin [14] 8/200 (4) 0/8 (0)
Liberman [98] 12/1077 (1) 1/9 (11)
Philpotts [103] 16/1236 (1) 1/6 (17)
ALH
Liberman [95] 7/1315 ( < 1) 0/4 (0)
Lechner [94] 154/35,424 ( < 1) 18/84 (21)
Berg [99] 15/1400 (1) 1/6 (17)
LCIS
Liberman [95] 16/1315 (1) 3/14 (21)
Lechner [94] 89/35,424 ( < 1) 20/58 (34)
Berg [99] 10/1400 ( < 1) 0/5 (0)
Philpotts [103] 5/1236 ( < 1) 1 (20)
Abbreviations: ALH, atypical lobular hyperplasia; LCIS,
lobular carcinoma in situ.
From Liberman L. Clinical management issues in percuta-
neous core breast biopsy. Radiol Clin N Am 2000;38(4):
791–807; with permission.a Among seven fibroepithelial tumors that were excised,
three (43%) were benign phyllodes tumors.b Phyllodes tumors.
L. Liberman / Radiol Clin N Am 40 (2002) 483–500 495

Papillary lesions
Papillary lesions of the breast, often histologically
heterogeneous, account for less than 10% of benign
breast neoplasms that undergo biopsy and 1% to 2%
of breast carcinomas [98]. In three studies which
have included 34 benign papillary lesions at per-
cutaneous biopsy that had subsequent surgical exci-
sion, carcinoma was found in two (6%) [14,98,103].
One of these two lesions was a spiculated mass
yielding papillomatosis at percutaneous biopsy, a
diagnosis considered discordant with the imaging
characteristics; surgery revealed a radial scar and
DCIS [98]. The other was an unusual microscopic
papillary lesion for which excision was suggested by
the pathologist; surgery revealed borderline DCIS
[103]. Although no carcinomas have been reported at
surgery in lesions yielding benign papilloma at per-
cutaneous biopsy (to my knowledge), additional
study with long-term follow-up is necessary to assess
the clinical course of benign papillary lesions with-
out atypia that are not excised after percutaneous
breast biopsy.
Lobular carcinoma in situ and atypical
lobular hyperplasia
Lobular carcinoma in situ (LCIS) is a disease of
small lobular ducts and lobules. LCIS without other
evidence of carcinoma has been reported in 1 to 3%
of breast biopsy specimens. It is often multicentric
and bilateral. Women with LCIS diagnosed at sur-
gical biopsy are at increased risk of developing
infiltrating carcinoma (ductal or lobular) in either
breast. Atypical lobular hyperplasia (ALH) has been
described as a lesion that has some but not all of the
features of LCIS, or a lesion that has all of the
features of LCIS but only involves up to 50 to
75% of the lobule. Some pathologists have sug-
gested use of the term ‘‘lobular neoplasia’’ to
indicate a variety of lobular lesions ranging from
atypical lobular hyperplasia to LCIS, while others
feel that the term is too broad [95].
Surgical excision is warranted in some lesions
yielding LCIS or ALH at percutaneous biopsy.
Liberman et al [95] reported carcinoma in three
(21%) of 14 lesions yielding LCIS at percutaneous
biopsy, including DCIS in two and infiltrating carci-
noma in one. In two of the lesions yielding cancer at
surgery, percutaneous biopsy findings overlapped
with those of DCIS; in one, there was an associated
high-risk lesion (radial scar). Philpotts et al [103]
reported carcinoma in one (20%) of five lesions
yielding LCIS at percutaneous biopsy, which was
evident as a mass at mammography. Berg et al [99]
reported carcinoma in one (17%) of six lesions
yielding ALH at percutaneous biopsy; in this lesion,
residual suspicious calcifications were present after
the percutaneous biopsy, and surgical histology
yielded DCIS.
In a multi-institutional study by Lechner et al [94],
LCIS was found in 89 (0.3%) of 35,424 lesions that
had percutaneous biopsy. Surgical excision, per-
formed in 58 (65%) of these LCIS lesions, yielded
carcinoma in 20 (34%), of which 12 were infiltrating
carcinomas (infiltrating lobular carcinoma in eight,
infiltrating ductal carcinoma in two, and tubular carci-
noma in two) and eight were DCIS. Percutaneous
biopsy revealed ALH in 154 (0.5%) of 32,424 lesions.
Of the 84 (55%) ALH lesions that had surgical
excision, surgery revealed carcinoma in 18 (21%),
including DCIS in 13 and infiltrating carcinoma in five
(three ductal and two lobular); LCIS was found in an
additional 18 (21%) of these 84 lesions. The authors
concluded that surgical excision after percutaneous
diagnosis of LCIS or ALH is warranted in selected
cases, but do not suggest specific selection criteria.
The published experience suggests that lesions
yielding LCIS or ALH at percutaneous biopsy war-
rant surgical excision if there is imaging-histologic
discordance, if an associated high-risk lesion is
present, or if the histologic features overlap with
ADH or DCIS. Histologic differentiation of ductal
and lobular carcinomas can be facilitated by staining
for E-cadherin, a transmembrane glycoprotein that is
present in ductal but not lobular carcinomas [93].
Georgian-Smith and Lawton [93] have suggested
that excision may also be warranted if percutaneous
biopsy yields calcifications associated with necrosis
in ‘‘pleomorphic’’ LCIS. Although the existing data
do not mandate routine excision of all lesions yield-
ing benign findings concordant with imaging fea-
tures as well as an ‘‘incidental’’ microscopic focus of
LCIS at percutaneous biopsy, further study is
needed. In addition, all women with LCIS at percu-
taneous biopsy should be informed about their
increased risk of breast cancer and opportunities
for prevention.
Follow-up
Follow-up is essential after benign percutaneous
biopsy, but the follow-up interval is not standardized.
For lesions yielding benign results concordant with
the imaging characteristics, Lee et al [70] suggest
annual mammography if the percutaneous biopsy
histologic diagnosis is specific and short-interval
L. Liberman / Radiol Clin N Am 40 (2002) 483–500496

follow-up (the ipsilateral breast at six months and both
breasts at 12, 24, and 36 months) if the percutaneous
biopsy histologic diagnosis is nonspecific. Jackman
et al [69] recommend that the first follow-up study be
obtained six months after percutaneous biopsy for all
lesions yielding benign findings concordant with the
imaging characteristics. Further work is necessary to
determine the optimal follow-up protocol.
Obtaining follow-up poses challenges. In a study
of 160 breast lesions that had percutaneous biopsy,
Goodman et al [104] reported that only 52 (74%) of
70 lesions referred for surgical excision had docu-
mented surgical outcomes. Among 90 lesions re-
ferred for mammographic surveillance, 10 (11%)
were resolved at the time of the study, 49 (54%)
were on track toward 3-year lesion stability, 21
(23%) were being followed up elsewhere, four
(4%) were lost to physicians, and six (7%) were lost
to follow-up for other reasons. Follow-up requires a
substantial commitment of time and resources, but is
necessary for patient care and to improve our under-
standing of the false-negative rate of percutaneous
core biopsy of the breast.
Future directions
Percutaneous biopsy has revolutionized breast
diagnosis, but further work is needed. Future studies
should include evaluation of new technology with
respect to safety, accuracy, and cost-effectiveness;
optimization of choice of biopsy method for different
lesions; long-term follow-up studies; and develop-
ment of technology for MRI-guided breast biopsy.
With this additional study, percutaneous biopsy may
afford even more women a less invasive, less expen-
sive alternative to surgery for the histologic diagnosis
of breast lesions.
Acknowledgment
The author thanks David C. Perlman for his
invaluable support.
References
[1] Liberman L. Clinical management issues in percutane-
ous core breast biopsy. Radiol Clin N Am 2000;38(4):
791–807.
[2] Liberman L. Percutaneous image-guided core breast
biopsy: State of the art at the millennium. AJR 2000;
174:1191–9.
[3] Dowlatshahi K, Yaremko ML, Kluskens LF, Jokich
PM. Nonpalpable breast lesions: findings of stereotaxic
needle-core biopsy and fine-needle aspiration cytology.
Radiology 1991;181:745–50.
[4] Dronkers DJ. Stereotaxic core biopsy of breast lesions:
correlation of stereotaxic large-core needle biopsy and
surgical biopsy results. Radiology 1992;188:631–4.
[5] Elvecrog EL, Lechner MC, Nelson MT. Nonpalpable
breast lesions: correlation of stereotaxic large-core
needle biopsy and surgical biopsy results. Radiology
1993;188:453–5.
[6] Gisvold JJ, Goellner JR, Grant CS, Donohue JH,
Sykes MW, Karsell PR, et al. Breast biopsy: a com-
parative study of stereotaxically guided core and ex-
cisional techniques. AJR 1994;162:815–20.
[7] Parker SH, Jobe WE, Dennis MA, Stavros AT, Johnson
KK, Yakes WF, et al. US-guided automated large-
core breast biopsy. Radiology 1993;187:507–11.
[8] Parker SH, Lovin JD, Jobe WE, Burke BJ, Hopper KD,
Yakes WF. Nonpalpable breast lesions: stereotactic
automated large-core biopsies. Radiology 1991;180:
403–7.
[9] Parker SH, Lovin JD, Jobe WE, Luethke JM, Hopper
KD, Yakes WF, et al. Stereotactic breast biopsy with a
biopsy gun. Radiology 1990;176:741–7.
[10] Welle GJ, Clark M, Loos S, Pauls D, Warden D,
Sheffield M, et al. Stereotactic breast biopsy: recumbent
biopsy using add-on upright equipment. AJR 2000;
175:59–63.
[11] Parker SH, Dennis MA, Jobe WE, Hendrick RE.
Clinical efficacy of digital stereotaxic mammography
[abstract]. Radiology 1993;189:326.
[12] Liberman L, Feng TL, Dershaw DD, Morris EA,
Abramson AF. Ultrasound-guided core breast biopsy:
utility and cost-effectiveness. Radiology 1998;208:
717–23.
[13] Meyer JE, Smith DN, Lester SC, Kaelin C, DiPiro PJ,
Denison CM, et al. Large-core needle biopsy of non-
palpable breast lesions. JAMA 1999;281:1638–41.
[14] Rubin E, Dempsey PJ, Pile NS, Bernreuter WK, Urist
MM, Shumate CR, et al. Needle-localization biopsy of
the breast: impact of a selective core needle biopsy
program on yield. Radiology 1995;195:627–31.
[15] Rubin E, Mennemeyer ST, Desmond R, Urist MM,
Waterbor J, Heslin MJ, et al. Reducing the cost of di-
agnosis of breast carcinoma. Cancer 2001;91:324–32.
[16] Smith DN, Darling MLR, Meyer JE, Denison CM,
Rose DI, Lester S, et al. The utility of ultrasonograph-
ically guided large-core needle biopsy: Results from
500 consecutive biopsies. J Ultrasound Med 2001;20:
43–9.
[17] Parker SH, Klaus AJ, McWey PJ, Schilling KJ, Cupples
TE, Duchesne N, et al. Sonographxically guided direc-
tional vacuum-assisted breast biopsy using a handheld
device. AJR 2001;177:405–8.
[18] Perez-Fuentes JA, Longobardi IR, Acosta VF, Marin
CE, Liberman L. Sonographically-guided directional
vacuum-assisted breast biopsy: preliminary experience
in Venezuela. AJR 2001;177:1459–63.
L. Liberman / Radiol Clin N Am 40 (2002) 483–500 497
[19] Simon JR, Kalbhen CL, Cooper RA, Flisak ME. Ac-
curacy and complication rates of US-guided vacuum-
assisted core breast biopsy: initial results. Radiology
2000;215:694–7.
[20] Orel SG, Schnall MD. MR imaging of the breast for
the detection, diagnosis, and staging of breast cancer.
Radiology 2001;220:13–30.
[21] Heywang-Koebrunner SH, Schaumloeffel-Schulze U,
Heinig A, Beck RM, Lampe D, Buchman J. MR-
guided percutaneous vacuum biopsy of breast lesions:
experiences with 100 lesions [abstract]. Radiology
1999;213:289.
[22] Kuhl CK, Morakkabati N, Leutner CC, Schmiedel A,
Wardelmann E, Schild HH. MR imaging-guided large-
core (14-gauge) needle biopsy of small lesions visible
at breast MR imaging alone. Radiology 2001;220:
31–9.
[23] Mumtaz H, Harms SE. Biopsy and intervention work-
ing group report. J Magn Reson Imaging 1999;10:
1010–5.
[24] Burbank F. Mammographic findings after 14-gauge
automated needle and 14-gauge directional, vacuum-
assisted stereotactic breast biopsies. Radiology 1997;
204:153–6.
[25] Kaye MD, Vicinanza-Adami CA, Sullivan ML. Mam-
mographic findings after stereotaxic biopsy of the
breast performed with large-core needles. Radiology
1994;192:149–51.
[26] Lamm RL, Jackman RJ. Mammographic abnormalities
caused by percutaneous stereotactic biopsy of histolog-
ically benign lesions evident on follow-up mammo-
grams. AJR 2000;174:753–6.
[27] Jackman RJ, Burbank F, Parker SH, Evans III WP,
Lechner MC, Richardson TR, et al. Atypical ductal
hyperplasia diagnosed at stereotactic breast biopsy: im-
proved reliability with 14-gauge, directional, vacuum-
assisted biopsy. Radiology 1997;204:485–8.
[28] Parker SH, Burbank F, Jackman RJ, Evans III WP,
Lechner MC, Richardson TR, et al. Percutaneous
large-core breast biopsy: a multi-institutional study.
Radiology 1994;193:359–64.
[29] Jackman RJ, Marzoni FA, Finkelstein SI, Shepard
MJ. Benefits of diagnosing nonpalpable breast cancer
with stereotactic large-core needle biopsy: lower costs
and fewer operations [abstract]. Radiology 1996;
201:311.
[30] Kaufman CS, Delbecq R, Jacobson L. Excising the
reexcision: stereotactic core-needle biopsy decreases
need for reexcision of breast cancer. World Journal
of Surgery 1998;22:1023–8.
[31] Liberman L, LaTrenta LR, Dershaw DD. Impact of
core biopsy on the surgical management of impalpable
breast cancer: another look at margins (letter). AJR
1997;169:1464–5.
[32] Liberman L, LaTrenta LR, Dershaw DD, Abramson
AF, Morris EA, Cohen MA, et al. Impact of core biop-
sy on the surgical management of impalpable breast
cancer. AJR 1997;168:495–9.
[33] Lind DS, Minter R, Steinbach B, Abbit P, Lanier L,
Haigh L, et al. Stereotactic core biopsy reduces the
reexcision rate and the cost of mammographically de-
tected cancer. Journal of Surgical Research 1998;78:
23–6.
[34] Morrow M, Venta L, Stinson T, Bennet C. Prospective
comparison of stereotactic core biopsy and surgical
excision as diagnostic procedures for breast cancer pa-
tients. Ann Surg 2001;233:537–41.
[35] Smith DN, Christian RL, Meyer JE. Large-core needle
biopsy of nonpalpable breast cancers: the impact on
subsequent surgical excisions. Arch Surg 1997;132:
256–9.
[36] Yim JH, Barton P, Weber B, Radford D, Levy J,
Monsees B, et al. Mammographically detected breast
cancer: benefits of stereotactic core versus wire local-
ization biopsy. Ann Surg 1996;223:688–700.
[37] Lee CH, Egglin TIK, Philpotts LE, Mainiero MB, To-
cino I. Cost-effectiveness of stereotactic core needle
biopsy: analysis by means of mammographic findings.
Radiology 1997;202:849–54.
[38] Liberman L, Fahs MC, Dershaw DD, Bonaccio E,
Abramson AF, Cohen MA, et al. Impact of stereotaxic
core biopsy on cost of diagnosis. Radiology 1995;195:
633–7.
[39] Liberman L, Gougoutas CA, Zakowski MF, LaTrenta
LR, Abramson AF, Morris EA, et al. Calcifications
highly suggestive of malignancy: comparison of breast
biopsy methods. AJR 2001;177:165–72.
[40] Liberman L, Sama M. Cost-effectiveness of stereotac-
tic 11-gauge directional vacuum-assisted breast biopsy.
AJR 2000;175:53–8.
[41] Lindfors KK, Rosenquist CJ. Needle core biopsy
guided with mammography: a study of cost effective-
ness. Radiology 1994;190:217–22.
[42] Liberman L, Cody HS, Smolkin JH, Susnik B, Tran
KN, Dershaw DD, et al. Sentinel lymph node biopsy in
nonpalpable breast cancer: factors affecting technical
success [abstract]. Radiology 1999;213:107.
[43] Liberman L, Dershaw DD, Rosen PP, Morris EA, Co-
hen MA, Abramson AF. Core needle biopsy of syn-
chronous ipsilateral breast lesions: impact on treatment.
AJR 1996;166:1429–32.
[44] Liberman L, Smolkin JH, Dershaw DD, Morris EA,
Abramson AF, Rosen PP. Calcification retrieval at ster-
eotactic 11-gauge vacuum-assisted breast biopsy. Radi-
ology 1998;208:251–60.
[45] Burbank F, Parker SH, Fogarty TJ. Stereotactic breast
biopsy: improved tissue harvesting with the mammo-
tome. Am Surg 1996;62:738–44.
[46] BergWA,Krebs TL, Campassi C,Magder LS, Sun CCJ.
Evaluation of 14- and 11-gauge directional, vacuum-
assisted biopsy probes and 14- gauge biopsy guns in a
breast parenchymal model. Radiology 1997;205:
203–8.
[47] Burbank F. Stereotactic breast biopsy: comparison of
14- and 11-gauge mammotome probe performance and
complication rates. Am Surg 1997;63:988–95.
[48] Jackman RJ, Burbank F, Parker SH, Evans WP,
Lechner MC, Richardson TR, et al. Accuracy of
L. Liberman / Radiol Clin N Am 40 (2002) 483–500498

sampling microcalcifications by three stereotactic
breast biopsy methods [abstract]. Radiology 1997;
205:325.
[49] Liberman L, EvansWP, DershawDD, Hann LE, Deutch
BM, Abramson AF, et al. Radiography of microcalcifi-
cations in stereotaxic mammary core biopsy specimens.
Radiology 1994;190:223–5.
[50] Liberman L, Hann LE, Dershaw DD, Morris EA,
Abramson AF, Rosen PP. Mammographic findings
after stereotactic 14-gauge vacuum biopsy. Radiology
1997;203:343–7.
[51] Meyer JE, Smith DN, DiPiro PJ, Denison CM, Frenna
TH, Harvey SC, et al. Stereotactic breast biopsy
of clustered microcalcifications with a directional,
vacuum-assisted device. Radiology 1997;204:575–6.
[52] Reynolds HE, Poon CM, Goulet RJ, Lazaridis CL.
Biopsy of breast microcalcifications using an 11-gauge
directional vacuum-assisted device. AJR 1998;171:
611–3.
[53] Liberman L, Dershaw DD, Glassman J, Abramson AF,
Morris EA, LaTrenta LR, et al. Analysis of cancers not
diagnosed at stereotactic core breast biopsy. Radiology
1997;203:151–7.
[54] Brem RF, Behrndt VS, Sanow L, Gatewood OMB.
Atypical ductal hyperplasia: histologic underestimation
of carcinoma in tissue harvested from impalpable
breast lesions using 11-gauge stereotactically guided
directional vacuum-assisted biopsy. AJR 1999;172:
1405–7.
[55] Burbank F. Stereotactic breast biopsy of atypical ductal
hyperplasia and ductal carcinoma in situ lesions: im-
proved accuracy with a directional, vacuum-assisted
biopsy instrument. Radiology 1997;202:843–7.
[56] Darling MLR, Smith DN, Lester SC, Kaelin C, Selland
DL, Denison CM, et al. Atypical ductal hyperplasia
and ductal carcinoma in situ as revealed by large-core
needle breast biopsy: results of surgical excision. AJR
2000;175:1341–6.
[57] Jackman RJ, Burbank F, Parker SH, EvansWP, Lechner
MC, Richardson TR, et al. Atypical ductal hyperplasia
diagnosed by 11-gauge, directional, vacuum-assisted
breast biopsy: how often is carcinoma found at surgery?
[abstract]. Radiology 1997;205:325.
[58] Jackman RJ, Nowels KW, Shepard MJ, Finkelstein SI,
Marzoni FA. Stereotaxic large-core needle biopsy of
450 nonpalpable breast lesions with surgical correla-
tion in lesions with cancer or atypical hyperplasia.
Radiology 1994;193:91–5.
[59] Liberman L, Cohen MA, Dershaw DD, Abramson
LE, Hann LE, Rosen PP. Atypical ductal hyperplasia
diagnosed at stereotaxic core biopsy of breast lesions:
an indication for surgical biopsy. AJR 1995;164:
1111–3.
[60] Philpotts LE, Shaheen NA, Carter D, Lange RC, Lee
CH. Comparison of rebiopsy rates after stereotactic
core needle biopsy of the breast with 11-gauge vacuum
suction probe versus 14-gauge needle and automatic
gun. AJR 1999;172:683–7.
[61] Leibman AJ, Frager D, Choi P. Experience with breast
biopsies using the Advanced Breast Biopsy Instrumen-
tation system. AJR 1999;172:1409–12.
[62] Berg WA, Nguyen T, Silverberg SG, Ioffe OB. Predic-
tors of benign results at excision after a core breast
biopsy result of atypical ductal hyperplasia (ADH).
[abstract] AJR 2001;176(suppl):44.
[63] Tocino I, Dillon D, Costa J, Philpotts LE, Horvath LJ,
Lee CH. Atypical hyperplasia of the breast diagnosed
by stereotactic core needle biopsy: correlation of mo-
lecular markers with surgical outcome [abstract]. Radi-
ology 1999;213:289.
[64] Jackman RJ, Burbank F, Parker SH, EvansWP, Lechner
MC, Richardson TR, et al. Stereotactic breast biopsy of
nonpalpable lesions: determinants of ductal carcinoma
in situ underestimation rates. Radiology 2001;218:
497–502.
[65] Lee CH, Carter D, Philpotts LE, Couce ME, Horvath
LJ, Lange RC, et al. Ductal carcinoma in situ diag-
nosed with stereotactic core needle biopsy: can inva-
sion be predicted? Radiology 2000;217:466–70.
[66] Liberman L, Dershaw DD, Rosen PP, Giess CS, Cohen
MA, Abramson AF, et al. Stereotaxic core biopsy
of breast carcinoma: accuracy at predicting invasion.
Radiology 1995;194:379–81.
[67] Liberman L, Vuolo M, Dershaw DD, Morris EA,
Abramson AF, LaTrenta LR, et al. Epithelial displace-
ment after stereotactic 11-gauge directional vacuum-
assisted breast biopsy. AJR 1999;172:677–81.
[68] Won B, Reynolds HE, Lazaridis CL, Jackson V. Ster-
eotactic biopsy of ductal carcinoma in situ of the breast
using an 11-gauge vacuum-assisted device: persistent
underestimation of disease. AJR 1999;173:227–9.
[69] Jackman RJ, Nowels KW, Rodriguez-Soto J, Marzoni
FA, Finkelstein SI, Shepard MJ. Stereotactic, auto-
mated, large-core needle biopsy of nonpalpable breast
lesions: false-negative and histologic underestimation
rates after long-term follow-up. Radiology 1999;210:
799–805.
[70] Lee CH, Philpotts LE, Horvath LJ, Tocino I. Follow-up
of breast lesions diagnosed as benign with stereotactic
core-needle biopsy: frequency of mammographic
change and false-negative rate. Radiology 1999;212:
189–94.
[71] Jackman RJ, Marzoni FA. Needle-localized breast bi-
opsy: why do we fail? Radiology 1997;204:677–84.
[72] Liberman L, Drotman MB, Morris EA, LaTrenta LR,
Abramson AF, Zakowski MF, et al. Imaging-histologic
discordance at percutaneous breast biopsy. Cancer
2000;89:2538–46.
[73] Liberman L, Benton CL, Dershaw DD, Abramson AF,
LaTrenta LR, Morris EA. Learning curve for stereo-
tactic breast biopsy: how many cases are enough? AJR
2001;176:721–7.
[74] American College of Radiology. Breast imaging re-
porting and data system (BI-RADS). Reston, (VA):
American College of Radiology; 1995.
[75] Liberman L, Abramson AF, Squires FB, Glassman J,
Morris EA, Dershaw DD. The Breast Imaging Report-
ing and Data System: positive predictive value of
L. Liberman / Radiol Clin N Am 40 (2002) 483–500 499

mammographic features and final assessment catego-
ries. AJR 1998;171:35–40.
[76] Orel SG, Kay N, Reynolds C, Sullivan DC. BI-RADS
categorization as a predictor of malignancy. Radiology
1999;211:845–50.
[77] Liberman L, Dershaw DD, Rosen PP, Cohen MA,
Hann LE, Abramson AF. Stereotaxic core biopsy of
impalpable spiculated breast masses. AJR 1995;165:
551–4.
[78] Liberman L, LaTrenta LR, Van Zee KJ, Morris EA,
Abramson AF, Dershaw DD. Stereotactic core biopsy
of calcifications highly suggestive of malignancy. Ra-
diology 1997;203:673–7.
[79] Sickles EA. Periodic mammographic follow-up of
probably benign lesions: results of 3,184 consecutive
cases. Radiology 1991;179:463–8.
[80] Varas X, Leborgne F, Leborgne JH. Nonpalpable,
probably benign lesions: role of follow-up mammog-
raphy. Radiology 1992;184:409–14.
[81] Brenner RJ, Sickles EA. Surveillance mammography
and stereotactic core breast biopsy for probably benign
lesions: a cost comparison analysis. Acad Radiol 1997;
4:419–25.
[82] Liberman L, Ernberg LA, Heerdt A, Zakowski MF,
Morris EA, LaTrenta LR, et al. Palpable breast masses:
is there a role for percutaneous image-guided core
biopsy? AJR 2000;175:779–87.
[83] Liberman L, Dershaw DD, Rosen PP, Morris EA,
Abramson AF, Borgen PI. Percutaneous removal of
malignant mammographic lesions at stereotactic vac-
uum-assisted biopsy. Radiology 1998;206:711–5.
[84] Burbank F, Forcier N. Tissue marking clip for stereo-
tactic breast biopsy: initial placement accuracy, long-
term stability, and usefulness as a guide for wire
localization. Radiology 1997;205:407–15.
[85] Liberman L, Dershaw DD, Morris EA, Abramson AF,
Thornton CM, Rosen PP. Clip placement after stereo-
tactic vacuum-assisted breast biopsy. Radiology 1997;
205:417–22.
[86] Liberman L. Advanced Breast Biopsy Instrumentation
(ABBI): analysis of published experience [commen-
tary]. AJR 1999;172:1413–6.
[87] Diaz LK, Wiley EL, Venta LA. Are malignant cells
displaced by large-gauge needle core biopsy of the
breast? AJR 1999;173:1303–13.
[88] Berg JW, Robbins GF. A late look at the safety of
aspiration biopsy. Cancer 1962;15:826–7.
[89] Kopans DB, Gallagher WJ, Swann CA, McCarthy KA,
White G, Hall DA, et al. Does preoperative needle
localization lead to an increase in local breast cancer
recurrence? Radiology 1988; 167:667–8.
[90] Lee CH, Chen AM, Haffty BG. Local recurrence of
breast cancer after breast-conservation therapy in pa-
tients diagnosed by stereotactic core needle biopsy.
[abstract] AJR 2001;176(Suppl):44–5.
[91] Dershaw DD, Morris EA, Liberman L, Abramson AF.
Nondiagnostic stereotaxic core breast biopsy: results of
rebiopsy. Radiology 1996;198:323–5.
[92] Meyer JE, Smith DN, Lester SC, DiPiro PJ, Denison
CM, Harvey SC, et al. Large-core needle biopsy: non-
malignant breast abnormalities evaluated with surgical
excision or repeat core biopsy. Radiology 1998;206:
717–20.
[93] Georgian-Smith D, Lawton TJ. Calcifications of lobu-
lar carcinoma in situ of the breast: Radiologic-patho-
logic correlation. AJR 2001;176:1255–9.
[94] Lechner MC, Jackman RJ, Brem RF, Evans WP, Parker
SH, Smid AP. Lobular carcinoma in situ and atypical
lobular hyperplasia at percutaneous biopsy with sur-
gical correlation: a multi-institutional study [abstract].
Radiology 1999;213:106.
[95] Liberman L, Sama M, Susnik B, et al. Lobular carci-
noma in situ at percutaneous breast biopsy: surgical
biopsy findings. AJR 1999;173:291–9.
[96] Philpotts LE, Shaheen NA, Jain KS, Carter D, Lee CH.
Uncommon high-risk lesions of the breast diagnosed at
stereotactic core-needle biopsy: clinical importance.
Radiology 2000;216:831–7.
[97] Reynolds HE. Core needle biopsy of challenging be-
nign breast conditions: a comprehensive literature re-
view. AJR 2000;174:1245–50.
[98] Liberman L, Bracero N, Vuolo M, Dershaw DD,
Morris EA, Abramson AF. Percutaneous large-core
biopsy of papillary breast lesions. AJR 1999;172:
331–7.
[99] Berg WA, Mrose HE, Ioffe OB. Atypical lobular hy-
perplasia or lobular carcinoma in situ at core-needle
breast biopsy. Radiology 2001;218:503–9.
[100] Dahlstrom JE, Jain S, Sutton S. Diagnostic accuracy
of stereotactic core biopsy in a mammographic breast
cancer screening programme. Histopathology 1996;
28:421–7.
[101] Liberman L, Bonaccio E, Hamele-Bena D, Abramson
AF, Cohen MA, Dershaw DD. Benign and malignant
phyllodes tumors: mammographic and sonographic
findings. Radiology 1996;198:121–4.
[102] Jacobs TW, Byrne C, Colditz G, Connolly JL, Schnitt
SJ. Radial scars in benign breast biopsy specimens
and the risk of cancer. N Engl J Med 1999;340:
430–6.
[103] Philpotts LE, Shaheen NA, Jain KS, Carter D, Lee
CH. Uncommon high-risk lesions of the breast diag-
nosed by stereotactic core-needle biopsy: Clinical
Importance. Radiology 2000;216:831–7.
[104] Goodman KA, Birdwell RL, Ikeda DM. Compliance
with recommended follow-up after percutaneous
breast core biopsy. AJR 1998;170:89–92.
[105] Hillner BE, Bear HD, Fajardo LL. Estimating the
cost-effectiveness of stereotaxic biopsy for nonpalpa-
ble breast abnormalities: a decision analysis model.
Acad Radiol 1996;3:351–60.
L. Liberman / Radiol Clin N Am 40 (2002) 483–500500

Breast imaging and the conservative treatment
of breast cancer
D. David Dershaw, MD
Breast Imaging Section, Department of Radiology, Memorial Sloan-Kettering Cancer Center,
1275 York Avenue, New York, NY 10021, USA
When the breast containing cancer is treated by
mastectomy, issues of multifocality and multicen-
tricity of disease are obviated by removal of the
entire breast. When breast conservation is per-
formed, however, it is presumed that residual cancer
may be present postoperatively in the breast and can
be sterilized with postoperative radiation. The suc-
cess of radiation in eradicating residual tumor
depends, at least partially, on the volume of residual
disease within the breast. Therefore, it is necessary
for the breast imager to determine, as accurately as
possible, the extent of disease within the breast
undergoing treatment. After treatment, the breast is
monitored to detect recurrent tumor, if it occurs, at
the earliest stage possible. Additionally, the opposite
breast is screened because of its increased risk of
developing carcinoma.
Whereas the goal of both mastectomy and con-
servation is to cure, conservation also considers the
cosmetic result. Unnecessary biopsy of the treated
breast can compromise cosmesis; therefore, the
breast imager should be able to differentiate the
usual benign sequelae from possible malignant dis-
ease to minimize the likelihood of unnecessary
biopsy. Also, physicians need to understand the
appropriate role of needle biopsy techniques in this
population, sparing these women additional surgery
when possible.
Evidence supporting breast conservation
From 1972 to 1989, six prospective randomized
trials of 4108 women were conducted comparing the
outcome of women with invasive breast carcinoma
treated with breast-conserving surgery and whole-
breast radiation versus mastectomy. Results are
shown in Table 1 [1–6]. Mastectomies performed
were either radical or modified radical mastectomies.
Breast-conserving surgery was classified as local or
wide excision or quadrantectomy. Except for the
Danish Breast Cancer Group, which included women
with stage III tumors, studies included only women
with stage I (Milan I, Gustave-Roussy) or stage I-II
(EORTC, NCI, NSABP B06) breast cancers. All
trials included whole-breast irradiation of 45–50
Gy. Except for the NSABP study, in which no boost
dose was given, conservation treatment in the other
five studies included radiation to the primary tumor
site boosting the total dose at this site to � 60 Gy. In
these trials, there was no significant difference in the
outcomes of women treated with conservation or
mastectomy (Table 1). Patterns of local recurrence
reported in these trials show 3% to 20% recurrence at
3 to 18 years of follow-up.
Multiple single institutions have also reported
retrospective data of their experience with breast con-
servation [7]. Among the 5600 women included in
these studies, 10-year results showed overall survival
rates ranging from 63% to 86%, with disease-free
survival rates ranging from 63% to 74%. Local recur-
rence rates were 8% to 20% at 10 years and 17% to
18% at 15-year follow-up. Again, these data support
the comparable survival rates of women treated with
0033-8389/02/$ – see front matter D 2002, Elsevier Science (USA). All rights reserved.
PII: S0033 -8389 (01 )00003 -3
E-mail address: [email protected] (D.D. Dershaw).
Radiol Clin N Am 40 (2002) 501–516
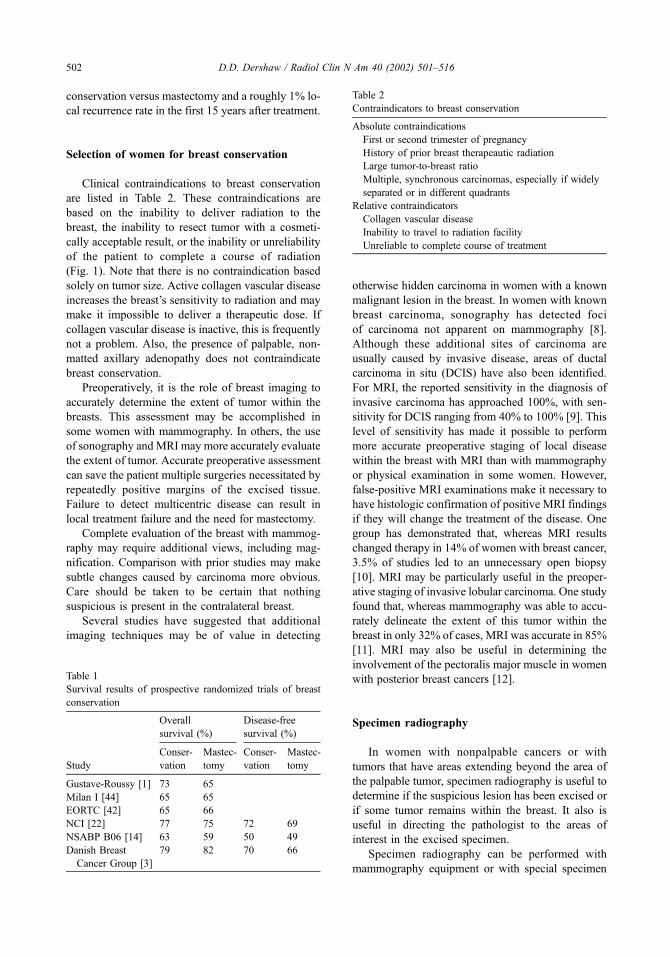
conservation versus mastectomy and a roughly 1% lo-
cal recurrence rate in the first 15 years after treatment.
Selection of women for breast conservation
Clinical contraindications to breast conservation
are listed in Table 2. These contraindications are
based on the inability to deliver radiation to the
breast, the inability to resect tumor with a cosmeti-
cally acceptable result, or the inability or unreliability
of the patient to complete a course of radiation
(Fig. 1). Note that there is no contraindication based
solely on tumor size. Active collagen vascular disease
increases the breast’s sensitivity to radiation and may
make it impossible to deliver a therapeutic dose. If
collagen vascular disease is inactive, this is frequently
not a problem. Also, the presence of palpable, non-
matted axillary adenopathy does not contraindicate
breast conservation.
Preoperatively, it is the role of breast imaging to
accurately determine the extent of tumor within the
breasts. This assessment may be accomplished in
some women with mammography. In others, the use
of sonography and MRI may more accurately evaluate
the extent of tumor. Accurate preoperative assessment
can save the patient multiple surgeries necessitated by
repeatedly positive margins of the excised tissue.
Failure to detect multicentric disease can result in
local treatment failure and the need for mastectomy.
Complete evaluation of the breast with mammog-
raphy may require additional views, including mag-
nification. Comparison with prior studies may make
subtle changes caused by carcinoma more obvious.
Care should be taken to be certain that nothing
suspicious is present in the contralateral breast.
Several studies have suggested that additional
imaging techniques may be of value in detecting
otherwise hidden carcinoma in women with a known
malignant lesion in the breast. In women with known
breast carcinoma, sonography has detected foci
of carcinoma not apparent on mammography [8].
Although these additional sites of carcinoma are
usually caused by invasive disease, areas of ductal
carcinoma in situ (DCIS) have also been identified.
For MRI, the reported sensitivity in the diagnosis of
invasive carcinoma has approached 100%, with sen-
sitivity for DCIS ranging from 40% to 100% [9]. This
level of sensitivity has made it possible to perform
more accurate preoperative staging of local disease
within the breast with MRI than with mammography
or physical examination in some women. However,
false-positive MRI examinations make it necessary to
have histologic confirmation of positive MRI findings
if they will change the treatment of the disease. One
group has demonstrated that, whereas MRI results
changed therapy in 14% of women with breast cancer,
3.5% of studies led to an unnecessary open biopsy
[10]. MRI may be particularly useful in the preoper-
ative staging of invasive lobular carcinoma. One study
found that, whereas mammography was able to accu-
rately delineate the extent of this tumor within the
breast in only 32% of cases, MRI was accurate in 85%
[11]. MRI may also be useful in determining the
involvement of the pectoralis major muscle in women
with posterior breast cancers [12].
Specimen radiography
In women with nonpalpable cancers or with
tumors that have areas extending beyond the area of
the palpable tumor, specimen radiography is useful to
determine if the suspicious lesion has been excised or
if some tumor remains within the breast. It also is
useful in directing the pathologist to the areas of
interest in the excised specimen.
Specimen radiography can be performed with
mammography equipment or with special specimen
Table 1
Survival results of prospective randomized trials of breast
conservation
Overall
survival (%)
Disease-free
survival (%)
Study
Conser-
vation
Mastec-
tomy
Conser-
vation
Mastec-
tomy
Gustave-Roussy [1] 73 65
Milan I [44] 65 65
EORTC [42] 65 66
NCI [22] 77 75 72 69
NSABP B06 [14] 63 59 50 49
Danish Breast
Cancer Group [3]
79 82 70 66
Table 2
Contraindicators to breast conservation
Absolute contraindications
First or second trimester of pregnancy
History of prior breast therapeautic radiation
Large tumor-to-breast ratio
Multiple, synchronous carcinomas, especially if widely
separated or in different quadrants
Relative contraindicators
Collagen vascular disease
Inability to travel to radiation facility
Unreliable to complete course of treatment
D.D. Dershaw / Radiol Clin N Am 40 (2002) 501–516502
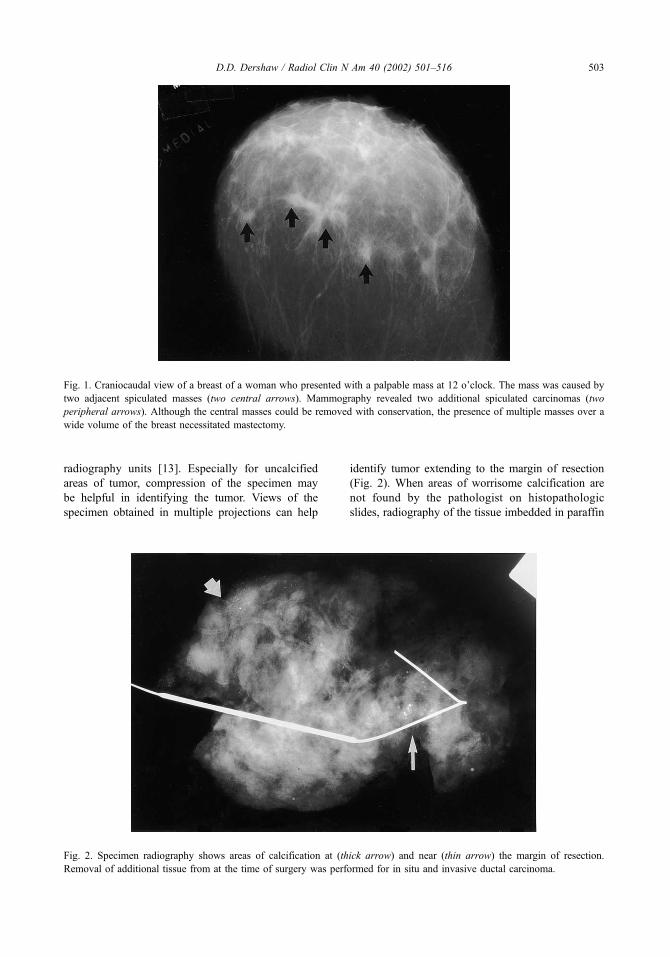
radiography units [13]. Especially for uncalcified
areas of tumor, compression of the specimen may
be helpful in identifying the tumor. Views of the
specimen obtained in multiple projections can help
identify tumor extending to the margin of resection
(Fig. 2). When areas of worrisome calcification are
not found by the pathologist on histopathologic
slides, radiography of the tissue imbedded in paraffin
Fig. 1. Craniocaudal view of a breast of a woman who presented with a palpable mass at 12 o’clock. The mass was caused by
two adjacent spiculated masses (two central arrows). Mammography revealed two additional spiculated carcinomas (two
peripheral arrows). Although the central masses could be removed with conservation, the presence of multiple masses over a
wide volume of the breast necessitated mastectomy.
Fig. 2. Specimen radiography shows areas of calcification at (thick arrow) and near (thin arrow) the margin of resection.
Removal of additional tissue from at the time of surgery was performed for in situ and invasive ductal carcinoma.
D.D. Dershaw / Radiol Clin N Am 40 (2002) 501–516 503

can assist in locating foci of calcification that have
not been sliced and stained so that additional slides of
these areas can be prepared (Fig. 3).
At the time that the specimen radiograph is
interpreted, the preoperative mammogram should be
available so that the mammographic characteristics of
the carcinoma can be compared with the findings on
the specimen radiograph. Areas of architectural dis-
tortion and asymmetry can be difficult to appreciate
on specimen radiography, and the specimen radio-
graph is least useful for tumors presenting with these
imaging characteristics [14]. The specimen radio-
graph should be examined while the patient is still
in surgery. Absence of the area of suspicion should
result in the removal of more tissue to successfully
biopsy the suspicious lesion. Extension of tumor
mass or calcifications to the margin of the specimen
suggests that tumor has been transected. Removal of
more tissue from that margin of the biopsy cavity is
appropriate to obtain negative margins at the time of
the original surgical procedure. The excised specimen
can be marked with surgical clips to orient the
Fig. 3. Biopsy was performed in this patient for suspicious calcifications that could not be identified on initial examination of the
pathology specimen. Radiography of tissue slices allowed the pathologist to identify the sites of calcification (arrows), which
were caused by ductal carcinoma in situ.
D.D. Dershaw / Radiol Clin N Am 40 (2002) 501–516504
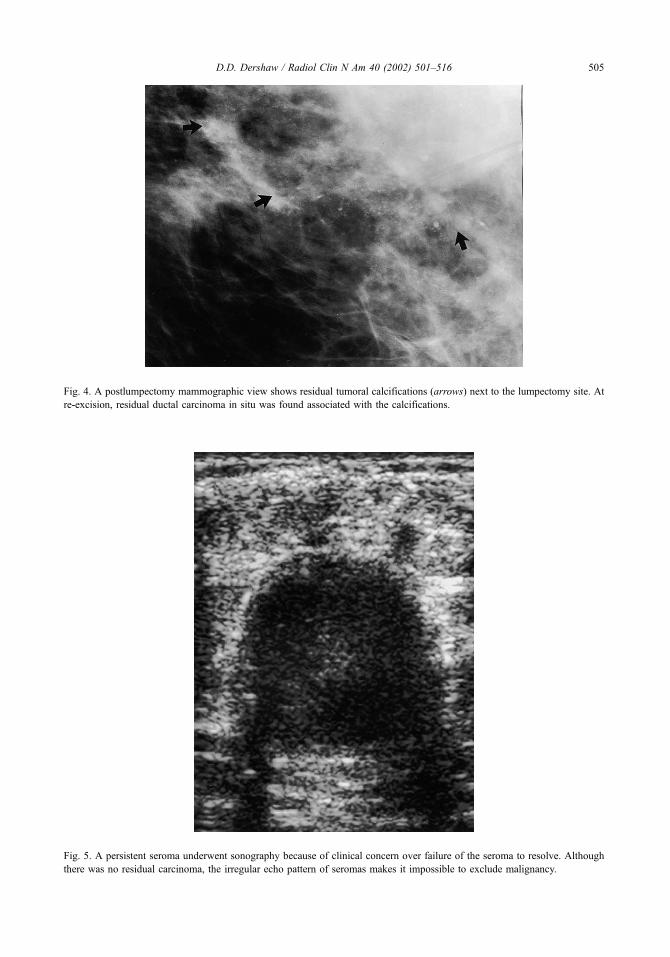
Fig. 4. A postlumpectomy mammographic view shows residual tumoral calcifications (arrows) next to the lumpectomy site. At
re-excision, residual ductal carcinoma in situ was found associated with the calcifications.
Fig. 5. A persistent seroma underwent sonography because of clinical concern over failure of the seroma to resolve. Although
there was no residual carcinoma, the irregular echo pattern of seromas makes it impossible to exclude malignancy.
D.D. Dershaw / Radiol Clin N Am 40 (2002) 501–516 505
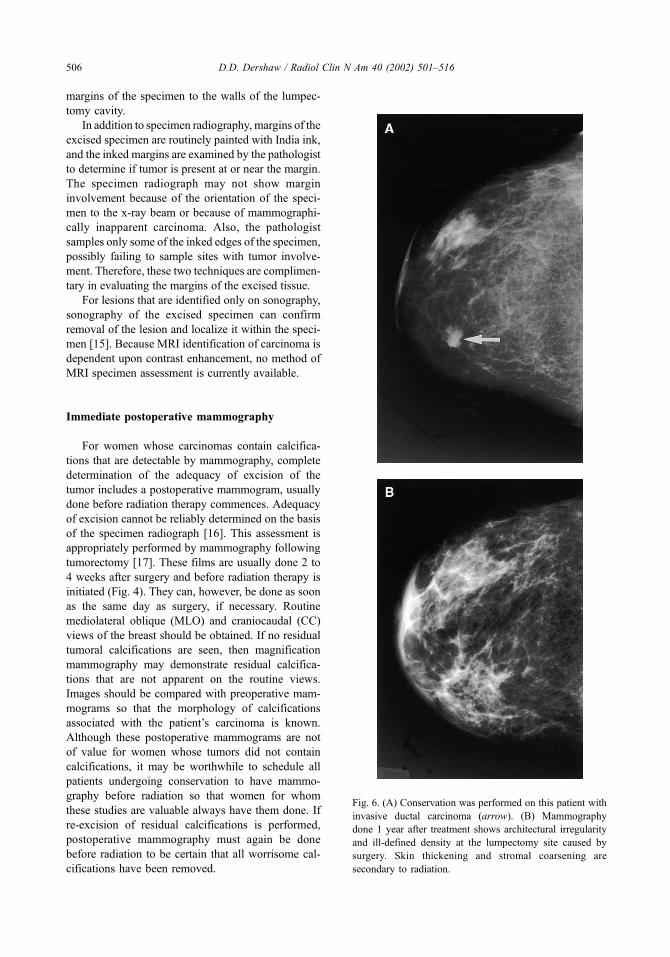
margins of the specimen to the walls of the lumpec-
tomy cavity.
In addition to specimen radiography, margins of the
excised specimen are routinely painted with India ink,
and the inked margins are examined by the pathologist
to determine if tumor is present at or near the margin.
The specimen radiograph may not show margin
involvement because of the orientation of the speci-
men to the x-ray beam or because of mammographi-
cally inapparent carcinoma. Also, the pathologist
samples only some of the inked edges of the specimen,
possibly failing to sample sites with tumor involve-
ment. Therefore, these two techniques are complimen-
tary in evaluating the margins of the excised tissue.
For lesions that are identified only on sonography,
sonography of the excised specimen can confirm
removal of the lesion and localize it within the speci-
men [15]. Because MRI identification of carcinoma is
dependent upon contrast enhancement, no method of
MRI specimen assessment is currently available.
Immediate postoperative mammography
For women whose carcinomas contain calcifica-
tions that are detectable by mammography, complete
determination of the adequacy of excision of the
tumor includes a postoperative mammogram, usually
done before radiation therapy commences. Adequacy
of excision cannot be reliably determined on the basis
of the specimen radiograph [16]. This assessment is
appropriately performed by mammography following
tumorectomy [17]. These films are usually done 2 to
4 weeks after surgery and before radiation therapy is
initiated (Fig. 4). They can, however, be done as soon
as the same day as surgery, if necessary. Routine
mediolateral oblique (MLO) and craniocaudal (CC)
views of the breast should be obtained. If no residual
tumoral calcifications are seen, then magnification
mammography may demonstrate residual calcifica-
tions that are not apparent on the routine views.
Images should be compared with preoperative mam-
mograms so that the morphology of calcifications
associated with the patient’s carcinoma is known.
Although these postoperative mammograms are not
of value for women whose tumors did not contain
calcifications, it may be worthwhile to schedule all
patients undergoing conservation to have mammo-
graphy before radiation so that women for whom
these studies are valuable always have them done. If
re-excision of residual calcifications is performed,
postoperative mammography must again be done
before radiation to be certain that all worrisome cal-
cifications have been removed.
Fig. 6. (A) Conservation was performed on this patient with
invasive ductal carcinoma (arrow). (B) Mammography
done 1 year after treatment shows architectural irregularity
and ill-defined density at the lumpectomy site caused by
surgery. Skin thickening and stromal coarsening are
secondary to radiation.
D.D. Dershaw / Radiol Clin N Am 40 (2002) 501–516506

Completeness of tumor excision cannot be deter-
mined on the basis of these images. Although all
tumoral calcifications may have been excised, resid-
ual, uncalcified tumor can be present in the breast
[18]. The presence of this tumor can be suggested by
positive histologic margins of the lumpectomy speci-
men. Also, because benign and malignant processes
containing calcifications can coexist, the presence of
residual calcifications, particularly when they are few
in number and not of BI-RADS 5 type, can be caused
Fig. 7. Postoperative seromas at the lumpectomy may take long periods to involute. (A) Preoperative mammography shows a
small invasive ductal carcinoma (arrow) in the lateral aspect of this breast. (B) Mammogram done 1 year later shows clips at the
surgical site, surrounding ill-defined density that is centrally caused by a seroma. (C) Mammogram 2 years after surgery shows
partial involution of the seroma.
D.D. Dershaw / Radiol Clin N Am 40 (2002) 501–516 507
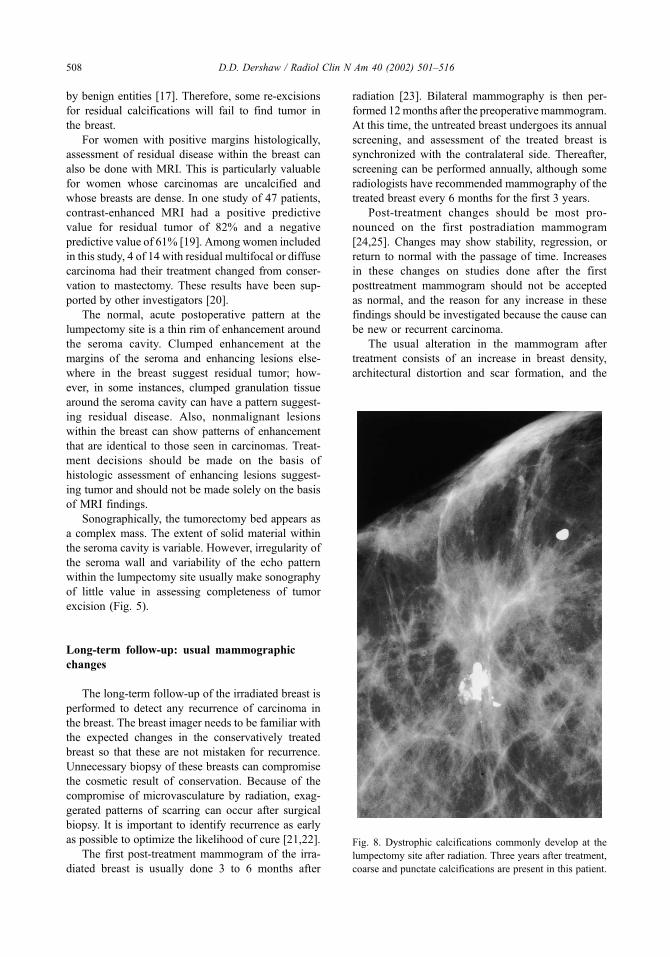
by benign entities [17]. Therefore, some re-excisions
for residual calcifications will fail to find tumor in
the breast.
For women with positive margins histologically,
assessment of residual disease within the breast can
also be done with MRI. This is particularly valuable
for women whose carcinomas are uncalcified and
whose breasts are dense. In one study of 47 patients,
contrast-enhanced MRI had a positive predictive
value for residual tumor of 82% and a negative
predictive value of 61% [19]. Among women included
in this study, 4 of 14 with residual multifocal or diffuse
carcinoma had their treatment changed from conser-
vation to mastectomy. These results have been sup-
ported by other investigators [20].
The normal, acute postoperative pattern at the
lumpectomy site is a thin rim of enhancement around
the seroma cavity. Clumped enhancement at the
margins of the seroma and enhancing lesions else-
where in the breast suggest residual tumor; how-
ever, in some instances, clumped granulation tissue
around the seroma cavity can have a pattern suggest-
ing residual disease. Also, nonmalignant lesions
within the breast can show patterns of enhancement
that are identical to those seen in carcinomas. Treat-
ment decisions should be made on the basis of
histologic assessment of enhancing lesions suggest-
ing tumor and should not be made solely on the basis
of MRI findings.
Sonographically, the tumorectomy bed appears as
a complex mass. The extent of solid material within
the seroma cavity is variable. However, irregularity of
the seroma wall and variability of the echo pattern
within the lumpectomy site usually make sonography
of little value in assessing completeness of tumor
excision (Fig. 5).
Long-term follow-up: usual mammographic
changes
The long-term follow-up of the irradiated breast is
performed to detect any recurrence of carcinoma in
the breast. The breast imager needs to be familiar with
the expected changes in the conservatively treated
breast so that these are not mistaken for recurrence.
Unnecessary biopsy of these breasts can compromise
the cosmetic result of conservation. Because of the
compromise of microvasculature by radiation, exag-
gerated patterns of scarring can occur after surgical
biopsy. It is important to identify recurrence as early
as possible to optimize the likelihood of cure [21,22].
The first post-treatment mammogram of the irra-
diated breast is usually done 3 to 6 months after
radiation [23]. Bilateral mammography is then per-
formed 12months after the preoperative mammogram.
At this time, the untreated breast undergoes its annual
screening, and assessment of the treated breast is
synchronized with the contralateral side. Thereafter,
screening can be performed annually, although some
radiologists have recommended mammography of the
treated breast every 6 months for the first 3 years.
Post-treatment changes should be most pro-
nounced on the first postradiation mammogram
[24,25]. Changes may show stability, regression, or
return to normal with the passage of time. Increases
in these changes on studies done after the first
posttreatment mammogram should not be accepted
as normal, and the reason for any increase in these
findings should be investigated because the cause can
be new or recurrent carcinoma.
The usual alteration in the mammogram after
treatment consists of an increase in breast density,
architectural distortion and scar formation, and the
Fig. 8. Dystrophic calcifications commonly develop at the
lumpectomy site after radiation. Three years after treatment,
coarse and punctate calcifications are present in this patient.
D.D. Dershaw / Radiol Clin N Am 40 (2002) 501–516508
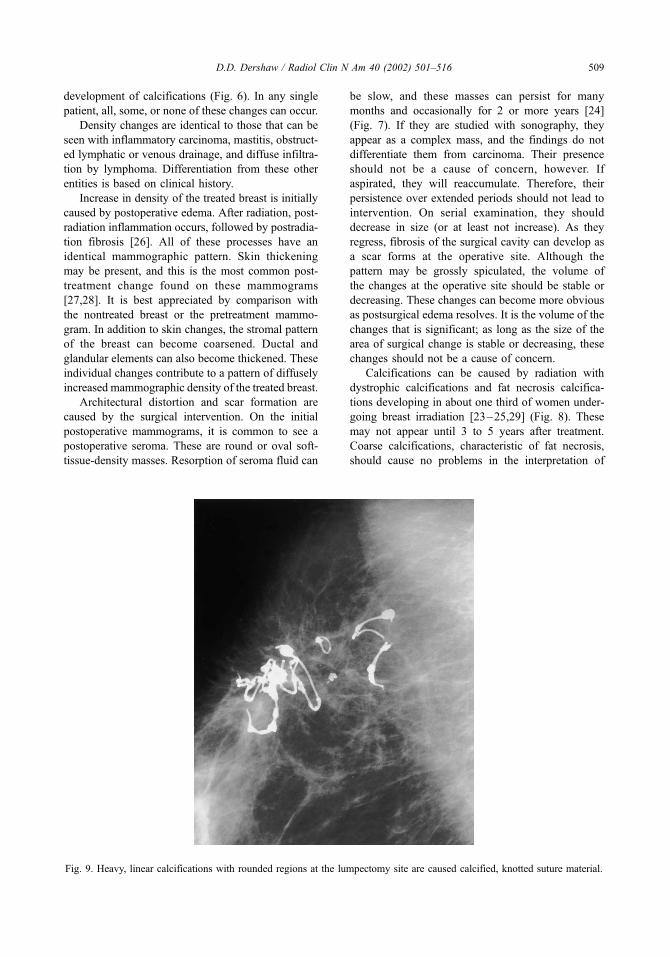
development of calcifications (Fig. 6). In any single
patient, all, some, or none of these changes can occur.
Density changes are identical to those that can be
seen with inflammatory carcinoma, mastitis, obstruct-
ed lymphatic or venous drainage, and diffuse infiltra-
tion by lymphoma. Differentiation from these other
entities is based on clinical history.
Increase in density of the treated breast is initially
caused by postoperative edema. After radiation, post-
radiation inflammation occurs, followed by postradia-
tion fibrosis [26]. All of these processes have an
identical mammographic pattern. Skin thickening
may be present, and this is the most common post-
treatment change found on these mammograms
[27,28]. It is best appreciated by comparison with
the nontreated breast or the pretreatment mammo-
gram. In addition to skin changes, the stromal pattern
of the breast can become coarsened. Ductal and
glandular elements can also become thickened. These
individual changes contribute to a pattern of diffusely
increased mammographic density of the treated breast.
Architectural distortion and scar formation are
caused by the surgical intervention. On the initial
postoperative mammograms, it is common to see a
postoperative seroma. These are round or oval soft-
tissue-density masses. Resorption of seroma fluid can
be slow, and these masses can persist for many
months and occasionally for 2 or more years [24]
(Fig. 7). If they are studied with sonography, they
appear as a complex mass, and the findings do not
differentiate them from carcinoma. Their presence
should not be a cause of concern, however. If
aspirated, they will reaccumulate. Therefore, their
persistence over extended periods should not lead to
intervention. On serial examination, they should
decrease in size (or at least not increase). As they
regress, fibrosis of the surgical cavity can develop as
a scar forms at the operative site. Although the
pattern may be grossly spiculated, the volume of
the changes at the operative site should be stable or
decreasing. These changes can become more obvious
as postsurgical edema resolves. It is the volume of the
changes that is significant; as long as the size of the
area of surgical change is stable or decreasing, these
changes should not be a cause of concern.
Calcifications can be caused by radiation with
dystrophic calcifications and fat necrosis calcifica-
tions developing in about one third of women under-
going breast irradiation [23–25,29] (Fig. 8). These
may not appear until 3 to 5 years after treatment.
Coarse calcifications, characteristic of fat necrosis,
should cause no problems in the interpretation of
Fig. 9. Heavy, linear calcifications with rounded regions at the lumpectomy site are caused calcified, knotted suture material.
D.D. Dershaw / Radiol Clin N Am 40 (2002) 501–516 509
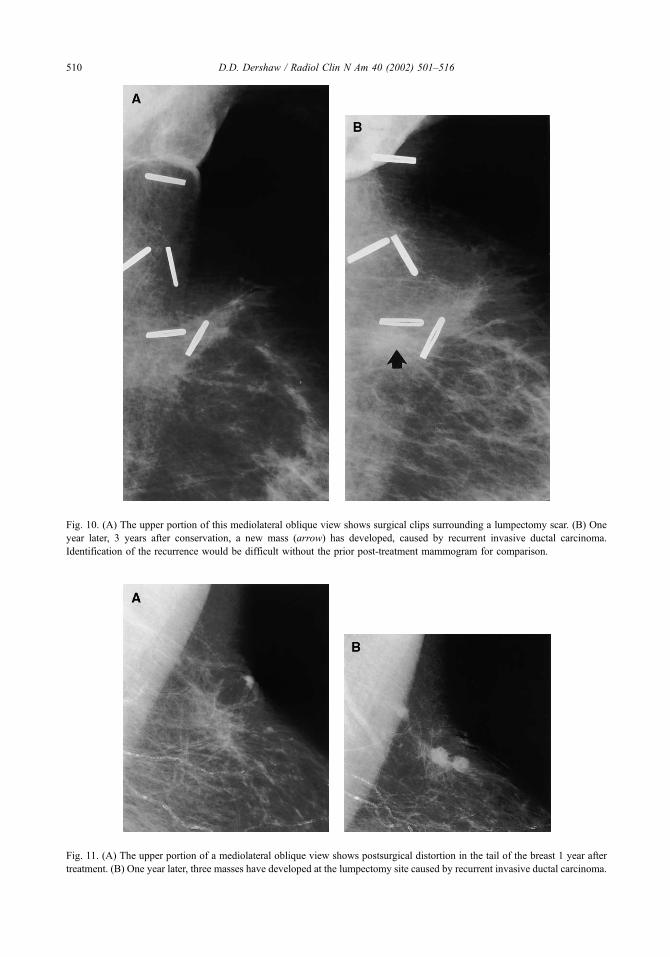
Fig. 10. (A) The upper portion of this mediolateral oblique view shows surgical clips surrounding a lumpectomy scar. (B) One
year later, 3 years after conservation, a new mass (arrow) has developed, caused by recurrent invasive ductal carcinoma.
Identification of the recurrence would be difficult without the prior post-treatment mammogram for comparison.
Fig. 11. (A) The upper portion of a mediolateral oblique view shows postsurgical distortion in the tail of the breast 1 year after
treatment. (B) One year later, three masses have developed at the lumpectomy site caused by recurrent invasive ductal carcinoma.
D.D. Dershaw / Radiol Clin N Am 40 (2002) 501–516510

mammograms of these patients. Calcified suture
material and surgical clips at the lumpectomy site
can also be seen (Fig. 9). These are also not a cause of
concern. The development of pleomorphic micro-
calcifications within the breast, however, raises the
possibility of local treatment failure. Their workup is
addressed in the following section.
Local treatment failure
Recurrence of carcinoma in the treated breast
occurs at a constant rate of 1% to 2% per year during
the first 2 to 8 years after treatment [30,31]. Local
recurrence rates of 5% to 10% at 5 years and 10% to
15% at 10 years for adequately treated cancers should
be expected. Women who are at increased risk for
local treatment failure include those with positive
margins [32,33], those not treated with radiation
[34], those with multiple cancers in the breast at the
time of initial presentation [35], and those whose
tumors have an extensive intraductal component
without a large negative surgical margin [36]. Some
also believe that those who are treated at a young age
are at greater risk for recurrence [37]; however, the
possibility of recurrent tumor exists in any breast
previously treated with conservation.
Local treatment failure that occurs within the first
5 to 7 years after treatment is most likely to be located
at or near the site of the original cancer [38,39]; it is
caused by recurrence of the original carcinoma that
was not fully eradicated. The greatest tumor burden
within the breast is usually near the site of the original
carcinoma, and the ability of radiation to sterilize the
tumor is related to tumor volume. Therefore, if tumor
cells are present in the breast after radiation, they are
Fig. 12. Six years after treatment for invasive ductal carcinoma, new microcalcifications (arrows) developed in the region of
coarse, fat necrosis calcifications at the site of prior lumpectomy. Biopsy revealed ductal carcinoma in situ.
D.D. Dershaw / Radiol Clin N Am 40 (2002) 501–516 511

most likely present at the site of the original carci-
noma. Local failure after 5 years is commonly caused
by carcinomas growing elsewhere in the breast. Small
tumors present within the breast that were undetected
at the time of treatment of the original cancer are
usually sterilized by postoperative radiation. There-
fore, growth of tumor outside the area of the original
cancer requires that new tumors form and grow for a
long enough time to become detectable.
Because of this pattern of recurrence, the breast
imager should attempt to include the entire site of
lumpectomy on follow-up mammograms, especially
in the first decade after treatment. This often requires
additional views beyond the routine MLO and CC
views. Routine magnification of the lumpectomy bed
is not necessary unless there are findings on non-
magnification views that warrant magnification [40].
If the surgeon has placed clips around the lumpec-
tomy cavity at the time of tumorectomy, identification
of all of these clips on the mammographic images is
helpful in documenting that the lumpectomy site has
been completely examined. It is helpful to establish
which extra views are needed on the first posttreat-
ment mammogram and to include these on all follow-
up studies, which makes it possible to compare the
size of the scar and other changes in the same
projection on serial examinations.
The ability of mammography to detect local recur-
rence is compromised by the presence of postoper-
ative distortion and increased density of the irradiated
breast. Mammography is able to detect only two thirds
of recurrences [23,38]. Therefore, the physical exami-
nation is of increased importance in detecting tumor
within the conservatively treated breast, and subtle
findings on physical examination should be carefully
correlated with subtle changes on mammography.
Patterns of recurrence on mammography are
generally those findings that are suspicious for car-
cinoma in the nonirradiated breast superimposed on
findings of lumpectomy and radiation. These include
suspicious microcalcifications and new masses not
caused by a simple cyst (Figs. 10, 11). Inflamma-
Fig. 13. An axillary view shows adenopathy (arrow) in the low axilla. This was new 5 years after conservation and was caused
by an axillary recurrence.
D.D. Dershaw / Radiol Clin N Am 40 (2002) 501–516512

tory recurrences can appear as diffusely increas-
ing breast density. Subtle or obvious enlargement
of the lumpectomy scar also can herald recurrent
carcinoma [38].
Calcifications that are associated with recurrences
tend to be highly suspicious (BI-RADS 5 category)
(Fig. 12) [41,42]. Less worrisome calcifications can
sometimes indicate the presence of recurrent tumor,
however. Recurrent DCIS is almost always indicated
by the development of microcalcifications. Detecting
these microcalcifications on mammography was
found to be the method of detecting recurrence in
92% of DCIS recurring as pure DCIS [43]. If an
immediate postoperative mammogram has not been
obtained for women whose cancers contain mammo-
Fig. 14. (A) Five years after conservation, this view of a
lumpectomy bed had been stable over several years,
showing unchanged architectural distortion and fat necrosis.
(B) One year later, a new mass (arrow) was evident near the
lumpectomy bed. Biopsy showed only fat necrosis.
Fig. 15. Sonography was performed for this woman with a
questionable new mass near her scar. (A) Sonogram of the
scar shows an angulated, spiculated, echo-poor shadowing
mass. (B) The palpable mass near the scar has similar
sonographic characteristics. It was caused by recurrent
carcinoma. Differentiation of scar and recurrence based on
their echo pattern is not possible.
D.D. Dershaw / Radiol Clin N Am 40 (2002) 501–516 513

graphically evident microcalcifications, the signifi-
cance of microcalcifications at the lumpectomy site
on the first post-treatment mammogram cannot be
determined. These can be caused by residual tumor or
recurrent disease or may indicate decreasing tumor
that is responding to treatment.
Although enlarging axillary nodes can appear
acutely postoperatively and are reactive, the presence
of axillary nodal enlargement later after treatment can
be caused by an axillary recurrence (Fig. 13). It is
necessary to determine the reason for developing
adenopathy. This might require biopsy, often done
using fine needle aspiration.
Benign sequelae resembling recurrent tumor
Fat necrosis and other dystrophic changes caused
by radiation can resemble tumor recurrence. Other
entities, such as sclerosing adenosis, can also occur
and produce findings that are also worrisome for new
or recurrent carcinoma. It is important to determine the
cause of these findings, without surgical intervention if
possible. When necessary for a definitive diagnosis,
however, surgical biopsy should be performed.
The characteristic pattern of fat necrosis is that it
develops at or near the lumpectomy site, usually
approximately 2 years after treatment. Because
enlargement of the surgical scar is a sign of recur-
rence, findings on physical examination and mam-
mography are suspicious for cancer (Fig. 14). MRI
may assist in the differentiation between scar and
recurrence. Because postoperative scarring is avascu-
lar after 18 months and recurrent breast carcinoma,
especially if invasive, is hypervascular, recurrences
will enhance with gadolinium on MRI, and enlarging
areas of fibrosis are generally nonenhancing [44,45].
Stereotactic core biopsy of suspicious areas has also
been demonstrated to be accurate in differentiating
scar from recurrence [46].
Sonographically, scars and carcinoma usually are
hypoechoic and ill defined (Fig. 15). The differentia-
tion of the two using sonography is therefore not
possible; however, sonography can be useful in
guiding needle biopsy of suspicious areas. Some have
also found it to be of value in following the size of
scars that are located in areas of the breast that are
difficult to fully image with mammography.
Summary
Breast conservation, where appropriate, offers
effective treatment for breast cancer while preserving
the breast. The increased use of mammographic
screening has led to increased detection of small,
curable breast cancers that are amenable to breast-
conserving surgery. Mammography and other imag-
ing modalities, such as sonography and MRI, assist in
the determination of the appropriateness of breast
conservation and in the differentiation of recurrence
from benign sequelae of treatment.
References
[1] Arriagada R, Le MG, Rochard F, et al. Conservative
treatment versus mastectomy in early breast cancer:
patterns of failure with 15 years of follow-up data.
Institut Gustave-Roussy Breast Cancer Group. J Clin
Oncol 1996;14:1558–64.
[2] Blichert-Toft M, Rose C, Anderson JA, et al. Danish
randomized trial comparing breast conservation ther-
apy with mastectomy: six years of life-table analysis. J
Natl Cancer Inst Monogr 1992;11:19–25.
[3] Fisher B, Anderson S, Redmond CK, et al. Reanalysis
and results after 12 years of follow-up in a randomized
clinical trial comparing total mastectomy with lumpec-
tomy with or without irradiation in the treatment of
breast cancer. N Engl J Med 1995;33:1456–61.
[4] Jacobson JA, Dandorth DN, Cowan KH, et al. Ten-
year results of a comparison of conservation with mas-
tectomy in the treatment of stage I and II breast cancer.
N Engl J Med 1995;332:907–11.
[5] van Dongen JA, Voogd AC, Fentiman IS, et al. Long-
term results of a randomized trial comparing breast-
conserving therapy with mastectomy: European Organ-
ization for Research and Treatment of Cancer 10801
trial. J Natl Cancer Inst 2000;92:1143–50.
[6] Veronesi U, Salvadori B, Luini A, et al. Conservative
treatment of early breast cancer: long-term results
of 1232 cases treated with quadrantectomy, axillary
dissection, and radiotherapy. Ann Surg 1990;211:
250–9.
[7] Winchester DP, Cox JD. Standards for breast-conser-
vation treatment. CA Cancer J Clin 1992;42:134–62.
[8] Berg WA, Gilbreath PL. Multicentric and multifocal
cancer: whole-breast US in preoperative evaluation.
Radiology 2000;214:59–66.
[9] Orel SG. High-resolution MR imaging for the detec-
tion, diagnosis, and staging of breast cancer. Radio-
graphics 1998;18:903–12.
[10] Fischer U, Kopka L, Grabbe E. Breast carcinoma:
effect of preoperative contrast-enhanced MR imaging
on the therapeutic approach. Radiology 1999;213:
881–8.
[11] Rodenko GN, Harms SE, Pruneda IM, et al. MR imag-
ing in the management before surgery of lobular carci-
noma of the breast: correlation with pathology. AJR
1996;167:1415–9.
[12] Morris EA, Schwartz LH, Drotman MB, et al. Eval-
uation of pectoralis major muscle in patients with
D.D. Dershaw / Radiol Clin N Am 40 (2002) 501–516514

posterior breast tumors on breast MR images: early
experience. Radiology 2000;214:67–72.
[13] Dershaw DD. Evaluation of the breast undergoing
lumpectomy and radiation therapy. Rad Clin N Am
1995;33:1147–60.
[14] Stomper PC, David SP, Sonnenfeld MR, et al. Efficacy
of specimen radiography of clinically occult non-calci-
fied breast lesions. AJR 1988;151:43–7.
[15] Fornage BD, Ross MI, Singletary SE, et al. Localiza-
tion if impalpable breast masses: value of sonography
in the operating room and scanning of excised speci-
mens. AJR 1994;163:569–73.
[16] Lee CH, Carter D. Detecting residual tumor after exci-
sional biopsy of impalpable breast carcinoma: efficacy
of comparing preoperative mammograms with radio-
graphs of the biopsy specimen. AJR 1995;164:81–6.
[17] Gluck BS, Dershaw DD, Liberman L, et al. Microcal-
cifications on postoperative mammograms as an indi-
cator of adequacy of tumor excision. Radiology
1993;188:469–72.
[18] Homer MJ, Schmidt-Ullrich R, Safaii H, et al. Residual
breast carcinoma after biopsy: role of mammography
in evaluation. Radiology 1989;170:75–7.
[19] Orel SG, Reynolds C, Schnall MD, et al. Breast carci-
noma: MR imaging before re-excision. Radiology
1997;205:429–36.
[20] Soderstrom CE, Harms SE, Farrell Jr RS, et al. Detec-
tion with MR imaging of residual tumor in the breast
soon after surgery. AJR 1997;168:485–8.
[21] Kurtz JM, Amalric R, Brandone H, et al. Local recur-
rence after breast-conserving surgery and radiotherapy:
frequency, time course and prognosis. Cancer 1989;63:
1912–7.
[22] Solin LJ, Fourquet A, Vincini FA, et al. Salvage
treatment for local recurrence after breast-conserving
surgery and radiation as initial treatment for mam-
mographically detected ductal carcinoma in situ of
the breast. Cancer 2001;91:1090–7.
[23] Dershaw DD. Mammography in patients with breast
cancer treated by breast conservation (lumpectomy
with or without radiation). AJR 1995;164:309–16.
[24] Brenner RJ, Pfaff JM. Mammographic features after
conservation therapy for malignant breast disease: se-
rial findings standardized by regression analysis. AJR
1996;167:171–8.
[25] Dershaw DD, Shank B, Reisinger S. Mammographic
findings after breast cancer treatment with local exci-
sion and definitive irradiation. Radiology 1987;164:
455–61.
[26] Schnitt SJ, Connolly JL, Harris JR, et al. Radiation
induced changes in the breast. Hum Pathol 1984;15:
545–50.
[27] Buckley JH, Roebuch EJ. Mammographic changes fol-
lowing radiotherapy. Br J Radiol 1986;59:337–44.
[28] Libshitz HI, Montague ED, Paulus DD. Skin thickness
in the therapeutically irradiated breast. AJR 1978;130:
345–7.
[29] Vora SA, Wazer DE, Homer MJ. Management of
microcalcifications that develop at the lumpectomy
site after breast conservation. Radiology 1997;203:
667–71.
[30] Dewarz JA, Arriagada R, Benhamou S, et al. (for the
IGR Breast Cancer Group). Local relapse and con-
tralateral tumor rates in patients with breast cancer
treated with conservative surgery and radiotherapy
(Institut Gustave-Roussy 1970–1982). Cancer 1995;
765:2260–5.
[31] Stotter AT, McNeese MD, Ames FC, et al. Predicting
the rate and extent of locoregional failure after breast
conservation therapy for early breast cancer. Cancer
1989;64:2217–25.
[32] Gage I, Schnitt SJ, Nixon AJ, et al. Pathologic margin
involvement and the risk of recurrence in patients trea-
ted with breast-conserving therapy. Cancer 1996;78:
1921–8.
[33] Peterson ME, Schultz DJ, Reynolds C, et al. Outcomes
in breast cancer patients relative to margin status after
treatment with breast-conserving surgery and radiation
therapy: the University of Pennsylvania experience. Int
J Radiat Oncol Biol Phys 1999;43:1029–35.
[34] McCormick B. Radiation and local control in early
invasive breast cancer. Breast J 1999;5:330–4.
[35] Leopold KA, Recht A, Schnitt SJ, et al. Results of
conservative surgery and radiation therapy for multiple
synchronous cancers of one breast. Int J Radiat Oncol
Biol Phys 1989;16:11–6.
[36] Zafrani B, Viehl P, Fourquet A, et al. Conservative
treatment of early breast cancer: prognostic value of
the ductal in situ component and other pathological
variables on local control and survival. Long-term re-
sults. Eur J Cancer Clin Oncol 1989;25:1645–50.
[37] Halverson KJ, Perez CA, Taylor ME, et al. Age as a
prognostic factor for breast and regional node recur-
rence following breast conserving surgery and irradia-
tion in stage I and II breast cancer. Int J Radiat Oncol
Biol Phys 1993;27:1045–50.
[38] Dershaw DD, McCormick B, Osborne MR. Detection
of local recurrence after conservative therapy for breast
carcinoma. Cancer 1992;70:493–6.
[39] Recht A, Silver B, Harris JR. The patterns of failure
within the treated breast following primary radiation
therapy [abstract]. Int J Radiat Oncol Biol Phys 1984;
10(suppl 2):79.
[40] DiPiro PJ, Meyer JE, Shaffer K, et al. Usefulness of the
routine magnification view after breast conservation
therapy for carcinoma. Radiology 1996;198:341–3.
[41] Orel SG, Troupin RH, Patterson EA, et al. Breast can-
cer recurrence after lumpectomy and irradiation: role of
mammography in detection. Radiology 1992;183:
201–6.
[42] Dershaw DD, McCormick B, Cox L, et al. Differentia-
tion of benign and malignant local tumor recurrence
after lumpectomy. AJR 1990;155:35–8.
[43] Liberman L, Van Zee KJ, Dershaw DD, et al. Mammo-
graphic features of local recurrence in women who
have undergone breast-conserving therapy for ductal
carcinoma in situ. AJR 1997;168:489–93.
[44] Gilles R, Guinebretiere JM, Shapeero LG, et al. As-
D.D. Dershaw / Radiol Clin N Am 40 (2002) 501–516 515

sessment of breast cancer recurrence with contrast-
enhanced subtraction MR imaging: preliminary results
in 26 patients. Radiology 1993;188:473–8.
[45] Dao TH, Rahmouni A, Campana F, et al. Tumor re-
currence versus fibrosis in the irradiated breast: differ-
entiation with dynamic gadolinium-enhanced MR
imaging. Radiology 1993;187:751–5.
[46] Liberman L, Dershaw DD, Durfee S, et al. Recurrent
carcinoma after breast conservation: diagnosis with
stereotaxic core biopsy. Radiology 1995;197:735–8.
D.D. Dershaw / Radiol Clin N Am 40 (2002) 501–516516

Breast imaging: a breast surgeon’s perspective
Kimberly J. Van Zee, MD
The Breast Service, Department of Surgery, Memorial Sloan-Kettering Cancer Center,
1275 York Avenue, New York, NY 10021, USA
The patient presenting with a lesion detected by
screening exam
A patient whose screening mammogram reveals an
abnormality is often referred to a surgeon who treats
diseases of the breast. The surgeon thus becomes the
treating clinician for a radiologic finding. The surgeon
is highly dependent upon the radiologist’s ability to
communicate his or her findings from the mammo-
gram. A thorough description of the abnormality—
including the type (eg, calcifications, mass, distortion),
descriptive characteristics (eg, punctate versus pleo-
morphic calcifications or well circumscribed versus
spiculated mass), size, location (eg, quadrant, distance
from nipple), and level of suspicion—is necessary if
the surgeon is to have a clear understanding of the
ramifications of the finding. Ideally, as the surgeon
reviews the written report describing themammogram,
he or she is able to inspect the actual film. Often,
however, the patient will arrive without the films. In
such cases, having a complete description greatly
facilitates the surgeon’s understanding of the finding
and communication with the patient.
I have found that the adoption of the Breast
Imaging Reporting and Data System (BI-RADSTM)
[1] lexicon, discussed by Liberman and Menell in
this volume [2], has greatly improved clear commu-
nication regarding level of suspicion for a lesion. By
means of this straightforward system of five numeric
assessment categories, the radiologist succinctly con-
veys to the surgeon an abundance of information.
As a result, the surgeon can appropriately discuss
with the patient the likelihood of malignancy and the
need for biopsy.
Noting the size, location, and type of lesion is also
very useful to the surgeon. In the patient referred with
an abnormal mammogram, knowledge of these
characteristics assists in determining whether any
physical examination findings correlate with the
mammographic findings. In a patient with a palpable
mass, a correlative mammogram or sonogram done
after the mass is marked by the surgeon can deter-
mine whether the radiologic abnormality corresponds
to the palpable one.
Given the widespread adoption of percutaneous
image-guided breast biopsy [3], a comment by the
radiologist regarding the feasibility of percutaneous
biopsy under stereotactic or ultrasound guidance is
also greatly appreciated. With this information, the
appropriate biopsy modality can be recommended.
In women with dense breasts and at high risk for
breast cancer by virtue of a prior personal history of
breast cancer, lobular carcinoma in situ, atypical
ductal hyperplasia, or because of a strong family
history of breast cancer, screening with sonography
[4] and MRI [5] is becoming increasingly common,
as discussed by Gordon [6] and Morris [7]. As with
mammography, a careful description of all relevant
findings helps the surgeon in his/her communication
with the patient. In experienced hands, sonography
and MRI of high-risk women may have an acceptable
false-positive rate and can occasionally detect cancer
that is nonpalpable and mammographically occult.
The patient presenting with a physical finding
The radiologist can also play a very important role
in the assessment of a patient presenting to the
surgeon with a finding on physical exam. Mammo-
graphic, sonographic, and/or MRI evaluation can
0033-8389/02/$ – see front matter D 2002, Elsevier Science (USA). All rights reserved.
PII: S0033 -8389 (01 )00006 -9
E-mail address: [email protected] (K.J. Van Zee).
Radiol Clin N Am 40 (2002) 517–520

often support or change the surgeon’s impression of a
palpable mass. Percutaneous core biopsy under ultra-
sound guidance can be helpful for tissue diagnosis in
women with palpable lumps, particularly if the lump
is deep, mobile, or vaguely palpable; ultrasound-
guided core biopsy in this setting can spare surgery
in women with benign disease and can expedite
treatment in women with breast cancer [3].
In the case of nipple discharge, the location of the
causative lesion can usually be identified by galac-
tography. Duct imaging can be of great utility to the
surgeon attempting to do a precise and accurate duct
excision for diagnosis [8]. In patients with nipple
discharge in whom a galactogram is unsuccessful,
MRI may be helpful in localizing the causative lesion
and in suggesting the presence of malignancy [9].
Image-guided biopsy
Probably the greatest change in the radiologist’s
contribution to the diagnosis of breast cancer has
been that effected by the widespread adoption of
image-guided core biopsy under stereotactic or ultra-
sound guidance, as discussed in this volume by
Liberman [3]. This technique represents a minimally
invasive method of obtaining breast tissue for histo-
logic diagnosis and has markedly changed the algo-
rithm used in the diagnosis of breast abnormalities.
The use of image-guided core biopsy has reduced the
number of surgical biopsies performed and has
increased the number of breast cancers that can be
treated with one surgical procedure. Through the
widespread use of this technique, many women are
now able to discuss surgical options with their
surgeon following a definitive diagnosis of breast
cancer but prior to any surgery.
In a patient undergoing stereotactic biopsy for
calcifications, communication of the findings of
specimen radiography and the postbiopsy mammo-
gram is very useful. Also, in patients in whom all
calcifications are removed, placement of a clip
greatly facilitates subsequent surgical excision should
histologic examination reveal malignancy [3]. In
these patients, knowing that no residual calcifications
remain after stereotactic biopsy also allows the
patient to forego the usual postoperative mammo-
gram to document removal of all calcifications.
The patient with breast cancer
In the patient with biopsy-proven breast cancer,
or in a patient whose physical or mammographic
findings are highly suspicious (BI-RADSTM cate-
gory 5), the radiologist makes important contribu-
tions to patient management.
In a patient with a relatively large mass or area of
calcifications, I often discuss the feasibility of breast
conservation with my radiologic colleagues while
reviewing the films. Sometimes the physical exami-
nation findings can underestimate or overestimate the
extent of disease, and radiologic findings can guide
one to a more appropriate treatment plan. In recent
years, sonography has played a larger role in the
characterization of palpable masses [10], and size
estimation by sonography may be better than that
by physical exam or mammography.
For women who are considering breast conserva-
tion, it is important to scrutinize the mammogram for
evidence of other sites of carcinoma in the ipsilateral
or contralateral breast. Sonography may identify
additional sites of disease that are mammographically
occult, altering surgical management [11]. MRI is
also being used more frequently in assessing extent of
disease, especially in women with dense breast tissue
and in those with infiltrating lobular carcinoma
[7]. Likewise, in women with positive margins after
attempted wide excision, MRI may be helpful in the
assessment of residual disease [12].
In patients with a radiologically detected non-
palpable lesion, preoperative localization is utilized.
While mammographic localization has been used for
many years, sonographic and MRI localization are
now also used. At our institution, localization is
performed with a thin hooked wire that has a 2-cm
reinforced portion. Ideally, the reinforced portion is
placed through the lesion so that, if the tissue sur-
rounding the reinforced portion and the hook of the
wire is excised, the entire radiologic lesion is resected.
Communication between surgeon and radiologist can
increase the likelihood of complete resection.
The recently developed ability to place a wire
under MRI guidance allows localization of lesions
that are nonpalpable and mammographically occult
but visible on MRI. In spite of the lesion’s being
mammographically occult, I have found that a
mammogram performed after the MRI-guided wire
placement is still helpful in guiding the surgeon
during the excision. The surgical procedure is similar
to that used for excisional biopsy with preoperative
mammographic localization, except that a specimen
radiograph usually does not demonstrate the lesion.
A postoperative MRI may be helpful to confirm
lesion retrieval.
In a patient with a large radiologic abnormality
that is either impalpable or vaguely palpable, it is
often useful to place multiple wires to bracket the
K.J. Van Zee / Radiol Clin N Am 40 (2002) 517–520518

area. This technique utilizes multiple mammograph-
ically or MRI-guided wires to delineate the bounda-
ries of the lesion, thereby increasing the likelihood
that the surgeon will completely excise the entire
lesion and achieve negative margins [13]. This tech-
nique may also be utilized for a mammographic mass
with calcifications extending from it, allowing the
surgeon to excise the mass and calcifications en bloc.
After excision of carcinoma with associated calci-
fications, a postoperative mammogram is generally
obtained, usually no earlier than 2 weeks after surgery.
In the presence of negative histologic margins, the
radiologist assists the surgeon in assessing the com-
pleteness of excision by reporting the presence or
absence of any residual calcifications that could
be associated with residual microscopic disease.
Although this applies to mammographic calcifi-
cations alone, it also applies to masses with associated
calcifications. Because of the high positive predictive
value of residual calcifications in this setting [14],
we generally perform needle localization and re-
excision for residual calcifications if the breast is
being conserved.
The patient with findings suspicious for
local recurrence
In the patient with a history of breast cancer
treated with breast conserving surgery, it is important
to distinguish between postoperative changes and
recurrence, as discussed by Dershaw in this volume
[15]. Having prior films is particularly useful in this
setting. I find it very helpful when their availability or
lack thereof is mentioned in the report because I am
then able to understand the level of concern of the
radiologist or encourage the patient to obtain her prior
films [15].
Magnetic resonance imaging is another tool that
is increasingly used in assessing patients for recur-
rence. Scar tissue that appears dense mammograph-
ically can sometimes be better imaged with MRI,
allowing the breast radiologist greater certainty in
interpretation [7].
In a patient with a history of DCIS treated with
breast conservation, new calcifications on mammog-
raphy raise the possibility of local recurrence. We
have found that, among patients in whom DCIS was
originally associated with mammographic calcifica-
tions, recurrences are usually manifest as calcifica-
tions with the same mammographic pattern and
calcification morphology as the original DCIS [16].
A comment from the radiologist to convey his or her
impression regarding the similarities or differences
between current mammograms and those obtained at
the time of the original DCIS diagnosis is useful to
the surgeon.
New modalities in breast imaging
Patients are interested in learning about new
modalities in breast imaging, as described by Leung
in this volume [17]. Although new techniques show
promise, we emphasize to our patients the proven
value of screening mammography, as discussed by
Lee [18]. We continue to take advantage of mammo-
graphic screening, a method that has been shown to
decrease breast cancer mortality, as we explore new
techniques that may assist in breast cancer detection.
Summary
Many changes have occurred in the past decade in
the imaging of the breast. These improvements have
led to more sensitive and specific breast imaging and
to the widespread use of minimally invasive biopsy
techniques. They have also facilitated a closer work-
ing relationship between breast imager and surgeon
and have contributed greatly to the surgeon’s ability
to optimally diagnose and treat breast cancer.
References
[1] American College of Radiology. Illustrated breast
imaging reporting and data system (BI-RADSTM). Re-
ston, VA: American College of Radiology; 1998.
[2] Liberman L, Menell JH. The Breast Imaging Reporting
and Data System (BI-RADSTM) Lexicon. In: Hricak H,
Liberman L., editors. Women’s imaging: an oncologic
focus. Philadelphia: W.B. Saunders; 2002. Radiol Clin
North Am, in press.
[3] Liberman L. Percutaneous image-guided core breast
biopsy. In: Hricak H, Liberman L, editors. Women’s
imaging: an oncologic focus. Philadelphia: W.B. Sa-
unders; 2002. Radiol Clin North Am, in press.
[4] Kolb TM, Lichy J, Newhouse JH. Occult cancer in
women with dense breasts: detection with screening
US—diagnostic yield and tumor characteristics. Radi-
ology 1998;207:191–9.
[5] Kuhl CK, Schmutzler RK, Leutner CC, Kempe A,
Wardelmann E, Hocke A, et al. Breast MR imaging
screening in 192 women proved or suspected to be
carriers of a breast cancer susceptibility gene: prelimi-
nary results. Radiology 2000;215:267–79.
[6] Gordon PB. Ultrasound for breast cancer screening and
staging. In: Hricak H, Liberman L, editors. Women’s
K.J. Van Zee / Radiol Clin N Am 40 (2002) 517–520 519
imaging: an oncologic focus. Philadelphia: W.B. Sa-
unders; 2002. Radiol Clin North Am, in press.
[7] Morris EA. Breast MRI: evolving roles. In: Hricak H,
Liberman L, editors. Women’s imaging: an oncologic
focus. Philadelphia: W.B. Saunders; 2002. Radiol Clin
North Am, in press.
[8] Van Zee KJ, Ortega Perez G, Minnard E, Cohen MA.
Preoperative galactography increases the diagnostic
yield of major duct excision for nipple discharge. Can-
cer 1998;82:1874–80.
[9] Orel SG, Dougherty CS, Reynolds C, Czerniecki BJ,
Siegelman ES, Schnall MD. MR imaging in patients
with nipple discharge: initial experience. Radiology
2000;216:248–54.
[10] Stavros AT, Thickman D, Rapp CL, Dennis MA,
Parker SH, Sisney GA. Solid breast nodules: use of
sonography to distinguish between benign and malig-
nant lesions. Radiology 1995;196:123–34.
[11] Berg WA, Gilbreath PL. Multicentric and multifocal
cancer: whole-breast US in preoperative evaluation.
Radiology 2000;214:59–66.
[12] Frei KA, Kinkel K, Bonel HM, Lu Y, Esserman LJ,
Hylton NM. MR imaging of the breast in patients with
positive margins after lumpectomy: influence of the
time interval between lumpectomy and MR imaging.
AJR 2001;175:1577–84.
[13] Liberman L, Kaplan JB, Van Zee KJ, Morris EA,
LaTrenta LR, Abramson AF, et al. Bracketing wires
at pre-operative breast needle localization. AJR 2001;
177:565–72.
[14] Gluck B, Dershaw DD, Liberman L, Deutch BM. Mi-
crocalcifications on post-operative mammography as
an indicator of the adequacy of tumor excision. Radi-
ology 1993;188:469–72.
[15] Dershaw DD. Breast imaging and the conservative
treatment of breast cancer. In: Hricak H, Liberman L,
editors. Women’s imaging: an oncologic focus. Phila-
delphia: W.B. Saunders; 2002. Radiol Clin North Am,
in press.
[16] Liberman L, Van Zee KJ, Dershaw DD, Morris EA,
Abramson AF, Samli B. Mammographic features of
local recurrence in women who have undergone
breast-conserving therapy for ductal carcinoma in situ.
AJR 1997;168:495–9.
[17] Leung JWT. New modalities in breast imaging: digital
mammography, positron emission tomography, and
sestamibi scintimammography. In: Hricak H, Liberman
L, editors. Women’s imaging: an oncologic focus. Phil-
adelphia: W.B. Saunders; 2002. Radiol Clin North Am,
in press.
[18] Lee CH. Screening mammography: proven value, con-
tinued controversy. In: Hricak H, Liberman L, editors.
Women’s imaging: an oncologic focus. Philadelphia:
W.B. Saunders; 2002. Radiol Clin North Am, in press.
K.J. Van Zee / Radiol Clin N Am 40 (2002) 517–520520
What do we expect from imaging?
Richard R. Barakat, MD*, Hedvig Hricak, MD, PhD
Academic Office, Gynecology Service, Department of Surgery, Memorial Sloan-Kettering Cancer Center,
1275 York Avenue, New York, NY 10021, USA
The objectives of imaging in gynecologic cancer
include tumor detection, tumor diagnosis, staging,
and follow-up. In addition, monitoring the response
to treatment and differentiating tumor recurrence
from post-treatment changes are important indica-
tions for imaging. In 2002 it is estimated that there
will be 39,300 cases of endometrial cancer, 23,300
cases of ovarian cancer, and 13,000 cases of cervical
cancer [1]. This article reviews the information
required by the practicing gynecologist or gyneco-
logic oncologist before surgery and briefly summa-
rize state-of-the-art imaging in answering clinically
pertinent questions.
Endometrial cancer
Since 1972, carcinoma of the epithelial lining
(endometrium) of the uterine corpus has been the
most common female pelvic malignancy. The Amer-
ican Cancer Society estimates that 39,300 cases will
occur in 2002 in the United States. Carcinoma of the
endometrium is primarily a disease of postmeno-
pausal women, although 25% of the cases occur in
premenopausalwomen, with 5% occurring in women
younger than 40 years of age [2]. In 75% of all cases,
the tumor is confined to the uterine corpus at the time
of diagnosis, and uncorrected survival rates of 75% or
more are expected [3].
The mainstay of treatment for endometrial cancer
is surgery. The majority of these cases are operated
on by the general obstetrician/gynecologist. In some
cases, pelvic lymph node sampling is indicated. This
procedure consists of taking a sample of lymph
nodes taken from the distal common iliac and from
the superior iliac artery and vein. A third sample of
lymphatics is obtained from the group of nodes that
lie along the obturator nerve. For some patients,
para-aortic node sampling is also indicated and can
be performed through a midline peritoneal incision
over the common iliac arteries and aorta. A sample
of lymph nodes is resected along the upper common
iliac vessels on either side and from the lower
portion of the aorta and vena cava. On the left side,
the lymph nodes and lymphatics are slightly poste-
rior to the aorta; on the right side, they lie primarily
in the vena caval fat bed. Unfortunately, many
patients who require lymph node sampling do not
undergo this procedure because the general gynecol-
ogist is not usually trained to perform a lymph node
sampling. Lymph nodes may be palpated, plucked,
or perhaps worst of all ignored. Patients who have
not been comprehensively staged are often subjected
to the morbidity of whole pelvic radiation therapy.
The key, then, is to determine preoperatively which
patients require lymph node sampling so that appro-
priate referral to or intraoperative consultation with a
gynecologic oncologist can be obtained.
The group of patients at greatest risk for nodal
metastases has been identified by the staging studies of
the Gynecologic Oncology Group (GOG) [4]. Pelvic
and para-aortic lymph nodes should be sampled for
the following indications: myometrial invasion,
greater than one half (outer half of myometrium);
regardless of tumor grade, tumor presence in the
isthmus-cervix; adnexal or other extrauterine metasta-
ses; presence of serous, clear-cell, undifferentiated, or
squamous types; and lymph nodes that are visibly or
palpably enlarged. In the GOG study, 46% of the
0033-8389/02/$ – see front matter D 2002, Elsevier Science (USA). All rights reserved.
PII: S0033 -8389 (01 )00002 -1
* Corresponding author.
E-mail address: [email protected] (R.R. Barakat).
Radiol Clin N Am 40 (2002) 521–526

positive para-aortic lymph nodes were enlarged, and
98% of the cases with aortic node metastases came
from patients with positive pelvic nodes, adnexal or
intra-abdominal metastases, or outer one-third myo-
metrial invasion [5]. These risk factors affected only
25% of the patients, yet they yielded most of the
positive para-aortic node patients. Identifying these
patients is crucial because they can achieve long-term
survival with radiation therapy. In the GOG study [6],
37 of 48 patients with positive para-aortic nodes
received postoperative irradiation, and 36% remained
tumor free at 5 years, whereas 13 (72%) of 18 patients
with positive pelvic nodes were disease free at 5 years
after treatment.
How can one identify the high-risk endometrial
cancer patient who requires surgical staging? Preop-
eratively, one knows from the endometrial sampling
procedure if a patient has a poorly differentiated
lesion or a high-risk histologic subtype that requires
pelvic and aortic nodal sampling. The presence of a
tumor in the isthmus or cervix can usually not be
determined by physical examination. Intraoperatively,
one can detect adnexal or peritoneal metastases and
enlarged lymph nodes, although in the GOG study,
only 10% of positive nodes were palpably enlarged.
The depth of myometrial invasion and cervical exten-
sion can be assessed clinically by opening the excised
uterus intraoperatively, preferably away from the
operating table. The clinical impression can be con-
firmed by microscopic frozen section [7]. Doering
and colleagues [8] reported a 91% accuracy rate for
148 patients for determining the depth of myometrial
invasion by gross visual examination of the cut
uterine surface. This is acceptable for a gynecologic
oncologist who can act on the information and
perform the required staging procedure.
The key issue that remains is the preoperative
identification of the high-risk patient who requires
nodal sampling. This is where radiologic imaging can
help the most. Specifically, imaging can predict the
presence of deep myometrial invasion or involvement
of the isthmus-cervix. Ultrasound is used in the
evaluation of stage I disease, with an emphasis on
detecting deep myometrial invasion [9]. A limitation
of ultrsound is suboptimal tissue contrast resolution,
so endometrial carcinoma may have an echogenicity
similar to the surrounding myometrium. As a result,
the reported accuracy for the differentiation of deep
(stage IC) from absent or superficial (stages IA and
IB) myometrial invasion by ultrasound ranges from
69% to 93% [9,10]. Similarly, difficulty in assessing
the depth of myometrial invasion is a major limitation
of computed tomography (CT) [9,10]. The reported
accuracy of CT for detecting myometrial invasion is
58% to 61% [9,11]. Because of difficulties in demar-
cating the anatomic landmarks between the cervix
and uterine corpus on axial imaging planes, CT is
limited in the evaluation of cervical tumor extension.
CT is more useful in advanced disease, by demon-
stration of pelvic sidewall extension, parametrial
invasion, lymph node enlargement, and distant meta-
stases to liver and lung [12]. Magnetic resonance
imaging (MRI) is the preferred modality in deter-
mining the depth of myometrial invasion and cervical
extension [9,12–14]. The use of MRI, with rapid
dynamic scanning after intravenous gadolinium con-
trast medium, significantly improves the assessment
of the depth of myometrial invasion [12]. The re-
ported accuracy of noncontrast MR is 55% to 83%,
compared with 85% to 94% for contrast-enhanced
MR studies [9,10,13,15]. In the evaluation of cervical
extension, the reported MR imaging accuracy ranges
from 91% to 95%. In the evaluation of lymph node
involvement, MRI has an accuracy of 88%, but, like
CT, MRI cannot distinguish between malignant and
hyperplastic nodes [9,11,12].
Cervical cancer
Carcinoma of the uterine cervix is the sixth most
common solid malignant neoplasm in American
women, after carcinoma of the breast, lung, color-
ectum, endometrium, and ovary. The American Can-
cer Society estimates that in 2002 there would be
13,000 new cases of invasive carcinoma of the cervix
in the United States and 4,100 deaths from the
disease [1]. The International Federation of Gynecol-
ogy and Obstetrics (FIGO) staging system is based
on clinical evaluation (inspection, palpation, colpo-
scopy); roentgenographic examination of the chest,
kidneys, and skeleton; and endocervical curettage
and biopsies. Lymphangiograms, arteriograms, CT
findings, MRI, and laparoscopy or laparotomy find-
ings are not used for clinical staging. Suspected
invasion of the bladder or the rectum should be
confirmed by biopsy. Bullous edema of the bladder
and swelling of the mucosa of the rectum are not
accepted as definitive criteria for staging.
As revised by FIGO [6] in 1995, stage Ia1
represents microscopic disease, and any clinically
apparent case is classified as stage IB. Stage IA is
further divided as follows: stage IA1: invasion up to
3 mm deep and 7 mm wide; stage IA2: invasion
between 3 and 5 mm deep and 7 mm wide. Stage IB
will be divided as follows: stage IB1: lesions no
greater than 4 cm in diameter; stage IB2; lesions
greater than 4 cm in diameter. Stage IIA disease
indicates involvement of the upper vagina, and
R.R. Barakat, H. Hricak / Radiol Clin N Am 40 (2002) 521–526522

stage IIB connotes spread beyond the cervix into the
parametria. To be classified as stage IIIB, the tumor
should definitely extend to the lateral pelvic wall,
although fixation is not required. Patients with hydro-
nephrosis or a nonfunctioning kidney ascribed to
extension of the tumor are classified as stage IIIB,
regardless of the pelvic findings. Stage IVA disease
(bladder or rectal invasion) is usually treated with
irradiation, whereas patients with distant metastatic
disease (stage IVB) receive chemotherapy. The crit-
ical distinction for the gynecologic oncologist is
between operable disease, which usually includes
stage IIA and below, and disease that is effectively
treated by radiation therapy (stages IIB – IV).
Although both definitive irradiation and radical oper-
ation are accepted treatments for stages IB and IIA
carcinoma of the cervix, surgery has often been
preferred in young women because of the desire to
preserve ovarian function. In addition, many gyne-
cologists believe that the sexually active patient will
be left with a more functional vagina after a surgical
procedure. The key is to select the right patient for
surgery to avoid the need for postoperative adjuvant
treatment. Patients with certain high-risk features (eg,
positive nodes, positive margins, or parametrial
extension) are now treated with postoperative chemo-
radiation after a recent GOG randomized trial
revealed a 17% improvement in progression-free
survival at 4 years approach [16]. If one could predict
ahead of time which patients had these features, one
could consider treating with radiation therapy to
avoid the combined morbidity of surgery followed
by chemoradiation.
Bulky endocervical tumors and the so-called
‘‘barrel-shaped cervix’’ have a higher incidence of
central recurrence, pelvic and para-aortic lymph
node metastasis, and distant dissemination [17].
The exact definition of a barrel lesion varies, but
most authorities consider lesions > 4 cm to be bulky
(stage IB2). Because of the inability of the intra-
cavitary sources to encompass the entire tumor in a
high-dose volume, larger doses of external radiation
to the whole pelvis, extrafascial hysterectomy, or
both have been advocated to improve therapeutic
results. Keys and colleagues [18], in a prospective,
randomized GOG study, found no significant differ-
ence in the survival of patients treated with irradi-
ation alone or irradiation followed by an extrafascial
hysterectomy. A recent follow-up study GOG trial
[19] revealed a 49% improvement in the risk of
recurrence and a 46% reduction in death for stage
IB2 patients treated with radiation and chemother-
apy followed by surgery, compared with radiation
alone followed by surgery.
Radiographic imaging before surgery should aid
the gynecologic oncologist in determining which
patients might be better treated by up-front chemo-
radiation rather than radical hysterectomy. This
includes patients with occult parametrial extension
and possibly positive pelvic nodes. These patients
will incur the morbidity of postoperative chemora-
diation following surgery and should be treated by
chemoradiation alone without surgery. Patients with
bulky (stage IB2) lesions are best treated by up-front
chemoradiation followed by simple hysterectomy.
The role of preoperative imaging in this group of
patients is to determine which patients have such
lesions so that they won’t undergo radical hysterec-
tomy followed by chemoradiation if the clinical
examination is incorrect [20,21].
Advances in pelvic imaging have improved the
diagnostic accuracy of cervical cancer staging.
Although ultrasound and CT have been used to
supplement clinical staging, MRI has become the
preeminent method for imaging cervical cancer. As
knowledge of cancer risk factors and the value of
cross-sectional imaging have been disseminated,
extended clinical staging utilizing imaging techniques
has developed without having to change the official
FIGO guidelines. In this setting, the use of CT or
MRI has gained wide acceptance in treatment plan-
ning, whereas the use of conventional radiological
examinations (intravenous urogram, barium enema,
and lymphangiography) is decreasing [21,22]. In
particular, the use of lymphangiography in the pre-
treatment evaluation of cancer of the cervix is no
longer recommended [23].
MRI is significantly better than CT in the evalua-
tion of parametrial invasion (MR imaging versus CT
accuracy, 85% to 93% versus 70% to 80%) [21,
22,24]. The presence of a low signal intensity stripe
of peripheral cervical stroma on MRI is 95% specific
in excluding parametrial invasion. The high predictive
value of MRI in determining the absence of para-
metrial invasion is valuable in identifying lesions that
could be surgically resected [21,22,24–26]. Further-
more, MRI is valuable in the evaluation of primary
endocervical lesion in cases where tumor origin
(endometrial versus endocervical) is in question.
MRI is not only valuable in evaluating the cervix
and parametrium but is also beneficial in evaluating
advanced-stage disease. Vaginal invasion (stages IIA
and IIIA) can be identified on MR imaging. Stage IIIB
disease (pelvic wall invasion and/or hydronephrosis)
is demonstrated as high-signal tumor infiltration
within adjacent pelvic musculature. The use of MRI
in the pretreatment evaluation of cervical cancer
results in fewer examinations and net cost savings.
R.R. Barakat, H. Hricak / Radiol Clin N Am 40 (2002) 521–526 523

Epithelial ovarian cancer
With 13,900 deaths expected in 2002, epithelial
ovarian cancer is the leading cause of death from
gynecologic cancer in the United States [1]. The
stage, defined by the extent of disease at diagnosis,
must be determined surgically. Unfortunately, only
23% of patients will present with disease confined to
the ovaries (stage I); 13% will have disease confined
to the pelvis (stage II), and 63% will have advanced
disease (stages III or IV) at presentation. Survival is
closely correlated with stage, with stage I patients
enjoying a 90% 5-year survival compared with 80%
for stage II and only 15% to 20% for stage III.
One of the most important prognostic factors in
epithelial ovarian cancer is the volume of disease that
remains after surgical cytoreduction. Numerous stud-
ies have demonstrated that there is a survival advan-
tage at the time patients with advanced ovarian cancer
undergo ‘‘optimal’’ versus ‘‘suboptimal’’ primary
surgical cytoreduction, or ‘‘debulking’’ [27–29]. Sur-
gical debulking refers to the resection of as much
tumor as possible even if grossly visible tumor is left
behind. The tumor left behind is termed ‘‘residual’’
disease. Because of the sensitivity of ovarian cancer
to chemotherapy, patients with small-volume residual
disease can often be put into long-term remission or
even cured.
Residual disease in patients with ovarian cancer
is quantified by measuring the diameter of the largest
tumor nodule remaining after the debulking surgery.
Patients are said to have undergone ‘‘optimal’’ ver-
sus ‘‘suboptimal’’ cytoreduction on the basis of
residual disease diameter. Various cutoff points
between 0.5 and 3.0 cm have been used for this
division. For those patients who undergo suboptimal
cytoreduction, the survival is equivalent regardless if
they are left with 4-, 5-, 6-, or even 10-cm tumor
nodules [29]. Therefore, surgery offers no survival
benefit to these patients. The current GOG definition
of optimal residual disease status uses 1 cm as a
cutoff point.
The actual percentage of patients with advanced
ovarian cancer who can be successfully cytoreduced
to optimal status varies in the literature from 17% to
87%, with a mean of 35% [30]. The most recent
review of patients with stage III ovarian cancer
operated on primarily at Memorial Sloan-Kettering
Cancer Center between 1995 and 1997 reported an
optimal (< 1 cm residual) cytoreduction rate of 45%
[31]. Therefore, it seems that the majority of patients
with advanced ovarian cancer may undergo a primary
surgical procedure that does not significantly improve
their overall survival.
To date, no preoperative test has been demonstra-
ted to accurately predict optimal versus suboptimal
cytoreduction in patients with advanced ovarian can-
cer. If such a test or group of tests could be identified,
then, as implied above, a significant number of
patients could be spared an unnecessary laparotomy.
Preliminary retrospective studies have evaluated the
ability of preoperative serum CA-125 levels and
preoperative CT scan of the abdomen and pelvis in
predicting optimal versus suboptimal cytoreduction.
In a review of 100 patients with stage III ovarian
cancer operated on at Memorial Sloan-Kettering
Cancer Center, a cutoff value of 500 U/mL for the
preoperative serum CA-125 level was determined to
predict residual status with a sensitivity of 78%, a
specificity of 73%, a positive predictive value of
78%, and a negative predictive value of 73% [31].
Five studies have evaluated the accuracy of CT
scan in predicting residual status. With a total of
188 evaluable patients in these five studies, CT
scan showed a sensitivity of 50% to 92%, a
specificity of 63% to 100%, a positive predictive
value of 61% to 100%, and a negative predictive
value of 75% to 96% [32–36]. These small studies
using retrospective film review have demonstrated
that cross-sectional imaging can also be helpful in
surgical planning (eg, in predicting the need for
sigmoid resection). If an accurate method of pre-
diction could be identified, then patients thought to
have disease not amenable to optimal cytoreduction
could be offered neoadjuvant chemotherapy with
attempted debulking at a later date. Preliminary
studies have demonstrated beneficial results with
this approach [37,38].
Frequently, bulky disease in the upper abdomen
involving the diaphragms, liver, porta-hepatis, spleen,
or suprarenal lymph nodes is cited as the reason that
optimal cytoreduction could not be achieved [39].
Knowledge of disease in these or other sites on the
basis of preoperative CT scan of the abdomen and
pelvis would be useful for surgical planning. It would
help in obtaining appropriate preoperative surgical
consultations and would allow for having the neces-
sary surgical equipment in the operating room.
The concept of residual disease status is based on
the surgeon’s informal measurement of the diameter
of the largest remaining tumor nodule after debulking
surgery [27–31,39]. This measurement is subjective
and not routinely confirmed by any objective means.
Because response to chemotherapy and survival are
clearly linked to size of residual disease, it is impor-
tant to compare the reported intraoperative assessment
of residual disease to that found on postoperative CT
scan of the abdomen and pelvis. This would allow for
R.R. Barakat, H. Hricak / Radiol Clin N Am 40 (2002) 521–526524

a more accurate assessment of disease status before
administering chemotherapy and would more accu-
rately assess patient prognosis. Clearly then, preoper-
ative imaging using CT scan can aid in predicting
which patients may not be amenable to optimal
debulking and which patients may be better served
by neo-adjuvant chemotherapy. In addition, it may
allow for appropriate surgical consultations before
surgery so that the appropriate surgeons are available
to perform the required procedure. Finally, postoper-
ative CT scan may provide objective confirmation of
the surgeon’s assessment of residual disease, allowing
for more accurate determination of prognosis and
proper stratification into clinical trials.
References
[1] Jemal A, Thomas A, Murray T, Thun M. Cancer sta-
tistics, 2002. CA Cancer J Clin 2002;52:23–47.
[2] Gallup DG, Stock RJ. Adenocarcinoma of the endo-
metrium in women 40 years of age or younger. Obstet
Gynecol 1984;64:417–20.
[3] International Federation of Gynecology and Obstetrics.
Annual report on the results of treatment in gyneco-
logic cancer. Stockholm: FIGO; 1985.
[4] Creasman WT, Morrow CP, Bundy BN, Homesley HD,
Graham JE, Heller PB. Surgical pathologic spread pat-
terns of endometrial cancer (a Gynecologic Oncology
Group study). Cancer 1987;60:2035–41.
[5] Morrow CP, Bundy BN, Kumar RJ, Creasman WT,
Heller P, Homesley HD, et al. Relationship between
surgical-pathological risk factors and outcome in clin-
ical Stages I and II carcinoma of the endometrium: a
Gynecologic Oncology Group study. Gynecol Oncol
1991;40:55–65.
[6] Creasman WT. New gynecologic cancer staging. Gy-
necol Oncol 1995;58:157–8.
[7] Malviya VK, Deppe G, Malone Jr JM, Sundareson AS,
Lawrence WD. Reliability of frozen section examina-
tion in identifying poor prognostic indicators in Stage I
endometrial adenocarcinoma. Gynecol Oncol 1989;34:
299–304.
[8] Doering DL, Barnhill DR, Weiser EB, Burke TW,
Woodward JE, Park RC. Intraoperative evaluation of
depth of myometrial invasion in Stage I endometrial
adenocarcinoma. Obstet Gynecol 1989;74:930–3.
[9] Kinkel K, Kaji Y, Yu KK, Segal MR, Lu Y, Powell CB,
et al. Radiologic staging in patients with endometrial
cancer: a meta-analysis. Radiology 1999;212:711–8.
[10] Kim SH, Kim HD, Song YS, Kang SB, Lee HP. De-
tection of deep myometrial invasion in endometrial car-
cinoma: comparison of transvaginal ultrasound, CT,
and MRI. J Comput Assist Tomogr 1995;19:766–72.
[11] Connor JP, Andrews JI, Anderson B, Buller RE. Com-
puted tomography in endometrial carcinoma. Obstet
Gynecol 2000;95:692–6.
[12] Seki H, Takano T, Sakai K. Value of dynamic MR
imaging in assessing endometrial carcinoma involve-
ment of the cervix. AJR 2000;175:171–6.
[13] Frei KA, Kinkel K, Bonel HM, Lu Y, Zaloudek C,
Hricak H. Prediction of deep myometrial invasion in
patients with endometrial cancer: clinical utility of con-
trast-enhanced MR imaging – a meta-analysis and
Bayesian analysis. Radiology 2000;216:444–9.
[14] Ito K, Matsumoto T, Nakada T, Nakanishi T, Fujita N,
Yamashita H. Assessing myometrial invasion by endo-
metrial carcinoma with dynamic MRI. J Comput Assist
Tomogr 1994;18:77–86.
[15] Hardesty LA, Sumkin JH, Nath ME, Edwards RP,
Price FV, Chang TS, et al. Use of preoperative MR
imaging in the management of endometrial carcinoma:
cost analysis. Radiology 2000;215:45–9.
[16] Peters 3rd WA, Liu PY, Barrett RJ, Stock RJ, Monk
JS, Berek JS, Souhami L, Grigsby P, Gordon Jr W,
Alberts DS. Concurrent chemotherapy and pelvic radi-
ation therapy compared with pelvic radiation therapy
alone as adjuvant therapy after radical surgery in high-
risk early-stage cancer of the cervix. J Clin Oncol 2000
Apr;18(8):1606–13.
[17] Fletcher GH. Cancer of the uterine cervix. Janeway
Lecture. Am J Roentgenol Radium Ther Nucl Med
1971;111:225–42.
[18] Keys H, Bundy B, Stehman F, Okagaki T, Gallup D,
Roman L, et al. Adjuvant hysterectomy after radiation
therapy reduces detection of local recurrence in
‘‘bulky’’ stage IB cervical without improving survival:
results of a prospective randomized GOG trial [ab-
stract]. Cancer J Sci Am 1997;3:113–23.
[19] Keys H, Bundy B, Stehman F, Muderspach L, Chafe
W, Suggs C, et al. Cisplatin, radiation, and adjuvant
hysterectomy compare with radiation and adjuvant
hysterectomy for bulky IB cervical carcinoma. N Engl
J Med 1999;340:1154–61.
[20] Manfredi R, Maresca G, Smaniotto D, Greggi S, An-
drulli D, Rabitti C, et al. Cervical cancer response to
neoadjuvant therapy: MR imaging assessment. Radiol-
ogy 1998;209:819–24.
[21] Subak LL, Hricak H, Powell B, Azizi L, Stern JL.
Cervical carcinoma: computed tomography and mag-
netic resonance imaging for preoperative staging. Ob-
stet Gynecol 1995;86:43–50.
[22] Yang WT, Lam WWM, Yu MY, Cheung TH, Metre-
weli C. Comparison of dynamic helical CT and dynam-
ic MR imaging in the evaluation of pelvic lymph nodes
in cervical carcinoma. AJR 2000;175:759–66.
[23] Scheidler J, Heuck AF, Steinborn M, Kimmig R, Re-
iser MF. Parametrial invasion in cervical carcinoma:
evaluation of detection at MR imaging with fat sup-
pression. Radiology 1998;80:209–14.
[24] Hricak H, Powell CB, Yu KK, Washington E, Subak
JL, Stern JL, et al. Invasive cervical carcinoma: role of
MR imaging in pretreatment work-up cost minimiza-
tion and diagnostic efficacy analysis. Radiology 1996;
198:403–9.
[25] Hawighorst H, Schoenberg SO, Knapstein PG, Knopp
R.R. Barakat, H. Hricak / Radiol Clin N Am 40 (2002) 521–526 525
MV, Schaeffer U, Essig M, et al. Staging of invasive
cervical carcinoma and of pelvic lymph nodes by high
resolution MRI with a phased-array coil in comparison
with pathological findings. J Comp Assist Tomography
1998;22:75–81.
[26] Nicolet V, Carigan L, Bourdon F, Prosmanne O. MR
imaging of cervical carcinoma: a practical staging ap-
proach. Radiographics 2000;20:1539–49.
[27] Curtin JP, Malik R, Venkatraman ES, Barakat RR,
Hoskins WJ. Stage IV ovarian cancer: impact of sur-
gical debulking. Gynecol Oncol 1997;64:9–12.
[28] Griffiths CT. Surgical resection of tumor bulk in the
primary treatment of ovarian cancer. Nat Cancer Inst
Monogr 1975;42:101–5.
[29] Hoskins WJ. Epithelial ovarian carcinoma: principles
of primary surgery. Gynecol Oncol 1994;55:S91–6.
[30] Ozols RF, Rubin SC, Thomas G, Robboy S. Epithelial
ovarian cancer. In: Hoskins WJ, Perez CA, Young RC,
editors. Principles and practice of gynecologic oncol-
ogy. 2nd edition. Philadelphia: Lippincott-Raven Pub-
lishers; 1997. p. 919–86.
[31] Chi DS, Venkatraman ES, Masson V, Hoskins WJ. The
ability of preoperative CA-125 to predict optimal pri-
mary tumor cytoreduction in stage III epithelial ovarian
carcinoma. Gynecol Oncol 2000;77:227–31.
[32] Forstner R, Hricak H, Occhipinti PA, Powell CB,
Frankel SD, Stern JL. Ovarian cancer: staging with
CT and MR imaging. Radiology 1995;197:619–26.
[33] Bristow RE, Duska LR, Lambrou NC, Fishman EK,
O’Neill MJ, Trimble EL, et al. A model for predicting
surgical outcome in patients with advanced ovarian
carcinoma using computed tomography. Cancer 2000;
89:1532–40.
[34] Gibbon DG, Kudish B, Rodriguez-Rodriguez L,
Comerci JT, Fultz PJ. CT scan as predictor of subop-
timal cytoreduction [abstract]. Gynecol Oncol 1999;
72:443–527.
[35] Meyer JI, Kennedy AW, Friedman R, Ayoub A,
Zepp RC. Ovarian carcinoma: value of CT in pre-
dicting success of debulking surgery. AJR 1995;165:
875–8.
[36] Nelson BE, Rosenfield AT, Schwartz PE. Preoperaa-
tive abdominopelvic computed tomographic prediction
of optimal cytoreduction in epithelial ovarian carcino-
ma. J Clin Oncol 1993;11:166–72.
[37] Schwartz PE, Rutherford TJ, Chambers JT, Kohorn EI,
Thiel RP. Neoadjuvant chemotherapy for advanced
ovarian cancer: long-term survival. Gynecol Oncol
1999;72:93–9.
[38] Vergote I, De Wever I, Tjalma W, Van Gramberen M,
Decloedt J, van Dam P. Neoadjuvant chemotherapy or
primary debulking surgery in advanced ovarian carci-
noma: a retrospective analysis of 285 patients. Gynecol
Oncol 1998;71:431–6.
[39] Hoskins WJ, McGuire WP, Brady MF, Homesley HD,
Creasman WT, Berman M, et al. The effect of diameter
of largest residual disease on survival after primary
cytoreductive surgery patients with suboptimal residual
epithelial ovarian carcinoma. Am J Obstet Gynecol
1994;170:974–80.
R.R. Barakat, H. Hricak / Radiol Clin N Am 40 (2002) 521–526526

Postmenopausal bleeding: value of imaging
Caroline Reinhold, MDa,b,c,*, Ida Khalili, MDa
aDepartment of Radiology, McGill University Health Center, 1650 Cedar Avenue, Montreal, PQ, H3G 1A4, CanadabDepartment of Gynecology, McGill University Health Center, 1650 Cedar Avenue, Montreal, PQ, H3G 1A4, Canada
cSynarc, Inc., San Francisco, CA, USA
Postmenopausal bleeding is a common clinical
problem accounting for approximately 5% of office
visits to a general gynecologist [1]. Postmenopausal
bleeding has been defined as (1) vaginal bleeding
occurring at least 6 months after complete cessation
of menses in women not on hormonal replacement
therapy (HRT), or (2) noncyclic vaginal bleeding
occurring in postmenopausal women who are receiv-
ing HRT [2]. Abnormal vaginal bleeding may be
caused by a number of gynecologic or nongyneco-
logic disorders. Endometrial atrophy is reported to be
the most common cause of postmenopausal bleeding
[2–4]. Other causes of postmenopausal bleeding
include endometrial hyperplasia, endometrial polyps,
endometrial carcinoma, and submucosal leiomyomas
[2,4]. Although most reports in the clinical literature
indicate that endometrial atrophy is the most common
cause of postmenopausal bleeding, the results of
recent studies with hysterosonography (HSG) indi-
cate that anatomic abnormalities, such as leiomyo-
mata and polyps, are much more common than has
been generally believed [5–9]. In addition, approx-
imately 10% of patients presenting with postmeno-
pausal bleeding are diagnosed with endometrial
carcinoma [4]. A diagnosis of endometrial carcinoma
should be excluded in all women of perimenopausal
or postmenopausal age presenting with abnormal
vaginal bleeding [2]. Intermenstrual and postmeno-
pausal bleeding is the initial symptom in 75% to 90%
of patients with endometrial carcinoma [10,11]. Early
diagnosis and treatment are important because the
5-year survival of patients varies from 90% to 100%
in patients with little or no myometrial involvement,
to 40% to 60% in patients with deep myometrial
invasion [12–15].
This article reviews (1) the relative role of endo-
metrial biopsy procedures and imaging in the evalua-
tion of patients with postmenopausal bleeding, and
(2) the imaging strategies for detecting and diagnos-
ing pathologic conditions of the uterus presenting
with postmenopausal bleeding. A discussion on the
role of imaging in women with a documented diag-
nosis of endometrial cancer is beyond the scope of
this article and is addressed elsewhere in this issue.
Role of diagnostic techniques
Endometrial biopsy procedures
Although dilatation and curettage (D and C) is
generally considered the standard of reference for
obtaining the necessary diagnostic intrauterine path-
ology, support for this assertion in the literature is
lacking. The sensitivity and specificity of D and C are
difficult to assess because few large series confirm
the histology with a subsequent hysterectomy speci-
men. In a series of 512 patients in whom the uteri
were removed immediately after the D and C, endo-
metrial lesions were missed in up to 10% of cases
including 38 endometrial polyps, 4 submucosal fib-
roids, 2 endocervical polyps, 2 placental polyps, and
1 undisturbed pregnancy [16]. For diagnosing endo-
metrial hyperplasia or carcinoma, false-negative rates
ranging from 2% to 6% have been reported [16–19].
0033-8389/02/$ – see front matter D 2002, Elsevier Science (USA). All rights reserved.
PII: S0033 -8389 (01)00008 -2
* Corresponding author. Department of Radiology,
McGill University Health Center, 1650 Cedar Avenue,
Montreal, Quebec, Canada, H3G 1A4.
E-mail address: [email protected]
(C. Reinhold).
Radiol Clin N Am 40 (2002) 527–562

In a study of 50 consecutive patients who underwent
D and C immediately before hysterectomy, Stock
and Kanbour [19] found that in 60% of patients less
than half of the endometrial surface was sampled
and in 16% less than a quarter of the surface was
actually sampled. In addition, as emphasized by Word
et al [16] in a review of over 6000 D and Cs, this
procedure is invasive and may be associated with
complications, such as infection, bleeding, and ute-
rine perforation.
Office-based endometrial sampling procedures,
such as Pipelle and Vabra, have gained widespread
acceptance since the convenience to the patient, lower
complication rate, and cost containment of these
procedures have been firmly established in the
literature [20]. Office biopsy procedures may be
technically impossible in 10% of patients, however,
because of cervical stenosis [21]. In addition, out-
patient endometrial sampling techniques may result
in specimens inadequate for histologic interpretation
in up to 15% of cases [22]. Dubinsky et al [1]
recently reported a 66% false-negative rate for detect-
ing endometrial carcinoma with endometrial biopsy.
Most studies, however, report the sensitivity of endo-
metrial sampling for detecting carcinoma to be 85%
or greater, with the two largest series reporting
sensitivities of 94% and 96%, respectively [22,23].
In general, the sensitivity for diagnosing endometrial
hyperplasia is more modest, ranging from 58% to
86% [18,22,24–29]. None of the series on endome-
trial sampling reported a false-positive diagnosis for
endometrial carcinoma.
Although the accuracy of endometrial sampling
procedures seems to be comparable with D and C for
diagnosing endometrial carcinoma, a lower accuracy
is achieved in the setting of endometrial hyperplasia,
polyps, or submucosal leiomyomas [14,17,18,24,26–
29]. This is clinically relevant, because endometrial
polyps or submucosal myomas have been reported in
up to 90% of patients with recurrent postmenopausal
bleeding [30]. The detection of pedunculated benign
conditions in the uterine cavity is a limitation of all
blind sampling procedures, including D and C. Hys-
teroscopy, which allows direct visualization of the
endometrial cavity, is superior in making an accurate
diagnosis of endometrial polyps and submucosal
myomas [31,32]. Hysteroscopy is, however, an inva-
sive method that carries a small but real risk of
perioperative complication. Because of these limita-
tions, it is generally recommended that a combination
of endovaginal sonography and endometrial sampling
be used in the diagnosis of endometrial disease in
women presenting with postmenopausal bleeding
[28,33–35].
Endovaginal sonography
Endovaginal versus transabdominal sonography
The use of transabdominal sonography in the
detection of endometrial pathology has been well-
documented [11,36–38]. Limited spatial resolution,
obesity, retroflexion, and multiple leiomyomas of the
uterus, however, can make assessment of the endo-
metrial stripe using transabdominal sonography tech-
nically difficult. With the advent of endovaginal
sonography these technical limitations have largely
been overcome. Furthermore, the greater resolution
afforded with the higher-frequency endovaginal probe
can improve the detection of endometrial carcinoma
and other endometrial abnormalities [39–41]. A pro-
spective comparison of endovaginal and transabdo-
minal sonography by Coleman et al [42] reported that
endovaginal scans yielded new information in 60% of
cases and allowed better visualization of pelvic struc-
tures in 22% of cases. The clinical diagnosis was
altered on the basis of endovaginal sonographic find-
ings in 24% of patients and confirmed with certainty
in 72% of patients. The authors believe that any
patient presenting with postmenopausal bleeding
should undergo endovaginal sonography [39,43].
Endometrial thickness
The advent of high-resolution endovaginal probes
has revolutionized the ability to visualize the endo-
metrium sonographically and to detect endometrial
pathology [39–42,44–48]. The use of endovaginal
sonographic measurements of maximal endometrial
thickness, as a predictor of disease in postmeno-
pausal women with bleeding, has recently been
well established in the literature [49]. Large trials
have been conducted to define an endometrial
thickness below which no pathology is found, in
the hopes of using this measurement as a screening
tool in postmenopausal women with abnormal ute-
rine bleeding [7,50–55]. Threshold values ranging
from 4 to 10 mm (double-layer endometrial thick-
ness) have been proposed. The role of endovaginal
sonography is to define a threshold value for
endometrial thickness below which routine histo-
logic sampling cannot be justified, because of a
low posttest probability of disease. Above this
threshold value, however, endometrial sampling is
indicated for the following reasons: (1) a high
posttest probability for endometrial pathology, and
(2) the lack of specificity of endovaginal sonogra-
phy in differentiating benign from malignant causes
of endometrial thickening.
The role of endovaginal sonography in detecting
endometrial cancer and other endometrial abnormal-
C. Reinhold, I. Khalili / Radiol Clin N Am 40 (2002) 527–562528
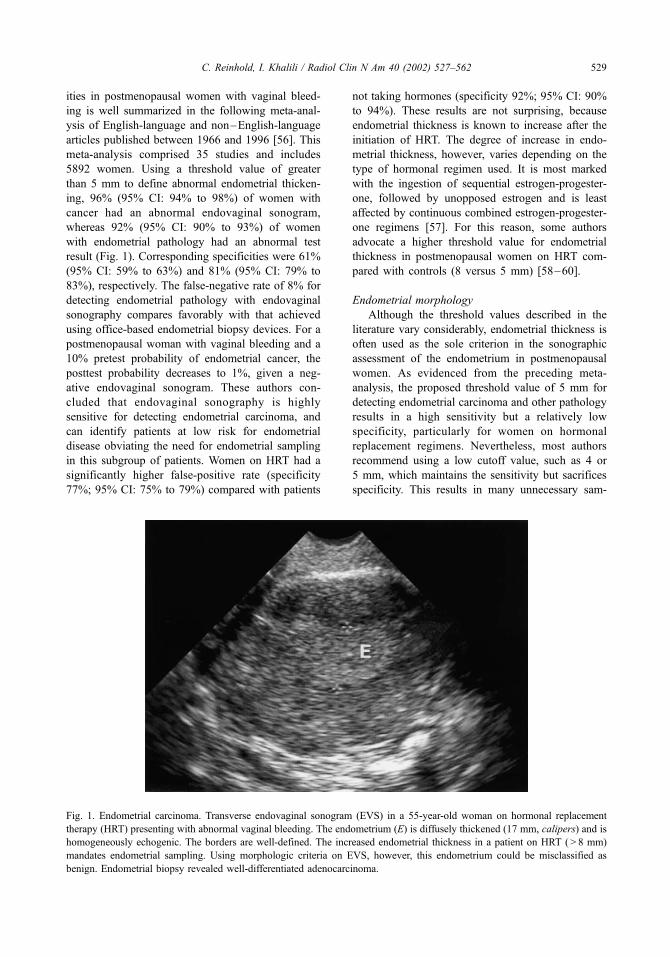
ities in postmenopausal women with vaginal bleed-
ing is well summarized in the following meta-anal-
ysis of English-language and non–English-language
articles published between 1966 and 1996 [56]. This
meta-analysis comprised 35 studies and includes
5892 women. Using a threshold value of greater
than 5 mm to define abnormal endometrial thicken-
ing, 96% (95% CI: 94% to 98%) of women with
cancer had an abnormal endovaginal sonogram,
whereas 92% (95% CI: 90% to 93%) of women
with endometrial pathology had an abnormal test
result (Fig. 1). Corresponding specificities were 61%
(95% CI: 59% to 63%) and 81% (95% CI: 79% to
83%), respectively. The false-negative rate of 8% for
detecting endometrial pathology with endovaginal
sonography compares favorably with that achieved
using office-based endometrial biopsy devices. For a
postmenopausal woman with vaginal bleeding and a
10% pretest probability of endometrial cancer, the
posttest probability decreases to 1%, given a neg-
ative endovaginal sonogram. These authors con-
cluded that endovaginal sonography is highly
sensitive for detecting endometrial carcinoma, and
can identify patients at low risk for endometrial
disease obviating the need for endometrial sampling
in this subgroup of patients. Women on HRT had a
significantly higher false-positive rate (specificity
77%; 95% CI: 75% to 79%) compared with patients
not taking hormones (specificity 92%; 95% CI: 90%
to 94%). These results are not surprising, because
endometrial thickness is known to increase after the
initiation of HRT. The degree of increase in endo-
metrial thickness, however, varies depending on the
type of hormonal regimen used. It is most marked
with the ingestion of sequential estrogen-progester-
one, followed by unopposed estrogen and is least
affected by continuous combined estrogen-progester-
one regimens [57]. For this reason, some authors
advocate a higher threshold value for endometrial
thickness in postmenopausal women on HRT com-
pared with controls (8 versus 5 mm) [58–60].
Endometrial morphology
Although the threshold values described in the
literature vary considerably, endometrial thickness is
often used as the sole criterion in the sonographic
assessment of the endometrium in postmenopausal
women. As evidenced from the preceding meta-
analysis, the proposed threshold value of 5 mm for
detecting endometrial carcinoma and other pathology
results in a high sensitivity but a relatively low
specificity, particularly for women on hormonal
replacement regimens. Nevertheless, most authors
recommend using a low cutoff value, such as 4 or
5 mm, which maintains the sensitivity but sacrifices
specificity. This results in many unnecessary sam-
Fig. 1. Endometrial carcinoma. Transverse endovaginal sonogram (EVS) in a 55-year-old woman on hormonal replacement
therapy (HRT) presenting with abnormal vaginal bleeding. The endometrium (E) is diffusely thickened (17 mm, calipers) and is
homogeneously echogenic. The borders are well-defined. The increased endometrial thickness in a patient on HRT ( > 8 mm)
mandates endometrial sampling. Using morphologic criteria on EVS, however, this endometrium could be misclassified as
benign. Endometrial biopsy revealed well-differentiated adenocarcinoma.
C. Reinhold, I. Khalili / Radiol Clin N Am 40 (2002) 527–562 529

pling procedures being performed not to miss sig-
nificant endometrial pathology. By increasing the
threshold value, the specificity improves, at the cost,
however, of increasing the number of false-negative
examinations. To address this issue, a number of
investigators have recently studied morphologic fea-
tures in addition to measuring endometrial thickness
with the hopes of improving the positive predictive
value of endovaginal sonography.
Weigel et al [61] in 1995 emphasized this point by
publishing an article entitled ‘‘Measuring the thick-
ness—is that all we have to do for sonographic as-
sessment of the endometrium in postmenopausal
women?’’ This group of investigators prospectively
examined 200 patients to ascertain the value of using
morphologic features on gray-scale ultrasound imag-
ing in patients with an endometrial thickness in the
indeterminate range for pathology (3 to 10 mm). These
authors concluded that combining metric and morpho-
logic parameters improved not only the predictability
of pathologic findings, but also the overall accuracy of
the sonographic evaluation. Similar conclusions have
been drawn by Brandner et al [62], who evaluated 221
postmenopausal women with endovaginal sonogra-
phy, including 139 (63%) who presented with abnor-
mal vaginal bleeding. This group of investigators used
various morphologic criteria and endometrial thick-
ness to classify patients as having endometrial atrophy,
proliferative endometria, endometrial hyperplasia or
polyps, or endometrial carcinoma.
Other investigators, however, remain more skep-
tical as to the role of endometrial morphology for
improving the accuracy of endovaginal sonography for
detecting endometrial carcinoma (Fig. 2) [44,63,64].
Hanggi et al [65] studied 203 consecutive women with
endovaginal sonography before a scheduled diagnos-
tic D and C or hysterectomy, of whom 91 presented
with symptoms of postmenopausal bleeding. Criteria
for malignancy on endovaginal sonography included
an endometrial thickness of greater than 5 mm, areas
of decreased echogenicity or heterogeneity, and poor
definition of the endomyometrial junction. Applying
these sonographic criteria, endometrial carcinoma was
diagnosed with a sensitivity of 85%, a specificity of
78%, a positive predictive value of 52%, and a
negative predictive value of 95%. When these results
are compared with those reported using measurements
of endometrial thickness alone, one notes a decrease
in sensitivity from 97% to 85%, with a corresponding
increase in specificity from 61% to 78%. These
observations parallel the authors’ findings in a pro-
spective study of 557 women presenting with post-
menopausal bleeding [64]. Using an endometrial
thickness of greater than 5 mm to define a positive
test result, the authors detected endometrial carcinoma
with a sensitivity of 97% (95% CI: 83% to 100%) and
Fig. 2. Atypical hyperplasia and polyp. Oblique endovaginal sonogram in a 75-year-old woman presenting with postmenopausal
bleeding. There is diffuse endometrial thickening (14 mm) with several small cystic areas. In addition, within the thickened
endometrial complex, there is a poorly defined hypoechoic area (arrows) that is suspicious for a carcinoma in the setting of
endometrial hyperplasia. Endometrial biopsy and subsequent hysterectomy revealed atypical hyperplasia and an endometrial
polyp originating from the ventral wall.
C. Reinhold, I. Khalili / Radiol Clin N Am 40 (2002) 527–562530

a specificity of 47% (95% CI: 42% to 52%). The
addition of morphologic criteria decreased the sensi-
tivity from 97% to 77% (95% CI: 59% to 90%),
however, and resulted in an increase in specificity
from 47% to 84% (95% CI: 80% to 87%).
The addition of morphologic criteria tends to
improve the specificity, however, at the cost of
sensitivity, in effect raising the threshold for detecting
endometrial carcinoma. These results are not surpris-
ing when one considers the following. First, endova-
ginal sonography is unlikely to detect a significant
number of endometrial abnormalities in the setting of
a thin endometrium, defined as a maximal endome-
trial thickness less than or equal to 5 mm. Although
the rate of detection of small endometrial polyps or
early carcinomas is improved with the addition of
HSG, this technique is not routinely used to evaluate
a normal-appearing endometrial complex [66]. Sec-
ond, the risk of falsely classifying a malignant endo-
metrium as benign is not negligible, given the
considerable overlap of morphologic features
between benign and malignant endometrial pathology
(see Fig. 1). Finally, benign and malignant endome-
trial pathology frequently coexist in the same patient.
The decision to emphasize sensitivity versus specif-
icity when evaluating the test performance of endo-
vaginal sonography depends largely on the clinical
indication for performing the test. Because the role of
endovaginal sonography in evaluating patients with
postmenopausal bleeding is primarily to identify
patients who require further evaluation, an abnormal
test result must have a high sensitivity for diagnosing
endometrial carcinoma. Although this diagnostic
pathway has a false-positive rate of 23% [56], this
is considerably less than is obtained if all patients
with postmenopausal bleeding are referred for tissue
diagnosis. Using a combination of endovaginal
sonography and endometrial sampling in evaluating
patients with postmenopausal bleeding has been
demonstrated to be cost effective [56].
Although the decision to obtain histologic tissue is
based primarily on biometric criteria, detailed mor-
phologic information should be obtained during
every endovaginal ultrasound. In particular, a distinc-
tion between diffuse and focal causes of endometrial
thickening should be made whenever possible. Dif-
fuse causes of endometrial thickening on endovaginal
sonography are most often the result of proliferative
change, hyperplasia, or carcinoma, and are accurately
diagnosed with endometrial sampling techniques.
Conversely, focal endometrial thickening is most
often caused by endometrial polyps. The accuracy
of all blind sampling techniques is low in the setting
of endometrial polyps, frequently resulting in pathol-
ogy reports with inconclusive findings, such as ‘‘tis-
sue insufficient for diagnosis’’ or ‘‘scanty fragments
of atrophic tissue.’’ For patients with endometrial
polyps or submucosal fibroids, endometrial sampling
and removal is performed best under direct hystero-
scopic visualization. Endovaginal sonography in
some instances can be used to determine which
patients can undergo blind endometrial sampling
successfully versus those who would benefit from
hysteroscopic guidance.
Hysterosonography
Hysterosonography is a minimally invasive proce-
dure that plays an important role in the detection and
characterization of endometrial pathology [5, 66–76].
Several studies have shown that the accuracy of
HSG in diagnosing endometrial pathology exceeds
that achieved using endovaginal sonography alone
[6,69,77,78]. Even in the setting of a thin endo-
metrium (�5 mm), HSG may identify the anatomic
cause of bleeding in some cases (Fig. 3) [5,8, 77–79].
Bree et al [67] performed HSG in 98 patients with
postmenopausal bleeding, and reported a sensitivity of
98%, a specificity of 88%, a positive predictive value
of 94%, and a negative predictive value of 97%
for detecting endometrial pathology. In addition,
HSG can make a more precise diagnosis in cases
where endovaginal sonography only shows abnormal
thickening of the endometrium [5,66–69, 71–76].
By accurately diagnosing endometrial polyps and
submucosal myomas with an intracavitary compo-
nent, HSG can select those patients who benefit most
from hysteroscopic-guided removal. Furthermore, as
is discussed later, endometrial carcinoma on HSG
usually presents as an irregular broad-based mass
[69]. This is in contradistinction to endovaginal
sonography, where endometrial carcinoma most often
presents as diffuse endometrial thickening. A priori
knowledge as to the location of an endometrial
malignancy may improve the accuracy of blind
sampling techniques.
Hysterosonography is more accurate than endo-
vaginal sonography for the detection, localization,
and characterization of endometrial pathology. In
addition, HSG can be helpful in patients with non-
visualization of the endometrium or to distinguish
true from apparent endometrial thickening on endo-
vaginal sonography (Figs. 3, 4). The exact role of
HSG in the evaluation of patients presenting with
postmenopausal bleeding has not yet been clearly
defined. The authors, however, propose the following
general guidelines for performing HSG in this clinical
setting: (1) patients with endometrial thickening on
endovaginal sonography and negative endometrial
C. Reinhold, I. Khalili / Radiol Clin N Am 40 (2002) 527–562 531

biopsy results; (2) patients with indeterminate find-
ings on endovaginal sonography; and (3) patients
with persistent bleeding and negative findings on
endovaginal sonography or endometrial biopsy.
Doppler ultrasound
Several investigators have measured pulsed Dop-
pler indices and color Doppler vascularity of the
endometrium to differentiate benign from malignant
endometrial pathology. Opinions differ, however, as
to the role of Doppler ultrasound in this clinical
setting. Threshold values for resistive indices (RI)
ranging from 0.40 to 0.70 have been reported to
differentiate benign from malignant endometria accu-
rately, with most authors recommending a threshold
value of 0.40 [80,81]. Proposed values for the pulsa-
Fig. 3. Endometrial polyp. (A) Oblique sagittal endovaginal sonogram in a patient presenting with postmenopausal bleeding
shows minimal focal thickening of the dorsal endometrium (calipers) relative to the ventral endometrium. The localized
thickening of the dorsal endometrium does not exceed 5 mm, and is located adjacent to an intramural leiomyoma (L). This raises
the possibility of apparent focal thickening caused by distortion of the endometrium by the leiomyoma. (B) Hysterosonography
shows that the focal thickening of the dorsal endometrium represents a small endometrial polyp (arrows).
C. Reinhold, I. Khalili / Radiol Clin N Am 40 (2002) 527–562532
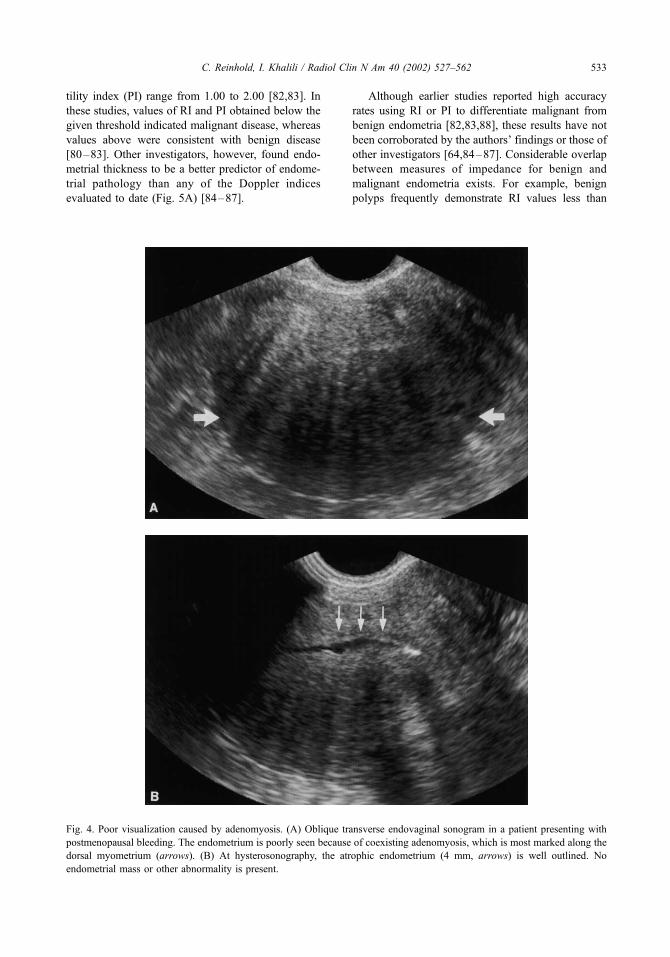
tility index (PI) range from 1.00 to 2.00 [82,83]. In
these studies, values of RI and PI obtained below the
given threshold indicated malignant disease, whereas
values above were consistent with benign disease
[80–83]. Other investigators, however, found endo-
metrial thickness to be a better predictor of endome-
trial pathology than any of the Doppler indices
evaluated to date (Fig. 5A) [84–87].
Although earlier studies reported high accuracy
rates using RI or PI to differentiate malignant from
benign endometria [82,83,88], these results have not
been corroborated by the authors’ findings or those of
other investigators [64,84–87]. Considerable overlap
between measures of impedance for benign and
malignant endometria exists. For example, benign
polyps frequently demonstrate RI values less than
Fig. 4. Poor visualization caused by adenomyosis. (A) Oblique transverse endovaginal sonogram in a patient presenting with
postmenopausal bleeding. The endometrium is poorly seen because of coexisting adenomyosis, which is most marked along the
dorsal myometrium (arrows). (B) At hysterosonography, the atrophic endometrium (4 mm, arrows) is well outlined. No
endometrial mass or other abnormality is present.
C. Reinhold, I. Khalili / Radiol Clin N Am 40 (2002) 527–562 533

Fig. 5. Doppler and benign endometrial disease. (A) Transverse endovaginal sonogram shows a thickened endometrium with
stalk flow on color Doppler imaging. Spectral analysis obtained from the stalk results in a resistive index of 0.4. (B) Sagittal
section in the same patient demonstrates the stalk flow (arrow), suggesting the presence of a polyp. In addition, although the
vascularity is sparse at the level of the fundus consistent with benign disease, the vascularity in the body of the uterus and lower
uterine segment is increased. At histopathology only endometrial hyperplasia and an endometrial polyp were found.
C. Reinhold, I. Khalili / Radiol Clin N Am 40 (2002) 527–562534
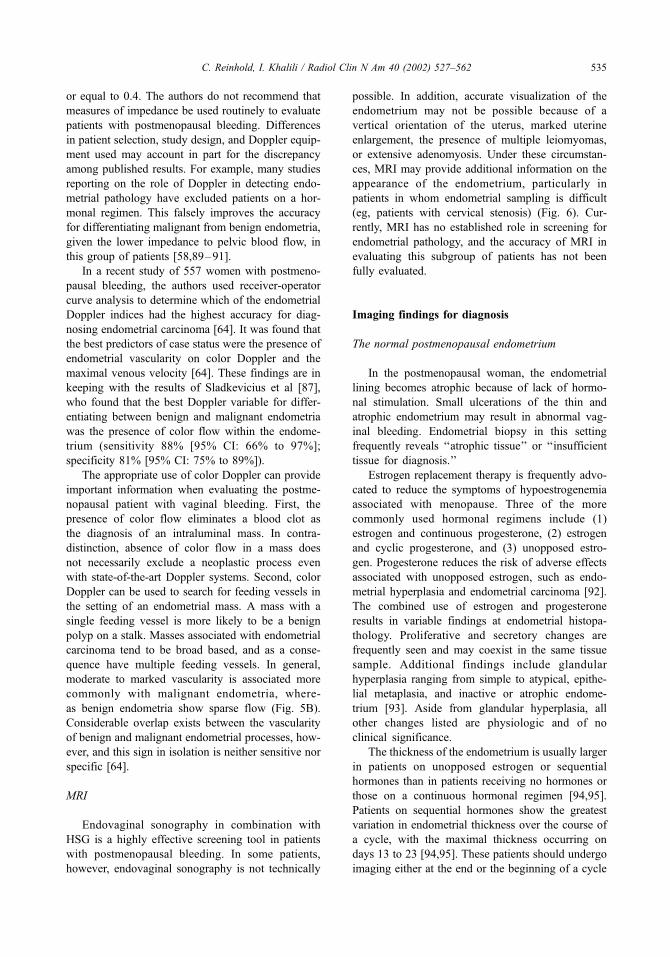
or equal to 0.4. The authors do not recommend that
measures of impedance be used routinely to evaluate
patients with postmenopausal bleeding. Differences
in patient selection, study design, and Doppler equip-
ment used may account in part for the discrepancy
among published results. For example, many studies
reporting on the role of Doppler in detecting endo-
metrial pathology have excluded patients on a hor-
monal regimen. This falsely improves the accuracy
for differentiating malignant from benign endometria,
given the lower impedance to pelvic blood flow, in
this group of patients [58,89–91].
In a recent study of 557 women with postmeno-
pausal bleeding, the authors used receiver-operator
curve analysis to determine which of the endometrial
Doppler indices had the highest accuracy for diag-
nosing endometrial carcinoma [64]. It was found that
the best predictors of case status were the presence of
endometrial vascularity on color Doppler and the
maximal venous velocity [64]. These findings are in
keeping with the results of Sladkevicius et al [87],
who found that the best Doppler variable for differ-
entiating between benign and malignant endometria
was the presence of color flow within the endome-
trium (sensitivity 88% [95% CI: 66% to 97%];
specificity 81% [95% CI: 75% to 89%]).
The appropriate use of color Doppler can provide
important information when evaluating the postme-
nopausal patient with vaginal bleeding. First, the
presence of color flow eliminates a blood clot as
the diagnosis of an intraluminal mass. In contra-
distinction, absence of color flow in a mass does
not necessarily exclude a neoplastic process even
with state-of-the-art Doppler systems. Second, color
Doppler can be used to search for feeding vessels in
the setting of an endometrial mass. A mass with a
single feeding vessel is more likely to be a benign
polyp on a stalk. Masses associated with endometrial
carcinoma tend to be broad based, and as a conse-
quence have multiple feeding vessels. In general,
moderate to marked vascularity is associated more
commonly with malignant endometria, where-
as benign endometria show sparse flow (Fig. 5B).
Considerable overlap exists between the vascularity
of benign and malignant endometrial processes, how-
ever, and this sign in isolation is neither sensitive nor
specific [64].
MRI
Endovaginal sonography in combination with
HSG is a highly effective screening tool in patients
with postmenopausal bleeding. In some patients,
however, endovaginal sonography is not technically
possible. In addition, accurate visualization of the
endometrium may not be possible because of a
vertical orientation of the uterus, marked uterine
enlargement, the presence of multiple leiomyomas,
or extensive adenomyosis. Under these circumstan-
ces, MRI may provide additional information on the
appearance of the endometrium, particularly in
patients in whom endometrial sampling is difficult
(eg, patients with cervical stenosis) (Fig. 6). Cur-
rently, MRI has no established role in screening for
endometrial pathology, and the accuracy of MRI in
evaluating this subgroup of patients has not been
fully evaluated.
Imaging findings for diagnosis
The normal postmenopausal endometrium
In the postmenopausal woman, the endometrial
lining becomes atrophic because of lack of hormo-
nal stimulation. Small ulcerations of the thin and
atrophic endometrium may result in abnormal vag-
inal bleeding. Endometrial biopsy in this setting
frequently reveals ‘‘atrophic tissue’’ or ‘‘insufficient
tissue for diagnosis.’’
Estrogen replacement therapy is frequently advo-
cated to reduce the symptoms of hypoestrogenemia
associated with menopause. Three of the more
commonly used hormonal regimens include (1)
estrogen and continuous progesterone, (2) estrogen
and cyclic progesterone, and (3) unopposed estro-
gen. Progesterone reduces the risk of adverse effects
associated with unopposed estrogen, such as endo-
metrial hyperplasia and endometrial carcinoma [92].
The combined use of estrogen and progesterone
results in variable findings at endometrial histopa-
thology. Proliferative and secretory changes are
frequently seen and may coexist in the same tissue
sample. Additional findings include glandular
hyperplasia ranging from simple to atypical, epithe-
lial metaplasia, and inactive or atrophic endome-
trium [93]. Aside from glandular hyperplasia, all
other changes listed are physiologic and of no
clinical significance.
The thickness of the endometrium is usually larger
in patients on unopposed estrogen or sequential
hormones than in patients receiving no hormones or
those on a continuous hormonal regimen [94,95].
Patients on sequential hormones show the greatest
variation in endometrial thickness over the course of
a cycle, with the maximal thickness occurring on
days 13 to 23 [94,95]. These patients should undergo
imaging either at the end or the beginning of a cycle
C. Reinhold, I. Khalili / Radiol Clin N Am 40 (2002) 527–562 535

[95,96]. It is preferable to image the endometrium
after the cyclic bleeding has ceased, to avoid false-
positive findings associated with blood in the endo-
metrial cavity. Patients on continuous hormonal regi-
mens show no significant increase in endometrial
thickness over controls [94].
Endovaginal sonography and hysterosonography
The normal postmenopausal endometrium meas-
ures less than or equal to 5 mm (double-layer thick-
ness); is homogeneous; and moderately echogenic
relative to the myometrium on endovaginal sono-
graphy and HSG [56,69,74]. The normal endome-
Fig. 6. Atrophic endometrium not visualized at transabdominal sonography. (A) Transabdominal sonogram in a 56-year-old
woman presenting with postmenopausal bleeding. Transverse section through the uterus does not demonstrate the endometrial
stripe. A central hypoechoic area (arrows) is present, which may represent prominence of the subendometrial halo; however,
replacement of the endometrium by tumor cannot be excluded. Sagittal T2-weighted image of the uterus (B), gadolinium-
enhanced early image of the uterus (C), and late image of the uterus (D) demonstrate an atrophic endometrium (arrows) with
normal signal intensity and enhancement pattern. The junctional zone (long arrow) is prominent and ill-defined (B), suggesting
the presence of uterine adenomyosis. This may have contributed to the abnormality seen on ultrasound.
C. Reinhold, I. Khalili / Radiol Clin N Am 40 (2002) 527–562536

trium on HSG is distensible and should expand with
the administration of normal saline. The appearance
of the endometrium shows greater variability in
patients on HRT (Figs. 7, 8). The endometrium of
patients on estrogen and cyclic progesterone parallel
that of the premenopausal patient and the maximal
endometrial thickness is greater than in patients not
receiving HRT [97]. This is the rationale for recom-
mending 8 versus 5 mm as a threshold value for
detecting endometrial pathology in patients on un-
opposed estrogen or sequential hormone therapy
[60,69,74].
MRI
In postmenopausal women, the normal endome-
trial complex can be identified as a thin hyperintense
structure relative to the adjacent myometrium on T2-
weighted sequences, and is usually isointense on T1-
weighted sequences. The endometrial complex is
hypointense during the early postcontrast images
and becomes isointense or slightly hyperintense rel-
ative to the adjacent myometrium on delayed con-
trast-enhanced images (see Fig. 6).
The normal range of endometrial thickness in post-
menopausal women with MRI has not been exten-
Fig. 6 (continued ).
C. Reinhold, I. Khalili / Radiol Clin N Am 40 (2002) 527–562 537

sively studied. A few small series have reported a
maximal endometrial thickness of 3 mm in women not
receiving exogenous hormones, and 4 to 6 mm in
women receiving HRT [98–100]. In the authors’
experience, using a threshold value of 3 mm results
in a high number of false-positive examinations. The
Fig. 7. Proliferative endometrium on hormone replacement therapy. A 58-year-old postmenopausal woman presenting with
noncyclic vaginal bleeding. Sagittal section through the uterus on endovaginal sonogram shows the endometrium to be of
uniform thickness measuring 6 mm (arrows). The endometrium is homogeneously echogenic. The myometrium is heterogenous
because of the presence of adenomyosis. The endometrial biopsy revealed a proliferative endometrium.
Fig. 8. Proliferative endometrium with polyp on hormone replacement therapy. A 70-year-old woman on estrogen replacement
therapy presenting with breakthrough bleeding. Transverse endovaginal sonogram of the uterus demonstrates diffuse endometrial
thickening (9 mm, long arrows). In addition, along the right ventral aspect of the endometrium, there is an echogenic mass (short
arrows) consistent with an endometrial polyp. This polyp was made visible by the lower echogenicity of the background
proliferative endometrium.
C. Reinhold, I. Khalili / Radiol Clin N Am 40 (2002) 527–562538
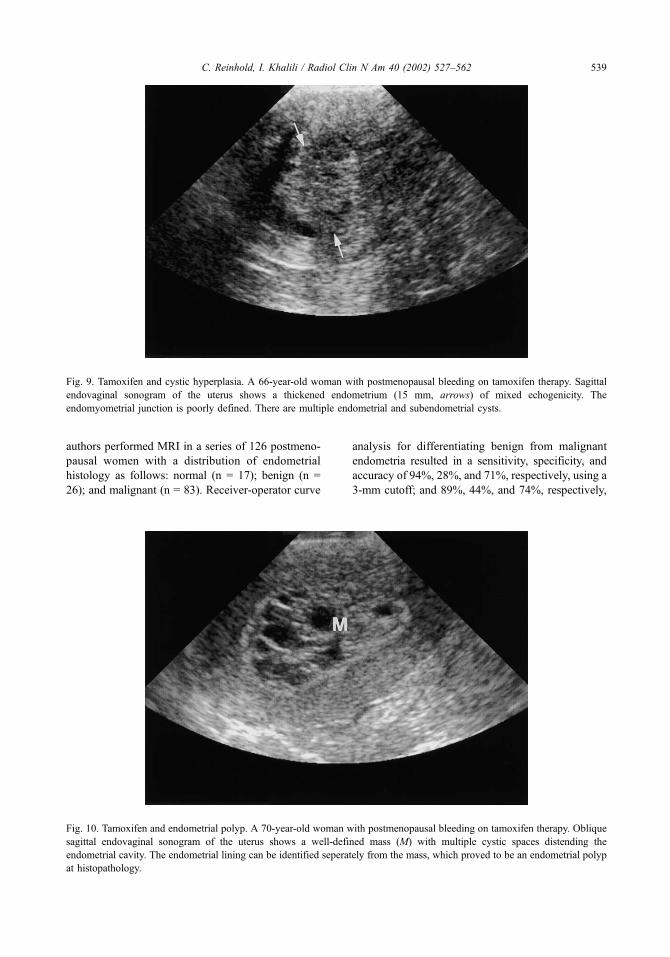
authors performed MRI in a series of 126 postmeno-
pausal women with a distribution of endometrial
histology as follows: normal (n = 17); benign (n =
26); and malignant (n = 83). Receiver-operator curve
analysis for differentiating benign from malignant
endometria resulted in a sensitivity, specificity, and
accuracy of 94%, 28%, and 71%, respectively, using a
3-mm cutoff; and 89%, 44%, and 74%, respectively,
Fig. 9. Tamoxifen and cystic hyperplasia. A 66-year-old woman with postmenopausal bleeding on tamoxifen therapy. Sagittal
endovaginal sonogram of the uterus shows a thickened endometrium (15 mm, arrows) of mixed echogenicity. The
endomyometrial junction is poorly defined. There are multiple endometrial and subendometrial cysts.
Fig. 10. Tamoxifen and endometrial polyp. A 70-year-old woman with postmenopausal bleeding on tamoxifen therapy. Oblique
sagittal endovaginal sonogram of the uterus shows a well-defined mass (M) with multiple cystic spaces distending the
endometrial cavity. The endometrial lining can be identified seperately from the mass, which proved to be an endometrial polyp
at histopathology.
C. Reinhold, I. Khalili / Radiol Clin N Am 40 (2002) 527–562 539

using a 5-mm cutoff [101]. The differences in sensi-
tivity between the 3- and 5-mm cutoff values did not
reach statistical significance. The authors use 5 mm as
the maximal endometrial thickness on MRI in post-
menopausal women.
Tamoxifen
Tamoxifen citrate is an antiestrogen agent used as
adjuvant chemotherapy in patients with breast cancer.
It functions as a weak estrogen agonist on the post-
Fig. 11. Tamoxifen and cystic atrophy, polyp. A 72-year-old woman on tamoxifen therapy presenting with postmenopausal
bleeding. (A) Sagittal endovaginal sonogram shows a diffusely thickened endometrium with cystic change (14 mm, calipers).
Centrally, a small mass of intermediate echogenicity (arrow) consistent with a polyp is identified. The diagnosis of endometrial
polyp in this setting is considerably facilitated by hysterosonography (not shown). (B) T2-weighted sagittal image of the uterus
shows diffuse thickening of the endometrial complex. The polyp (arrow) is difficult to visualize in the background of cystic
atrophy. (C) T1-weighted sagittal image obtained immediately after the administration of a gadolinium chelate shows the
enhancing stalk (arrow) of the polyp. Note the contrast enhancement of the endomyometrial interface. This finding is nonspecific
but has been reported in patients receiving tamoxifen.
C. Reinhold, I. Khalili / Radiol Clin N Am 40 (2002) 527–562540

menopausal endometrium. Tamoxifen therapy is
associated with a wide spectrum of endometrial
pathology including proliferative change, hyperpla-
sia, polyps, adenomyosis, and carcinoma [102–106].
Postmenopausal patients on tamoxifen have a signifi-
cantly thicker endometrium than controls. In one
study the mean endometrial thickness of patients on
tamoxifen was 13 mm [107]. The endometrial thick-
ening decreases significantly 6 months after discon-
tinuation of tamoxifen therapy [108].
Endometrial cystic atrophy is frequently found at
histopathology in patients receiving tamoxifen. The
histologic findings include multiple cystic spaces
lined by an atrophic endometrium, with a small
amount of fibrous stroma. These cystic spaces may
be situated within the endometrium or extend into
the endometrial-myometrial junction to form suben-
dometrial cysts [102]. At endovaginal sonography,
these patients typically present with diffuse endo-
metrial thickening.
Endometrial hyperplasia is classified as (1) with
cytologic atypia and (2) without cytologic atypia.
This classification is not unique to patients on tamox-
ifen but applies to all patients with endometrial
hyperplasia. The differentiation has prognostic sig-
nificance, because patients with cytologic atypia have
a higher risk of developing endometrial carcinoma
(23% versus 2%) [109].
Unfortunately, imaging cannot distinguish between
hyperplasia with and without cellular atypia. Polyps
associated with tamoxifen therapy tend to be larger in
size. At histopathology these show cystic glandular
dilatation, prominent stromal fibrosis, and metaplastic
change [110]. Tamoxifen may result in the growth of
new leiomyomas, or increase the size of previously
existing ones [111]. Tamoxifen is also associated with
the development of adenomyosis in postmenopausal
women [112].
Tamoxifen therapy carries an increased risk (1.3-
to 7.5-fold) of developing endometrial cancer [102].
This risk increases with the duration of therapy and
the cumulative tamoxifen dose. Endometrial cancers
associated with tamoxifen use are usually high grade
and more aggressive [113].
Endovaginal sonography and hysterosonography
In 1996, the American College of Radiology
published appropriateness criteria on the role of
imaging in patients receiving tamoxifen therapy
[114]. In this report, it was recommended that endo-
vaginal sonography be used as the first-line imaging
modality for evaluating the uterus in women under-
going tamoxifen therapy. The strength of endovaginal
sonography is in the assessment of endometrial thick-
ness. Furthermore, it may provide information about
endometrial texture or focal masses. In cases where
endovaginal sonography is nondiagnostic or is sug-
gestive of an abnormality, hysterosonography (HSG)
can provide additional information. HSG can be used
to image polyps and subendometrial cysts with con-
fidence and can help direct sampling procedures
when necessary.
The most common sonographic pattern in patients
on tamoxifen is a thickened endometrium with mul-
Fig. 11 (continued ).
C. Reinhold, I. Khalili / Radiol Clin N Am 40 (2002) 527–562 541

tiple cystic spaces (Figs. 9–11) [103,105,106,115–
117]. The histologic counterpart to this sonographic
appearance includes cystic atrophy, hyperplasia,
polyps, subendometrial cysts, and adenomyosis.
Although endometrial carcinoma infrequently
presents with cystic spaces, the sonographic appear-
ance of endometrial carcinoma is nonspecific. Endo-
metrial sampling is recommended in all patients on
tamoxifen presenting with vaginal bleeding. Imaging
plays an important role at directing the type of
sampling procedure to be performed in this patient
population. For example, imaging may suggest the
need for a more aggressive intervention (D and C
versus endometrial biopsy). Alternatively, in the
Fig. 12. Tamoxifen and adenomyosis. A 66-year-old woman on tamoxifen therapy presenting with postmenopausal bleeding.
Sagittal (A) and parasagittal (B) endovaginal sonogram of the uterus shows a thickened endometrium (13 mm, calipers) with
cystic change and poorly defined endometrial borders. The hypoechoic inner myometrium, myometrial cysts, and linear
echogenic striations extending out from the endometrium into the myometrium are signs of adenomyosis. The presence of
adenomyosis frequently results in an overestimation of the true endometrial thickness. (C) Sagittal T2-weighted image shows the
true endometrial thickness to be 5 mm (arrows). Note the increased thickness of the junctional zone and multiple hyperintense
foci within the inner myometrium consistent with adenomyosis.
C. Reinhold, I. Khalili / Radiol Clin N Am 40 (2002) 527–562542
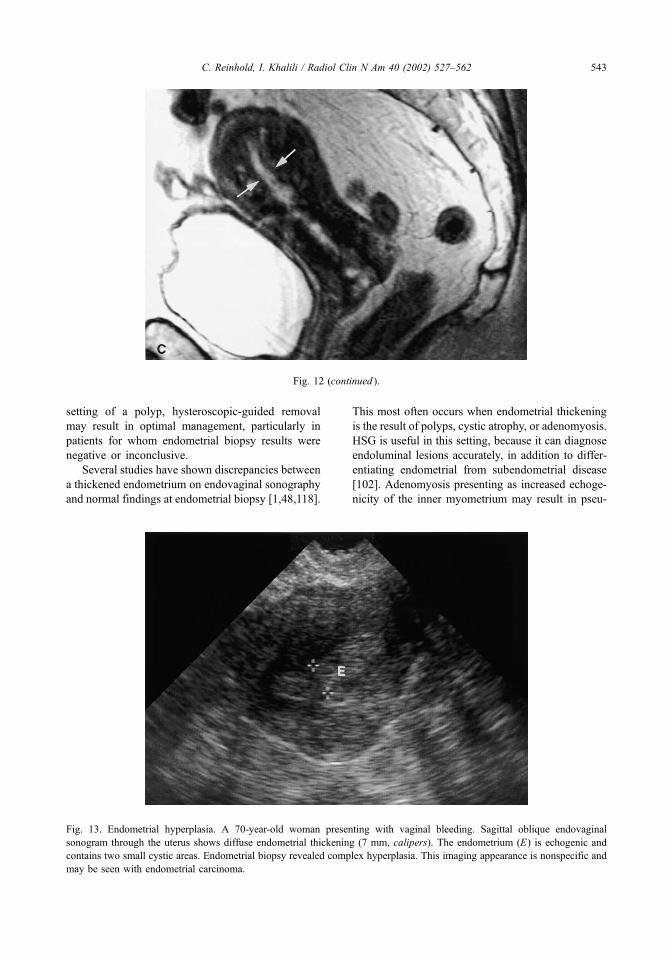
setting of a polyp, hysteroscopic-guided removal
may result in optimal management, particularly in
patients for whom endometrial biopsy results were
negative or inconclusive.
Several studies have shown discrepancies between
a thickened endometrium on endovaginal sonography
and normal findings at endometrial biopsy [1,48,118].
This most often occurs when endometrial thickening
is the result of polyps, cystic atrophy, or adenomyosis.
HSG is useful in this setting, because it can diagnose
endoluminal lesions accurately, in addition to differ-
entiating endometrial from subendometrial disease
[102]. Adenomyosis presenting as increased echoge-
nicity of the inner myometrium may result in pseu-
Fig. 13. Endometrial hyperplasia. A 70-year-old woman presenting with vaginal bleeding. Sagittal oblique endovaginal
sonogram through the uterus shows diffuse endometrial thickening (7 mm, calipers). The endometrium (E) is echogenic and
contains two small cystic areas. Endometrial biopsy revealed complex hyperplasia. This imaging appearance is nonspecific and
may be seen with endometrial carcinoma.
Fig. 12 (continued ).
C. Reinhold, I. Khalili / Radiol Clin N Am 40 (2002) 527–562 543

dothickening of the endometrium on endovaginal
sonography (Fig. 12).
MRI
Despite the proved effectiveness of MRI for
demonstrating endometrial abnormalities [119,120],
little has been published in the literature regarding
the MRI appearance of the uterus in women under-
going tamoxifen therapy [21]. Ascher et al [121]
reported on the MRI appearance of the uterus in 35
postmenopausal patients with breast cancer who
were undergoing tamoxifen treatment, and correlated
the imaging findings with histopathologic results.
This group of authors noted two imaging patterns.
Fig. 14. Atypical hyperplasia and polyp. A 75-year-old woman presenting with vaginal bleeding. (A) Sagittal endovaginal
sonogram shows a retroverted uterus with diffuse endometrial thickening (14 mm, arrows) of heterogeneous echotexture. The
differential diagnosis comprises a wide range of endometrial pathology. (C) Sagittal T2-weighted fast spin echo image of the uterus
shows diffuse thickening of the endometrial complex (arrows) with an intact junctional zone. The endometrial complex is
heterogeneous. The imaging appearance is nonspecific. Endometrial sampling diagnosed atypical hyperplasia. The patient
underwent hysterectomy, which confirmed the diagnosis of atypical hyperplasia. In addition, an endometrial polyp originating from
the ventral aspect of the endometrium was found. (See also color Fig. 14B, page 545.)
C. Reinhold, I. Khalili / Radiol Clin N Am 40 (2002) 527–562544
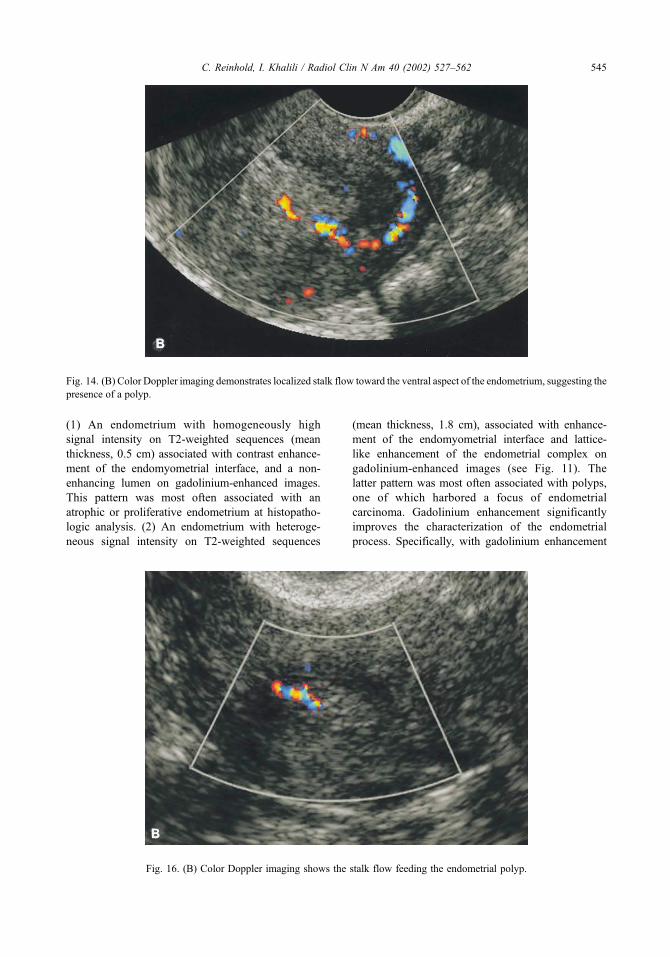
(1) An endometrium with homogeneously high
signal intensity on T2-weighted sequences (mean
thickness, 0.5 cm) associated with contrast enhance-
ment of the endomyometrial interface, and a non-
enhancing lumen on gadolinium-enhanced images.
This pattern was most often associated with an
atrophic or proliferative endometrium at histopatho-
logic analysis. (2) An endometrium with heteroge-
neous signal intensity on T2-weighted sequences
(mean thickness, 1.8 cm), associated with enhance-
ment of the endomyometrial interface and lattice-
like enhancement of the endometrial complex on
gadolinium-enhanced images (see Fig. 11). The
latter pattern was most often associated with polyps,
one of which harbored a focus of endometrial
carcinoma. Gadolinium enhancement significantly
improves the characterization of the endometrial
process. Specifically, with gadolinium enhancement
Fig. 14. (B) Color Doppler imaging demonstrates localized stalk flow toward the ventral aspect of the endometrium, suggesting the
presence of a polyp.
Fig. 16. (B) Color Doppler imaging shows the stalk flow feeding the endometrial polyp.
C. Reinhold, I. Khalili / Radiol Clin N Am 40 (2002) 527–562 545

an enhancing stalk is seen in many of the polyps,
improving the diagnostic confidence. Additional
imaging findings include subendometrial cysts, leio-
myomas, and adenomyosis.
Although the role of MRI in this patient popula-
tion is not well-defined, MRI can demonstrate both
endometrial and myometrial pathology associated
with tamoxifen use. MRI may be appropriate in
patients with an equivocal or abnormal endovaginal
sonogram who are unable to undergo HSG because of
cervical stenosis.
Endometrial hyperplasia
Endometrial hyperplasia is a common cause of
abnormal uterine bleeding, and in postmenopausal
Fig. 16. Endometrial polyp. A 54-year-old woman presenting with postmenopausal bleeding. (A) Sagittal endovaginal sonogram
of the uterus shows an echogenic mass (arrows) within the endometrial cavity. Note the displacement of the endometrial lining
around the mass. (See also color Fig. 16B, page 545.)
Fig. 15. Endometrial polyp. A 47-year-old woman presenting with perimenopausal bleeding. Transverse endovaginal sonogram
of the uterus shows a uniformly echogenic, well-defined mass (calipers) within the endometrial cavity consistent with a polyp.
C. Reinhold, I. Khalili / Radiol Clin N Am 40 (2002) 527–562546
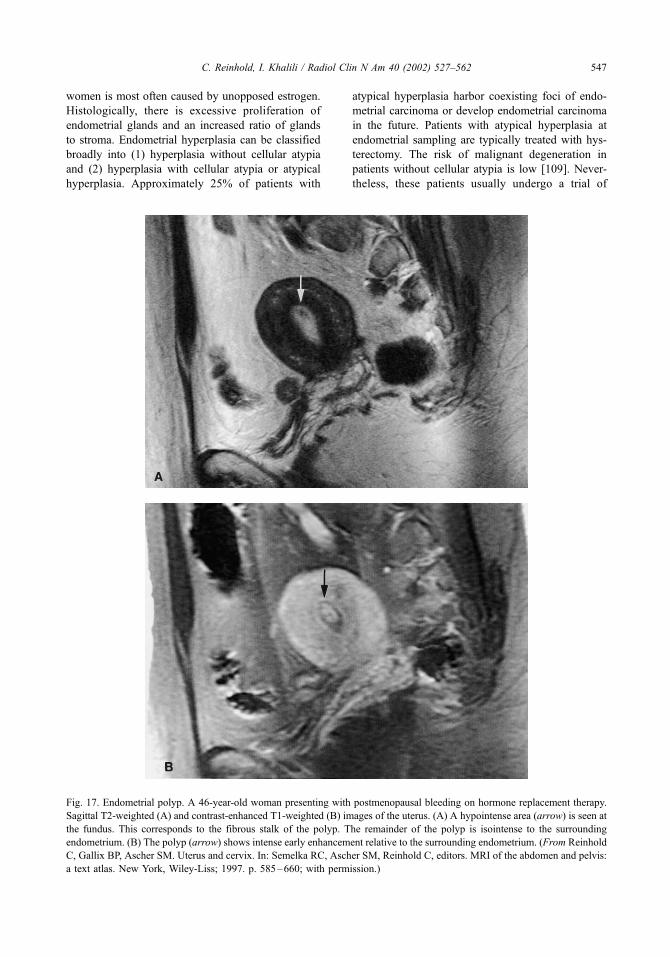
women is most often caused by unopposed estrogen.
Histologically, there is excessive proliferation of
endometrial glands and an increased ratio of glands
to stroma. Endometrial hyperplasia can be classified
broadly into (1) hyperplasia without cellular atypia
and (2) hyperplasia with cellular atypia or atypical
hyperplasia. Approximately 25% of patients with
atypical hyperplasia harbor coexisting foci of endo-
metrial carcinoma or develop endometrial carcinoma
in the future. Patients with atypical hyperplasia at
endometrial sampling are typically treated with hys-
terectomy. The risk of malignant degeneration in
patients without cellular atypia is low [109]. Never-
theless, these patients usually undergo a trial of
Fig. 17. Endometrial polyp. A 46-year-old woman presenting with postmenopausal bleeding on hormone replacement therapy.
Sagittal T2-weighted (A) and contrast-enhanced T1-weighted (B) images of the uterus. (A) A hypointense area (arrow) is seen at
the fundus. This corresponds to the fibrous stalk of the polyp. The remainder of the polyp is isointense to the surrounding
endometrium. (B) The polyp (arrow) shows intense early enhancement relative to the surrounding endometrium. (From Reinhold
C, Gallix BP, Ascher SM. Uterus and cervix. In: Semelka RC, Ascher SM, Reinhold C, editors. MRI of the abdomen and pelvis:
a text atlas. New York, Wiley-Liss; 1997. p. 585–660; with permission.)
C. Reinhold, I. Khalili / Radiol Clin N Am 40 (2002) 527–562 547

C. Reinhold, I. Khalili / Radiol Clin N Am 40 (2002) 527–562548
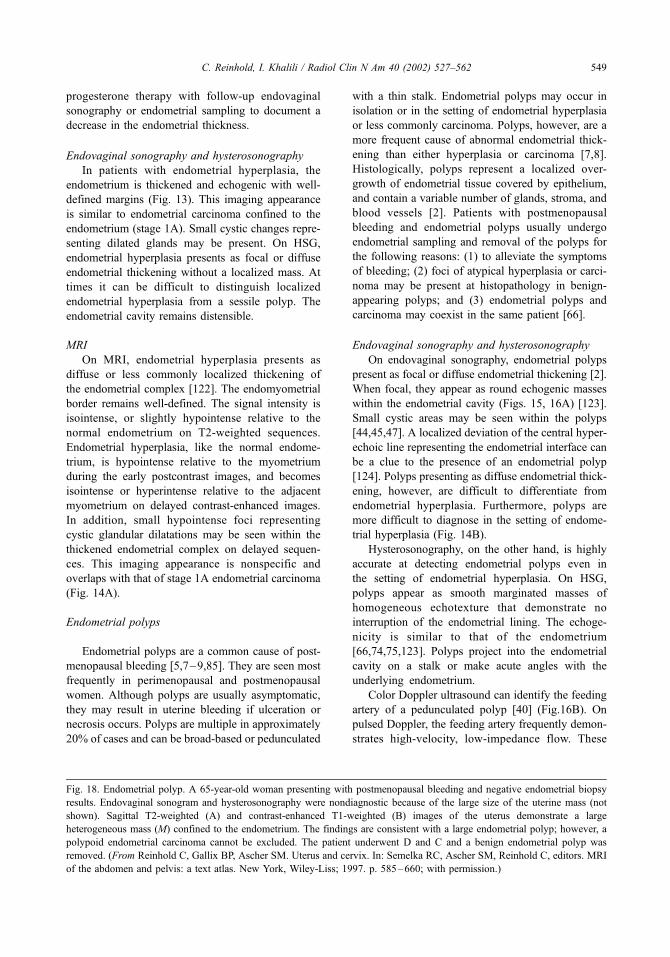
progesterone therapy with follow-up endovaginal
sonography or endometrial sampling to document a
decrease in the endometrial thickness.
Endovaginal sonography and hysterosonography
In patients with endometrial hyperplasia, the
endometrium is thickened and echogenic with well-
defined margins (Fig. 13). This imaging appearance
is similar to endometrial carcinoma confined to the
endometrium (stage 1A). Small cystic changes repre-
senting dilated glands may be present. On HSG,
endometrial hyperplasia presents as focal or diffuse
endometrial thickening without a localized mass. At
times it can be difficult to distinguish localized
endometrial hyperplasia from a sessile polyp. The
endometrial cavity remains distensible.
MRI
On MRI, endometrial hyperplasia presents as
diffuse or less commonly localized thickening of
the endometrial complex [122]. The endomyometrial
border remains well-defined. The signal intensity is
isointense, or slightly hypointense relative to the
normal endometrium on T2-weighted sequences.
Endometrial hyperplasia, like the normal endome-
trium, is hypointense relative to the myometrium
during the early postcontrast images, and becomes
isointense or hyperintense relative to the adjacent
myometrium on delayed contrast-enhanced images.
In addition, small hypointense foci representing
cystic glandular dilatations may be seen within the
thickened endometrial complex on delayed sequen-
ces. This imaging appearance is nonspecific and
overlaps with that of stage 1A endometrial carcinoma
(Fig. 14A).
Endometrial polyps
Endometrial polyps are a common cause of post-
menopausal bleeding [5,7–9,85]. They are seen most
frequently in perimenopausal and postmenopausal
women. Although polyps are usually asymptomatic,
they may result in uterine bleeding if ulceration or
necrosis occurs. Polyps are multiple in approximately
20% of cases and can be broad-based or pedunculated
with a thin stalk. Endometrial polyps may occur in
isolation or in the setting of endometrial hyperplasia
or less commonly carcinoma. Polyps, however, are a
more frequent cause of abnormal endometrial thick-
ening than either hyperplasia or carcinoma [7,8].
Histologically, polyps represent a localized over-
growth of endometrial tissue covered by epithelium,
and contain a variable number of glands, stroma, and
blood vessels [2]. Patients with postmenopausal
bleeding and endometrial polyps usually undergo
endometrial sampling and removal of the polyps for
the following reasons: (1) to alleviate the symptoms
of bleeding; (2) foci of atypical hyperplasia or carci-
noma may be present at histopathology in benign-
appearing polyps; and (3) endometrial polyps and
carcinoma may coexist in the same patient [66].
Endovaginal sonography and hysterosonography
On endovaginal sonography, endometrial polyps
present as focal or diffuse endometrial thickening [2].
When focal, they appear as round echogenic masses
within the endometrial cavity (Figs. 15, 16A) [123].
Small cystic areas may be seen within the polyps
[44,45,47]. A localized deviation of the central hyper-
echoic line representing the endometrial interface can
be a clue to the presence of an endometrial polyp
[124]. Polyps presenting as diffuse endometrial thick-
ening, however, are difficult to differentiate from
endometrial hyperplasia. Furthermore, polyps are
more difficult to diagnose in the setting of endome-
trial hyperplasia (Fig. 14B).
Hysterosonography, on the other hand, is highly
accurate at detecting endometrial polyps even in
the setting of endometrial hyperplasia. On HSG,
polyps appear as smooth marginated masses of
homogeneous echotexture that demonstrate no
interruption of the endometrial lining. The echoge-
nicity is similar to that of the endometrium
[66,74,75,123]. Polyps project into the endometrial
cavity on a stalk or make acute angles with the
underlying endometrium.
Color Doppler ultrasound can identify the feeding
artery of a pedunculated polyp [40] (Fig.16B). On
pulsed Doppler, the feeding artery frequently demon-
strates high-velocity, low-impedance flow. These
Fig. 18. Endometrial polyp. A 65-year-old woman presenting with postmenopausal bleeding and negative endometrial biopsy
results. Endovaginal sonogram and hysterosonography were nondiagnostic because of the large size of the uterine mass (not
shown). Sagittal T2-weighted (A) and contrast-enhanced T1-weighted (B) images of the uterus demonstrate a large
heterogeneous mass (M) confined to the endometrium. The findings are consistent with a large endometrial polyp; however, a
polypoid endometrial carcinoma cannot be excluded. The patient underwent D and C and a benign endometrial polyp was
removed. (From Reinhold C, Gallix BP, Ascher SM. Uterus and cervix. In: Semelka RC, Ascher SM, Reinhold C, editors. MRI
of the abdomen and pelvis: a text atlas. New York, Wiley-Liss; 1997. p. 585–660; with permission.)
C. Reinhold, I. Khalili / Radiol Clin N Am 40 (2002) 527–562 549

Doppler indices overlap with those encountered in
endometrial carcinoma [80,81]. The presence of color
flow in an endometrial mass excludes the presence of
a blood clot.
MRI
Endometrial polyps are of intermediate signal
intensity on T1-weighted images [125]. On T2-
weighted images, polyps present as masses that are
slightly hypointense relative to the normal endome-
trium (Fig. 17). Polyps may be entirely isointense on
T2-weighted sequences, however, and present as
diffuse or localized endometrial thickening. Large
polyps are frequently heterogeneous in signal inten-
sity (Fig. 18) [122,125]. The presence of a central
fibrous core and intratumoral cysts favors the diag-
nosis of a benign polyp [125]. On T2-weighted
sequences, the fibrous core is seen as a hypointense
area within a polyp (see Fig. 17). Intratumoral cysts
are well-defined cystic structures of variable size
Fig. 19. Uterine leiomyoma. (A) Transverse endovaginal sonogram shows a large leiomyoma (L) in the center of the uterus,
suspicious for a submucosal myoma. (B) The hysterosonography clearly shows that the leiomyoma (L) indents the endometrium;
however, it is not submucosal in location. The cause for the postmenopausal bleeding was an endometrial polyp.
C. Reinhold, I. Khalili / Radiol Clin N Am 40 (2002) 527–562550

[125]. The presence of intratumoral cysts is nonspe-
cific, however, and cysts may be encountered in
endometrial carcinomas. Endometrial polyps show a
variable degree of enhancement after gadolinium
administration. Small polyps enhance early and are
well delineated against the hypointense endometrial
complex on early dynamic scans (see Fig. 17). In
addition, a vascular stalk frequently can be identified
during the arterial phase. On delayed images, polyps
are slightly hypointense relative to the endometrium,
but remain isointense or hyperintense relative to the
adjacent myometrium [122]. Large polyps demon-
Fig. 20. Submucosal leiomyoma. A 48-year-old woman with postmenopausal bleeding. Sagittal hysterosonography shows an
anteriorly located submucosal leiomyoma (L) displacing the endometrium posteriorly (arrows).
Fig. 21. Endometrial carcinoma. A 60-year-old woman presenting with postmenopausal bleeding. Oblique transverse
endovaginal sonogram of the uterus shows a mixed echogenicity endometrial mass (arrows) with irregular borders. The mass is
confined to the endometrium. The imaging appearance is consistent with a stage 1A endometrial carcinoma.
C. Reinhold, I. Khalili / Radiol Clin N Am 40 (2002) 527–562 551

strate a heterogeneous pattern of enhancement (see
Fig. 18). The addition of gadolinium-enhanced
sequences significantly improves the detection rate
of endometrial polyps [119]. The enhancement
characteristics of polyps are not sufficiently specific,
however, to obviate the need for tissue sampling
[99,119,122,125].
Leiomyomas
Leiomyomas are well-circumscribed tumors com-
posed of smooth muscle cells arranged in a whorl-like
interlacing pattern, separated by fibrous connective
tissue. Leiomyomas are not encapsulated but contain
a pseudocapsule representing the compressed adja-
Fig. 22. Endometrial carcinoma. A 63-year-old woman presenting with postmenopausal bleeding. (A) Oblique sagittal endo-
vaginal sonogram shows a homogeneous, polypoid mass (arrows) within the endometrial cavity. The mass is slightly hypoechoic
relative to normal endometrium (long arrow). (B) Sagittal T2-weighted image shows the mass (arrows) to be hypointense to
normal endometrium. Note the relatively homogeneous appearance of the mass. (C) Sagittal T1-weighted image early
postcontrast administration shows the endometrial mass (arrows) to be hypointense relative to the adjacent myometrium. Note
the presence of an enhancing stalk (long arrow) dorsally.
C. Reinhold, I. Khalili / Radiol Clin N Am 40 (2002) 527–562552
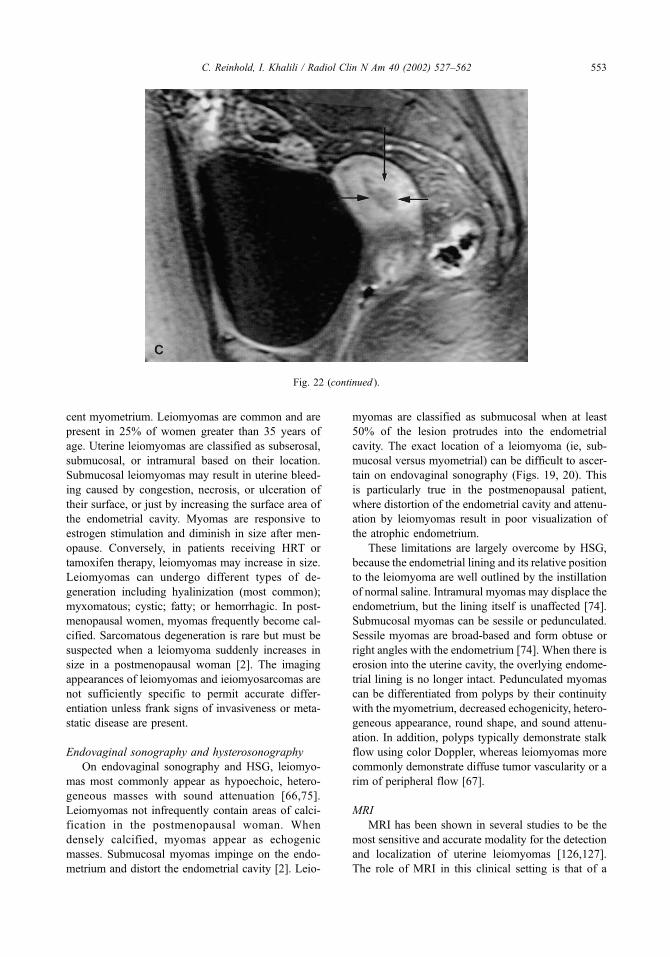
cent myometrium. Leiomyomas are common and are
present in 25% of women greater than 35 years of
age. Uterine leiomyomas are classified as subserosal,
submucosal, or intramural based on their location.
Submucosal leiomyomas may result in uterine bleed-
ing caused by congestion, necrosis, or ulceration of
their surface, or just by increasing the surface area of
the endometrial cavity. Myomas are responsive to
estrogen stimulation and diminish in size after men-
opause. Conversely, in patients receiving HRT or
tamoxifen therapy, leiomyomas may increase in size.
Leiomyomas can undergo different types of de-
generation including hyalinization (most common);
myxomatous; cystic; fatty; or hemorrhagic. In post-
menopausal women, myomas frequently become cal-
cified. Sarcomatous degeneration is rare but must be
suspected when a leiomyoma suddenly increases in
size in a postmenopausal woman [2]. The imaging
appearances of leiomyomas and ieiomyosarcomas are
not sufficiently specific to permit accurate differ-
entiation unless frank signs of invasiveness or meta-
static disease are present.
Endovaginal sonography and hysterosonography
On endovaginal sonography and HSG, leiomyo-
mas most commonly appear as hypoechoic, hetero-
geneous masses with sound attenuation [66,75].
Leiomyomas not infrequently contain areas of calci-
fication in the postmenopausal woman. When
densely calcified, myomas appear as echogenic
masses. Submucosal myomas impinge on the endo-
metrium and distort the endometrial cavity [2]. Leio-
myomas are classified as submucosal when at least
50% of the lesion protrudes into the endometrial
cavity. The exact location of a leiomyoma (ie, sub-
mucosal versus myometrial) can be difficult to ascer-
tain on endovaginal sonography (Figs. 19, 20). This
is particularly true in the postmenopausal patient,
where distortion of the endometrial cavity and attenu-
ation by leiomyomas result in poor visualization of
the atrophic endometrium.
These limitations are largely overcome by HSG,
because the endometrial lining and its relative position
to the leiomyoma are well outlined by the instillation
of normal saline. Intramural myomas may displace the
endometrium, but the lining itself is unaffected [74].
Submucosal myomas can be sessile or pedunculated.
Sessile myomas are broad-based and form obtuse or
right angles with the endometrium [74]. When there is
erosion into the uterine cavity, the overlying endome-
trial lining is no longer intact. Pedunculated myomas
can be differentiated from polyps by their continuity
with the myometrium, decreased echogenicity, hetero-
geneous appearance, round shape, and sound attenu-
ation. In addition, polyps typically demonstrate stalk
flow using color Doppler, whereas leiomyomas more
commonly demonstrate diffuse tumor vascularity or a
rim of peripheral flow [67].
MRI
MRI has been shown in several studies to be the
most sensitive and accurate modality for the detection
and localization of uterine leiomyomas [126,127].
The role of MRI in this clinical setting is that of a
Fig. 22 (continued ).
C. Reinhold, I. Khalili / Radiol Clin N Am 40 (2002) 527–562 553

problem-solving modality, in cases where endovagi-
nal sonography and HSG are nondiagnostic. The
appearance of leiomyomas on MRI is variable and
depends on its cellular composition, and on the type
and extent of degenerative changes present. Leio-
myomas typically appear as sharply marginated
masses of low signal intensity relative to the myome-
trium on T2-weighted images, and are hypovascu-
lar after gadolinium administration [21,126]. When
leiomyomas enlarge and degenerate, they attain
mixed signal intensity on T2-weighted images. Cel-
lular leiomyomas with little or no collagen are hy-
perintense on T2-weighted images, and show early
intense enhancement. Submucosal leiomyomas proj-
ect into the endometrial cavity and may be sessile or
pedunculated. When sessile, at least 50% of the
leiomyoma is surrounded by the endometrial lining.
Contrast-enhanced images play little role in the
Fig. 23. Endometrial carcinoma. A 52-year-old woman presenting with postmenopausal bleeding. (A) Sagittal endovaginal
sonogram shows diffuse thickening (8 mm, calipers) of the endometrium. The endometrium is homogeneously echogenic. (B)
Sagittal T2-weighted image shows the endometrium to be thickened (arrows) but of normal signal intensity. (C) On early
postcontrast T1-weighted images, the endometrial complex is hypointense (arrows). This imaging appearance is nonspecific and
can be seen in endometrial carcinoma and hyperplasia.
C. Reinhold, I. Khalili / Radiol Clin N Am 40 (2002) 527–562554

detection, localization, or characterization of submu-
cosal leiomyomas, and are not routinely used. Sub-
mucosal myomas can be differentiated from polyps
by establishing their myometrial origin. Other MRI
characteristics that favor submucosal myomas but are
not entirely specific include low signal intensity on
T2-weighted images and a spherical shape.
Endometrial carcinoma
A discussion on the role of imaging in women
with a documented diagnosis of endometrial cancer is
beyond the scope of this article, and is addressed
elsewhere in this issue. This section focuses primarily
on the imaging findings of endometrial carcinoma
and presents morphologic characteristics for differ-
entiating malignant from benign disease.
Endometrial carcinoma is the most common inva-
sive malignancy of the female genital tract [59]. The
presenting symptom in over 75% of patients is uterine
bleeding. Approximately 90% of endometrial carci-
nomas are adenocarcinomas. Other histologic sub-
types include squamous, papillary, and clear cell
carcinomas. Although the histologic subtype is a
strong prognostic indicator, the histology of endome-
trial carcinomas cannot be predicted on the basis of
imaging characteristics.
Endovaginal sonography and hysterosonography
The sonographic appearance of endometrial carci-
noma is variable, and there is considerable overlap
between the morphologic characteristics of benign
and malignant endometrial pathology (Figs. 21–23).
Nevertheless, a number of imaging findings sugges-
tive of malignancy can be identified. The following
sonographic patterns of endometrial carcinoma have
been reported: (1) diffuse endometrial thickening,
hyperechoic with well-defined borders; (2) endome-
trial thickening with a heterogeneous echotexture and
irregular or poorly defined margins; and (3) a hetero-
geneous mass-like lesion [44,45,67,74]. Occasion-
ally, a well-defined cystic area may be seen within
an endometrial carcinoma (Fig. 24). The findings of a
diffusely thickened endometrium of increased echo-
genicity with well-defined borders are nonspecific
and indistinguishable from benign endometrial path-
ology (see Fig. 23). Endometrial thickening or an
endometrial mass that is heterogeneous with irregular
borders is suggestive of malignancy. Several small
series using HSG have shown poor distensibility of
the uterine cavity to be a useful sign for diagnosing
endometrial carcinoma [67,74]. Furthermore, endo-
metrial carcinoma on HSG usually presents as an
irregular broad-based mass [69]. This is in contra-
distinction to endovaginal sonography, where endo-
metrial carcinoma most often presents as diffuse
endometrial thickening.
On color Doppler imaging, endometrial carcino-
mas typically have multiple feeding vessels and show
moderate vascularity [64]. Rarely, stalk flow may be
seen in polypoid endometrial carcinomas. Further-
more, hypovascular endometrial carcinomas are not
uncommon, and color vascularity or Doppler indices
cannot be used to predict case status accurately.
Fig. 23 (continued ).
C. Reinhold, I. Khalili / Radiol Clin N Am 40 (2002) 527–562 555

MRI
Endometrial carcinomas most commonly present
as focal or diffuse widening (>5 mm) of the endo-
metrial complex on MRI (see Figs. 21–24) [100,
128,129]. With larger tumors, an irregular mass can
be seen distending the endometrial cavity. In patients
with myometrial invasion, the tumor borders are
frequently irregular or ill-defined. Endometrial
carcinomas are isointense to the myometrium on
T1-weighted sequences. On T2-weighted sequences,
the signal intensity is variable ranging from isoin-
tense or slightly hypointense relative to the normal
endometrium, to a signal intensity that is isointense to
the myometrium. Endometrial carcinomas tend to
have a relatively homogeneous appearance. Endome-
trial carcinomas enhance less than the myometrium on
dynamic contrast-enhanced MRI scans [21]. The
differential in enhancement becomes less marked on
Fig. 24. Endometrial carcinoma. A 69-year-old woman presenting with postmenopausal bleeding. (A) Transverse endovaginal
sonogram of the uterus demonstrates a well-defined, echogenic mass within the endometrial cavity. Note two small areas of
cystic change (arrows). Coronal oblique T2-weighted (B) and T1-weighted (C) images of the uterus demonstrate the cystic
change (arrow) within the endometrial carcinoma.
C. Reinhold, I. Khalili / Radiol Clin N Am 40 (2002) 527–562556

delayed scans. In the absence of myometrial invasion
(stage 1A), the imaging appearance of endometrial
carcinoma is nonspecific and does not permit differ-
entiation from endometrial hyperplasia or polyp (see
Fig. 23) [100,130]. Rarely, in polypoid endometrial
carcinomas, an enhancing stalk may be seen on early
contrast-enhanced MRI (see Fig. 22).
Technique
Endovaginal sonography and hysterosonography
High-resolution sonographic images are needed to
evaluate the endometrium adequately in postmeno-
pausal women presenting with vaginal bleeding.
Transabdominal sonography suffers from limited
spatial resolution. In addition, obesity, retroflexion,
and multiple leiomyomas of the uterus can make
assessment of the endometrial stripe using transabdo-
minal sonography difficult. With the advent of endo-
vaginal sonography these technical limitations have
largely been overcome. Furthermore, the greater
resolution obtained with the higher-frequency endo-
vaginal probes (5 to 7.5 MHz) can improve the
detection of endometrial pathology.
Hysterosonography is an important adjunct to
endovaginal sonography in the assessment of post-
menopausal bleeding. Hysterosonography is well
tolerated by most patients and does not require the
routine administration of analgesics. In preparation
for performing the HSG, the patient is placed in a
lithotomy position, and a speculum is inserted into
the vagina. The internal os is localized and cleansed
with povidone-iodine solution. A 5 or 7F hysterosal-
pingogram catheter is inserted into the lower uterine
segment. Before insertion, the catheter and balloon
should be flushed with a sterile saline solution to
prevent air from entering the endometrial cavity.
Dilating the balloon with 1 to 2 mL of normal saline
fixes the catheter in place. The speculum can be
removed and the endovaginal probe inserted into the
vagina. Approximately 20 to 60 mL of sterile saline
solution is infused into the uterine cavity to achieve
distention, and endovaginal sonography of the uterus
is performed simultaneously [74,75,131].
Hysterosonography is contraindicated if signs of
pelvic infection including pain, fever, and mucopur-
ulent discharge are present. The presence of vaginal
bleeding is not a contraindication to undergoing HSG.
Antibiotics are not given prophilactically [75]. A
theoretical concern is transtubal dissemination of
endometrial carcinoma into the peritoneal cavity. Slow
infusion and avoidance of high pressures prevent
visible accumulation of fluid in the cul-de-sac during
the procedure. In some instances it may be prudent to
deflate the balloon before infusing the normal saline to
minimize the pressure within the endometrial cavity.
Although transtubal spread of malignant cells is a
theoretic concern, there was no difference in survival
rates between patients who demonstrated intraperito-
neal spill of contrast medium and those who did not in
a study of patients with endometrial carcinoma who
underwent standard HSG [132].
Fig. 24 (continued ).
C. Reinhold, I. Khalili / Radiol Clin N Am 40 (2002) 527–562 557

MRI
The MRI protocol for evaluating patients pre-
senting with postmenopausal bleeding is tailored
to provide optimal depiction of the endometrium.
Imaging the endometrium in two planes (sagittal and
coronal oblique or short-axis) improves the ac-
curacy of detecting small endometrial lesions and
establishing the location of a leiomyoma relative to
the endometrial complex. The use of a pelvic multi-
coil array improves the signal-to-noise ratio of the
image allowing the acquisition of high-resolution
T2-weighted fast spin echo images with the fol-
lowing imaging parameters: field of view, 20 to
24 cm; section thickness, 4 to 5 mm; and matrix
size, 512 � 256. High-resolution images are needed
to depict consistently the atrophic endometrium. Dy-
namic contrast-enhanced and delayed fat-suppressed
T1-weighted images are needed for the detection
and characterization of endometrial pathology. In
addition, contrast-enhanced sequences allow the dif-
ferentiation of debris and hemorrhage from true
endometrial pathology.
Summary
Endovaginal sonography in combination with
HSG is an effective screening tool in evaluating
patients with postmenopausal bleeding. Endovaginal
sonography is highly sensitive for detecting endome-
trial carcinoma and can identify patients at low risk
for endometrial disease obviating the need for endo-
metrial sampling in this subgroup of patients. In
patients with abnormal findings at sonography, a
detailed morphologic analysis can be used to deter-
mine which patients can undergo blind endometrial
sampling successfully versus those who would bene-
fit from hysteroscopic guidance. In patients in whom
endovaginal sonography and HSG are inadequate,
MRI may provide additional information on the
appearance of the endometrium, particularly in
patients in whom endometrial sampling is difficult
(eg, patients with cervical stenosis).
References
[1] Dubinsky TJ, Parvey HR, Maklad N. The role of
transvaginal sonography and endometrial biopsy in
the evaluation of peri- and postmenopausal bleeding.
AJR Am J Roentgenol 1997;169:145–9.
[2] Salem S. The uterus and adnexa. In: Rumack CM,
Wilson SR, Charboneau JW, editors. Diagnostic ultra-
sound. 2nd edition. St. Louis: Mosby-Year Book;
1998. p. 535–540.
[3] Brenner PF. Differential diagnosis of abnormal uterine
bleeding. Am J Obstet Gynecol 1996; 175(3 pt 2):
766–9.
[4] Karlsson B, Granberg S, Hellberg P, Wikland M.
Comparative study of transvaginal sonography and
hysteroscopy for the detection of pathologic endome-
trial lesions in women with postmenopausal bleeding.
J Ultrasound Med 1994;13:757–62.
[5] Bronz L, Suter T, Rusca T. The value of transvaginal
sonography with and without saline instillation in the
diagnosis of uterine pathology in pre- and postmeno-
pausal women with abnormal bleeding or suspect
sonographic findings. Ultrasound Obstet Gynecol
1997;9:53–8.
[6] Cullinan JA, Fleischer AC, Kepple DM, Arnold AL.
Sonohysterography: a technique for endometrial eval-
uation. Radiographics 1995;15:501–14.
[7] Karlsson B, Granberg S, Wikland M, Ylostalo P, Tor-
vid K, Marsal K, et al. Transvaginal ultrasonography
of the endometrium in women with postmenopausal
bleeding: a Nordic multicenter study. Am J Obstet
Gynecol 1995;172:1488–94.
[8] O’Connell LP, Fries MH, Zeringue E, Brehm W.
Triage of abnormal postmenopausal bleeding: a com-
parison of endometrial biopsy and transvaginal
sonohysterography versus fractional curettage
with hysteroscopy. Am J Obstet Gynecol 1998;178:
956–61.
[9] Saidi MH, Sadler RK, Theis VD, Akright BD, Farhart
SA, Villanueva GR. Comparison of sonography, so-
nohysterography, and hysteroscopy for evaluation of
abnormal uterine bleeding. J Ultrasound Med 1997;
16:587–91.
[10] Choyke PL, Thickman D, Kressel HY, Lynch JH,
Jaffe MH, Clark LR, et al. Controversies in the radio-
logic diagnosis of pelvic malignancies. Radiol Clin
North Am 1985;23:531–49.
[11] Chambers CB, Unis JS. Ultrasonographic evidence of
uterine malignancy in the post menopausal uterus.
Am J Obstet Gynecol 1986;154:1194–9.
[12] Chen SS, Lee L. Retroperitoneal lymph node meta-
stases in stage 1 carcinoma of the endometrium:
correlation with risk factors. Gynecol Oncol 1983;
16:319–25.
[13] DiSaia PJ, Creasman WT, Boronow RC, Blessing
JA. Risk factors and recurrent patterns in stage 1
endometrial cancer. Am J Obstet Gynecol 1985;
151:1009–15.
[14] Figge DC, Otto PM, Tamimi HK, Greer BE. Treat-
ment variables in the management of endometrial
cancer. Am J Obstet Gynecol 1983;146:495–500.
[15] Nolan JF, Huen A. Prognosis in endometrial cancer.
Gynecol Oncol 1976;4:384–90.
[16] Word B, Gravlee LC, Wideman GL. The fallacy of
simple uterine curettage. Obstet Gynecol 1958;12:
642–8.
C. Reinhold, I. Khalili / Radiol Clin N Am 40 (2002) 527–562558

[17] Grimes DA. Diagnostic dilatation and curettage: a
reappraisal. Am J Obstet Gynecol 1982;142:1–6.
[18] Koonings PP, Moyer DL, Grimes DA. A random-
ized clinical trial comparing Pipelle and Tis-U- Trap
for endometrial biopsy. Obstet Gynecol 1990;75:
293–5.
[19] Stock RJ, Kanbour A. Prehysterectomy curettage.
Obstet Gynecol 1975;45:537–41.
[20] Chambers JT, Chambers SK. Endometrial sampling:
When? Where? Why? With what? Clin Obstet Gyne-
col 1992;35:28–39.
[21] Reinhold C, Gallix BP, Ascher S. Uterus and cervix in
MRI of the abdomen and pelvis. In: Semelka RC,
Ascher SM, Reinhold C, editors. MRI of the abdomen
and pelvis: a text atlas. New York: Wiley-Liss; 1997.
p. 607–9.
[22] Guido RS, Kanbour-Shakir A, Rulin MC, Christo-
pherson WA. Pipelle endometrial sampling. Sensitiv-
ity in the detection of endometrial cancer. J Reprod
Med 1995;40:553–5.
[23] Hofmeister FJ. Endometrial biopsy: another look. Am
J Obstet Gynecol 1974;118:773–7.
[24] Byrne AJ. Endocyte endometrial smears in the cyto-
diagnosis of endometrial carcinoma. Acta Cytol 1990;
34:373–81.
[25] Ferenczy A, Shore M, Guralnick M, Gelfand MM.
The Kevorkian curette: an appraisal of its effective-
ness in endometrial evaluation. Obstet Gynecol 1979;
54:262–7.
[26] Frishman G, Jacobs S. A randomized clinical trial
comparing Pipelle and Tis-u-trap for endometrial bi-
opsy [comments]. Obstet Gynecol 1990;76:315–6.
[27] Giusa-Chiferi MG, Goncalves WJ, Baracat EC.
Transvaginal ultrasound, uterine biopsy and hystero-
scopy for postmenopausal bleeding. Int J Gynecol
Obstet 1996;55:39–44.
[28] Van Den Bosch T, Vandendael A, Van Schou-
broeck D, Wranz PAB, Lombard CJ. Combining
vaginal ultrasonography and office endometrial
sampling in the diagnosis of endometrial disease
in postmenopausal women. Obstet Gynecol 1995;
85:349–52.
[29] Vuopala S. Diagnostic accuracy and clinical applic-
ability of cytological and histological methods for
investigating endometrial carcinoma. Acta Obstet Gy-
necol Scand Suppl 1977;70:1–72.
[30] Townsend DE, Fields G, McCausland A, et al. Diag-
nostic and operative hysteroscopy in the management
of persistent postmenopausal bleeding. Obstet Gyne-
col 1993;82:419–21.
[31] Brooks PG, Serden SP. Hysteroscopic findings after
unsuccessful dilatation and curettage for abnormal
uterine bleeding. Am J Obstet Gynecol 1988;158:
1354–7.
[32] Goldrath MH, Sherman AI. Office hysteroscopy and
suction curettage: can we eliminate the hospital diag-
nostic dilatation and curettage? Am J Obstet Gynecol
1985;152:220–9.
[33] Goldchmit R, Katz Z, Blickstein I, Caspi B, Dgani R.
The accuracy of endometrial Pipelle sampling with
and without sonographic measurement of endometrial
thickness. Obstet Gynecol 1993;82:727–30.
[34] Goldstein SR, Nachtigall M, Snyder JR, Nachitall
L. Endometrial assessment by vaginal ultrasonogra-
phy before endometrial sampling in patients with
post menopausal bleeding. Am J Obstet Gynecol
1990;163(1 pt 1):119–23.
[35] Kavak Z, Ceyhan N, Pekin S. Combination of vaginal
ultrasonography and Pipelle sampling in the diagnosis
of endometrial disease. Aust N Z J Obstet Gynaecol
1996;36:63–6.
[36] Fleischer AC, Kalemeris GC, Machin JE, Entman SS,
James AE. Sonographic depiction of normal and ab-
normal endometrium with histopathologic correlation.
J Ultrasound Med 1986;5:445–52.
[37] Johnson MA, Graham MF, Cooperberg PL. Abnor-
mal endometrial echoes: sonographic spectrum of
endometrial pathology. J Ultrasound Med 1982;1:
161–6.
[38] Nasri MN, Coast GJ. Correlation of ultrasound find-
ings and endometrial histopathology in postme-
nopausal women. Br J Obstet Gynaecol 1989;96:
1333–8.
[39] Mendelson EB, Bohm-Velez M, Joseph N, Neiman
HL. Endometrial abnormalities: evaluation with trans-
vaginal sonography. AJR Am J Roentgenol 1988;
150:139–42.
[40] Osmers R, Volksen M, Schauer A. Vaginosonography
for early detection of endometrial carcinoma? Lancet
1990;335:1569–71.
[41] Rullo S, Piccioni MG, Framarino Dei Malatesta ML,
Silvestrini J, Boni T, Marzetti L. Sonographic, hys-
teroscopic, histological correlation in the early diag-
nosis of endometrial carcinoma. Eur J Gynaecol
Oncol 1991;12:463–9.
[42] Coleman BG, Arger PH, Grumbach K, Menard MK,
Mintz MC, Allen KS, et al. Transvaginal and trans-
abdominal sonography: prospective comparison. Ra-
diology 1988;168:639–43.
[43] Bourne TH, Habmberger L, Hahlin M, Granberg S.
Ultrasound in gynecology: endometrium [review]. Int
J Gynaecol Obstet 1997;56:115–27.
[44] Atri M, Nazarnia S, Aldis AE, Reinhold C, Bret PM,
Kintzen G. Transvaginal US appearance of endome-
trial abnormalities. Radiographics 1994;14:483–92.
[45] Hulka CA, Hall DA, McCarthy K, Simeone JF. En-
dometrial polyps, hyperplasia, and carcinoma in post-
menopausal women: differentiation with endovaginal
sonography. Radiology 1994;191:755–8.
[46] Nasri MN, Shepherd JH, Setchell ME, Lowe DG,
Chard T. The role of vaginal scan in measurement
of endometrial thickness in postmenopausal women.
Br J Obstet Gynaecol 1991;98:470–5.
[47] Sheth S, Hamper UM, Kurman RJ. Thickened endo-
metrium in the postmenopausal woman: sonographic-
pathologic correlation. Radiology 1993;187:135–9.
[48] Shipley CF 3rd, Simmons CL, Nelson GH. Compar-
ison of transvaginal sonography with endometrial bi-
C. Reinhold, I. Khalili / Radiol Clin N Am 40 (2002) 527–562 559
opsy in asymptomatic postmenopausal women. J Ul-
trasound Med 1994;13:99–104.
[49] Lerner JP, Timor-Tritsch IE, Monteagudo A. Use of
transvaginal sonography in the evaluation of endome-
trial hyperplasia and carcinoma. Obstet Gynecol Surv
1996;51:718–25.
[50] Granberg S, Wikland M, Karlsson B, Norstrom A,
Friberg LG. Endometrial thickness as measured by
endovaginal ultrasonography for identifying endo-
metrial abnormality. Am J Obstet Gynecol 1991;
164(1 pt 1):47–52.
[51] Guner H, Tiras MB, Karabacak O, Sarikaya H, Er-
dem M, Yildirim M. Endometrial assessment by
vaginal ultrasonography might reduce endometrial
sampling in patients with postmenopausal bleeding:
a prospective study. Aust N Z J Obstet Gynecol
1996;36:175–8.
[52] Haller H, Matejcic N, Rukavina B, Krasevic M, Rup-
cic S, Mozetic D. Transvaginal sonography and hys-
teroscopy in women with postmenopausal bleeding.
Int J Gynecol Obstet 1996;54:155–9.
[53] Karlsson B, Granberg S, Wikland M, Ryd W, Nor-
strom A. Endovaginal scanning of the endometrium
compared to cytology and histology in women with
postmenopausal bleeding. Gynecol Oncol 1993;50:
173–8.
[54] Malinova M, Pehlivanov B. Transvaginal sonography
and progesterone challenge for identifying pathology
in postmenopausal women. Int J Gynecol Obstet
1996;52:49–53.
[55] Pertl B, Lahousen M, Pieber D, Heydarfadi HJ, Giu-
liani A. Stellenwert der Sonograhie bei der Fruher-
kennung des Endometriumkarzinoms. Gynakol
Geburtshilfliche Rundsch 1996;36:14–20.
[56] Smith-Bindman R, Kerlikowske K, Feldstein VA,
Subak L, Scheidler J, Segal M, et al. Endovaginal
ultrasound to exclude endometrial cancer and other
endometrial abnormalities. JAMA 1998; 280:1510–7.
[57] Bonilla-Musoles F, Ballester MJ, Marti MC, Raga F,
Osborne NG. Transvaginal color Doppler assessment
of endometrial status in normal postmenopausal
women: the effect of hormone replacement therapy.
J Ultrasound Med 1995;14:503–7.
[58] Doren M, Suselbeck B, Schneider HP, Holzgreve W.
Uterine perfusion and endometrial thickness in post-
menopausal women on long-term continuous com-
bined estrogen and progestogen replacement.
Ultrasound Obstet Gynecol 1997;9:113–9.
[59] Landis SH, Murray T, Bolden S, et al. Cancer statis-
tics. CA Cancer J Clin 1999;49:8.
[60] Lin MC, Gosink BB, Wolf SI, Feldesman MR, Stuen-
kel CA, Braly PS, et al. Endometrial thickness after
menopause: effect of hormone replacement. Radiolo-
gy 1991;180:427–32.
[61] Weigel M, Friese K, Strittmatter HJ, Melchert F.
Measuring the thickness: is that all we have to do
for sonographic assessment of endometrium in post-
menopausal women? Ultrasound Obstet Gynecol
1995;6:97–102.
[62] Brandner P, Gnirs J, Neis KJ, Hetterbach A, Schmidt
W. Vaginosonography in the noninvasive evaluation
of the endometrium of the postmenopausal uterus.
Geburtsh u Frauenheik 1991;51:734–40.
[63] Granberg S, Ylostalo P, Wikland M, Karlsson B. En-
dometrial sonographic and histologic findings in
women with and without hormonal replacement ther-
apy suffering from postmenopausal bleeding. Matur-
itas 1997;27:35–40.
[64] Reinhold C. The Use of Endovaginal Sonography and
Doppler Ultrasound in the Detection of Endometrial
Carcinoma in Women Presenting with Postmeno-
pausal Bleeding [master’s thesis]. Montreal, Canada:
McGill University; 1999.
[65] Hanggi W, Brandenberger AW, Ammann M, Laely A,
Dietz TU, Hermann U. Diagnosis of malignant tu-
mors of the uterus by transvaginal sonography. Ultra-
schall Med 1995;16:2–7.
[66] Dubinsky TJ, Parvey HR, Gormaz G, Curtis M, Ma-
klad N. Transvaginal hysterosonography: comparison
with biopsy in the evaluation of postmenopausal
bleeding. J Ultrasound Med 1995;14:887–93.
[67] Bree RL, Bowerman RA, Bohm-Velez M, Benson CB,
Doubilet PM, DeDreu S, et al. US evaluation of the
uterus in patients with postmenopausal bleeding: a
positive effect on diagnostic decision making. Radiol-
ogy 2000;216:260–4.
[68] Dubinsky TJ, Parvey HR, Gormaz G, Makland N.
Transvaginal hysterosonography in the evaluation of
small endoluminal masses. J Ultrasound Med 1995;
14:1–6.
[69] Dubinsky TJ, Stroehlein K, Abu-Ghazzeh Y, Parvey
HR, Maklad N. Prediction of benign and malignant
endometrial disease: hysterosonographic-pathologic
correlation. Radiology 1999;210:393–7.
[70] Gaucherand P, Piaceenza JM, Salle B, et al. Sonohys-
terography of the uterine cavity: preliminary investi-
gations. J Clin Ultrasound 1995;23:339–48.
[71] Goldstein SR, Schwartz LB. Evaluation of abnor-
mal vaginal bleeding in perimenopausal women
with endovaginal ultrasound and saline infusion so-
nohysterography. Ann N Y Acad Sci 1997;828:
208–12.
[72] Hamilton JA, Larson AJ, Lower AM, Hasnain S,
Grudzinskas JG. Routine use of saline hysterosonog-
raphy in 500 consecutive, unselected, infertile wom-
en. Hum Reprod 1998;13:2463–73.
[73] Im DD, Murphy CA, Rosenshein NB. Hysterosonog-
raphy as an adjunct to transvaginal sonography in the
evaluation of intraluminal lesions of the uterine cav-
ity. Prim Care Update Ob Gyns 1998;5:194.
[74] Laifer-Narin SL, Ragavendra N, Lu DS, Sayre J,
Perrella RR, Grant EG. Transvaginal saline hystero-
sonography: characteristics distinguishing malignant
and various benign conditions. AJR Am J Roentgen-
ol 1999;172:1513–20.
[75] Parson SAK, Lense JJ. Sonohysterography for endo-
metrial abnormalities: preliminary results. J Clin Ul-
trasound 1993;21:87–95.
C. Reinhold, I. Khalili / Radiol Clin N Am 40 (2002) 527–562560

[76] Valenzano M, Costantini S, Cucuccio S, Dugnani MC,
Paoletti R, Ragni N. Use of hysterosonography in
women with abnormal postmenopausal bleeding.
Eur J Gynaecol Oncol 1999;20:217–22.
[77] Bree RL. Ultrasound of the endometrium, facts, con-
troversies, and future trends. Abdom Imaging 1997;
22:557–69.
[78] Williams CD, Marshburn PB. A prospective study of
transvaginal hydrosonography in the evaluation of
abnormal uterine bleeding. Am J Obstet Gynecol
1998;179:292–8.
[79] Schwarzler P, Concin H, Bosch H, et al. An evalua-
tion of sonohysterography and diagnostic hystero-
scopy for the assessment of intrauterine pathology.
Ultrasound Obstet Gynecol 1998;11:337–42.
[80] Hata T, Hata K, Senoh D, Makihara K, Aoki S, Take-
miya O, et al. Doppler ultrasound assessment of
tumor vascularity in gynecologic disorders. J Ultra-
sound Med 1989;8:309–14.
[81] Kurjak A, Shalan H, Kupesic S, Kosuta D, Sosic A,
Benic S, et al. An attempt to screen asymptomatic
women for ovarian and endometrial cancer with trans-
vaginal color and pulsed Doppler sonography. J Ul-
trasound Med 1994;13:295–301.
[82] Bourne TH, Campbell S, Steer CV, Royston P, White-
head MI, Collins WP. Detection of endometrial can-
cer by transvaginal ultrasonography with color flow
imaging and blood flow analysis: a preliminary re-
port. Gynecol Oncol 1991;40:253–9.
[83] Bourne TH, Campbell S, Whitehead MI, Royston P,
Steer CV, Collins WP. Detection of endometrial cancer
in postmenopausal women by transvaginal ultrasono-
graphy and color flow imaging. BMJ 1990;301:369.
[84] Chan FY, Chau MT, Pun TC, Lam C, Ngan HYS,
Leong L, et al. Limitation of transvaginal sonography
and color Doppler imaging in the differentiation of
endometrial carcinoma from benign lesions. J Ultra-
sound Med 1994;13:623–8.
[85] Conoscenti G,Meir YJ, Fischer-Tamaro L,MaieronA,
Natale R, D’ottavio G, et al. Endometrial assessment
by transvaginal sonography and histological findings
after D&C in women with postmenopausal bleeding.
Ultrasound Obstet Gynecol 1995;6:108–15.
[86] Flam F, Almstrom H, Hellstrom AC, Moberger B.
Value of uterine artery Doppler in endometrial cancer.
Acta Oncol 1995;34:779–82.
[87] Sladkevicius P, Valentin L, Marsal K. Endometrial
thickness and Doppler velocimetry of the uterine ar-
teries as discriminators of endometrial status in wom-
en with postmenopausal bleeding: a comparative
study. Am J Obstet Gynecol 1994;171:722–8.
[88] Merce LT, Garcia GL, De la Fuente F. Doppler ultra-
sound assessment of endometrial pathology. Acta Ob-
stet Gynecol Scand 1991;70:525–30.
[89] Achiron R, Lipitz S, Frenkel Y, Mashiach S. Endo-
metrial blood flow response to estrogen replacement
therapy and tamoxifen in asymptomatic, postmeno-
pausal women: a transvaginal Doppler study. Ultra-
sound Obstet Gynecol 1995;5:411–4.
[90] Achiron R, Lipitz S, Sivan E, Goldenberg M, Hor-
ovitz A, Frenkel Y, et al. Changes mimicking endo-
metrial neoplasia in postmenopausal, tamoxifen-
treated women with breast cancer: a transvaginal
Doppler study. Ultrasound Obstet Gynecol 1995;6:
116–20.
[91] Bonila-Musoles F, Marti MC, Ballester MJ, Raga F,
Osborne NG. Normal uterine arterial blood flow in
postmenopausal women assessed by transvaginal col-
or Doppler sonography. J Ultrasound Med 1995;14:
497–501.
[92] Weiderpass E, Adami HO, Baron JA, Magnusson C,
Bergstrom R, Lindgren A, et al. Risk of endometrial
cancer following estrogen replacement with and with-
out progestins. J Natl Cancer Inst 1999;91:1131–7.
[93] Deligdisch L. Hormonal pathology of the endome-
trium. Mod Pathol 2000;13:285–94.
[94] Affinito P, Palomba S, Pellicano M, Sorrentino C, Di
Carlo C, Morgera R, et al. Ultrasonographic measure-
ment of endometrial thickness during hormonal
replacement therapy in postmenopausal women. Ul-
trasound Obstet Gynecol 1998;11:343–6.
[95] Levine D, Gosink BB, Johnson LA. Change in endo-
metrial thickness in postmenopausal women un-
dergoing hormone replacement therapy. Radiology
1995;197:603–8.
[96] Exacoustos C, Lello S, Caporale E, Minghetti MC,
Angelozzi D, Arduini D, et al. Monitoring of hor-
mone replacement therapy in postmenopausal women
by transvaginal sonography and color flow Doppler:
study in different phases of sequential therapy. Fertil
Steril 1999;71:536–43.
[97] Callen PW. Ultrasound evaluation of the uterus. In:
Callen PW, ed. Ultrasonography in obstetrics and gy-
necology. 3rd edition. Philadelphia: WB Saunders;
1994. p. 586–913.
[98] Demas BE, Hricak H, Jaffe RB. Uterine MRI: ef-
fects of hormonal stimulation. Radiology 1986;159:
123–6.
[99] HricakH, Alpers C, Crooks LE, Sheldon PE.Magnetic
resonance imaging of the female pelvis: initial experi-
ence. AJR Am J Roentgenol 1983;141:1119–28.
[100] Hricak H, Stern JL, Fischer MR, et al. Endometrial
carcinoma staging by MRI. Radiology 1987;162:
297–305.
[101] Bijan B, Reinhold C, Ascher SM, Liang L. Accuracy
of MRI in detecting endometrial pathology in post-
menopausal women. Radiology 2000;217(P):276.
[102] Ascher SM, Imaoka I, Lage JM. Tamoxifen-induced
uterine abnormalities: the role of imaging. Radiology
2000;214:29–38.
[103] Cheng WF, Lin HH, Torng PL, Huang SC. Compar-
ison of endometrial changes among symptomatic ta-
moxifen-treated and nontreated premenopausal and
postmenopausal breast cancer patients. Gynecol On-
col 1997;66:233–7.
[104] Gerber B, Krause A, Muller H, Reimer T, Kulz T,
Makovitzky J, et al. Effects of adjuvant tamox-
ifen on the endometrium in postmenopausal women
C. Reinhold, I. Khalili / Radiol Clin N Am 40 (2002) 527–562 561

with breast cancer: a prospective long-term study
using transvaginal ultrasound. J Clin Oncol 2000;
18:3464–70.
[105] Kedar RP, Bourne TH, Powles TJ, Collins WP, Ash-
ley SE, Cosgrove DO, et al. Effects of tamoxifen on
uterus and ovaries of postmenopausal women in a
randomised breast cancer prevention trial. Lancet
1994;28;343:1318–21.
[106] Lahti E, Blanco G, Kauppila A, Apaja-Sarkkinen M,
Taskinen PJ, Laatikainen T. Endometrial changes in
postmenopausal breast cancer patients receiving ta-
moxifen. Obstet Gynecol 1993;81(5 pt 1):660–4.
[107] Cohen I, Rosen DJ, Shapira J, Cordoba M, Gilboa S,
Altaras MM, et al. Endometrial changes with tamox-
ifen: comparison between tamoxifen-treated and non-
treated asymptomatic, postmenopausal breast cancer
patients. Gynecol Oncol 1994;52:185–90.
[108] Cohen I, Beyth Y, Azaria R, Flex D, Figer A, Tepper
R. Ultrasonographic measurement of endometrial
changes following discontinuation of tamoxifen treat-
ment in postmenopausal breast cancer patients. Br J
Obstet Gynaecol 2000;107:1083–7.
[109] Kurman RJ, Norris HJ. Endometrial hyperplasia and
related cellular changes. In: Kurman RJ, editor. Blaus-
tein’s pathology of the female genital tract. 4th edition.
New York: Springer-Verlag; 1994. p. 411–437.
[110] Schlesinger C, Kamoi S, Ascher SM, Kendell M,
Lage JM, Silverberg SG. Endometrial polyps: a com-
parison study of patients receiving tamoxifen with
two control groups. Int J Gynecol Pathol 1998;17:
302–11.
[111] Schwartz LB, Rutkowski N, Horan C, Nachtigall LE,
Snyder J, Goldstein SR. Use of transvaginal ultraso-
nography to monitor the effects of tamoxifen on ute-
rine leiomyoma size and ovarian cyst formation. J
Ultrasound Med 1998;17:699–703.
[112] Cohen I, Beyth Y, Shapira J, Tepper R, Fishman A,
Cordoba M, et al. High frequency of adenomyosis in
postmenopausal breast cancer patients treated with
tamoxifen. Gynecol Obstet Invest 1997;44:200–5.
[113] Deligdisch L, Kalir T, Cohen CJ, de Latour M, Le
Bouedec G, Penault-Llorca F. Endometrial histopa-
thology in 700 patients treated with tamoxifen for
breast cancer. Gynecol Oncol 2000;78:181–6.
[114] Thurmond AS. Abnormal vaginal bleeding. In:
American College of Radiology appropriateness cri-
teria: expert panel on women’s imaging—Women’s
Work Group. Reston, VA: American College of Ra-
diology; 1996. p. WI-4.1–WI-4.10.
[115] Bertelli G, Venturini M, Del Mastro L, Garrone O,
Cosso M, Gustavino C, et al. Tamoxifen and the en-
dometrium: findings of pelvic ultrasound examination
and endometrial biopsy in asymptomatic breast can-
cer patients. Breast Cancer Res Treat 1998;47:41–6.
[116] Friedrich M, Villena-Heinsen C, Mink D, Endres V,
Reitnauer K, SchmidtW. Ultrasonography of the endo-
metrium and endometrial pathology under tamoxifen
treatment. Eur J Gynaecol Oncol 1998;19:536–40.
[117] Hulka CA, Hall DA. Endometrial abnormalities asso-
ciated with tamoxifen therapy for breast cancer:
sonographic and pathologic correlation. AJR Am J
Roentgenol 1993;160:809–12.
[118] Langer RD, Pierce JJ, O’Hanlan KA, Johnson SR,
Espeland MA, Trabal JF, et al. Transvaginal ultraso-
nography compared with endometrial biopsy for
the detection of endometrial disease: postmenopausal
estrogen/progestin interventions trial. N Engl J Med
1997;337:1792–8.
[119] Hricak H, Finck S, Honda G, Goranson H. MRI in the
evaluation of benign uterine masses: value of gado-
pentetate dimeglumine-enhanced T1-weighted im-
ages. AJR Am J Roentgenol 1992;158:1043–50.
[120] Lipson SA, Hricak H. MRI of the female pelvis. Ra-
diol Clin North Am 1996;34:1157–82.
[121] Ascher SM, Johnson JC, BarnesWA, Bae CJ, Patt RH,
Zeman RK. MRI appearance of the uterus in postme-
nopausal women receiving tamoxifen therapy for
breast cancer: histopathologic correlation. Radiology
1996;200:105–10.
[122] Reinhold C, Gallix BP, Ascher SM. Uterus and cer-
vix. In: Semelka RC, Ascher SM, Reinhold C, edi-
tors. MRI of the abdomen and pelvis: a text atlas.
New York: Wiley-Liss; 1997. p. 585–660.
[123] Kupfer MC, Schiller VL, Hansen GC, et al. Trans-
vaginal sonographic evaluation of endometrial pol-
yps. J Ultrasound Med 1994;13:535–9.
[124] Baldwin MT, Dudiak KM, Gorman B, Marks CA.
Focal intracavitary masses recognized with the hyper-
echoic line sign at endovaginal US and characterized
with hysterosonography. Radiographics 1999;19:
927–35.
[125] Grasel RP, Outwater EK, Siegelman ES, Capuzzi D,
Parker L, Hussain SM. Endometrial polyps: MRI fea-
tures and distinction from endometrial carcinoma. Ra-
diology 2000;214:47–52.
[126] Murase E, Siegelman ES, Outwater EK. Uterine leio-
myomas: histopathologic features, MRI findings, dif-
ferential diagnosis, and treatment. Radiographics
1999;19:1179–97.
[127] Hricak H, Tscholakoff D, Heinrichs L, et al. Uterine
leiomyomas: correlation of MR histopathologic find-
ings, and symptoms. Radiology 1986;158:385–91.
[128] Hricak H, Rubinstein LV, Gherman GM, Karstaedt N.
MRI evaluation of endometrial carcinoma: Results
of an NCI Cooperative study. Radiology 1991;179:
829–32.
[129] Worthington JL, Balfe DM, Lee JK, Gersell DJ, Heik-
en JP, Ling D, et al. Uterine neoplasms: MRI. Radi-
ology 1986;159:725–30.
[130] Audet P, Pressacco J, Burke M, Reinhold C. MRI of
female pelvic malignancies. Magn Reson Imaging
Clin N Am 2000;8:887–914.
[131] Sohaey R, Woodward P. Sonohysterography: techni-
que, endometrial findings, and clinical applications.
Semin Ultrasound CT MR 1999;20:250–8.
[132] DeVore GR, Schwartz PE, Morris J. Hysterography:
5-year follow-up in patients with endometrial carci-
noma. Obstet Gynecol 1982;60:369–72.
C. Reinhold, I. Khalili / Radiol Clin N Am 40 (2002) 527–562562

Imaging of cancer of the endometrium
Susan M. Ascher, MDa,*, Caroline Reinhold, MD, MPHb
aDepartment of Radiology, Abdominal Imaging Division, Georgetown University Hospital, 3800 Reservoir Road NW,
Washington, DC 20007-2197, USAbDepartment of Radiology, Gastroenterology and Gynecology, Montreal General Hospital, 1650 Cedar Avenue, Montreal,
Quebec H3Q1A4, Canada
The most important prognostic factors for
women with endometrial cancer are stage of disease,
depth of myometrial invasion, and histologic grade
of tumor. These factors correlate strongly with
lymph node metastases and with survival [1,2].
Although surgical staging is the primary means to
assess these prognosticators, it is imperfect with
recognized drawbacks (eg, staging errors and obe-
sity or other causes of increased surgical risk). These
limitations have led to the investigation and imple-
mentation of cross-sectional imaging for women
with endometrial cancer. Specifically, a growing
body of literature suggests that preoperative cross-
sectional imaging in select women with endometrial
cancer is complementary to surgical staging by
impacting the type and extent of surgery, and in
some patients it may be performed in lieu of
surgical staging [1,3].
The goals of this article are to review the
epidemiology, staging, imaging strategies, and
impact of imaging on treatment decisions and plan-
ning in women with the diagnosis of endometrial
cancer. Detection of endometrial cancer is beyond
the scope of this chapter and is addressed in the
article entitled, ‘‘Postmenopausal bleeding: value
of imaging.’’
Epidemiology and cancer prognostic factors
Epidemiology
Approximately 37,400 women had endometrial
cancer in 1999, making it the most common invasive
gynecologic malignancy in North America. Approx-
imately 6400 women that same year died of the
disease [4]. Endometrial cancer strikes women during
the 6th and 7th decades of life, and most women seek
treatment for dysfunctional uterine bleeding (inter-
menstrual or postmenopausal) [5]. Although the exact
etiology of endometrial cancer remains unknown,
studies have suggested that two distinct mechanisms
may play a role in its origin: (1) unopposed estrogen
stimulation, which leads to endometrial hyperplasia
and then progresses to carcinoma, and (2) sponta-
neous carcinomas arising from atrophic or inert endo-
metrium [1]. These divergent origins may account for
the more favorable prognosis in women with estro-
gen-related carcinomas that have well-differentiated
tumors compared with the poorer prognosis in
women with an unknown carcinogen that has undif-
ferentiated tumors [5].
Recognized risk factors associated with endome-
trial cancer include obesity, diabetes mellitus, hyper-
tension, nulliparity, unopposed estrogen replacement
therapy, and adenomatous endometrial hyperplasia
(Table 1) [1]. Women on tamoxifen citrate for breast
cancer and chemoprevention are also at increased risk
(2.2- to 6.4-fold) for endometrial cancer; however,
the benefit of tamoxifen therapy for reducing breast
cancer recurrence, contralateral new breast cancers,
and the development of breast cancer in women at
0033-8389/02/$ – see front matter D 2002, Elsevier Science (USA). All rights reserved.
PII: S0033 -8389 (01 )00013 -6
* Corresponding author.
E-mail address: [email protected]
(S.M. Ascher).
Radiol Clin N Am 40 (2002) 563–576
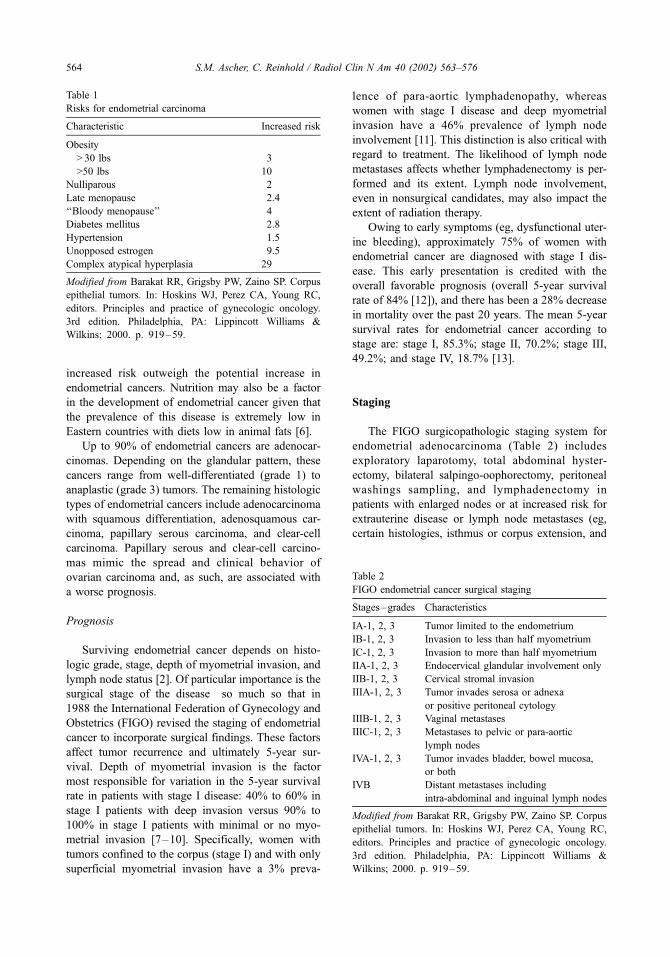
increased risk outweigh the potential increase in
endometrial cancers. Nutrition may also be a factor
in the development of endometrial cancer given that
the prevalence of this disease is extremely low in
Eastern countries with diets low in animal fats [6].
Up to 90% of endometrial cancers are adenocar-
cinomas. Depending on the glandular pattern, these
cancers range from well-differentiated (grade 1) to
anaplastic (grade 3) tumors. The remaining histologic
types of endometrial cancers include adenocarcinoma
with squamous differentiation, adenosquamous car-
cinoma, papillary serous carcinoma, and clear-cell
carcinoma. Papillary serous and clear-cell carcino-
mas mimic the spread and clinical behavior of
ovarian carcinoma and, as such, are associated with
a worse prognosis.
Prognosis
Surviving endometrial cancer depends on histo-
logic grade, stage, depth of myometrial invasion, and
lymph node status [2]. Of particular importance is the
surgical stage of the disease so much so that in
1988 the International Federation of Gynecology and
Obstetrics (FIGO) revised the staging of endometrial
cancer to incorporate surgical findings. These factors
affect tumor recurrence and ultimately 5-year sur-
vival. Depth of myometrial invasion is the factor
most responsible for variation in the 5-year survival
rate in patients with stage I disease: 40% to 60% in
stage I patients with deep invasion versus 90% to
100% in stage I patients with minimal or no myo-
metrial invasion [7–10]. Specifically, women with
tumors confined to the corpus (stage I) and with only
superficial myometrial invasion have a 3% preva-
lence of para-aortic lymphadenopathy, whereas
women with stage I disease and deep myometrial
invasion have a 46% prevalence of lymph node
involvement [11]. This distinction is also critical with
regard to treatment. The likelihood of lymph node
metastases affects whether lymphadenectomy is per-
formed and its extent. Lymph node involvement,
even in nonsurgical candidates, may also impact the
extent of radiation therapy.
Owing to early symptoms (eg, dysfunctional uter-
ine bleeding), approximately 75% of women with
endometrial cancer are diagnosed with stage I dis-
ease. This early presentation is credited with the
overall favorable prognosis (overall 5-year survival
rate of 84% [12]), and there has been a 28% decrease
in mortality over the past 20 years. The mean 5-year
survival rates for endometrial cancer according to
stage are: stage I, 85.3%; stage II, 70.2%; stage III,
49.2%; and stage IV, 18.7% [13].
Staging
The FIGO surgicopathologic staging system for
endometrial adenocarcinoma (Table 2) includes
exploratory laparotomy, total abdominal hyster-
ectomy, bilateral salpingo-oophorectomy, peritoneal
washings sampling, and lymphadenectomy in
patients with enlarged nodes or at increased risk for
extrauterine disease or lymph node metastases (eg,
certain histologies, isthmus or corpus extension, and
Table 1
Risks for endometrial carcinoma
Characteristic Increased risk
Obesity
> 30 lbs 3�>50 lbs 10�
Nulliparous 2�Late menopause 2.4�‘‘Bloody menopause’’ 4�Diabetes mellitus 2.8�Hypertension 1.5�Unopposed estrogen 9.5�Complex atypical hyperplasia 29�Modified from Barakat RR, Grigsby PW, Zaino SP. Corpus
epithelial tumors. In: Hoskins WJ, Perez CA, Young RC,
editors. Principles and practice of gynecologic oncology.
3rd edition. Philadelphia, PA: Lippincott Williams &
Wilkins; 2000. p. 919–59.
Table 2
FIGO endometrial cancer surgical staging
Stages–grades Characteristics
IA-1, 2, 3 Tumor limited to the endometrium
IB-1, 2, 3 Invasion to less than half myometrium
IC-1, 2, 3 Invasion to more than half myometrium
IIA-1, 2, 3 Endocervical glandular involvement only
IIB-1, 2, 3 Cervical stromal invasion
IIIA-1, 2, 3 Tumor invades serosa or adnexa
or positive peritoneal cytology
IIIB-1, 2, 3 Vaginal metastases
IIIC-1, 2, 3 Metastases to pelvic or para-aortic
lymph nodes
IVA-1, 2, 3 Tumor invades bladder, bowel mucosa,
or both
IVB Distant metastases including
intra-abdominal and inguinal lymph nodes
Modified from Barakat RR, Grigsby PW, Zaino SP. Corpus
epithelial tumors. In: Hoskins WJ, Perez CA, Young RC,
editors. Principles and practice of gynecologic oncology.
3rd edition. Philadelphia, PA: Lippincott Williams &
Wilkins; 2000. p. 919–59.
S.M. Ascher, C. Reinhold / Radiol Clin N Am 40 (2002) 563–576564
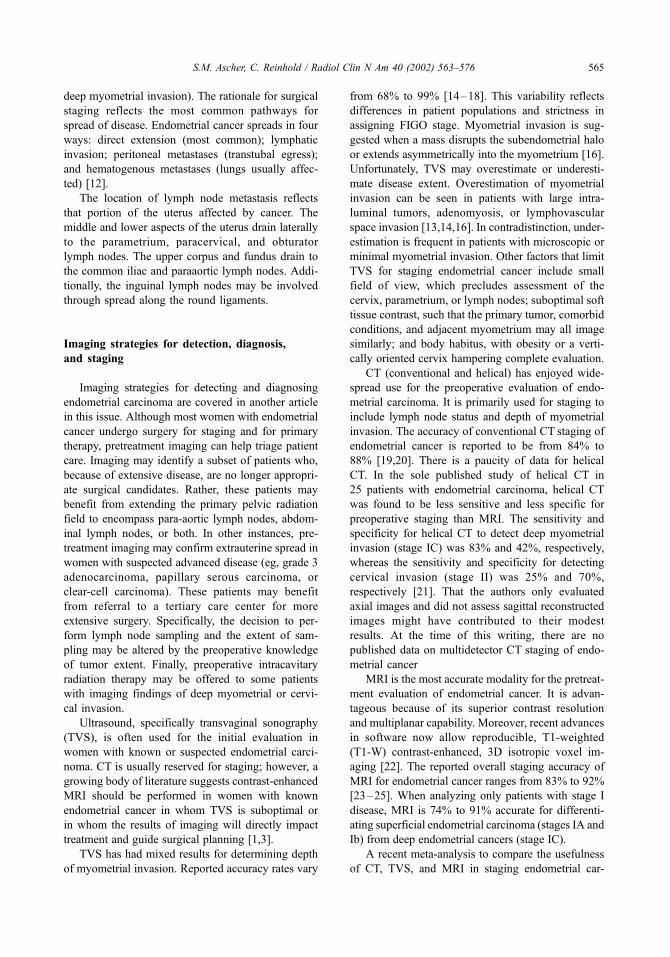
deep myometrial invasion). The rationale for surgical
staging reflects the most common pathways for
spread of disease. Endometrial cancer spreads in four
ways: direct extension (most common); lymphatic
invasion; peritoneal metastases (transtubal egress);
and hematogenous metastases (lungs usually affec-
ted) [12].
The location of lymph node metastasis reflects
that portion of the uterus affected by cancer. The
middle and lower aspects of the uterus drain laterally
to the parametrium, paracervical, and obturator
lymph nodes. The upper corpus and fundus drain to
the common iliac and paraaortic lymph nodes. Addi-
tionally, the inguinal lymph nodes may be involved
through spread along the round ligaments.
Imaging strategies for detection, diagnosis,
and staging
Imaging strategies for detecting and diagnosing
endometrial carcinoma are covered in another article
in this issue. Although most women with endometrial
cancer undergo surgery for staging and for primary
therapy, pretreatment imaging can help triage patient
care. Imaging may identify a subset of patients who,
because of extensive disease, are no longer appropri-
ate surgical candidates. Rather, these patients may
benefit from extending the primary pelvic radiation
field to encompass para-aortic lymph nodes, abdom-
inal lymph nodes, or both. In other instances, pre-
treatment imaging may confirm extrauterine spread in
women with suspected advanced disease (eg, grade 3
adenocarcinoma, papillary serous carcinoma, or
clear-cell carcinoma). These patients may benefit
from referral to a tertiary care center for more
extensive surgery. Specifically, the decision to per-
form lymph node sampling and the extent of sam-
pling may be altered by the preoperative knowledge
of tumor extent. Finally, preoperative intracavitary
radiation therapy may be offered to some patients
with imaging findings of deep myometrial or cervi-
cal invasion.
Ultrasound, specifically transvaginal sonography
(TVS), is often used for the initial evaluation in
women with known or suspected endometrial carci-
noma. CT is usually reserved for staging; however, a
growing body of literature suggests contrast-enhanced
MRI should be performed in women with known
endometrial cancer in whom TVS is suboptimal or
in whom the results of imaging will directly impact
treatment and guide surgical planning [1,3].
TVS has had mixed results for determining depth
of myometrial invasion. Reported accuracy rates vary
from 68% to 99% [14–18]. This variability reflects
differences in patient populations and strictness in
assigning FIGO stage. Myometrial invasion is sug-
gested when a mass disrupts the subendometrial halo
or extends asymmetrically into the myometrium [16].
Unfortunately, TVS may overestimate or underesti-
mate disease extent. Overestimation of myometrial
invasion can be seen in patients with large intra-
luminal tumors, adenomyosis, or lymphovascular
space invasion [13,14,16]. In contradistinction, under-
estimation is frequent in patients with microscopic or
minimal myometrial invasion. Other factors that limit
TVS for staging endometrial cancer include small
field of view, which precludes assessment of the
cervix, parametrium, or lymph nodes; suboptimal soft
tissue contrast, such that the primary tumor, comorbid
conditions, and adjacent myometrium may all image
similarly; and body habitus, with obesity or a verti-
cally oriented cervix hampering complete evaluation.
CT (conventional and helical) has enjoyed wide-
spread use for the preoperative evaluation of endo-
metrial carcinoma. It is primarily used for staging to
include lymph node status and depth of myometrial
invasion. The accuracy of conventional CT staging of
endometrial cancer is reported to be from 84% to
88% [19,20]. There is a paucity of data for helical
CT. In the sole published study of helical CT in
25 patients with endometrial carcinoma, helical CT
was found to be less sensitive and less specific for
preoperative staging than MRI. The sensitivity and
specificity for helical CT to detect deep myometrial
invasion (stage IC) was 83% and 42%, respectively,
whereas the sensitivity and specificity for detecting
cervical invasion (stage II) was 25% and 70%,
respectively [21]. That the authors only evaluated
axial images and did not assess sagittal reconstructed
images might have contributed to their modest
results. At the time of this writing, there are no
published data on multidetector CT staging of endo-
metrial cancer
MRI is the most accurate modality for the pretreat-
ment evaluation of endometrial cancer. It is advan-
tageous because of its superior contrast resolution
and multiplanar capability. Moreover, recent advances
in software now allow reproducible, T1-weighted
(T1-W) contrast-enhanced, 3D isotropic voxel im-
aging [22]. The reported overall staging accuracy of
MRI for endometrial cancer ranges from 83% to 92%
[23–25]. When analyzing only patients with stage I
disease, MRI is 74% to 91% accurate for differenti-
ating superficial endometrial carcinoma (stages IA and
Ib) from deep endometrial cancers (stage IC).
A recent meta-analysis to compare the usefulness
of CT, TVS, and MRI in staging endometrial car-
S.M. Ascher, C. Reinhold / Radiol Clin N Am 40 (2002) 563–576 565

cinoma found that contrast-enhanced MRI performed
better than CT, ultrasound, or unenhanced MRI in
assessing depth of myometrial invasion [3]. In fol-
low-up meta-analysis and bayesian analysis, the use
of contrast-enhanced MRI significantly affected the
post-test probability of deep myometrial invasion in
patients with all grades of endometrial carcinoma
[26]. This last study has important economic impli-
cations for identifying a subset of patients who
might benefit from referral to a tertiary care center
for more aggressive management by a gynecologic
oncologist versus patients who can be treated by a
local general gynecologist.
Contrast-enhanced MRI results alter the likelihood
ratios for myometrial invasion, which, in turn, affects
the probability of lymph node metastases and hence
the extent of surgery performed. Specifically, Frei et al
[26] found the mean weighted pre-MRI probabilities
of deep myometrial invasion in patients with tumor
grades 1, 2, and 3 were 13%, 35%, and 54%, respec-
tively, whereas post-MRI probabilities for deep myo-
metrial invasion for grades 1, 2, and 3 increased to
60%, 84%, and 92%, respectively, for positive and
decreased to 1%, 5%, or 10%, respectively, for nega-
tive MR findings. Practically speaking, deep myome-
trial invasion can be reliably excluded in patients with
grade 1 or 2 tumors in whom MRI does not dem-
onstrate deep myometrial invasion. With this know-
ledge, frozen section or lymph node sampling is not
necessary, nor does the patient need referral to a
specialist. Similarly, in a patient with grade 3 adeno-
carcinoma, lack of deep myometrial invasion on MRI
significantly decreases the chance of lymph node
metastases, and lymphadenectomy may be deferred.
Conversely, positive MRI findings would support the
need for lymph node sampling.
Women are often diagnosed with endometrial
cancer after dilation and curettage. The MRI changes
in the uterus after dilation and curettage do not appear
to negatively impact image interpretation for staging,
and there are no strict guidelines for how long one
should wait before having a woman with a newly
diagnosed endometrial cancer [27] undergo scanning.
We opt to image women once post-procedural vaginal
bleeding has ceased or has nearly resolved.
Imaging protocol
Patient preparation is minimal. Patients are
instructed not to eat or drink 4 to 6 hours before the
examination to limit peristalsis artifact; alternatively,
glucagon may be administered before imaging.
Patients are also asked void prior to imaging. They
are scanned in the prone position using a torso-phased
array coil, and the field of view is as small as is
appropriate to body habitus. A basic examination
includes orthogonal T2- weighted (T2-W) sequences,
transverse T1-W sequence, and sagittal dynamic con-
trast-enhanced T1-W sequences. This protocol seeks
to detect viable primary tumor (T2-W and Gd-T1-W
sequences); myometrial and cervical involvement
(T2-W and Gd-T1-W sequences); and loco-regional
spread (eg, pelvic sidewall) and lymphadenopathy
(T1-W and Gd T1-W sequences).
Highly resolved T2-W fast spin echo sequences
(FSE) are favored for evaluation of the primary tumor,
myometrial penetration, and cervical extension [28].
Intravenous contrast is routinely used to delineate
viable tumor versus debris and to highlight the
tumor-myometrial junction. Contrast studies im-
prove the sensitivity and negative predictive value
for deep myometrial invasion [29]. Dynamic contrast-
enhanced T1-W spoiled-gradient echo sequences have
been found to be incrementally more accurate in the
determination of myometrial invasion than T2-W and
contrast-enhanced T1-W sequences by 85%, 58%,
and 68%, respectively [30]. An advantage of the
dynamic sequence is that absence of the junctional
zone (JZ), a landmark used for determining the depth
of myometrial invasion on T2-W sequences, does not
hamper evaluation. This is especially important as
T2-W zonal anatomy becomes less conspicuous in
women after menopause, the same cohort that tends to
get endometrial cancer.
In addition to the absence of the JZ or indistinct
zonal anatomy, other circumstances that may interfere
with the MR evaluation in women with endometrial
cancer are (1) myometrial thinning by a large polypoid
tumor or obstructed endometrial canal, (2) poor
tumor–myometrial interface regardless of sequence,
(3) distorting multiple or large leiomyomata, (4) small
uteri, and (5) congenital anomalies [31].
Imaging findings
MR correlates for the FIGO staging system have
been devised (Table 3). In general, endometrial can-
cer presents as widening of the endometrial stripe
greater than 3 to 5 mm in a postmenopausal wom-
an. Tumors tend to be isointense to myometrium on
T1-W sequences and have a variable appearance on
T2-W sequences (isointense, hypointense, or hetero-
geneous compared with the myometrium). On the
images taken immediately after dynamic contrast
administration, endometrial cancers typically enhance
less than the normal myometrium. This difference in
S.M. Ascher, C. Reinhold / Radiol Clin N Am 40 (2002) 563–576566
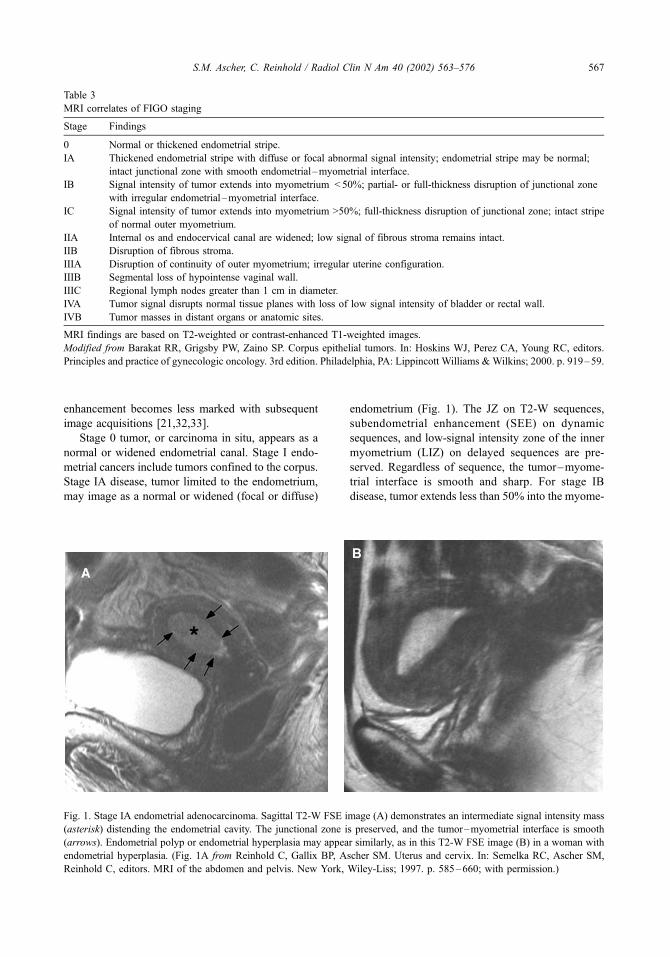
enhancement becomes less marked with subsequent
image acquisitions [21,32,33].
Stage 0 tumor, or carcinoma in situ, appears as a
normal or widened endometrial canal. Stage I endo-
metrial cancers include tumors confined to the corpus.
Stage IA disease, tumor limited to the endometrium,
may image as a normal or widened (focal or diffuse)
endometrium (Fig. 1). The JZ on T2-W sequences,
subendometrial enhancement (SEE) on dynamic
sequences, and low-signal intensity zone of the inner
myometrium (LIZ) on delayed sequences are pre-
served. Regardless of sequence, the tumor–myome-
trial interface is smooth and sharp. For stage IB
disease, tumor extends less than 50% into the myome-
Table 3
MRI correlates of FIGO staging
Stage Findings
0 Normal or thickened endometrial stripe.
IA Thickened endometrial stripe with diffuse or focal abnormal signal intensity; endometrial stripe may be normal;
intact junctional zone with smooth endometrial–myometrial interface.
IB Signal intensity of tumor extends into myometrium < 50%; partial- or full-thickness disruption of junctional zone
with irregular endometrial–myometrial interface.
IC Signal intensity of tumor extends into myometrium >50%; full-thickness disruption of junctional zone; intact stripe
of normal outer myometrium.
IIA Internal os and endocervical canal are widened; low signal of fibrous stroma remains intact.
IIB Disruption of fibrous stroma.
IIIA Disruption of continuity of outer myometrium; irregular uterine configuration.
IIIB Segmental loss of hypointense vaginal wall.
IIIC Regional lymph nodes greater than 1 cm in diameter.
IVA Tumor signal disrupts normal tissue planes with loss of low signal intensity of bladder or rectal wall.
IVB Tumor masses in distant organs or anatomic sites.
MRI findings are based on T2-weighted or contrast-enhanced T1-weighted images.
Modified from Barakat RR, Grigsby PW, Zaino SP. Corpus epithelial tumors. In: Hoskins WJ, Perez CA, Young RC, editors.
Principles and practice of gynecologic oncology. 3rd edition. Philadelphia, PA: Lippincott Williams &Wilkins; 2000. p. 919–59.
Fig. 1. Stage IA endometrial adenocarcinoma. Sagittal T2-W FSE image (A) demonstrates an intermediate signal intensity mass
(asterisk) distending the endometrial cavity. The junctional zone is preserved, and the tumor–myometrial interface is smooth
(arrows). Endometrial polyp or endometrial hyperplasia may appear similarly, as in this T2-W FSE image (B) in a woman with
endometrial hyperplasia. (Fig. 1A from Reinhold C, Gallix BP, Ascher SM. Uterus and cervix. In: Semelka RC, Ascher SM,
Reinhold C, editors. MRI of the abdomen and pelvis. New York, Wiley-Liss; 1997. p. 585–660; with permission.)
S.M. Ascher, C. Reinhold / Radiol Clin N Am 40 (2002) 563–576 567

trium with associated disruption or irregularity of
JZ, SEE, or LIZ (Fig. 2). If these landmarks are not
present, stage IB tumor is suggested by an irregular
tumor–myometrial interface. With stage IC disease,
tumor not only disrupts the JZ, SEE, or LIZ, it extends
more than 50% into the myometrium (Fig. 3). There
should be, however, an intact stripe of normal outer
myometrial tissue. It is recommended that superficial
Fig. 2. Stage IB endometrial adenocarcinoma. Sagittal T2-W FSE (A) and gadolinium-enhanced fat-suppressed T1-W spoiled-
gradient echo (B) images show a large mass distending the endometrial canal and approaching the endocervix. There is superficial
myometrial invasion at the level of the lower uterine segment (arrows). (From Audet P, Pressacco J, Burke M, Reinhold C. MR
imaging of female pelvic malignancies. Magn Reson Imaging Clin North Am 2000;8:887–914; with permission.)
Fig. 3. Stage IC endometrial adenocarcinoma. Sagittal T2-W FSE (A) and coronal gadolinium-enhanced fat-suppressed T1-W
spoiled-gradient echo (B) image shows a mass (asterisks, A, B) originating in the endometrium and invading the underlying
myometrium. Depth of myometrial invasion is difficult to discern on the T2-W image because of coexistent adenomyosis. After
intravenous contrast imaging, the tumor myometrial interface is more conspicuous, and deep myometrial invasion is well seen
(arrows, B). (From Audet P, Pressacco J, Burke M, Reinhold C. MR imaging of female pelvic malignancies. Magn Reson
Imaging Clin North Am 2000;8:887–914; with permission.)
S.M. Ascher, C. Reinhold / Radiol Clin N Am 40 (2002) 563–576568

Fig. 4. Stage IIA endometrial adenosquamous. Sagittal T2-W FSE (A) and gadolinium-enhanced fat-suppressed T1-W spoiled-
gradient echo (B) images show an endometrial mass with deep myometrial invasion and extension into the cervix. The cervical
involvement is more conspicuous on the T2-W image (arrows, A) because the tumor and normal cervical tissue enhance
similarly. (From Audet P, Pressacco J, Burke M, Reinhold C. MR imaging of female pelvic malignancies. Magn Reson Imaging
Clin North Am 2000;8:887–914; with permission.)
Fig. 5. Stage IIB endometrial adenocarcinoma. Sagittal T2-W FSE (A) and gadolinium-enhanced fat-suppressed T1-W spoiled-
gradient echo (B) images show an endometrial cancer (straight arrows, A,B) extending into and invading the anterior cervix
(curved arrow, A). Incidental note is made of Nabothian cysts (N). Bl = urinary bladder. (From Reinhold C, Gallix BP, Ascher
SM. Uterus and cervix. In: Semelka RC, Ascher SM, Reinhold C, editors. MRI of the abdomen and pelvis. New York, Wiley-
Liss; 1997. p. 585–560; with permission.)
S.M. Ascher, C. Reinhold / Radiol Clin N Am 40 (2002) 563–576 569

Fig. 6. Stage IIIA endometrial carcinoma. Sagittal (A) and axial (B) T2-W single-shot fast spin-echo (FSE) images in a woman
with papillary serous carcinoma show low-signal– intensity tumor extending into the endocervical canal. There is bilateral
hydrosalpinx (asterisks, A,B) secondary to tumor involvement to the fallopian tubes. The sigmoid colon (arrow, B) is
compressed by the dilated tubes but is otherwise normal. In another patient, sagittal T2-W FSE (C) and gadolinium-enhanced T1-
W fat-suppressed spoiled-gradient echo (D) images show a mass distending the endometrial canal and invading the underlying
myometrium. Deep myometrial invasion is easier to define on the postcontrast image (arrows, D). The axial gadolinium-
enhanced fat-suppressed T1-W spoiled-gradient echo image (E) shows a complex right adnexal metastasis (asterisk, E). (Figs. 6A
and 6B from Reinhold C, Gallix BP, Ascher SM. Uterus and cervix. In: Semelka RC, Ascher SM, Reinhold C, editors. MRI of the
abdomen and pelvis. New York, Wiley-Liss; 1997. p. 585–560; with permission.)
S.M. Ascher, C. Reinhold / Radiol Clin N Am 40 (2002) 563–576570

and deepmyometrial invasion be confirmed on orthog-
onal views.
Caution should be used when evaluating myome-
trial penetration in women with adenomyosis. The
normal endometrial–myometrial interface in women
with adenomyosis is irregular; imaging an irregular
endometrial–myometrial interface in the absence of
other findings should not automatically confer a
diagnosis of superficial myometrial invasion. Con-
versely, full-thickness disruption of the JZ in women
with true deep myometrial invasion may not be
apparent in patients with adenomyosis.
Stage II disease includes tumor extension beyond
the uterine corpus into the cervix. Stage IIA, invasion
of the endocervix, appears as widening of the internal
os and the endocervical canal with preservation of the
fibrocervical stroma (Fig. 4). Widening of the endo-
cervical canal by polypoid extension of an endome-
trial cancer, debris, or coexisting cervical polyp should
not be misinterpreted as cervical invasion. Contrast-
enhanced scans, especially dynamic imaging, may
help sort out the reason for endocervical canal widen-
ing. For stage IIB, there is disruption of the fibrocer-
vical stroma (Fig. 5). Microscopic cervical invasion
may go undetected.
Stage III endometrial cancer is tumor that extends
outside the uterus but not the true pelvis. For IIIA
disease, in which tumor invades the serosa or adnexa
or peritoneal cytologic findings are positive, the
integrity of the outer myometrium is usually irregular,
disrupted, or both (Fig. 6). The ovaries may be
involved by direct extension or as discrete metastases.
Parametrial involvement images as disruption of the
serosa with direct extension into the surrounding
parametrial fat. In stage IIIB disease, tumor extends
into the upper vagina, and there is segmental loss of
the low-signal intensity vaginal wall.
Lymphadenopathy, stage IIIC, is diagnosed when
the short axis of regional lymph nodes is larger than
1 cm (Fig. 7). Unfortunately, SI does not distinguish
hyperplastic lymph nodes from metastatic lymph
nodes. If a patient’s cancer spreads through the
lymphatics, there may be abdominal lymph node
metastases (MR equivalent of stage IVB disease) in
the absence of pelvic lymphadenopathy. Lymph
nodes are especially well seen on T1-W and Gd-FS-
T1-W sequences. The use of contrast can help dif-
ferentiate pelvic vessels from pelvic lymph nodes.
Stage IV tumor is disease that extends beyond
the true pelvis or invades the bladder or rectum. In
stage IVA disease there is a focal loss of the low-
signal intensity wall of the bladder, rectum, or both
(Fig. 8). It may be difficult to distinguish tumor
applied to these hollow viscera versus frank inva-
sion. Stage IVB, distant metastasis, is self-explan-
atory though pelvic manifestations include ascites
(which may enhance on delayed images) and peri-
toneal deposits [34]. Peritoneal disease is most
conspicuous on fat-suppressed gadolinium-enhanced
T1-W images and in the presence of ascites [35,36].
Although some studies have shown MRI to be
superior to CT in the detection of peritoneal disease,
Fig. 6 (continued ).
S.M. Ascher, C. Reinhold / Radiol Clin N Am 40 (2002) 563–576 571

deposits smaller than 1 cm may remain occult
regardless of imaging modality.
Impact of imaging on treatment decisions
and planning
Of all the gynecologic malignancies, treatment
plans for endometrial cancer have the most variabil-
ity. This is especially true for endometrial cancer
confined to the uterine corpus, which represents
approximately 75% of the adenocarcinomas of the
uterus. The standard treatment is total abdominal
hysterectomy and bilateral salpingo-oophorectomy.
However, preoperative and postoperative radiation
therapy and even chemotherapy are performed in
some patients (Table 4).
Although there are recognized indications for
retroperitoneal lymph node sampling (deep myome-
trial invasion, isthmus–cervix extension, extrauterine
spread, unfavorable histologies and enlarged lymph
nodes), a gray zone exists for patients who may not
Fig. 7. Stage IIIC endometrial adenocarcinoma. Axial (A) and sagittal (B) T2-W FSE images show an enlarged right external
iliac lymph node (arrow, A) and a large endometrial mass (asterisk, A,B) extending into and invading the cervix (arrows, B).
Note several nonpathologically enlarged left external iliac lymph nodes. (From Audet P, Pressacco J, Burke M, Reinhold C. MR
imaging of female pelvic malignancies. Magn Reson Imaging Clin North Am 2000;8:887–914; with permission.)
S.M. Ascher, C. Reinhold / Radiol Clin N Am 40 (2002) 563–576572
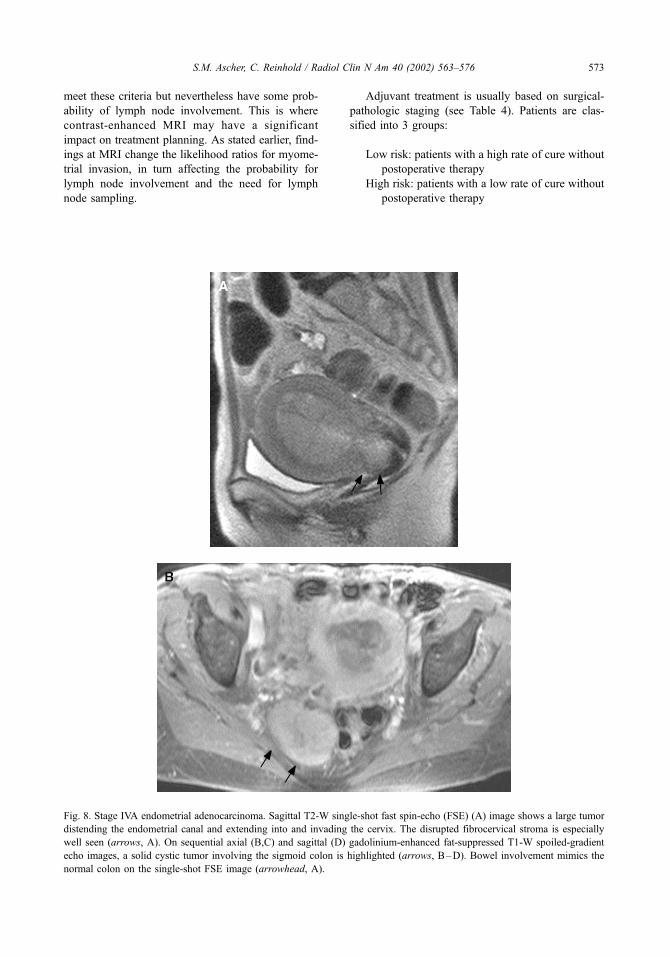
meet these criteria but nevertheless have some prob-
ability of lymph node involvement. This is where
contrast-enhanced MRI may have a significant
impact on treatment planning. As stated earlier, find-
ings at MRI change the likelihood ratios for myome-
trial invasion, in turn affecting the probability for
lymph node involvement and the need for lymph
node sampling.
Adjuvant treatment is usually based on surgical-
pathologic staging (see Table 4). Patients are clas-
sified into 3 groups:
Low risk: patients with a high rate of cure without
postoperative therapy
High risk: patients with a low rate of cure without
postoperative therapy
Fig. 8. Stage IVA endometrial adenocarcinoma. Sagittal T2-W single-shot fast spin-echo (FSE) (A) image shows a large tumor
distending the endometrial canal and extending into and invading the cervix. The disrupted fibrocervical stroma is especially
well seen (arrows, A). On sequential axial (B,C) and sagittal (D) gadolinium-enhanced fat-suppressed T1-W spoiled-gradient
echo images, a solid cystic tumor involving the sigmoid colon is highlighted (arrows, B–D). Bowel involvement mimics the
normal colon on the single-shot FSE image (arrowhead, A).
S.M. Ascher, C. Reinhold / Radiol Clin N Am 40 (2002) 563–576 573

Intermediate risk: patients who demonstrate a
reduced rate of surgical cure but who may or
may not benefit from additional therapy
Low-risk patients do not benefit from postoper-
ative radiation therapy. High-risk patients do benefit
from radiation therapy, usually to the vaginal cuff
and pelvis. Para-aortic radiation and abdominal
radiation are reserved for patients with proven
para-aortic lymph node metastasis and extra-pelvic
spread. It is for the intermediate-risk patients that
there is controversy regarding radiotherapy. A phase
3 GOG study did find an overall survival benefit at
3 years in intermediate-risk patients undergoing
postoperative radiation; however, the survival bene-
fit was less clear for a subset of patients who, after
surgical staging, were found to have myometrial
invasion as the only risk factor [37]. Regardless of
definitive survival benefit, it seems reasonable to
conclude from the GOG study that radiation ther-
Fig. 8 (continued ).
S.M. Ascher, C. Reinhold / Radiol Clin N Am 40 (2002) 563–576574

apy probably does improve local and regional
tumor control.
Summary
Transvaginal US is often the initial imaging
examination for women with dysfunctional (postmen-
opausal or intermenstrual) uterine bleeding. However,
once the diagnosis of endometrial cancer has been
made, contrast-enhanced MRI should be performed
in patients who require multifactorial assessment (eg,
depth of myometrial invasion, cervical involvement,
lymph node metastasis). The results of contrast-
enhanced MRI help distinguish patients who need
more aggressive therapy and referral to a gynecologic
oncologist from those who will do well treated by a
community gynecologist.
References
[1] Barakat RR, Grigsby PW, Zaino SP. Corpus epithelial
tumors. In: Hoskins WJ, Perez CA, Young RC, editors.
Principles and practice of gynecologic oncology. 3rd
edition. Philadelphia, PA: Lippincott Williams & Wil-
kins; 2000. p. 919–59.
[2] Boronow RC, Morrow CP, Creaseman WT, Disaia PJ,
Silverberg SG, Miller A, et al. Surgical staging in en-
dometrial carcinoma: clinical-pathologic findings of a
prospective study. Obstet Gynecol 1984;63:825–32.
[3] Kinkel K, Kaji Y, YuK, SegalMR, LuY, BethanC, et al.
Radiology staging in patients with endometrial carcino-
ma: a meta-analysis. Radiology 1999;212:711–8.
[4] Landis SH, Murray T, Bolden S, et al. Cancer statistics,
1999. CA Cancer J Clin 1999;49:8.
[5] Bokehman JV. Two pathogenetic types of endometrial
carcinoma. Gynecol Oncol 1983;15:10–17.
[6] Gusberg SB. Current concepts in cancer—the changing
nature of endometrial cancer. N Engl J Med 1980;
302:729–31.
[7] Chen SS, Lee L. Retroperitoneal lymph node metas-
tases in Stage I carcinoma of the endometrium: cor-
relation with risk factors. Gynecol Oncol 1985;16:
319–25.
[8] DiSaia PF, Creasmean WT, Boronow RC, Blessing JA.
Risk factors and recurrent patterns in stage I endome-
trial cancer. Am J Obstet Gynecol 1985;151:1009–115.
[9] Figge DC, Otto PM, Tamini HK, Greer BE. Treatment
variables in the management of endometrial cancer.
Am J Obstet Gynecol 1983;146:495–500.
[10] Nolan JF, Huen A. Prognosis in endometrial cancer.
Gyencol Oncol 1976;4:384–90.
[11] Piver MS, Lele SB, Barlow JJ, Blumenson L. Para
aortic lymph node evaluation in stage I endometrial
carcinoma. Obstet Gynecol 1982;59:97–100.
[12] Brinton LA, Hoover RN. Epidemiology of gyneco-
logic cancers. In: Hoskins WJ, Perez CA, Young RC,
editors. Principles and practice of gynecologic oncol-
ogy. 3rd edition. Philadelphia, PA: Lippincott Williams
& Wilkins; 2000. p. 3–29.
[13] Goodman A. Premalignant and malignant disorders of
the uterine corpus. In: Decherney AH, Pernoll ML,
editors. Current obstetric and gynecologic diagnosis
and treatment. 8th edition. Norwalk, CT: Appleton &
Lange; 1994. p. 937–53.
[14] Artner A, Bosze P, Gonda G. The value of ultrasound
in preoperative assessment of the myometrial and cer-
vical invasion in endometrial carcinoma. Gyencol On-
col 1994;54:147–51.
[15] DelMaschio A, Vanzulli A, Sironi S, Spagnolo D, Bel-
loni C, Garancini P, et al. Estimating the depth of
myometrial involvement in endometrial carcinoma: ef-
ficacy of transvaginal sonography vs MR imaging.
AJR Am J Roentgenol 1993;160:533–8.
[16] Gordon AN, Fleischer AC, Dudley BS, Drolshagan LF,
Kalemeris GC, Partain CL, et al. Preoperative assess-
ment of myometrial invsion of endometrial adenomcar-
cinoma by sonography (US) and magnetic resonance
imaging (MRI). Gynecol Oncol 1989;34:175–9.
[17] Teefey SA, Stahl JA, Middleeton WD, Huettner PC,
Table 4
Contemporary treatment plan using FIGO staging
Treatment factors Low risk Intermediate risk High risk
Stage IA, GI, 2 IA, G3 IIIA, IIIB, IIIC (all grades)
IB, IC (all grades) IVA, IVB (all grades)
IIA, IIB (all grades)
IIIA (+ cytology)
Postoperative treatment None Vaginal cuff radiation Vaginal cuff radiation
+/� pelvic radiation Pelvic radiation
+/� 32P (+ cytology) Para-aortic radiation (+ aortic nodes)
Abdominal radiation (+ intra-abdominal spread)
Note: Any patient with intermediate or high risk factors who has had incomplete surgical staging (ie, no lymph nodes sampled)
should have at least postoperative vaginal cuff radiation and probably whole-pelvic radiation.
Modified from Barakat RR, Grigsby PW, Zaino SP. Corpus epithelial tumors. In: Hoskins WJ, Perez CA, Young RC, editors.
Principles and practice of gynecologic oncology. 3rd edition. Philadelphia, PA: Lippincott Williams &Wilkins; 2000. p. 919–59.
S.M. Ascher, C. Reinhold / Radiol Clin N Am 40 (2002) 563–576 575
Bernhard LM, Brown JJ, et al. Local staging of endo-
metrial carcinoma: comparison of transvaginal and in-
traoperative sonography and gross visual inspection.
AJR Am J Roentgenol 1996;166:547–52.
[18] Yamashita Y, Mizutani H, Torashima M, Takahashi M,
Miyazaki K, Okamura H, et al. Assessment of myo-
metrial invasion by endometrial carcinoma: transvagi-
nal sonography vs contrast-enhanced MR imaging.
AJR Am J Roentgenol 1993;161:595–9.
[19] Balfe DM, Van Dyke J, Lee JK, Weyman PJ,
McClennan BL. Computed tomography in malignant
endometrial neoplasms. J Comput Assist Tomogr 1983;
7:677–81.
[20] Walsh JW, Goplerud DR. Computed tomography of
primary, persistent, and recurrent endometrial malig-
nancy. AJR Am J Roentgenol 1982;139:1149–54.
[21] Hardesty L, Sumkin JH, Hakim C, Johns C, Nath M.
The ability of helical CT to pre-operatively stage en-
dometrial carcinoma. AJR Am J Roentgenol 2001;176:
603–6.
[22] Takahasihi N, Narra V, Spencer BE, Hovsepian D.
Application of VIBE (volumetric interpolated breath-
hold examination) MR technique for the evaluation
and follow-up of patients undergoing uterine fibroid
embolization. Proceedings of the International Society
of Magnetic Resonance in Medicine 2001;9:594.
[23] Hirano Y, Kubo K, Hirai Y, Okada S, Yamada K,
Sawano S, et al. Preliminary experience with gadoli-
nium-enhanced dynamic MR imaging for uterine neo-
plasms. Radiographics 1992;12:243–56.
[24] Hricak H, Rubinstein LV, Gherman GM, Karstaedt N.
MR imaging evaluation of endometrial carcinoma:
results of an NCI cooperative study. Radiology 1991;
179:829–32.
[25] Lien HH, Blomlie V, Trope C, Kaern J, Abeler VM.
Cancer of the endometrium: value of MR imaging in
determining depth of invasion into the myometrium.
AJR Am J Roentgenol 1991;157:1221–3.
[26] Frei KA, Kinkel K, Bonel HM, Lu Y, Zaloudek C,
Hricak H, et al. Prediction of deep myometrial invasion
in patients with endometrial cancer: clinical utility of
contrast-enhanced MR imaging. A meta-analysis and
Bayesian analysis. Radiology 2000;216:444–9.
[27] Ascher SM, Scoutt LM, McCarthy SM, Lange RC, De-
Cherney AH. Uterine changes following dilation and
curettage: MRI findings. Radiology 1991;180:433–5.
[28] Takahashi S, Murakami T, Narumi Y, Kurach H, Tsuda
K, Kim T, et al. Preoperative staging of endometrial
carcinoma: diagnostic effect of T2-weighted fast spin
echo MR imaging. Radiology 1998;206:539–47.
[29] Saez F, Urresola A, Larena JA, Marin JI, Pijuan JI,
Schneider J, et al. Endometrial carcinoma: assessment
of myometrial invasion with plain and gadolinium-
enhanced MR imaging. J Magn Reson Med 2000;
12:460–6.
[30] Seki H, Kimura M, Sakai K. Myometrial invasion of
endometrial carcinoma: assessment with dynamic MR
and contrast-enhanced T1-weighted images. Clin Ra-
diol 1997;52:18–23.
[31] Scoutt LM, McCarthy SM, Flynn SD, Lange RC, Long
F, Smith RC, et al. Clinical stage I endometrial carci-
noma: pitfalls in pre-operative assessment with MR
imaging. Radiology 1995;194:567–72.
[32] Sironi S, Columbo E, Villa G, Taccagni G, Belloni C,
Garancini P, et al. Myometrial invasion by endometrial
carcinoma: assessment with plain and gadolinium-en-
hanced MR imaging. Radiology 1992;185:207–12.
[33] Yamashita Y, Harada M, Sawada T, Takahashi M,
Miyazake K, Okamura H. Normal uterus and FIGO
stage I endometrial carcinoma: dynamic gadolinium-
enhanced MR imaging. Radiology 1993;18:495–501.
[34] Outwater EK, Siegelman ES,Wilson KM,Mitchell DG.
Benign and malignant gynecologic disease: clinical im-
portance of fluid and peritoneal enhancement in the pel-
vis at MR imaging. Radiology 1996;200:483–8.
[35] Low RN, Carter WD, Saleh F, Sigeti J. Ovarian
cancer: comparison of findings with perfluorocarbon-
enhanced MR imaging, In-111-CYT-103 immuno-
scintigraphy, and CT. Radiology 1995;195:391–400.
[36] Low RN, Sigeti JS. MR imaging of peritoneal disease:
comparison of contrast-enhanced fast multiplanar
spoiled gradient-recalled and spin-echo imaging. AJR
Am J Roentgenol 1994;163:1131–40.
[37] Roberts JA, Burnetto VL, Keys HM, et al. A phase III
randomized study of surgery vs surgery plus adjunctive
radiation therapy in intermediate risk endometrial ad-
enocarcinoma (GOG 99) [abstract]. Gynecol Oncol
1998;68:135.
S.M. Ascher, C. Reinhold / Radiol Clin N Am 40 (2002) 563–576576
Imaging of cancer of the cervix
Juergen Scheidler, MDa,*, Andreas F. Heuck, MDb
aDepartment of Clinical Radiology, Ludwig-Maximilians-University of Munich, Klinikum Grosshadern, D-81366,
Munich, GermanybRadiology Associates, Radiologisches Zentrum Munchen-Pasing, Pippinger Strasse 25, D-81245, Munich, Germany
Rapid advances in imaging technology have
resulted in significant changes in imaging algorithms
of the female pelvis. Ultrasound is considered an
adjunct to physical examination and is often the
initial imaging study ordered. CT represents a tech-
nical advance over ultrasound for staging of pelvic
neoplasms. The relative lack of soft tissue contrast
resolution, the necessity for injection of contrast
material, and exposure of the patient to ionizing
radiation, however, detracts from its usefulness.
MRI has proved to be a most valuable diagnostic
tool in studying the female pelvis. As documented by
numerous studies during the last decade, MRI offers
a noninvasive assessment of normal anatomy, con-
genital anomalies, and benign and malignant diseases
of the uterus. For most conditions, it has proved to be
superior to clinical examination, ultrasound, and CT.
Continuing advances in MRI of the pelvis, including
the development of new pulse sequences and coil
techniques, the use of gadolinium chelates as para-
magnetic contrast media, and the growing experience
of radiologists, have further increased the potential of
MRI as a problem-solving modality and helped to
establish its immediate and cost-effective impact on
treatment alternatives [1,2].
This article reviews the current status of cross-
sectional imaging modalities for the diagnosis and
staging of cervical cancer. With emphasis on MRI,
imaging strategies and their impact on treatment
decision and planning in cervical cancer are discussed.
Epidemiology and cancer prognostic factors
In the United States, carcinoma of the cervix is the
second most common gynecologic malignancy in
women, accounting for 15,700 new cases (6% of all
cancers) and 4900 deaths in the year 2001. World-
wide, cervical cancer is second only to breast cancer
as the most common malignancy in both incidence
and mortality. More than 471,000 new cases are
diagnosed each year, predominantly among the eco-
nomically disadvantaged, in both developing and
industrialized nations. During the last 50 years in
the United States, the use of screening programs
based on the Papanicolaou smear and pelvic exami-
nation has led to a steep decline in incidence of and
deaths from cervical cancer.
Cervical cancer occurs more frequently in young
women of low socioeconomic standing. The average
age at diagnosis is about 50 years with peaks at 38
and 62 years. Risk factors include early age at first
intercourse, a high number of sexual partners, multi-
parity, cigarette smoking, and a history of sexually
transmitted diseases. Strong evidence suggests that
the human papilloma virus is a main cause of
cervical carcinoma.
Cervical intraepithelial neoplasia (CIN) is consid-
ered a precursor lesion of cervical cancer. CIN is
characterized into three groups: (1) CIN 1, minor
dysplasia; (2) CIN 2, moderate dysplasia; and (3)
CIN 3, severe dysplasia or carcinoma in situ. Up to
40% of CIN 3 lesions progress to invasive carcinoma
if left untreated.
Carcinoma arises at the squamocolumnar junction,
which is located exophytic in young women. In these
individuals, cervical carcinoma grows predominantly
exophytic and large parts of the tumor extend inferi-
0033-8389/02/$ – see front matter D 2002, Elsevier Science (USA). All rights reserved.
PII: S0033 -8389 (01 )00007 -0
* Corresponding author. Associate Clinical Professor of
Radiology, Radiologic Center of Munich, Pippinger Str. 25,
D-81245 Munich, Germany.
E-mail address: [email protected] (J. Scheidler).
Radiol Clin N Am 40 (2002) 577–590
orly into the vagina. In older women with atrophic
cervices, however, the squamocolumnar junction is
located in the endocervical canal. Tumors occurring
inside the endocervical canal account for approxi-
mately 20% of cervical carcinomas, more commonly
involve the supravaginal portion of the cervix, and
frequently extend laterally through the cervical wall.
Two main histologic types of cervical carcinoma
can be differentiated: (1) squamous cell carcinoma,
which accounts for 80% to 90% of cases; and (2)
adenocarcinoma, which carries the worst prognosis.
Other important prognostic factors are the histologic
grade of tumor; the location within the cervix (exo-
cervix versus endocervix); the tumor volume and the
depth of stromal invasion; adjacent tissue extension;
and lymph node involvement at the time of treatment.
Clinically, the leading symptoms of cervical car-
cinoma are bleeding and vaginal discharge. Physical
pelvic examination commonly reveals a more or less
necrotic and bleeding tumor. In a number of patients,
however, speculum examination may reveal a normal
cervix when the carcinoma is located within the
cervical canal or occult. In these cases, detection of
cervical carcinoma is often based on exfoliate cytol-
ogy (Papanicolaou smear). In cases with a grossly
visible mass the definite diagnosis is made with
biopsy. Primary clinical information about local
tumor spread is provided by bimanual vaginal and
rectal examinations.
Staging
The classic staging of cervical carcinoma is clinical
and uses the Federation Internationale de Gynecologie
et d’Obstetrique (FIGO) classification (Table 1). The
TNM staging classification is essentially based on the
same criteria as the FIGO system (see Table 1). In
addition to the standard physical examination, FIGO
staging may include findings from examination under
anesthesia, cystoscopy, rectosigmoidoscopy, barium
enema, biopsy, intravenous pyelography, and chest
radiography. When compared with intraoperative and
pathologic findings, however, clinical staging shows
errors of 20% to 35% depending on the stage of
disease [1,3–5]. In addition, up to 25% of patients
have metastasis to the locoregional pelvic or to the
para-aortal lymph nodes that cannot be detected by
clinical examination. Moreover, extension to the blad-
der or adjacent bowel is difficult to define clinically.
These shortcomings of the clinical FIGO staging
system underline the importance of an accurate imag-
ing evaluation of carcinoma of the cervix. Ultrasound
is considered an adjunct to physical examination.
Technical limitations (caused by the patient’s habitus,
operator dependence, and low signal-to-noise ratio)
and lack of tissue characterization severely decrease
the diagnostic value of sonography in cervical cancer.
In addition, ultrasound is inadequate for staging
pelvic malignancies [6,7].
CT is not well suited to evaluate tumor size or
stromal invasion because it cannot distinguish cancer
from the surrounding normal cervical tissue [8]. In
general, the accuracy of CT in staging cervical carci-
noma is limited. In evaluating the stage of disease,
MRI was found to have an accuracy of 90%, compared
with 65% for CT [8]. Both modalities, however, were
comparable in evaluating lymph node metastases
(86% each). In identifying parametrial involvement,
CT has an accuracy of 55% to 70% and the overall
staging accuracy is as low as 45% to 63% [5,8,9].
MRI performed at high field strengths is the most
reliable pretherapeutic modality for the detection or
exclusion of parametrial spread, the overall tumor
staging, and for lymph node assessment [4,5,10–16].
MRI plays an important role in selecting patients for
surgery or radiation therapy.
MRI appearance of cervical carcinoma
Cervical cancer appears as a relatively hyperin-
tense mass on T2-weighted imaging, and is easily
Table 1
Staging systems for cervical neoplasms
TNM Cervix FIGO
T1 Limited to uterus I
T1a Preclinical invasive carcinoma IA
T1a1 Depth � 3 mm, horizontal
spread � 7 mm
IA1
T1a2 Depth 3–5 mm, horizontal
spread � 7 mm
IA2
T1b Tumor greater than T1a2 IB
T2 Beyond uterus but not to pelvic
side wall or lower third of vagina
II
T2a No parametrial invasion IIA
T2b With parametrial invasion IIB
T3 Extends to the pelvic wall or
involves lower third of the vagina
or hydronephrosis
III
T3a Lower third of vagina,
not to pelvic side wall
IIIA
T3b Pelvic side wall or
hydronephrosis
IIIB
T4 Tumor invades bladder
mucosa or rectum; extends
beyond true pelvis
IVA
M1 Distant metastasis (including lymph
nodes beyond the true pelvis)
IVB
J. Scheidler, A.F. Heuck / Radiol Clin N Am 40 (2002) 577–590578

Fig. 1. Normal appearance of the uterus on T2-weighted sagittal (A) and transversal (B) images after vaginal opacification with
ultrasound jelly. Note the low signal intensity stroma (C ) and the excellent delineation of the dorsal vaginal fornix (white
arrow) and the dorsal and anterior (black arrow) vaginal wall. Small intramural leiomyoma (diamond ). OV= ovary;
UB= urinary bladder.
J. Scheidler, A.F. Heuck / Radiol Clin N Am 40 (2002) 577–590 579

distinguishable from the normal low signal intensity
cervical stroma (Figs. 1, 2). Adenocarcinomas
(approximately 10% of cervical carcinomas) usually
have higher signal intensity on heavily T2-weighted
images (Fig. 3) than squamous cell cancer (90%). As
has been demonstrated by histopathologic correlation,
location and size of an invasive tumor can be deter-
mined accurately on T2-weighted images even in
clinically problematic lesions [13,15–19]. The accu-
racy in determining the depth of stromal invasion is
also high (about 80%) [5,11]. Preinvasive disease,
however, usually cannot be identified with MRI.
The contrast uptake of cervical carcinoma varies
considerably. Both strong enhancing tumors and
lesions revealing intermediate enhancement are seen
after intravenous gadolinium administration. Viable
tumors and areas of necrosis can be distinguished
with the use of gadolinium chelates. Because contrast
enhancement may render the tumor isointense to the
surrounding high-signal cervical and parametrial tis-
sue on T1-weighted images, however, it has not been
shown to increase diagnostic performance in tumor
depiction, in the definition of the depth of stromal
invasion, and in the evaluation of early parametrial
involvement [14,20,21]. Even so, contrast-enhanced
imaging may be helpful in the evaluation of tumor
extension to the pelvic side wall or into adjacent
organs, such as rectum or urinary bladder [20].
Fig. 2. Cervical carcinoma FIGO stage Ib. Sagittal (A) and
axial (B) T2-weighted images. The tumor (star) is located
endocervically. No extension to the vagina is seen (A).
Parametrial invasion can be excluded because of the
preserved dark rim of normal cervical stroma surrounding
the tumor (star).
Fig. 3. Adenocarcinoma of the cervix. T2-weighted sagittal
image. Compared with the squamous cell carcinoma
presented in Fig. 2, the signal intensity of the tumor is
higher. The tumor presents with full-thickness stromal
invasion of the cervix (arrows). The occlusion of the
cervical canal leads to fluid retention within the dilated
uterine cavity (star).
J. Scheidler, A.F. Heuck / Radiol Clin N Am 40 (2002) 577–590580
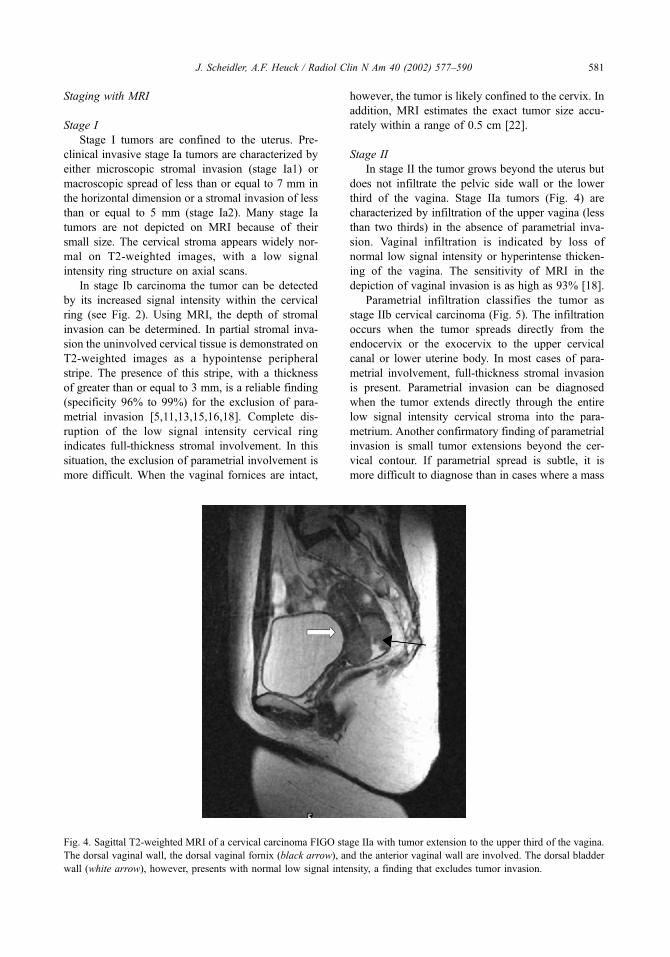
Staging with MRI
Stage I
Stage I tumors are confined to the uterus. Pre-
clinical invasive stage Ia tumors are characterized by
either microscopic stromal invasion (stage Ia1) or
macroscopic spread of less than or equal to 7 mm in
the horizontal dimension or a stromal invasion of less
than or equal to 5 mm (stage Ia2). Many stage Ia
tumors are not depicted on MRI because of their
small size. The cervical stroma appears widely nor-
mal on T2-weighted images, with a low signal
intensity ring structure on axial scans.
In stage Ib carcinoma the tumor can be detected
by its increased signal intensity within the cervical
ring (see Fig. 2). Using MRI, the depth of stromal
invasion can be determined. In partial stromal inva-
sion the uninvolved cervical tissue is demonstrated on
T2-weighted images as a hypointense peripheral
stripe. The presence of this stripe, with a thickness
of greater than or equal to 3 mm, is a reliable finding
(specificity 96% to 99%) for the exclusion of para-
metrial invasion [5,11,13,15,16,18]. Complete dis-
ruption of the low signal intensity cervical ring
indicates full-thickness stromal involvement. In this
situation, the exclusion of parametrial involvement is
more difficult. When the vaginal fornices are intact,
however, the tumor is likely confined to the cervix. In
addition, MRI estimates the exact tumor size accu-
rately within a range of 0.5 cm [22].
Stage II
In stage II the tumor grows beyond the uterus but
does not infiltrate the pelvic side wall or the lower
third of the vagina. Stage IIa tumors (Fig. 4) are
characterized by infiltration of the upper vagina (less
than two thirds) in the absence of parametrial inva-
sion. Vaginal infiltration is indicated by loss of
normal low signal intensity or hyperintense thicken-
ing of the vagina. The sensitivity of MRI in the
depiction of vaginal invasion is as high as 93% [18].
Parametrial infiltration classifies the tumor as
stage IIb cervical carcinoma (Fig. 5). The infiltration
occurs when the tumor spreads directly from the
endocervix or the exocervix to the upper cervical
canal or lower uterine body. In most cases of para-
metrial involvement, full-thickness stromal invasion
is present. Parametrial invasion can be diagnosed
when the tumor extends directly through the entire
low signal intensity cervical stroma into the para-
metrium. Another confirmatory finding of parametrial
invasion is small tumor extensions beyond the cer-
vical contour. If parametrial spread is subtle, it is
more difficult to diagnose than in cases where a mass
Fig. 4. Sagittal T2-weighted MRI of a cervical carcinoma FIGO stage IIa with tumor extension to the upper third of the vagina.
The dorsal vaginal wall, the dorsal vaginal fornix (black arrow), and the anterior vaginal wall are involved. The dorsal bladder
wall (white arrow), however, presents with normal low signal intensity, a finding that excludes tumor invasion.
J. Scheidler, A.F. Heuck / Radiol Clin N Am 40 (2002) 577–590 581
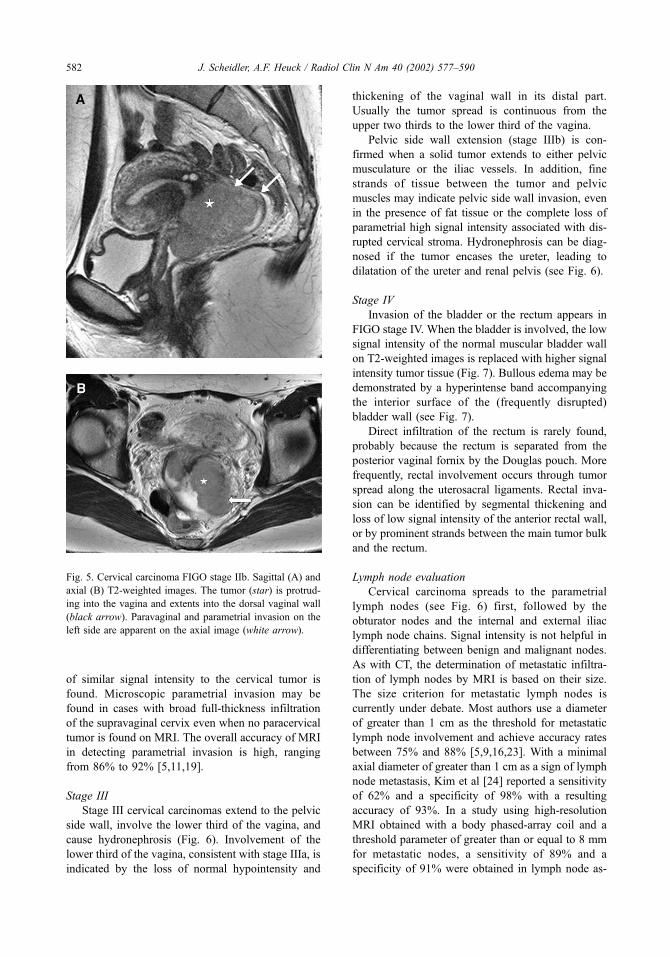
of similar signal intensity to the cervical tumor is
found. Microscopic parametrial invasion may be
found in cases with broad full-thickness infiltration
of the supravaginal cervix even when no paracervical
tumor is found on MRI. The overall accuracy of MRI
in detecting parametrial invasion is high, ranging
from 86% to 92% [5,11,19].
Stage III
Stage III cervical carcinomas extend to the pelvic
side wall, involve the lower third of the vagina, and
cause hydronephrosis (Fig. 6). Involvement of the
lower third of the vagina, consistent with stage IIIa, is
indicated by the loss of normal hypointensity and
thickening of the vaginal wall in its distal part.
Usually the tumor spread is continuous from the
upper two thirds to the lower third of the vagina.
Pelvic side wall extension (stage IIIb) is con-
firmed when a solid tumor extends to either pelvic
musculature or the iliac vessels. In addition, fine
strands of tissue between the tumor and pelvic
muscles may indicate pelvic side wall invasion, even
in the presence of fat tissue or the complete loss of
parametrial high signal intensity associated with dis-
rupted cervical stroma. Hydronephrosis can be diag-
nosed if the tumor encases the ureter, leading to
dilatation of the ureter and renal pelvis (see Fig. 6).
Stage IV
Invasion of the bladder or the rectum appears in
FIGO stage IV. When the bladder is involved, the low
signal intensity of the normal muscular bladder wall
on T2-weighted images is replaced with higher signal
intensity tumor tissue (Fig. 7). Bullous edema may be
demonstrated by a hyperintense band accompanying
the interior surface of the (frequently disrupted)
bladder wall (see Fig. 7).
Direct infiltration of the rectum is rarely found,
probably because the rectum is separated from the
posterior vaginal fornix by the Douglas pouch. More
frequently, rectal involvement occurs through tumor
spread along the uterosacral ligaments. Rectal inva-
sion can be identified by segmental thickening and
loss of low signal intensity of the anterior rectal wall,
or by prominent strands between the main tumor bulk
and the rectum.
Lymph node evaluation
Cervical carcinoma spreads to the parametrial
lymph nodes (see Fig. 6) first, followed by the
obturator nodes and the internal and external iliac
lymph node chains. Signal intensity is not helpful in
differentiating between benign and malignant nodes.
As with CT, the determination of metastatic infiltra-
tion of lymph nodes by MRI is based on their size.
The size criterion for metastatic lymph nodes is
currently under debate. Most authors use a diameter
of greater than 1 cm as the threshold for metastatic
lymph node involvement and achieve accuracy rates
between 75% and 88% [5,9,16,23]. With a minimal
axial diameter of greater than 1 cm as a sign of lymph
node metastasis, Kim et al [24] reported a sensitivity
of 62% and a specificity of 98% with a resulting
accuracy of 93%. In a study using high-resolution
MRI obtained with a body phased-array coil and a
threshold parameter of greater than or equal to 8 mm
for metastatic nodes, a sensitivity of 89% and a
specificity of 91% were obtained in lymph node as-
Fig. 5. Cervical carcinoma FIGO stage IIb. Sagittal (A) and
axial (B) T2-weighted images. The tumor (star) is protrud-
ing into the vagina and extents into the dorsal vaginal wall
(black arrow). Paravaginal and parametrial invasion on the
left side are apparent on the axial image (white arrow).
J. Scheidler, A.F. Heuck / Radiol Clin N Am 40 (2002) 577–590582

sessment [10]. A comparative meta-analysis between
lymphangiography, CT, and MRI showed MRI to be
slightly better than lymphangiography in detecting
lymph node metastasis, whereas CT and MRI were
not significantly different [25].
Imaging strategies for detection, diagnosis,
and staging
The role of imaging in the diagnostic work-up of
cervical carcinoma is not to prove the presence of a
Fig. 6. Cervical carcinoma FIGO stage IIIb. Axial T2-weighted turbo spin echo (TSE) (A), axial HASTE (B), and coronal T2-
weighted TSE images (C, D). Left side parametrial invasion is evident both on axial T2-weighted TSE and HASTE images
(straight arrow); however, parametrial lymph node metastases on the right side (black arrows) are much better identified on the
high-resolution T2-weighted TSE sequence than on the low-resolution HASTE sequence. Parametrial tumor invasion is encasing
the left ureter (curved arrow), leading to dilatation and hydronephrosis.
J. Scheidler, A.F. Heuck / Radiol Clin N Am 40 (2002) 577–590 583
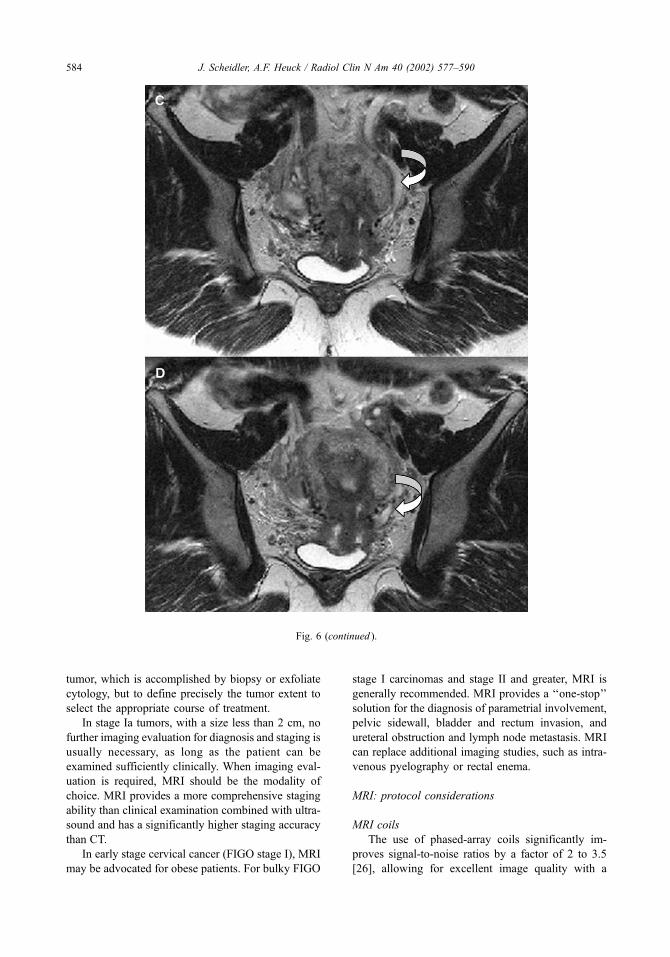
tumor, which is accomplished by biopsy or exfoliate
cytology, but to define precisely the tumor extent to
select the appropriate course of treatment.
In stage Ia tumors, with a size less than 2 cm, no
further imaging evaluation for diagnosis and staging is
usually necessary, as long as the patient can be
examined sufficiently clinically. When imaging eval-
uation is required, MRI should be the modality of
choice. MRI provides a more comprehensive staging
ability than clinical examination combined with ultra-
sound and has a significantly higher staging accuracy
than CT.
In early stage cervical cancer (FIGO stage I), MRI
may be advocated for obese patients. For bulky FIGO
stage I carcinomas and stage II and greater, MRI is
generally recommended. MRI provides a ‘‘one-stop’’
solution for the diagnosis of parametrial involvement,
pelvic sidewall, bladder and rectum invasion, and
ureteral obstruction and lymph node metastasis. MRI
can replace additional imaging studies, such as intra-
venous pyelography or rectal enema.
MRI: protocol considerations
MRI coils
The use of phased-array coils significantly im-
proves signal-to-noise ratios by a factor of 2 to 3.5
[26], allowing for excellent image quality with a
Fig. 6 (continued ).
J. Scheidler, A.F. Heuck / Radiol Clin N Am 40 (2002) 577–590584

reduction of the field of view to 16 cm and the slice
thickness to 4 mm. With these parameters, the spatial
resolution approaches an in-plane resolution of 0.6
mm2. Early technical problems of phased-array coils,
such as increased motion and ghosting artifacts
caused by very high signal intensity in the near field,
have been almost completely resolved. Very obese
patients or those with protuberance of the abdomen
caused by tumor or ascites, however, may not be
suited for phased-array coil imaging.
Endovaginal and endorectal coil imaging may be
applied to study cervical cancer. It allows for excel-
lent signal-to-noise levels with a reduction of the field
of view to below 10 cm. Endovaginal coil images
provide excellent details of the anatomy of the cervix,
including tumor presence and extent, and the para-
metrial space [27,28]. No study, however, has yet to
provide definitive evidence of the advantages of
endocoils over phased-array surface coils.
Pulse sequences and imaging planes
Heavily T2-weighted high-resolution images are
essential for depicting normal zonal anatomy and
pathologic changes of the uterus and vagina. T2-
weighted turbo spin echo (TSE) or fast spin echo
(FSE) sequences provide anatomic and pathologic
information superior to that provided by conventional
spin echo sequences. TSE sequences allow higher
signal-to-noise ratios and a significant decrease in
imaging time (by a factor of 3 to 4) leading to a
considerable reduction in motion artifacts [29,30].
TSE sequences have fully replaced conventional spin
echo sequences for T2-weighted imaging.
Breath-hold T2-weighted TSE sequences are
rarely used in the pelvis because they do not provide
the necessary resolution and are still susceptible to
motion artifacts. In contrast, single-shot T2-weighted
sequences of the half fourier single-shot turbo spin
echo (HASTE) or single-shot FSE (ss-FSE) type are
very robust against artifacts and even can be used in
free breathing and uncooperative patients [31]. The
HASTE (ss-FSE) technique, however, suffers from
insufficient resolution and T2 contrast to detect even
small lymph node metastases (see Fig. 6).
Short tau inversion recovery (STIR) sequences
provide two general features: (1) robust fat suppres-
sion and (2) positive T1 and T2 contrast. By sup-
pressing the normally intense signal from fat, STIR
sequences greatly increase the ability to identify
structures or lesions that are surrounded by fat, such
as the parametria or lymph nodes. Because of
sequence properties, T1 and T2 contrasts are additive
with STIR imaging, enhancing the contrast between
lesions and low signal fat tissue. Despite these
properties STIR sequences have not yet been shown
to be superior to T2-weighted TSE sequences in
imaging of the uterus [19].
Advances in shim procedures helped to make
spectral fat-saturation techniques available as a robust
technique even in phased-array coil studies. Fat
saturation may be applied to either T2- or T1-
weighted contrast-enhanced sequences. The useful-
ness of both fat-suppressed T2-weighted sequences
for staging and fat-suppressed contrast-enhanced T1-
weighted sequences for the detection of parametrial
involvement, however, did not surpass the diagnostic
value of standard T2-weighted TSE sequences with-
out fat suppression [19,32].
Motion artifact suppression
Suppression of motion artifacts should be per-
formed whenever possible. If special software to
compensate for respiratory motion is available, it
should be used. If it is unavailable, a strap band
over the pelvis is helpful. Pulsation artifacts should
be suppressed by flow compensation techniques.
For the reduction of artifacts caused by bowel
Fig. 7. FIGO stage IVa cervical carcinoma with invasion of
the dorsal bladder wall. Sagittal T2-weighted TSE images
with vaginal opacification using ultrasound jelly. The large
central necrotic (star) tumor is occluding the cervical canal,
leading to fluid retention within the uterine cavity. The
tumor extends to the lower third of the anterior vaginal wall
(white arrow) and invades the urinary bladder (black arrow).
J. Scheidler, A.F. Heuck / Radiol Clin N Am 40 (2002) 577–590 585
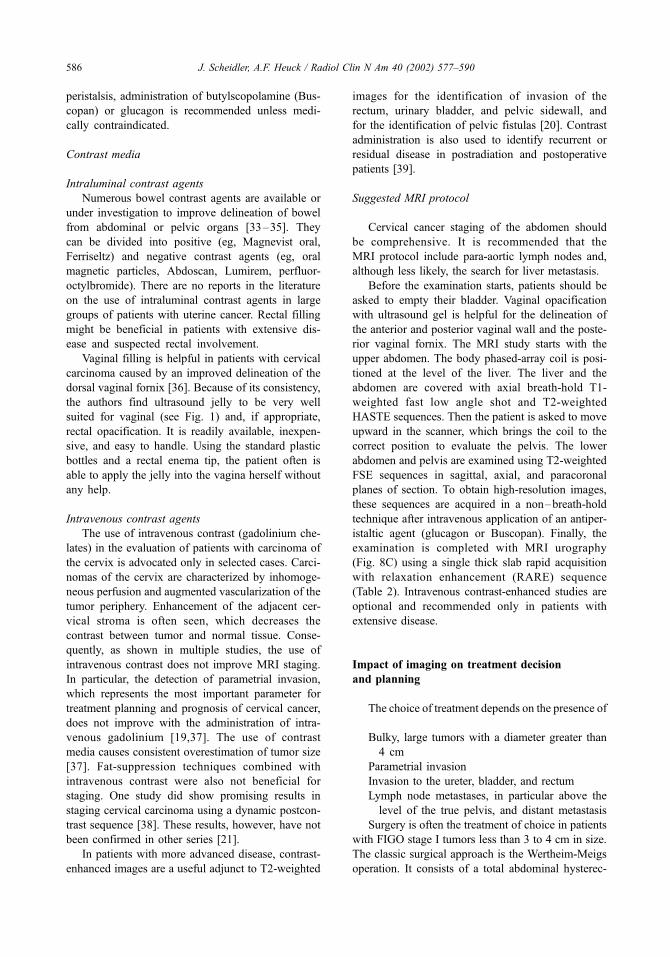
peristalsis, administration of butylscopolamine (Bus-
copan) or glucagon is recommended unless medi-
cally contraindicated.
Contrast media
Intraluminal contrast agents
Numerous bowel contrast agents are available or
under investigation to improve delineation of bowel
from abdominal or pelvic organs [33–35]. They
can be divided into positive (eg, Magnevist oral,
Ferriseltz) and negative contrast agents (eg, oral
magnetic particles, Abdoscan, Lumirem, perfluor-
octylbromide). There are no reports in the literature
on the use of intraluminal contrast agents in large
groups of patients with uterine cancer. Rectal filling
might be beneficial in patients with extensive dis-
ease and suspected rectal involvement.
Vaginal filling is helpful in patients with cervical
carcinoma caused by an improved delineation of the
dorsal vaginal fornix [36]. Because of its consistency,
the authors find ultrasound jelly to be very well
suited for vaginal (see Fig. 1) and, if appropriate,
rectal opacification. It is readily available, inexpen-
sive, and easy to handle. Using the standard plastic
bottles and a rectal enema tip, the patient often is
able to apply the jelly into the vagina herself without
any help.
Intravenous contrast agents
The use of intravenous contrast (gadolinium che-
lates) in the evaluation of patients with carcinoma of
the cervix is advocated only in selected cases. Carci-
nomas of the cervix are characterized by inhomoge-
neous perfusion and augmented vascularization of the
tumor periphery. Enhancement of the adjacent cer-
vical stroma is often seen, which decreases the
contrast between tumor and normal tissue. Conse-
quently, as shown in multiple studies, the use of
intravenous contrast does not improve MRI staging.
In particular, the detection of parametrial invasion,
which represents the most important parameter for
treatment planning and prognosis of cervical cancer,
does not improve with the administration of intra-
venous gadolinium [19,37]. The use of contrast
media causes consistent overestimation of tumor size
[37]. Fat-suppression techniques combined with
intravenous contrast were also not beneficial for
staging. One study did show promising results in
staging cervical carcinoma using a dynamic postcon-
trast sequence [38]. These results, however, have not
been confirmed in other series [21].
In patients with more advanced disease, contrast-
enhanced images are a useful adjunct to T2-weighted
images for the identification of invasion of the
rectum, urinary bladder, and pelvic sidewall, and
for the identification of pelvic fistulas [20]. Contrast
administration is also used to identify recurrent or
residual disease in postradiation and postoperative
patients [39].
Suggested MRI protocol
Cervical cancer staging of the abdomen should
be comprehensive. It is recommended that the
MRI protocol include para-aortic lymph nodes and,
although less likely, the search for liver metastasis.
Before the examination starts, patients should be
asked to empty their bladder. Vaginal opacification
with ultrasound gel is helpful for the delineation of
the anterior and posterior vaginal wall and the poste-
rior vaginal fornix. The MRI study starts with the
upper abdomen. The body phased-array coil is posi-
tioned at the level of the liver. The liver and the
abdomen are covered with axial breath-hold T1-
weighted fast low angle shot and T2-weighted
HASTE sequences. Then the patient is asked to move
upward in the scanner, which brings the coil to the
correct position to evaluate the pelvis. The lower
abdomen and pelvis are examined using T2-weighted
FSE sequences in sagittal, axial, and paracoronal
planes of section. To obtain high-resolution images,
these sequences are acquired in a non–breath-hold
technique after intravenous application of an antiper-
istaltic agent (glucagon or Buscopan). Finally, the
examination is completed with MRI urography
(Fig. 8C) using a single thick slab rapid acquisition
with relaxation enhancement (RARE) sequence
(Table 2). Intravenous contrast-enhanced studies are
optional and recommended only in patients with
extensive disease.
Impact of imaging on treatment decision
and planning
The choice of treatment depends on the presence of
Bulky, large tumors with a diameter greater than
4 cm
Parametrial invasion
Invasion to the ureter, bladder, and rectum
Lymph node metastases, in particular above the
level of the true pelvis, and distant metastasis
Surgery is often the treatment of choice in patients
with FIGO stage I tumors less than 3 to 4 cm in size.
The classic surgical approach is the Wertheim-Meigs
operation. It consists of a total abdominal hysterec-
J. Scheidler, A.F. Heuck / Radiol Clin N Am 40 (2002) 577–590586

tomy including the resection of the upper third of the
vagina, the excision of parametrial and paravaginal
tissue including the sacrouterine ligaments, and pel-
vic and para-aortic lymph node dissection. With the
advent of laparoscopic approaches, a number of new
techniques have been introduced.
There is no agreement on the recommended
approach in patients with large stage I tumors and
patients with early parametrial invasion (early FIGO
stage IIb). Several centers prefer to combine chemo-
therapy and radiotherapy, whereas few still perform a
radiohysterectomy. Surgery may have the advantage
of retaining the option of radiotherapy in the event of
tumor recurrence. Recent prospective studies have
revealed no difference in survival rates between
radiotherapy and surgery in these patients [40];
however, morbidity increases significantly when
radiotherapy is combined with surgery. This fact
underlines the importance of preoperative staging
for correct treatment assignment. Because of the
inaccuracy of clinical FIGO staging, preoperative
imaging plays an important role in identifying
patients who will benefit from surgery. In selecting
operative candidates (stage I and minimal stage IIa
tumors), MRI is more accurate than CT (94% versus
76%) [8]. After the inclusion of MRI in the pretreat-
ment work-up of patients with cervical cancer, sig-
nificantly fewer procedures and fewer invasive
studies are performed [1]. Additional studies to
exclude bladder and rectal invasion (eg, barium
enema, cystoscopy, or proctoscopy) are avoided and
significant cost savings are gained [1].
Fig. 8. Cervical cancer recurrence at the left pelvic wall. Axial (A) and coronal (B) T2-weighted TSE images and MRI urography
using a rapid acquisition with relaxation enhancement (RARE) sequence (C). The tumor recurrence (star) approaches the left
pelvic side wall (black arrow). No residual fat plane is left between the tumor recurrence and the pelvic wall. Ultrafast (7 s) thick-
slice (70 mm) MRI urography (C) using a RARE sequence nicely demonstrates the tumor-related encasement and stenosis of the
left distal ureter (white arrow).
J. Scheidler, A.F. Heuck / Radiol Clin N Am 40 (2002) 577–590 587

The impact of MRI on treatment decisions and
costs was examined by Schwartz et al [2] in an
unselected patient population that included patients
with cervical carcinoma. Their study demonstrates
that the use of pelvic MRI may alter treatment,
decrease the number of invasive surgical procedures
performed, and reduce total health care expenditures.
The presence of pelvic or para-aortic lymph node
metastasis excludes surgery in patients with cervical
cancer. CT and MRI perform equally in the assess-
ment of pelvic and para-aortic lymph node metastasis
with an accuracy of 86% to 93% [8,24]. The use of
lymphangiography for lymph node staging is no
longer advocated. The change in the evaluation of
lymph nodes results from the invasive nature of
lymphangiography, not the results that there are no
significant differences in the accuracy between lym-
phangiography, CT, and MRI [25]. In fact, a trend
toward better performance was noticed for MRI than
for lymphangiography or CT [25]. Because CT and
MRI are less invasive than lymphangiography and
also assess local tumor extent, the use of lymphan-
giography for patient selection cannot be justified
anymore and cross-sectional imaging should be con-
sidered the preferred adjunct to clinical evaluation of
invasive cervical cancer.
Recurrent cervical cancer may be found in up to
20% of cases. Therapeutic options include surgery,
radiation therapy, and chemotherapy depending on
the primary tumor therapy and the location and the
extent of tumor recurrence. MRI is well suited for the
diagnosis of cervical cancer recurrence because of its
high soft tissue contrast. Determination of the extent
of recurrence with MRI may offer clinical assistance
in the selection of optimal therapy. MRI is in partic-
ular useful for the differentiation of recurrent cervical
carcinoma from radiation changes [41]. The presence
of completely low signal intensity stroma around the
endocervical canal and normal paracervical tissues
exclude recurrence after radiation therapy with a
negative predictive value of 97% [42]. A distinct
mass of intermediate to high signal intensity on T2-
weighted images is highly suspicious of a recurrent
tumor (positive predictive value 86%). In contrast to
Table 2
Suggested MRI protocol for cervical cancer staging (body phased-array coil, vaginal opacification recommended)
Sequence type Plane of section NEX
SL
(mm)
FOV
(mm) Matrix Comment
Upper abdomen
GRE (FLASH) T1w Transversal 1 8 350 256 Breath-hold, covering the liver and the
upper abdomen
T2w-HASTE (ssFSE) Transversal 1 8 350 512 Breathhold, covering the liver and the
upper abdomen
Lower abdomen and pelvis
T2w-TSE (FSE) Transversal 2 5 350 512 After intravenous application of
Glucagon or Buscopan,
non–breath-hold
T1w-GRE or SE Transversal 1 5–8 350 256 or 512 Either breath-hold GRE (256 matrix,
8 mm SL) or non–breath-hold SE
(512 matrix, 5 mm SL)
T2w-TSE (FSE) Sagittal 2 4 350 512 Non–breath-hold
Optional
T2w-TSE Paracoronal 2 4 400 512 Non–breath-hold, orientated along the
axis of the cervical canal
RARE Coronal 1 80 400 512 Single-shot thick slab breath-hold
MRI-urography
Optional (postgadolinium intravenously)
T1w-GRE or SE Transversal 1 5–8 350 256 or 512 Either breath-hold GRE (256 matrix,
8 mm SL) or non–breath-hold SE
(512 matrix, 5 mm SL)
Abbreviations: FLASH, fast low angle shot; FOV, field of view; GRE, gradient recalled echo; HASTE, half fourier single-shot
turbo spin echo; NEX, number of acquisitions; RARE, rapid acquisition with relaxation enhancement; SE, spin echo; SL, slice
thickness; ss-FSE, single-shot fast spin echo; T1w, T1 weighted; T2w, T2 weighted; TSE, turbo spin echo.
J. Scheidler, A.F. Heuck / Radiol Clin N Am 40 (2002) 577–590588

recurrent tumor, late fibrosis displays low signal
intensity on T2-weighted images. Within the first
year after therapy, however, early fibrosis, mainly
containing granulation tissue with a high degree of
vascularization, is often present. It may be difficult or
impossible to distinguish early fibrosis from residual
or recurrent tumor, even if intravenous contrast
medium is administered [42,43].
References
[1] Hricak H, Powell CB, Yu KK, Washington E, Subak
LL, Stern JL, et al. Invasive cervical carcinoma: role
of MRI in pretreatment work-up– cost minimization
and diagnostic efficacy analysis. Radiology 1996;198:
403–9.
[2] Schwartz LB, Panageas E, Lange R, Rizzo J, Comite F,
McCarthy S. Female pelvis: impact of MRI on treat-
ment decisions and net cost analysis. Radiology
1994;192: 55–60.
[3] Chung CK, Nahhas WA, Zaino R, Stryker JA, Mortel
R. Histologic grade and lymph node metastasis in squ-
amous cell carcinoma of the cervix. Gynecol Oncol
1981;12:348–54.
[4] Cobby M, Browning J, Jones A, Whipp E, Goddard P.
Magnetic resonance imaging, computed tomography
and endosonography in the local staging of carcinoma
of the cervix. Br J Radiol 1990;63:673–9.
[5] Kim SH, Choi BI, Lee HP, Kang SB, Choi YM, Han
MC, et al. Uterine cervical carcinoma: comparison of
CT and MR findings. Radiology 1990;175:45–51.
[6] Kerr-Wilson RH, Shingleton HM, Orr Jr JW, Hatch
KD. The use of ultrasound and computed tomography
scanning in the management of gynecologic cancer
patients. Gynecol Oncol 1984;18:54–61.
[7] O’Brien WF, Buck DR, Nash JD. Evaluation of sonog-
raphy in the initial assessment of the gynecologic pa-
tient. Am J Obstet Gynecol 1984;149:598–602.
[8] Subak LL, Hricak H, Powell CB, Azizi L, Stern JL.
Cervical carcinoma: computed tomography and mag-
netic resonance imaging for preoperative staging. Ob-
stet Gynecol 1995;86:43–50.
[9] Zapf S, Halbsguth A, Schweden F, Klose K, Lochner
B, Beck T, et al. Magnetic resonance tomography in
the diagnosis of cervix cancer: computed tomographic
and histological correlations. Rofo Fortschr Geb
Rontgenstr Nuklearmed 1988;148:34–7.
[10] Heuck A, Scheidler J, Kimmig R, Mueller-Lisse U,
Steinborn M, Helmberger T, et al. Lymph node staging
in cervix carcinomas: the results of high-resolution
magnetic resonance tomography (MRT) with a
phased-array body coil. Rofo Fortschr Geb Rontgenstr
Neuen Bildgeb Verfahr 1997;166:201–4.
[11] Kim SH, Choi BI, Han JK, Kim HD, Lee HP, Kang SB,
et al. Preoperative staging of uterine cervical carcino-
ma: comparison of CT and MRI in 99 patients. J Com-
put Assist Tomogr 1993;17:633–40.
[12] Lien HH, Blomlie V, Iversen T, Trope C, Sundfor K,
Abeler VM. Clinical stage I carcinoma of the cervix:
value of MR imaging in determining invasion into the
parametrium. Acta Radiol 1993;34:130–2.
[13] Lien HH, Blomlie V, Kjorstad K, Abeler V, Kaalhus O.
Clinical stage I carcinoma of the cervix: value of MRI
in determining degree of invasiveness. AJR Am J
Roentgenol 1991; 156:1191–4.
[14] Scheidler J, Heuck A, Wencke K, Kimmig R, Mueller-
Lisse U, Reiser M. Parametrial infiltration of cervix
carcinoma: diagnostic value of contrast-enhanced fat-
suppressed T1-weighted SE sequences at 1.5 tesla. Ro-
fo Fortschr Geb Rontgenstr Neuen Bildgeb Verfahr
1997; 166:312–6.
[15] Sironi S, Belloni C, Taccagni GL, Del Maschio A. Car-
cinoma of the cervix: value of MRI in detecting para-
metrial involvement. AJR Am J Roentgenol 1991;
156:753–6.
[16] Togashi K, Nishimura K, Sagoh T, Minami S, Noma S,
Fujisawa I, et al. Carcinoma of the cervix: staging with
MRI. Radiology 1989;171: 245–51.
[17] Heuck A, Sittek H, Seelos K, Kreft B, Hermanns M,
Reiser M. MRT of the female pelvis: turbo-spin-echo
(TSE) sequences compared to conventional spin-echo
sequences at 0.5 Tesla. Rofo Fortschr Geb Rontgenstr
Neuen Bildgeb Verfahr 1994;160:538–45.
[18] Hricak H, Lacey CG, Sandles LG, Chang YC, Winkler
ML, Stern JL. Invasive cervical carcinoma: compari-
son of MRI and surgical findings. Radiology 1988;
166:623–31.
[19] Scheidler J, Heuck AF, Steinborn M, Kimmig R, Re-
iser MF. Parametrial invasion in cervical carcinoma:
evaluation of detection at MRI with fat suppression.
Radiology 1998;206:125–9.
[20] Hricak H, Hamm B, Semelka RC, Cann CE, Nauert T,
Secaf E, et al. Carcinoma of the uterus: use of gado-
pentetate dimeglumine in MRI. Radiology 1991;181:
95–106.
[21] Tsuda K, Murakami T, Kurachi H, Ogawa H, Oi H,
Miyake A, et al. MRI of cervical carcinoma: compar-
ison among T2-weighted, dynamic, and postcontrast
T1-weighted images with histopathological correlation.
Abdom Imaging 1997;22:103–7.
[22] Hawnaur JM, Johnson RJ, Buckley CH, Tindall V,
Isherwood I. Staging, volume estimation and assess-
ment of nodal status in carcinoma of the cervix: com-
parison of magnetic resonance imaging with surgical
findings. Clin Radiol 1994;49:443–52.
[23] Dooms GC, Hricak H, Crooks LE, Higgins CB. Mag-
netic resonance imaging of the lymph nodes: compar-
ison with CT. Radiology 1984;153:719–28.
[24] Kim SH, Kim SC, Choi BI, Han MC. Uterine cervical
carcinoma: evaluation of pelvic lymph node metastasis
with MRI. Radiology 1994;190:807–11.
[25] Scheidler J, Hricak H, Yu KK, Subak L, Segal MR.
Radiological evaluation of lymph node metastases in
patients with cervical cancer: a meta-analysis. JAMA
1997;278:1096–101.
[26] Gauger J, Holzknecht NG, Lackerbauer CA, Sittek H,
J. Scheidler, A.F. Heuck / Radiol Clin N Am 40 (2002) 577–590 589

Fiedler KE, Petsch R, et al. Breathhold imaging of the
upper abdomen using a cp-array coil: comparison with
standard body coil imaging. MAGMA 1996;4:93–104.
[27] deSouza NM, Hawley IC, Schwieso JE, Gilderdale DJ,
Soutter WP. The uterine cervix on in vitro and in vivo
MR images: a study of zonal anatomy and vascularity
using an enveloping cervical coil. AJR Am J Roent-
genol 1994;163:607–12.
[28] deSouza NM, Scoones D, Krausz T, Gilderdale DJ,
Soutter WP. High-resolution MRI of stage I cervical
neoplasia with a dedicated transvaginal coil: MR fea-
tures and correlation of imaging and pathologic find-
ings. AJR Am J Roentgenol 1996;166:553–9.
[29] Heuck A, Kreft B, Sittek H, Reiser M. Value of turbo-
spin echo sequences in MRI of the abdomen and pelvis
with 0.5 T. Rontgenpraxis 1994;47:229–34.
[30] Nghiem HV, Herfkens RJ, Francis IR, Sommer FG,
Jeffrey Jr RB, Li KC, et al. The pelvis: T2-weighted
fast spin-echo MRI. Radiology 1992;185: 213–7.
[31] Regan F, Cavaluzzi J, Nguyen B. Fast MR abdominal
imaging using the HASTE sequence. AJR 1998;170:
1471–6.
[32] Postema S, Peters LA, Hermans J, Trimbos JB, Patty-
nama PM. Cervical carcinoma: do fast SE and fat sup-
pression techniques improve MR tumor staging at 0.5
T? J Comput Assist Tomogr 1996;20:807–11.
[33] Brown JJ. Gastrointestinal contrast agents for MRI.
Magn Reson Imaging Clin N Am 1996;4:25–35.
[34] Pels Rijcken TH, Davis MA, Ros PR. Intraluminal
contrast agents for MRI of the abdomen and pelvis.
J Magn Reson Imaging 1994;4:291–300.
[35] Scheidler J, Heuck AF, Meier W, Reiser MF. MRI of
pelvic masses: efficacy of the rectal superparamagnetic
contrast agent Ferumoxsil. J Magn Reson Imaging
1997;7:1027–32.
[36] Van Hoe L, Vanbeckevoort D, Oyen R, Itzlinger U,
Vergote I. Cervical carcinoma: optimized local staging
with intravaginal contrast-enhanced MRI—preliminary
results. Radiology 1999;213:608–11.
[37] Sironi S, De Cobelli F, Scarfone G, Colombo E, Bolis
G, Ferrari A, et al. Carcinoma of the cervix: value of
plain and gadolinium-enhanced MRI in assessing de-
gree of invasiveness. Radiology 1993;188:797–801.
[38] Yamashita Y, Takahashi M, Sawada T, Miyazaki K,
Okamura H. Carcinoma of the cervix: dynamic MRI.
Radiology 1992;182:643–8.
[39] Hricak H. Cancer of the uterus: the value of MRI pre-
and post-irradiation. Int J Radiat Oncol Biol Phys
1991;21:1089–94.
[40] Landoni F, Maneo A, Colombo A, Placa F, Milani R,
Perego P, et al. Randomised study of radical surgery
versus radiotherapy for stage Ib-IIa cervical cancer [see
comments]. Lancet 1997;350:535–40.
[41] Weber TM, Sostman HD, Spritzer CE, Ballard RL,
Meyer GA, Clark-Pearson DL, et al. Cervical carcino-
ma: determination of recurrent tumor extent versus
radiation changes with MRI. Radiology 1995;194:
135–9.
[42] Hricak H, Swift PS, Campos Z, Quivey JM, Gildengor-
in V, Goranson H. Irradiation of the cervix uteri: value
of unenhanced and contrast-enhanced MRI. Radiology
1993;189:381–8.
[43] Ebner F, Tamussino K, Kressel HY. Magnetic reso-
nance imaging in cervical carcinoma: diagnosis, stag-
ing, and follow-up. Magn Reson Q 1994;10:22–42.
J. Scheidler, A.F. Heuck / Radiol Clin N Am 40 (2002) 577–590590

Detection and characterization of adnexal masses
Stacey A. Funt, MD, Lucy E. Hann, MD*
Department of Radiology, Memorial Sloan-Kettering Cancer Center, 1275 York Avenue, New York, NY 10021, USA
Department of Radiology, Weill Medical College, Cornell University, 525 East 68th Street, New York, NY 10021, USA
Ultrasound (US) is usually the first imaging study
performed in women with pelvic symptoms and
suspected adnexal mass by physical examination.
Excellent results of US for detection of adnexal
masses have been confirmed in several studies, which
have demonstrated 60% to 97% of ovarian masses
may be visualized sonographically and 93% to 97%
of ovarian masses may be characterized by sono-
graphic morphology and Doppler imaging features
[1–5]. MRI also has proved beneficial in determining
the site of origin for adnexal masses and characteriz-
ing those masses that are indeterminate by sono-
graphic criteria [6–10]. CT is the primary modality
for ovarian tumor staging and diagnosis of recur-
rence. The applications of CT are discussed elsewhere
in this issue. This article focuses on:
� Rationale for imaging in ovarian cancer
detection� Key imaging features of specific malignant
adnexal masses� Ultrasound detection of adnexal masses� Characterization of adnexal masses by mor-
phology and Doppler� MRI for lesion characterization
Ovarian cancer epidemiology and
prognostic factors
Ovarian cancer is the leading cause of death from
gynecologic malignancies. It is diagnosed in approx-
imately 25,000 women annually and there are an
estimated 14,500 deaths each year. Although the
1.4% incidence of ovarian cancer in the general
population is relatively low, in high-risk women with
BRCA genetic mutations, the risk of ovarian cancer is
much higher, estimated at 16% to 65% [11]. Detection
of early stage I ovarian malignancies can have a
significant impact because 5-year survival for stage I
and II tumors is approximately 80% to 90% in contrast
to 5% to 50% 5-year survival for women with stage III
and IV disease. Unfortunately, 80% of women with
ovarian cancer present with advanced-stage disease.
Serum CA-125 is used for diagnosis of ovarian cancer
but it is limited by poor sensitivity for detection of
early stage ovarian cancer because CA-125 is insensi-
tive to germ cell and mucinous tumors and is
expressed in only 50% of stage I ovarian cancers. In
contrast to CA-125, US has been shown to be effective
for detection of stage I ovarian cancers [12–18].
Ovarian cancer screening trials using transvaginal
ultrasound (TVUS) have shown consistently that US
detects more stage I ovarian cancers than CA-125
alone [12–16,18]. Data demonstrating survival bene-
fit are lacking, but results from a study in which TVUS
was used for ovarian cancer screening indicate
decrease in case-specific ovarian cancer mortality with
93% 2-year and 84% 5-year survival in women with
ovarian cancer detected by TVUS [18].
Primary ovarian malignancies are classified by the
site of cell origin, such as surface epithelium, germ
cell, or stromal cell. Approximately 80% to 90% of
primary ovarian cancers are surface epithelial–stromal
tumors of the ovary. These include serous cystadeno-
carcinoma (40% to 50%); mucinous cystadenocarci-
noma (5% to 10%); endometrioid carcinoma (20% to
25%); and clear cell carcinoma (5% to 10%) [19,20].
Brenner tumors also arise from the surface epithelium
0033-8389/02/$ – see front matter D 2002, Elsevier Science (USA). All rights reserved.
PII: S0033 -8389 (01 )00009 -4
* Corresponding author. Department of Radiology,
Memorial Sloan-Kettering Cancer Center, 1275 York Ave,
New York, NY 10021.
E-mail address: [email protected] (L. Hann).
Radiol Clin N Am 40 (2002) 591–608
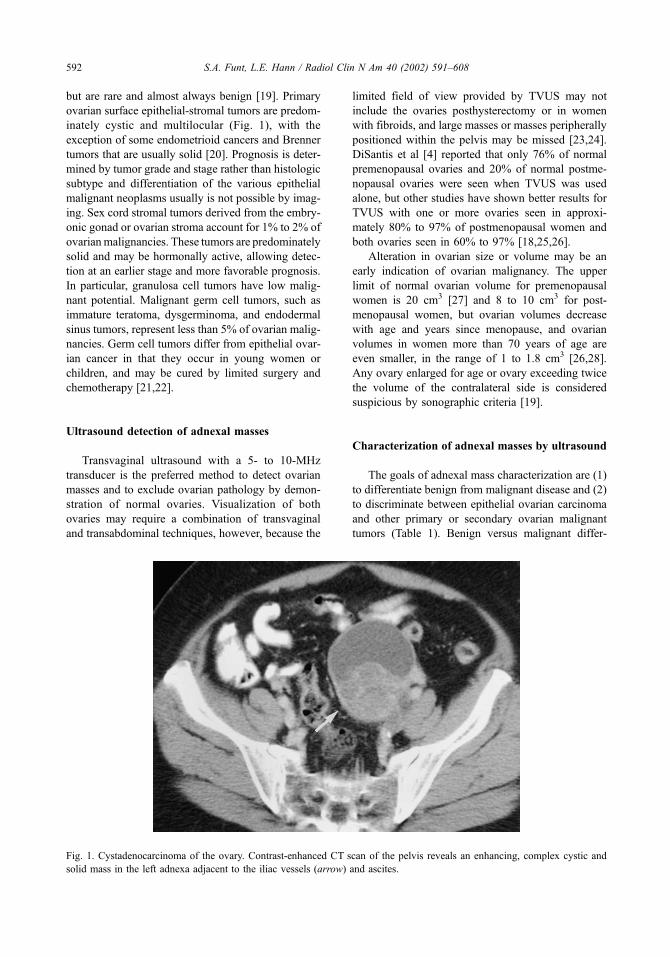
but are rare and almost always benign [19]. Primary
ovarian surface epithelial-stromal tumors are predom-
inately cystic and multilocular (Fig. 1), with the
exception of some endometrioid cancers and Brenner
tumors that are usually solid [20]. Prognosis is deter-
mined by tumor grade and stage rather than histologic
subtype and differentiation of the various epithelial
malignant neoplasms usually is not possible by imag-
ing. Sex cord stromal tumors derived from the embry-
onic gonad or ovarian stroma account for 1% to 2% of
ovarianmalignancies. These tumors are predominately
solid and may be hormonally active, allowing detec-
tion at an earlier stage and more favorable prognosis.
In particular, granulosa cell tumors have low malig-
nant potential. Malignant germ cell tumors, such as
immature teratoma, dysgerminoma, and endodermal
sinus tumors, represent less than 5% of ovarian malig-
nancies. Germ cell tumors differ from epithelial ovar-
ian cancer in that they occur in young women or
children, and may be cured by limited surgery and
chemotherapy [21,22].
Ultrasound detection of adnexal masses
Transvaginal ultrasound with a 5- to 10-MHz
transducer is the preferred method to detect ovarian
masses and to exclude ovarian pathology by demon-
stration of normal ovaries. Visualization of both
ovaries may require a combination of transvaginal
and transabdominal techniques, however, because the
limited field of view provided by TVUS may not
include the ovaries posthysterectomy or in women
with fibroids, and large masses or masses peripherally
positioned within the pelvis may be missed [23,24].
DiSantis et al [4] reported that only 76% of normal
premenopausal ovaries and 20% of normal postme-
nopausal ovaries were seen when TVUS was used
alone, but other studies have shown better results for
TVUS with one or more ovaries seen in approxi-
mately 80% to 97% of postmenopausal women and
both ovaries seen in 60% to 97% [18,25,26].
Alteration in ovarian size or volume may be an
early indication of ovarian malignancy. The upper
limit of normal ovarian volume for premenopausal
women is 20 cm3 [27] and 8 to 10 cm3 for post-
menopausal women, but ovarian volumes decrease
with age and years since menopause, and ovarian
volumes in women more than 70 years of age are
even smaller, in the range of 1 to 1.8 cm3 [26,28].
Any ovary enlarged for age or ovary exceeding twice
the volume of the contralateral side is considered
suspicious by sonographic criteria [19].
Characterization of adnexal masses by ultrasound
The goals of adnexal mass characterization are (1)
to differentiate benign from malignant disease and (2)
to discriminate between epithelial ovarian carcinoma
and other primary or secondary ovarian malignant
tumors (Table 1). Benign versus malignant differ-
Fig. 1. Cystadenocarcinoma of the ovary. Contrast-enhanced CT scan of the pelvis reveals an enhancing, complex cystic and
solid mass in the left adnexa adjacent to the iliac vessels (arrow) and ascites.
S.A. Funt, L.E. Hann / Radiol Clin N Am 40 (2002) 591–608592

entiation is essential because women with suspected
ovarian malignancy should be referred to gynecologic
oncologists for adequate primary surgery and staging,
whereas women with presumed benign ovarian
masses may be treated with less invasive surgery by
general gynecologists.
Morphology
Although both benign and malignant ovarian
masses are often cystic, there are important differ-
entiating features. US features of benignity include
simple cyst, thin wall, and septations less than 3 mm.
Hyperechoic regions, as may be seen in benign cystic
teratoma, and uniform low-level echoes, as seen in
endometriomas (Fig. 2A) or hemorrhagic cysts, are
also considered benign (Fig. 2B) [1,29,30]. Reported
accuracy of US morphology for prediction of benig-
nity is approximately 95% [30,31].
Ovarian masses with mural thickening, septations
greater than 3 mm, nodularity, and papillary projec-
tions are suggestive of malignancy and solid compo-
nent within an ovarian mass is reported to be the
most statistically significant predictor of malignancy
(Figs. 3, 4) [1]. Because some benign lesions, such as
endometriomas and hemorrhagic cysts, may have
similar appearance to malignant ovarian tumors, the
reported accuracy of 50% to 94% for prediction of
malignancy by morphology is slightly lower than for
benign disease [1,3,32–34]. To avoid unnecessary
surgery, it is essential that any premenopausal woman
with an abnormal ovary by TVUS have a follow-up
sonogram in 6 weeks or after the next menses to
exclude transient physiologic cysts (Fig. 5).
Some investigators have developed a morphologic
scoring system to standardize diagnosis of ovarian
abnormalities. The scoring system or morphologic
index assigns numerical scores for various US fea-
tures, such as size, wall thickness, solid components,
and number and thickness of septations [1,14,34,35].
Excellent interobserver variability is reported with
use of the morphologic index [14], but Timmerman
et al [36] found similar interobserver variability
(Cohen’s kappa 0.85) when readers used subjective
assessment of ovarian morphology.
It is not possible to differentiate histologic subtypes
of primary ovarian tumors by morphology, but there
are some features that should be considered. Epithelial
ovarian tumors are typically cystic, but endometrioid
tumors and Brenner tumors may be solid (Fig. 6A).
Table 1
Sonographic morphology of adnexal masses
Simple cyst Complex cyst Solid
Benign Benign Benign
Simple ovarian cysts Cysts with low-level echoes Pedunculated fibroid
Follicular cyst Endometrioma Torsion
Corpus luteal cyst Hemorrhagic cyst Brenner tumora
Hydrosalpinx Cystadenoma Fibroma/thecoma
Cystadenoma Cysts with hyperechoic components Nongynecologic
Nongynecologic cysts Cystic teratoma Lymphadenopathy
Cysts of gastrointestinal origin Cysts with solid components/septations Gastrointestinal tumor
Bladder diverticulum Turbo-ovarian abscess Bladder tumor
Fibrothecoma Malignant
Cystadenoma Germ cell tumors
Cystic teratoma Endometrioid carcinoma
Peritoneal inclusion cyst Granulosa cell
Nongynecologic Metastases to ovary
Abscess
Hematoma
Lymphocele
Malignant
Mucinous cystadenocarcinoma
Serous cystadenocarcinoma
Clear cell carcinoma
Endometrioid carcinoma
Granulosa cell
Cystic teratocarcinoma
Metastases to ovary
a Uncommonly may be malignant.
S.A. Funt, L.E. Hann / Radiol Clin N Am 40 (2002) 591–608 593

Mucinous cystadenocarcinomas are more septated
than serous cystadenocarcinomas and may have fluid
with low-level echoes. Malignant germ cell tumors are
predominately solid as are stromal tumors (Fig. 6B).
Metastases to the ovary have a variable appear-
ance and are most frequent from breast cancer, colon
cancer, gastric cancer, and lymphoma [37]. In a study
that compared morphology of 24 secondary ovarian
Fig. 2. Benign endometrioma. (A) Simple cyst (short arrow) and a complex cyst (curved arrow) that has uniform low-level
echoes consistent with benign hemorrhagic cyst or endometrioma. (See also color Fig. 2B, page 598).
Fig. 3. Primary clear cell carcinoma of the ovary in a woman with a history of breast carcinoma. Transverse sonogram reveals a
cystic ovarian mass with thick irregular internal solid component (arrow).
S.A. Funt, L.E. Hann / Radiol Clin N Am 40 (2002) 591–608594

neoplasms with 86 primary ovarian cancers, multi-
locularity was more frequently associated with pri-
mary ovarian malignancy [37]. The issue of primary
versus secondary ovarian neoplasm is particularly
relevant in women with breast cancer who have
increased risk of primary ovarian cancer secondary
to BRCA mutations [11]. Ovarian metastases from
breast cancer are reported to be predominately solid
and occur more often in women with documented
stage IV breast cancer (Fig. 7) [38]. Bilaterality is not
useful for discrimination of primary from secondary
ovarian tumors. An estimated 59% to 75% of ovarian
metastases are bilateral and primary ovarian carcino-
mas also are frequently bilateral as seen in 50% of
serous cystadenocarcinomas, 30% of endometrioid
carcinomas, 20% of clear cell tumors, and 15% to
20% of mucinous cystadenocarcinomas [19,20,37].
Doppler imaging techniques
Doppler imaging techniques aid characterization of
adnexal masses by providing information regarding
vascular compliance, vessel density, and distribution
of vessels within the mass. Tumor neovascularity has
vessels that lack muscular layers and typically have
low resistance flow patterns with high diastolic flow
relative to systolic flow. Pulsed Doppler techniques
allow sampling of blood flowwithin vessels, and ratios
of diastolic flow relative to systolic flow may be cal-
culated as measures of vascular resistance. Resistive
index (RI) is peak systolic velocity minus end-diastolic
velocity divided by peak systolic velocity, and value
less than 0.4 is considered abnormal. Pulsatility index
(PI) is peak systolic velocity minus end-diastolic
velocity divided by mean velocity, and any value be-
low 1 is abnormal. Multiple samples are taken within
the ovary and the lowest values are selected.
Initial reports using pulsed Doppler showed high
sensitivity and specificity for detection of ovarian
cancers, but subsequent studies have shown consid-
erable overlap of RI and PI ratios in benign and
malignant masses [2,19,30,39–41]. Whereas RI and
PI tend to be lower in malignant ovarian tumors,
these indices cannot reliably differentiate benign from
malignant masses because some benign tumors,
inflammatory conditions, and the normal corpus
luteum may have flow patterns similar to those found
in ovarian malignancies [2,42]. For this reason,
pulsed Doppler cannot be used as an independent
indicator of malignancy, but it may provide supple-
mental information that is useful in benign versus
malignant differentiation. For example, benign con-
Fig. 4. Metastatic colon carcinoma to ovary. Transverse ultrasound image of the right ovary reveals a cystic mass with multiple
thick septations (arrows).
S.A. Funt, L.E. Hann / Radiol Clin N Am 40 (2002) 591–608 595

ditions should be considered in the differential diag-
nosis if a morphologically complex mass has Doppler
indices that are entirely normal.
Location of blood flow within an adnexal mass is
displayed best by power Doppler that is angle-inde-
pendent and sensitive to low-amplitude flow. Vessels
within tumors are located centrally, in irregular areas
of mural thickening and within papillary projections
compared with benign masses that typically have
peripheral vessel distribution with regular branching
pattern (Fig. 8) [3,42]. Most malignant ovarian
masses have internal vascularity on color or power
Doppler imaging, although rarely flow may be absent
(see Figs. 2B, 6B) [2,3]. It has been suggested that
detection of vascularity within malignant tumors may
be related to the size of tumor vegetations with
decreased detection of internal flow if papillary
projections are smaller than 1 cm (Fig. 9) [3]. The
Fig. 5. Hemorrhagic cyst appears suspicious for malignancy, but resolves on follow-up. (A) Right ovarian cystic mass has
irregular solid components (straight arrow) and free fluid is noted (curved arrow). Asterisk = uterus. (B) Follow-up sonogram 6
weeks later reveals a normal ovary (arrow) with follicles.
S.A. Funt, L.E. Hann / Radiol Clin N Am 40 (2002) 591–608596

role of three-dimensional US with power Doppler for
improved diagnosis of ovarian masses is yet to be
determined [43].
Comparison of morphology and Doppler for
differentiation of benign from malignant
ovarian masses
Current evidence is that the combination of ovar-
ian morphology and Doppler perform best for char-
acterization of adnexal masses. In a prospective
study, Buy et al [3] used gray-scale US, duplex
Doppler, and color Doppler to evaluate 132 adnexal
masses including 98 benign, 3 borderline, and 31
malignant masses. Adding color Doppler to gray-
scale morphologic information increased specificity
from 82% to 97% and increased positive predictive
value from 63% to 97% but there was no added
information from duplex Doppler indices.
In a study of 211 adnexal masses including 28
malignancies Brown et al [1] used stepwise logistic
regression to determine the best discrimination
between benignity and malignancy by gray-scale
US and Doppler. A nonhyperechoic solid component
within a mass, central blood flow on color Doppler
imaging, free intraperitoneal fluid, and septations
Fig. 6. Papillary serous and endometrioid carcinoma in a postmenopausal woman. (A) Sagittal sonogram reveals an enlarged
lobulated ovary (short arrows) with heterogeneous architecture and small cystic regions (curved arrow). (See also color Fig. 6B,
page 598.)
Fig. 7. Bilateral ovarian metastasis from breast carcinoma. Contrast-enhanced CT scan of the pelvis reveals bilateral solid
adnexal masses and a small amount of fluid in the cul-de-sac (arrows).
S.A. Funt, L.E. Hann / Radiol Clin N Am 40 (2002) 591–608 597

within a mass proved to be the best predictors of
malignancy with 93% sensitivity and 93% specificity.
A recent meta-analysis of 89 data sets and 5159
patients using current US technique compared results
of morphologic assessment, Doppler US, color Dop-
pler flow imaging, and combined techniques for
characterization of adnexal masses [44]. Summary
receiver-operator curves showed that the point where
sensitivity and specificity are equal was highest for
combined techniques (0.92), followed in decreasing
order by morphologic assessment alone (0.85); Dop-
pler indices (0.82); and color Doppler flow (0.73).
MRI characterization of ovarian masses
Ultrasound remains the primary modality for
evaluation of adnexal masses, but lesions that are
indeterminate, poorly visualized, or inadequately
localized warrant further characterization (Table 2)
Fig. 2. (B) Power Doppler image reveals vessel (arrow) within the thin septation, but no internal vascularity. Resistive index and
pulsatility index were normal.
Fig. 6. (B) Power Doppler image shows internal hypervascularity consistent with malignancy (arrows).
S.A. Funt, L.E. Hann / Radiol Clin N Am 40 (2002) 591–608598

[45]. The additional benefit of MRI for character-
ization of ovarian masses in selected patients has
been well documented [6,7,10,46,47]. Because most
women with adnexal masses have benign ovarian
histopathology, specific diagnosis of benign adnexal
masses may obviate the need for surgery and change
clinical management [6]. A prospective study of 103
women with adnexal masses found that MRI had
sensitivity and specificity of 96% and 100% for
diagnosis of pedunculated leiomyomas, 100% and
99% for dermoid cyst, and 92% and 91% for endo-
metriomas [7]. Although MRI is expensive, it may
prove cost effective when improved diagnosis
reduces the need for surgical intervention or other
imaging evaluation [6,7,48]. In a study of women
with a variety of gynecologic diseases, including
adnexal masses, pelvic MRI was shown to alter
treatment in up to 73% of patients, decrease the
number of invasive surgeries, and reduce overall
expenditures for care [49].
MRI protocol
There is varying uniformity among pelvic MRI
protocols because of the lack of evidence-based cri-
teria. Generally accepted sequences to evaluate the
ovaries include axial T1, axial T2, and sagittal T2-
weighted images (coronal T2-weighted images are
optional). The administration of gadolinium has been
shown to increase characterization and detection of
malignant masses [33,47] and fat saturation is docu-
mented to differentiate blood from fat in lesions high
in signal intensity on T1-weighted sequences [50]. A
pelvic phased array coil or body coil is typically used
to increase signal-to-noise ratio and glucagon may be
administered intramuscularly to decrease motion arti-
fact from adjacent bowel.
MRI criteria for differentiation of benign from
malignant ovarian masses
Characterization of lesions as benign or malignant
on MRI is improved with the use of gadolinium
[10,51]. Diagnostic accuracy for malignancy in the
range of 87% to 99% is achieved by demonstration of
solid, enhancing tissue on MRI with gadolinium
[33,46,47,51,52]. Komatsu et al [46] found that the
single criteria of enhancing solid tissue was 91%
sensitive and 88% specific for differentiation of
benign from malignant adnexal masses. In a study
of 91 benign and 96 malignant adnexal masses,
gadolinium-enhanced MRI depicted 94% of adnexal
masses and had an overall accuracy of 93% for
diagnosis of malignancy [51]. The MRI features most
predictive of malignancy were necrosis in a solid
lesion and vegetations in a cystic lesion [51].
Other significant findings suggesting malignancy
include papillary projections, septa greater than 3 mm
in thickness, and solid components within a mass
[10,53,54]. In a study of 115 ovarian masses, the
Fig. 8. Metastatic colon cancer. Transverse power Doppler image of the ovary reveals internal vascularity (open arrows)
localized to the nodular solid component of the mass (solid arrow).
S.A. Funt, L.E. Hann / Radiol Clin N Am 40 (2002) 591–608 599

most significant findings for malignancy based on a
logistic regression analysis were wall structure, inter-
nal architecture, and massive ascites [9]. These data
were then used to generate a computer-assisted model
to distinguish benign from malignant adnexal masses,
and when applied to 75 new cases, the model had an
accuracy of 87% [9]. In a prospective study of 60
adnexal masses, Stevens et al [54] suggested five
primary criteria for malignancy (size > 4 cm, solid
mass or large solid component, wall thickening >3
mm, septa >3 mm, and vegetation and nodularity and
necrosis) and four ancillary criteria (involvement of
pelvic organs and sidewall; peritoneal, mesenteric, or
omental disease; ascites; and adenopathy). A lesion
was considered malignant on contrast-enhanced MRI
if there were one or more primary criteria and a single
ancillary criterion. Three masses were not detected by
MRI. For the remaining 57 masses, a correct diag-
nosis was made in 23 (100%) of 23 malignant masses
and in 30 (88%) of 34 benign masses.
Benign-appearing lesions by MRI
Simple cystic lesions
Lesions that have a homogeneous, low signal
intensity on T1-weighted images and high signal
intensity on T2-weighted images are simple, fluid-
filled structures and are considered benign (Fig. 10).
These are most commonly physiologic cysts, such as
follicular cysts that occur because of failure of
ovulation. These thin-walled cysts may rarely have
mural enhancement or higher signal intensity on T1-
weighted images because of proteinaceous material
within the cyst [55]. The corpus luteal cyst, formed
after ovulation, is often larger and may have irregular
walls. These cysts may hemorrhage with resulting
high signal on T1-weighted images, indistinguishable
from endometriomas [51,56].
Location of cysts by MRI or US may provide
information regarding the benign nature of an adnexal
abnormality. Peripheral cysts in a young woman sug-
gest polycystic ovaries or an ovary within a cyst may
indicate benign peritoneal inclusion cyst [57,58].
Peritoneal inclusion cysts are usually seen in preme-
nopausal women with a history of prior pelvic or
abdominal surgery. Failure of peritoneal resorption of
ovarian exudate and peritoneal adhesions cause fluid
to collect around the ovary. Although these benign
cysts may be complex with septations, the cysts
usually conform to the shape of the pelvis and
identification of the normal ovary within the fluid
collection allows correct differentiation from ovarian
Fig. 9. Borderline serous carcinoma. Longitudinal ultrasound image of the left ovary reveals a cystic mass with fine mural
nodularity (arrows).
S.A. Funt, L.E. Hann / Radiol Clin N Am 40 (2002) 591–608600

malignancies (Fig. 11). Peritoneal inclusion cysts can
be differentiated from paraovarian cysts that are lo-
cated in the broad ligament and are separate from the
ovary [58].
Morphology of a cyst may also provide specific
diagnosis. A hydrosalpinx often appears serpiginous
in structure or has ‘‘cog-wheeling’’ on T2-weighted
images. Nongynecologic cysts in the adnexal region
include duplication cysts or an appendiceal mucocele,
although these may appear brighter on T1-weighted
images because of proteinaceous material. Serous
cystadenomas may be indistinguishable from simple
cysts or they may have thin septations and occasion-
ally papillary projections [56,59]. Mucinous cystade-
nomas more often have multiple septations and may
appear brighter on T1-weighted images because of
mucinous material [60].
High T1 signal intensity
Lesions with high signal intensity on T1-weighted
images usually contain blood products (hemorrhagic
cysts, endometriomas, or hematoma) or fat (mature
cystic teratoma) (Fig. 12). MRI with fat saturation has
proved to be extremely specific, sensitive, and accu-
rate in differentiating blood from fat-containing
lesions [50,53]. Following fat saturation, a fat-con-
taining mass loses signal, whereas a hemorrhagic
mass remains bright and even has an exaggerated
signal (Fig. 13). This apparent increase in signal is
caused by a narrowed dynamic range on fat saturation
that increases conspicuity [61]. Lesions containing fat
or blood may appear heterogeneous on T2-weighted
images because of chronicity and concentration of
blood products within the hemorrhage or the mixture
of fat, fluid, and the Rokitansky protuberance within
the dermoid [62].
Diagnostic features of mature cystic teratoma
include fat or coarse calcification on CT or loss
of T1-weighted bright signal on MRI when fat
saturation is applied [63]. Chemical shift artifact
on MRI also suggests the presence of fat. This
Fig. 10. Simple cyst. (A) T1-weighted axial image of the
pelvis (TR= 500, TE= 8) shows a homogeneous, low signal
lesion in the right ovary (arrow). (B) T2-weighted axial
image (TR= 6666, TE= 98) shows a homogeneous high
signal lesion in the right ovary (arrow).
Table 2
MRI signal characteristics of adnexal massesa
Low T1, High T2
Functional cysts
Peritoneal inclusion cysts
Cystadenomas
Hydrosalpinx
High T1
Dermoid
Endometrioma
Hemorrhagic cyst
Proteinaceous material
Low T1, Low T2
Leiomyoma
Fibroma or thecoma
Heterogenous signal
Many of the above secondary to hemorrhage, fluid,
septations, or degeneration
Malignancies (enhancing nodule, thick septation, or
papillary projection)
Tubo-ovarian abscess
Ovarian torsion
Ruptured ectopic pregnancy
a Listed are the most characteristic or common MRI
signal intensities for adnexal masses yet many of these
lesions may have varying appearances.
S.A. Funt, L.E. Hann / Radiol Clin N Am 40 (2002) 591–608 601
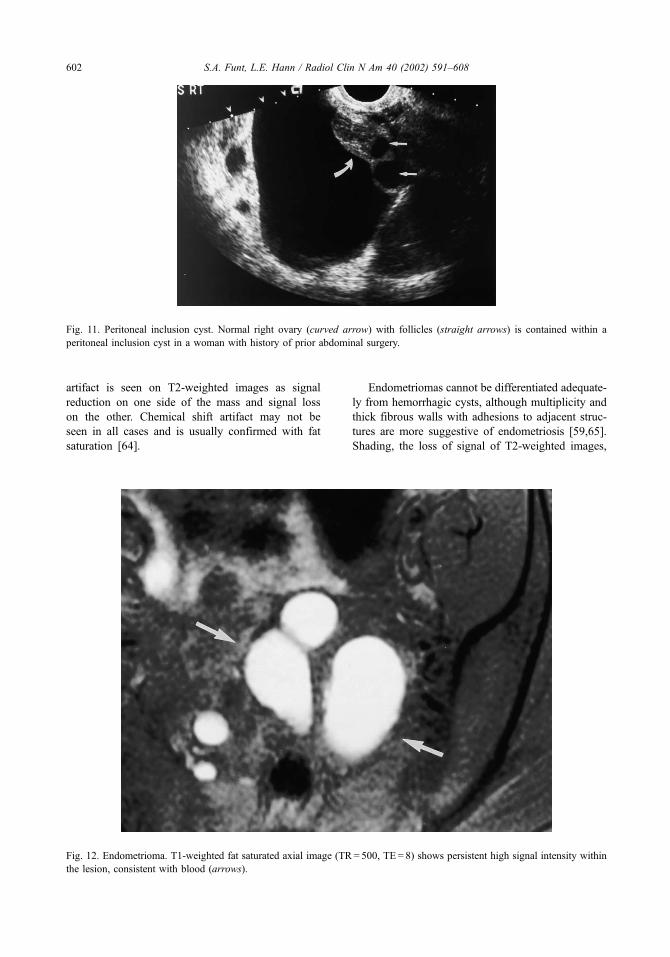
artifact is seen on T2-weighted images as signal
reduction on one side of the mass and signal loss
on the other. Chemical shift artifact may not be
seen in all cases and is usually confirmed with fat
saturation [64].
Endometriomas cannot be differentiated adequate-
ly from hemorrhagic cysts, although multiplicity and
thick fibrous walls with adhesions to adjacent struc-
tures are more suggestive of endometriosis [59,65].
Shading, the loss of signal of T2-weighted images,
Fig. 11. Peritoneal inclusion cyst. Normal right ovary (curved arrow) with follicles (straight arrows) is contained within a
peritoneal inclusion cyst in a woman with history of prior abdominal surgery.
Fig. 12. Endometrioma. T1-weighted fat saturated axial image (TR= 500, TE= 8) shows persistent high signal intensity within
the lesion, consistent with blood (arrows).
S.A. Funt, L.E. Hann / Radiol Clin N Am 40 (2002) 591–608602

which represents a chronic hemorrhagic process,
hematocrit levels, and multilocularity have been used
to describe endometriomas but also may be seen with
hemorrhagic cysts [62,64,66,67].
Solid lesions
An adnexal mass that is low in signal intensity on
T1- and T2-weighted images is most likely a pedun-
culated leiomyoma [8,68]. This diagnosis can be
stated with near certainty when a stalk is seen con-
necting to the uterus or two normal ovaries are
identified. Leiomyomas may be heterogeneous on
T2-weighted images because of hyaline, myxoma-
tous, or fatty degeneration. Calcification may present
as areas of very low signal on T1- and T2-weighted
images. Contrast is not essential for evaluation but
when present, fibroids enhance. MRI cannot exclude
the rare case of malignant degeneration but other
signs, such as a rapidly enlarging fibroid or invasion
of adjacent structures, may suggest malignancy.
Ovarian fibromas also present with low signal
intensity on T1- and T2-weighted sequences, but on
T1-weighted images, fibromas often have lower sig-
nal intensity than leiomyomas (Fig. 14) [69–71]. A
variety of signal intensities may be seen on T2-
weighted images because of edema and cystic degen-
eration encountered mainly in larger lesions [71,72].
Brenner tumors, which are usually benign, may be
solid, cystic, or mixed. When solid, they can have
low signal intensities on T1- and T2-weighted
images. Amorphous calcifications, best seen on CT,
are commonly present in the solid portions of the
mass. Approximately 30% of Brenner tumors are
associated with a second neoplasm, such as a cystic
teratoma or a cystadenoma [73].
Heterogeneous signal intensities
Most of the lesions mentioned may appear heter-
ogeneous because of hemorrhage, fluid, septations,
necrosis, or degeneration. Some of these masses may
mimic malignancy warranting surgery or short-term
follow-up. Also included in the differential diagnosis
of heterogeneous adnexal masses are tubo-ovarian
abscesses, ovarian torsion, and ruptured ectopic preg-
nancy, but these conditions usually have specific
clinical or laboratory findings and are not typically
diagnosed by MRI. Tubo-ovarian abscesses are typ-
ically thick walled with central fluid. Hemorrhage,
surrounding edema, and engulfment of the ovary may
occasionally add to their complex appearance. Ovar-
ian torsion is typically seen with an associated ovar-
ian mass, yet may occur in a normal ovary. Edema,
hemorrhage, or an underlying mass create a hetero-
geneous appearance on MRI. Kimura et al [74]
described three findings of a torsed ovary with a
mass: (1) engorged blood vessels on the side of
torsion with a protrusion of the lesion toward the
uterus, (2) lack of enhancement, and (3) straight
blood vessels draped around the lesion. A ruptured
ectopic pregnancy is usually associated with hemor-
rhage that may become organized in a chronic setting
with surrounding inflammation [57,64]. Nongyneco-
logic masses, such as diverticular and appendicular
abscesses, may appear as adnexal lesions and mimic
ovarian abnormalities [75].
Fig. 13. Bilateral dermoids. (A) T1-weighted axial image
(TR = 500, TE = 8) shows bilateral heterogeneous high
signal adnexal masses (arrows). (B) T1-weighted fat
saturated axial image (TR= 500, TE= 8) shows a loss of
signal from both lesions (arrows). A small region of high
signal drops from the left dermoid (arrowheads).
S.A. Funt, L.E. Hann / Radiol Clin N Am 40 (2002) 591–608 603
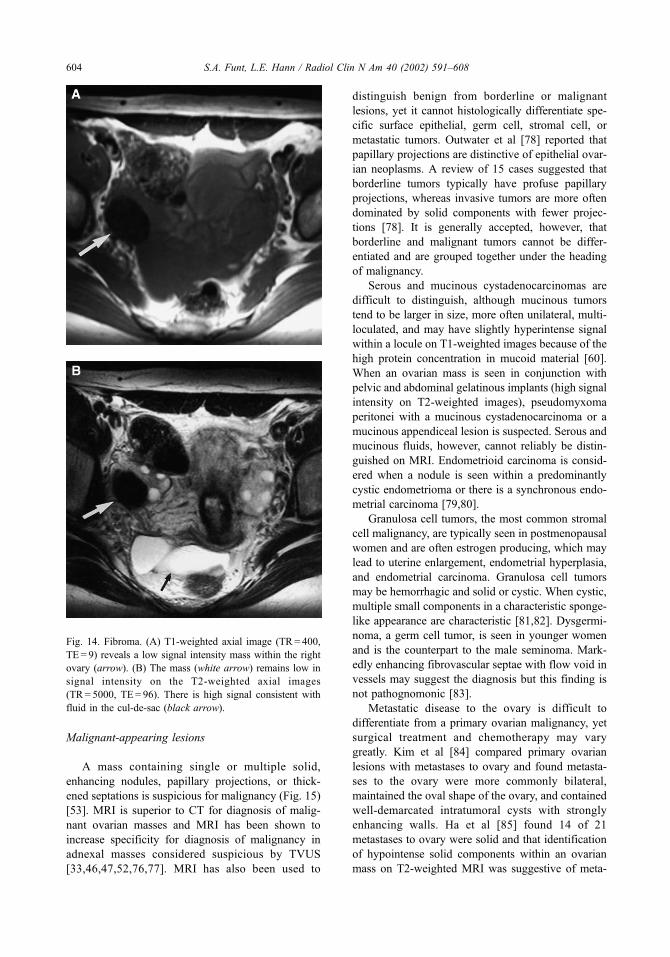
Malignant-appearing lesions
A mass containing single or multiple solid,
enhancing nodules, papillary projections, or thick-
ened septations is suspicious for malignancy (Fig. 15)
[53]. MRI is superior to CT for diagnosis of malig-
nant ovarian masses and MRI has been shown to
increase specificity for diagnosis of malignancy in
adnexal masses considered suspicious by TVUS
[33,46,47,52,76,77]. MRI has also been used to
distinguish benign from borderline or malignant
lesions, yet it cannot histologically differentiate spe-
cific surface epithelial, germ cell, stromal cell, or
metastatic tumors. Outwater et al [78] reported that
papillary projections are distinctive of epithelial ovar-
ian neoplasms. A review of 15 cases suggested that
borderline tumors typically have profuse papillary
projections, whereas invasive tumors are more often
dominated by solid components with fewer projec-
tions [78]. It is generally accepted, however, that
borderline and malignant tumors cannot be differ-
entiated and are grouped together under the heading
of malignancy.
Serous and mucinous cystadenocarcinomas are
difficult to distinguish, although mucinous tumors
tend to be larger in size, more often unilateral, multi-
loculated, and may have slightly hyperintense signal
within a locule on T1-weighted images because of the
high protein concentration in mucoid material [60].
When an ovarian mass is seen in conjunction with
pelvic and abdominal gelatinous implants (high signal
intensity on T2-weighted images), pseudomyxoma
peritonei with a mucinous cystadenocarcinoma or a
mucinous appendiceal lesion is suspected. Serous and
mucinous fluids, however, cannot reliably be distin-
guished on MRI. Endometrioid carcinoma is consid-
ered when a nodule is seen within a predominantly
cystic endometrioma or there is a synchronous endo-
metrial carcinoma [79,80].
Granulosa cell tumors, the most common stromal
cell malignancy, are typically seen in postmenopausal
women and are often estrogen producing, which may
lead to uterine enlargement, endometrial hyperplasia,
and endometrial carcinoma. Granulosa cell tumors
may be hemorrhagic and solid or cystic. When cystic,
multiple small components in a characteristic sponge-
like appearance are characteristic [81,82]. Dysgermi-
noma, a germ cell tumor, is seen in younger women
and is the counterpart to the male seminoma. Mark-
edly enhancing fibrovascular septae with flow void in
vessels may suggest the diagnosis but this finding is
not pathognomonic [83].
Metastatic disease to the ovary is difficult to
differentiate from a primary ovarian malignancy, yet
surgical treatment and chemotherapy may vary
greatly. Kim et al [84] compared primary ovarian
lesions with metastases to ovary and found metasta-
ses to the ovary were more commonly bilateral,
maintained the oval shape of the ovary, and contained
well-demarcated intratumoral cysts with strongly
enhancing walls. Ha et al [85] found 14 of 21
metastases to ovary were solid and that identification
of hypointense solid components within an ovarian
mass on T2-weighted MRI was suggestive of meta-
Fig. 14. Fibroma. (A) T1-weighted axial image (TR= 400,
TE= 9) reveals a low signal intensity mass within the right
ovary (arrow). (B) The mass (white arrow) remains low in
signal intensity on the T2-weighted axial images
(TR= 5000, TE= 96). There is high signal consistent with
fluid in the cul-de-sac (black arrow).
S.A. Funt, L.E. Hann / Radiol Clin N Am 40 (2002) 591–608604

stases. In a study of adnexal masses in women with
breast carcinoma, breast metastases to the ovaries
were more commonly bilateral and solid in compar-
ison with primary ovarian masses that appeared cystic
[38]. Brown et al [37], however, reviewed 110
ovarian primary and metastatic neoplasms and found
only multilocularity was a significant distinguishing
factor on both MRI and US. There is limited ability
accurately to distinguish these lesions.
Summary
The main challenge to the radiologist is to differ-
entiate benign from malignant adnexal masses. Both
US and MRI perform well for prediction of benig-
nity. There is less specificity for diagnosis of malig-
nancy but features, such as papillary projections,
thickened septations, and internal vascularity within
nodules, aid in this differentiation. The combination
of morphology and Doppler characteristics provide
the most accurate US diagnosis. For sonographi-
cally indeterminate masses, MRI is useful for addi-
tional lesion characterization. Analysis of T1- and
T2-weighted signal intensities for benign-appearing
lesions with the addition of fat saturation for high
signal on T1-weighted sequences may lead to an
exact diagnosis or a narrow differential. For cases
considered suspicious by TVUS, more specific diag-
nosis by MRI may obviate the need for surgery or
otherwise change management by identification of
benign etiology.
Fig. 15. Cystadenocarcinoma. (A) T1-weighted axial image status post-gadolinium administration (TR= 170, TE= 4.2)
demonstrates a complex, irregular, enhancing mass in the pelvis (arrow). (B) T2-weighted axial image (TR= 5000, TE= 96)
demonstrates a heterogeneous cystic and solid pelvic mass (arrow).
S.A. Funt, L.E. Hann / Radiol Clin N Am 40 (2002) 591–608 605

References
[1] Brown DL, Doubilet PM, Miller FH, Frates MC, Laing
FC, Di Salvo DN, et al. Benign and malignant ovarian
masses: selection of the most discriminating gray-scale
and Doppler sonographic features. Radiology 1998;
208:103–10.
[2] Brown DL, Frates MC, Laing FC, Di Salvo DN,
Doubilet PM, Bensen CB, et al. Ovarian masses: can
benign and malignant lesions be differentiated with
color and pulsed Doppler US? Radiology 1994;190:
333–6.
[3] Buy JN, Ghossain MA, Hugol D, Hassen K, Sciot C,
True JB, et al. Characterization of adnexal masses:
combination of color Doppler and conventional sono-
graphy compared with spectral Doppler analysis alone
and conventional sonography alone. AJR Am J Roent-
genol 1996;166:385–93.
[4] DiSantis DJ, Scatarige JC, Kemp G, Giren FT, Hsiu JG,
Cramer MS, et al. A prospective evaluation of transva-
ginal sonography for detection of ovarian disease. AJR
Am J Roentgenol 1993;161:91–4.
[5] Mendelson EB, Bohm-Velez M. Transvaginal ultra-
sonography of pelvic neoplasms. Radiol Clin North
Am 1992;230:703–34.
[6] Outwater EK, Dunton CJ. Imaging of the ovary and
adnexa: clinical issues and applications of MRI. Radi-
ology 1995;194:1–18.
[7] Scoutt LM, McCarthy SM, Lange R, Bourque A,
Schwartz PE. MR evaluation of clinically suspected
adnexal masses. J Comput Assist Tomogr 1994;18:
609–18.
[8] Weinreb JC, Barkoff ND, Megibow A, Demopoulos R.
The value of MRI in distinguishing leiomyomas from
other solid pelvic masses when sonography is indeter-
minate. AJR Am J Roentgenol 1990;154:295–9.
[9] Yamashita Y, Hatanaka Y, Torashima M, Takahashi M,
Miyazaki K, Okamura H. Characterization of sono-
graphically indeterminate ovarian tumors with MRI:
a logistic regression analysis. Acta Radiol 1997;38:
572–7.
[10] Yamashita Y, Torashima M, Hatanaka Y, Harada M,
Higashida Y, Takahashi M, et al. Adnexal masses: ac-
curacy of characterization with transvaginal US and
precontrast and postcontrast MRI. Radiology 1999;
194:557–65.
[11] Struewing JP, Hartge P, Wacholder S, Baker SM,
Berlin M, McAdams M, et al. The risk of cancer asso-
ciated with specific mutations of BRCA1 and BRCA2
among Ashkenazi Jews. N Engl J Med 1997;336:
1401–8.
[12] Bourne TH, Whitehead MI, Campbell S, Royston P,
Bhan V, Collins WP. Ultrasound screening for familial
ovarian cancer. Gynecol Oncol 1991;43:92–7.
[13] Campbell S, Bhan V, Royston P, Whitehead MI , Col-
lins WP. Transabdominal ultrasound screening for
ovarian cancer. BMJ 1989; 299:1363–7.
[14] DePriest PD, Varner E, Powell J, Fried A, Puls L,
Higgins R, et al. The efficacy of a sonographic mor-
phology index in identifying ovarian cancer: a multi-
institutional investigation. Gynecol Oncol 1994;55:
174–8.
[15] Einhorn N, Sjovall K, Knapp R, Hall P, Scully RE,
Bast Jr RC, et al. Prospective evaluation of serum
CA-125 levels for early detection of ovarian cancer.
Obstet Gynecol 1992;80:14–8.
[16] Jacobs IJ, Skates SJ, MacDonald N, Menon U,
Rosenthal AN, Davies AP, et al. Screening for ovar-
ian cancer: a pilot randomized controlled trial. Lancet
1999;353:1207–10.
[17] Troiano RN, Quedens-Case C, Taylor KJ. Correlation
of findings on transvaginal sonography with serum CA
125 levels. AJR Am J Roentgenol 1997;168:1587–90.
[18] van Nagell JR, DePriest PD, Reedy MB, Gallion HH,
Veland FR, Pavlik EJ, et al. The efficacy of trans-
vaginal sonographic screening in asymptomatic women
at risk for ovarian cancer. Gynecol Oncol 2000;77:
350–6.
[19] Salem S. The uterus and adnexa. In: Rumack CM, Wil-
son SR, Charboneau JW, editors. Diagnostic ultra-
sound. 2nd edition. St. Louis: Mosby; 1998. p. 519–73.
[20] Wagner BJ, Buck J, Seidman JD, McCabe KM. Ovarian
epithelial neoplasms: radiologic-pathologic correlation.
Radiographics 1994;14:1351–74.
[21] Brammer HM, Buck JL, Hayes WS, Sheth S, Tarassoli
FA. Malignant germ cell tumors of the ovary: radio-
logic-pathologic correlation. Radiographics 1991;10:
715–24.
[22] Young RC, Perez CA, Hoskins WJ. Cancer of the ova-
ry. In: DeVita VT, Hellman S, Rosenberg SA, editors.
Cancer: principles and practice of oncology. 4th edition.
Philadelphia: JB Lippincott; 1993. p. 1226–63.
[23] Coleman BC, Arger PH, Grumbach K, Menard MK,
Mintz MC, Allen KS, et al. Transvaginal and trans-
abdominal sonography: prospective comparison. Radi-
ology 1988;168:639–43.
[24] Tessler FN, Schiller VL, Perrella RR, Sutherland ML,
Grant EG. Transabdominal versus endovaginal pelvic
sonography: prospective study. Radiology 1989;170:
553–6.
[25] Fleischer AC, McKee MS, Gordon AN, Page DL,
Kepple DM, Worrell JA, et al. Transvaginal sonogra-
phy of postmenopausal ovaries with pathologic corre-
lation. J Ultrasound Med 1990;9:637–44.
[26] Tepper R, Zalel Y, Markov S, Cohen I, Beyth Y, et al.
Ovarian volume in postmenopausal women: sugges-
tions to an ovarian size normogram for menopausal
age. Acta Obstet Gynecol Scand 1995;74:208–11.
[27] Cohen HL, Tice HM, Mandel FS. Ovarian volumes
measured by US: bigger than we think. Radiology
1990;177:189–92.
[28] Pavlik EJ, DePriest PD, Gallion HH, Ueland FR,
Reedy MB, Kryscio RJ. Ovarian volume related to
age. Gynecol Oncol 2000;77:410–2.
[29] Bailey CL, Ueland FR, Land GL, De Priest PD, Gal-
lion HH, Kryscio RJ, et al. The malignant potential of
small cystic ovarian tumors in women over 50 years of
age. Gynecol Oncol 1998;69:3–7.
S.A. Funt, L.E. Hann / Radiol Clin N Am 40 (2002) 591–608606
[30] Jain KA. Prospective evaluation of adnexal masses
with endovaginal gray-scale and duplex and color
Doppler US: Correlation with pathologic findings. Ra-
diology 1994;191:63–7.
[31] Hermann UJ, Locher GW, Goldhirsch A. Sonographic
patterns of ovarian tumors: prediction of malignancy.
Obstet Gynecol 1987;69:777–81.
[32] Benacerraf BR, Finkler NJ, Wojciechowski C, Knapp
RC. Sonographic accuracy in the diagnosis of ovarian
masses. J Reprod Med 1990;35:491–5.
[33] Stein SM, Laifer-Narin S, Johnson MB, Roman LD,
Muderspach LI, Tyszka JM. Differentiation of benign
and malignant adnexal masses: relative value of gray-
scale, color Doppler, and spectral Doppler sonography.
AJR Am J Roentgenol 1995;164:381–6.
[34] Timor-Tritsch IE, Lerner JP, Monteagudo A, Santos R.
Transvaginal ultrasonographic characterization of ovar-
ian masses by means of color flow-directed Doppler
measurements and a morphologic scoring system. Am
J Obstet Gynecol 1993;168:909–13.
[35] Kurjak A, Predanic M. New scoring system for pre-
diction of ovarian malignancy based on transvaginal
color Doppler sonography. J Ultrasound Med 1992;
11:631–8.
[36] Timmerman D, Schwarzler P, Collins WP, Claerhout
F, Coenen M, Amart F, et al. Subjective assessment
of adnexal masses with the use of ultrasonography: an
analysis of interobserver variability and experience.
Ultrasound Obstet Gynecol 1999;13:8–10.
[37] Brown DL, Zou KH, Tempany CMC, Frates MC,
Silverman SG, McNeil BJ, et al. Primary versus sec-
ondary ovarian malignancy: imaging findings of ad-
nexal masses in the radiology diagnostic oncology
group study. Radiology 2001;219:213–8.
[38] Hann LE, Lui DM, Shi W, Bach AM, Sellard D-L,
Castiel M. Adnexal masses in women with breast
cancer: US findings with clinical and histopathologic
correlation. Radiology 2000;216:242–7.
[39] Hamper UM, Sheth S, Abbas FM, Rosenshein NB,
Aranson D, Kurman RJ. Transvaginal color Doppler
sonography of adnexal masses: differences in blood
flow impedance in benign and malignant lesions.
AJR Am J Roentgenol 1993;160:1225–8.
[40] Kurjak A, Predanic M, Kupesic-Urek S, Jukic S. Trans-
vaginal color and pulsed Doppler assessment of ad-
nexal tumor vascularity. Gynecol Oncol 1993;50:3–9.
[41] Levine D, Feldstein VA, Babcock CJ, Filly RA. Sono-
graphy of ovarian masses: poor sensitivity of resistive
index for identifying malignant lesions. AJR Am J
Roentgenol 1994;162:1355–9.
[42] Fleischer AC, Brader KR. Sonographic depiction of
ovarian vascularity and flow: current improvements
and future applications. J Ultrasound Med 2001;20:
241–50.
[43] Kurjak A, Kupesic S, Anic T, Kosuta D. Three dimen-
sional ultrasound and power Doppler improve the
diagnosis of ovarian lesions. Gynecol Oncol 2000;
76:28–32.
[44] Kinkel K, Hricak H, Lu Y, Tsuda K, Filly RA. US
characterization of ovarian masses: a meta- analysis.
Radiology 2000;217:803–11.
[45] Jain KA, Friedman DL, Pettinger TW, Alagappan R,
Jeffrey RB, Sommer FG. Adnexal masses: comparison
of specificity of endovaginal US and pelvic MRI.
Radiology 1993;186:697–704.
[46] Komatsu T, Konishi I, Mandai M, Togashi K, Kawa-
kami S, Konishi J, et al. Adnexal masses: transvagi-
nal US and gadolinium-enhanced MRI assessment of
intratumoral structure. Radiology 1996;198:109–15.
[47] Stevens SK, Hricak H, Stern JL. Ovarian lesions: de-
tection and characterization with gadolinium-enhanced
MRI at 1.5 T. Radiology 1991;181:481–8.
[48] Yu KK, Hricak H. Can MRI of the pelvis be cost
effective? Abdom Imaging 1997;22:597–601.
[49] Schwartz LB, Panageas E, Lange R, Rizzo J, Comite F,
McCarthy S. Female pelvis: impact of MRI on treat-
ment decisions and net cost analysis. Radiology 1994;
192:55–60.
[50] Kier R, Smith RC, McCarthy SM. Value of lipid- and
water-suppression MR images in distinguishing be-
tween blood and lipid within ovarian masses. AJR
Am J Roentgenol 1991;158:321–5.
[51] Hricak H, Chen M, Coakley FV, KinKel K, Sica G,
et al. Complex adnexal masses: detection and charac-
terization with MRI—multivariate analysis. Radiology
2000;214:39–46.
[52] Kurtz AB, Tsimikas JV, Tempany CMC, Hamper UM,
Arger PH, Bree RL, et al. Diagnosis and staging of
ovarian cancer: comparative values of Doppler and
conventional US, CT, and MRI correlated with surgery
and histopathologic analysis—report of the Radiology
Diagnostic Oncology Group. Radiology 1999;212:
19–27.
[53] Ghossain MA, Buy J-N, Ligneres C, Bazot M, Hassen
K, Malbec L. Epithelial tumors of the ovary: com-
parison of MR and CT findings. Radiology 1991;
181:863–870.
[54] Stevens SK, Hricak H, Campos Z. Teratomas versus
cystic hemorrhagic adnexal lesions: differentiation
with proton-selective fat-saturation MRI. Radiology
1993;186:481–8.
[55] Occhipinti KA, Frankel SD, Hricak H. The ovary:
computed tomography and magnetic resonance imag-
ing. Radiol Clin North Am 1993;31:1115–32.
[56] Sutton CL, McKinney CD, Jones JE, Gay SB. Ovarian
masses revisited: radiologic and pathologic correlation.
Radiographics 1992;12:853–77.
[57] Hamm B, Kubik-Huch RA, Fleige B. MRI and CT of
the female pelvis: radiologic-pathologic correlation.
Eur Radiol 1999;9:3–15.
[58] Jain KA. Imaging of peritoneal inclusion cyst. AJR
Am J Roentgenol 2000;174:1559–63.
[59] Gougoutas CA, Siegelman ES, Hunt J, Outwater EK.
Pelvic endometriosis: various manifestations and MRI
findings. AJR Am J Roentgenol 2000;175:353–8.
[60] Hussain SM, Outwater EK, Siegelman ES. MRI fea-
tures of pelvic mucinous carcinomas. Eur Radiol
2000;10:885–91.
S.A. Funt, L.E. Hann / Radiol Clin N Am 40 (2002) 591–608 607

[61] Sugimura K, Okizuka H, Imaoka I, Kaji Y, Takahashi
K, Kitao M, et al. Pelvic endometriosis: detection and
diagnosis with chemical shift MRI. Radiology 1993;
188:435–8.
[62] Woodward PJ, Sohaey R, Mezzetti TP. Endometriosis:
radiologic-pathologic correlation. Radiographics 2001;
21:193–216.
[63] Guinet C, Buy JN, Ghossain MA, Malbec L, Hugol D,
True JB, et al. Fat suppression techniques in MRI of
mature ovarian teratomas: comparison with CT. Eur J
Radiol 1993;17:117–21.
[64] Troiano RN, McCarthy S. Magnetic resonance imaging
evaluation of adnexal masses. Semin Ultrasound CT
MR 1994;15:38–48.
[65] Lipson SA, Hricak H. MRI of the female pelvis. Radiol
Clin North Am 1996;34:1157–82.
[66] Arrive L, Hricak H, Martin MC. Pelvic endometriosis:
MRI. Radiology 1989;171:687–92.
[67] Togashi K, Nishimura K, Kimura I, Tsuda Y, Yama-
shita K, Shibata T. Endometrial cysts: diagnosis with
MRI. Radiology 1991;180:73–8.
[68] Hricak H, Tscholakoff D, Heinrichs L, Fisher MR,
Dooms GC, Reinhold C, et al. Uterine leiomyomas:
correlation of MR, histopathologic findings, and symp-
toms. Radiology 1986;158:385–91.
[69] Outwater EK, Siegelman ES, Talerman A, Dunton C.
Ovarian fibromas and cystadenofibromas: MRI features
of the fibrous component. J Magn Reson Imaging 1997;
7:465–71.
[70] Schwartz RK, Levine D, Hatabu H, Edelman RR.
Ovarian fibroma: findings by contrast-enhanced MRI.
Abdom Imaging 1997;22:535–7.
[71] Troiano RN, Lazzarini KM, Scoutt LM, Lange RC,
Flynn SD, McCarthy S. Fibroma and fibrothecoma of
the ovary: MRI findings. Radiology 1997;204:795–8.
[72] Ueda J, Furukawa T, Higashino K, Ueda K, Kobayashi
S, Shimura K, et al. Ovarian fibroma of high signal
intensity on T2-weighted MR image. Abdom Imaging
1998;23:657–8.
[73] Moon WJ, Koh BH, Kim SK, Kim YS, Rhim HC, Cho
OK, et al. Brenner tumor of the ovary: CT and MR
findings. J Comput Assist Tomogr 2000;24:72–6.
[74] Kimura I, Togashi K, Kawakami S, Takakura K, Mori
T, Konishi J. Ovarian torsion: CT and MRI appear-
ances. Radiology 1994;190:337–41.
[75] Levine CD, Patel UJ, Ghanekar D, Wachsberg RH,
Simmons MZ, Stein M. Benign extraovarian mimics
of ovarian cancer: distinction with imaging studies.
Clin Imaging 1997;21:350–8.
[76] Forstner R, Chen M, Hricak H. Imaging of ovarian
cancer. J Magon Reson Imaging 1995;5:606–13.
[77] Van Vierzen PBJ, Massuger LFAG, Ruys SHJ,
Barentsz J. Borderline ovarian malignancy: ultrasound
and fast dynamic MR findings. Eur J Radiol 1998;28:
136–42.
[78] Outwater EK, Huang AB, Dunton CJ, Taleman A,
Dunton C. Papillary projections in ovarian neoplasms:
appearance on MRI. J Magn Reson Imaging 1997;7:
689–95.
[79] De Breuck Y, Ramboer K, Ghekiere J, Dosterlinck D,
Ghiteko J, Van Hoc L, et al. Endometroid cystadeno-
carcinoma of the ovary. Journal Belge de Radiologie
1996;79:65–166.
[80] Kinoshita T, Ishii K, Naganuma H, Higashiiwai H.
MR findings of ovarian tumors with cystic compo-
nents. Br J Radiol 2000;73:333–9.
[81] Ko SF, Wan YL, Ng SH, Lee TY, Tin JW, Chen WJ.
Adult ovarian granulosa cell tumors: spectrum of sono-
graphic and CT findings with pathologic correlation.
AJR Am J Roentgenol 1999;172:1227–33.
[82] Morikawa K, Hatabu H, Togashi K, Kataoka ML, Mori
T, Konishi J. Granulosa cell tumor of the ovary: MR
findings. J Comput Assist Tomogr 1997;21:1001–4.
[83] Kim SH, Kang SB. Ovarian dysgerminoma: color
Doppler ultrasonographic findings and comparison
with CT and MRI findings. J Ultrasound Med 1995;
14:843–8.
[84] Kim SH, Kim WH, Park KJ, Lee JK, Kim JS. CT and
MR findings of Krukenberg tumors: comparison with
primary ovarian tumors. J Comput Assist Tomogr 1996;
20:393–8.
[85] Ha HK, Baek SY, Kim SH, Kim HH, Chung EC, Yeon
KM. Krukenberg’s tumor of the ovary: MRI features.
AJR Am J Roentgenol 1995;164:1435–9.
S.A. Funt, L.E. Hann / Radiol Clin N Am 40 (2002) 591–608608

Staging ovarian cancer: role of imaging
Fergus V. Coakley, MD
Abdominal Imaging, Department of Radiology, University of California San Francisco, Box 0628, L-308,
505 Parnassus Avenue, San Francisco, CA 94143, USA
Ovarian cancer is the commonest cause of death
from gynecologic malignancy, and is the fifth com-
monest cause of cancer deaths in women [1]. The
lifetime risk of ovarian cancer in women is 1.5%, and
the overall mortality is approximately 60%. As with
other tumors, it is important to distinguish the sepa-
rate radiological roles of detection, characterization,
and staging, although in practice these are often
combined. Ultrasound is the primary modality used
for the detection and characterization of adnexal
masses, and these issues are discussed in a separate
chapter. CT is the primary modality used for staging
of ovarian cancer, and CT is the main modality
discussed in this chapter. MRI is useful in the
characterization of ovarian masses and for the eluci-
dation of certain equivocal CT findings, and these
applications are also described. The role of imaging
in the staging of ovarian cancer is reviewed under the
following headings:
� Radiologically relevant pathology� Staging and management� Typical CT findings� Atypical CT findings� Clinical role of imaging in ovarian cancer
Radiologically relevant pathology
The pathology of ovarian cancers is complex, but
only a few basic concepts are essential for the
practicing radiologist. The germinal epithelium is
the single layer of columnar cells that line the ovary.
Approximately 90% of ovarian cancers are of epi-
thelial origin [2–4]. Epithelial cancers are graded as
well (10%), moderately (25%), or poorly (65%)
differentiated. More differentiated tumors have a
better prognosis. Epithelial tumors are subtyped as
serous (50%), mucinous (20%), endometrioid (20%),
clear cell (10%), or undifferentiated (1%). The cur-
rent consensus is that histologic subtype is not of
independent prognostic significance, allowing for
tumor grade and stage, and should not affect treat-
ment planning [2]. Clear cell cancer is a possible
exception, and may have a worse prognosis inde-
pendent of other factors. Epithelial cancers are typi-
cally cystic and have a propensity to spread within
the peritoneal cavity. Non-epithelial cancers include
malignant granulosa cell tumor, dysgerminoma,
immature teratoma, endodermal sinus tumor, and
metastases to the ovary.
Staging and management
Ovarian cancer is staged surgically, based on the
International Federation of Obstetrics and Gynecol-
ogy (FIGO) system introduced in 1964 and most
recently revised in 1985 [5]. The FIGO system
reflects the three primary mechanisms of spread of
ovarian cancer, i.e., local, peritoneal, and lymphatic
[6]. The FIGO staging system is summarized in
Table 1. Stage I ovarian cancer refers to tumor
confined to the ovaries. Stage II consists of ovarian
cancer with peritoneal metastases confined to the true
pelvis. Stage III consists of ovarian cancer with
extrapelvic peritoneal metastases or abdominopelvic
nodal metastases. Stage IV consists of ovarian cancer
0033-8389/02/$ – see front matter D 2002, Elsevier Science (USA). All rights reserved.
PII: S0033 -8389 (01 )00012 -4
E-mail address: [email protected]
(F.V. Coakley).
Radiol Clin N Am 40 (2002) 609–636
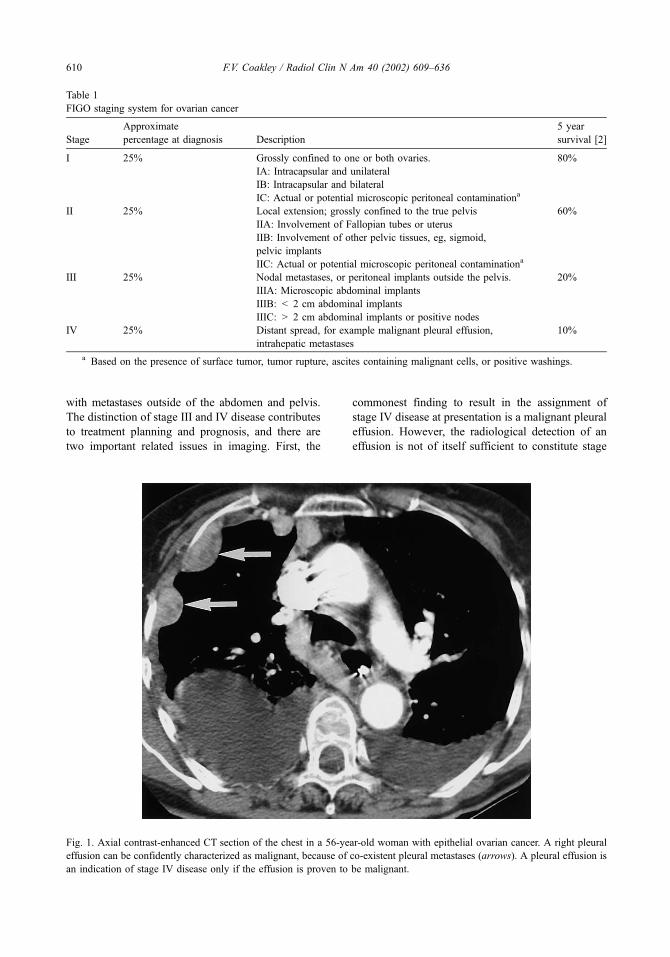
with metastases outside of the abdomen and pelvis.
The distinction of stage III and IV disease contributes
to treatment planning and prognosis, and there are
two important related issues in imaging. First, the
commonest finding to result in the assignment of
stage IV disease at presentation is a malignant pleural
effusion. However, the radiological detection of an
effusion is not of itself sufficient to constitute stage
Table 1
FIGO staging system for ovarian cancer
Stage
Approximate
percentage at diagnosis Description
5 year
survival [2]
I 25% Grossly confined to one or both ovaries. 80%
IA: Intracapsular and unilateral
IB: Intracapsular and bilateral
IC: Actual or potential microscopic peritoneal contaminationa
II 25% Local extension; grossly confined to the true pelvis 60%
IIA: Involvement of Fallopian tubes or uterus
IIB: Involvement of other pelvic tissues, eg, sigmoid,
pelvic implants
IIC: Actual or potential microscopic peritoneal contaminationa
III 25% Nodal metastases, or peritoneal implants outside the pelvis. 20%
IIIA: Microscopic abdominal implants
IIIB: < 2 cm abdominal implants
IIIC: > 2 cm abdominal implants or positive nodes
IV 25% Distant spread, for example malignant pleural effusion,
intrahepatic metastases
10%
a Based on the presence of surface tumor, tumor rupture, ascites containing malignant cells, or positive washings.
Fig. 1. Axial contrast-enhanced CT section of the chest in a 56-year-old woman with epithelial ovarian cancer. A right pleural
effusion can be confidently characterized as malignant, because of co-existent pleural metastases (arrows). A pleural effusion is
an indication of stage IV disease only if the effusion is proven to be malignant.
F.V. Coakley / Radiol Clin N Am 40 (2002) 609–636610

IV disease; the effusion must be demonstrated to be
malignant. CT rarely contributes to the determination
of whether an effusion is benign or malignant, except
when pleural thickening or nodules are identified
(Fig. 1). Another similarly important distinction is
the differentiation of liver surface implants (perito-
neal spread; stage III) from true intraparenchymal
metastases (hematogenous spread; stage IV). Surface
Fig. 2. Axial contrast-enhanced CT sections in two different patients with ovarian cancer, illustrating the differences between
perihepatic (A) and intrahepatic (B) metastases. Perihepatic metastases are surface peritoneal implants and are a feature of stage
III disease. Intrahepatic metastases are hematogenous intraparenchymal deposits and indicate stage IV disease.
F.V. Coakley / Radiol Clin N Am 40 (2002) 609–636 611

implants are usually well defined, biconvex, and
peripheral, and indent the liver rather than replace
liver parenchyma. True intraparenchymal implants
are often ill-defined, circular, and partially or com-
pletely surrounded by liver tissue (Fig. 2).
The management of ovarian cancer is closely
related to stage. The standard of care for suspected
early ovarian cancer is a comprehensive staging
laparotomy [7]. The established elements of a com-
prehensive staging laparotomy, based on the known
patterns of disease spread, are total abdominal hys-
terectomy (TAH), bilateral salpingo-oophorectomy
(BSO), infracolic omentectomy, random sampling
of multiple peritoneal sites (including pelvic side
walls, paracolic gutters, cul-de-sac, and surface of
bladder, rectum, and diaphragm), and pelvic and
para-aortic lymphadenectomy. Inspection and palpa-
tion are also performed, but in isolation are inad-
equate for the detection of peritoneal or nodal
metastases. The standard of care for operable
advanced ovarian cancer is primary optimal surgical
cytoreduction (ie, debulking) followed by adjuvant
combination chemotherapy with a platinum com-
pound and paclitaxel [7]. Optimal debulking refers
to the reduction of all tumor sites to a maximal
diameter of less than 1 to 2 cm. The 1 to 2 cm
threshold has been established empirically. Cytore-
duction with residual tumor over 1 to 2 cm confers no
benefit, while more aggressive cytoreduction to less
than 1 cm has no incremental benefit. Optimal cyto-
reduction improves survival, and probably improves
quality of life. Debulking is believed to act by remov-
ing hypovascular tumor which would receive inad-
equate chemotherapy, by increasing the number of
actively proliferating cells which are highly chemo-
sensitive, and by reducing the number of cancer cells
from which chemoresistant clones might develop.
Typical CT findings
Primary tumor
The majority of malignant epithelial tumors
appear as cystic masses lateral to the uterus. Because
of the mobility of the ovary, ovarian masses may also
be seen in the midline above the bladder or anterior to
Fig. 3. Axial contrast-enhanced CT section in a 56-year-old woman with stage I well-differentiated mucinous adenocarcinoma of
the right ovary. The large right cystic adnexal mass demonstrates the characteristic imaging features of malignancy in a cystic
lesion; the presence of thick septa (white arrow) and solid components (black arrow).
F.V. Coakley / Radiol Clin N Am 40 (2002) 609–636612

Fig. 4. Fifty-four-year-old woman with stage II poorly differentiated papillary serous carcinoma of the left ovary. Axial
T2-weighted MR image (A) shows large predominantly solid adnexal masses (asterisks) is inseparable from the sigmoid colon
(arrow). Sagittal T2-weighted MR image (B) confirms the sigmoid colon (arrow) is encased and compressed by tumor (asterisks).
At surgery, the sigmoid colon was extensively involved by tumor, and a sigmoid resection was required.
F.V. Coakley / Radiol Clin N Am 40 (2002) 609–636 613

the rectum [8]. Ovarian cancer is frequently bilateral,
and it is thought that in about half these cases the
contralateral tumor represents a synchronous second
malignancy (multicentric origin) while in the remain-
ing cases contralateral involvement is due to meta-
static spread from the primary tumor in the other
ovary [4]. Cystic adenocarcinomas are usually over
4 cm in diameter, and may be very large. Features
that suggest malignancy in a cyst are thick (>3 mm)
walls or septa, nodules, vegetations, or papillary pro-
jections (Fig. 3) [9,10]. Malignancy in a solid lesion
is suggested by necrosis. While these features are
usually detectable by contrast-enhanced CT, gadoli-
nium-enhanced MRI is slightly superior to both
contrast-enhanced CT and Doppler US in the charac-
terization of adnexal masses [11]. The administration
of gadolinium is important, because it may reveal
solid elements not appreciated on the pre-contrast T1
and T2 weighted images. It is sometimes possible to
suggest the histologic subtype of epithelial cancer
based on imaging findings. Calcification suggests a
serous tumor, but only 12% of serous tumors have
Fig. 5. Axial contrast-enhanced CT sections in three different patients with ovarian cancer, illustrating peritoneal implants
(arrows) in the left paracolic gutter (A), greater omentum (B), and perihepatic space (C). These are all frequent sites of peritoneal
metastases in ovarian cancer. The finding of confluent metastatic disease in the greater omentum is known as omental cake, and
is virtually diagnostic of ovarian cancer.
F.V. Coakley / Radiol Clin N Am 40 (2002) 609–636614
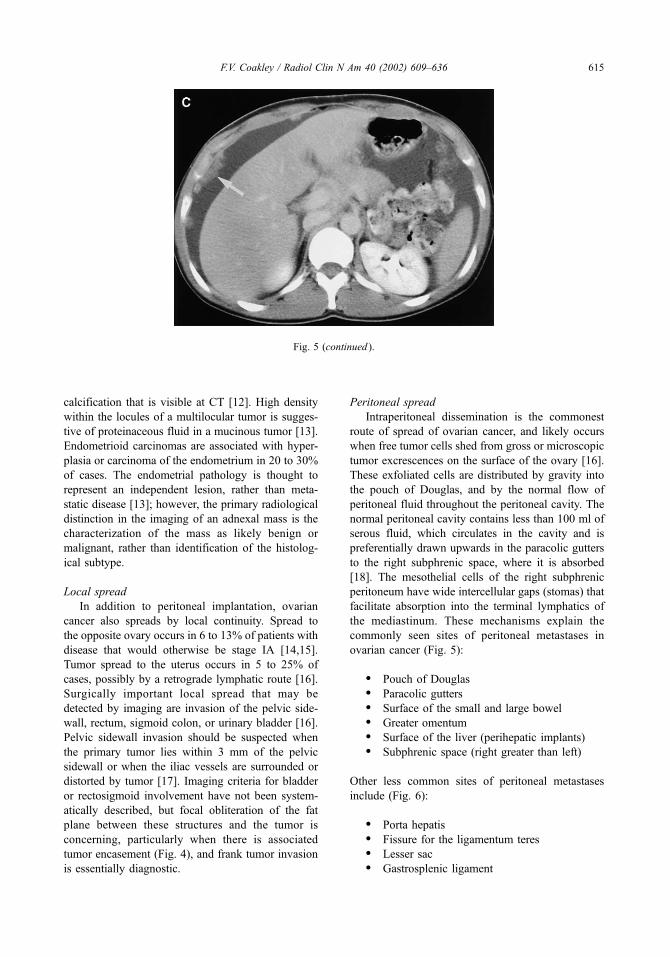
calcification that is visible at CT [12]. High density
within the locules of a multilocular tumor is sugges-
tive of proteinaceous fluid in a mucinous tumor [13].
Endometrioid carcinomas are associated with hyper-
plasia or carcinoma of the endometrium in 20 to 30%
of cases. The endometrial pathology is thought to
represent an independent lesion, rather than meta-
static disease [13]; however, the primary radiological
distinction in the imaging of an adnexal mass is the
characterization of the mass as likely benign or
malignant, rather than identification of the histolog-
ical subtype.
Local spread
In addition to peritoneal implantation, ovarian
cancer also spreads by local continuity. Spread to
the opposite ovary occurs in 6 to 13% of patients with
disease that would otherwise be stage IA [14,15].
Tumor spread to the uterus occurs in 5 to 25% of
cases, possibly by a retrograde lymphatic route [16].
Surgically important local spread that may be
detected by imaging are invasion of the pelvic side-
wall, rectum, sigmoid colon, or urinary bladder [16].
Pelvic sidewall invasion should be suspected when
the primary tumor lies within 3 mm of the pelvic
sidewall or when the iliac vessels are surrounded or
distorted by tumor [17]. Imaging criteria for bladder
or rectosigmoid involvement have not been system-
atically described, but focal obliteration of the fat
plane between these structures and the tumor is
concerning, particularly when there is associated
tumor encasement (Fig. 4), and frank tumor invasion
is essentially diagnostic.
Peritoneal spread
Intraperitoneal dissemination is the commonest
route of spread of ovarian cancer, and likely occurs
when free tumor cells shed from gross or microscopic
tumor excrescences on the surface of the ovary [16].
These exfoliated cells are distributed by gravity into
the pouch of Douglas, and by the normal flow of
peritoneal fluid throughout the peritoneal cavity. The
normal peritoneal cavity contains less than 100 ml of
serous fluid, which circulates in the cavity and is
preferentially drawn upwards in the paracolic gutters
to the right subphrenic space, where it is absorbed
[18]. The mesothelial cells of the right subphrenic
peritoneum have wide intercellular gaps (stomas) that
facilitate absorption into the terminal lymphatics of
the mediastinum. These mechanisms explain the
commonly seen sites of peritoneal metastases in
ovarian cancer (Fig. 5):
� Pouch of Douglas� Paracolic gutters� Surface of the small and large bowel� Greater omentum� Surface of the liver (perihepatic implants)� Subphrenic space (right greater than left)
Other less common sites of peritoneal metastases
include (Fig. 6):
� Porta hepatis� Fissure for the ligamentum teres� Lesser sac� Gastrosplenic ligament
Fig. 5 (continued ).
F.V. Coakley / Radiol Clin N Am 40 (2002) 609–636 615

� Splenic hilum� Gastrohepatic ligament
As noted, such peritoneal implants should not be
mistaken for intraparenchymal metastases in the liver
or spleen. Peritoneal metastases appear as nodular or
plaque-like enhancing soft tissue masses of varying
size, and may occur anywhere in the peritoneal
cavity. Delayed enhancement of perihepatic implants
has been described at MRI [19], though this may
actually represent contrast retention in the lesion with
washout in the adjacent liver. In either case, delayed
images may help. Ascites is a nonspecific finding, but
in a patient with ovarian cancer, usually indicates
peritoneal metastases [20]. Ascitic fluid may outline
small implants, which facilitates detection [8].
Previous studies examining the accuracy of CT in
the diagnosis of peritoneal metastases in ovarian
cancer have reported a sensitivity of 63% to 79%
and a specificity of 100% [21–23]. A more recent
study of 64 patients at Memorial Sloan-Kettering
Cancer Center, using spiral CT, demonstrated a sen-
sitivity of 85% to 93% and specificity of 91% to 96%
for the detection of peritoneal metastases outside the
Fig. 6. Axial contrast-enhanced CT sections in five different patients with ovarian cancer, illustrating peritoneal implants
(arrows) in the porta hepatis (A), fissure for the ligamentum teres (B), superior recess of the lesser sac (C), gastrosplenic ligament
(D), and splenic hilum (E). These are uncommon sites of metastatic disease in ovarian cancer, but are important to recognize,
because they may constitute unresectable disease. In addition, peritoneal implants (stage III) in the fissure for the ligamentum
teres, superior recess of the lesser sac, or splenic hilum should not be mistaken for intraparenchymal metastases (stage IV).
F.V. Coakley / Radiol Clin N Am 40 (2002) 609–636616

Fig. 6 (continued ).
F.V. Coakley / Radiol Clin N Am 40 (2002) 609–636 617

true pelvis [24]. This increased accuracy likely re-
flects the increasing use of thinner sections and the
absence of slice misregistration artifact on spiral CT,
which aid the detection of small implants and help in
the distinction of unopacified bowel from tumor
implants. However, implants measuring 1 cm or less
in diameter remain difficult to detect, and CT sensi-
tivity falls from 25% to 50% for such small volume
disease [24]. While CT is the primary modality for
the demonstration of metastatic disease [11,17], MRI
may be equally or more accurate [17,25]. The use of
MRI is currently limited by expense, availability,
prolonged duration of scanning, and lack of wide-
spread reader experience.
Nodal spread
The ovarian lymphatic vessels are another impor-
tant route of metastatic spread. The ovary has three
routes of lymphatic drainage [16]. The main pathway
ascends with the ovarian vessels to the retroperitoneal
nodes of the upper abdomen. The second pathway
passes laterally in the broad ligament to reach the
internal iliac and obturator nodes in the pelvic side-
wall. The third group passes with the round ligament
to the external iliac and inguinal nodes, and explains
the occasional spread of ovarian cancer to the groin.
The frequency of nodal metastases in patients with
what would otherwise be stage I or II disease is 15 to
17%, and rises to 64% in stage IV disease [26]. In a
study of 71 unselected patients with ovarian cancer, 20
(28%) had pathologically proven nodal metastases
[17]. Using a size threshold of greater than 1 cm in
short axis to define adenopathy, the sensitivity and
specificity of preoperative CT for nodal staging was
50% and 95%, respectively. Therefore, while enlarged
nodes are likely to be involved (Fig. 7), CT is unable to
exclude disease in non-enlarged nodes. This empha-
sizes the importance of lymphadenectomy as part of
the routine surgical staging of suspected early stage
disease. Occasionally, patients are encountered who
have predominantly nodal rather peritoneal spread.
Disproportionate nodal disease may be seen in dys-
germinoma (see later), and this should be suggested as
a possible diagnosis, particularly in younger patients.
However, in our experience, disproportionate nodal
disease is more frequently encountered in the setting
of poorly differentiated adenocarcinoma (Fig. 8).
Interestingly, while nodal involvement indicates at
least stage III disease, there is evidence that patients
with ‘‘node only’’ stage III disease have a better
prognosis than patients with stage III disease due to
the presence of peritoneal metastases [27].
Distant metastases (stage IV disease)
The term ‘‘distant metastases’’ in the setting of
ovarian cancer refers to metastases beyond the status
of stage III disease, ie, metastases outside of the
peritoneal cavity and abdominopelvic lymph nodes
(Fig. 9). Such metastases are rare at presentation, but
are increasingly recognized during treatment because
of the sophistication of imaging technology and
because therapy is increasingly successful at control-
ling peritoneal disease, so patients live longer and die
of distant disease which would not otherwise have
Fig. 7. Axial contrast-enhanced CT sections in two different patients with ovarian cancer, illustrating nodal metastases (arrows)
in the obturator chain (A) and retroperitoneum (B).
F.V. Coakley / Radiol Clin N Am 40 (2002) 609–636618

become evident [28]. The common sites of distant
metastases at autopsy are listed in Table 2 [28–30].
Manifestations of stage IV disease, such as paren-
chymal hepatic metastases, pleural or pulmonary
nodules, and superior diaphragmatic adenopathy, are
important to recognize but do not necessarily contra-
indicate cytoreduction.
Atypical CT findings
The typical CT findings in a patient with
advanced ovarian cancer are cystic adnexal masses
with irregular internal solid components, omental
cake, and ascites. Other sites of peritoneal disease
may also be present; however, a significant propor-
tion of patients has atypical findings. These are
important to recognize, because they may have
important pathologic or clinical implications. In addi-
tion, several pathologic entities may result in unusual
or potentially confusing imaging findings. These
issues are described in this section.
Non-epithelial ovarian cancer
Ovarian cancers other than primary epithelial
cancers include malignant sex-cord stromal tumors,
malignant germ cell tumors, and metastases to the
ovary. Malignant germ cell and malignant sex-cord
Fig. 8. Axial contrast-enhanced CT sections in a 55-year-old woman with stage III poorly differentiated adenocarcinoma of the
right ovary. The primary tumor (asterisk) is predominantly cystic with mural nodules (A). A large nodal deposit (arrow) is seen
in the retroperitoneum (B), without visible peritoneal deposits or ascites. Disproportionate nodal disease is unusual, and may be
seen in poorly differentiated primary epithelial cancer, and dysgerminoma. An extra-ovarian primary cancer with nodal and
adnexal metastases is also a consideration.
F.V. Coakley / Radiol Clin N Am 40 (2002) 609–636 619

stromal tumors account for approximately 7% of
primary ovarian cancers [3].
Of the many subtypes of sex-cord stromal
tumors, only granulosa cell tumors are seen with
significant frequency [16]. Granulosa cell tumors are
characterized histologically by a significant content
of granulosa cells, which are the cells that surround
the ovarian follicles. During ovulation, these cells
mature from pregranulosa cells to granulosa cells,
and finally granulosa lutein cells. The latter secrete
estrogens and progesterone, and accordingly granu-
losa cell tumors are often functional (ie, hormonally
active). Granulosa cell tumors are divided into adult
and juvenile types. The later are almost always
benign [31]. Adult granulosa cell tumors usually
present in pre- or post- menopausal patients with
menstrual disturbance or uterine bleeding, due to
estrogen-induced endometrial hyperplasia. Endome-
trial hyperplasia progresses to endometrial carcinoma
in 5 to 25% of patients. The wide variation in the
reported incidence of secondary endometrial carci-
noma may be partially due to histologic difficulty in
distinguishing atypical hyperplasia and endometrial
carcinoma [32]. Occasionally, granulosa cell tumors
are androgenic and present with virilization. At
imaging, granulosa cell tumors are large encapsu-
lated multicystic masses that are predominantly solid
with variable cystic components [33,34]. The tumors
may have a characteristic ‘‘spongelike’’ appearance
on T2-weighted MRI. The masses are usually uni-
lateral and confined to the ovary. Associated endo-
metrial thickening or mass may be seen. Unilateral
salpingo-oophorectomy is the standard treatment
[16]. The histological appearance of granulosa cell
tumors does not correlate with biological behavior,
so prolonged follow-up is required to detect evi-
dence of malignancy, such as peritoneal metastases
(Fig. 10). Granulosa cell tumors have a particular
predisposition to hemorrhage. Hemorrhage may be
intratumoral or intraperitoneal. The latter is due to
tumor rupture and may result in an acute clinical
presentation with hemoperitoneum.
Malignant germ cell tumors account for less than
5% of all ovarian cancers [16], but are more frequent
in younger women, and account for two-thirds of
ovarian cancers in women less than 20 years of age
[35]. The commonest subtypes are dysgerminoma,
immature teratoma, and endodermal sinus tumor, and
these subtypes account for approximately 90% of
malignant germ cell tumors [4]. Dysgerminoma is the
female equivalent of seminoma. The tumor is fre-
Fig. 9. Axial contrast-enhanced CT sections in a 45-year-old woman with recurrent ovarian adenocarcinoma, 6 years after initial
surgery and chemotherapy for stage III disease. Two separate metastases (arrows) are seen in the mid (A) and lower (B) right
kidney. Hematogenous metastases are increasingly detected in patients with ovarian cancer, due to modern imaging technology
and better control of peritoneal disease. Such metastases may be seen in a wide variety of sites.
Table 2
Frequency of distant metastases in ovarian cancer at autopsy
by site
Site Frequency
Liver 45–48%
Lung 34–39%
Pleura 25%
Adrenal glands 15–21%
Spleen 15–20%
Bone and bone marrow 11%
Kidney 7–10%
Skin and subcutaneous tissues 5%
Brain 3–6%
F.V. Coakley / Radiol Clin N Am 40 (2002) 609–636620

quently unilateral and solid, but be partially cystic
and contain areas of hemorrhage and necrosis [36].
The finding of a multi-lobulated mass with prominent
enhancing septa has been described as a character-
istic feature on MRI [37]. The tumor is often local-
ized at presentation (stage I or II) [38]. If present,
metastatic disease tends to be nodal rather than
peritoneal. Many patients can be successfully treated
by unilateral oophorectomy and combination chemo-
therapy [16]. Immature (malignant) teratoma of the
ovary is also usually unilateral and solid, though
cystic areas are common [39]. About 70% of patients
have stage I or II disease at presentation. Calcifica-
tion and small amounts of fat may be seen within
mature teratoma [40]. In addition, a co-existent
mature teratoma is present in the ipsilateral ovary
in 26% of patients and in the contralateral ovary in
10% of patients [41]. Metastases, if present, are
usually peritoneal in location (Fig. 11). Endodermal
sinus tumor or yolk sac tumor of the ovary is a
malignant germ cell tumor characterized histologi-
cally by papillary projections that resemble the yolk
sac endodermal sinus of the rodent placenta [32]. The
tumor usually presents as rapidly growing unilateral
adnexal mass in a young woman. The imaging
features are variable, and the tumors may range from
predominantly solid to predominantly cystic [42]. A
co-existent mature teratoma (dermoid cyst) is seen in
Fig. 10. Axial contrast-enhanced CT sections in a 46-year-old woman with recurrent granulosa cell tumor, 4 years after initial
surgery for stage I disease. A predominantly solid peritoneal implant (arrow) is seen between the liver, right kidney, and
duodenum (A). Four weeks later, the patient complained of right upper quadrant pain, and a repeat CT scan (B) showed a large
hematoma (asterisk) adjacent to the implant, secondary to tumor rupture and hemorrhage. Granulosa cell tumors have a particular
predilection to hemorrhage, either within the tumor or into the peritoneal cavity.
F.V. Coakley / Radiol Clin N Am 40 (2002) 609–636 621

up to 15% of cases (Fig. 12). Hemorrhage and
hypervascular enhancement have been suggested as
imaging findings that may suggest the histologic
diagnosis, in the setting of a complex ovarian mass
in a young woman.
Metastases to the ovary usually arise from primary
malignancy in the stomach or colon, though other
primary sites such as the breast, lung, and pancreas
are also recognized [43]. The term Krukenberg tumor
is sometimes used as a synonym for metastases to the
ovary. However, this term is correctly used for a
metastasis consisting of mucin signet-ring cells in a
cellular stroma, usually arising from a carcinoma of
the gastric antrum [32]. Using this definition, only
30% to 40% of ovarian metastases are Krukenberg
tumors [4]. Metastases to the ovary are typically
bilateral, solid, and strongly enhancing [43,44].
Cystic and necrotic areas are common (Fig. 13).
Mucinous tumors may result in areas of increased
T2 signal on MRI, while fibrous stromal may result in
areas of reduced T2 signal [43]. The primary tumor is
often clinically overt, with other evidence of wide-
spread metastatic disease [45].
Superior diaphragmatic adenopathy
The superior diaphragmatic (or cardiophrenic)
nodes lie on the superior surface of the diaphragm,
and are divided into two groups [46,47]. The
anterior diaphragmatic (or paracardiac) nodes lie
behind the seventh costochondral junction and ster-
num. The lateral diaphragmatic (or juxtaphrenic)
nodes lie close to the entrance of the phrenic nerve
into the diaphragm, adjacent to the inferior vena
cava on the right and the cardiac apex on the left.
The diaphragmatic nodes are the principal drainage
site of the entire peritoneal cavity, and enlarged
superior diaphragmatic nodes are seen in approxi-
mately 15% of patients with advanced ovarian
cancer (Fig. 14) [48]. Because these nodes are
usually small, enlargement is defined as a short axis
diameter greater than 5 mm [47,48]. In a study of
FIGO stage III ovarian cancer at the Royal Marsden
Hospital, anterior diaphragmatic adenopathy was
seen at baseline CT scanning in 15 (28%) of 53
patients [48]. This finding was an independent
predictor of disease recurrence and death. This
suggests anterior diaphragmatic adenopathy should
be considered indicative of stage IV disease, but
such radiologic findings are not currently incorpo-
rated in the surgically-based FIGO staging system.
One limitation of the Marsden study was that the
pathological status of the nodes was not directly
assessed, but the inaccessible location of these nodes
is such that they are rarely biopsied or resected.
Mesenteric root disease
The small bowel mesentery may be involved by
surface peritoneal implants, such as in the greater
omentum or on the bowel wall. These implants are
usually peripherally located with respect to the small
Fig. 11. Axial contrast-enhanced CT sections in a 28-year-old woman with stage III immature teratoma. Relatively small and
predominantly solid ovarian masses (arrow) are seen in pelvis (A). Two larger additional masses (asterisks) lying in the pouch of
Douglas and superior to the bladder were found to be extra-ovarian peritoneal implants at surgery. (B) Tumor implants (arrows)
are also seen in the greater omentum (arrows). Solid ovarian masses in young women with suspected ovarian malignancy are
suggestive of primary non-epithelial cancer.
F.V. Coakley / Radiol Clin N Am 40 (2002) 609–636622
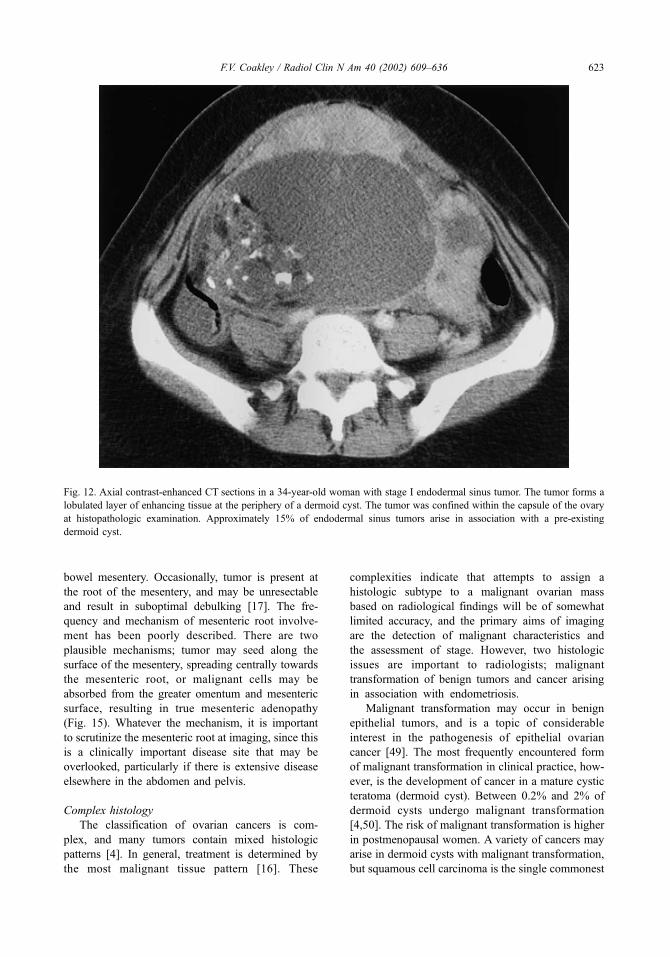
bowel mesentery. Occasionally, tumor is present at
the root of the mesentery, and may be unresectable
and result in suboptimal debulking [17]. The fre-
quency and mechanism of mesenteric root involve-
ment has been poorly described. There are two
plausible mechanisms; tumor may seed along the
surface of the mesentery, spreading centrally towards
the mesenteric root, or malignant cells may be
absorbed from the greater omentum and mesenteric
surface, resulting in true mesenteric adenopathy
(Fig. 15). Whatever the mechanism, it is important
to scrutinize the mesenteric root at imaging, since this
is a clinically important disease site that may be
overlooked, particularly if there is extensive disease
elsewhere in the abdomen and pelvis.
Complex histology
The classification of ovarian cancers is com-
plex, and many tumors contain mixed histologic
patterns [4]. In general, treatment is determined by
the most malignant tissue pattern [16]. These
complexities indicate that attempts to assign a
histologic subtype to a malignant ovarian mass
based on radiological findings will be of somewhat
limited accuracy, and the primary aims of imaging
are the detection of malignant characteristics and
the assessment of stage. However, two histologic
issues are important to radiologists; malignant
transformation of benign tumors and cancer arising
in association with endometriosis.
Malignant transformation may occur in benign
epithelial tumors, and is a topic of considerable
interest in the pathogenesis of epithelial ovarian
cancer [49]. The most frequently encountered form
of malignant transformation in clinical practice, how-
ever, is the development of cancer in a mature cystic
teratoma (dermoid cyst). Between 0.2% and 2% of
dermoid cysts undergo malignant transformation
[4,50]. The risk of malignant transformation is higher
in postmenopausal women. A variety of cancers may
arise in dermoid cysts with malignant transformation,
but squamous cell carcinoma is the single commonest
Fig. 12. Axial contrast-enhanced CT sections in a 34-year-old woman with stage I endodermal sinus tumor. The tumor forms a
lobulated layer of enhancing tissue at the periphery of a dermoid cyst. The tumor was confined within the capsule of the ovary
at histopathologic examination. Approximately 15% of endodermal sinus tumors arise in association with a pre-existing
dermoid cyst.
F.V. Coakley / Radiol Clin N Am 40 (2002) 609–636 623

malignancy. The imaging findings in a series of
six patients with malignant transformation in der-
moid cysts have been reported [51]. A large non-
fatty solid component was seen in four cases, and this
mass invaded adjacent structures in three cases.
Therefore, these findings may indicate malignancy
when seen in a dermoid cyst, particularly in a post-
menopausal patient.
The co-existence of endometriosis and endome-
trial cancer was initially considered coincidental [4],
but is now generally accepted as a real association
[52,53]. The reported relative risk of ovarian cancer
in patients with long-standing endometriosis is 4.2
[54]. The mechanism of the association remains
obscure. The commonest histologic types of ovarian
cancer seen in association with endometriosis are
clear cell, endometrioid, and serous carcinoma [53].
The radiological appearances of ovarian cancer aris-
ing in endometriosis have not been systematically
described, but the detection of solid tissue in an
endometriotic cyst should be considered suspicious
(Fig. 16).
Primary papillary serous carcinoma of
the peritoneum
Occasionally, a female patient presents with
peritoneal carcinomatosis, an elevated CA-125, but
without large adnexal masses [55,56]. While this
may represent peritoneal spread from a non-ovarian
primary site, the constellation of findings should
raise the possibility of primary papillary serous
carcinoma of the peritoneum (Fig. 17). Papillary
serous peritoneal carcinomatosis is usually secon-
dary to ovarian papillary serous carcinoma. How-
ever, in about 10% of cases, the ovaries appear
grossly normal, or are only superficially involved by
tumor. In such cases, it is postulated that the tumor
has arisen from the extraovarian peritoneum, and the
term papillary serous carcinoma of the peritoneum is
used [57]. A primary origin from the extraovarian
peritoneum is supported by the occurrence of the
tumor many years after bilateral oophorectomy for
benign disease [58], and by one reported case in a
man [59]. Other terms that have been used to refer
to this condition include serous surface papillary
Fig. 13. Axial contrast-enhanced CT section in a 69-year-old woman with widely metastatic pancreatic cancer, including a
metastasis to the left ovary (arrow). The mass is heterogenous and hypodense, but predominantly solid.
F.V. Coakley / Radiol Clin N Am 40 (2002) 609–636624

carcinoma, papillary tumor of the peritoneum, and
normal-sized ovary carcinoma syndrome. Imaging
findings resemble those of peritoneal carcinomatosis
due to ovarian carcinoma, except that the ovaries are
Fig. 14. Axial contrast-enhanced CT section (A) in a 59-year-woman with ovarian cancer showing an enlarged superior
diaphragmatic node (arrow). These nodes are rarely biopsied, because of the inaccessible location. In this case, a PET scan (B)
was performed, and confirmed increased metabolic activity (arrow) in the node.
F.V. Coakley / Radiol Clin N Am 40 (2002) 609–636 625

F.V. Coakley / Radiol Clin N Am 40 (2002) 609–636626

typically less than 4 cm in size. The presence of
peritoneal masses, extensive omental calcification,
and the absence of an ovarian mass on CT have
been reported as highly suggestive of primary papil-
lary serous carcinoma of the peritoneum, particularly
in postmenopausal women [55,60]. The distinction
from ovarian papillary serous carcinoma is largely
academic, since both are treated with cytoreduc-
tive surgery and platin-based chemotherapy, and
the prognosis is similar in both conditions [56,57].
The distinction from primary peritoneal mesothe-
lioma can be difficult histologically, but is important
to make, since prognosis and management are dif-
ferent. The median survival for patients with papil-
lary serous carcinoma of the peritoneum is 2 years,
whereas patients with peritoneal mesothelioma
rarely survive for more than a year.
Calcified ovarian tumors
Calcification in an ovarian mass usually suggests
a benign etiology, such as mature teratoma, fibroma,
or Sertoli-Leydig cell tumor [61–63], but calcifica-
tion can also be seen in ovarian malignancies. Most
calcified ovarian cancers are serous carcinomas [12].
Other rare malignancies such as malignant Brenner
Fig. 15. Axial contrast-enhanced CT sections in two different patients with ovarian cancer, illustrating mesenteric root
involvement. Disease in the mesenteric root may appear as soft tissue nodules (arrow) adjacent to the superior mesenteric vessels
(A), which may represent nodal spread after absorption of malignant cells from the greater omentum or mesenteric surface, or as
soft tissue masses (arrows) distributed more randomly within the mesentery (B), which may represent peritoneal implants on the
mesenteric surface.
Fig. 16. Axial gadolinium-enhanced T1 axial MR image with fat suppression in a 41-year-old woman. A left ovarian cystic
lesion is of high T1 signal intensity (asterisk), despite fat saturation. This is suggestive of hemorrhage in an either endometriotic
cyst or a hemorrhagic ovarian cyst. However, in addition, an enhancing mural nodularity is visible (arrow). The lesion was
resected and histopathologic analysis showed a focus of clear-cell carcinoma arising in an endometriotic cyst.
F.V. Coakley / Radiol Clin N Am 40 (2002) 609–636 627

tumors and gonadoblastoma may also calcify [64,65].
Calcification in peritoneal metastases is helpful in the
detection of implants around the liver and spleen.
Calcified disease more inferiorly in the abdomen may
Fig. 17. Axial contrast-enhanced CT sections (A and B) in a 52-year-old woman with primary serous papillary carcinoma of the
peritoneum, showing the typical radiologic constellation of ascites, peritoneal implants (straight arrows) and non-enlarged ovaries
(curved arrows).
F.V. Coakley / Radiol Clin N Am 40 (2002) 609–636628
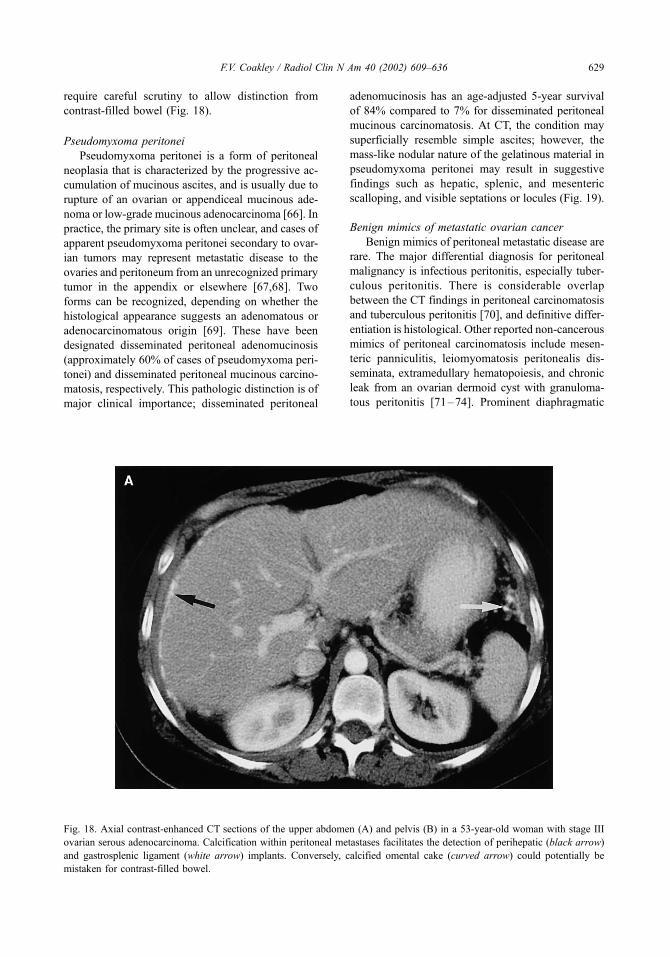
require careful scrutiny to allow distinction from
contrast-filled bowel (Fig. 18).
Pseudomyxoma peritonei
Pseudomyxoma peritonei is a form of peritoneal
neoplasia that is characterized by the progressive ac-
cumulation of mucinous ascites, and is usually due to
rupture of an ovarian or appendiceal mucinous ade-
noma or low-grade mucinous adenocarcinoma [66]. In
practice, the primary site is often unclear, and cases of
apparent pseudomyxoma peritonei secondary to ovar-
ian tumors may represent metastatic disease to the
ovaries and peritoneum from an unrecognized primary
tumor in the appendix or elsewhere [67,68]. Two
forms can be recognized, depending on whether the
histological appearance suggests an adenomatous or
adenocarcinomatous origin [69]. These have been
designated disseminated peritoneal adenomucinosis
(approximately 60% of cases of pseudomyxoma peri-
tonei) and disseminated peritoneal mucinous carcino-
matosis, respectively. This pathologic distinction is of
major clinical importance; disseminated peritoneal
adenomucinosis has an age-adjusted 5-year survival
of 84% compared to 7% for disseminated peritoneal
mucinous carcinomatosis. At CT, the condition may
superficially resemble simple ascites; however, the
mass-like nodular nature of the gelatinous material in
pseudomyxoma peritonei may result in suggestive
findings such as hepatic, splenic, and mesenteric
scalloping, and visible septations or locules (Fig. 19).
Benign mimics of metastatic ovarian cancer
Benign mimics of peritoneal metastatic disease are
rare. The major differential diagnosis for peritoneal
malignancy is infectious peritonitis, especially tuber-
culous peritonitis. There is considerable overlap
between the CT findings in peritoneal carcinomatosis
and tuberculous peritonitis [70], and definitive differ-
entiation is histological. Other reported non-cancerous
mimics of peritoneal carcinomatosis include mesen-
teric panniculitis, leiomyomatosis peritonealis dis-
seminata, extramedullary hematopoiesis, and chronic
leak from an ovarian dermoid cyst with granuloma-
tous peritonitis [71–74]. Prominent diaphragmatic
Fig. 18. Axial contrast-enhanced CT sections of the upper abdomen (A) and pelvis (B) in a 53-year-old woman with stage III
ovarian serous adenocarcinoma. Calcification within peritoneal metastases facilitates the detection of perihepatic (black arrow)
and gastrosplenic ligament (white arrow) implants. Conversely, calcified omental cake (curved arrow) could potentially be
mistaken for contrast-filled bowel.
F.V. Coakley / Radiol Clin N Am 40 (2002) 609–636 629

slips should not be mistaken for perihepatic implants
[75] (Fig. 20).
Clinical role of imaging in ovarian cancer
The previous sections have described the typical
and atypical imaging findings in ovarian cancer. The
ultimate role of the radiologist is to integrate these
findings with the clinical setting in order to optimize
patient care and develop a tailored patient-specific
management plan. The imaging observations that are
critical to management may be divided into those
related to characterization of the primary tumor,
identification of metastatic disease to prevent under-
staging, and identification of disease that may be an
indication for neoadjuvant chemotherapy.
Most ovarian malignancies are epithelial cancers
and appear as cystic adnexal masses with irregular
internal solid components. This is often accompanied
by omental cake, peritoneal implants, and ascites.
The clinical and imaging findings in non-epithelial
cancers have been described previously, and are
summarized in Table 3. These diagnoses are impor-
tant considerations in the appropriate setting, because
in young patients some of these tumors (granulosa
cell tumor, dysgerminoma, immature teratoma, and
endodermal sinus tumor) may be treated by unilateral
oophorectomy in order to preserve fertility. Con-
versely, metastatic disease to the ovary may be more
appropriately treated by systemic chemotherapy
rather than resection.
In practice, up to 90% of patients with apparent
stage I or II ovarian cancer do not have optimal
surgical staging, often because of failure to perform
a selective retroperitoneal lymphadenectomy [76]. As
a result, approximately 30% of such patients are
under-staged [77]. Accurate identification of ovarian
metastases by imaging helps prevent such under-
staging, and may guide subspecialist referral in
patients in whom the diagnosis of ovarian cancer
was not considered, or considered unlikely.
In practice, the percentage of women with ad-
vanced ovarian cancer who are successfully (opti-
mally) debulked varies from 17% to 87% [7]. This
wide variation likely reflects differences in surgical
Fig. 18 (continued ).
F.V. Coakley / Radiol Clin N Am 40 (2002) 609–636630

expertise, but indicates that even in specialist cen-
ters a significant fraction of patients will have
inoperable disease and will gain no benefit from
primary cytoreduction. The optimal management of
Fig. 19. Axial contrast-enhanced CT sections in a 45-year-old woman with pseudomyxoma peritonei. Mucin in the peritoneal
cavity resembles simple ascitic fluid, but the presence of scalloping (arrow) of the liver surface (A) and mass-like separation of
bowel loops (B) indicates the true diagnosis.
F.V. Coakley / Radiol Clin N Am 40 (2002) 609–636 631

patients with inoperable ovarian cancer is not
established, but review of the clinical and radio-
logical literature suggests:
� Neoadjuvant chemotherapy (ie, preoperative)
with interval (or delayed) cytoreductive surgery
after tumor shrinkage is a viable management
option, and merits a randomized controlled trial
[78,79].� Cross-sectional imaging can help treatment
planning by identifying, with a high degree of
accuracy, those patients with inoperable dis-
ease [17,80,81].
The concept of using imaging to identify patients
with inoperable disease who may be more appropri-
ately managed by neoadjuvant chemotherapy appears
straightforward, but the problem is that there are no
clearly established surgical criteria for inoperable
disease. Some institutions consider radical surgery
appropriate to achieve optimal debulking, even if this
involves including resection of the liver, spleen, or
kidneys [7,82]. Therefore, the role of the radiologist
is not to describe disease as resectable or unresect-
able, but rather to alert the clinician to disease that
may complicate surgery. Depending on the institu-
tion, this may be an indication for neoadjuvant
chemotherapy. Findings that may indicate inoperable
disease include:
� Invasion of the pelvic sidewall, rectum, sig-
moid colon, or bladder� Tumor deposits greater than 1 to 2 cm in size
in the gastrosplenic ligament, gastrohepatic
ligament, lesser sac, fissure for the ligamen-
tum teres, porta hepatis, subphrenic space,
small bowel mesentery, or retroperitoneum
above the renal hila [17,80,81,83].
Summary
Ovarian cancer is relatively common, and often
presents at an advanced stage with widespread
intraperitoneal metastases. The constellation of com-
plex pelvic masses, ascites, omental cake, and other
peritoneal implants is virtually diagnostic. All
patients are potential surgical candidates, since
suspected early stage disease is treated by a com-
prehensive staging laparotomy including total abdo-
minal hysterectomy, bilateral salpingo-oophorectomy,
Fig. 20. Axial contrast-enhanced CT section of the upper abdomen, showing a prominent diaphragmatic slip (arrow). This should
not be interpreted as a perihepatic implant.
F.V. Coakley / Radiol Clin N Am 40 (2002) 609–636632

and omentectomy. Operable advanced disease is
treated by surgical debulking and adjuvant combina-
tion chemotherapy. The role of imaging is to detect
and characterize adnexal masses as likely malignant,
recognize unusual findings that may suggest atypical
pathology, demonstrate metastases in order to pre-
vent under-staging, and detect specific sites of dis-
ease that may be unresectable. These aims are
directly related to clinical management; character-
ization of an adnexal mass as malignant guides
appropriate surgical referral, recognition of atypical
pathology such as malignant granulosa cell tumor in
a young woman may be an indication for fertility-
preserving surgery. Demonstration of metastatic sites
assists surgical planning, and detection of unresect-
able disease may be an indication for neoadjuvant
(ie, preoperative) chemotherapy with interval de-
bulking rather than primary debulking with adjuvant
(postoperative) chemotherapy.
References
[1] Landis SH, Murray T, Bolden S, et al. Cancer statistics,
1998. CA Cancer J Clin 1998;48:6.
[2] Friedlander ML. Prognostic factors in ovarian cancer.
Sem Oncol 1998;25:305–14.
[3] Koonings PP, Campbell K, Mishell DR, et al. Relative
frequency of primary ovarian neoplasms: a 10-year
review. Obstet Gynecol 1989;74:921–6.
[4] Scully RE. Tumors of the ovary and maldeveloped
gonads. Atlas of tumor pathology 3rd series. Washing-
ton DC: Armed Forces Institute of Pathology; 1979.
[5] International Federation of Obstetrics and Gynecology.
Annual report on the results of treatment in gynecolog-
ical cancer. Int J Gynecol Obstetr 1989;28:189–90.
[6] Hoskins WJ. Surgical staging and cytoreductive sur-
gery of epithelial ovarian cancer. Cancer 1993;71:
1534–40.
[7] Boente MP, Chi DS, HoskinsWJ. The role of surgery in
the management of ovarian cancer: primary and interval
cytoreductive surgery. Sem Oncol 1998;25:326–34.
[8] Kawamoto SK, Urban BA, Fishman EK. CT of
epithelial ovarian tumors. RadioGraphics 1999;19:
S85–S102.
[9] Brown DL, Doubilet PM, Miller FH, et al. Benign and
malignant ovarian masses: selection of the most dis-
criminating gray-scale and Doppler sonographic fea-
tures. Radiology 1998;208:103–10.
[10] Hricak H, Chen M, Coakley FV, et al. Complex ad-
nexal masses: detection and characterization by MR
imaging – multivariate analysis. Radiology 2000;214:
39–46.
Table 3
Clinicoradiological clues to the diagnosis of non-epithelial ovarian cancer.
Diagnosis
Frequency
(% of all cancers)a Clinical and radiological clues
Malignant granulosa <10% Perimenopausal patient with estrogenic symptoms
cell tumor Large encapsulated solid mass with variable cystic
(may be spongelike) components
Usually unilateral and confined to the ovary
± Endometrial hyperplasia/carcinoma
± Intratumoral hemorrhage/hemoperitoneum
Metastases to the
ovary
6% Older woman with known primary malignancy,
including gastric, colonic, breast, lung,
and pancreatic
Bilateral solid strongly enhancing masses
± Cystic and necrotic areas
± Increased (mucin) or decreased (stromal
reaction) T2 signal intensity
Dysgerminoma 1% Young woman
Unilateral solid multi-lobulated mass
± Nodal metastases
Immature teratoma <1% Young woman
Unilateral predominantly solid mass
± Peritoneal metastases
Endodermal <1% Young woman with a rapidly growing mass
sinus tumor Predominantly solid to cystic unilateral mass with
hemorrhage and hypervascular enhancement
± Co-existent dermoid cyst
a Scully.
F.V. Coakley / Radiol Clin N Am 40 (2002) 609–636 633
[11] Kurtz A, Tsimikas JV, Tempany CMC, et al. Diagnosis
and staging of ovarian cancer: Comparative values of
Doppler and conventional US, CT, and MR imaging
correlated with surgery and histopathologic analysis –
report of the Radiation Diagnostic Oncology Group.
Radiology 1999;212:19–27.
[12] Mitchell DG, Hill MC, Hill S, et al. Serous carcinoma
of the ovary: CT identification of metastatic calcified
implants. Radiology 1996;158:649–52.
[13] Wagner BJ, Buck JL, Seidman JD, et al. Ovarian epi-
thelial neoplasms: radiologic-pathologic correlation.
RadioGraphics 1994;14:1351–74.
[14] Fuks Z. Patterns of spread of ovarian carcinoma: Re-
lation to therapeutic strategies. Adv Biosci 1980;
26:39–51.
[15] Munnell EW. Is conservative therapy ever justified in
stage I (Ia) cancer of the ovary? Am J Obstet Gynecol
1969;103:641–50.
[16] Young RC, Perez CA, Hoskins WJ. Cancer of the ova-
ry. In: DeVita VT Jr, Hellman S, Rosenberg SA, edi-
tors. Cancer: Principles and practice of Oncology, 4th
edition. Philadelphia: JB Lippincott; 1993. p. 1226–61.
[17] Forstner R, Hricak H, Occhipinti KA, et al. Ovarian
cancer: Staging with CT and MR imaging. Radiology
1995;197:619–26.
[18] Feldman GB, Knapp RI. Lymphatic drainage of the
peritoneal cavity and significance in ovarian cancer.
Am J Obstet Gynecol 1974;119:991–4.
[19] Low RN, Carter WD, Saleh F, et al. Ovarian cancer:
comparison of findings with perfluorocarbon-enhanced
MR imaging, In-111-CYT-103 immunoscintigraphy,
and CT. Radiology 1995;195:391–400.
[20] Morrow CP, Curtin JP, Townsend D. Tumors of the
ovary: Neoplasms derived from celomic epithelium.
In: Schmitt W, editor. Synopsis of gynecologic oncol-
ogy. 5th edition. New York: Churchill Livingstone;
1998. p. 233–80.
[21] Halvorsen Jr RA, Panushka C, Oakley GJ, et al. Intra-
peritoneal contrast material improves the CT detection
of peritoneal metastases. AJR 1991;157:37–40.
[22] Buy JN, Moss AA, Ghossian MA, et al. Peritoneal
implants from ovarian tumors: CT findings. Radiology
1988;169:691–4.
[23] Jacquet P, Jelinek JS, Steves MA, et al. Evaluation of
computed tomography in patients with peritoneal car-
cinomatosis. Cancer 1993;72:1631–6.
[24] Coakley FV, Choi PH, Gouqoutas CA, Pothuri B,
Venkatraman E, Chi D, et al. Detection of peritoneal
metastases by spiral CT in patients with ovarian can-
cers. Radiology, in press.
[25] Low RN, Semelka RC, Worawattanakul S, et al. Ex-
trahepatic abdominal imaging in patients with malig-
nancy: Comparison of MR imaging and helical CT,
with subsequent surgical correlation. Radiology 1999;
210:625–32.
[26] Musumeci R, De Palo G, Kenda R, et al. Retroperito-
neal metastases from ovarian carcinoma: reassessment
of 365 patients studied with lymphography. AJR 1980;
134:449–52.
[27] Onda T, Yoshikawa H, Yasugi T, et al. Patients with
ovarian carcinoma upstaged to stage III after system-
atic lymphadenectomy have similar survival to Stage I/
II patients and superior survival to other Stage III pa-
tients. Cancer 1998;83:1555–60.
[28] Dauplat J, Hacker NF, Nieberg RK, et al. Distant meta-
stases in epithelial ovarian carcinoma. Cancer 1987;
60:1561–6.
[29] Dvoretsky PM, Richards KA, Angel C, et al. Distribu-
tion of disease at autopsy in 100 women with ovarian
cancer. Hum Pathol 1988;19:57–63.
[30] Rose PG, Piver MS, Tsukada Y, et al. Metastatic pat-
terns in histologic variants of ovarian cancer. An autop-
sy study. Cancer 1989;64:1508–13.
[31] Calaminus G, Wessalowski R, Harms D, et al. Juvenile
granulosa cell tumors of the ovary in children and
adolescents: results from 33 patients registered in a
prospective cooperative study. Gynecol Oncol 1997;
65:447–52.
[32] Hricak H, Coakley FV. Urogenital imaging. In: Petters-
son H, Allison D, editors. The Encyclopedia of Med-
ical Imaging, Volume IV:2, Oslo: The NICER Institute;
1999. p. 297–549.
[33] Ko SF, Wan YL, Ng SH, et al. Adult ovarian gran-
ulosa cell tumors: spectrum of sonographic and CT
findings with pathologic correlation. AJR 1999;
172:1227–33.
[34] Morikawa K, Hatabu H, Togashi K, et al. Granulosa
cell tumor of the ovary: MR findings. J Comput Assist
Tomogr 1997;21:1001–4.
[35] Forstner R, Chen M, Hricak H. Imaging of ovarian
cancer. JMRI 1995;5:606–13.
[36] Sohaib S, Reznek R, Husband J. Ovarian cancer. In:
Husband JES, Reznek RH, editors. Imaging in Oncol-
ogy. Oxford: Isis Medical Media; 1998. p. 277–308.
[37] Tanaka YO, Kurosaki Y, Nishida M, et al. Ovarian
dysgerminoma: MR and CT appearances. J Comput
Assist Tomogr 1994;18:443–8.
[38] Krepart G, Smith JP, Rutledge F, et al. The treatment for
dysgerminoma of the ovary. Cancer 1978;41:986–90.
[39] Gershenson DM, del Junco G, Silva EG, et al. Imma-
ture teratoma of the ovary. Obstetr Gynecol 1986;68:
624–9.
[40] Outwater EK, Siegelman ES, Hunt JL. Ovarian terato-
mas: Tumor types and imaging characteristics. Radio-
Graphics 2001;21:475–90.
[41] Brown MF, Hebra A, McGeehin K, et al. Ovarian
masses in children: A review of 91 cases of malignant
and benign masses. J Pediatr Surg 1993;28:930–3.
[42] Yamaoka T, Togashi K, Koyama T, et al. Yolk sac tumor
of the ovary: radiologic-pathologic correlation in four
cases. J Comput Assist Tomogr 2000;24:605–9.
[43] Ha HK, Baek SY, Kim SH, et al. Krukenberg’s tumor
of the ovary: MR imaging features. AJR 1995;164:
1435–9.
[44] Kim SH, Kim WH, Park KJ, et al. CT and MR findings
of Krukenberg tumors: comparison with primary ovar-
ian tumors. J Comput Assist Tomogr 1996;20:393–8.
[45] Hann LE, Lui DM, Shi W, et al. Adnexal masses in
F.V. Coakley / Radiol Clin N Am 40 (2002) 609–636634

women with breast cancer: US findings with clinical
and histopathologic correlation. Radiology 2000;216:
242–7.
[46] Williams PL, Warwick R. Grays Anatomy. 38th ed.
Edinburgh, London, Melbourne, New York: Churchill
Livingstone; 1995. p. 1624.
[47] Aronberg DJ, Peterson RR, Glazer HS, et al. Superior
diaphragmatic lymph nodes: CT assessment. J Comput
Assist Tomogr 1986;10:937–41.
[48] Holloway BJ, Gore ME, Hern RP, et al. The signifi-
cance of paracardiac lymph node enlargement in ovar-
ian cancer. Clinl Radiol 1997;52:692–7.
[49] Puls LE, Powell DE, DePriest PD, et al. Transition
from benign to malignant epithelium in mucinous
and serous ovarian cystadenocarcinoma. Gynecol On-
col 1992;47:53–7.
[50] Comerci Jr JT, Licciardi F, Bergh PA, et al. Mature
cystic teratoma: a clinicopathologic evaluation of 517
cases and review of the literature. Obstetrics & Gyne-
cology 1994;84:22–8.
[51] Kido A, Togashi K, Konishi I, et al. Dermoid cysts of
the ovary with malignant transformation: MR appear-
ance. AJR 1999;172:445–9.
[52] Heaps JM, Nieberg RK, Berek JS.Malignant neoplasms
arising in endometriosis. Obstetr Gynecol 1990;75:
1023–8.
[53] Ogawa S, Kaku T, Amada S, et al. Ovarian endome-
triosis associated with ovarian carcinoma: a clin-
icopathological and immunohistochemical study.
Gynecologic Oncology 2000;77:298–304.
[54] Brinton LA, Gridley G, Persson I, et al. Cancer risk
after a hospital discharge diagnosis of endometriosis.
Am J Obstet Gynecol 1997;176:572–9.
[55] Chopra S, Laurie LR, Chintapalli KN, et al. Primary
papillary serous carcinoma of the peritoneum: CT-
pathologic correlation. J Comput Assist Tomogr 2000;
24:395–9.
[56] Piura B, Meirovitz M, Bartfeld M, et al. Peritoneal
papillary serous carcinoma: study of 15 cases and com-
parison with stage III– IV ovarian papillary serous car-
cinoma. Journal of Surgical Oncology 1988;68:173–8.
[57] Fromm GL, Gershenson DM, Silva EG. Papillary se-
rous carcinoma of the peritoneum. Obstetr Gynecol
1990;75:89–95.
[58] Weber AM, Hewitt WJ, Gajewski WH, et al. Serous
carcinoma of the peritoneum after oophorectomy. Ob-
stet Gynecol 1992;80:558–60.
[59] Shah IA, Jayram L, Gani OS, et al. Papillary serous
carcinoma of the peritoneum in a man. Cancer 1998;
82:860–6.
[60] Stafford-Johnson DB, Bree RL, Francis IR, et al. CT
appearance of primary papillary serous carcinoma of
the peritoneum. AJR 1998;171:687–9.
[61] Buy JN, Ghossain MA, Moss AA, et al. Cystic terato-
ma of the ovary: CT detection. Radiology 1989;171:
697–701.
[62] Sivanesaratnam V, Dutta R, Jayalakshmi P. Ovarian
fibroma–clinical and histopathological characteristics.
Int J Gynaecol Obstet1990;33:243–7.
[63] Mooney EE, Vaidya KP, Tavassoli FA. Ossifying well-
differentiated Sertoli-Leydig cell tumor of the ovary.
Annals of Diagnostic Pathology 2000;4:34–8.
[64] Moon WJ, Koh BH, Kim SK, et al. Brenner tumor of
the ovary: CT and MR findings. J Comput Assist To-
mogr 2000;24:72–6.
[65] Woodcock AS, Govan AD, Gowing NF, et al. A report
of the histological features in 12 cases of gonadoblas-
toma. Tumori. 1979;65:181–9.
[66] Walensky RP, Venbrux AC, Prescott CA, et al. Pseu-
domyxoma peritonei. AJR 1996;167:471–4.
[67] Zissin R, Gayer G, Fishman A, et al. Synchronous
mucinous tumors of the ovary and the appendix asso-
ciated with pseudomyxoma peritonei: CT findings.
Abdom Imaging 2000;25:311–6.
[68] Young RH, Hart WR. Metastases from carcinomas of
the pancreas simulating primary mucinous tumors of
the ovary. A report of seven cases. Am J Surg Path
1989;13:748–56.
[69] Ronnett BM, Zahn CM, Kurman RJ, et al. Dissemi-
nated peritoneal adenomucinosis and peritoneal muci-
nous carcinomatosis. A clinicopathologic analysis of
109 cases with emphasis on distinguishing pathologic
features, site of origin, prognosis, and relationship to
‘‘pseudomyxoma peritonei’’. Am J Surg Path 1995;19:
1390–408.
[70] Ha HK, Jung JI, Lee MS, et al. CT differentiation of
tuberculous peritonitis and peritoneal carcinomatosis.
AJR 1996;167:743–8.
[71] Fujiyoshi F, Ichinari N, Kajiya Y, et al. Retractile mes-
enteritis: small-bowel radiography, CT, and MR imag-
ing. AJR 1997;169:791–3.
[72] Papadatos D, Taourel P, Bret PM. CT of leiomyoma-
tosis peritonealis disseminata mimicking peritoneal
carcinomatosis. AJR 1996;167:475–6.
[73] Scott Jr. WW, Fishman EK. Extramedullary hemato-
poiesis mimicking the appearance of carcinomatosis
or peritoneal mesothelioma: computed tomography
demonstration. Gastrointestinal Radiology 1990;
15:82–3.
[74] Stuart GCE, Smith JP. Ruptured benign cystic terato-
mas mimicking gynecologic malignancy. Gynecol On-
col 1983;16:139–43.
[75] Rosen A, Auh YH, Rubenstein WA, et al. CT appear-
ance of diaphragmatic pseudotumors. J Comput Assist
Tomogr 1983;7:995–9.
[76] Munoz KA, Harlan LC, Trimble EL. Patterns of care
for women with ovarian cancer in the United States.
J Clin Oncol 1997;15:3408–15.
[77] McGowan L, Lesher LP, Norris HJ, et al. Misstaging of
ovarian cancer. Obstetr Gynecol 1985;65:568–72.
[78] Schwartz PE, Rutherford TJ, et al. Neoadjuvant che-
motherapy for advanced ovarian cancer: long-term sur-
vival. Gynecol Oncol 1999;72:93–9.
[79] Vergote I, De Wever I, Tjalma W, et al. Neoadjuvant
chemotherapy or primary debulking surgery in ad-
vanced ovarian carcinoma: a retrospective analysis of
285 patients. Gynecol Oncol 1998;71:431–6.
[80] Meyer JI, Kennedy AW, Friedman R, et al. Ovarian
F.V. Coakley / Radiol Clin N Am 40 (2002) 609–636 635

carcinoma: value of CT in predicting success of de-
bulking surgery. AJR 1995;165:875–8.
[81] Nelson BE, Rosenfield AT, Schwartz PE. Preoperative
abdominopelvic computed tomographic prediction of
optimal cytoreduction in epithelial ovarian carcinoma.
J Clin Oncol 1993;11:166–72.
[82] Curtin JP, Malik R, Venkatraman ES, et al. Stage IV
ovarian cancer: impact of surgical debulking. Gynecol
Oncol 1997;64:9–12.
[83] Heintz APM, Hacker NF, Berek JS, et al. Cytoreduc-
tive surgery in ovarian carcinoma: feasibility and mor-
bidity. Obstetr Gynecol 1986;67:783–8.
F.V. Coakley / Radiol Clin N Am 40 (2002) 609–636636
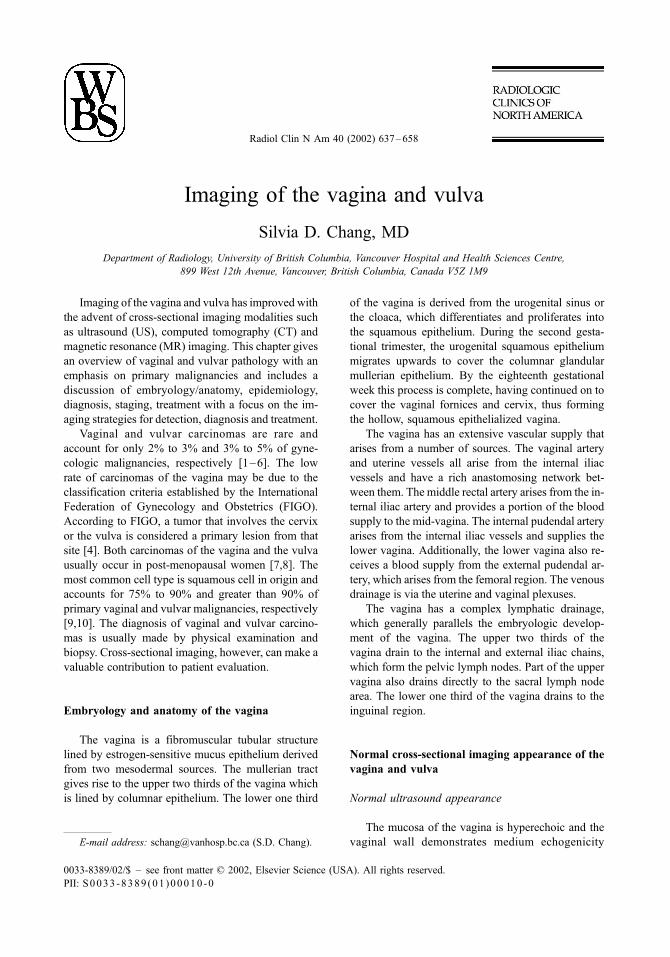
Imaging of the vagina and vulva
Silvia D. Chang, MD
Department of Radiology, University of British Columbia, Vancouver Hospital and Health Sciences Centre,
899 West 12th Avenue, Vancouver, British Columbia, Canada V5Z 1M9
Imaging of the vagina and vulva has improved with
the advent of cross-sectional imaging modalities such
as ultrasound (US), computed tomography (CT) and
magnetic resonance (MR) imaging. This chapter gives
an overview of vaginal and vulvar pathology with an
emphasis on primary malignancies and includes a
discussion of embryology/anatomy, epidemiology,
diagnosis, staging, treatment with a focus on the im-
aging strategies for detection, diagnosis and treatment.
Vaginal and vulvar carcinomas are rare and
account for only 2% to 3% and 3% to 5% of gyne-
cologic malignancies, respectively [1–6]. The low
rate of carcinomas of the vagina may be due to the
classification criteria established by the International
Federation of Gynecology and Obstetrics (FIGO).
According to FIGO, a tumor that involves the cervix
or the vulva is considered a primary lesion from that
site [4]. Both carcinomas of the vagina and the vulva
usually occur in post-menopausal women [7,8]. The
most common cell type is squamous cell in origin and
accounts for 75% to 90% and greater than 90% of
primary vaginal and vulvar malignancies, respectively
[9,10]. The diagnosis of vaginal and vulvar carcino-
mas is usually made by physical examination and
biopsy. Cross-sectional imaging, however, can make a
valuable contribution to patient evaluation.
Embryology and anatomy of the vagina
The vagina is a fibromuscular tubular structure
lined by estrogen-sensitive mucus epithelium derived
from two mesodermal sources. The mullerian tract
gives rise to the upper two thirds of the vagina which
is lined by columnar epithelium. The lower one third
of the vagina is derived from the urogenital sinus or
the cloaca, which differentiates and proliferates into
the squamous epithelium. During the second gesta-
tional trimester, the urogenital squamous epithelium
migrates upwards to cover the columnar glandular
mullerian epithelium. By the eighteenth gestational
week this process is complete, having continued on to
cover the vaginal fornices and cervix, thus forming
the hollow, squamous epithelialized vagina.
The vagina has an extensive vascular supply that
arises from a number of sources. The vaginal artery
and uterine vessels all arise from the internal iliac
vessels and have a rich anastomosing network bet-
ween them. The middle rectal artery arises from the in-
ternal iliac artery and provides a portion of the blood
supply to the mid-vagina. The internal pudendal artery
arises from the internal iliac vessels and supplies the
lower vagina. Additionally, the lower vagina also re-
ceives a blood supply from the external pudendal ar-
tery, which arises from the femoral region. The venous
drainage is via the uterine and vaginal plexuses.
The vagina has a complex lymphatic drainage,
which generally parallels the embryologic develop-
ment of the vagina. The upper two thirds of the
vagina drain to the internal and external iliac chains,
which form the pelvic lymph nodes. Part of the upper
vagina also drains directly to the sacral lymph node
area. The lower one third of the vagina drains to the
inguinal region.
Normal cross-sectional imaging appearance of the
vagina and vulva
Normal ultrasound appearance
The mucosa of the vagina is hyperechoic and the
vaginal wall demonstrates medium echogenicity
0033-8389/02/$ – see front matter D 2002, Elsevier Science (USA). All rights reserved.
PII: S0033 -8389 (01 )00010 -0
E-mail address: [email protected] (S.D. Chang).
Radiol Clin N Am 40 (2002) 637–658

(Fig. 1). The vulva is seen as medium echogenicity
on ultrasound.
Normal CT appearance
The vagina is seen as a rectangular soft tissue
structure inferior to the cervix (Fig. 2). The vulva is
seen as a triangular soft tissue structure (Fig. 3).
Normal MR appearance
Current convention divides the vagina into thirds
for descriptive purposes. The upper third of the vagina
includes the vaginal fornices (Fig. 4). The middle third
of the vagina is at the level of the bladder base.
The lower third of the vagina is adjacent to the urethra.
On T1-weighted scans, the vagina displays medium
signal intensity, similar to the urethra anteriorly and
the rectum posteriorly. On T2-weighted images, the
vaginal muscosa appears as a central stripe of high
signal intensity surrounded by the intermediate signal
intensity of the vaginal wall (Fig. 4). The appearance
of the vagina varies depending on hormonal influen-
ces. The high signal intensity stripe may be thin or
absent in premenarchal girls and in postmenopausal
women not on hormone replacement therapy. Admin-
istration of intravenous gadolinium causes the vaginal
mucosa to enhance (Fig. 4). On both T1 and T2
weighted sequences the vulva demonstrates low to
intermediate signal intensity (Fig. 5).
Benign disorders of the vagina
Congenital anomalies such as vaginal atresia
(Fig. 6), vaginal duplication, abnormalities of gona-
dal differentiation and ambiguous genitalia can be
evaluated with magnetic resonance (MR). MR can
also assess associated abnormalities of the uterus,
cervix and ovaries. Gartner’s duct cysts are derived
from mesonephric and tubule remnants. These are
best seen on MR (Fig. 7) as low signal lesions on T1
and high signal lesions on T2-weighted sequences.
Neurofibroma, hemangioma (Fig. 8), fibroepithe-
lial polyp, leiomyoma, rhabdomyoma, and mullerian
mixed tumor are examples of the variety of benign
tumors that involve the vagina. Benign tumors of the
vagina typically present as mobile rounded submu-
cosal or polypoid masses. Simple excision is both
diagnostic and therapeutic in these cases.
Carcinoma of the vagina
Epidemiology and pathology
Carcinoma of the vagina mainly occurs in post-
menopausal females; usually in patients in their
sixties and seventies. Vaginal intraepithelial neo-
plasia (VAIN) often occurs with cervical intraepi-
thelial neoplasia (CIN) and is believed to have a
Fig. 1. Normal ultrasound of the vagina in the sagittal plane. The vaginal mucosa is demonstrated as a thin echogenic line (*) and
the adjacent wall is of medium echogenicity (arrows). u = uterus, c = cervix.
S.D. Chang / Radiol Clin N Am 40 (2002) 637–658638

similar etiology secondary to human papillomavirus
(HPV) [11]. Unlike the cervix, the vagina does not
have a transformation zone of immature cells sus-
ceptible to HPV infection, thus most vaginal HPV
lesions arise from healing areas of squamous meta-
plasia due to mucosal trauma such as tampon use or
coitus. Vaginal carcinoma is often found in associ-
ation with VAIN (dysplasia/carcinoma in situ).
VAIN is found in younger women and has been
presumed to precede invasive vaginal carcinoma
much like CIN precedes cervical carcinoma [12].
Unlike the strong association between CIN and
cervical carcinoma, however, no such association
between VAIN and invasive vaginal carcinoma has
been established to date.
Eighty to ninety percent of primary vaginal malig-
nancies are squamous cell carcinomas and approx-
imately 5% to 10% are adenocarcinomas. Risk factors
for primary invasive carcinoma of the vagina include:
advancing age, human papillomavirus (HPV) and
prior carcinoma involving the cervix or vulva. One
study showed an association between chronic irritant
vaginitis secondary to the use of pessaries with
vaginal cancers arising in the posterior fornix or
posterior wall [13]. Others argue that advancing age
requires the use of pessaries and may be the causative
Fig. 2. Normal intravenous contrast-enhanced CT of the vagina. (A) Axial image of the upper vagina (arrows) and (B) axial
image of the lower vagina (v). b = bladder, r = rectum, u = uterus.
S.D. Chang / Radiol Clin N Am 40 (2002) 637–658 639

factor rather than the pessaries themselves [5,14].
Prior pelvic radiation has been linked with vaginal
cancers and proposed by some to be a predisposing
factor [2,8]; however, many of these patients received
radiation for carcinoma of the cervix or vulva and
a field effect may explain the development of
the vaginal carcinoma rather than exposure to radi-
ation therapy.
Clear cell adenocarcinoma of the vagina is a
subtype of adenocarcinoma associated with maternal
ingestion of diethylstilbestrol (DES) during preg-
nancy. Clear cell adenocarcinoma in women exposed
to DES is rare with only approximately 1 in every
1000 women exposed to DES in utero developing
clear cell carcinoma [15]; however, approximately
45% of DES-exposed women have areas of vaginal
adenosis and 25% have structural abnormalities of
the uterus, cervix, or vagina. These abnormalities are
both dose and time related with respect to DES
exposure. Typically, patients with clear cell carci-
noma of the vagina present at an early age with a
peak occurrence between the ages of 15 and 22 years
[16]. Women who have been exposed to DES require
careful observation. Treatment of clear cell carci-
noma of the vagina is similar to other cancers of the
vagina. Other rare primary vaginal carcinomas
include vaginal melanomas and vaginal sarcomas,
predominantly leiomyosarcomas [17–21]. In the
pediatric population, embryonal rhabdomyosarcoma
(sarcoma botryoides) is a malignant sarcoma present-
ing in children under the age of 6 [22]. In general,
metastases to the vagina are more common than
primary vaginal malignancies. Metastases usually
occur from direct tumor extension from the endome-
trium or cervix, but may also spread from the rectum
or bladder.
The most common symptom in patients with
vaginal carcinoma is abnormal bleeding. This affects
60% to 70% of patients with vaginal carcinoma and
typically is postmenopausal bleeding in an elderly
patient. Another third of patients with vaginal carci-
noma have vaginal discharge, which causes them to
seek medical care. Aside from these two common
symptoms, patients with vaginal carcinoma tend to be
asymptomatic. In advanced disease, symptoms such
as vaginal pain or hemorrhage may occur. The
diagnosis of vaginal carcinoma is made clinically
with biopsy.
Pattern of spread
Approximately half of all primary vaginal can-
cers originate in the upper third of the vagina,
typically presenting as nodular, exophytic or ulcer-
ated masses [23–25]. Vaginal cancer can spread by
direct extension into adjacent structures such as the
bladder, urethra, and rectum. Vaginal tumors also
spread via both the lymphatic and hematogenous
systems. Lymphatic spread is determined by the site
of the primary vaginal lesion. Generally, tumors
originating in the vaginal vault spread to the obtu-
rator and internal iliac nodes. Tumors arising from
the posterior wall tend to spread to the superior and
inferior gluteal nodes. Tumors arising from the
lower one-third of the vagina will usually spread
to the pelvic and/or inguinofemoral lymph nodes.
The most common location of hematogenous spread
of vaginal cancer is to the lungs. Less common
Fig. 3. Normal intravenous contrast-enhanced CT of the vulva. The vulva (arrows) is situated anterior to the anus (a).
S.D. Chang / Radiol Clin N Am 40 (2002) 637–658640
sites of hematogenous spread include the liver and
bone [23].
Staging
Clinical staging of vaginal cancer is based on the
guidelines defined by the International Federation of
Gynecology and Obstetrics (FIGO). According to the
FIGO system both vaginal and cervical cancers are
staged in the same manner [4]. Staging of vaginal
cancer according to FIGO includes clinical examina-
tion, CXR, complete blood count and biochemical
profile. Often included in the FIGO staging of
vaginal cancer are cystoscopy, sigmoidoscopy, bar-
ium enema and IVP. Additionally, most staging of
vaginal cancer includes a CT to assess for lympha-
denopathy, which is not part of the FIGO system. It is
however, part of the TNM classification system
(Table 1) [26]. The incidence of lymph node meta-
stases is poorly documented with one report claiming
16% of patients with vaginal cancer presented with
nodal involvement [8] and another report stating as
many as 40% of patients with vaginal cancer have
nodal involvement [27]. Overall, FIGO stage II
disease is the most common stage of presentation,
accounting for approximately 40% of all vaginal
cancers [8,27–29].
Prognosis
Tumor stage is the most important predictive
factor with respect to survival [2,8,10,14]. The
overall survival rate for patients with vaginal cancer
is approximately 45%. This is based largely on
squamous cell disease that accounts for the major-
ity of patients with vaginal cancer. As with most
cancers, survival is directly related to stage. Tumor
size is also an important predictor of outcome.
Studies have shown a poor prognosis if tumor size
is greater than 5 cm [23] and a better survival rate
for patients with tumors less than 4 cm in diameter
[24]. The consensus at this time is that tumor
location, tumor grade, cell type and age of the
patient do not influence outcome [10]. Some
reports, however, have shown increased rates of
local recurrence in patients with posterior wall
tumors [23] and better survival rates in patients
with tumors of the upper third of the vagina [30].
Many studies have shown a correlation between
histological grade of a tumor and its recurrence,
[24,31] but an equal number of studies have found
no such correlation [2,8,10]. Similarly, some inves-
tigators have reported poorer survival rates with
adenocarcinoma, [23] while others have shown no
difference between the outcome in patients with ade-
nocarcinomas and squamous carcinomas [10,24,29].
Both melanoma of the vagina and the much less
common sarcomas of the vagina have decreased
survival rates compared with squamous cell carci-
nomas of the vagina. Few cases of small cell carci-
noma of the vagina have been reported and all have
been fatal.
Imaging evaluation of vaginal carcinomas
Conventional radiography
As previously mentioned, the FIGO staging
system for vaginal carcinoma is similar to that of
cervical carcinoma and incorporates the use of
chest radiograph, barium enema and intravenous
pyelography [4]. The chest radiograph is a standard
in the work up of gynecological malignancies
because it can detect pulmonary metastases and
other comorbid pulmonary disease common in the
elderly population. The double contrast barium
enema had traditionally been used to assess meta-
static rectal or colonic involvement in patients with
vaginal cancer. Barium enema findings in these
patients may include: fixation and tethering of the
bowel wall, irregular serrations, mucosal ulceration
and fistula formation [32]; however, these studies
tended to give a low positive yield. Today, the
barium enema has been largely replaced by
sigmoidoscopy and colonoscopy, which allow for
direct visualization and biopsy. The intravenous
pyelogram (IVP) is used to identify tumor spread
causing obstruction. IVP findings may include
delayed or persistent nephrogram, hydronephrosis,
hydroureter, or extrinsic compression of the ureter
by tumor. The use of IVPs in the work up of
vaginal cancers has declined over the years due to
a combination of low positive yield, increased use
of cross-sectional imaging, and direct visualization
with cystoscopy.
Lymphangiography
Lymphangiography, was the modality of choice
for assessment of nodal disease in the past. How-
ever, this is an invasive technique and the number of
centers where lymphangiography is routinely per-
formed is declining. Lymphangiography has largely
been replaced by cross-sectional imaging, which is
less invasive and provides comparable accuracy for
identification of nodal involvement as well as addi-
tional information about extra-nodal structures.
S.D. Chang / Radiol Clin N Am 40 (2002) 637–658 641

Cross-sectional imaging
The advantages of CT and MRI have led to an
increase in their use in the evaluation of patients
with gynecological cancer. Although US is used
extensively in the assessment of ovarian and endo-
metrial abnormalities, it is limited in the assessment
of the cervix, vagina and vulva. Both US and CT are
limited in assessment of early localized disease due
to inferior soft tissue contrast when compared to
MRI. CT is most useful in the evaluation of more
advanced disease and in the detection and biopsy of
suspected lymph node metastases. MRI offers excel-
lent soft tissue contrast and allows assessment of the
extent of tumor as well as staging. For tumors
involving areas that are difficult to examine clini-
cally, such as the upper third of the vagina, MRI
may be helpful in determining whether the site of
origin is vaginal or cervical.
Magnetic resonance imaging
T1- and T2-weighted sequences both play a role
in the evaluation of the female pelvis. T1-weighted
images provide excellent contrast between fat and
soft tissue. T1-weighted images are used to char-
acterize soft tissues and lymphadenopathy. T2-
weighted sequences are essential in characterizing
pathological conditions as they differentiate the
layers of the vaginal wall the best. Thin (5 mm)
Fig. 4. Normal MR anatomy of the vagina. (A) On axial T1-weighted sequence the vagina (v) demonstrates intermediate signal
intensity similar to adjacent urethra (u) and rectum (r). On (B) axial and (C) sagittal T2-weighted images, the mucosa of the
vagina is demonstrated as a high signal intensity stripe (arrow). The anterior (curved arrow) and posterior (large white arrow)
vaginal fornices are best visualized in the sagittal plane. (D). On axial T1-weighted images with gadolinium, the mucosa of
the vagina (arrows) enhances greater than the surrounding muscular wall. u = urethra, r = rectum, b = bladder, ut = uterus. Figure
(C) modified from Chang SD, Hricak H [48].
S.D. Chang / Radiol Clin N Am 40 (2002) 637–658642

sections are preferable. The optimal plane of imag-
ing is transaxial [33]. MRI cannot differentiate
primary tumors from metastatic lesions. Inflamma-
tory disease cannot be distinguished from tumors
by MRI. In spite of these limitations, MRI remains
the best imaging modality available for the assess-
ment of vaginal cancer. MRI is used to differentiate
tumor from fibrotic or granulomatous tissue, in
Fig. 4 (continued ).
S.D. Chang / Radiol Clin N Am 40 (2002) 637–658 643
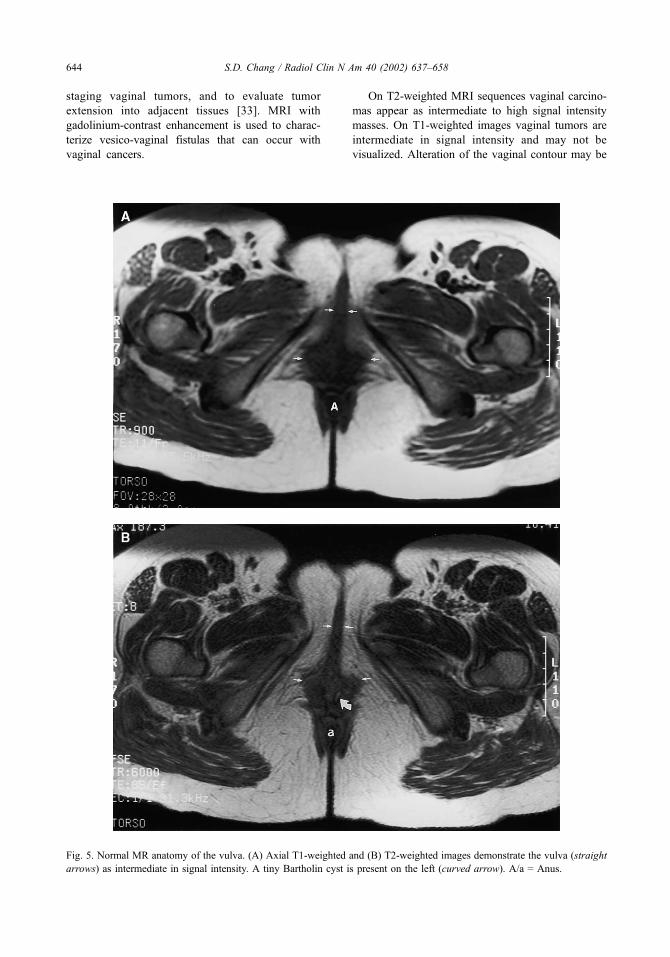
staging vaginal tumors, and to evaluate tumor
extension into adjacent tissues [33]. MRI with
gadolinium-contrast enhancement is used to charac-
terize vesico-vaginal fistulas that can occur with
vaginal cancers.
On T2-weighted MRI sequences vaginal carcino-
mas appear as intermediate to high signal intensity
masses. On T1-weighted images vaginal tumors are
intermediate in signal intensity and may not be
visualized. Alteration of the vaginal contour may be
Fig. 5. Normal MR anatomy of the vulva. (A) Axial T1-weighted and (B) T2-weighted images demonstrate the vulva (straight
arrows) as intermediate in signal intensity. A tiny Bartholin cyst is present on the left (curved arrow). A/a = Anus.
S.D. Chang / Radiol Clin N Am 40 (2002) 637–658644
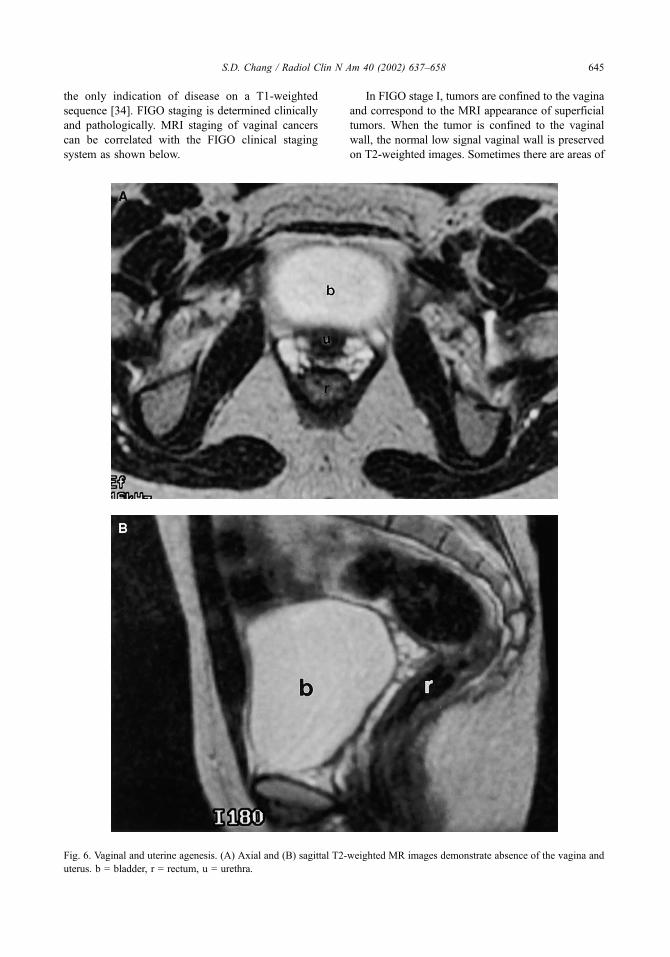
the only indication of disease on a T1-weighted
sequence [34]. FIGO staging is determined clinically
and pathologically. MRI staging of vaginal cancers
can be correlated with the FIGO clinical staging
system as shown below.
In FIGO stage I, tumors are confined to the vagina
and correspond to the MRI appearance of superficial
tumors. When the tumor is confined to the vaginal
wall, the normal low signal vaginal wall is preserved
on T2-weighted images. Sometimes there are areas of
Fig. 6. Vaginal and uterine agenesis. (A) Axial and (B) sagittal T2-weighted MR images demonstrate absence of the vagina and
uterus. b = bladder, r = rectum, u = urethra.
S.D. Chang / Radiol Clin N Am 40 (2002) 637–658 645
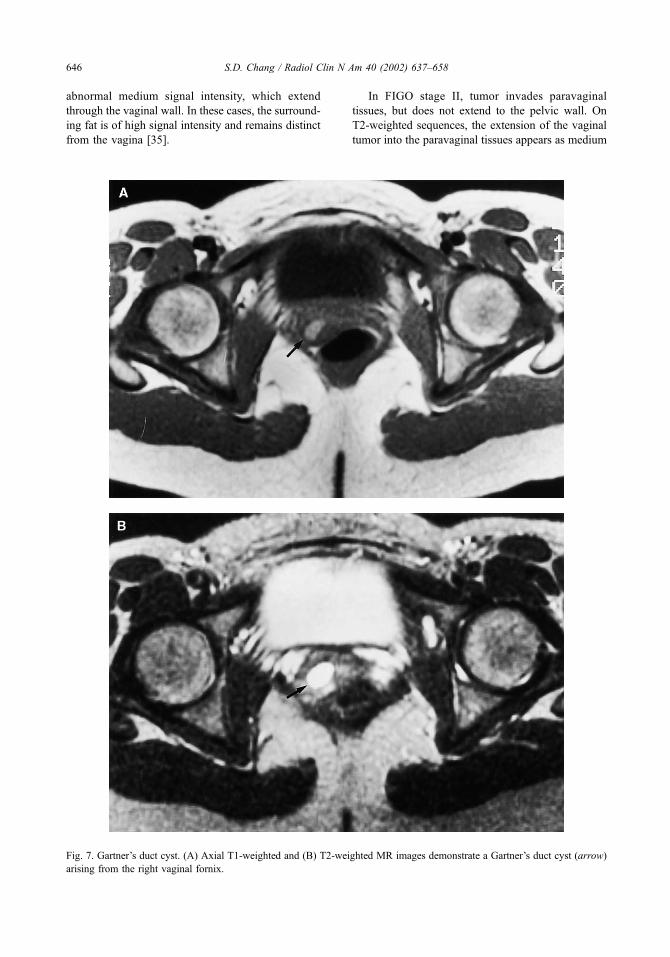
abnormal medium signal intensity, which extend
through the vaginal wall. In these cases, the surround-
ing fat is of high signal intensity and remains distinct
from the vagina [35].
In FIGO stage II, tumor invades paravaginal
tissues, but does not extend to the pelvic wall. On
T2-weighted sequences, the extension of the vaginal
tumor into the paravaginal tissues appears as medium
Fig. 7. Gartner’s duct cyst. (A) Axial T1-weighted and (B) T2-weighted MR images demonstrate a Gartner’s duct cyst (arrow)
arising from the right vaginal fornix.
S.D. Chang / Radiol Clin N Am 40 (2002) 637–658646

to high signal intensity. The interface between fat and
tumor is indistinct and represents paravaginal soft
tissue involvement [35]. (Fig. 9)
In FIGO stage III, the tumor extends to the
pelvic wall. This appears as increased signal in
the pelvic floor muscles (levator ani, obturator
internus, or piriformis muscle) on T2-weighted
images [34].
In FIGO stage IVa, tumor invades the mucosa of
the bladder or rectum and/or extends beyond the true
Fig. 8. Hemangioma involving the vagina. (A) Axial T2-weighted and (B) with fat saturation MR images demonstrate the
hemangioma as high signal intensity involving the posterior wall of the vagina (straight arrows). The mons pubis (curved
arrows) is also involved. u = urethra.
S.D. Chang / Radiol Clin N Am 40 (2002) 637–658 647
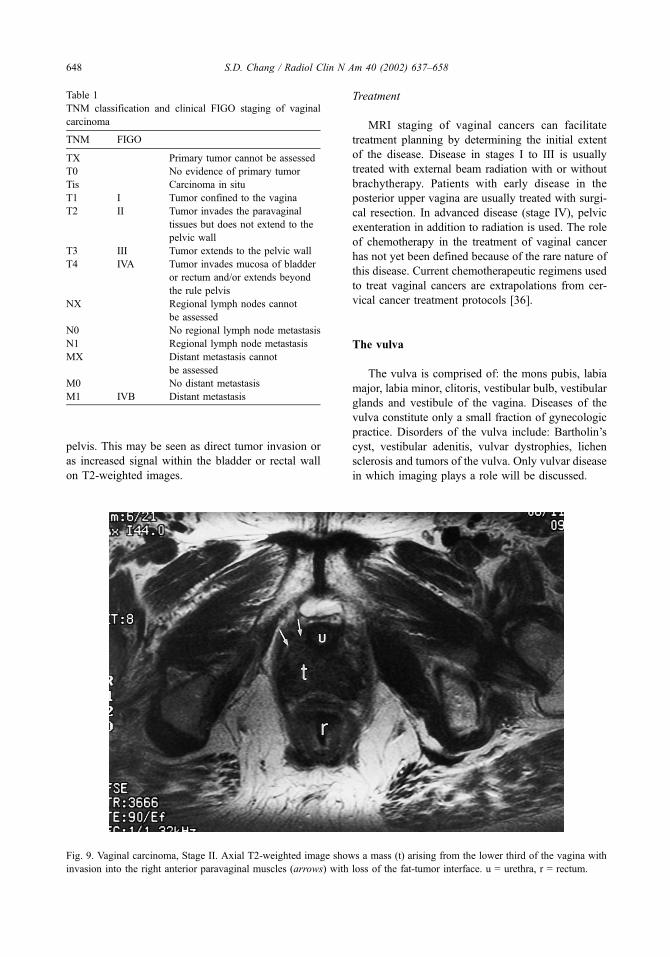
pelvis. This may be seen as direct tumor invasion or
as increased signal within the bladder or rectal wall
on T2-weighted images.
Treatment
MRI staging of vaginal cancers can facilitate
treatment planning by determining the initial extent
of the disease. Disease in stages I to III is usually
treated with external beam radiation with or without
brachytherapy. Patients with early disease in the
posterior upper vagina are usually treated with surgi-
cal resection. In advanced disease (stage IV), pelvic
exenteration in addition to radiation is used. The role
of chemotherapy in the treatment of vaginal cancer
has not yet been defined because of the rare nature of
this disease. Current chemotherapeutic regimens used
to treat vaginal cancers are extrapolations from cer-
vical cancer treatment protocols [36].
The vulva
The vulva is comprised of: the mons pubis, labia
major, labia minor, clitoris, vestibular bulb, vestibular
glands and vestibule of the vagina. Diseases of the
vulva constitute only a small fraction of gynecologic
practice. Disorders of the vulva include: Bartholin’s
cyst, vestibular adenitis, vulvar dystrophies, lichen
sclerosis and tumors of the vulva. Only vulvar disease
in which imaging plays a role will be discussed.
Fig. 9. Vaginal carcinoma, Stage II. Axial T2-weighted image shows a mass (t) arising from the lower third of the vagina with
invasion into the right anterior paravaginal muscles (arrows) with loss of the fat-tumor interface. u = urethra, r = rectum.
Table 1
TNM classification and clinical FIGO staging of vaginal
carcinoma
TNM FIGO
TX Primary tumor cannot be assessed
T0 No evidence of primary tumor
Tis Carcinoma in situ
T1 I Tumor confined to the vagina
T2 II Tumor invades the paravaginal
tissues but does not extend to the
pelvic wall
T3 III Tumor extends to the pelvic wall
T4 IVA Tumor invades mucosa of bladder
or rectum and/or extends beyond
the rule pelvis
NX Regional lymph nodes cannot
be assessed
N0 No regional lymph node metastasis
N1 Regional lymph node metastasis
MX Distant metastasis cannot
be assessed
M0 No distant metastasis
M1 IVB Distant metastasis
S.D. Chang / Radiol Clin N Am 40 (2002) 637–658648
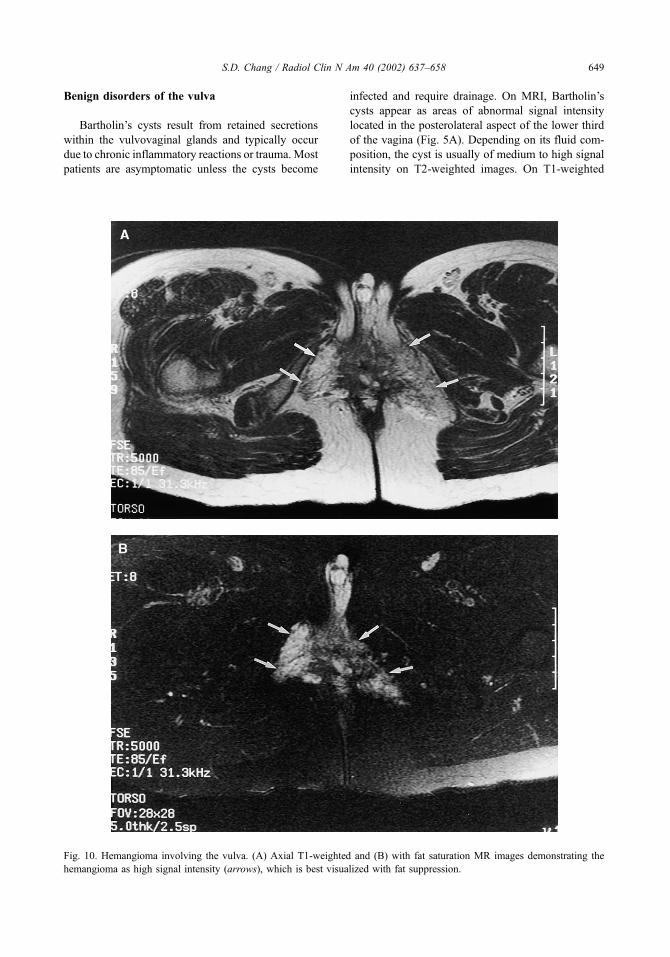
Benign disorders of the vulva
Bartholin’s cysts result from retained secretions
within the vulvovaginal glands and typically occur
due to chronic inflammatory reactions or trauma. Most
patients are asymptomatic unless the cysts become
infected and require drainage. On MRI, Bartholin’s
cysts appear as areas of abnormal signal intensity
located in the posterolateral aspect of the lower third
of the vagina (Fig. 5A). Depending on its fluid com-
position, the cyst is usually of medium to high signal
intensity on T2-weighted images. On T1-weighted
Fig. 10. Hemangioma involving the vulva. (A) Axial T1-weighted and (B) with fat saturation MR images demonstrating the
hemangioma as high signal intensity (arrows), which is best visualized with fat suppression.
S.D. Chang / Radiol Clin N Am 40 (2002) 637–658 649
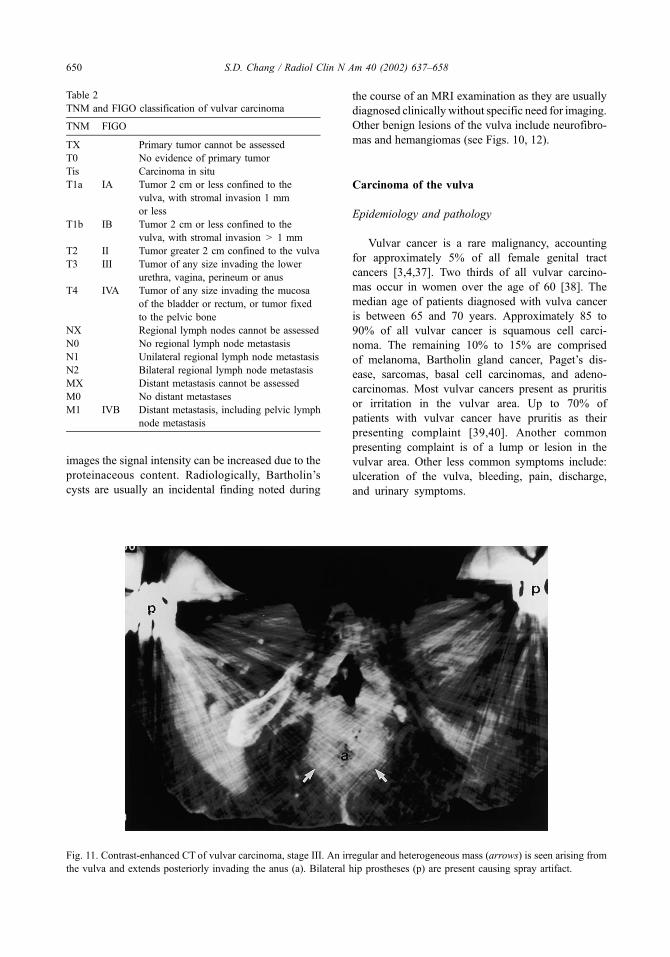
images the signal intensity can be increased due to the
proteinaceous content. Radiologically, Bartholin’s
cysts are usually an incidental finding noted during
the course of an MRI examination as they are usually
diagnosed clinically without specific need for imaging.
Other benign lesions of the vulva include neurofibro-
mas and hemangiomas (see Figs. 10, 12).
Carcinoma of the vulva
Epidemiology and pathology
Vulvar cancer is a rare malignancy, accounting
for approximately 5% of all female genital tract
cancers [3,4,37]. Two thirds of all vulvar carcino-
mas occur in women over the age of 60 [38]. The
median age of patients diagnosed with vulva cancer
is between 65 and 70 years. Approximately 85 to
90% of all vulvar cancer is squamous cell carci-
noma. The remaining 10% to 15% are comprised
of melanoma, Bartholin gland cancer, Paget’s dis-
ease, sarcomas, basal cell carcinomas, and adeno-
carcinomas. Most vulvar cancers present as pruritis
or irritation in the vulvar area. Up to 70% of
patients with vulvar cancer have pruritis as their
presenting complaint [39,40]. Another common
presenting complaint is of a lump or lesion in the
vulvar area. Other less common symptoms include:
ulceration of the vulva, bleeding, pain, discharge,
and urinary symptoms.
Fig. 11. Contrast-enhanced CT of vulvar carcinoma, stage III. An irregular and heterogeneous mass (arrows) is seen arising from
the vulva and extends posteriorly invading the anus (a). Bilateral hip prostheses (p) are present causing spray artifact.
Table 2
TNM and FIGO classification of vulvar carcinoma
TNM FIGO
TX Primary tumor cannot be assessed
T0 No evidence of primary tumor
Tis Carcinoma in situ
T1a IA Tumor 2 cm or less confined to the
vulva, with stromal invasion 1 mm
or less
T1b IB Tumor 2 cm or less confined to the
vulva, with stromal invasion > 1 mm
T2 II Tumor greater 2 cm confined to the vulva
T3 III Tumor of any size invading the lower
urethra, vagina, perineum or anus
T4 IVA Tumor of any size invading the mucosa
of the bladder or rectum, or tumor fixed
to the pelvic bone
NX Regional lymph nodes cannot be assessed
N0 No regional lymph node metastasis
N1 Unilateral regional lymph node metastasis
N2 Bilateral regional lymph node metastasis
MX Distant metastasis cannot be assessed
M0 No distant metastases
M1 IVB Distant metastasis, including pelvic lymph
node metastasis
S.D. Chang / Radiol Clin N Am 40 (2002) 637–658650

Vulvar tumors are usually separated into two
categories based on their association with human
papillomavirus (HPV). HPV-negative tumors usually
occur in women over the age of 60 and are
associated with vulvar inflammation or lichen scle-
rosis. Typically, these lesions are unifocal and are
usually well differentiated with exuberant keratin
formation [41–43]. HPV-positive tumors occur in
Fig. 12. Vulvar (Bartholin cyst) carcinoma, stage I. (A) Axial T1-weighted and (B) axial T2-weighted MR images show a small
< 2 cm mass (arrow) arising from the Bartholin gland.
S.D. Chang / Radiol Clin N Am 40 (2002) 637–658 651

women under the age of 60 and are associated with
vulvar intraepithelia neoplasia (VIN). These tumors
tend to be multifocal and occur more frequently in
women who smoke.
Fig. 13. Vulvar carcinoma, stage II. (A) Axial T2-weighted with fat saturation and (B) sagittal T2-weighted images of one patient
and (C) axial T1-weighted image in a different patient show a mass >2 cm arising from the vulva. a = anus, b = bladder, v =
vagina, r = rectum.
S.D. Chang / Radiol Clin N Am 40 (2002) 637–658652

Carcinoma in situ, VIN, or Bowen’s disease tend
to occur in younger women and is considered a
precancerous change. The median age at time of
diagnosis is between the ages of 45 and 50 years.
Between 80% to 90% of all VINs contain HPV. These
lesions may be associated with similar lesions of the
cervix and vagina. Typically these lesions form less
keratin than HPV-negative tumors.
Pattern of spread
Approximately 70% of vulvar carcinomas involve
the labia majora or minora [44]. The labia majora is
more commonly involved. The clitoris and perineum
are each involved by 15% to 20% of vulvar cancers.
Up to 10% of cases have such extensive lesions that
the site of origin cannot be determined. Multifocal
lesions account for about 5% of all cases of vulvar
cancer. Vulvar tumors extend locally to invade adja-
cent structures including the vagina, urethra and anus.
In advanced disease, adjacent pelvic bones may
become involved.
Early in the course of vulvar carcinoma, the
tumor spreads to regional lymph nodes. The lym-
phatic drainage of the vulva is comprised of a rich
anastomatic network with multiple extensions
across midline. Typically, the initial regional meta-
stasis involves the superficial inguinal lymph nodes
and then spreads to the deep femoral lymph nodes
with subsequent involvement of the pelvic lymph
nodes. However, many different patterns of spread
have been reported. Vulvar carcinoma can also
spread via hematogenous metastasis, most com-
monly to the lungs.
Staging
The FIGO staging system uses a TNM staging
system (Table 2). As of 1988 the FIGO staging
system switched from that of clinical assessment to
surgical pathological evaluation of the resected
specimen which includes the primary lesion and
regional lymph nodes. This change was imple-
mented due to studies showing that clinical assess-
ment of lymph nodes was inaccurate [45–47]. In
1994, the staging system subdivided stage I into
superficial versus deep invasion.
Prognosis
The prognosis for cure following treatment is
correlated with various clinical and pathological
features. Tumor diameter is such a strong predictive
factor with respect to outcome that it is part of the
Fig. 13 (continued ).
S.D. Chang / Radiol Clin N Am 40 (2002) 637–658 653
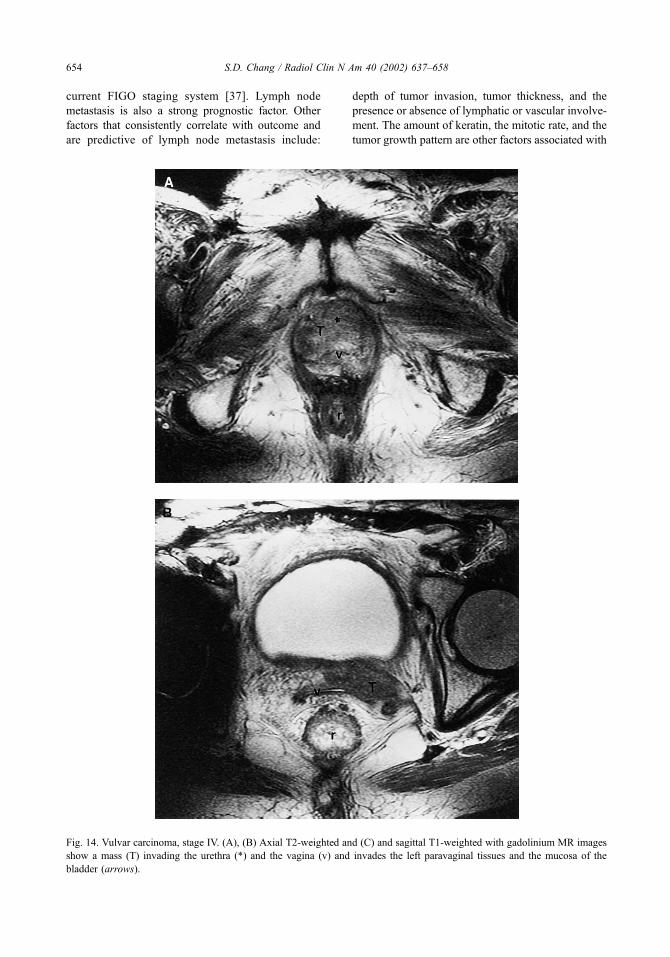
current FIGO staging system [37]. Lymph node
metastasis is also a strong prognostic factor. Other
factors that consistently correlate with outcome and
are predictive of lymph node metastasis include:
depth of tumor invasion, tumor thickness, and the
presence or absence of lymphatic or vascular involve-
ment. The amount of keratin, the mitotic rate, and the
tumor growth pattern are other factors associated with
Fig. 14. Vulvar carcinoma, stage IV. (A), (B) Axial T2-weighted and (C) and sagittal T1-weighted with gadolinium MR images
show a mass (T) invading the urethra (*) and the vagina (v) and invades the left paravaginal tissues and the mucosa of the
bladder (arrows).
S.D. Chang / Radiol Clin N Am 40 (2002) 637–658654
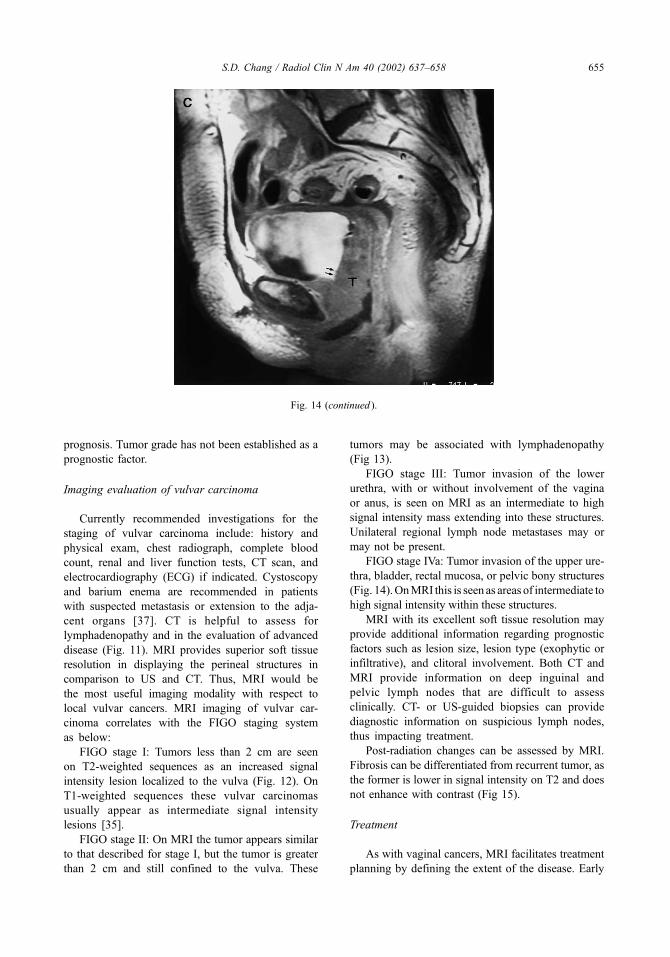
prognosis. Tumor grade has not been established as a
prognostic factor.
Imaging evaluation of vulvar carcinoma
Currently recommended investigations for the
staging of vulvar carcinoma include: history and
physical exam, chest radiograph, complete blood
count, renal and liver function tests, CT scan, and
electrocardiography (ECG) if indicated. Cystoscopy
and barium enema are recommended in patients
with suspected metastasis or extension to the adja-
cent organs [37]. CT is helpful to assess for
lymphadenopathy and in the evaluation of advanced
disease (Fig. 11). MRI provides superior soft tissue
resolution in displaying the perineal structures in
comparison to US and CT. Thus, MRI would be
the most useful imaging modality with respect to
local vulvar cancers. MRI imaging of vulvar car-
cinoma correlates with the FIGO staging system
as below:
FIGO stage I: Tumors less than 2 cm are seen
on T2-weighted sequences as an increased signal
intensity lesion localized to the vulva (Fig. 12). On
T1-weighted sequences these vulvar carcinomas
usually appear as intermediate signal intensity
lesions [35].
FIGO stage II: On MRI the tumor appears similar
to that described for stage I, but the tumor is greater
than 2 cm and still confined to the vulva. These
tumors may be associated with lymphadenopathy
(Fig 13).
FIGO stage III: Tumor invasion of the lower
urethra, with or without involvement of the vagina
or anus, is seen on MRI as an intermediate to high
signal intensity mass extending into these structures.
Unilateral regional lymph node metastases may or
may not be present.
FIGO stage IVa: Tumor invasion of the upper ure-
thra, bladder, rectal mucosa, or pelvic bony structures
(Fig. 14).OnMRI this is seen as areas of intermediate to
high signal intensity within these structures.
MRI with its excellent soft tissue resolution may
provide additional information regarding prognostic
factors such as lesion size, lesion type (exophytic or
infiltrative), and clitoral involvement. Both CT and
MRI provide information on deep inguinal and
pelvic lymph nodes that are difficult to assess
clinically. CT- or US-guided biopsies can provide
diagnostic information on suspicious lymph nodes,
thus impacting treatment.
Post-radiation changes can be assessed by MRI.
Fibrosis can be differentiated from recurrent tumor, as
the former is lower in signal intensity on T2 and does
not enhance with contrast (Fig 15).
Treatment
As with vaginal cancers, MRI facilitates treatment
planning by defining the extent of the disease. Early
Fig. 14 (continued ).
S.D. Chang / Radiol Clin N Am 40 (2002) 637–658 655

stage disease (stages I and II) can be treated with
vulvectomy and unilateral lymph node dissection.
More advanced disease, however, may require pelvic
exenteration and bliateral lymph node dissection.
Summary
The imaging evaluation of female lower genital
tract cancers has undergone dramatic changes in the
Fig. 15. Post radiation changes of vulvar carcinoma. (A) Axial T2- and (B) T1-weighted post gadolinium MR images
demonstrate fibrosis as irregular low signal intensity strands (arrows) and do not show any appreciable contrast enhancement. v =
vulva, a = anus.
S.D. Chang / Radiol Clin N Am 40 (2002) 637–658656

last two decades. Technical improvements and
increased availability of cross-sectional modalities
(US, CT, MR) have increased their use to such an
extent that they have largely replaced more conven-
tional imaging techniques. US is of limited value in
the staging of vaginal and vulvar malignancies. CT
is most useful for staging more advanced disease of
the vagina and vulva. It is widely available and
provides quick imaging time. CT is used in the
detection and biopsy of suspected lymph nodes and
metastases. MRI provides the best soft tissue con-
trast and is the most useful imaging modality
available to evaluate carcinomas of the vagina and
vulva. Future advancements in the imaging evalua-
tion of vaginal and vulvar cancers will likely focus
on functional imaging.
References
[1] Daw E. Primary carcinoma of the vagina. J Obstet
Gynaec Br Comm 1971;78:853–6.
[2] Gallup DG, Talledo OE, Shah KJ, et al. Invasive squa-
mous cell carcinoma of the vagina: a 14-year study.
Obstet Gynecol 1987;69:782–5.
[3] Green THJ. Carcinoma of the vulva: a reassessment.
Obstet Gynecol 1978;52:462–9.
[4] Pettersson F, editor. International Federation of Gyne-
cology and Obstetrics. Annual report on the results of
treatment in gynecological cancer. Stockholm (Swe-
den): Radium hemmet; 1994.
[5] Rutledge F. Cancer of the vagina. Am J Obstet Gyne-
col 1967;97:635–55.
[6] Young JL, Percy CL, Asire AJ, editors. Surveillance,
epidemiology and end results: Incidence and mortality
data, 1973077 (NIH Publication No. 81–2330). Be-
thesda, (MD): United States Department of Health
and Human Services; 1981.
[7] Franklin EW, Rutledge FN. Epidemiology of carcino-
ma of the vulva. Obstet Gynecol 1972;39:165–72.
[8] Pride GL, Schultz AE, Chuprevich TW, et al. Primary
invasive squamous carcinoma of the vagina. Obstet
Gynecol 1979;53:218–25.
[9] Choo YC, Anderson DG. Neoplasms of the vagina
following cervical carcinoma. Gynecol Oncol 1982;
23:125–32.
[10] Peters WA, Kumar NB, Morley GW. Carcinoma of the
vagina: factors influencing treatment outcome Cancer
1985;55:892–7.
[11] Hoffman MS, De Cesare LS, Roberts WS, et al. Upper
vaginectomy for in situ and occult, superficially inva-
sive carcinoma of the vagina. Am J Obstet Gynecol
1992;166:30–3.
[12] Crum CP. Female genital tract. In: Cotran RS, Kumar
V, Robbins SL, editors. Robbins Pathologic Basis of
Disease, edition 5. Philadelphia: WB Saunders Com-
pany; 1994. p. 1044.
[13] Schraub S, Sun XS, Maingon P, Horiot JC, Daly N,
Keiling R. Cervical and vaginal cancer associated with
pessary use. Cancer 1992;69:2505–9.
[14] Herbst AL, Green TH, Ulfelder H, Brown BF, Shaffer
DW, Raval HB. Primary carcinoma of the vagina. Am
J Obstet Gynecol 1970;106:210–8.
[15] Melnick S, Cole P, Anderson D, Herbst A. Rates and
risks of diethylstilbestrol-related clear-cell adenocarci-
noma of the vagina and cervix: an update. N Engl J
Med 1987;316:514–6.
[16] Herbst A. Clear cell adenocarcinoma and the current
status of DES-exposed females. Cancer 1981;48:
484–8.
[17] Joseph RE, Enghardt MH, Doering DL, et al. Small
cell neuroendocrine carcinoma of the vagina. Cancer
1992;70:784–9.
[18] Miliauskas JR, Leong AS. Small cell (neuroendocrine)
carcinoma of the vagina. Histopathology 1992;21:
371–4.
[19] Peters WA, Kumar NB, Andersen WA, Morley GW.
Primary sarcoma of the adult vagina: a clinicopatho-
logic study. Obstet Gynecol 1985;65:699–704.
[20] Ragnarsson-Olding B, Johansson H, Rutqvist L, Ring-
borg U. Malignant melanoma of the vulva and vagina.
Cancer 1993;71:1893–7.
[21] Weinstock MA. Malignant melanoma of the vulva and
vagina in the United States: patterns of incidence and
population-based estimates of survival. Am J Obstet
Gynecol 1994;171:1225–30.
[22] Copeland LJ, Gershenson DM, Saul PB, Sneige N,
Stringer CA, Edwards CL. Sarcoma botyroides of the
female genital tract. Obstet Gynecol 1985;66:262–6.
[23] Chyle V, Zagars GK, Wheeler JA, Wharton JT, Delclos
L. Definitive radiotherapy for carcinoma of the vagina:
outcome and prognostic factors. Int J Radiat Oncol
Biol Phys 1996;35(5):891–905.
[24] Kirkbride P, Fyles A, Rawlings GA, Manchul L, Levin
W, Murphy KJ. Carcinoma of the vagina: experience at
the Princess Margaret Hospital (1974–1989). Gynecol
Oncol 1995;56:435–43.
[25] Stock RG, ChenASJ, Seski J, Atkinson EJ, O’Brien PC.
A 30 year experience in the management of primary car-
cinoma of the vagina: analysis of prognostic factors and
treatment modalities. Gynecol Oncol 1995;56:45–52.
[26] International Union Against Cancer. TNM classifica-
tion of malignant tumors. Sobin LH, Wittkind Ch, ed-
itors. New York: Wiley-Liss; 1997. p. 133–40.
[27] Rubin SC. Young J Mikuta JJ, Berek JS. Squamous
carcinoma of the vagina: treatment, complications and
long-term follow-up. Gynecol Oncol 1985;20:346–53.
[28] Al-Kurdi M, Monagnan JM, Ngan HY, Pecorelli S.
Thirty-two years experience in management of primary
tumors of the vagina. Br J Obstet Gynecol 1981;88:
1145–50.
[29] Davis KP, Stanhope CR, Garton GR, Boyes DA. Inva-
sive vaginal carcinoma: analysis of early-stage disease.
Gynecol Oncol 1991;42:131–6.
[30] Kucera H, Vavra N, Lundvall F, Poulsen H, Bock JE.
Radiation management of primary carcinoma of the
S.D. Chang / Radiol Clin N Am 40 (2002) 637–658 657

vagina: clinical and histopathological variables associ-
ated with survival. Gynecol Oncol 1991;40:12–6.
[31] Marcus RB, Million RR, Daly JW, Nicastri AD, Sedlis
A, Remy JC. Carcinoma of the vagina. Cancer 1978;42:
2507–12.
[32] Gedgaudas-McClees RK, Yordan E, Berek JS, Jahshan
A. Gastrointestinal complications of gynecologic dis-
eases. In: Gore RM, Levine MS, Laufer I, editors. Text-
book of gastrointestinal radiology. Philadelphia: W.B.
Saunders; 1993. p. 2559–67.
[33] Hricak H, Chang YCF, Thurnher S, Marshall R, Yor-
dan E, Hacker N. Vagina: evaluation with MR imaging.
Part I. Normal anatomy and congenital anomalies. Ra-
diology 1988;169:169–74.
[34] Chang YCF, Hricak H, Thurnher S, et al. Vagina: eval-
uation with MR imaging. Part II neoplasms. Radiology
1989;171:245–51.
[35] Carrington BM, Hricak H. The uterus and vagina. In:
Hricak H, Carrington BM, editors. MRI of the pel-
vis: a text atlas. London: Appleton & Lange; 1991.
p. 93–184.
[36] Thigpen T, Blessing J, Homesley HD, et al. Phase II
trial of cisplatin in advanced or recurrent cancer of the
vagina: a Gynecologic Oncology Group study. Gyne-
col Oncol 1986;23:101–4.
[37] Benedet JL, Bender H, Jones H, et al. FIGO staging
classifications and clinical practice guidelines in the
management of gynecologic cancers. Int J Gynecol
Obstet 2000;70:209–62.
[38] Zaino RJ. Carcinoma of the vulva, urethra, and Bar-
tholin’s glands. Contemp Issues Surg Pathol 1987;9:
119–153.
[39] Benedet JL, Turko M, Fairey RN, et al. Squamous
carcinoma of the vulva: Results of treatment. Am J
Obstet Gynecol 1979;134:201–7.
[40] Figge DC, Gaudenz R. Invasive carcinoma of the vul-
va. Am J Obstet Gynecol 1974;119:382–95.
[41] Bloss JD, Liao SY, Wilczynski SP, et al. Clinical and
histologic features of vulvar carcinomas analyzed for
human papillomavirus status: evidence that squamous
cell carcinoma of the vulva has more than none etiol-
ogy. Hum Pathol 1991;22:711–8.
[42] Crum CP. Carcinoma of the vulva: epidemiology and
pathogenesis. Obstet Gynecol 1992;79:448–54.
[43] Hording U, Junge J, Daugaard S, et al. Vulvar squa-
mous cell carcinoma and papillomaviruses: indications
for two different etiologies. Gynecol Oncol 1994;52:
241–6.
[44] Shimm DS, Fuller AF, Orlow EL. Prognostic variables
in the treatment of squamous cell carcinoma of the
vulva. Gynecol Oncol 1986;24:343–58.
[45] Boyce J, Fruchter RG, Kasambilides E, et al. Prognos-
tic factors in carcinoma of the vulva. Gynecol Oncol
1985;20:364–77.
[46] Homesley HD, Bundy BN, Sedlis A, et al. Prognostic
factors for groin node metastasis in squamous cell car-
cinoma of the vulva (a Gynecologic Oncology Group
study). Gynecol Oncol 1993;49:279–83.
[47] Sedlis A, Homesley H, Bundy BN, et al. Positive groin
lymph nodes in superficial squamous cell vulvar can-
cer: a Gynecologic Oncology Group study. Am J Ob-
stet Gynecol 1987;156:1159–64.
[48] Chang SD, Hricak H. Diagnostic Imaging. In: Eifel PJ,
Levenback CF, editors. ACS Atlas of clinical Oncol-
ogy: cancer of the female lower genital tract. Hamilton,
Ontario: BC Decker Inc.; 2001. 9 p. 63–87.
S.D. Chang / Radiol Clin N Am 40 (2002) 637–658658

Postsurgical pelvis: treatment follow-up
Kazuro Sugimura, MDa,*, Hiromi Okizuka, MDb
aDepartment of Radiology, Kobe University Graduate School of Medicine, 7-5-2, Kusunoki-cho, Chuo-ku, 6500017 Kobe, JapanbDepartment of Radiology, National Defense Medical College, 3-2, Namiki, Tokorozawa, Japan
Cervical carcinoma
Postsurgical changes
Stage IA carcinoma is usually treated with coni-
zation or total abdominal hysterectomy (TAH). TAH
requires resection of the uterine corpus and cervix
and a small cuff of the upper vagina. The residual
vagina is sutured. During the procedure the uterosac-
ral, uterovesical, round, and broad ligaments are
incised; however, the cardinal ligaments, which are
intimately related to the ureters, are left intact. There
is minimal disturbance of the trigone of the bladder
and the ureters because these structures are not
removed from their beds [1].
Modified radical (extended) abdominal hyster-
ectomy appears to be well suited for patients with 3
to 5 mm of invasion and small lesions that do not
distort the anatomy. This procedure removes the
cervix and the upper vagina (proximal 1–2 cm),
including paracervical tissues. The ureters are dis-
sected in the paracervical tunnel to the point of entry
into the bladder. Because the ureters are unsheathed
and retracted laterally, parametrial and paracervical
tissue can be safety removed medial to the ureter.
This operation may be performed with or without
pelvic lymphadenectomy [1].
Radical abdominal hysterectomy is indicated for
most patients with stage Ib or IIb cancer of the cervix.
This procedure consists of removal of the uterus, the
upper third of the vagina, and the parametrial, para-
cervical, and upper paravaginal tissues. All uterine
ligaments are resected, including the cardinal liga-
ments that are dissected free of the ureters and are
severed at the pelvic sidewall. Lymph node dissection,
with removal of all nodes distal to and including the
common iliac chains, is undertaken at the same time.
Para-aortic lymphadenectomy is performed at the
discretion of the surgeon.
Pelvic exenteration is performed for a few selected
stage IVa lesions and recurrent or persistent carci-
noma of the cervix. Occasionally, pelvic exenteration
is indicated for severe radiation toxicity. In patients
with malignant disease, the most important criterion
for resectability is that the tumor be confined to the
central pelvis without evidence of extension to the
pelvic sidewall or of distant dissemination. Exentera-
tion may be total or partial. Total exenteration con-
sists of removal of the bladder, urethra, uterus,
vagina, and rectum, together with all the pelvic
supporting and connective tissues. Partial exentera-
tion is either anterior, with the rectum preserved, or
posterior, with retention of the bladder and the urethra
[2]. Most exenterations are supralevator, with the
pelvic floor musculature left in situ. Infralevator
exenteration is occasionally necessary, however, and
in these patients the pelvic floor muscles are resected
together with the vulva.
CT and MR appearance
After conization, extensive shortening and subse-
quent incompetence of the cervix may occur (Fig. 1).
Stenosis of the cervical canal, another complication of
cone biopsy, occasionally results in hematometra or
hematocervix. The CT and MR appearance of the
central pelvis is similar after total and radical hyster-
ectomy. In addition to the absence of the uterus, the
opposed vaginal fornices typically form a linear soft
tissue configuration on transaxial images. Nodularity
or fullness of the lateral fornix, seen on postcontrast
0033-8389/02/$ – see front matter D 2002, Elsevier Science (USA). All rights reserved.
PII: S0033 -8389 (01 )00016 -1
* Corresponding author.
E-mail address: [email protected] (K. Sugimura).
Radiol Clin N Am 40 (2002) 659–680

CTand T1-weighted MR images (T1-WI), may mimic
a mass lesion. In most cases, a normal vaginal cuff is
confirmed by visualizing a smooth, low-signal–
intensity muscular wall on T2-weighted MR images
(T2-WI) (Fig. 2). In some cases, however, fibrotic scar
tissue is present at the vaginal vault. The scar demon-
strates medium to low signal intensity on T2-WI
(Fig. 3) [3–5]. In addition, after radical hysterectomy,
the medium- to high-signal-intensity residual vagina
is short. Metallic clips along the pelvic sidewall can be
detected at the site of lymph node dissection. After
total exenteration, the pelvis is devoid of the bladder,
urethra, genitalia, and rectum. The patient has a
urinary diversion and a colostomy, which may be
visualized during CT or MR examination [5].
In patients who have undergone anterior pelvic
exenteration, there is no identifiable bladder or pelvic
genitalia, but the rectum remains in situ and the
potential space in the anterior pelvis is filled by bowel
(see Fig. 13). Sometimes the rectum occupies a more
anterior position. After posterior pelvic exenteration
(see Fig. 14), the rectum and pelvic genitalia are
Fig. 1. Conization. T2-WI (A) and fat-suppressed contrast-enhanced T1-weighted image (B) show shortening of the cervix.
Defect in the portio (arrows) is also seen.
K. Sugimura, H. Okizuka / Radiol Clin N Am 40 (2002) 659–680660
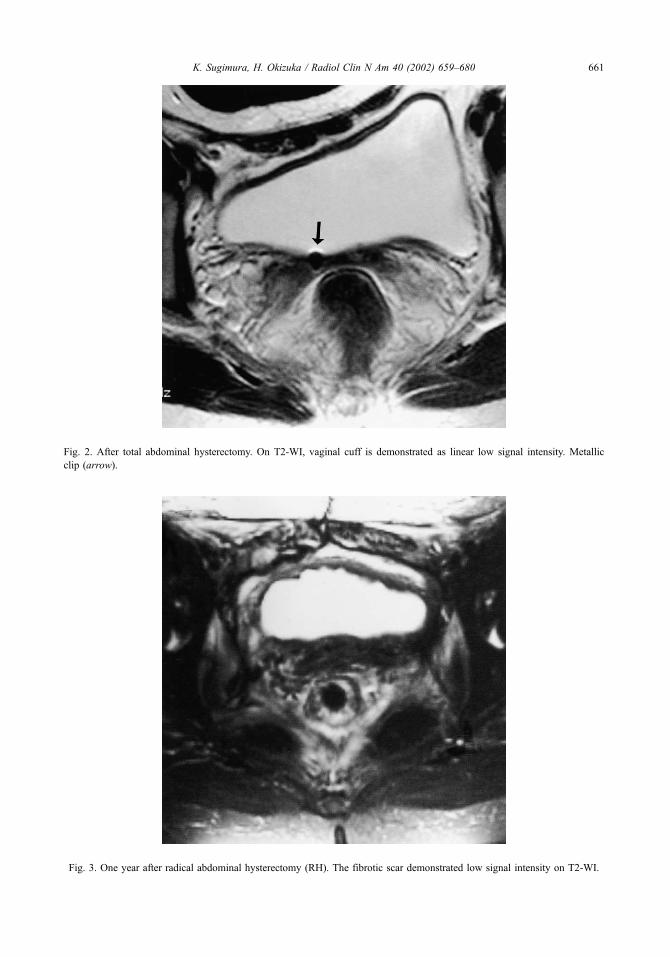
Fig. 2. After total abdominal hysterectomy. On T2-WI, vaginal cuff is demonstrated as linear low signal intensity. Metallic
clip (arrow).
Fig. 3. One year after radical abdominal hysterectomy (RH). The fibrotic scar demonstrated low signal intensity on T2-WI.
K. Sugimura, H. Okizuka / Radiol Clin N Am 40 (2002) 659–680 661

absent and the bladder extends into the posterior
pelvis [5].
Postradiation follow-up
Advanced carcinoma of the cervix is commonly
treated with radiation therapy, usually combination
external beam therapy and brachytherapy [1]. A
residual tumor may be recognized on postcontrast
CT scans in which the tumor may appear as a soft
tissue mass enlarging the cervix with diminished
intravenous contrast enhancement compared with
normal cervical tissue.
A residual tumor displays high signal intensity on
T2-WI, similar to the corresponding primary tumor
(Fig. 4). MRI is superior to CT for delineating the
tumor. Most tumors that respond to therapy decrease
in size within 6 months, and most of these tumors also
Fig. 4. Cervical cancer after radiation. T2-WI 10 days after (A) and 1 year after (B) completion of radiation. Residual tumor displays
high signal intensity on T2-WI. After 1 year, size of the tumor has increased. Invasion of the bladder and the rectum is also seen.
K. Sugimura, H. Okizuka / Radiol Clin N Am 40 (2002) 659–680662
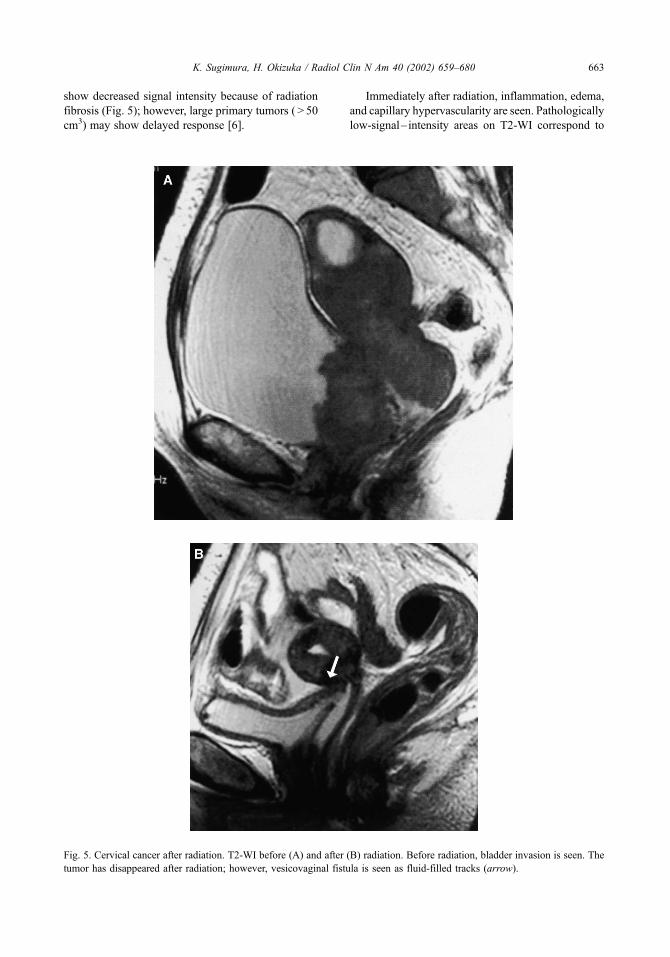
show decreased signal intensity because of radiation
fibrosis (Fig. 5); however, large primary tumors ( > 50
cm3) may show delayed response [6].
Immediately after radiation, inflammation, edema,
and capillary hypervascularity are seen. Pathologically
low-signal– intensity areas on T2-WI correspond to
Fig. 5. Cervical cancer after radiation. T2-WI before (A) and after (B) radiation. Before radiation, bladder invasion is seen. The
tumor has disappeared after radiation; however, vesicovaginal fistula is seen as fluid-filled tracks (arrow).
K. Sugimura, H. Okizuka / Radiol Clin N Am 40 (2002) 659–680 663
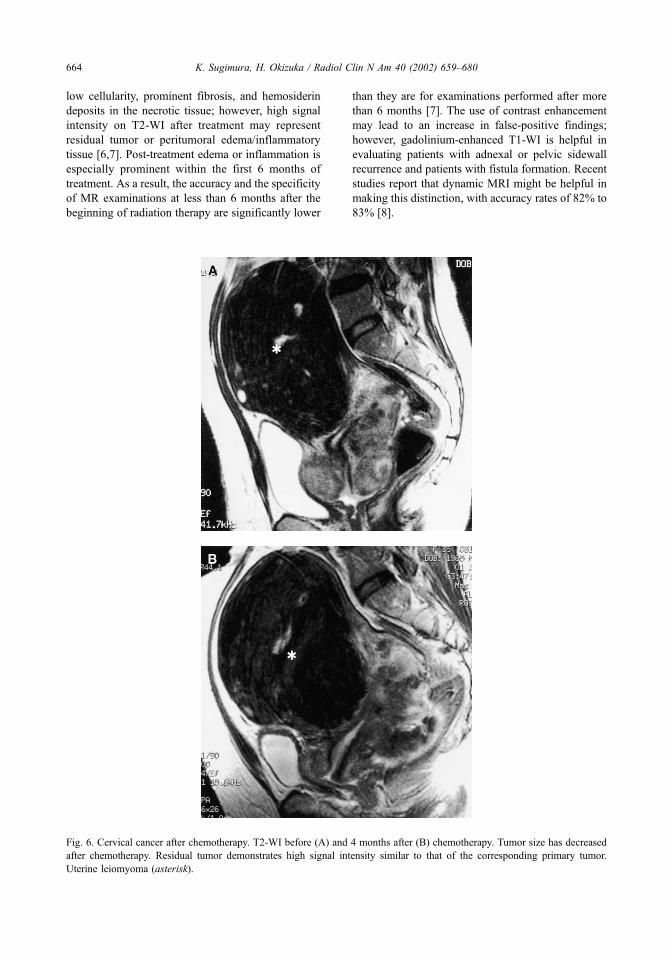
low cellularity, prominent fibrosis, and hemosiderin
deposits in the necrotic tissue; however, high signal
intensity on T2-WI after treatment may represent
residual tumor or peritumoral edema/inflammatory
tissue [6,7]. Post-treatment edema or inflammation is
especially prominent within the first 6 months of
treatment. As a result, the accuracy and the specificity
of MR examinations at less than 6 months after the
beginning of radiation therapy are significantly lower
than they are for examinations performed after more
than 6 months [7]. The use of contrast enhancement
may lead to an increase in false-positive findings;
however, gadolinium-enhanced T1-WI is helpful in
evaluating patients with adnexal or pelvic sidewall
recurrence and patients with fistula formation. Recent
studies report that dynamic MRI might be helpful in
making this distinction, with accuracy rates of 82% to
83% [8].
Fig. 6. Cervical cancer after chemotherapy. T2-WI before (A) and 4 months after (B) chemotherapy. Tumor size has decreased
after chemotherapy. Residual tumor demonstrates high signal intensity similar to that of the corresponding primary tumor.
Uterine leiomyoma (asterisk).
K. Sugimura, H. Okizuka / Radiol Clin N Am 40 (2002) 659–680664

Postchemotherapy changes
Recently, presurgical chemotherapy was used in
patients with advanced cervical cancer to reduce
tumor volume and stage, providing optimal condi-
tions for surgical therapy. After chemotherapy, the
residual tumor demonstrates high signal intensity on
T2-WI, similar to that of the corresponding primary
tumor (Fig. 6). MRI is superior to CT for delineating
the tumor.
In most cases, the size of the tumor is correctly
estimated, but peritumoral inflammatory tissue may
sometimes result in slight overestimation. In the
presence of intratumoral necrosis, the necrotic area
images with low signal intensity on T2-WI. This
finding may be related to hemosiderin deposits in
necrotic tissue [9]. In patients with a completely
successful responses to chemotherapy, the area pre-
viously occupied by cancerous tissue shows low
signal intensity, corresponding to fibrosis and extens-
ive foreign body reaction [10].
Cancer recurrence
Although advances in surgical techniques, radi-
ation therapy, and chemotherapy have resulted in
improved survival rates, approximately 30% of
patients with invasive cervical carcinoma die as a
result of recurrent or persistent disease. The preva-
lence of recurrence of cervical carcinoma varies with
tumor grade, histologic tumor type, tumor size, and
presence of lymph node metastases at the time of
presentation [11].
Typical manifestations of recurrent cervical carci-
noma, such as pelvic masses and lymphadenopathy,
are well recognized; however, less typical manifes-
tations such as peritoneal carcinomatosis and solid
organ metastases also occur. The increasing preva-
lence of these less manifestations is related, in part, to
the use of intensive pelvic radiation therapy, which
has resulted in a shift away from pelvic recurrence
toward distant recurrence. Selected patients with
limited pelvic recurrence not fixed to the pelvic wall
and without evidence of extrapelvic metastasis can be
potentially salvaged by pelvic exenteration with cura-
tive intent [2].
For patients with recurrence in the pelvis after
surgery, a combination of external radiation, depend-
ing on the volume of the tumor, and an additional
parametrial dose with midline shielding is needed [1].
CT and MR appearance
Pelvic recurrence may be located centrally in the
pelvis in the preserved cervix or in the postsurgical
bed and vaginal cuff. Residual tumor may appear as
a heterogeneous soft tissue mass on postcontrast
CT scans.
Fig. 7. Recurrent cervical carcinoma. Recurrent tumor is seen at the vaginal vault (arrows). The tumor demonstrated high signal
intensity on T2-WI, similar to the primary tumor.
K. Sugimura, H. Okizuka / Radiol Clin N Am 40 (2002) 659–680 665
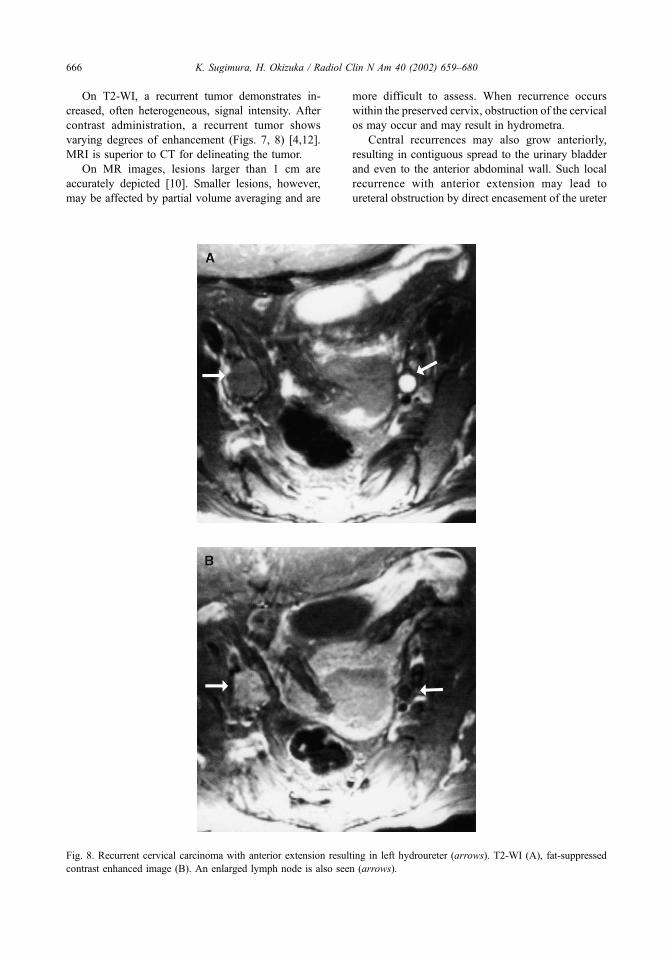
On T2-WI, a recurrent tumor demonstrates in-
creased, often heterogeneous, signal intensity. After
contrast administration, a recurrent tumor shows
varying degrees of enhancement (Figs. 7, 8) [4,12].
MRI is superior to CT for delineating the tumor.
On MR images, lesions larger than 1 cm are
accurately depicted [10]. Smaller lesions, however,
may be affected by partial volume averaging and are
more difficult to assess. When recurrence occurs
within the preserved cervix, obstruction of the cervical
os may occur and may result in hydrometra.
Central recurrences may also grow anteriorly,
resulting in contiguous spread to the urinary bladder
and even to the anterior abdominal wall. Such local
recurrence with anterior extension may lead to
ureteral obstruction by direct encasement of the ureter
Fig. 8. Recurrent cervical carcinoma with anterior extension resulting in left hydroureter (arrows). T2-WI (A), fat-suppressed
contrast enhanced image (B). An enlarged lymph node is also seen (arrows).
K. Sugimura, H. Okizuka / Radiol Clin N Am 40 (2002) 659–680666
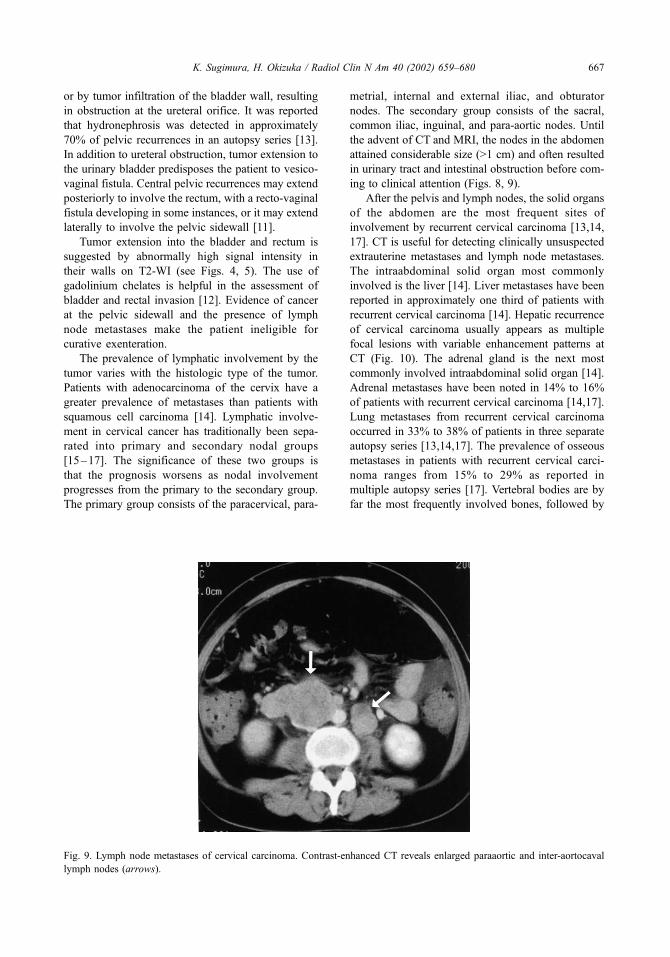
or by tumor infiltration of the bladder wall, resulting
in obstruction at the ureteral orifice. It was reported
that hydronephrosis was detected in approximately
70% of pelvic recurrences in an autopsy series [13].
In addition to ureteral obstruction, tumor extension to
the urinary bladder predisposes the patient to vesico-
vaginal fistula. Central pelvic recurrences may extend
posteriorly to involve the rectum, with a recto-vaginal
fistula developing in some instances, or it may extend
laterally to involve the pelvic sidewall [11].
Tumor extension into the bladder and rectum is
suggested by abnormally high signal intensity in
their walls on T2-WI (see Figs. 4, 5). The use of
gadolinium chelates is helpful in the assessment of
bladder and rectal invasion [12]. Evidence of cancer
at the pelvic sidewall and the presence of lymph
node metastases make the patient ineligible for
curative exenteration.
The prevalence of lymphatic involvement by the
tumor varies with the histologic type of the tumor.
Patients with adenocarcinoma of the cervix have a
greater prevalence of metastases than patients with
squamous cell carcinoma [14]. Lymphatic involve-
ment in cervical cancer has traditionally been sepa-
rated into primary and secondary nodal groups
[15–17]. The significance of these two groups is
that the prognosis worsens as nodal involvement
progresses from the primary to the secondary group.
The primary group consists of the paracervical, para-
metrial, internal and external iliac, and obturator
nodes. The secondary group consists of the sacral,
common iliac, inguinal, and para-aortic nodes. Until
the advent of CT and MRI, the nodes in the abdomen
attained considerable size (>1 cm) and often resulted
in urinary tract and intestinal obstruction before com-
ing to clinical attention (Figs. 8, 9).
After the pelvis and lymph nodes, the solid organs
of the abdomen are the most frequent sites of
involvement by recurrent cervical carcinoma [13,14,
17]. CT is useful for detecting clinically unsuspected
extrauterine metastases and lymph node metastases.
The intraabdominal solid organ most commonly
involved is the liver [14]. Liver metastases have been
reported in approximately one third of patients with
recurrent cervical carcinoma [14]. Hepatic recurrence
of cervical carcinoma usually appears as multiple
focal lesions with variable enhancement patterns at
CT (Fig. 10). The adrenal gland is the next most
commonly involved intraabdominal solid organ [14].
Adrenal metastases have been noted in 14% to 16%
of patients with recurrent cervical carcinoma [14,17].
Lung metastases from recurrent cervical carcinoma
occurred in 33% to 38% of patients in three separate
autopsy series [13,14,17]. The prevalence of osseous
metastases in patients with recurrent cervical carci-
noma ranges from 15% to 29% as reported in
multiple autopsy series [17]. Vertebral bodies are by
far the most frequently involved bones, followed by
Fig. 9. Lymph node metastases of cervical carcinoma. Contrast-enhanced CT reveals enlarged paraaortic and inter-aortocaval
lymph nodes (arrows).
K. Sugimura, H. Okizuka / Radiol Clin N Am 40 (2002) 659–680 667

the pelvis, ribs, and extremities [17]. The prevalence
of peritoneal carcinomatosis has ranged from 5% to
27% [15,17].
Endometrial cancer
Postsurgical changes
In stage I, grade 1 lesions, total abdominal hys-
terectomy, bilateral salpingo-oophorectomy, and
cytologic examination of peritoneal washings are
considered sufficient. In stage I, grade 2 and 3
patients, who are at much higher risk, selective pelvic
and para-aortic lymphadenectomy are also performed
to determine the need for adjunctive therapy. Adjuv-
ant radiotherapy has demonstrated improved control
in patients with high grade or deep myometrial
invasion [18,19].
Cancer recurrence
Approximately 17% of patients primarily treated
for endometrial carcinoma experience local or distant
recurrence. Women at low risk of recurrence are
characterized by stage Ia, grade 1 or 2, or stage Ib
grade 1 adenocarcinoma and have recurrence rates of
3% to 15%. The remaining high-risk patients (grade 3
lesions, stage equal to or greater than Ic disease; stage
Ib, grade 2; and aggressive histologies consisting of
sarcoma, papillary serous, clear-cell, and adenosqu-
amous) have recurrence rates of 25% to 45% [20].
Seventy percent of treatment failures for endometrial
carcinoma occur within the first 3 years of therapy.
Recurrences after surgery may occur locally within
the vagina, regionally within the pelvic or para-aortic
lymph nodes, or systemically. For low-risk endome-
trial cancers that recur, the vagina is the sole site of
failure in 30% to 50% of the patients. It is well
recognized as risk, particularly in patients who do not
receive adjuvant therapy. Vaginal recurrences may
result from local spread through lymphatic channels
or implantation at the time of surgery. Although
vaginal recurrences occur anywhere in the vagina,
the most common location is at the vaginal apex
(Figs. 11, 12).
Distant dissemination of endometrial carcinoma
may develop secondary to local failure. When recur-
rence is isolated and occurs at the vaginal apex,
radiotherapy is performed. When recurrence is more
extended or extrapelvic, chemotherapy is usually
used. Recurrent intrapelvic endometrial carcinoma
Fig. 10. Liver metastases of cervical carcinoma. Contrast-enhanced CT reveals multiple low-attenuation lesions in the liver.
K. Sugimura, H. Okizuka / Radiol Clin N Am 40 (2002) 659–680668

or distal metastasis is visualized as is recurrent cer-
vical carcinoma. Hepatic, lung, and osseous meta-
stases and peritoneal carcinomatosis may develop.
Ovarian cancer
Postsurgical changes
All histologic types of ovarian carcinoma are
treated in the same way. The standard surgical proce-
dure for ovarian carcinoma is total abdominal hyster-
ectomy and bilateral salpingo-oophorectomy. Partial
or complete omentectomy should be performed, and in
advanced disease an attempt should be made to resect
as much metastatic tumor as possible [21].
Postsurgical CT or MR appearance depends on the
extent of the resection. The uterus and ovaries are
absent, and vaginal fornices typically form a linear
soft tissue configuration on transaxial images. The
potential space is occupied by small bowel and
fibrous tissue [4].
Fig. 11. Recurrent endometrial carcinoma is seen at the vaginal vault. T2-WI (A), fat-suppressed contrast-enhanced image (B).
Recurrent tumor shows high signal intensity on T2-WI and good enhancement (arrows).
K. Sugimura, H. Okizuka / Radiol Clin N Am 40 (2002) 659–680 669

Cancer recurrence
The recurrence rate of ovarian cancer is high,
primarily because two thirds of patients have tumors
that have spread beyond the pelvis by the time of
diagnosis. Aggressive surgical cytoreduction fol-
lowed by chemotherapy has been the therapeutic
keystone for primary and recurrent ovarian disease.
However, it has been reported that if the recurrent
lesion is larger than 2 cm in diameter, surgical
resection may improve survival [22,23].
Serial measurement of the serumCA-125 levels is a
routine practice in the management of ovarian cancer.
A CA-125 level that remains elevated after chemo-
therapy is a strong indication of a residual tumor. Con-
versely, it is well recognized that a normal CA-125
level does not exclude the presence of a tumor [23].
Even at laparotomy, the detection of all tumors is
not feasible; up to 50% of patients who have a
negative findings on second-look surgery eventually
have a recurrent tumor. The goals of reassessment
during and after adjuvant chemotherapy include not
Fig. 12. Pelvic sidewall recurrence of endometrial carcinoma. T2-WI (A), fat-suppressed contrast-enhanced image (B). Recurrent
tumor shows high signal intensity on T2-weighted image and good enhancement (arrows).
K. Sugimura, H. Okizuka / Radiol Clin N Am 40 (2002) 659–680670
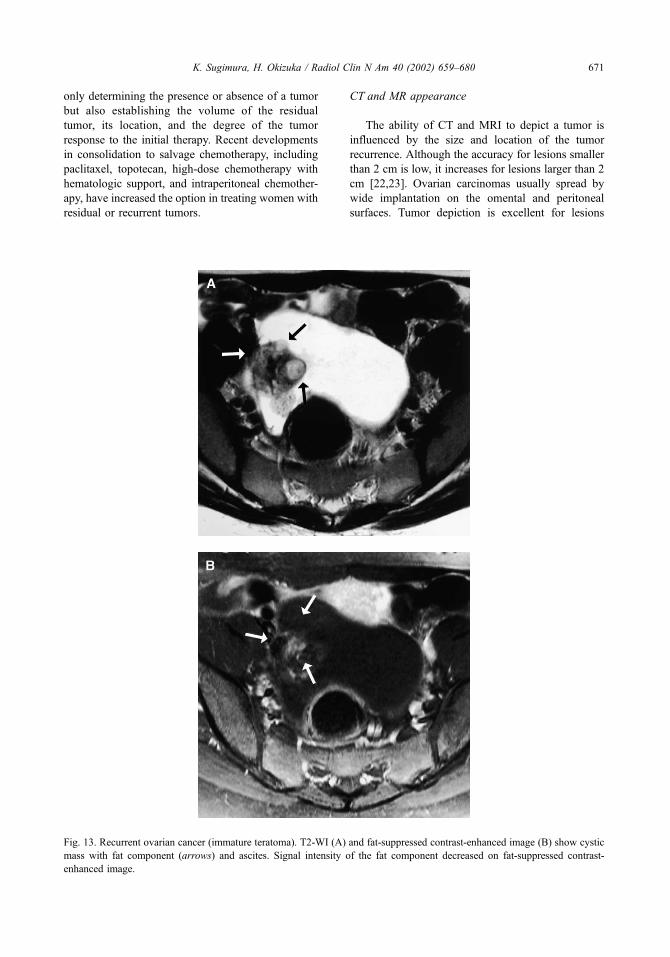
only determining the presence or absence of a tumor
but also establishing the volume of the residual
tumor, its location, and the degree of the tumor
response to the initial therapy. Recent developments
in consolidation to salvage chemotherapy, including
paclitaxel, topotecan, high-dose chemotherapy with
hematologic support, and intraperitoneal chemother-
apy, have increased the option in treating women with
residual or recurrent tumors.
CT and MR appearance
The ability of CT and MRI to depict a tumor is
influenced by the size and location of the tumor
recurrence. Although the accuracy for lesions smaller
than 2 cm is low, it increases for lesions larger than 2
cm [22,23]. Ovarian carcinomas usually spread by
wide implantation on the omental and peritoneal
surfaces. Tumor depiction is excellent for lesions
Fig. 13. Recurrent ovarian cancer (immature teratoma). T2-WI (A) and fat-suppressed contrast-enhanced image (B) show cystic
mass with fat component (arrows) and ascites. Signal intensity of the fat component decreased on fat-suppressed contrast-
enhanced image.
K. Sugimura, H. Okizuka / Radiol Clin N Am 40 (2002) 659–680 671

located in the cul-de-sac, in the vaginal cuff, and on
the liver surface. Lesions located in the peritoneum
and mesentery, however, are not well displayed
[22,23]. Tumor implants are recognized as soft tissue
on postcontrast CT and marked enhancement nod-
ules or plaques with gadolinium chelates on MRI
Fig. 15. Peritoneal implants with ovarian cancer. Contrast-enhanced CT demonstrates peritoneal implants protruding into
ascites (arrow).
Fig. 14. Extensive ascites and peritoneal implants with ovarian cancer. T2-WI demonstrates extensive ascites and multiple
peritoneal implants (arrows).
K. Sugimura, H. Okizuka / Radiol Clin N Am 40 (2002) 659–680672
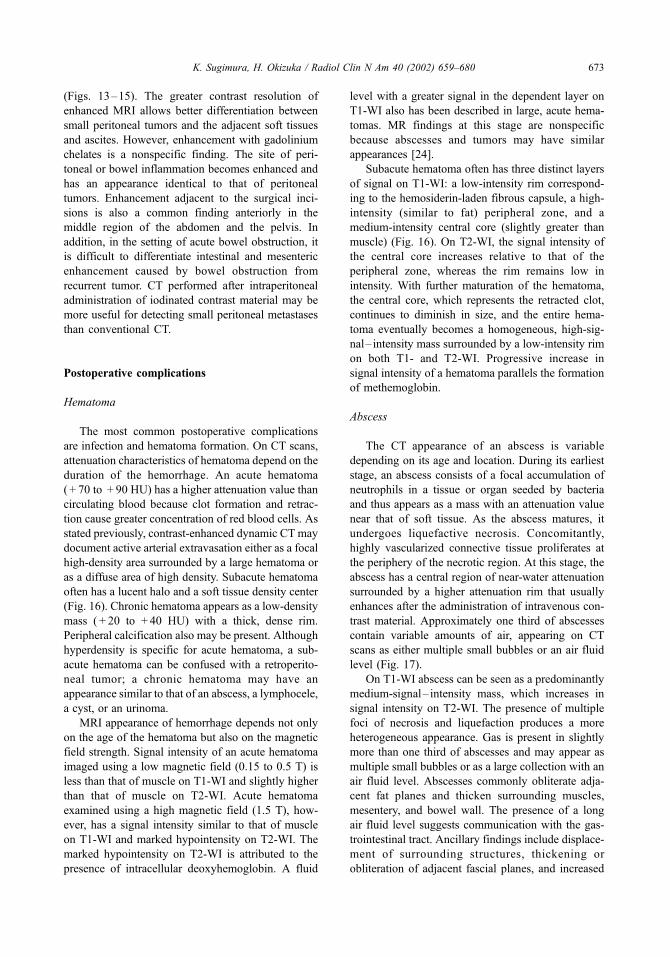
(Figs. 13–15). The greater contrast resolution of
enhanced MRI allows better differentiation between
small peritoneal tumors and the adjacent soft tissues
and ascites. However, enhancement with gadolinium
chelates is a nonspecific finding. The site of peri-
toneal or bowel inflammation becomes enhanced and
has an appearance identical to that of peritoneal
tumors. Enhancement adjacent to the surgical inci-
sions is also a common finding anteriorly in the
middle region of the abdomen and the pelvis. In
addition, in the setting of acute bowel obstruction, it
is difficult to differentiate intestinal and mesenteric
enhancement caused by bowel obstruction from
recurrent tumor. CT performed after intraperitoneal
administration of iodinated contrast material may be
more useful for detecting small peritoneal metastases
than conventional CT.
Postoperative complications
Hematoma
The most common postoperative complications
are infection and hematoma formation. On CT scans,
attenuation characteristics of hematoma depend on the
duration of the hemorrhage. An acute hematoma
( + 70 to + 90 HU) has a higher attenuation value than
circulating blood because clot formation and retrac-
tion cause greater concentration of red blood cells. As
stated previously, contrast-enhanced dynamic CT may
document active arterial extravasation either as a focal
high-density area surrounded by a large hematoma or
as a diffuse area of high density. Subacute hematoma
often has a lucent halo and a soft tissue density center
(Fig. 16). Chronic hematoma appears as a low-density
mass ( + 20 to + 40 HU) with a thick, dense rim.
Peripheral calcification also may be present. Although
hyperdensity is specific for acute hematoma, a sub-
acute hematoma can be confused with a retroperito-
neal tumor; a chronic hematoma may have an
appearance similar to that of an abscess, a lymphocele,
a cyst, or an urinoma.
MRI appearance of hemorrhage depends not only
on the age of the hematoma but also on the magnetic
field strength. Signal intensity of an acute hematoma
imaged using a low magnetic field (0.15 to 0.5 T) is
less than that of muscle on T1-WI and slightly higher
than that of muscle on T2-WI. Acute hematoma
examined using a high magnetic field (1.5 T), how-
ever, has a signal intensity similar to that of muscle
on T1-WI and marked hypointensity on T2-WI. The
marked hypointensity on T2-WI is attributed to the
presence of intracellular deoxyhemoglobin. A fluid
level with a greater signal in the dependent layer on
T1-WI also has been described in large, acute hema-
tomas. MR findings at this stage are nonspecific
because abscesses and tumors may have similar
appearances [24].
Subacute hematoma often has three distinct layers
of signal on T1-WI: a low-intensity rim correspond-
ing to the hemosiderin-laden fibrous capsule, a high-
intensity (similar to fat) peripheral zone, and a
medium-intensity central core (slightly greater than
muscle) (Fig. 16). On T2-WI, the signal intensity of
the central core increases relative to that of the
peripheral zone, whereas the rim remains low in
intensity. With further maturation of the hematoma,
the central core, which represents the retracted clot,
continues to diminish in size, and the entire hema-
toma eventually becomes a homogeneous, high-sig-
nal– intensity mass surrounded by a low-intensity rim
on both T1- and T2-WI. Progressive increase in
signal intensity of a hematoma parallels the formation
of methemoglobin.
Abscess
The CT appearance of an abscess is variable
depending on its age and location. During its earliest
stage, an abscess consists of a focal accumulation of
neutrophils in a tissue or organ seeded by bacteria
and thus appears as a mass with an attenuation value
near that of soft tissue. As the abscess matures, it
undergoes liquefactive necrosis. Concomitantly,
highly vascularized connective tissue proliferates at
the periphery of the necrotic region. At this stage, the
abscess has a central region of near-water attenuation
surrounded by a higher attenuation rim that usually
enhances after the administration of intravenous con-
trast material. Approximately one third of abscesses
contain variable amounts of air, appearing on CT
scans as either multiple small bubbles or an air fluid
level (Fig. 17).
On T1-WI abscess can be seen as a predominantly
medium-signal– intensity mass, which increases in
signal intensity on T2-WI. The presence of multiple
foci of necrosis and liquefaction produces a more
heterogeneous appearance. Gas is present in slightly
more than one third of abscesses and may appear as
multiple small bubbles or as a large collection with an
air fluid level. Abscesses commonly obliterate adja-
cent fat planes and thicken surrounding muscles,
mesentery, and bowel wall. The presence of a long
air fluid level suggests communication with the gas-
trointestinal tract. Ancillary findings include displace-
ment of surrounding structures, thickening or
obliteration of adjacent fascial planes, and increased
K. Sugimura, H. Okizuka / Radiol Clin N Am 40 (2002) 659–680 673

density of adjacent mesenteric fat. Whereas most
abscesses are round or oval, those adjacent to solid
organs, such as the liver, may have a crescentic or
lenticular configuration.
Fistula or sinus tract
A fistula is an abnormal communication between
two epithelialized surfaces, and a sinus is a blind-
ending abnormal tract that can open onto the skin
surface. Fistulas and sinus tracts commonly arise
secondary to sepsis or to inflammatory gastrointesti-
nal conditions. Fistulas also may be caused by pen-
etrating tumors or radiation therapy.
Enterovesical fistulas most commonly affect the
peritoneal bladder dome, and vesicovaginal fistulas
involve the posterior bladder wall. Rectovaginal and
sigmoidovaginal fistulas are classified into (1) those
involving the peritonized portion of the vagina and
the Douglas pouch [7] (upper third), (2) direct con-
Fig. 16. Subacute hematoma. Contrast-enhanced CT (A) and T1-WI (B). Hematoma demonstrates heterogeneous mass on
contrast-enhanced CT. T1-weighted images displays a high-signal-intensity peripheral zone and a medium-signal-intensity
central core.
K. Sugimura, H. Okizuka / Radiol Clin N Am 40 (2002) 659–680674
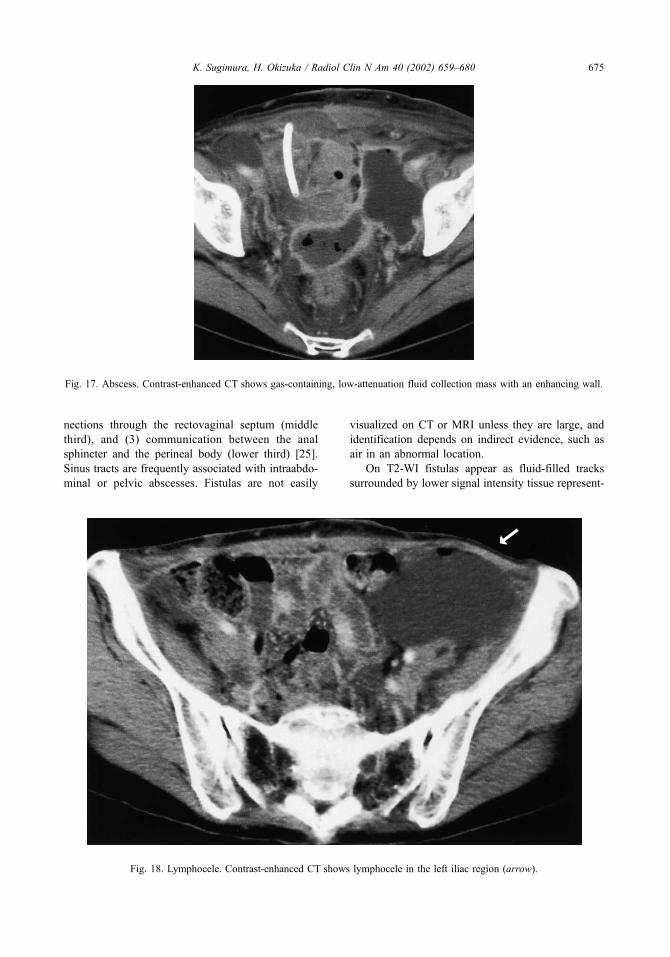
nections through the rectovaginal septum (middle
third), and (3) communication between the anal
sphincter and the perineal body (lower third) [25].
Sinus tracts are frequently associated with intraabdo-
minal or pelvic abscesses. Fistulas are not easily
visualized on CT or MRI unless they are large, and
identification depends on indirect evidence, such as
air in an abnormal location.
On T2-WI fistulas appear as fluid-filled tracks
surrounded by lower signal intensity tissue represent-
Fig. 18. Lymphocele. Contrast-enhanced CT shows lymphocele in the left iliac region (arrow).
Fig. 17. Abscess. Contrast-enhanced CT shows gas-containing, low-attenuation fluid collection mass with an enhancing wall.
K. Sugimura, H. Okizuka / Radiol Clin N Am 40 (2002) 659–680 675

ing fibrosis, granulation tissue, or tumor. A key
finding is the presence of a focal interruption in the
low-signal-intensity muscle of the bladder, rectum, or
vagina (see Fig. 5). The use of gadolinium chelates
improves fistula detection.
Sinus tracts are identified by their orientation and
communication with the skin surface. On MR
images, sinuses appear as linear or tubular structures
that run from the pelvis to the skin surface, usually
the perineum.
Injection of contrast material into the fistula
improves visualization and helps establish the pres-
ence of communication with adjacent abscesses or the
genitourinary tract. An iodinated contrast agent at a
concentration of 5% to 10% is useful for CT fistulo-
graphy; normal saline provides good contrast for MRI
studies [26].
Lymphocele
A lymphocele (lymphocyst) is an accumulation of
lymph fluid, contained by the parietal peritoneum,
adjacent to the pelvic sidewall [27]. It is a relatively
uncommon complication of lymphadenectomy and
occurs in less than 5% of patients. Factors implicated
in the development of lymphoceles include the extent
of lymphadenectomy, radiation therapy before sur-
gery, tumor invasion of the lymphatics, and treatment
with heparin as a prophylaxis against deep venous
thrombosis [27].
Lymphoceles are visualized as well-circumscribed
oval structures (Fig. 18). They may contain multiple
septa. Because of their protein content, they show
high signal intensity on T2-WI. The configuration
and position of a lymphocele, together with its signal
characteristics, facilitate recognition on imaging stud-
ies, particularly when there is a history of previous
lymph node dissection [4].
Postradiation changes
The recognition of changes in the irradiated pelvis
is important lest they be mistaken for recurrent neo-
plasms. MRI is superior to CT for demonstrating
those changes after radiation therapy. Acute radiation
leads to endarteritis of small blood vessels and
increased endothelial permeability, resulting in the
formation of interstitial edema and congestion. A
chronic radiation effect is caused by ischemia and
fibrosis, resulting in impaired organ function, stric-
ture, or fistula formation.
Uterus
In females of reproductive age, the uterus may
undergo several changes after radiation therapy, and
the myometrium and the endometrium are affected
[28]. The myometrium demonstrates a generalized
decrease in signal intensity on T2-WI that may be
seen as early as 1 month after treatment. Eventually
this leads to a loss of distinction of the zonal anatomy.
The endometrium undergoes atrophy. These changes
become apparent after approximately 6 months. Two
mechanisms account for these changes, a direct
radiation effect on the uterine tissues and radiation-
induced ovarian hypofunction, which causes reduced
hormonal stimulation of the uterus. Cervical os steno-
sis may occur 3 to 6 months after the completion of
high-dose radiotherapy [29].
Ovary
In females of reproductive age, the irradiated
ovaries become smaller and demonstrate a homoge-
neous, decreased signal intensity on T2-WI, reflect-
ing atrophy of the ovarian follicles, increased fibrosis,
and vascular sclerosis. [29].
Vagina
During the acute phase, the wall of the vagina
exhibits increased signal intensity on T2-WI because
of edema and hypervascular inflammatory change,
whereas the vagina becomes atrophic and shows a
homogeneously low signal intensity during the
chronic phase from fibrosis. More severe changes,
manifested by inflammation and tissue necrosis with
ulceration that can progress to fistula formation, can
also be seen.
Bladder
The severity of bladder radiation injury is not
directly related to the interval from the start of
therapy because the effects of severe radiation may
Fig. 19. Radiation cystitis with vesicovaginal fistula. (A) T1-W, (B) T2-W, and (C) contrast-enhanced images. Thickening of
the bladder wall, with heterogeneous high signal intensity on T2-WI. Vesico-vaginal fistula is clearly demonstrated on
contrast-enhanced image (arrow). Thickening of the perirectal fat and increased signal intensity of striated muscle on T2-WI
are also seen.
K. Sugimura, H. Okizuka / Radiol Clin N Am 40 (2002) 659–680676
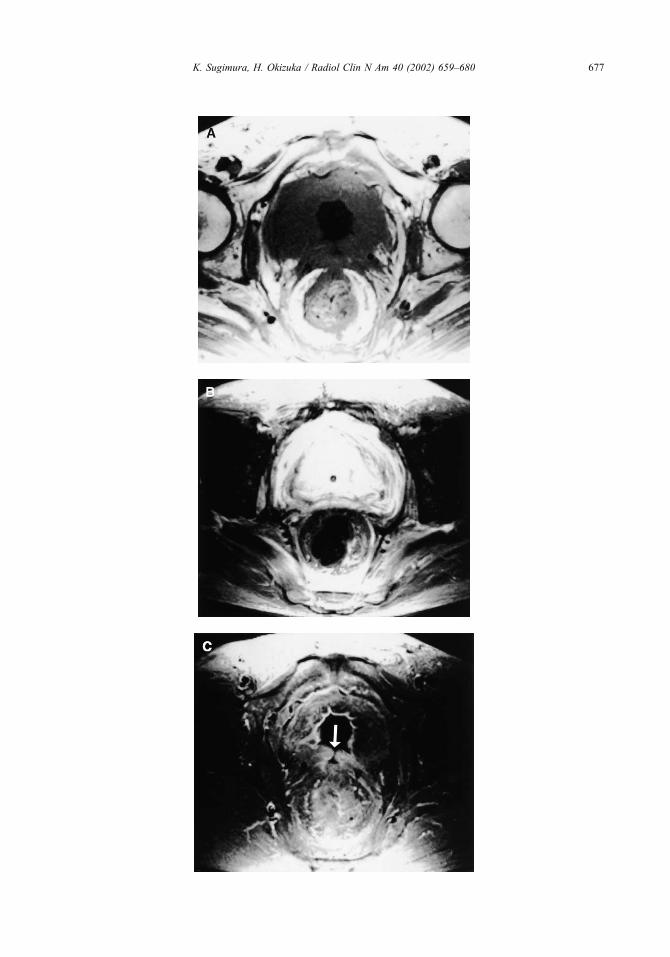
K. Sugimura, H. Okizuka / Radiol Clin N Am 40 (2002) 659–680 677

be identified in the acute, subacute, or chronic phases.
Symmetrical thickening of the walls of the urinary
bladder is commonly seen in patients who have
received a total radiation dose of 54 Gy or greater.
Postradiation MR studies of the bladder demonstrate
a range of changes that correlate with the severity of
histologic findings. Although symptom severity gen-
erally parallels the MR grades of radiation change,
minor changes may be identified in totally asympto-
matic patients [30]. The earliest MR feature is high
signal intensity of the bladder mucosa on T2-WI,
which most likely represents mucosal edema. This
high signal intensity usually commences at the tri-
gone but may spread to involve the whole mucosa.
The normal bladder wall thickness (< 5 mm) is pre-
served. With more severe radiation injury, the bladder
wall increases in width to more than 5 mm, and it
demonstrates a uniformly high signal intensity on
T2-WI. After contrast administration, the bladder
wall enhances, but there may be differentially
increased enhancement of the mucosa [30]. During
the subacute or chronic stage, the inner aspect of the
bladder wall may remain as a thin band of low signal
intensity because of radiation-induced fibrosis,
whereas the rest of the wall is of high signal intensity.
In addition to thickening and abnormal signal char-
acteristics of the bladder wall, bladder radiation
changes in their most extreme form include the
formation of fistulae or sinus tracts arising from the
bladder (Fig. 19).
Rectum and perirectal tissue
Radiation-induced injury of the colon, or radiation
colitis, occurs in two time frames. In some patients, it
develops as an acute process, during or within a few
weeks of the time of radiation exposure. In others, it
develops as a late complication of therapy. The early
form presents as self-limited diarrhea and tenesmus
and is usually recognized clinically without the need
for imaging studies. The late form is a chronic,
relentlessly progressive process that begins 2 to 20
years after radiation exposure. It is a result of radi-
ation-induced, obliterative endarteritis, and it is, in a
sense, a form of ischemic disease [30]. CT findings
include narrowing and mural thickening of the irra-
diated segment. The presacral space is widened by
increased perirectal fat and perirectal fibrous tissue
that usually encircle the rectum and the perirectal fat
like a sleeve. The combination of increased perirectal
fat and thickened perirectal fascia can produce a
target appearance, with the thick-walled, stenotic
rectum forming the center of the target. The symmet-
rical increase in perirectal fibrous tissue found after
radiation helps distinguish radiation proctitis from the
general asymmetrical appearance of recurrent tumor
or postoperative fibrosis [31].
Radiation-induced changes have been studied
more extensively using MRI. The severity of these
changes is graded based on MRI signal intensity and
thickness of the wall of the involved organ. The first
MR evidence of radiotherapy change in the rectum is
increased signal intensity in the submucosa on T2-
WI. At this stage, the outer muscle layer of the rectal
wall retains its normal low signal intensity on T2-WI
sequences. With progression of radiation injury, the
rectal wall becomes thickened (> 6 mm in the dis-
tended state), and the outer muscle layer demonstrates
high signal intensity on T2-WI. As a result of these
changes, differentiation between the submucosa and
muscle layers is lost [30]. After the administration of
gadolinium chelates, rectal tissue enhances but there
is no distinction between the component layers. The
most severe rectal changes include evidence of a
fistula or a sinus tract from the rectum. As with
bladder radiation injury, the degrees of rectal change
are unrelated to the time from the start of treatment,
and minor rectal MR findings may be seen in
asymptomatic patients [30].
The perirectal fascia becomes thickened after
radiation therapy measuring more than 3 mm at
the S4/5 vertebral level. This is more commonly
seen in the subacute phase [30]. The presacral space,
which normally has a maximum diameter of less
than 1.5 cm at the S4/5 vertebral level, is widened,
usually during the chronic phase after treatment. The
space may be filled with fat (high signal intensity on
both T1- and T2-WI) or fluid (low signal intensity
on T1-WI and high signal intensity on T2-WI).
Alternatively, presacral tissue may demonstrate low
signal intensity on T1 and T2-WI, most likely
because of fibrosis.
Pelvic fat and striated muscles
Normal pelvic fat demonstrates homogeneous
high signal intensity on T1- and T2-WI. Radiation
therapy changes lead to a heterogeneous decrease in
signal intensity on T1- and T2-WI [30] within the
pelvic fat.
Normally, the striated pelvic muscles demonstrate
medium signal intensity on T1-WI and decreased
signal intensity on T2-WI. After radiation, however,
they demonstrate high signal intensity on T2-WI,
probably related to edema, with the involved muscles
corresponding to the radiation field (Fig. 19) [30].
Radiation muscle changes are commonly identified
during the subacute phase [31].
K. Sugimura, H. Okizuka / Radiol Clin N Am 40 (2002) 659–680678

Bone marrow
MRI is excellent for the evaluation of radiation-
induced bone marrow changes. Normal bone marrow
demonstrates medium to high signal intensity (less
than the signal intensity of fat) on T1-WI. Radiation
results in myeloid depletion and an increase in fat
content, accounting for the high signal intensity of
irradiated bone marrow on T1-WI. Radiation-induced
osteonecrosis may cause bone marrow to display low
signal intensity on T1-WI and heterogeneous signal
intensity on T2-WI.
Insufficiency fractures occur as a result of normal
physiologic stress on bone with deficient elastic
resistance. They are often seen in postmenopausal
women, in patients who have had exposure to radi-
ation, or in patients with who have had high-dose
steroid therapy. The typical distribution of insuf-
ficiency fractures is sacroiliac joint in 61%, upper
sacrum (S1-2) in 28%, lower sacrum (S3-5) in 4%,
pubis in 4%, and ischium in 3%. The lesions dem-
onstrate low signal intensity on T1-WI and variable
signal intensity on T2-WI. Symmetrical fractures are
found in more than half the patients [32] (Fig. 20).
Fig. 20. Insufficiency fracture. T1-W (A) and contrast-enhanced (B) images. Bilateral sacroiliac joints demonstrate low signal
intensity on T1-weighted image (arrows) and slight contrast enhancement.
K. Sugimura, H. Okizuka / Radiol Clin N Am 40 (2002) 659–680 679

References
[1] Thompson JD. Hysterectomy. In: Thompson JD, Rock
JA, editors. Te Lind’s operative gynecology. Philadel-
phia, PA: JB Lippincott; 1992. p. 663–738.
[2] Morley GW, Hopkins MP. Pelvic exenteration. In:
Thompson JD, Rock JA, editors. Te Lind’s operative
gynecology. Philadelphia, PA: JB Lippincott; 1992.
p. 1329–45.
[3] Brown JJ, Gutierrez ED, Lee JK. MR appearance of
the normal and abnormal vagina after hysterectomy.
AJR Am J Roentgenol 1992;158:95–8.
[4] Kasales CJ, Langer JE, Arger PH. Pelvic pathology
after hysterectomy a pictorial essay. Clin Imaging
1995;19:210–7.
[5] Okizuka H, Hricak H. MR evaluation of the pelvis after
therapy. In: Higgins CB, Hricak H, Helms CA, editors.
Magnetic resonance imaging of the body. Philadelphia,
PA: Lippincott-Raven; 1997. p. 957–84.
[6] Flueckiger F, Ebner F, Poschauko H, Tamissino K,
Einspieler R, Ranner G. Cervical cancer: serial MR
imaging before and after primary radiation therapy–a
2-year follow-up study. Radiology 1992;184:89–93.
[7] HricakH, Swift PS, Campos Z, Quivey JM,Gildengorin
V, Goranson H. Irradiation of the cervix uteri: value of
unenhanced and contrast-enhanced MR imaging. Radi-
ology 1993;189:381–8.
[8] Kinkel K, Ariche M, Tardivon AA, Spotz A, Castaigne
D, Lhomme C, et al. Differentiation between recurrent
tumor and benign conditions after treatment of gyneco-
logic pelvic carcinoma: value of dynamic contrast-
enhanced subtraction MR imaging. Radiology 1997;
204:55–63.
[9] Sironi S, Belloni C, Taccagni G, DelMaschio A. Inva-
sive cervical carcinoma: MR imaging after postopera-
tive chemotherapy. Radiology 1991;180:719–22.
[10] Kim KH, Lee BH, Do YS, Chin SY, Park SY, Kim BG,
et al. Stage IIb cervical carcinoma: MR evaluation of
effect of intraarterial chemotherapy. Radiology 1994;
192:61–5.
[11] Hricak H. Cancer of the uterus: the value of MRI pre-
and post-irradiation. Int J Radiat Oncol Biol Phys 1991;
21:1089–94.
[12] Fulcher AS, O’Sullivan SG, Segreti EM, Kavanagh
BD. Recurrent cervical carcinoma: typical and atypical
manifestations. Radiographics 1999;19:S103–16.
[13] Pearson B, Garcia M. Spread and metastasis in carci-
noma of the cervix uteri: their significance in planning
treatment. New Orleans Med J 1942;95:215–9.
[14] Drescher CW, Hopkins MP, Roberts JA. Comparison
of the pattern of metastatic spread of squamous cell
cancer and adenocarcinoma of the uterine cervix. Gy-
necol Oncol 1989;33:340–3.
[15] Henriksen E. The lymphatic spread of carcinoma of the
cervix and of the body of the uterus. Am J Obstet
Gynecol 1949;58:924–42.
[16] Henriksen E. The dispersion of cancer of the cervix.
Radiology 1950;54:812–5.
[17] Sotto LSJ, Graham JB, Pickren JW. Postmortem find-
ings in cancer of the cervix. Am J Obstet Gynecol 1960;
80:791–4.
[18] Pearvey RG, Petereit DG. Post-operative high dose rate
brachytherapy in patients with low to intermediate risk
endometrial cancer. Radiother Oncol 2000;56:17–22.
[19] Scarabelli C, Campagnutta E, Giorda G, De Piero G,
Sopracordevole F, Quaranta M, et al. Maximal cytor-
eductive surgery as a reasonable therapeutic alternative
for recurrent endometrial carcinoma. Gynecol Oncol
1997;70:90–3.
[20] Shumsky AG, Brasher PMA, Stuart GCE, Nation JG.
Risk-specific follow-up endometrial carcinoma pa-
tients. Gynecol Oncol 1997;65:379–82.
[21] Rutledge FN. Surgical treatment of ovarian cancer. In:
Thompson JD, Rock JA, editors. Te Lind’s operative
gynecology. Philadelphia, PA: JB Lippincott; 1992.
p. 1303–1328.
[22] Forstner R, Hricak H, Powell CB, Azizi L, Frankel SB,
Stern JL. Ovarian cancer recurrence: value of MR
imaging. Radiology 1995;196:715–20.
[23] Low RN, Saleh F, Song SYT, Shiftan TA, Barone RM,
Lacey CG, et al. Treated ovarian cancer: comparison of
MR imaging with serum CA-125 level and physical ex-
amination-a longitudinal study. Radiology 1999;211:
519–28.
[24] Gomori JM, Grossman RI, Goldberg HI, Zimmerman
RA, Bilaniuk LT. Intracranial hematomas: imaging by
high-field MR. Radiology 1985;157:87–93.
[25] Outwater E, Schiebler ML. Pelvic fistulas: findings on
MR images. AJR Am J Roentgenol 1993;160:327–30.
[26] Myhr GE, Myrvold HE, Nilsen G, Thoresen JE, Rinck
PA. Perianal fistulas: use of MR imaging for diagnosis.
Radiology 1994;191:545–9.
[27] Ilancheran A, Monaghan JM. Pelvic lymphocyst: a 10-
year experience. Gynecol Oncol 1988;29:333–6.
[28] Arrive L, Chang YCF, Hricak H, Brescia RJ, Auffer-
mann W, Quivey JM. Radiation-induced uterine
changes: MR imaging. Radiology 1989;170:55–8.
[29] Grigsby PW, Russell A, Bruner D, Eifel P, Koh WJ,
Spanos W, et al. Late injury of cancer therapy on the
female reproductive tract. Radiat Oncol Biol Phys
1995;31:1281–99.
[30] Sugimura K, Carrington BM, Quivey JM, Hricak H.
Postirradiation changes in the pelvis: assessment with
MR imaging. Radiology 1990;175:805–13.
[31] WatanabeM, Sugimura K, Kuroda S, Okizuka H, Ishida
T. CT assessment of postirradiation changes in the rec-
tumandperirectal region.Clin Imaging1995;19:182–7.
[32] Abe H, Nakamura M, Takahashi S, Maruoka S, Ogawa
Y, Sakamoto K. Radiation-induced insufficiency frac-
tures of the pelvis: evaluation with 99m Tc-methylene
diphosphonate scintigraphy. AJR Am J Roentgenol
1992;158:599–602.
K. Sugimura, H. Okizuka / Radiol Clin N Am 40 (2002) 659–680680

Index
Note: Page numbers of article titles are in boldface type.
A
Abscesses, after pelvic surgery, 683
Adenocarcinoma, clear cell, of vagina, 650
Adnexal masses, 597–617
benign versus malignant, 606
CA-125 levels in, 597
Doppler ultrasonography of, 602, 606
MR imaging of, 606–607, 609–610, 613–614
benign-appearing lesions, 607, 609–610, 613
heterogeneous signal intensities in, 610, 613
high T1 signal intensity in, 609
simple cystic lesions, 607, 609
solid lesions, 610
benign versus malignant, 607
malignant-appearing lesions, 614
protocol for, 607
prognosis for, 597–598
transvaginal sonography of, 598–599, 601–602
metastases in, 601
morphology in, 599, 601–602
Advanced Breast Biopsy Instrumentation system, in
core biopsy, of breast cancer, 493
Artificial neural network, to diagnose breast disease,
BI-RADS lexicon for, 417–418
Atypical ductal hyperplasia, core biopsy of, 490–491
Atypical lobular hyperplasia, core biopsy of, 496
B
Bartholin’s cysts, of vulva, 659–660
BI-RADS lexicon, 409–430, 492–493
and communication with referring physicians,
419–420
breast parenchymal density, 416–417
computer-aided diagnosis, 417–418
for mammography, 409–411
for MR imaging, 424–428
lexicon development, 424–428
potential usefulness of, 428
for ultrasonography, 420–424
lesion characterization, 420–421
lexicon development, 421–423
observer variability in, 423–424
limitations of, 418–419
potential usefulness of, 411–416
category 3: probably benign, 412–416
final assessment categories, 411–412
Biopsy
core, of breast cancer . See Core biopsy.
endometrial, for postmenopausal bleeding,
527–528
fine-needle aspiration, of breast cancer,
434–435, 437
image-guided, of breast cancer, 518
Bladder, postradiation changes in, 686, 688
Bleeding, postmenopausal.
See Postmenopausal bleeding.
Bone marrow, postradiation changes in, 688–689
BRCA genes, and risk of breast cancer, 400
MR imaging for, 465
Breast cancer. See also Breast disease.
Breast Imaging Reporting and Data System in .
See BI-RADS lexicon.
conservative treatment of, 501–516
and benign sequelae resembling recurrent
tumor, 514
evidence supporting, 501–502
local failure of, 511–514
long-term follow-up of, 508–509, 511
mammography after, 506–508
patient selection for, 502
specimen radiography in, 502–504, 506
core biopsy of . See Core biopsy.
digital mammography of .
See Digital mammography.
MR imaging of, 437, 443–466
difficult histologies in, 457–459
0033-8389/02/$ – see front matter D 2002, Elsevier Science (USA). All rights reserved.
PII: S0033 -8389 (02 )00032 -5
Radiol Clin N Am 40 (2002) 681–687

for occult primary breast cancer, 464
for staging, 459–462
for tumor recurrence, 462, 464
image acquisition in, 445–449
fat suppression in, 445
Memorial Sloan-Kettering protocol for,
445–449
proposed minimum requirements, 445
image analysis in, 449–451, 457
American College of Radiology lexicon
for, 449
clip artifact in, 453
delayed imaging time in, 456
fat suppression in, 453
kinetics in, 450–451, 453
misregistration in, 454–455
morphology in, 449–450
unilateral examinations in, 456–457
window levels in, 454
in high-risk patients, 464–465
sensitivity of, 443–445
to assess recurrence, 519
to assess residual disease, 462
to assess treatment response, 462
to guide core biopsy, 484–485
to localize lesions, 518–519
ovarian metastases from, 601, 614
positron emission tomography of . See Positron
emission tomography.
screening for, mammography in .
See Mammography.
sestamibi scintimammography of .
See Sestamibi scintimammography.
surgeon’s perspective on, 518–519
ultrasonography of, 431–441
barriers to acceptance of, 435–437
false-positives and nonstandard thresholds,
436–437
lack of proof of benefit, 435–436
nature of examination, 436
problems with reproducibility, 436
small footprint probes, 436
for screening, 434–435
for staging, 432–434
versus other modalities, 437–439
Breast disease. See also Breast cancer.
surgeon’s perspective on, 517–520
breast cancer, 518–519
findings suspicious for local recurrence, 519
image-guided biopsy, 518
lesions detected by screening, 517–518
new imaging modalities, 519
patient with physical findings, 518
Breast Imaging Reporting and Data System.
See BI-RADS lexicon.
Breast parenchymal density, BI-RADS lexicon for,
416–417
Brenner tumors, MR imaging of, 610
C
CA-125 levels
in adnexal masses, 597
in ovarian cancer, 524, 680
Calcifications, in breast
BI-RADS lexicon for, 409–410
recurrent breast cancer and, 513–514
stereotactic core biopsy of, 490
Calcified ovarian tumors, CT of, 637–639
Cancer
breast . See Breast cancer.
cervical . See Cervical cancer.
endometrial . See Endometrial cancer.
ovarian . See Ovarian cancer.
vaginal . See Vaginal cancer.
vulvar . See Vulvar cancer.
Cervical cancer, 579–595
CT of, 523–524
epidemiology of, 579
lymph node evaluation in, 585
MR imaging of, 523–524, 580–582
and treatment planning, 593–594
coils in, 587
contrast enhancement in, 589–592
motion artifact suppression in, 589
protocol for, 592–593
pulse sequences and imaging planes in,
587, 589
postchemotherapy changes in, 674–675
MR imaging of, 675
postoperative changes in, 669–670
after hysterectomy, 669–670
after pelvic exenteration, 669–670
CT of, 669–670
MR imaging of, 669–670
postradiation follow-up of, 672–674
MR imaging in, 672–674
prognosis for, 580
recurrence of, 675–677
CT of, 675–677
MR imaging of, 675–677
staging of, 580
MR imaging in, 582, 584–585
stage I, 582
Index / Radiol Clin N Am 40 (2002) 681–687682
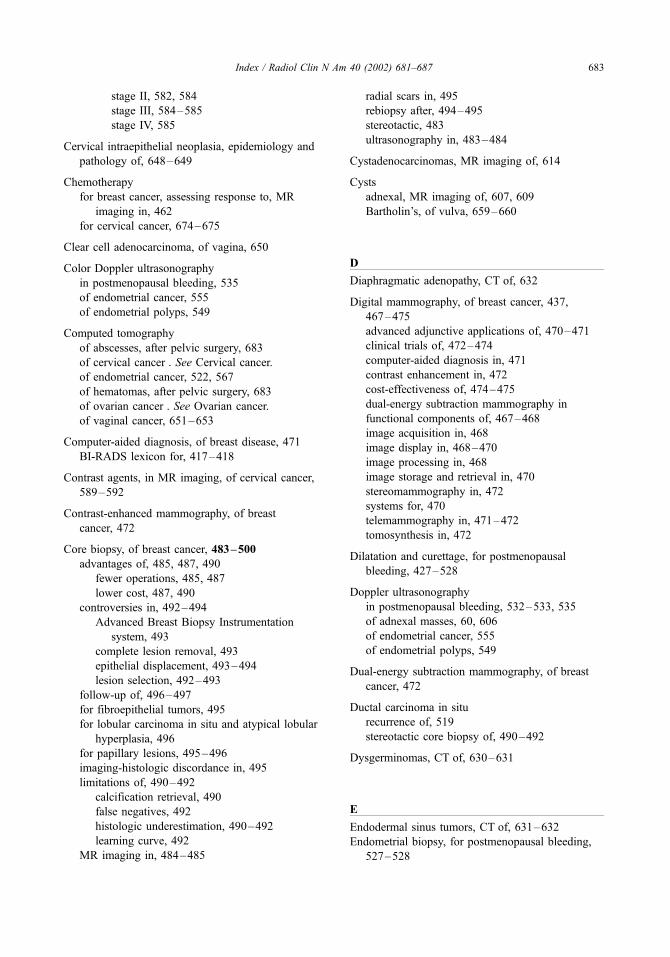
stage II, 582, 584
stage III, 584–585
stage IV, 585
Cervical intraepithelial neoplasia, epidemiology and
pathology of, 648–649
Chemotherapy
for breast cancer, assessing response to, MR
imaging in, 462
for cervical cancer, 674–675
Clear cell adenocarcinoma, of vagina, 650
Color Doppler ultrasonography
in postmenopausal bleeding, 535
of endometrial cancer, 555
of endometrial polyps, 549
Computed tomography
of abscesses, after pelvic surgery, 683
of cervical cancer . See Cervical cancer.
of endometrial cancer, 522, 567
of hematomas, after pelvic surgery, 683
of ovarian cancer . See Ovarian cancer.
of vaginal cancer, 651–653
Computer-aided diagnosis, of breast disease, 471
BI-RADS lexicon for, 417–418
Contrast agents, in MR imaging, of cervical cancer,
589–592
Contrast-enhanced mammography, of breast
cancer, 472
Core biopsy, of breast cancer, 483–500
advantages of, 485, 487, 490
fewer operations, 485, 487
lower cost, 487, 490
controversies in, 492–494
Advanced Breast Biopsy Instrumentation
system, 493
complete lesion removal, 493
epithelial displacement, 493–494
lesion selection, 492–493
follow-up of, 496–497
for fibroepithelial tumors, 495
for lobular carcinoma in situ and atypical lobular
hyperplasia, 496
for papillary lesions, 495–496
imaging-histologic discordance in, 495
limitations of, 490–492
calcification retrieval, 490
false negatives, 492
histologic underestimation, 490–492
learning curve, 492
MR imaging in, 484–485
radial scars in, 495
rebiopsy after, 494–495
stereotactic, 483
ultrasonography in, 483–484
Cystadenocarcinomas, MR imaging of, 614
Cysts
adnexal, MR imaging of, 607, 609
Bartholin’s, of vulva, 659–660
D
Diaphragmatic adenopathy, CT of, 632
Digital mammography, of breast cancer, 437,
467–475
advanced adjunctive applications of, 470–471
clinical trials of, 472–474
computer-aided diagnosis in, 471
contrast enhancement in, 472
cost-effectiveness of, 474–475
dual-energy subtraction mammography in
functional components of, 467–468
image acquisition in, 468
image display in, 468–470
image processing in, 468
image storage and retrieval in, 470
stereomammography in, 472
systems for, 470
telemammography in, 471–472
tomosynthesis in, 472
Dilatation and curettage, for postmenopausal
bleeding, 427–528
Doppler ultrasonography
in postmenopausal bleeding, 532–533, 535
of adnexal masses, 60, 606
of endometrial cancer, 555
of endometrial polyps, 549
Dual-energy subtraction mammography, of breast
cancer, 472
Ductal carcinoma in situ
recurrence of, 519
stereotactic core biopsy of, 490–492
Dysgerminomas, CT of, 630–631
E
Endodermal sinus tumors, CT of, 631–632
Endometrial biopsy, for postmenopausal bleeding,
527–528
Index / Radiol Clin N Am 40 (2002) 681–687 683

Endometrial cancer, 565–578
and postmenopausal bleeding .
See Postmenopausal bleeding.
CT of, 522, 567
endometriosis and, 634
epidemiology of, 565–566
imaging findings in, 568–570, 573–574
and treatment planning, 574–577
stages 0, I, IA, IB, 569–570, 573
stage II, 573
stages III, IIIA, IIIB, IIIC, 573
stages IV, IVA, IVB, 573
imaging protocol for, 568
MR imaging of, 522, 567–568
contrast-enhanced, 568
postoperative changes in, 677–678
prognosis for, 566
radiation therapy for, 576–577
recurrence of, 678
staging of, 566–567
transvaginal sonography of, 567
Endometriomas, MR imaging of, 609
Endometriosis, and endometrial cancer, 634
Endometrium, in postmenopausal bleeding, 528–531,
546–547, 549
Endovaginal sonography, in postmenopausal
bleeding. See Postmenopausal bleeding.
Epithelial displacement, in core biopsy, of breast
cancer, 493–494
Estrogen replacement therapy, for postmenopausal
bleeding. See Postmenopausal bleeding.
F
Fat necrosis, of breast, resembling recurrent breast
cancer, 514
Fibroepithelial tumors, of breast, core biopsy of, 495
Fibromas, ovarian, MR imaging of, 610
Fine-needle aspiration biopsy, of breast cancer,
434–435, 437
Fistulas, after pelvic surgery, 683–686
Fluorodeoxyglucose, in positron emission
tomography, of breast cancer, 475
G
Germ cell tumors, CT of, 630–632
Granulosa cell tumors
CT of, 630
MR imaging of, 614
Gynecologic imaging, 521–526
of cervical cancer, 522–524 .
See also Cervical cancer.
of endometrial cancer, 521–522 .
See also Endometrial cancer.
of ovarian cancer, 524–525 .
See also Ovarian cancer.
H
Hematomas, after pelvic surgery, 683
Hodgkin’s disease, treatment of, and risk of breast
cancer, 400–401
Human papillomavirus, and vulvar cancer, 660–661
Hysterectomy, for cervical cancer, 669–670
Hysterosonography, in postmenopausal bleeding.
See Postmenopausal bleeding.
I
Intraluminal contrast agents, in MR imaging, of
cervical cancer, 589–590
Intravenous contrast agents, in MR imaging, of
cervical cancer, 590–592
K
Krukenberg tumors, MR imaging of, 632
L
Leiomyomas
and postmenopausal bleeding .
See Postmenopausal bleeding.
MR imaging of, 610
Lobular carcinoma in situ, core biopsy of, 496
Lymph node evaluation, in cervical cancer, 585
Lymphangiography, of vaginal cancer, 651
Lymphoceles, after pelvic surgery, 686
M
Magnetic resonance imaging
after breast-conserving treatment, 508
BI-RADS lexicon for . See BI-RADS lexicon.
Index / Radiol Clin N Am 40 (2002) 681–687684

in patient selection, for breast-conserving
treatment, 502
in postmenopausal bleeding .
See Postmenopausal bleeding.
of abscesses, after pelvic surgery, 683
of adnexal masses . See Adnexal masses.
of breast cancer . See Breast cancer.
of cervical cancer . See Cervical cancer.
of endometrial cancer, 522, 567–568
contrast-enhanced, 568
of endometrial polyps, 549–551
of fistulas, after pelvic surgery, 684–685
of hematomas, after pelvic surgery, 683
of lymphoceles, after pelvic surgery, 686
of postradiation changes, in pelvis, 686,
688–689
of vagina, normal anatomy in, 648
of vaginal cancer, 651–658
of vulvar cancer, 664–665
Mammography, 395–407
accuracy of, 401–404
false-negative interpretations in, 402
false-positive interpretations in, 402–404
observer variability in, 401–402
after breast-conserving treatment, 506–509, 511
to detect local recurrence, 512–514
BI-RADS lexicon for, 409–411
controversies in, 396–399
age to initiate screening, 396–397
decrease in mortality, 396
optimal screening interval, 399
stopping screening, 397–399
digital . See Digital mammography.
in high-risk women under 40, 399–401
proven benefit of, 395
Mesenteric root disease, CT of, 632–633
Metastases
from ovarian cancer, 628–629
to ovaries, 601, 614, 632
benign mimics of, 639–640
Motion artifacts, in MR imaging, of cervical
cancer, 589
Mucinous cystadenocarcinomas, MR imaging
of, 614
N
Nodal spread
by cervical cancer, 677
by ovarian cancer, 628
Non-epithelial ovarian cancer, CT of, 629–632
O
Ovarian cancer
CA-125 levels in, 524, 680
CT of, 524–525
imaging of, clinical role of, 640–642
postoperative changes in, 678–679
CT of, 681–683
MR imaging of, 681–683
recurrence of, 679–680
staging of, 619–646
and treatment planning, 619–622
CT in, 622, 624–626, 628–635, 637–640
benign mimics of metastatic disease,
639–640
calcified tumors, 637–639
complex histology in, 633–634
distant metastases, 628–629
local spread, 625
mesenteric root disease, 632–633
nodal spread, 628
non-epithelial cancer, 629–632
peritoneal spread, 625–626, 628
primary papillary serous peritoneal cancer,
634–635, 637
primary tumor, 622, 624–625
pseudomyxoma peritonei, 639
superior diaphragmatic adenopathy, 632
pathology in, 619
Ovarian fibromas, MR imaging of, 610
Ovaries
metastases to, 601, 614, 632
postradiation changes in, 686
P
Papillary lesions, of breast, core biopsy of,
495–496
Papillary serous carcinoma, of peritoneum, CT of,
634–635, 637
Pelvic exenteration, for cervical cancer, 669–670
Pelvic fat, postradiation changes in, 688
Perirectal tissue, postradiation changes in, 688
Peritoneal spread, by ovarian cancer, 625–626, 628
Phyllodes tumors, of breast, core biopsy of, 495
Plain films
in patient selection, for breast-conserving
treatment, 502–504, 506
of vaginal cancer, 651
Index / Radiol Clin N Am 40 (2002) 681–687 685

Polyps, endometrial, and postmenopausal bleeding,
549–551
Positron emission tomography, of breast cancer,
475, 477
applications of, 475
diagnostic accuracy of, 475
for distant metastases, 475–477
for regional nodal metastases, 475
to monitor treatment, 477
Postmenopausal bleeding, 527–563
Doppler ultrasonography in, 532–533, 535
endometrial biopsy for, 527–528
endometrial cancer in, 555–557
endovaginal sonography and
hysterosonography in, 555
MR imaging in, 556–557
endometrial hyperplasia in, 546–547, 549
endovaginal sonography and
hysterosonography in, 547, 549
MR imaging in, 549
endometrial polyps in, 549–551
endovaginal sonography and
hysterosonography in, 549
MR imaging in, 549–551
endovaginal sonography and hysterosonography
in, 528–532
endometrial morphology in, 529–531
endometrial thickness in, 528–529
techniques for, 557
estrogen replacement therapy for, 535–536
leiomyomas in, 551–555
endovaginal sonography and
hysterosonography in, 553
MR imaging in, 553–555
MR imaging in, 535
techniques for, 558
tamoxifen for, 539–546
endovaginal sonography and
hysterosonography in, 541–543
MR imaging in, 543–546
versus normal endometrium, 535–536
endovaginal sonography and
hysterosonography in, 536–537
MR imaging in, 537–539
Pseudomyxoma peritonei, CT of, 639
R
Radial scars, and risk of breast cancer, 495
Radiation therapy
effects of
on bladder, 686, 688
on bone marrow, 688–689
on ovaries, 686
on pelvic fat and striated muscles, 688
on rectum and perirectal tissue, 688
on uterus, 686
on vagina, 686
for cervical cancer, 672–674
for endometrial cancer, 576–577
Rectum, postradiation changes in, 688
S
Scars, of breast, resembling recurrent breast
cancer, 514
Scintimammography, sestamibi. See Sestamibi
scintimammography.
Serous cystadenocarcinomas, MR imaging of, 614
Sestamibi scintimammography, of breast cancer,
437–438, 477–479
applications of, 478–479
diagnostic accuracy of, 477–478
Sex-cord stromal tumors
CT of, 630
MR imaging of, 614
Sinus tracts, after pelvic surgery, 683–686
Stereomammography, of breast cancer, 472
Stereotactic biopsy, of breast cancer, 483
Striated muscles, postradiation changes in, 688
T
Tamoxifen, for postmenopausal bleeding.
See Postmenopausal bleeding.
Telemammography, of breast cancer, 471–472
Teratomas, CT of, 631
Tomosynthesis, in digital mammography, of breast
cancer, 472
U
Ultrasonography
after breast-conserving treatment, 508
BI-RADS lexicon for . See BI-RADS lexicon.
color Doppler . See Color
Doppler ultrasonography.
Doppler . See Doppler ultrasonography.
Index / Radiol Clin N Am 40 (2002) 681–687686
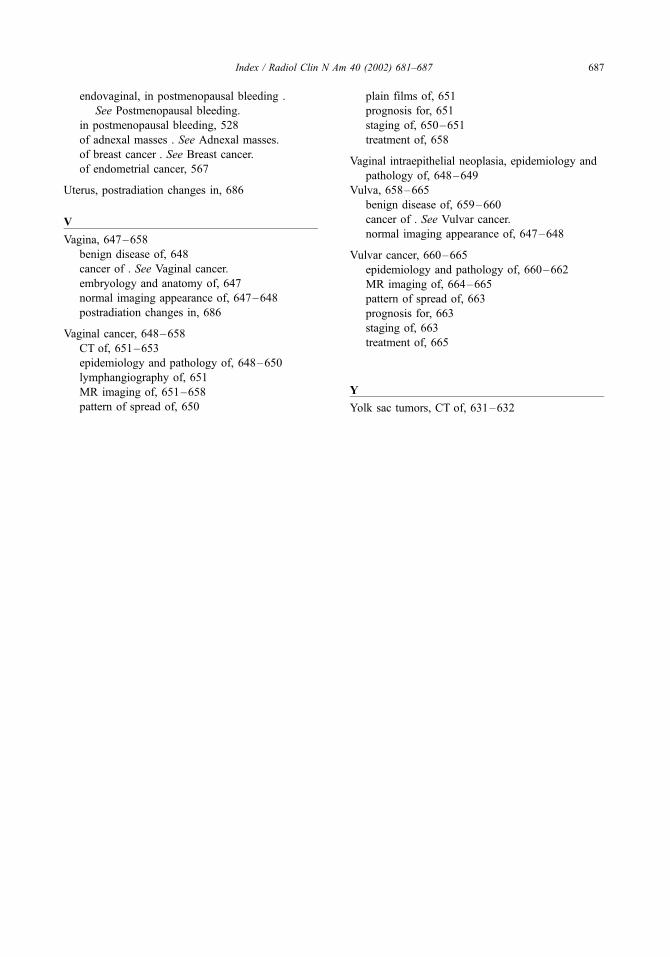
endovaginal, in postmenopausal bleeding .
See Postmenopausal bleeding.
in postmenopausal bleeding, 528
of adnexal masses . See Adnexal masses.
of breast cancer . See Breast cancer.
of endometrial cancer, 567
Uterus, postradiation changes in, 686
V
Vagina, 647–658
benign disease of, 648
cancer of . See Vaginal cancer.
embryology and anatomy of, 647
normal imaging appearance of, 647–648
postradiation changes in, 686
Vaginal cancer, 648–658
CT of, 651–653
epidemiology and pathology of, 648–650
lymphangiography of, 651
MR imaging of, 651–658
pattern of spread of, 650
plain films of, 651
prognosis for, 651
staging of, 650–651
treatment of, 658
Vaginal intraepithelial neoplasia, epidemiology and
pathology of, 648–649
Vulva, 658–665
benign disease of, 659–660
cancer of . See Vulvar cancer.
normal imaging appearance of, 647–648
Vulvar cancer, 660–665
epidemiology and pathology of, 660–662
MR imaging of, 664–665
pattern of spread of, 663
prognosis for, 663
staging of, 663
treatment of, 665
Y
Yolk sac tumors, CT of, 631–632
Index / Radiol Clin N Am 40 (2002) 681–687 687


![Las Colonias Inglesas de Norteamerica[1]](https://static.fdocuments.net/doc/165x107/5571faa1497959916992aef3/las-colonias-inglesas-de-norteamerica1.jpg)