
Radiation products in processed ices relevant to Edgeworth-Kuiper ...
16
RADIATION PRODUCTS IN PROCESSED ICES RELEVANT TO EDGEWORTH-KUIPER-BELT OBJECTS M. H. MOORE 1 , R. L. HUDSON 2 and R. F. FERRANTE 3 1 NASA/Goddard Space Flight Center, Greenbelt, MD 20771, U.S.A. (E-mail: [email protected]); 2 Eckerd College, St. Petersburg, FL 33733, U.S.A. E-mail: [email protected]; 3 US Naval Academy, Annapolis, MD 21402, U.S.A. E-mail: [email protected] Abstract. Near the inner edge of the Edgeworth-Kuiper Belt (EKB) are Pluto and Charon, which are known to have N 2 - and H 2 O-dominated surface ices, respectively. Such non-polar and polar ices, and perhaps mixtures of them, also may be present on other trans-Neptunian objects. Pluto, Charon, and all EKB objects reside in a weak, but constant UV-photon and energetic ion radiation environment that drives chemical reactions in their surface ices. Effects of photon and ion processing include changes in ice composition, volatility, spectra, and albedo, and these have been studied in a number of laboratories. This paper focuses on ice processing by ion irradiation and is aimed at understanding the volatiles, ions, and residues that may exist on outer solar system objects. We summarize radiation chemical products of N 2 -rich and H 2 O-rich ices containing CO or CH 4 , including possible volatiles such as alcohols, acids, and bases. Less-volatile products that could accumulate on EKB objects are observed to form in the laboratory from acid-base reactions, reactions promoted by warming, or reactions due to radiation processing of a relatively pure ice (e.g., CO → C 3 O 2 ). New IR spectra are reported for the 1–5 µm region, along with band strengths for the stronger features of carbon suboxide, carbonic acid, the ammonium and cyanate ions, polyoxymethylene, and ethylene glycol. These six materials are possible contributors to EKB surfaces, and will be of interest to observers and future missions. 1. Introduction A summary of this paper was presented at the First Decadal Review of the Edgeworth- Kuiper-Belt: Towards New Frontiers workshop in Antofagasta, Chile. The work- shop’s focus was to review scientific knowledge of the Edgeworth-Kuiper Belt (EKB); participants included observers, theorists, and experimentalists. The work- shop made clear that the EKB, a reservoir from which short period comets are recruited, is on the verge of further characterization by new surveys; these are ex- pected to dramatically increase the number of known objects in this region. In addi- tion, future missions will target several of these cold icy bodies for a more in-depth examination. Laboratory research directed towards understanding the composition, chemistry, and color of Kuiper Belt objects (KBOs) were workshop topics. A major focus of our own laboratory work is the low-temperature radiation chemistry of ices and the identification of likely products for remote detection. This paper summarizes some of our laboratory results on products identified in Earth, Moon and Planets 92: 291–306, 2003. © 2004 Kluwer Academic Publishers. Printed in the Netherlands.
Transcript of Radiation products in processed ices relevant to Edgeworth-Kuiper ...

RADIATION PRODUCTS IN PROCESSED ICES RELEVANT TOEDGEWORTH-KUIPER-BELT OBJECTS
M. H. MOORE1, R. L. HUDSON2 and R. F. FERRANTE3
1NASA/Goddard Space Flight Center, Greenbelt, MD 20771, U.S.A. (E-mail:[email protected]); 2Eckerd College, St. Petersburg, FL 33733, U.S.A. E-mail:
[email protected]; 3US Naval Academy, Annapolis, MD 21402, U.S.A. E-mail:[email protected]
Abstract. Near the inner edge of the Edgeworth-Kuiper Belt (EKB) are Pluto and Charon, which areknown to have N2- and H2O-dominated surface ices, respectively. Such non-polar and polar ices, andperhaps mixtures of them, also may be present on other trans-Neptunian objects. Pluto, Charon, andall EKB objects reside in a weak, but constant UV-photon and energetic ion radiation environmentthat drives chemical reactions in their surface ices. Effects of photon and ion processing includechanges in ice composition, volatility, spectra, and albedo, and these have been studied in a numberof laboratories. This paper focuses on ice processing by ion irradiation and is aimed at understandingthe volatiles, ions, and residues that may exist on outer solar system objects. We summarize radiationchemical products of N2-rich and H2O-rich ices containing CO or CH4, including possible volatilessuch as alcohols, acids, and bases. Less-volatile products that could accumulate on EKB objectsare observed to form in the laboratory from acid-base reactions, reactions promoted by warming, orreactions due to radiation processing of a relatively pure ice (e.g., CO → C3O2). New IR spectraare reported for the 1–5 µm region, along with band strengths for the stronger features of carbonsuboxide, carbonic acid, the ammonium and cyanate ions, polyoxymethylene, and ethylene glycol.These six materials are possible contributors to EKB surfaces, and will be of interest to observersand future missions.
1. Introduction
A summary of this paper was presented at the First Decadal Review of the Edgeworth-Kuiper-Belt: Towards New Frontiers workshop in Antofagasta, Chile. The work-shop’s focus was to review scientific knowledge of the Edgeworth-Kuiper Belt(EKB); participants included observers, theorists, and experimentalists. The work-shop made clear that the EKB, a reservoir from which short period comets arerecruited, is on the verge of further characterization by new surveys; these are ex-pected to dramatically increase the number of known objects in this region. In addi-tion, future missions will target several of these cold icy bodies for a more in-depthexamination. Laboratory research directed towards understanding the composition,chemistry, and color of Kuiper Belt objects (KBOs) were workshop topics.
A major focus of our own laboratory work is the low-temperature radiationchemistry of ices and the identification of likely products for remote detection.This paper summarizes some of our laboratory results on products identified in
Earth, Moon and Planets 92: 291–306, 2003.© 2004 Kluwer Academic Publishers. Printed in the Netherlands.

292 M. H. MOORE ET AL.
processed H2O- and N2-rich ice mixtures relevant to KBOs. New spectra in the 1–5 µm region for several of the least volatile radiation products are presented alongwith intrinsic band strengths of the more intense features.
Table I lists ices, organics, and complex materials identified on objects locatednear the edge of the solar system. These identifications are described in several re-cent papers. Cruikshank et al. (1998), and Luu et al. (2000), and references therein,reported the detection of H2O-ice on various Centaurs. N2-rich ice containing smallamounts of methane (CH4) and carbon monoxide (CO) was identified on the sur-faces of Pluto and Triton (Cruikshank et al., 1993; Owen et al., 1993). Relativeabundances of N2:CH4:CO on Triton of 100:0.1:0.05 (Quirico et al., 1999) and100:0.5:0.25 on Pluto (Doute et al., 1999) were determined by detailed compar-isons of observations and laboratory spectra. Ice features dominated by H2O, andpossibly containing NH3 absorptions, were detected on Charon (Brown and Calvin,2000; Buie and Grundy, 2000; Dumas et al., 2001). Noll et al., 2000 and Brown etal., 2000, discuss features detected in spectra of several KBOs. For comets, comamolecules arise from the sublimation of H2O-dominated ices. (Ehrenfreund andCharnley, 2000, give an inventory of these volatiles.) Although observing a comet’snucleus is more difficult than observing its coma, broad absorption features at 1.5and 2.05 µm in Hale-Bopp spectra are thought to arise from water ice on thenucleus (Davies et al., 1997). Another cometary nuclear absorption, at 2.39 µm,was measured during the DS-1 encounter with Borrelly and is consistent with C–Hcompounds (Soderblom et al., 2002).
Compositional differences among the icy objects at the edge of the solar systemcan be understood, in part, by variations in temperature, which affect vapor pres-sures, and masses, which affect escape velocities. Surface temperatures of Triton,Pluto, and Charon are in the 30–40 K range, and temperatures of KBOs and cometsbeyond 40 AU are under 30 K. Although Pluto and Triton are cold enough andmassive enough to retain N2, CH4, and CO ices, similar volatiles detected in cometsmust have been trapped in H2O ice. Centaurs are the presumed transition objectsbetween KBOs and short-period comets, and are in unstable orbits in the giantplanet region. Their surfaces are warmer than Triton’s and probably depleted ofN2, CO, and CH4, but they could still preserve these molecules if trapped in anH2O matrix in cooler inner layers.
A common feature among all these objects is their exposure to UV photonsand cosmic ray particles (mostly H+, He+, and O+), which slowly modify thechemistry of surface ices. Estimates of relevant incident fluxes are given in Table I.Johnson (1989) has discussed the results of these processes. UV photons absorbedin the atmospheres of Triton and Pluto can form products that precipitate onto theiricy surfaces, but on surfaces without atmospheres the observed contribution of UVexposure is small. The reason for this is that the UV penetration depth is only∼0.15 µm, compared to the ∼50-µm thickness of ice sampled by IR observations.Turning to particle radiation, Table I gives an approximate energy flux for 1 MeVcosmic rays (CR). From such an estimate, Johnson (1989) calculated a dose of 160
RADIATION PRODUCTS ON EKBOS 293
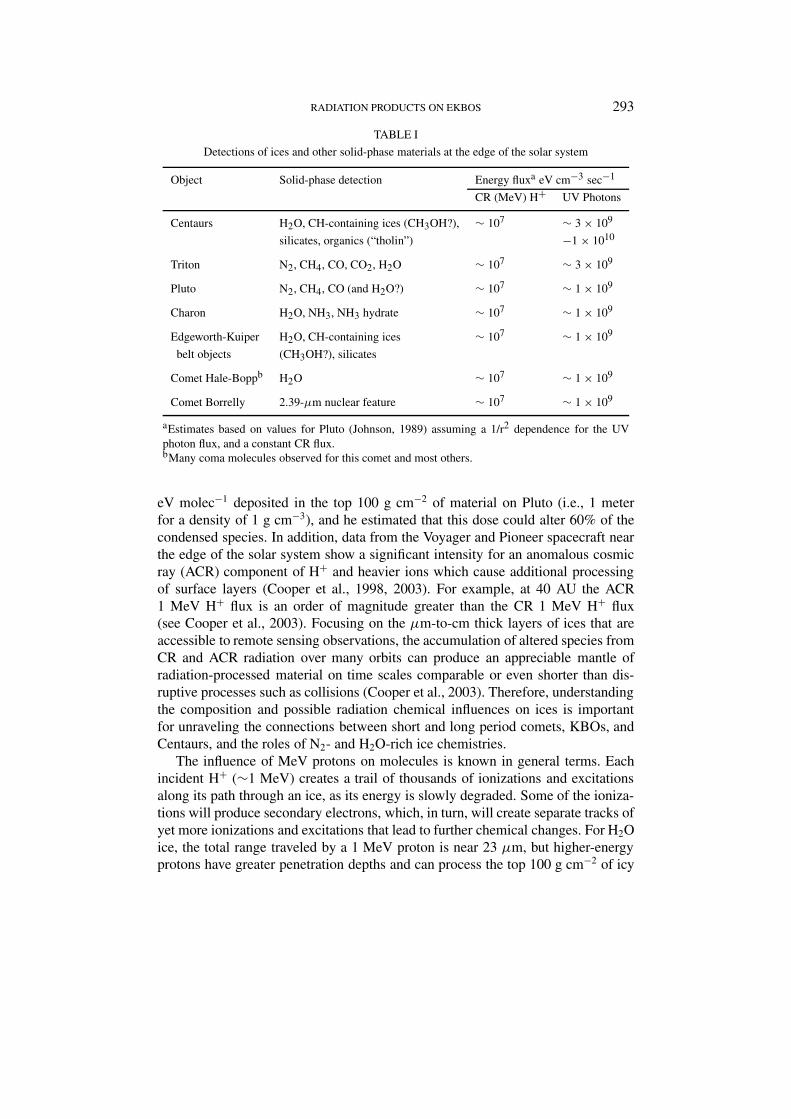
TABLE I
Detections of ices and other solid-phase materials at the edge of the solar system
Object Solid-phase detection Energy fluxa eV cm−3 sec−1
CR (MeV) H+ UV Photons
Centaurs H2O, CH-containing ices (CH3OH?), ∼ 107 ∼ 3 × 10⁹
silicates, organics (“tholin”) −1 × 10¹⁰
Triton N2, CH4, CO, CO2, H2O ∼ 107 ∼ 3 × 10⁹
Pluto N2, CH4, CO (and H2O?) ∼ 107 ∼ 1 × 10⁹
Charon H2O, NH3, NH3 hydrate ∼ 107 ∼ 1 × 10⁹
Edgeworth-Kuiper H2O, CH-containing ices ∼ 107 ∼ 1 × 10⁹
belt objects (CH3OH?), silicates
Comet Hale-Boppb H2O ∼ 107 ∼ 1 × 10⁹
Comet Borrelly 2.39-µm nuclear feature ∼ 107 ∼ 1 × 10⁹
aEstimates based on values for Pluto (Johnson, 1989) assuming a 1/r2 dependence for the UVphoton flux, and a constant CR flux.bMany coma molecules observed for this comet and most others.
eV molec−1 deposited in the top 100 g cm−2 of material on Pluto (i.e., 1 meterfor a density of 1 g cm−3), and he estimated that this dose could alter 60% of thecondensed species. In addition, data from the Voyager and Pioneer spacecraft nearthe edge of the solar system show a significant intensity for an anomalous cosmicray (ACR) component of H+ and heavier ions which cause additional processingof surface layers (Cooper et al., 1998, 2003). For example, at 40 AU the ACR1 MeV H+ flux is an order of magnitude greater than the CR 1 MeV H+ flux(see Cooper et al., 2003). Focusing on the µm-to-cm thick layers of ices that areaccessible to remote sensing observations, the accumulation of altered species fromCR and ACR radiation over many orbits can produce an appreciable mantle ofradiation-processed material on time scales comparable or even shorter than dis-ruptive processes such as collisions (Cooper et al., 2003). Therefore, understandingthe composition and possible radiation chemical influences on ices is importantfor unraveling the connections between short and long period comets, KBOs, andCentaurs, and the roles of N2- and H2O-rich ice chemistries.
The influence of MeV protons on molecules is known in general terms. Eachincident H+ (∼1 MeV) creates a trail of thousands of ionizations and excitationsalong its path through an ice, as its energy is slowly degraded. Some of the ioniza-tions will produce secondary electrons, which, in turn, will create separate tracks ofyet more ionizations and excitations that lead to further chemical changes. For H2Oice, the total range traveled by a 1 MeV proton is near 23 µm, but higher-energyprotons have greater penetration depths and can process the top 100 g cm−2 of icy

294 M. H. MOORE ET AL.
surface material. In addition, secondary nuclear and electromagnetic showers fromCR or ACR can penetrate tens of meters.
Although the molecules in Table I are relatively simple, quantitative predictionsof their responses to radiation are difficult. For this reason, laboratory experimentscontinue to provide the ground truth that documents radiation-induced chemicalchanges. Here we first summarize our laboratory IR studies, from 2.5–25 µm, ofsome irradiated ices (H2O and N2 ices containing CO and CH4) relevant to thesurfaces of outer solar system objects. Results from these experiments show whichions and molecules are detectable at different temperatures. The bulk of this paperthen follows, and focuses on new IR spectra, from 1–5 µm, of several relativelyinvolatile species that may be KBO surface materials. Intrinsic band strengths aregiven for many of the stronger IR features.
2. Experimental Methods
Details of our experimental set-up, ice preparation, IR spectral measurements,cryostat, and proton beam source have been published (Moore and Hudson, 1998,2000; Hudson and Moore, 1995). In summary, ice samples were formed by con-densation of gas-phase mixtures onto a pre-cooled aluminum mirror at 10–20 K.Two spectrometers allowed measurements from 1–5 µm (Brucker spectrometer)and from 2.5–25 µm (Mattson spectrometer). Figure 1 is a schematic that repres-ents the design of both set-ups. Most ice films examined between 1 and 5 µm weretens of microns thick, as determined by a laser interference fringe system. Spectrawere measured as a function of temperature (12–300 K) in some experiments.
IR spectra were recorded before and after exposure of ices to a 0.8 MeV protonbeam from a Van de Graaff accelerator. The use of proton irradiation to simulatecosmic-ray bombardment has been discussed in other papers (e.g., Hudson andMoore, 2001; Moore et al., 1983). Three ice experiments (NH3 + HCl, NH3 +HNCO, and NH3 + H2CO) involved no irradiation because the desired productsformed during warming. Several band strengths (either A values or cross sections)are reported for the first time. Some of these were calculated by scaling previously-published values, based on the relative areas of our spectral bands compared tothe area of a previously-measured band. For ethylene glycol, A((CH2OH)2) wasmeasured using an injection technique to form different thicknesses of H2O +(CH2OH)2, following a procedure described in Moore and Hudson (2000).
Carbon suboxide, C3O2, was generated by a method described by Gerakinesand Moore (2001). HNCO was synthesized by the reaction of NaOCN powder(Aldrich Chemical, 96%) with HCl gas (Aldrich Chemical 99+%), and purifiedby distillation from an ethanol/liquid nitrogen slush bath. Formaldehyde (H2CO)was the gas released during the warming of paraformaldehyde. Ethylene glycol,(CH2OH)2, was from Fisher Scientific, certified. Other reagents used were the samepurity as those referenced by Cottin et al. (2003).

RADIATION PRODUCTS ON EKBOS 295
Figure 1. Schematic of laboratory set-up.
3. Radiation Products in H2O and N2 Ices Containing CO and CH4
3.1. H2O-RICH ICES
A summary of products from processed H2O-rich ices, containing either CO orCH4, is included here for completeness. These mixtures are relevant to both cometsand KBOs. Hudson and Moore (1999) examined H2O + CO ices to follow thelow-temperature, solid-phase sequence CO → H2CO → CH3OH. We showedthat H2CO and CH3OH formed with greater abundances than reported by othercondensed-phase processes (UV-photolysis and discharge experiments). Radiation-processed ices had a ratio CH3OH/H2CO ∼ 1.7, which is near the value of 2

296 M. H. MOORE ET AL.
observed for comets and interstellar ices. Spectral studies of the radiation chemistryof H2O + CH4 ices (Moore and Hudson, 1998) were motivated by the discovery ofabundant C2H6 in comet C/1996 B2 Hyakutake by Mumma et al. (1996). The roleof CH4 for C2H6 formation in irradiated icy mixtures was examined. A summaryof the radiation products we identified is given in Table II, which also lists specieswhose spectral signatures were still present as ices were warmed to ∼100 K.
3.2. N2-RICH ICES
We also have recently published IR (2.5–25 µm) studies of proton irradiated N2-dominated ices (Moore and Hudson, 2003). Mixtures of N2 + CH4, N2 + CO,and N2 + CH4 + CO are relevant to ices identified on Pluto and Triton. Productsformed during irradiation at 10–20 K were identified as HCN, HNC, NH3, HN3,OCN−, and CH2N2 (diazomethane). The evolution and stability of these productswere followed during warming to ∼35 K, where OCN−, CN−, N−
3 , and NH+4 were
identified. We expect that similar species exist on the surfaces of Triton, Pluto, andperhaps KBOs. Even with further warming, all of these ions were detectable at 100K. These results are summarized in Table II.
4. Spectra (1–5 µm) and Band Strengths of Products ObservedAbove ∼100 K
In this section we show 1–5 µm spectra of some of the more stable radiationproducts and give peak positions for many of the weaker absorption bands. Theseweaker features can include both overtone and combination bands, which we willrefer to as overtones in the following sections. Selection of these products is basedon results shown in Table II. Four identified products present at 100 K are: carbonsuboxide (C3O2), carbonic acid (H2CO3), and the ammonium (NH+
4 ) and cyanate(OCN−) ions. Also included for study are polyoxymethylene (POM or (H2CO)n)and ethylene glycol ((CH2OH)2), because these are stable radiation end-products ofmolecules observed in irradiated H2O-rich ices (H2CO and CH3OH, respectively).
4.1. CARBON SUBOXIDE (C3O2)
Irradiation of pure CO ice at 20 K forms CO2, C2O, and C3O2, the latter beingthe least volatile of the three. Figure 2 shows the 1–5 µm spectrum of C3O2 at 10K compared to the spectrum of pure unirradiated CO at 10 K (shown truncated atthe bottom of the figure). The C3O2 spectrum from 1–4 µm was measured usinga 50-µm thick ice, compared to a 5-µm thick ice for the strong 4.55 µm feature.An expansion shows weak features at 2.19, 2.29, and 2.34 µm after removal of theunderlying channel fringe pattern. A recent study by Gerakines and Moore (2001)discussed the formation and stability of carbon suboxide in proton-irradiated andUV-photolyzed ices. That work included the C3O2 IR spectrum from 2.0–25 µm,
RADIATION PRODUCTS ON EKBOS 297
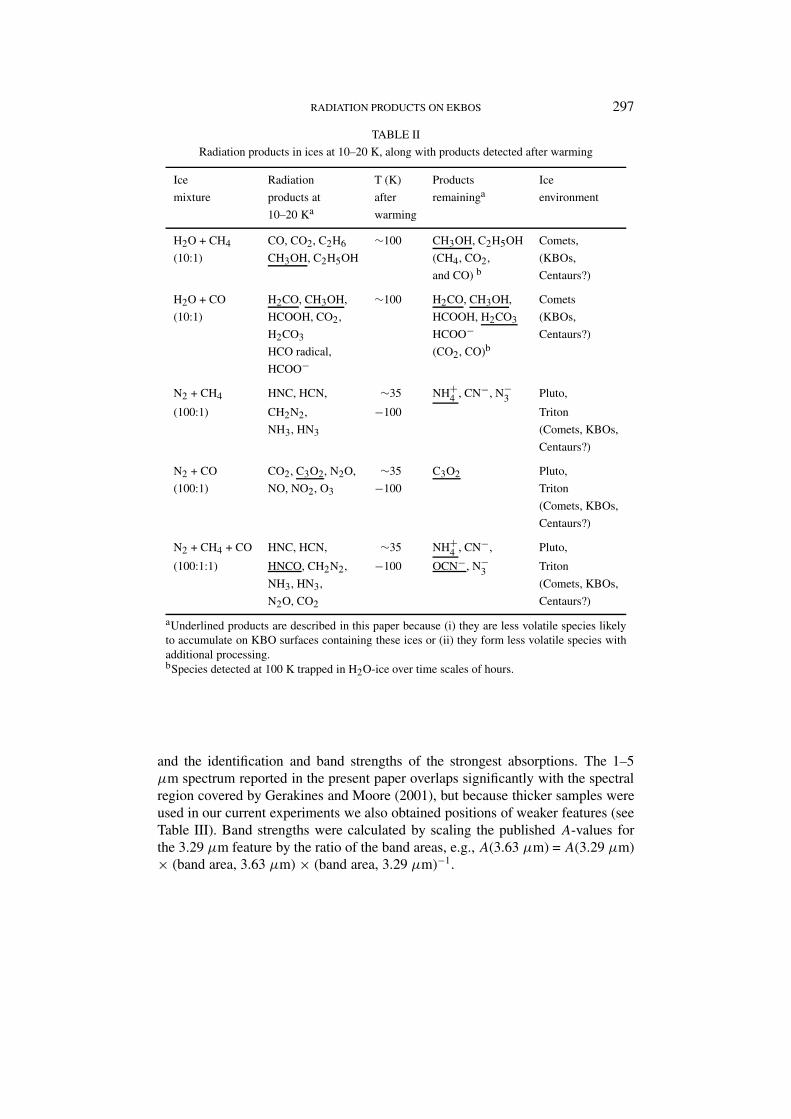
TABLE II
Radiation products in ices at 10–20 K, along with products detected after warming
Ice Radiation T (K) Products Ice
mixture products at after remaininga environment
10–20 Ka warming
H2O + CH4 CO, CO2, C2H6 ∼100 CH3OH, C2H5OH Comets,
(10:1) CH3OH, C2H5OH (CH4, CO2, (KBOs,
and CO) b Centaurs?)
H2O + CO H2CO, CH3OH, ∼100 H2CO, CH3OH, Comets
(10:1) HCOOH, CO2, HCOOH, H2CO3 (KBOs,
H2CO3 HCOO− Centaurs?)
HCO radical, (CO2, CO)b
HCOO−
N2 + CH4 HNC, HCN, ∼35 NH+4 , CN−, N−
3 Pluto,
(100:1) CH2N2, −100 Triton
NH3, HN3 (Comets, KBOs,
Centaurs?)
N2 + CO CO2, C3O2, N2O, ∼35 C3O2 Pluto,
(100:1) NO, NO2, O3 −100 Triton
(Comets, KBOs,
Centaurs?)
N2 + CH4 + CO HNC, HCN, ∼35 NH+4 , CN−, Pluto,
(100:1:1) HNCO, CH2N2, −100 OCN−, N−3 Triton
NH3, HN3, (Comets, KBOs,
N2O, CO2 Centaurs?)
aUnderlined products are described in this paper because (i) they are less volatile species likelyto accumulate on KBO surfaces containing these ices or (ii) they form less volatile species withadditional processing.bSpecies detected at 100 K trapped in H2O-ice over time scales of hours.
and the identification and band strengths of the strongest absorptions. The 1–5µm spectrum reported in the present paper overlaps significantly with the spectralregion covered by Gerakines and Moore (2001), but because thicker samples wereused in our current experiments we also obtained positions of weaker features (seeTable III). Band strengths were calculated by scaling the published A-values forthe 3.29 µm feature by the ratio of the band areas, e.g., A(3.63 µm) = A(3.29 µm)× (band area, 3.63 µm) × (band area, 3.29 µm)−1.

298 M. H. MOORE ET AL.
TABLE III
Band positions and strengthsa
Species Position (µm) Band strength Fig. No. Ref.
Carbon suboxide T < 20 K (T = 250 K) 10−18 cm molec−1
C3O2 2.19 (2.20) 0.02b
2.29 (2.29) 0.032.34 0.0012.67 (2.66) 3.8, 2.0 (a)2.763.00 (2.99) 23.29 (3.30) 6 (a)3.63 (3.63) 0.063.75 (3.75) 0.094.17 8 (a)4.55 130 (a)4.664.74 (a)
Carbonic acid (T = 250 K) 10−18 cm molec−1
H2CO3 (3.49) 33.81 (3.82) 160 (155) (b)
Ammonium (T = 250 K) 10−18 cm molec−1 (c)NH+
4 (2.21) 0.15(2.24) 0.07 4, 5(3.2) 26(3.3) 37(3.5)
Cyanate OCN− T < 20 K (T = 250 K) 10−18 cm molec−1
4.617 (4.610) 20 5 (d)
Polyoxymethylene (T ≥ 200 K) 10−20 cm2 (C-atom)−1
POM (2.24) 0.6(H2CO)n (3.36) 4.5 6 (e)
(3.42) 6.0 (e)(3.58) 0.85 (e)
Ethylene glycol T < 20 K (T = 100 K) 10−18 cm molec−1
(CH2OH)2 2.29 (2.29) 0.12.48 (2.48) 0.25 73.40 (3.40)3.48 (3.48)
aData in parentheses were recorded at the higher temperatures. Data in bold are new values whereasdata not in bold are from the literature as referenced.bValues based on A = 6 × 10⁻¹⁸ cm molec−1 for 3.29 µm band.Reference: (a) Gerakines and Moore (2001); (b) Gerakines et al. (2000); (c) Average value for 6.96mm band is 30 × 10−18 cm molec−1 based on: d’Hendecourt and Allamandola (1986); Grim andGreenberg (1987); Demyk et al. (1998); R. K. Khanna (2003, private communication); (d) Averagebased on Grim et al. (1989), Demyk et al. (1998), Keane (1997), and R. K. Khanna (2003, privatecommunication); (e) Schutte et al. (1993).

RADIATION PRODUCTS ON EKBOS 299
Figure 2. Spectrum of carbon suboxide (C3O2) from 1—5 µm at T < 20 K. The region from 1—4µm is shown vertically expanded by a factor of ∼7. Additional expansion around 2.2 µm (upper left)reveals several weak overtone bands. For comparison, the lower truncated spectrum shows pure COice at T < 20 K. (The 2.70-µm feature is H2O contamination.)
4.2. CARBONIC ACID (H2CO3)
Irradiation of the two-component ice H2O + CO2 at 10–20 K forms CO, H2O2, O3,and H2CO3, the last being the least volatile species. Figure 3 compares the 1–5 µmspectrum of pure H2CO3 at 250 K with the truncated spectrum of unirradiated H2O+ CO2 (10:1) at ∼20 K. Previous IR (2.5–25 µm) studies of H2CO3 formation,stability, and A-values can be found in Moore and Khanna (1991), DelloRussoet al. (1993), and Gerakines et al. (2000). The IR spectrum of H2CO3 also hasbeen identified in pure CO2 ices implanted with H+ (Brucato et al., 1997). No newH2CO3 features were found in the 1–2.5 µm region within the limits of detection.The A-value for the 3.82 µm band at 250 K was calculated from the 18 K valuepublished in Gerakines et al. (2000) in a manner similar to that described above:A(3.82 µm, 250 K) = A (3.81 µm, 18 K) × (band area 3.82 µm, 250 K) × (bandarea 3.81 µm, 18 K)−1.
4.3. AMMONIUM CHLORIDE (NH4Cl)
Figure 4 shows the 1–5 µm spectrum of NH4Cl, made by simultaneously condens-ing (from separate deposit tubes) NH3 and HCl at ∼20 K, and then warming to 250

300 M. H. MOORE ET AL.
Figure 3. Spectrum of carbonic acid (H2CO3) at 250 K. This molecule is a dominant product afterion irradiation of H2O + CO2 ice, and is less volatile than H2O. For comparison, the spectrum ofunirradiated H2O + CO2 is shown (truncated) at the bottom.
K. The spectrum of pure NH3 at 120 K is given for comparison, while HCl’s onlyabsorption in this region is at 3.6 µm (arrow). Strong, well-defined peaks at 3.20and 3.28 µm, and a less-defined one at 3.52 µm, are due to the ammonium ion(NH+
4 ). An expansion in the 2.0–2.3 µm region shows weaker NH+4 bands at 2.21
and 2.24 µm, and is compared to the same region for pure NH3 at 120 K. PreviousIR studies involving NH+
4 have focused on the 6.96 µm feature (e.g., Grim et al.,1989; Demyk et al., 1998; Keane 1997; Khanna, 2003, private communication).A-values in Table III were calculated for bands in the 1–5 µm region by scalingthe average reported values for the 6.96 µm band (30 × 10−18 cm molec−1) withthe ratio of the band areas, as described earlier.
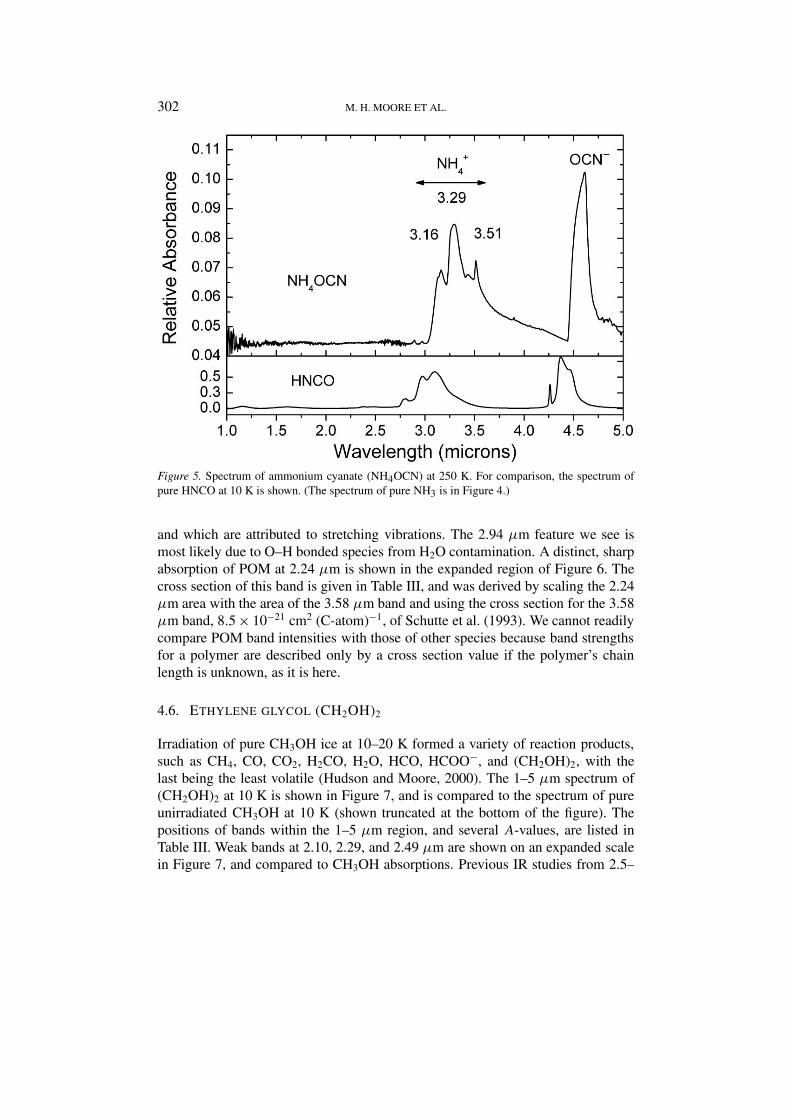
4.4. AMMONIUM CYANATE (NH4OCN)
The IR spectrum of NH4OCN from 1–5 µm at 250 K, compared to the truncatedspectrum of pure HNCO at 10 K, is shown in Figure 5. Acid-base reactions werepromoted on warming NH3 + HNCO (reactants condensed simultaneously fromseparate deposit tubes), and the formation of NH+
4 and OCN− occurred. The am-monium ion features at 3.16, 3.29, and 3.51 µm are broader than those of NH4Clshown in Figure 4, but show the same relative band areas. Previous IR (2.5–25

RADIATION PRODUCTS ON EKBOS 301
Figure 4. Spectrum of ammonium chloride (NH4Cl) at 250 K. For comparison, the spectrum of pureNH3 at 120 K is shown, and the position of the fundamental vibration of HCl is indicated with anarrow at 3.6 µm. Weaker overtone bands of NH+
4 are evident in the expanded view (uppermost trace)and can be compared to those of NH3 (lower).
µm) studies of OCN− formation, its stability, and its A-value can be found inGrim and Greenberg (1987), d’Hendecourt and Allamandola (1986), and Hudsonet al. (2001). In our 1–5 µm spectrum, the large OCN− band at 4.61 µm was theonly anion absorption feature found within our limits of detection. Weaker NH+
4overtone bands were not observed since the sample’s thickness was an order ofmagnitude less than that for Figure 4.
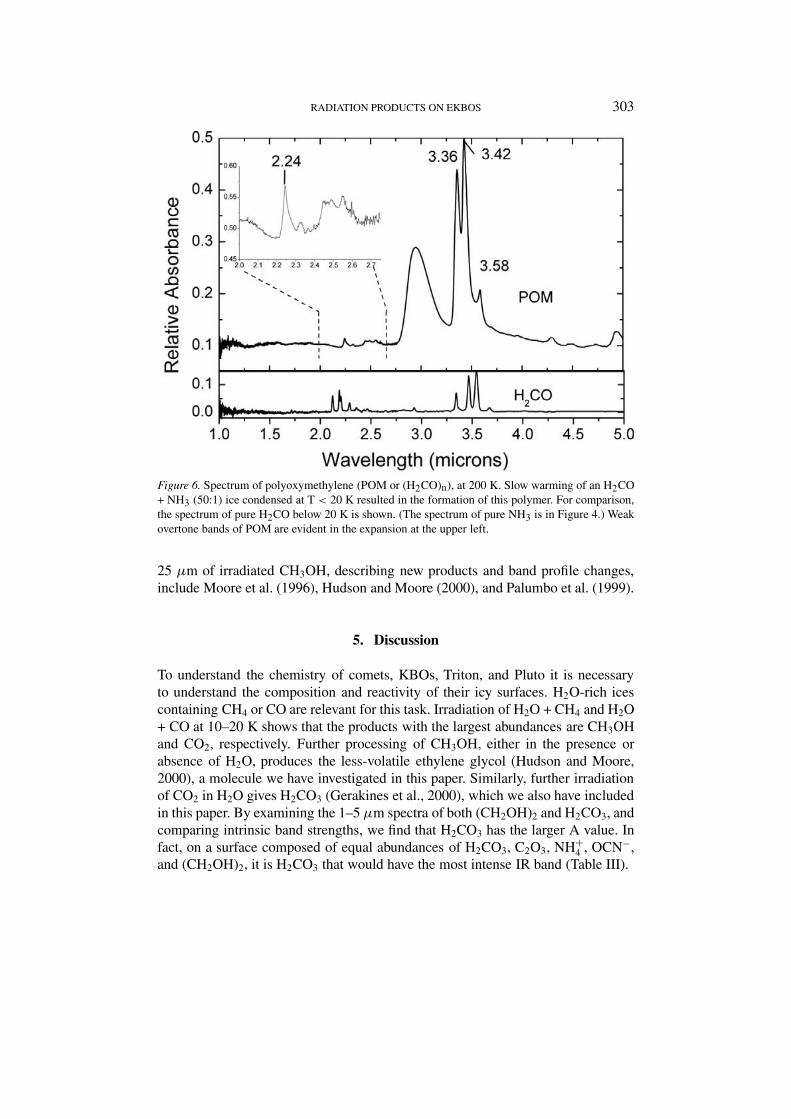
4.5. POLYOXYMETHYLENE ((H2CO)n)
Schutte et al. (1993) showed that reactions during warming an ice mixture of H2CO+ NH3 (where the H2CO/NH3 ratio is 50) produces polyoxymethylene (POM or(H2CO)n). We used this technique to produce the 1–5 µm spectrum of POM at200 K shown in Figure 6. For comparison, the spectrum of pure H2CO at 20 K isat the bottom of Figure 6 (the NH3 spectrum is in Figure 4). An alternate methodfor making POM (without warming in the presence of NH3) is the irradiation ofpure H2CO ice at 20 K. On irradiation, pure H2CO ice forms CO, CO2, HCO,and POM, the last being the least volatile species. The spectrum of POM fromirradiated H2CO is not presented in this paper. Our IR spectrum of POM has bandsat 3.36, 3.42, and 3.58 µm which agree with those reported by Schutte et al. (1993),
302 M. H. MOORE ET AL.
Figure 5. Spectrum of ammonium cyanate (NH4OCN) at 250 K. For comparison, the spectrum ofpure HNCO at 10 K is shown. (The spectrum of pure NH3 is in Figure 4.)
and which are attributed to stretching vibrations. The 2.94 µm feature we see ismost likely due to O–H bonded species from H2O contamination. A distinct, sharpabsorption of POM at 2.24 µm is shown in the expanded region of Figure 6. Thecross section of this band is given in Table III, and was derived by scaling the 2.24µm area with the area of the 3.58 µm band and using the cross section for the 3.58µm band, 8.5 × 10⁻²¹ cm2 (C-atom)−1, of Schutte et al. (1993). We cannot readilycompare POM band intensities with those of other species because band strengthsfor a polymer are described only by a cross section value if the polymer’s chainlength is unknown, as it is here.
4.6. ETHYLENE GLYCOL (CH2OH)2
Irradiation of pure CH3OH ice at 10–20 K formed a variety of reaction products,such as CH4, CO, CO2, H2CO, H2O, HCO, HCOO−, and (CH2OH)2, with thelast being the least volatile (Hudson and Moore, 2000). The 1–5 µm spectrum of(CH2OH)2 at 10 K is shown in Figure 7, and is compared to the spectrum of pureunirradiated CH3OH at 10 K (shown truncated at the bottom of the figure). Thepositions of bands within the 1–5 µm region, and several A-values, are listed inTable III. Weak bands at 2.10, 2.29, and 2.49 µm are shown on an expanded scalein Figure 7, and compared to CH3OH absorptions. Previous IR studies from 2.5–
RADIATION PRODUCTS ON EKBOS 303
Figure 6. Spectrum of polyoxymethylene (POM or (H2CO)n), at 200 K. Slow warming of an H2CO+ NH3 (50:1) ice condensed at T < 20 K resulted in the formation of this polymer. For comparison,the spectrum of pure H2CO below 20 K is shown. (The spectrum of pure NH3 is in Figure 4.) Weakovertone bands of POM are evident in the expansion at the upper left.
25 µm of irradiated CH3OH, describing new products and band profile changes,include Moore et al. (1996), Hudson and Moore (2000), and Palumbo et al. (1999).
5. Discussion
To understand the chemistry of comets, KBOs, Triton, and Pluto it is necessaryto understand the composition and reactivity of their icy surfaces. H2O-rich icescontaining CH4 or CO are relevant for this task. Irradiation of H2O + CH4 and H2O+ CO at 10–20 K shows that the products with the largest abundances are CH3OHand CO2, respectively. Further processing of CH3OH, either in the presence orabsence of H2O, produces the less-volatile ethylene glycol (Hudson and Moore,2000), a molecule we have investigated in this paper. Similarly, further irradiationof CO2 in H2O gives H2CO3 (Gerakines et al., 2000), which we also have includedin this paper. By examining the 1–5 µm spectra of both (CH2OH)2 and H2CO3, andcomparing intrinsic band strengths, we find that H2CO3 has the larger A value. Infact, on a surface composed of equal abundances of H2CO3, C2O3, NH+
4 , OCN−,and (CH2OH)2, it is H2CO3 that would have the most intense IR band (Table III).

304 M. H. MOORE ET AL.
Figure 7. Spectra of ethylene glycol ((CH2OH)2) and CH3OH, both samples at T < 20 K. Expansionof the 2.5-µm region reveals weak overtone bands of both (CH2OH)2 and CH3OH.
Carbonic acid and methanol are not the only products found in irradiated H2O+ CO and H2O + CH4 ices. Less abundant products are formed and can remaintrapped in the H2O, even on warming to 100 K. Such products include ethanol(C2H5OH), formic acid (HCOOH), formaldehyde (H2CO), and ethane (C2H6).
Because as much as 19% of the total carbon in H2O + CO ice can be convertedto H2CO by irradiation (Hudson and Moore, 1999), we also have examined theradiation processing of H2CO, which leads to a less-volatile molecule, POM. It isalso possible to form this polymer through thermally-promoted reactions of H2COin the presence of NH3. Since POM has been suggested as a candidate to explainmass spectra taken by Giotto near comet Halley (Huebner, 1987), the study of thispolymer is important.
Irradiated N2-rich ices containing CO and CH4 are relevant for understandingthe surfaces of Triton and Pluto. The radiation products expected to form andsurvive on these surfaces are anions (OCN−, CN−, and N−
3 ) associated with thecation, NH+
4 . For this reason we investigated the 1–5 µm spectra of both NH4Cland NH4OCN. The 4.6-µm band was the only detected OCN− absorption. It is agood candidate for future observations because it is moderately intense and liesin a region not obscured by H2O bands. The strongest NH+
4 bands lie within theintense 3.1-µm feature of H2O. The weak NH+
4 overtones in the 2.0–2.2 µm region

RADIATION PRODUCTS ON EKBOS 305
become good candidates for new observations, although the 2.2-µm absorption isclose to one of the weak NH3 overtones, as seen in Figure 4.
The possibility of terrains on Pluto and Triton with varying concentrations ofCO, CH4, and N2 led us to also investigate the conversion of pure CO into C3O2
during irradiation. Brownish-red in color, C3O2 has been proposed as a possiblesurface colorant for cometary nuclei (Huntress et al., 1991). In the 1–5 µm regionit has a very strong feature at 4.55 µm, along with many weaker overtone bands.
Each of the six species listed in Table III can be formed in irradiated ices. In theabsence of evidence for thermal processing, all six could be markers for radiationprocessing. POM, NH+
4 , and OCN− also can form during thermal processing ofices containing the reactants for acid-base reactions or NH3-catalyzed reactions.Since there is no known reasonable thermal, catalytic, or acid-base processing thatcould explain the presence of C3O2, H2CO3, and (CH2OH)2 in outer solar systemices, these three molecules are reliable markers for radiation-induced chemistry.
Future laboratory work will include careful studies of band profiles at differenttemperatures for these six ions and molecules, along with other possible surfacespecies. Such spectra are important for determining if any characteristic profilesexist that can be used as temperature markers (e.g., the 1.65 µm band of crystallinewater ice). In addition, more work needs to be done before some of these spe-cies can be distinguished from more abundant molecules. For example, it may bedifficult to discriminate between CH3OH and (CH2OH)2. Similarly, the differencebetween NH+
4 and NH3 may require more work, especially if NH3-hydrates areconsidered.
Acknowledgements
The authors acknowledge NASA support through NASA’s Laboratory for Planet-ary Atmospheres and SARA Programs. The authors thank Steve Brown and ClaudeSmith, members of the Radiation Laboratory at NASA/Goddard, for operation ofthe accelerator. RLH acknowledges support from NASA Grant NAG-5-1843.
References
Brown, M. E. and Calvin, W. M.: 2000, Science 287, 107–109.Brown, M. E., Blake, G. A., and Kessler, J. E.: 2000, ApJ 543, L163–L165.Brucato, J. R., Palumbo, M. E., and Strazzulla, G.: 1997, Icarus 125, 135–144.Buie, M. W. and Grundy, W. M.: 2000, Icarus 148, 324–239.Cooper, J. F. Christian, E. R., and Johnson, R. E.: 1998, Adv. Space Res. 21, 1611–1614.Cooper, J. F., Christian, E. R., and Johnson, R. E.: 2003 (this volume).Cottin, H., Moore, M. H., and Benilan, Y.: 2003, ApJ 561, L139–L142.Cruikshank, D. P., Roush, T. L., Owen, T. C., Geballe, T. R., de Bergh, C., Schmitt, B., Geballe, T.
R., and Barthlomew, M. J.: 1993, Science 261, 742–745.

306 M. H. MOORE ET AL.
Cruikshank, D. P., Roush, T. L., Bartholomew, M. J., Geballe, T. R., Pendleton, Y. J., White, S. M.,Bell III, J. F., Davies, J. K., Owen, T. C., de Bergh, C., Tholen, D. J., Bernstein, M. P., and Brown,R. H.: 1998, Icarus 135, 389–407.
Davies, J. K., Roush, T. L., Cruikshank, D. P., Bartholomew, M. J., Geballe, T. R., Owen, T., and deBergh, C.: 1997, Icarus 127, 238–245.
DelloRusso N., Khanna, R. K., and Moore M. H.: 1993, J. Geophys. Res. 98, 5505–5510.Demyk, K. Dartois, E., d’Hendecourt, L., Jourdain de Muizon, M., Heras, A. M., and Breitfellner,
M.: 1998, Astron. Astrophys. 339, 553–560.d’Hendecourt, L. B. and Allamandola, L. J.: 1986, Astron. Astrophys. Supp. Ser. 64, 453–467.Doute, S., Schmitt, B., Quirico, E., Owen, T. C., Cruikshank, D. P., de Bergh, C., Geballe, T. R., and
L. Roush, T.: 1999, Icarus 142, 421–444.Dumas, C., Terrile, R. J., Brown, R. H., Schneider, G., and Smith, B. A.: 2001, ApJ 121, 1163–1170.Ehrenfreund, P. and Charnley, S. B: 2000, Ann. Rev. Astron. Astrophys. 38, 427–483.Gerakines, P. A. and Moore, M. H.: 2001, Icarus 154, 372–280.Gerakines, P. A., Moore, M. H., and Hudson, R. L.: 2000, Astron. Astrophys. 357, 793–800.Grim, R. J. A. and Greenberg, J. M.: 1987, ApJ 321, L91–L96.Grim, R. J. A., Greenberg, J. M., deGroot, M. S., Baas, F., Schutte, W. A., and Schmitt, B.: 1989,
Astron. Astrophys. Suppl. Ser. 78, 161–186.Hudson, R. L. and Moore, M. H.: 1995, Rad. Phys. and Chem. 45, 779–789.Hudson, R. L. and Moore, M. H.: 1999, Icarus 140, 451–461.Hudson, R. L. and Moore, M. H.: 2000, Icarus 145, 661–663.Hudson, R. L., and Moore, M. H.: 2001, J. Geophys. Res. – Planets 106, 33275–33284.Hudson, R. L., Moore, M. H., and Gerakines, P. A.: 2001, ApJ. 550, 1140–1150.Huebner, W. F.: 1987, Science 237, 628–630.Huntress, W. T. Jr., Allen, M., and Delitsky, M.: 1991, Nature 352, 316–318.Johnson, R. L.: 1989, Geophys. Res. Lett. 16, 1233–1236.Keane, J. V.: 1997, ‘Laboratory Simulation of Interstellar Ices Containing Cyanic Acid Isomers’, MS
Thesis, Leiden University.Luu, J. X., Jewitt, D. C., and Trujillo, C.: 2000, ApJ 531, L151–L154.Moore, M. H. and Hudson R. L.: 1998, Icarus 135, 518–527.Moore, M. H. and Hudson R. L.: 2000, Icarus 145, 282–288.Moore, M. H. and Hudson, R. L.: 2003, Icarus 161, 486–500.Moore, M. H. and Khanna, R. K.: 1991, Spectrochim. Acta 47A, 255–262.Moore, M. H., Donn, B., Khanna, R. K., and A’Hearn, M. F.: 1983, Icarus 54, 388–405.Moore, M. H., Ferrante, R. F., and Nuth III, J. A.: 1996, Planetary and Space Science 44, 927–935.Mumma, M. J., DiSanti, M. A., DelloRusso, N. Fomenkova, M. Magee-Sauer, K., Kaminski, C. D.,
and Xie, D. X.: 1996, Science 272, 1310–1314.Noll, S. K., Luu, J., and Gilmore, D.: 2000, ApJ 119, 970–976.Owen, T. C., Roush, T. L., Cruikshank, D. P., Elliot, J. L., Young, L. A. deBergh, C., Schmitt, B.,
Geballe, T. R., Brown, R. H., and Bartholomew, M. J.: 1993, Science 261, 745–748.Palumbo, M. E., Castorina, A. C., and Strazzulla, G.: 1999, Astron. Astrophys. 342, 551–562.Quirico, E., Doute, S., Schmitt, B., deBergh, C., Cruikshank, D. P., Owen, T. C., Geballe, T. R., and
Roush, T. L.: 1999, Icarus 139, 159–178.Schutte, W. A., Allamandola, L. J., and Sandford, S. A.: 1993, Icarus 104, 118–137.Soderblom, L. A., Becker, L., Bennett, G., Boice, D. C., Britt, D. T., Brown, R. H., Buratti, B. J.,
Isbell, C., Giese, B., Hare, T., Hicks, M. D., Howington-Kraus, E., Kirk, R. L., Lee, M., Nelson,R. M., Oberst, J., Owen, T., Rayman, M. D., Sandel, B. R., Stern, S. A., Thomas, N., and Yelle,R. V.: 2002, Science 296, 1087–1091.