Radiation doses for barium meals and barium enemas in the ...
111
Cape Peninsula University of Technology Digital Knowledge CPUT Theses & Dissertations Theses & Dissertations 1-1-2009 Radiation doses for barium meals and barium enemas in the Western Cape South Africa Caroline Nabasenja CPUT, [email protected] This Text is brought to you for free and open access by the Theses & Dissertations at Digital Knowledge. It has been accepted for inclusion in CPUT Theses & Dissertations by an authorized administrator of Digital Knowledge. For more information, please contact [email protected]. Recommended Citation Nabasenja, Caroline, "Radiation doses for barium meals and barium enemas in the Western Cape South Africa" (2009). CPUT Theses & Dissertations. Paper 122. http://dk.cput.ac.za/td_cput/122
Transcript of Radiation doses for barium meals and barium enemas in the ...
Cape Peninsula University of TechnologyDigital Knowledge
CPUT Theses & Dissertations Theses & Dissertations
1-1-2009
Radiation doses for barium meals and bariumenemas in the Western Cape South AfricaCaroline NabasenjaCPUT, [email protected]
This Text is brought to you for free and open access by the Theses & Dissertations at Digital Knowledge. It has been accepted for inclusion in CPUTTheses & Dissertations by an authorized administrator of Digital Knowledge. For more information, please contact [email protected].
Recommended CitationNabasenja, Caroline, "Radiation doses for barium meals and barium enemas in the Western Cape South Africa" (2009). CPUT Theses& Dissertations. Paper 122.http://dk.cput.ac.za/td_cput/122
- i -
RADIATION DOSES FOR BARIUM MEALS AND BARIUM ENEMAS IN THE WESTERN CAPE SOUTH AFRICA by CAROLINE NABASENJA Thesis submitted in fulfilment of the requirements for the award of the degree of Master of Technology Radiography (Diagnostic) in the Faculty of Health and Wellness Sciences at the Cape Peninsula University of Technology Supervisors: Mrs F Davidson Prof P C Engel-Hills Dr T Kotze Submitted at Bellville campus on September 15, 2009
- ii -
DECLARATION
I, Caroline Nabasenja, declare that the contents of this thesis represent my own unaided work, and that the thesis has not previously been submitted for academic examination towards any qualification. Furthermore, it represents my own opinions and not necessarily those of the Cape Peninsula University of Technology.
Signed Date
- iii -
ABSTRACT
Since their discovery in 1895, the use of x-rays is continuously evolving in medicine
making the diagnosis of injuries and diseases more practicable. It is therefore not
surprising that x-rays contribute 90% of the radiation dose to the population from man-
made sources (DWP, 1992). Moreover, these radiation doses are associated with both
fatal and non-fatal cancer risk that is detrimental to adults between 20 to 60 years (Wall,
1996). Radiation dose to individuals therefore needs to be actively monitored in order to
minimise such risk. Barium contrast examinations were characterised as one of the
radiological examinations that contributed enormously to the collective dose to the
patients in the radiology department (DWP, 1992). Determining the diagnostic reference
levels of such examinations would reduce the over-exposure of individuals to ionising
radiation. Currently in South Africa (SA), there are no diagnostic dose reference levels
for barium meal (BaM) and barium enema (BaE) examinations. This study therefore
investigated the radiation doses delivered to patients referred for BaM and BaE,
obtained potential regional reference doses for these examinations, compared the
radiation doses obtained with those from similar dosimetry studies and investigated
sources of dose variation among the study sites.
A total of 25 BaM and 30 BaE patients in the age range 18 to 85 years, weighing 50 kg
to 90 kg, at 3 hospitals in the Western Cape, SA were investigated. The radiation dose
to the patients was measured using Dose Area Product (DAP) meters that were
permanently fitted onto fixed fluoroscopy units at these 3 hospitals. The third quartile
DAP values were 20.1 Gycm2 and 36.5 Gycm2 for BaM and BaE respectively. The
median DAP values were 13.6 Gycm2 and 27.8 Gycm2 for BaM and BaE respectively.
The median values were recommended as the potential Diagnostic Reference Levels for
BaM and BaE as they are less affected by outlying values of under or over- weight

- iv -
(Yakoumakis, Tsalafoutas, Sandilos, Koulentianos et al, 1999). The weights of the
patients, fluoroscopy time, the number of images obtained, the use of digital or
conventional fluoroscopy equipment and the level of training of the radiologists were the
factors considered for dose variation among the 3 hospitals.

- v -
ACKNOWLEDGEMENTS
If I have seen any further, it is by standing on the shoulders of giants (Isaac Newton)
I wish to thank:
� First and foremost, God for his protection, wisdom, provision, sustainability. For he alone planned this venture and all glory I project back to Him for everything I am and He has made me (Jeremiah. 29:11-15)
� Mrs F Davidson who took up the challenge of accepting the supervisory role in this project. Being an international student with little knowledge of who is who in the radiography field, she made all the necessary contacts to get the giants in the radiation dose field on board to ensure the project ran as smoothly as possible. Her commitment, encouragement and hard work made this project a success. Mrs Davidson is a lecturer at the Groote Schuur Radiography campus CPUT.
� Professor P C Engel-Hills who was one of the giants in the radiation dose field aboard the supervisory team. She is a vessel of knowledge who did not mind my tapping into. Her comments and advice to the building and accomplishment of this project is invaluable. Professor P C Engel-Hills is a senior lecturer at Groote Schuur Radiography campus at CPUT.
� Dr T Kotze, who tirelessly explained the technical and statistical aspects of the research project. His enthusiasm and reassurances were such an inspiration. Dr T Kotze is a medical physicist at Groote Schuur Hospital
� The management, staff and patient participants of the hospitals where the project was undertaken. They offered more than 150% co-operation and assistance throughout the project period.
� Mrs Carol le Roux, for her encouragement and motivation. She painted the South African picture that made it home to me. Without her hospitality, care, mentorship and friendship, perhaps I would not have chosen to pursue any further studies in SA. Mrs Carol le Roux is a senior lecturer at the Tygerberg Radiography campus at CPUT.
� The entire radiography staff of both Tygerberg and Groote Schuur who always made time to respond to the researcher’s puzzling questions. To mention but a few, Mr A Speelman who translated consent form to Afrikaans, Mr A Cokoyi provided information on fluoroscopy equipment types. And to the radiographers both students and qualified alike.
� My family and friends, for the moral, spiritual and emotional support. My family pledged to keep on their knees and all prayers have been answered according to His Will.
� Last but not least, the financial assistance of the National Research Foundation towards this research is acknowledged. Opinions expressed in this thesis and the conclusions arrived at, are those of the author, and are not necessarily to be attributed to the National Research Foundation.
- vi -
DEDICATION I dedicate this to my entire family for if it was not for your prayers and support, this would have been a more challenging road to travel. And to kkojja Sam Kafeero who passed away when I was away pursuing my dreams, I know you would have been proud of me. Will always miss and love you.
- vii -
Table of contents
DECLARATION ................................................................................................................ ii
ABSTRACT ....................................................................................................................... iii
CHAPTER 1 INTRODUCTION ....................................................................................... 1
1.1 Background...........................................................................................................................1
1.2 Radiological examination of the gastrointestinal tract .....................................................2 1.2.1 Barium meal examinations ............................................................................................ 2 1.2.2 Barium enema examinations.......................................................................................... 3 1.2.3 Colonoscopy .................................................................................................................. 3 1.2.4 Computed Tomography ................................................................................................. 3 1.2.5 Virtual colonography ..................................................................................................... 4 1.2.6 Magnetic Resonance Imaging........................................................................................ 4 1.2.7 Positron Emission Tomography..................................................................................... 4 1.2.8 Abdominal Ultrasound................................................................................................... 4
1.3 Frequency of barium meal and barium enema examinations..........................................4
1.4 Radiation doses in South Africa..........................................................................................5
1.5 Rationale for the research project ......................................................................................5
1.6 Statement of the problem ....................................................................................................6
1.7 Significance of the study ......................................................................................................6
1.8 Overview of the methodology..............................................................................................6
1.9 Delimitations of the study....................................................................................................7
1.10 Introduction to the thesis structure ..................................................................................7 Chapter 2 Radiation protection............................................................................................... 7 Chapter 3 Radiation dosimetry ............................................................................................... 7 Chapter 4 Dose limits ............................................................................................................. 8 Chapter 5 Research methodology ........................................................................................... 8 Chapter 6 Research findings................................................................................................... 8 Chapter 7 Discussion .............................................................................................................. 8 Chapter 8 Conclusion ............................................................................................................. 8
CHAPTER 2 RADIATION PROTECTION ..................................................................... 9
2.1 Biological effects of radiation..............................................................................................9 2.1.1 Deterministic effects ...................................................................................................... 9 2.1.2 Stochastic effects ........................................................................................................... 9 2.1.3 Somatic effects............................................................................................................. 10 2.1.4 Hereditary effects......................................................................................................... 10
2.2 Techniques and devices for radiation protection............................................................10 2.2.1 Fluoroscopic unit dose rate limitation.......................................................................... 10 2.2.2 Image intensification fluoroscopy ............................................................................... 11 2.2.3 Intermittent fluoroscopy .............................................................................................. 11 2.2.4 Pulsed fluoroscopy....................................................................................................... 11 2.2.5 Last image hold and electronic collimation................................................................. 12
- viii -
2.2.6 Beam limiting devices ................................................................................................. 12 2.2.7 Exposure factors .......................................................................................................... 12 2.2.8 Beam quality................................................................................................................ 12 2.2.9 Source to image receptor distance ............................................................................... 13 2.2.10 Cumulative timing device.......................................................................................... 13 2.2.11 Film screen combination and radiographic processing.............................................. 13 2.2.12 Effective communication........................................................................................... 15 2.2.13 Immobilisation........................................................................................................... 15 2.2.14 Gonad shielding ......................................................................................................... 16
CHAPTER 3 RADIATION DOSIMETRY ..................................................................... 17
3.1 Dose quantities....................................................................................................................17 3.1.1 Absorbed dose ............................................................................................................. 17 3.1.2 Equivalent dose............................................................................................................ 17
3.2 Dose measurements............................................................................................................18 3.2.1 Fogging of a photographic emulsion ........................................................................... 18 3.2.2 Thermoluminescence................................................................................................... 18 3.2.3 Ionisation in air ............................................................................................................ 19
CHAPTER 4 DOSE LIMITS .......................................................................................... 25
4.1 The principle of dose limits ...............................................................................................25
4.2 Diagnostic reference levels ................................................................................................25 4.2.1 Legislation on diagnostic reference levels................................................................... 25 4.2.2 The need for DRLs ...................................................................................................... 27 4.2.3 DRLs for barium meal and barium enema examinations ............................................ 27 4.2.4 Factors affecting dose variations ................................................................................. 31
CHAPTER 5 RESEARCH METHODOLOGY .............................................................. 37
5.1 Introduction........................................................................................................................37
5.2 Research methodology .......................................................................................................37 5.2.1 Descriptive quantitative survey research ..................................................................... 37 5.2.2 Site and participant selection ....................................................................................... 38 5.2.3 Time frame................................................................................................................... 39 5.2.4 Pilot study .................................................................................................................... 39 5.2.5 Data collected .............................................................................................................. 40 5.2.6 Validity and reliability of the measurement instruments ............................................. 41 5.2.7 Delimitation of research............................................................................................... 42 5.2.8 Research assumptions.................................................................................................. 43
5.3 Ethical consideration .........................................................................................................43 5.3.1 Ethical responsibility to the participants...................................................................... 43 5.3.2 Values of honesty and integrity of the researcher........................................................ 44
5.4 Barium enema examination protocols..............................................................................44 5.4.1 Study site 1 .................................................................................................................. 44 5.4.2 Study site 2 .................................................................................................................. 47 5.4.3 Study site 3 .................................................................................................................. 48
5.5 Barium meal procedure at sites 1, 2 and 3.......................................................................49 5.5.1 Contrast medium and preparation................................................................................ 49 5.5.2 Contraindication of barium meal ................................................................................. 49
- ix -
5.5.3 Patient preparation; ...................................................................................................... 49 5.5.4 Technique .................................................................................................................... 50
5.6 Data analysis.......................................................................................................................51 5.6.1 Rejection of data .......................................................................................................... 51 5.6.2 Sub-problem 1 ............................................................................................................. 53 5.6.3 Sub-problem 2 ............................................................................................................. 53 5.6.4 Sub-problem 3 ............................................................................................................. 53 5.6.5 Linear correlation coefficient, R.................................................................................. 54 5.6.6 Coefficient of determination, R2.................................................................................. 55 5.6.7 Significance of the linear correlation coefficient......................................................... 55 5.6.8 Error bars ..................................................................................................................... 55
CHAPTER 6 RESEARCH FINDINGS.......................................................................... 57
6.1 Barium meals......................................................................................................................58 6.1.1 Age............................................................................................................................... 58 6.1.2 Weight.......................................................................................................................... 58 6.1.3 DAP values .................................................................................................................. 61 6.1.4 Fluoroscopy time ......................................................................................................... 62 6.1.5 Number of images........................................................................................................ 63 6.1.6 Comparison of mean DAP, mean FT and mean number of images at the study sites . 64
6.2 Barium enemas...................................................................................................................66 6.2.1 Age............................................................................................................................... 66 6.2.2 Weight.......................................................................................................................... 66 6.2.3 DAP values .................................................................................................................. 69 6.2.4 Fluoroscopy time ......................................................................................................... 70 6.2.5 Number of images........................................................................................................ 71 6.2.6 Comparison of mean DAP, mean FT and mean number of images at the study sites . 72
6.3 Level of training of the radiologist....................................................................................73
6.4 Digital versus conventional fluoroscopy units .................................................................74
CHAPTER 7 DISCUSSION............................................................................................ 75
CHAPTER 8 CONCLUSION.......................................................................................... 82
REFERENCES ................................................................................................................ 86
- x -
LIST OF FIGURES Figure 3.1: DAP meter mounted onto light beam diaphragm of x-ray tube at one of the study sites ……………………………………………………………………….………………………20 Figure 3.2: DAP meter electrometer and display connected by cable and operated remote from the x-ray tube at one ……………………………………………………………………………...20 Figure 3.3: Diagrammatic sketch of relationship between distance and area for DAP meters……………………………………………………………..................................................22 Figure 4.1: The equipment set up of an over-table CF unit at one of the study sites……………33 Figure 6.1: DAP versus weight for all BaM patients…………………………………………….58 Figure 6.2: DAP versus weight for BaM at site 2………………………………………………..59 Figure 6.3: DAP versus weight for BaM at site 3………………………………………………..60 Figure 6.4: DAP versus FT for BaM at sites 1 and 3……………………………………............62 Figure 6.5: The mean DAP, mean FT and mean images obtained for BaM at the 3 study sites employing conventional and digital fluoroscopy equipment.....…………………….....................64 Figure 6.6: DAP versus weight for all BaE patients……………………………………………..65 Figure 6.7: DAP versus weight for BaE at site 1………………………………………………...66 Figure 6.8: DAP versus weight for BaE at site 2……………………………………...................67 Figure 6.9: DAP versus weight for BaE at site 3………………………………….......................67 Figure 6.10: DAP versus FT for BaE at sites 1 and 3.....……………….......................................70
Figure 6.11: The mean DAP, mean FT and mean images obtained for BaE at the 3 study sites employing conventional and digital equipment…………………..................................................72 LIST OF TABLES Table 4.1: The mean and third quartile DAP values recorded for BaM from various
countries…………………………………………………………………………..........................28
Table 4.2: The mean and third quartile DAP values recorded for BaE from various
countries…………………………………………………………………………..........................30
Table 5.1 The standard series of radiographs obtained for BaE at study site 1………………….47
Table 5.2 The standard series of radiographs obtained for BaE at site 2………………………...48
Table 5.3 The standard series of radiographs obtained for BaE at study site 3………………….49
Table 5.4 The sequence of radiographs obtained for BaM at the 3 study sites………………….50
Table 5.5 Critical Q values (Qc) for rejection of a single discordant value at a 90% confidence
interval……………………………………………………………………………………………52
Table 6.1 The mean, minimum, maximum, standard deviations, corrected mean DAP and
corrected standard deviations for BaM at the 3 study sites ……………………….......................60
Table 6.2 The combined median, first and third quartile DAP values for all BaM patients……………………………………………………………………………………………61 Table 6.3 The mean, minimum, maximum, standard deviations, corrected mean DAP and
corrected standard deviation for BaE at the 3 study sites………………………………………..68
Table 6.4 The combined median, first and third quartile DAP values for all BaE patients……………………………………………………………………………………………68
- xi -
Table 7.1 The correlation coefficient R, coefficient of determination R2 and p values for BaM at the study sites………………………………………………………………………......................76 Table 7.2 The correlation coefficient R, coefficient of determination R2 and the p values for BaE at the study sites…………………………………………………………………………………..77 Table 7.3 Mean DAP values recorded for DF and CF units for BaM and BaE……….................79 APPENDICES Appendix 1 Fluoroscopy equipment specifications for equipment employed at the 3 study sites …………………………………………………………..............................................93 Appendix 2 Data capture sheet…………………………………………………………..94 Appendix 3 Consent form.……………………………………………………………..95
- 1 -
CHAPTER 1 INTRODUCTION
The exposure of individuals to ionising radiation in diagnostic radiology is based on a
risk to benefit ratio; with the benefit of diagnosing the disease condition preceding
clinical management. The radiation dose received by the patient needs to be monitored
and quantified to avoid over-exposure of the patient to this ionising radiation. Such over-
exposure results in the risk of the ionising radiation superseding the intended benefit
(Trapp & Kron, 2008:12). Internationally, diagnostic reference levels (DRLs) have been
developed to act as points of reference when exposing a patient to ionising radiation
during diagnostic radiology examinations (Hart, Hillier & Wall, 2007).
Despite the contribution of barium contrast examinations to the collective dose to humans
from radiological examinations (DWP1, 1992), there are no DRLs for barium meal (BaM)
and barium enema (BaE) examinations in South Africa (SA). This research project
therefore investigated the radiation doses received by patients referred for BaM and BaE
in the Western Cape, SA and recommended potential regional DRLs these examinations.
When adopted, the DRLs would act as points of reference for these examinations in the
radiology departments.
In this chapter, the background of the research project, the radiological examination
options of the gastrointestinal tract and frequency of BaM and BaE are discussed. These
are followed by a presentation of the research problem, the rationale and significance of
the study. An overview of the methodology used and the delimitations of the study are
highlighted and the chapter concludes with an introduction to the thesis.
1.1 Background
Since their discovery in 1895, the use of x-rays has continuously evolved in medicine
making the diagnosis of injuries and diseases more practicable. It is therefore not
surprising that x-rays contribute 90% of the radiation dose to the population from man-
made sources (DWP, 1992). Moreover, these radiation doses are associated with both
1 Dosimetry Working Party
- 2 -
fatal and non-fatal cancer risks that are detrimental to adults between 20 to 60 years
(Wall, 1996) thereby necessitating radiation protection measures.
In attempts to maximise the benefits of x-rays, requirements to deliver the lowest possible
radiation dose consistent with the clinical purpose of the examination are legally
formalised internationally. In SA, there is legislation addressing this in the Health Act
(South Africa Public Health Act, 1973). In the United Kingdom (UK), dose reference
levels were adopted (RCR2 & NRPB3, 1990) to act as dose audits for quality control in
radiology departments. In 1992, a Dosimetry Working Party devised national protocols
that provided practical guidance for radiology departments in the use of these reference
doses. In these protocols, it was emphasised that departments must focus on dose levels
for examinations that are most frequently performed and that contribute enormously to
the collective dose and therefore radiation risk (DWP, 1992).
1.2 Radiological examination of the gastrointestinal tract
Radiological examination of the gastrointestinal tract (GIT) utilising ionising radiation
involves the exposure of sensitive organs of the body such as the thyroid, breasts and the
reproductive organs to this radiation. Initially, barium contrast examinations were the
basic routine radiological examinations of the GIT but the advancement of newer
radiological imaging techniques and equipment such as Computed Tomography (CT),
Virtual colonography, Magnetic Resonance Imaging (MRI), Endoscopy and Ultrasound
have since decreased the frequency of BaM and BaE performance. Nonetheless, barium
contrast examinations contribute enormously to the collective dose to the population from
radiological examinations (Hart & Wall, 2004; Kaul, Bauer, Bernhardt, Nosske & Veit,
1997) thereby necessitating the investigation of radiation doses associated with them.
1.2.1 Barium meal examinations
The BaM is the basic routine radiological examination of the stomach and duodenum
involving the ingestion of barium sulphate contrast medium that coats the stomach and
aids and its radiological examination. The BaM is indicated in gastric and duodenal
2 Royal College of Radiologists 3 National Radiological Protection Board
- 3 -
displacements, structural abnormalities such as diverticulae, peptic ulceration and gastric
cancers (Simpkins, 1993: 789-829). Gelfand (1988) found BaM to have a specificity of
more than 90% and a sensitivity of 80-100% for ulcers more than 5mm in diameter.
1.2.2 Barium enema examinations
The barium enema is the routine radiological examination of the colon where barium
sulphate contrast medium is administered through the rectum and aids in radiological
examination of the colon. This examination is indicated in congenital lesions,
inflammatory lesions such as colitis, ulcerative colitis, Crohn’s disease and ischemic
colitis, diverticular disease of the colon and tumours of the colon such as polypoid lesions
(Thomas, 1993: 857-880).
1.2.3 Colonoscopy
Colonoscopy is an endoscopic examination of the large colon and distal part of the small
bowel with a fibre optic camera attached to a flexible tube passed through the anal
opening. Colonoscopy is indicated for polyps and in situations of uncertainty of the
radiological finding such as a normal BaE in a patient with rectal bleeding of unknown
origin (Thomas, 1993: 857-880). The high sensitivity of colonoscopy for detection of
colon polyps has resulted in its being recommended as a first line investigation for the
colon in some radiology departments. The use of colonoscopy is however limited by the
difficulty of the endoscope reaching the right colon that is predominately affected by
colon cancers (Rockey, Paulson, Niedzwiecki, Davis et al, 2005; Debatin & Patak, 1999).
Thirteen percent of the patients referred for BaE in this study had incomplete
colonoscopies.
1.2.4 Computed Tomography
Computed Tomography facilitates the viewing of cross-sectional images of the GIT.
With such capabilities, CT diagnoses, differentiates and stages GIT tumours as well as
gastric inflammatory conditions such as gastritis and peptic ulcer disease (Karen, Horton,
Elliot & Fishman, 2003). However, BaE remain unsurpassed for mucosal definition
(Bartam & Taylor, 2008: 680).
- 4 -
1.2.5 Virtual colonography
Virtual colonography uses a graphics-based software system to produce images similar to
those obtained with a real endoscope. Contrary to the endoscope, a three dimensional
(3D) image reconstructed from CT provides a virtual environment from which to obtain
endoluminal views of the tubular structures such as the colon (Seeram, 2009: 363-375).
Virtual colonoscopy is a non-invasive radiological examination well suited for patients
contraindicated for invasive procedures. It is also sensitive in diagnosing abnormalities
of the stomach and colon such as colon cancer (Caroline & Kendzierski, 2008: 648).
1.2.6 Magnetic Resonance Imaging
MRI uses non-ionising radiation. It provides good soft tissue contrast, and has short
imaging time, results in less patient discomfort with absence of harmful side effects. MRI
colonography coupled with MRI virtual colonoscopy are employed in the detection of
polyps, examination of the GIT lumen and evaluation of patients with diverticular and
inflammatory bowel disease (Debatin & Patak, 1999).
1.2.7 Positron Emission Tomography
PET is a functional imaging technique that is used to assess tissue activity. PET utilises
Fluoro-2-deoxy-glucose as a marker to assess tumour activity such as gastric cancer
(Caroline & Kendzierski, 2008: 649).
1.2.8 Abdominal Ultrasound
Ultrasound imaging uses high frequency sound waves to produce images of the GIT.
Abdominal ultrasound allows the measurement of bowel wall thickness and Doppler flow
assessment while endoscopic ultrasound evaluates the depth of gastric wall invasion by
disease (Bartam & Taylor, 2008: 682).
1.3 Frequency of barium meal and barium enema examinations
The advancements in other imaging modalities such as CT, virtual colonography, MRI,
colonoscopy and ultrasound with capabilities of tumour staging and high sensitivities for
polyps and colon cancers are continually affecting the frequency of performance of BaM
and BaE (Caroline & Kendzierski, 2008: 627-649; Bartam & Taylor, 2008: 679-705).
- 5 -
The decreased frequency of BaM and BaE in the Western Cape, SA was predominantly
in the private sector where newer and more advanced imaging equipment such as Multi-
detector CT and Colonoscopy are employed. Even in the public sector, patients were
referred for BaE after failed or incomplete colonoscopy. This demonstrated that other
imaging modalities are employed in the radiological examination of the GIT but BaM and
BaE continue to have a role in imaging of this area. Despite their decreased frequency,
BaE remain one of the largest contributors to the collective dose from radiological
examinations (Hart & Wall, 2004) thereby necessitating dosimetry studies for barium
contrast examinations.
1.4 Radiation doses in South Africa
In SA, protection of radiation workers and the public from unnecessary radiation
exposure is continually emphasised (South Africa Public Health Act, 1973). Currently, it
is a legal requirement for all fixed fluoroscopy equipment to have permanently fitted
Dose Area Product (DAP) meters thereby allowing real time monitoring of patient’s
radiation dose during fluoroscopy examinations (DoH4 SA, 2006). Engel-Hills (1997)
investigated radiation doses to patients referred for BaE in the Western Cape, SA using a
DAP meter and obtained dose levels more than twice as high as the UK values (Hart,
Hillier, Wall, Shrimpton & Bungay, 1996). However, the tendency to record lower doses
in subsequent dosimetry studies owing to improved radiation protection activities in
radiology departments (DWP, 1992; Hart et al, 1996; Warren-Forward, Haddaway,
Temperton & McCall, 1998) was observed in this study.
1.5 Rationale for the research project
Barium contrast examinations are categorised as one of the largest contributors to the
collective dose from radiological examinations (Hart & Wall, 2004) yet DRLs5 do not
exist for these examinations in SA. Hence this study investigated the radiation doses
received by patients referred for BaM and BaE and developed potential regional DRLs
for these examinations in the Western Cape, SA. Despite the recommendations for
4 Department of Health 5 Diagnostic Reference Levels
- 6 -
subsequent dosimetry studies and country or region specific DRLs (ICRP6, 1996; Wall,
2001), only one study (Engel-Hills, 1997) investigated radiation doses for barium contrast
examinations in SA over a decade ago and this study focussed on BaE alone.
1.6 Statement of the problem
The absence of national DRLs for BaM and BaE in SA and the enormous contribution to
collective dose to patients referred for these examinations; this study investigated the
radiation doses received by patients referred for BaM and BaE by:
Sub-problem 1
Measuring the radiation dose for BaM and BaE using DAP meter that were permanently
fixed to the fluoroscopy units
Sub-problem 2
Comparing the radiation doses obtained in this study with those from similar studies
Sub-problem 3
Determining the factors responsible for DAP variations among the study sites.
1.7 Significance of the study
The investigation of radiation doses received by patients referred for BaM and BaE in
this study recommended regional DRLs for BaM and BaE and explained the factors
responsible for the dose variations among the radiology departments and patients. When
the DRLs recorded in this study are adopted by radiology departments as dose audits and
measures of quality assurance, equipment and departments recording high radiation doses
will be identified and corrective action undertaken.
1.8 Overview of the methodology
The radiation doses of patients referred for BaM and BaE to 3 hospitals in the Western
Cape, SA were measured using DAP7 meters that were permanently fitted onto the
fluoroscopy equipment. Both male and female patients aged between 18 years and 85
years weighing 50 kg to 90 kg were included in the study. The patients’ weights were
measured using a digital bathroom scale. The age, gender, weight, indication for the
6 International Commission on Radiological Protection 7 Dose Area Product
- 7 -
study, exposure factors for the images acquired, number of images, fluoroscopy time and
DAP value were recorded for each patient. These data were analysed and DRLs were
obtained for BaM and BaE, these dose levels were compared with those from similar
studies and causes of dose variation among the study sites were determined.
1.9 Delimitations of the study
The delimitations of the research project were that;
• Only public hospitals in the Western Cape, SA with DAP meters permanently
fitted to their fluoroscopy equipment were included. These hospitals also
performed a number of BaM and BaE that allowed sufficient data to be collected
within the research time frame.
• The patient participants were aged between 18 years and 85 years weighing 50 kg
to 90 kg. The age limit allowed for recruitment of adult patients. The weight
restriction ensured that the mean weight of the sample lay 5 kg from 70 kg, the
assumed average weight of an adult. As such the reference doses for an average
adult were be obtained (DWP, 1992).
1.10 Introduction to the thesis structure
In order to understand the radiation doses delivered to patients referred for BaM and BaE
in the Western Cape, SA; the next chapters of this work are going to discuss the concepts
of ionising radiation as outlined below.
Chapter 2 Radiation protection
Under radiation protection, the biological effects of radiation, the radiation dose
relationship that induces these effects and the techniques and equipment that reduce over
exposure of individuals to ionising radiation; particularly for fluoroscopy equipment with
emphasis on BaM and BaE are discussed.
Chapter 3 Radiation dosimetry
In this chapter, the dose quantities such as absorbed dose and dose equivalent, how the
absorbed dose to tissue is measured, the equipment used in the measurement of absorbed
dose with emphasis on the Dose Area Product meter are discussed.
- 8 -
Chapter 4 Dose limits
This chapter presents the principle of dose limits, the legislation surrounding these dose
limits, recommended DRLs for BaM and BaE from other dosimetry studies and the
causes of variation of these DRLs.
Chapter 5 Research methodology
The chapter systematically describes the data collection process and method followed
when measuring radiation doses for BaM and BaE with the aim of identifying potential
DRLs.
Chapter 6 Research findings
In this chapter, the Dose Area Product (DAP) values for BaM and BaE and the variations
in these values are reported.
Chapter 7 Discussion
This chapter discusses the research findings giving reasons for DAP variations and
compares the dose levels for this study with those from other dosimetry studies
Chapter 8 Conclusion
In the chapter, the conclusions are drawn and limitations and recommendations presented.
- 9 -
CHAPTER 2 RADIATION PROTECTION
When ionising radiation interacts with the body tissues, it excites the atoms in the tissues
in a process known as ionisation. In order to minimise and avoid unnecessary over-
exposure of patients and even radiology department personnel to ionising radiation,
several techniques and devices are employed. In this chapter, the biological effects of
ionising radiation and the techniques and devices for radiation protection are discussed.
2.1 Biological effects of radiation
The nature and severity of the symptoms of exposure to ionising radiation and the time at
which they appear depend on the amount of radiation absorbed and the rate at which it is
delivered to the tissue. These biological effects of radiation are classified as:
deterministic, stochastic, somatic and hereditary (Trapp & Kron, 2008: 48-52).
2.1.1 Deterministic effects
Deterministic effects of ionising radiation occur above a certain threshold radiation dose
value. Above this threshold value, the severity of the radiation injury increases with the
dose and can occur within a few hours, or less if the individual is exposed to high doses
of radiation. Examples of deterministic effects include direct tissue damage such as
erythema, radiation sickness characterised by nausea and vomiting and gastrointestinal
syndrome (Trapp & Kron, 2008: 48-50).
2.1.2 Stochastic effects
Contrary to deterministic effects, stochastic effects occur at all dose levels with no
threshold dose. The probability of occurrence of stochastic effects increases with
increasing dose to an individual. Additionally, the severity of stochastic effects is
independent of the dose that induced the effect. An example of a stochastic effect is
cancer that is equally harmful whether caused by a low or high dose value. Stochastic
effects include all late-expressing health effects of radiation like hereditary effects but
exclude late tissue reactions resulting from direct irradiation (Matthews & Brennan,
2008; Trapp & Kron, 2008: 50).
- 10 -
2.1.3 Somatic effects
Somatic effects appear in the irradiated individual after acute radiation exposure.
Somatic effects include nausea and vomiting, organ death, erythema, cancer, cataract and
decreased life expectancy (Trapp & Kron, 2008: 48-52).
2.1.4 Hereditary effects
Hereditary effects appear in the descendants of the irradiated individual. The
International Commission on Radiological Protection (ICRP) estimated the risk of serious
hereditary ill health within the first two generations to be 10 per million per milli Sievert
with the risk being twice this value in subsequent generations (Martin & Harbison 1996:
35-41; Trapp & Kron, 2008: 51).
2.2 Techniques and devices for radiation protection
In view of the need for radiation protection in radiological examinations, the following
techniques and devices have been adopted to minimise exposure of individuals to
ionising radiation. These include; image intensification fluoroscopy, intermittent and
pulsed fluoroscopy, beam limiting devices, adjusted exposure factors, filtration, source to
tabletop distance, cumulative timing device, fluoroscopic unit exposure rate limitation,
film screen combinations, radiographic processing, effective communication,
immobilisation and gonadal shielding. However, for BaM and BaE where fluoroscopy
and spot films are acquired, the complexity of the examination and uniqueness of each
patient influence the radiation dose received by the patient (Statkiewicz-Sherer, Visconti
& Ritenour, 1993: 159-193; Trapp & Kron, 2008: 110-113).
2.2.1 Fluoroscopic unit dose rate limitation
With the high doses associated with fluoroscopy, regulating the rate at which an
individual receives radiation (dose rate) results in dose reduction. The United States
Food and Drug Agency (2006) has recommended that the maximum radiation skin dose
rate must not exceed 100 mGy/ minute under normal imaging conditions without
backscattered radiation. The dose rate can be minimised by restricting the maximum
kilovoltage peak (kVp) and tube current of the x-ray generator and providing additional

- 11 -
filtration in the x-ray tube housing so that more highly penetrative x-rays are produced
for image acquisition (Trapp & Kron, 2008: 113).
2.2.2 Image intensification fluoroscopy
The image intensification capability of fluoroscopy amplifies the fluoroscopy image to
7000 times the brightness of the image allowing the viewing of the image under regular
white light. Additionally, less tube current is required in obtaining a diagnostic image
resulting in low patient doses (Statkiewicz-Sherer et al, 1993:159-193).
2.2.3 Intermittent fluoroscopy
Intermittent fluoroscopy is a technique adopted by radiologists using conventional
fluoroscopy units where the radiologist activates the fluoroscopic tube for a few seconds
at a time so as to view an area of interest. The technique is most effective when
combined with the last image hold feature of the fluoroscopy equipment resulting in short
fluoroscopy times and low radiation dose to the patient. Intermittent fluoroscopy further
prolongs the life of the fluoroscopy tube (Mahesh, 2001).
2.2.4 Pulsed fluoroscopy
Pulsed fluoroscopy involves emission of the x-ray beam in a series of pulses rather than
continuously. Some modern digital fluoroscopy equipment are equipped with this dose
saving feature where images are acquired at varying frame rates per second such as 3,
7.5, 15 and 30 frames per second depending on the phase of imaging. Imaging at lower
frame rates results in higher dose saving than imaging at higher frame rates (Trapp &
Kron, 2008: 110-113). However, imaging fast moving objects such as barium contrast
passing through the oesophagus at very low frame rates results in increased image noise.
In order to compensate this increased image noise, manufacturers increase the
milliampere setting on the fluoroscopy unit to allow acquisition of a good diagnostic
image. This in turn affects the dose saving possible with a certain decrease in frame rate.
For example, a frame rate reduction from 30 to 15 frames per second may result in 25%
dose saving rather than the expected 50% dose reduction (Mahesh, 2001). Mean frame
rate of 7.5 frames per second was used at sites 2 and 3 in this study. The difference
- 12 -
between intermittent and pulsed fluoroscopy is that the former is operator dependant
whereas the latter is a feature of the equipment.
2.2.5 Last image hold and electronic collimation
The last image hold feature of fluoroscopy equipment allows the radiologist to view the
last acquired image on the television monitor. This facilitates the planning of the next
sequence of images without additional exposure of the patient to ionising radiation. For
fluoroscopy equipment with electronic collimation superimposed on the collimator blade
of the last image hold, the radiologist adjusts the field dimensions of the image without
additional radiation exposure to the patient (Mahesh, 2001; Trapp & Kron, 2008: 110-
113).
2.2.6 Beam limiting devices
Beam limiting devices work in such a way that they restrict the primary beam to the area
of interest for the radiological procedure. Consequently, the amount of scattered and
absorbed dose to the surrounding anatomical area is reduced. Beam limiting devices used
during barium contrast examinations include; aperture diaphragms and collimators
(Statkiewicz-Sherer et al, 1993: 159-193).
2.2.7 Exposure factors
When appropriate exposure factors are selected, radiographs that are diagnostic with
minimal dose to the patient are obtained. This is achieved by using high kilovoltages
(kV) and low milliamperes (mA) over time in seconds. Increasing the kV and lowering
the mAs (product of milliampere and time) results in radiographic images with decreased
contrast but lower patient dose. These factors must therefore be adjusted in such a way
that patient dose is minimised while adequate image contrast is maintained (Statkiewicz-
Sherer et al, 1993: 159-193). The kVp and mAs ranged from 88 kV to120 kV and 5 mAs
to 25 mAs respectively.
2.2.8 Beam quality
The quality of the x-ray beam is influenced by the applied kilovoltage peak and the
amount of filtration. Selection of a high kilovoltage produces a high energy x-ray beam
- 13 -
that is more penetrating. Such a high energy beam reduces the absorbed dose to the
irradiated individual. In order to increase the number of highly penetrating x-ray
photons, an Aluminium (Al) or Copper (Cu) filter is added to absorb the low energy x-ray
photons. This process is referred to as filtration and results in x-ray beam hardening. In
this way, the radiation dose to the individual is reduced by allowing only high energy x-
ray photons to reach the image receptor (Statkiewicz-Sherer et al, 1993: 159-193;
Mahesh, 2001).
2.2.9 Source to image receptor distance
When the source to image receptor distance (SID) is short, the patient receives an
increased entrance skin dose as compared to using a longer SID. A minimum distance of
38 centimetres is recommended to reduce the entrance skin dose to the patient. All study
sites investigated used a source to image distance of 100 centimetres (Statkiewicz-Sherer
et al, 1993: 159-193).
2.2.10 Cumulative timing device
Fluoroscopy units must be equipped with cumulative timers with an audible alarm that
sounds after 5 minutes of fluoroscope activation. This timer makes the radiology
personnel aware of the duration of exposure of the patient and enables them to work
cautiously to avoid exposure of patients for long periods to ionising radiation
(Statkiewicz-Sherer et al, 1993: 159-193).
2.2.11 Film screen combination and radiographic processing
Film screen combination and radiographic processing conditions affect the absorbed dose
to the patient when repeat radiographs are acquired due to poor images being produced as
a result of the film screen combination used and radiographic image processing
conditions. Since conventional and digital fluoroscopy systems use different films and
image processing conditions, they are discussed individually.
Conventional fluoroscopy
Currently, radiographic films are manufactured with various speeds that influence their
response to the radiographic exposure. In combination with intensifying screens, the
- 14 -
conversion of x-rays to visible light is accelerated. High speed film-screen combinations
are more sensitive to x-rays as compared to low speed film screen combinations. As a
result, less x-ray exposure is required to produce a diagnostic image with a high speed
film screen combination as compared to a low film screen combination. Consequently,
there is reduced dose to the patient (Statkiewicz-Sherer et al, 1993: 159-193). At the
study site with conventional fluoroscopy equipment, a 200 speed film screen combination
was used.
Additionally, the temperature and the age of the radiographic film processing chemicals
affect the final image on the radiograph in such a way that, if the temperature is not
properly regulated or exhausted chemicals are used without varying the radiographic
factors, a poor radiograph is produced. This will necessitate repeat radiographs resulting
in additional exposure of the patient to ionising radiation that would have been avoided if
the processing conditions were checked. It is therefore essential that a quality assurance
program exists in the department to check the temperature and working conditions of the
processor and processing chemicals. Good quality control minimises the need for repeat
radiographs resulting from using a faulty processor or exhausted processing chemicals
and therefore reduces unnecessary additional radiation dose to the patients (Sprawls &
Kitts, 1996; Grey, 1997).
Digital fluoroscopy
Contrary to conventional fluoroscopy, digital fluoroscopy employs laser imagers to
produce hard copies of images. Radiology departments have advanced from employing
wet film laser imagers to using dry film laser imagers. The two study sites in this
research project that employed digital fluoroscopy units used dry film laser imagers.
The dry film laser imager uses photothermographic blue base films made of silver
behenate crystals. During image reproduction onto the film, the film is exposed on both
sides using a laser beam in a z pattern to obtain the high level of exposure required for
this film. The film is then exposed to controlled heat of the order of 140 degrees Celsius
for a few seconds to transform the latent image into a permanent image (Gahleitner,
- 15 -
Kreuzer, Schick, Nowotny et al, 1999). There are no processing chemicals required for
dry film laser imagers as is the case with the wet film laser imager, yet the image quality
of the former is comparable to that of the latter. Another advantage of dry film laser
imagers is the absence of latent image degradation resulting from the use of exhausted
processing chemicals that would result into repeat radiographs and unnecessary
additional radiation exposure to patients (Schueller, Kaindl, Langenberger, Stadler et al,
2007; Zähringer, Wassmer, Krug, Winnekendonk et al, 2001). Currently, the increased
use of the picture archiving and communication system (PACS) is eliminating the need
for radiographic films and film processing. This is because the information is stored and
transferred electronically to the departments throughout the hospital (Samei, Seibert,
Andriole, Badano et al, 2004).
2.2.12 Effective communication
This is an important part of radiological imaging where the radiographer or radiologist
must explain the procedure thoroughly and truthfully to the patient. BaM and BaE
require GIT preparation for successful imaging of the stomach and colon respectively.
The instructions must therefore be effectively communicated to the patient to ensure
adequate GIT preparation. On the day of the examination, the procedure must be clearly
and continuously communicated to the patient before and during the examination to
reduce anxiety and increase cooperation of the patient thereby minimising the chances of
repeat images that result in additional radiation exposure to the patient (Statkiewicz-
Sherer et al, 1993:159-193).
2.2.13 Immobilisation
Immobilisation of the patient prevents blurring of the radiographic image. When the
image is blurred, repeat images are undertaken that result in additional radiation exposure
to the patient. Immobilisation is only possible for voluntary movements of the patient for
example limb movement. For involuntary movements such as of the digestive system,
short exposure times are employed to minimise blurring of the resultant image. During
the BaE examination, Hyoscine-N-butylbromide is administered intravenously or
intramuscularly to regulate the bowel movements (Statkiewicz-Sherer et al, 1993: 159-
193).
- 16 -
2.2.14 Gonad shielding
Gonad shielding devices protect the reproductive organs of the patient from being
irradiated when in close proximity to the area of interest such as imaging of the pelvis.
The use of gonad shields during barium contrast examinations is however not feasible as
they will obscure the gastrointestinal structures. This results in unavoidable high
radiation exposure to the reproductive organs of females as compared to males given the
anatomical location of the former. Other techniques of radiation protection must
therefore be sought, for example, the ten day rule must be applied in females of
reproductive age referred for barium contrast examinations to prevent exposure to the
unborn foetus (Statkiewicz-Sherer et al, 1993: 159-193).
The effects associated with exposure of individuals to ionising radiation and uncertainty
surrounding the threshold dose levels at which these effects occur substantiate for
knowledge of radiation protection techniques. During barium contrast examinations, the
adoption of intermittent fluoroscopy, use of equipment with pulsed fluoroscopy and last
image hold features, collimating the x-ray beam to area of interest, using long SID8 and
high kV9 with low mAs10 to improve the beam quality reduce the radiation dose to the
patient. Additionally, effective communication of the procedure to the patient improves
patient cooperation and reduces the incidence of repeat radiographs due to movement
blur.
When radiation protection techniques are adopted, the radiation dose to the patients is
minimised. It is however essential to quantify this radiation dose. Quantification of the
radiation dose provides knowledge on the amount of radiation dose received by
individuals. Knowledge of the amount of radiation dose delivered during radiological
examinations and how it is measured can be used to assess of the effectiveness of the
radiation protection procedures. The next chapter is therefore going to discuss how
radiation dose is measured, in what units and the dosemeters employed in its
measurement.
8 Source to Image receptor Distance 9 Kilovoltage 10 milliampere seconds
- 17 -
CHAPTER 3 RADIATION DOSIMETRY
X-rays are electromagnetic waves with high energy, short wave length and high
frequency with the ability to produce positive and negative charged particles on
interacting with matter. When x-rays interact with body tissue, they deposit energy into
the tissue resulting in excitation of electrons from the atoms in the tissue and formation of
ion pairs (Bushong, 2004: 5). In this chapter, the units used to quantify ionising
radiation, how these quantities of ionising radiation are measured and the equipment
employed to obtain these measurements are discussed.
3.1 Dose quantities
3.1.1 Absorbed dose
The energy deposited into the tissue by ionising radiation is referred to as the absorbed
dose. The international system (SI) unit of absorbed dose is the Gray (Gy) where; Gray is
the deposition of 1 Joule of energy in a kilogram of any medium. The value of absorbed
dose depends on both the photon energy of the ionising radiation and type of the
absorbing medium; whereby a high energy beam produces less absorbed dose than a low
energy beam of the same intensity. This is because more of the high energy beam
photons are transmitted without absorption in comparison to the low energy beam (Ball,
Moore & Turner, 2008: 295).
3.1.2 Equivalent dose
Different types and energies of ionising radiation do not cause the same degree of
biological damage even with the deposition of the same amount of absorbed dose in the
tissue. Hence, if only the absorbed dose to tissue is considered, it does not give an
accurate indication of the tissue damage caused by any particular ionising radiation. To
overcome this, equivalent dose that accounts for the type and energy of the ionisation
radiation deposited in the tissue was introduced. Equivalent dose is therefore used as a
measure of the biological effect of ionising radiation and to establish the probability of
stochastic effects to an individual. The SI unit of equivalent dose is the Sievert (Sv). The
equivalent dose is calculated from the product of the absorbed dose and the radiation
weighting factor.
- 18 -
Dose equivalent (Sv) = Absorbed dose (Gy) x Radiation weighting factor (WR)
The value of the WR is dependent on the density of ionisation caused by the type of
radiation deposited in the absorbing medium. The weighting factor for x- and gamma
rays is 1 (Martin & Harbison, 1996: 23-31; Trapp & Kron, 2008: 32-33).
3.2 Dose measurements
The quantity of energy absorbed by a medium can be measured both directly and
indirectly. The direct measurement of this energy is not feasible in diagnostic radiology.
Indirect methods are therefore sought to measure the absorbed dose from the easily
measurable effects of radiation that include; ionisation in air, thermoluminescence and
fogging of a photographic emulsion (Ball et al, 2008: 296-307).
3.2.1 Fogging of a photographic emulsion
A photographic film emulsion contains microscopic particles of silver bromide. When
the film is exposed to x-rays, the silver bromide molecules are converted into metallic
silver. On developing the film, the areas of the film emulsion that were irradiated appear
grey or black due to the metallic silver. The degree of blackening is used to estimate the
exposure and dose by measuring the photographic density of the emulsion. Dosemeters
that use this principle have been adopted for personnel monitoring (Ball et al, 2008: 304-
305).
3.2.2 Thermoluminescence
Estimation of absorbed dose using thermoluminescence in crystals such as lithium
fluoride is used in some dosemeters. When these crystals are exposed to x-rays, their
electrons absorb the energy of the ionising radiation and are transmitted to higher energy
levels. These electrons only release this energy when heat is applied to them thereby
releasing the energy in the form of light photons. The quantity of light emitted is related
to the absorbed dose. The dosemeters that use this principle are called
thermoluminescent dosemeters (TLDs). They are ideal for personnel monitoring and
measurement of entrance surface dose involving single or multiple radiographs in the

- 19 -
same area of interest for example the chest or pelvis. Being thin discs with an atomic
number similar to tissue, TLDs are not visible on the resultant radiograph when placed on
the skin of the patient or in a body cavity (Engel-Hills, 2002).
3.2.3 Ionisation in air
Air in its normal state is a good electrical insulator. When air is however exposed to x-
rays, its atoms are excited resulting in the release of electrons and formation of ion pairs
thereby enabling it to conduct an electric current. In order to measure the strength of the
x-ray beam, knowledge of the quantity of charge on the ion pairs and the mass of air
ionised is required and is known as the radiation exposure. The SI unit of radiation
exposure is coulombs per kilogram. The exposure measurement is converted into
absorbed dose by multiplying it with a conversion factor.
Absorbed dose (Grays) = exposure (coulombs per kg) x conversion factor
The value of the conversion factor is different for different materials and may also vary
for the same material at different beam energies. Free air ionisation chambers, thimble
ionisation chambers and DAP meters are some of the dosemeters that employ the air
ionisation effect. While thimble ionisation chambers are widely adopted for
radiotherapy, the DAP meters are employed in diagnostic radiography (Ball et al, 2008:
297-303). The DAP meter is therefore going to be discussed in detail.
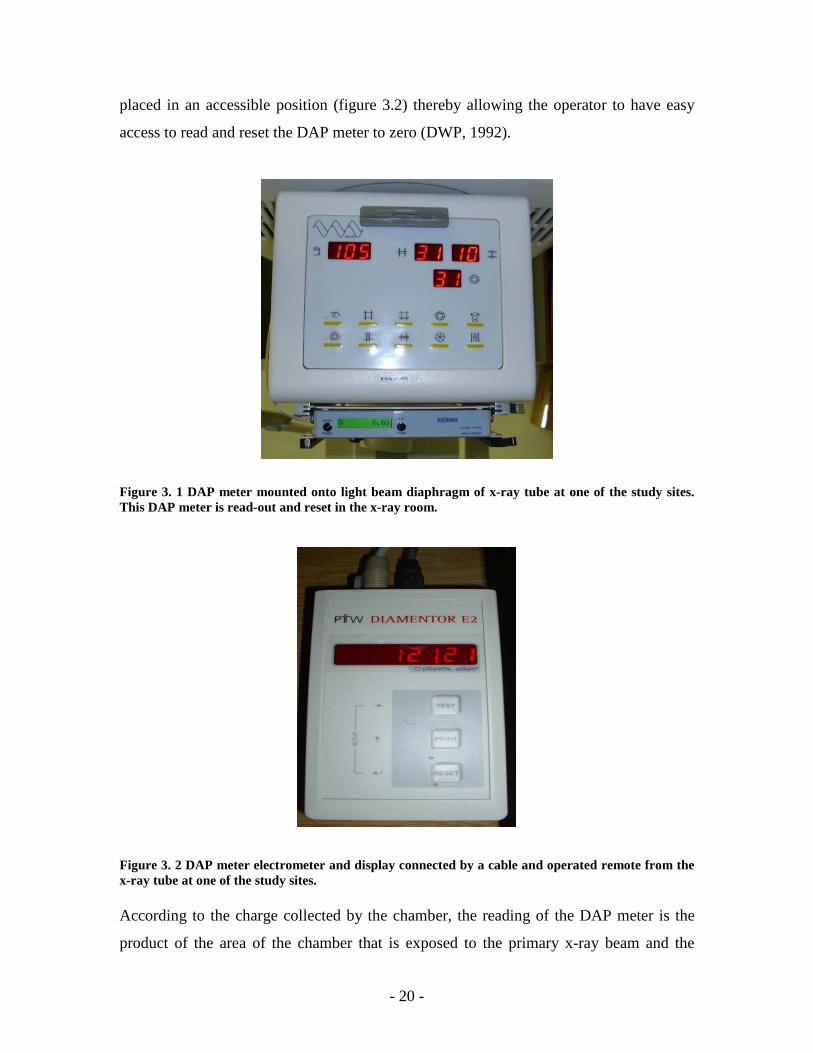
Dose Area Product meter
The DAP meter is used to measure Dose Area Product of an ionising radiation beam. A
transmission ionisation chamber attached to the diaphragm of the x-ray tube is used to
measure the Dose Area Product (Wall, 1996). A DAP meter consists of a flat large
parallel plate ionisation chamber measuring approximately 15cm2 that is transparent to
allow the light beam diaphragm device to still be used. The chamber is designed to be
mounted on the light beam diaphragm (figure 3.1). The use of cones, field delineators
and external beam filters require some amendment to the positioning. The chamber is
connected to an electrometer and display unit by a cable such that the display unit can be
- 20 -
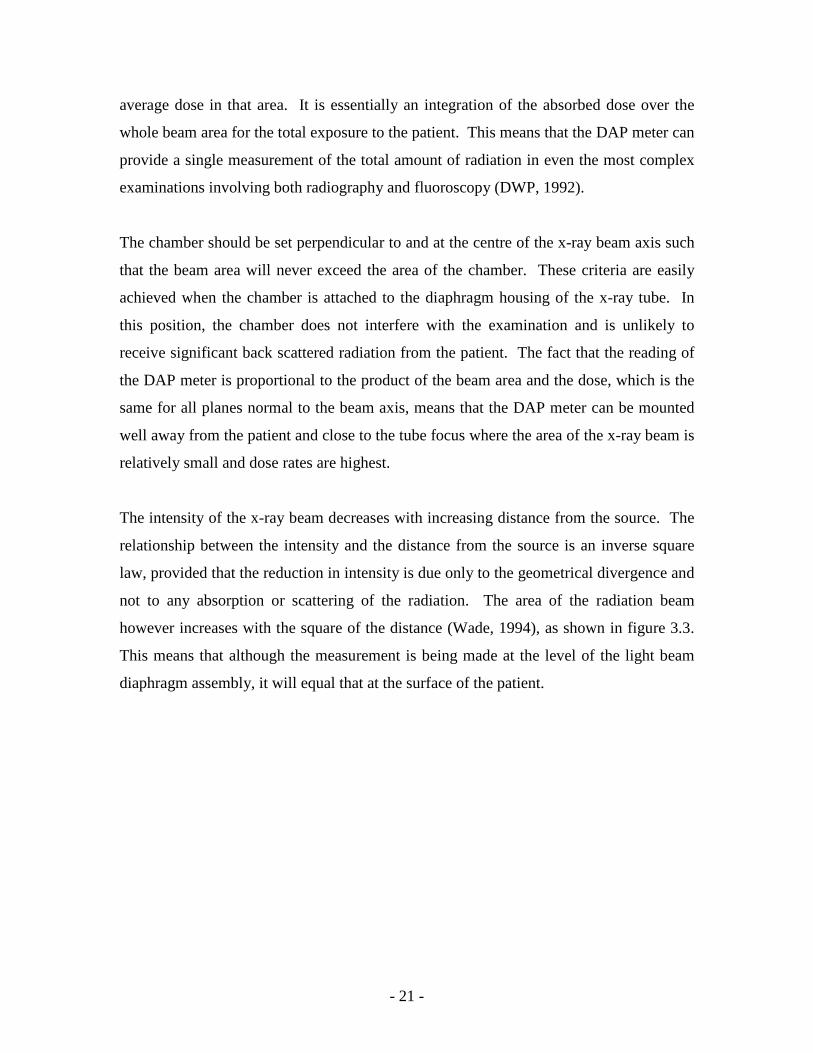
placed in an accessible position (figure 3.2) thereby allowing the operator to have easy
access to read and reset the DAP meter to zero (DWP, 1992).
Figure 3. 1 DAP meter mounted onto light beam diaphragm of x-ray tube at one of the study sites. This DAP meter is read-out and reset in the x-ray room. Figure 3. 2 DAP meter electrometer and display connected by a cable and operated remote from the x-ray tube at one of the study sites. According to the charge collected by the chamber, the reading of the DAP meter is the
product of the area of the chamber that is exposed to the primary x-ray beam and the
- 21 -
average dose in that area. It is essentially an integration of the absorbed dose over the
whole beam area for the total exposure to the patient. This means that the DAP meter can
provide a single measurement of the total amount of radiation in even the most complex
examinations involving both radiography and fluoroscopy (DWP, 1992).
The chamber should be set perpendicular to and at the centre of the x-ray beam axis such
that the beam area will never exceed the area of the chamber. These criteria are easily
achieved when the chamber is attached to the diaphragm housing of the x-ray tube. In
this position, the chamber does not interfere with the examination and is unlikely to
receive significant back scattered radiation from the patient. The fact that the reading of
the DAP meter is proportional to the product of the beam area and the dose, which is the
same for all planes normal to the beam axis, means that the DAP meter can be mounted
well away from the patient and close to the tube focus where the area of the x-ray beam is
relatively small and dose rates are highest.
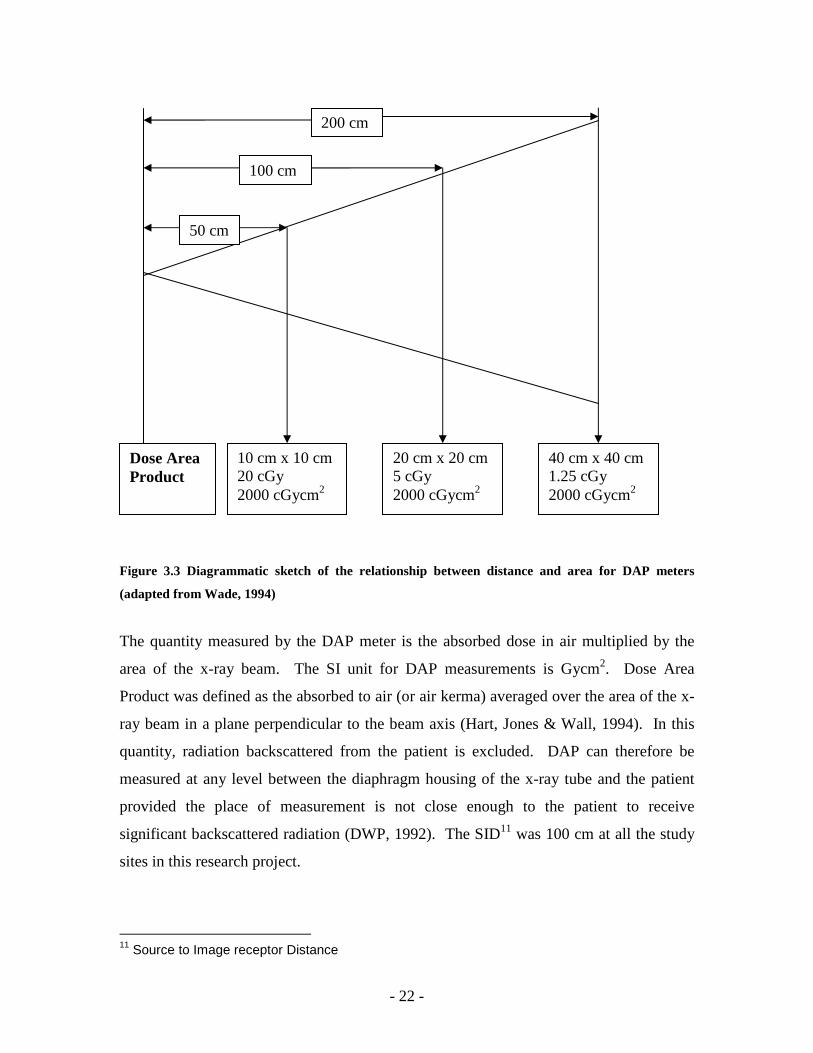
The intensity of the x-ray beam decreases with increasing distance from the source. The
relationship between the intensity and the distance from the source is an inverse square
law, provided that the reduction in intensity is due only to the geometrical divergence and
not to any absorption or scattering of the radiation. The area of the radiation beam
however increases with the square of the distance (Wade, 1994), as shown in figure 3.3.
This means that although the measurement is being made at the level of the light beam
diaphragm assembly, it will equal that at the surface of the patient.
- 22 -
Figure 3.3 Diagrammatic sketch of the relationship between distance and area for DAP meters
(adapted from Wade, 1994)
The quantity measured by the DAP meter is the absorbed dose in air multiplied by the
area of the x-ray beam. The SI unit for DAP measurements is Gycm2. Dose Area
Product was defined as the absorbed to air (or air kerma) averaged over the area of the x-
ray beam in a plane perpendicular to the beam axis (Hart, Jones & Wall, 1994). In this
quantity, radiation backscattered from the patient is excluded. DAP can therefore be
measured at any level between the diaphragm housing of the x-ray tube and the patient
provided the place of measurement is not close enough to the patient to receive
significant backscattered radiation (DWP, 1992). The SID11 was 100 cm at all the study
sites in this research project.
11 Source to Image receptor Distance
10 cm x 10 cm
20 cGy 2000 cGycm2
20 cm x 20 cm 5 cGy 2000 cGycm2
40 cm x 40 cm 1.25 cGy 2000 cGycm2
200 cm
100 cm
50 cm
Dose Area Product

- 23 -
The DAP meter must be calibrated for a range of measured field sizes, kilovoltages,
doses and dose rates. The calibration must cover both fluoroscopy and radiography
modes for diagnostic energies, and be made against a dosemeter calibrated in a manner
traceable to the national primary standard of air kerma with an uncertainty not exceeding
5% at a 95% confidence level for the x-ray qualities and dose rates used in the calibration
(DWP, 1992). The calibration must be done when the dosemeter is first received and
annually thereafter. As the calibration is accurate for the specific equipment in use, it is
preferable to calibrate the DAP meter in situ. If the dosemeter is moved to another x-ray
unit then the calibration should be checked again at installation. In a situation where the
chamber is used for an under-couch x-ray tube, the calibration should be adjusted for the
couch attenuation so that the readings taken need no further corrections when data is
being processed. Alternatively, a correction factor can be measured for the couch
attenuation and this can be applied to the readings in order to obtain the correct dose. For
DAP meters that are fitted with timers, these timers need to be checked for accuracy. The
DAP meter uses an ionisation chamber necessitating temperature and pressure corrections
(DWP, 1992).
During barium meal and barium enema examinations, radiography and fluoroscopy
techniques are employed with the effective x-ray beam moving over a large area of the
patient to demonstrate the necessary anatomy. If thermoluminescent dosemeters were
used, a large number would be required to give the same amount of information as the
DAP meter. The total DAP summed over all the views and fluoroscopy is therefore
better measures of patient dose than entrance surface dose. Since the DAP meter
integrates the total exposure throughout the study despite the continuous alterations in
beam position and beam area (Hart et al, 1994), it is highly suitable for BaM and BaE.
The interaction of ionising radiation with the body tissue results in deposition of energy
referred to as absorbed dose. Since it is not feasible to measure this dose directly in
diagnostic radiology, the effects of this ionising radiation on matter are used to estimate
the absorbed dose. The degree of fogging of a photographic emulsion, the amount of
light photons emitted from a thermoluminescent crystal and amount of ionisation of air
- 24 -
provide estimates of absorbed by a medium. A DAP meter operates under the principle
of ionisation of air and provides a single measurement for absorbed dose in examinations
involving both fluoroscopy and radiography and therefore a suitable dosemeter for
barium contrast examination.
With knowledge of an appropriate dosemeter to measure the radiation dose associated
with barium contrast examinations and the sole goal of delivering the lowest possible
radiation dose coupled with acceptable image quality, the concept of dose limits was
adopted internationally to allow low radiation dose delivery to man. The next chapter is
therefore going to discuss the principle of dose limits and how they are achieved.
- 25 -
CHAPTER 4 DOSE LIMITS
4.1 The principle of dose limits
The substantial biological and epidemiological evidence of radiation induced effects in
man motivated the concept of dose limits and control of radiation risks (ICRP12, 1998).
The ICRP and NRPB13 published dose limits to eradicate the possibility of deterministic
effects and minimise the possibility of stochastic effects. Since medical exposure is
based on benefit versus risk criteria, the “As Low as Reasonably Achievable” (ALARA)
principle was adopted to optimise limiting the exposure of patients to radiation. This
chapter is going to discuss; the legislation of DRLs14, the need for these DRLs, the DRLs
for BaM and BaE from dosimetry studies both internationally and in SA, and the factors
causing variation in these DRLs.
4.2 Diagnostic reference levels
4.2.1 Legislation on diagnostic reference levels
In 1990, the RCR15 and the NRPB introduced reference doses for common x-ray
examinations in the UK following a patient dosimetry survey in 1985 (RCR & NRPB,
1990). The reference doses were determined at the third quartile values of the mean
doses to a representative number of patients for a particular examination. In 1992, a
DWP16 established national protocols that would guide radiology departments in the use
of these reference doses. The radiology departments were to carry out dose
measurements on at least 10 adult patients per examination weighing between 50 kg and
90 kg. Such weight restrictions would ensure that the average weight of the patients
studied would lie 5 kg on either side of 70 kg (65 kg -75 kg) which is the average weight
of an adult man (DWP, 1992). In cases where the mean doses from such dose
12 International Commission on Radiological Protection 13 National Radiological Protection Board 14 Diagnostic Reference Levels 15 Royal College of Radiologists 16 Dosimetry Working Party
- 26 -
measurements exceeded the reference doses and were not clinically justified, causes for
the high doses are sought so as to undertake corrective actions (Wall, 2001).
Similar to reference doses in the UK, the ICRP adopted the term Diagnostic Reference
Levels (DRLs) in 1996 (ICRP, 1996). DRLs were indicated as dose levels that were not
to be exceeded by departments operating under standard and normal diagnostic and
technical practices. The DRLs were also set at the third quartile value of mean dose
obtained for standard sized adult patients or phantoms using a variety of equipment.
While clarifying the use and setting of DRLs, the ICRP indicated that DRLs should be:
• easily measurable dose quantities such as absorbed dose in air and entrance
surface dose for tissue equivalent phantoms or representative patients
• investigation levels above which equipment and procedures must be reviewed to
ascertain whether dose optimisation measures were undertaken
• used as simple tests for identifying unusually high patient dose levels
• complementary to professional judgement and
• related to common types of diagnostic examination and widely defined equipment
and not be used in a precise manner (ICRP, 1996; Matthews & Brennan, 2008).
Additionally, Wall (2001) stressed that dose data from 1 or 2 hospitals should be used to
monitor local trends in patient dose with time and differences between x-ray rooms and
practitioners. In situations where high DRLs or third quartile dose values are recorded,
median dose values should be adopted as reference doses. This is because the median
value is less affected by extreme outliers of under or overweight of the study sample as
compared to the mean DAP value. When Yakoumakis et al (1999) included an
overweight patient in the BaE patient sample, the mean DAP was greatly affected as
compared to the median value. The use of the first quartile values as reference levels is
not recommended as these dose levels may be too low that the image quality is
compromised. First quartile values may therefore be adopted as dose levels for
investigation of image quality in the radiology department (Roberts, 1992).
- 27 -
4.2.2 The need for DRLs
From the above indicators, it can be deduced that DRLs were primarily intended to avoid
situations of high patient radiation exposure without clinical justification. DRLs can
therefore be used to:
• identify techniques, equipment and departments delivering high dose and
facilitate an investigation of such dose. McQuaruz & Tole (1992) found the
absence of dose limits to continually impede radiation protection of patients in
developing countries as poor and ill-maintained equipment were still in use due to
the socio-economic pressures and reluctance to perform quality assurance
programmes.
• obtain optimum dose ranges for particular examinations that represent good
practice. In a dosimetry survey in the UK, reference doses for BaM and BaE were
set at 25 Gycm2 and 60 Gycm2 respectively (DWP, 1992). With knowledge of
specific effective dose, radiologists are capable of promoting dose optimisation as
they influence image quality and radiation dose to the patients (Lampinen &
Rannikko, 1999).
• promote progression towards lower dose and image quality procedures (ICRP,
2002; Matthews & Brennan, 2008). This is evidenced in the dose savings
recorded in the UK dose studies of 40% (Hart et al, 1996) and further 20% (Hart,
Hillier & Wall, 2002) as compared to the 1983 and 1985 (DWP, 1992) and 1995
(Hart et al, 1996) dosimetry studies respectively.
4.2.3 DRLs for barium meal and barium enema examinations
The regulations on adoption of local, regional and country based DRLs for the various x-
ray examinations owing to the demographic variations such as body stature of individuals
from different geographical locations led to dosimetry studies in the different countries
(ICRP, 1996). Tables 4.1 and 4.2 show the mean and third quartile DAP values for BaM
and BaE from various dosimetry studies respectively. The comparability of DAP values
obtained in Spain and Serbia support the concept of country specific DRLs. In Spain,
Ruiz-Cruces, Ruiz, Pĕrez-Martĭnez, Lŏpez et al (2000) obtained mean DAP values of
39.85 Gycm2 and 56.87 Gycm2 for BaM and BaE respectively that compared well with
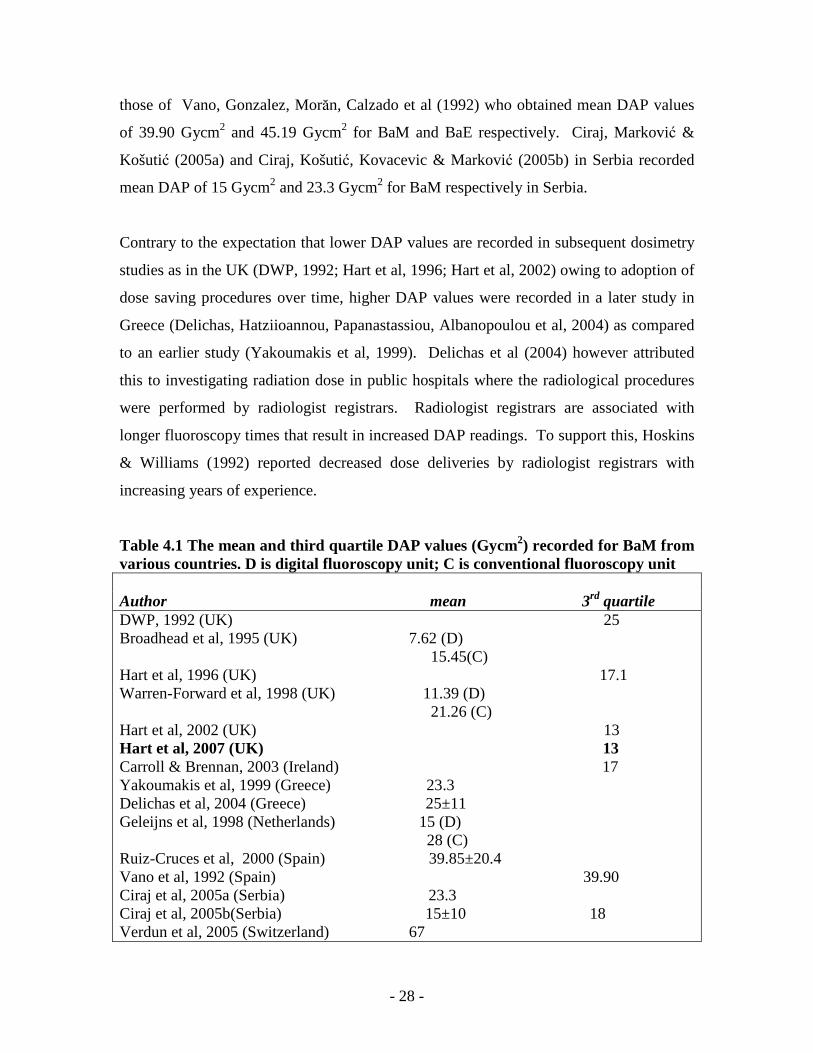
- 28 -
those of Vano, Gonzalez, Morăn, Calzado et al (1992) who obtained mean DAP values
of 39.90 Gycm2 and 45.19 Gycm2 for BaM and BaE respectively. Ciraj, Marković &
Košutić (2005a) and Ciraj, Košutić, Kovacevic & Marković (2005b) in Serbia recorded
mean DAP of 15 Gycm2 and 23.3 Gycm2 for BaM respectively in Serbia.
Contrary to the expectation that lower DAP values are recorded in subsequent dosimetry
studies as in the UK (DWP, 1992; Hart et al, 1996; Hart et al, 2002) owing to adoption of
dose saving procedures over time, higher DAP values were recorded in a later study in
Greece (Delichas, Hatziioannou, Papanastassiou, Albanopoulou et al, 2004) as compared
to an earlier study (Yakoumakis et al, 1999). Delichas et al (2004) however attributed
this to investigating radiation dose in public hospitals where the radiological procedures
were performed by radiologist registrars. Radiologist registrars are associated with
longer fluoroscopy times that result in increased DAP readings. To support this, Hoskins
& Williams (1992) reported decreased dose deliveries by radiologist registrars with
increasing years of experience.
Table 4.1 The mean and third quartile DAP values (Gycm2) recorded for BaM from various countries. D is digital fluoroscopy unit; C is conventional fluoroscopy unit Author mean 3rd quartile DWP, 1992 (UK) 25 Broadhead et al, 1995 (UK) 7.62 (D) 15.45(C) Hart et al, 1996 (UK) 17.1 Warren-Forward et al, 1998 (UK) 11.39 (D) 21.26 (C) Hart et al, 2002 (UK) 13 Hart et al, 2007 (UK) 13 Carroll & Brennan, 2003 (Ireland) 17 Yakoumakis et al, 1999 (Greece) 23.3 Delichas et al, 2004 (Greece) 25±11 Geleijns et al, 1998 (Netherlands) 15 (D) 28 (C) Ruiz-Cruces et al, 2000 (Spain) 39.85±20.4 Vano et al, 1992 (Spain) 39.90 Ciraj et al, 2005a (Serbia) 23.3 Ciraj et al, 2005b(Serbia) 15±10 18 Verdun et al, 2005 (Switzerland) 67
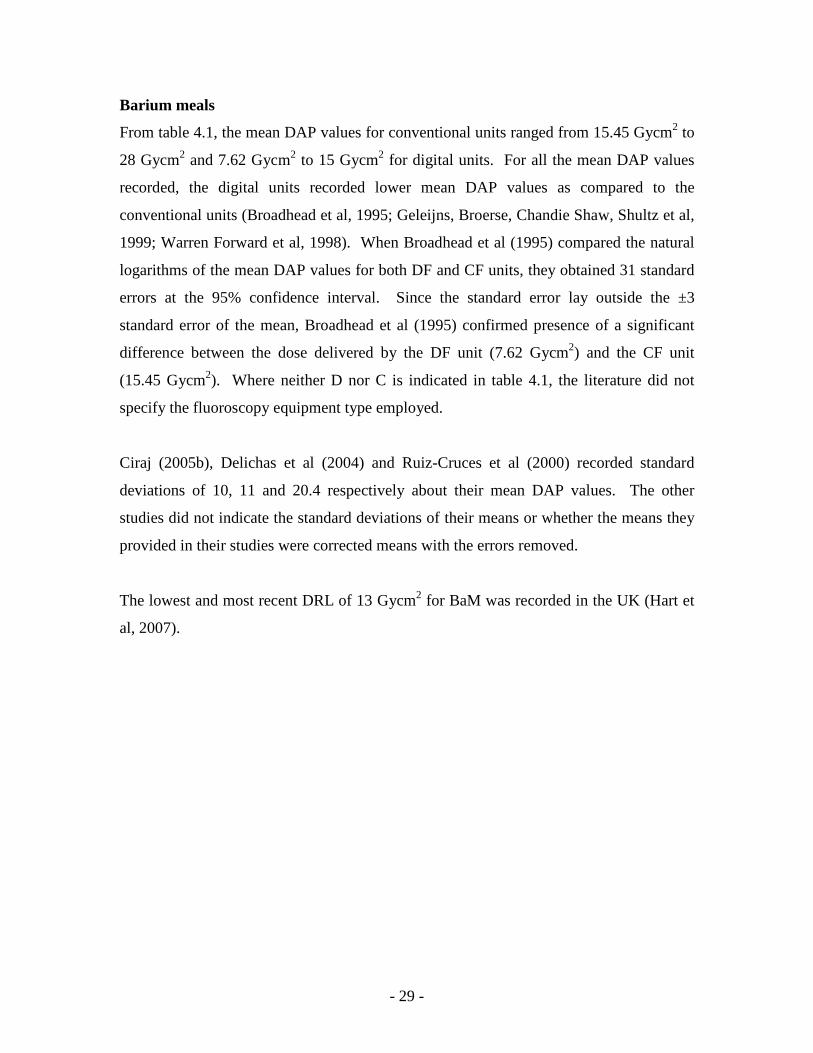
- 29 -
Barium meals
From table 4.1, the mean DAP values for conventional units ranged from 15.45 Gycm2 to
28 Gycm2 and 7.62 Gycm2 to 15 Gycm2 for digital units. For all the mean DAP values
recorded, the digital units recorded lower mean DAP values as compared to the
conventional units (Broadhead et al, 1995; Geleijns, Broerse, Chandie Shaw, Shultz et al,
1999; Warren Forward et al, 1998). When Broadhead et al (1995) compared the natural
logarithms of the mean DAP values for both DF and CF units, they obtained 31 standard
errors at the 95% confidence interval. Since the standard error lay outside the ±3
standard error of the mean, Broadhead et al (1995) confirmed presence of a significant
difference between the dose delivered by the DF unit (7.62 Gycm2) and the CF unit
(15.45 Gycm2). Where neither D nor C is indicated in table 4.1, the literature did not
specify the fluoroscopy equipment type employed.
Ciraj (2005b), Delichas et al (2004) and Ruiz-Cruces et al (2000) recorded standard
deviations of 10, 11 and 20.4 respectively about their mean DAP values. The other
studies did not indicate the standard deviations of their means or whether the means they
provided in their studies were corrected means with the errors removed.
The lowest and most recent DRL of 13 Gycm2 for BaM was recorded in the UK (Hart et
al, 2007).
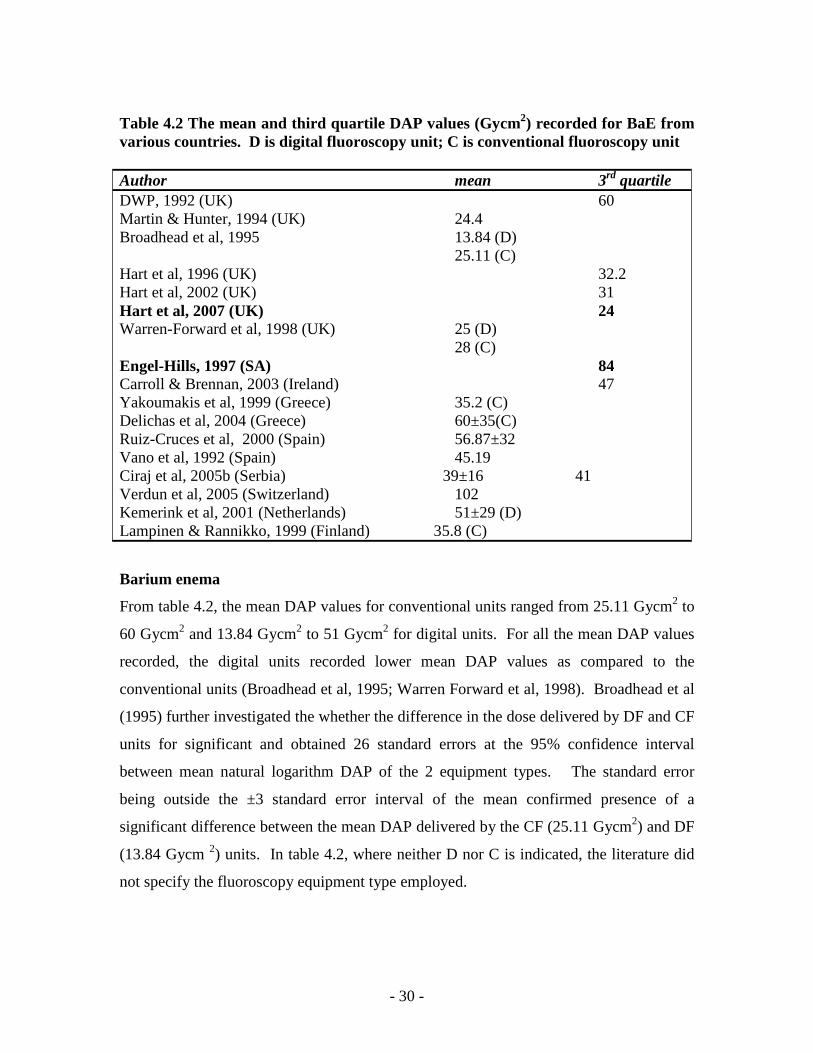
- 30 -
Table 4.2 The mean and third quartile DAP values (Gycm2) recorded for BaE from various countries. D is digital fluoroscopy unit; C is conventional fluoroscopy unit Author mean 3rd quartile DWP, 1992 (UK) 60 Martin & Hunter, 1994 (UK) 24.4 Broadhead et al, 1995 13.84 (D) 25.11 (C) Hart et al, 1996 (UK) 32.2 Hart et al, 2002 (UK) 31 Hart et al, 2007 (UK) 24 Warren-Forward et al, 1998 (UK) 25 (D) 28 (C) Engel-Hills, 1997 (SA) 84 Carroll & Brennan, 2003 (Ireland) 47 Yakoumakis et al, 1999 (Greece) 35.2 (C) Delichas et al, 2004 (Greece) 60±35(C) Ruiz-Cruces et al, 2000 (Spain) 56.87±32 Vano et al, 1992 (Spain) 45.19 Ciraj et al, 2005b (Serbia) 39±16 41 Verdun et al, 2005 (Switzerland) 102 Kemerink et al, 2001 (Netherlands) 51±29 (D) Lampinen & Rannikko, 1999 (Finland) 35.8 (C)
Barium enema
From table 4.2, the mean DAP values for conventional units ranged from 25.11 Gycm2 to
60 Gycm2 and 13.84 Gycm2 to 51 Gycm2 for digital units. For all the mean DAP values
recorded, the digital units recorded lower mean DAP values as compared to the
conventional units (Broadhead et al, 1995; Warren Forward et al, 1998). Broadhead et al
(1995) further investigated the whether the difference in the dose delivered by DF and CF
units for significant and obtained 26 standard errors at the 95% confidence interval
between mean natural logarithm DAP of the 2 equipment types. The standard error
being outside the ±3 standard error interval of the mean confirmed presence of a
significant difference between the mean DAP delivered by the CF (25.11 Gycm2) and DF
(13.84 Gycm 2) units. In table 4.2, where neither D nor C is indicated, the literature did
not specify the fluoroscopy equipment type employed.
- 31 -
Ciraj (2005b), Delichas et al (2004), Kemerink et al (2001) and Ruiz-Cruces et al (2000)
recorded standard deviations of 16, 35, 29 and 32 respectively about their mean DAP
values. The other studies did not indicate the standard deviations of their means or
whether the means they provided in their studies were corrected mean with the errors
removed.
The lowest and most recent DRL of 24 Gycm2 for BaE was recorded in the UK (Hart et
al, 2007). An earlier study in SA recorded a third quartile value of 84 Gycm2 for BaE
(Engel-Hills, 1997).
4.2.4 Factors affecting dose variations
During investigation of patient doses for BaM and BaE, Carroll and Brennan (2003)
recorded individual patient variations of 90 Gycm2 and 45 Gycm2 and mean hospital dose
variations of 4.2 Gycm2 and 7.8 Gycm2 for BaM and BaE respectively. On investigation
of these variations, they developed a four and seven variable regression model for the
BaM and BaE respectively. In decreasing order of importance, the fluoroscopy time
(FT), patient’s weight, fluoroscopy grid ratio and filtration accounted for the 53% DAP
variation for BaM, while FT, number of films, level of filtration, fluoroscopy grid
material, radiographic grid ratio, prior failed colonoscopy and fluoroscopy grid ratio were
responsible for the 70% DAP variation for BaE. The fluoroscopy time, secondary
radiation grid type and the level of filtration affected both BaM and BaE (Carroll &
Brennan, 2003). Martin & Hunter (1994) found that 15% to 20% lower DAP values are
achievable with optimisation of all equipment factors. When the same radiologist is
operating the same equipment using a standard protocol for all patients, any arising
variations are dependant on the patient such as the patient’s weight (Ciraj et al, 2005a).
Besides equipment factors, the dynamic nature of the examination, preference of the
examining radiologist and findings of the examination affect the variation in DAP values
of patients (Yakoumakis et al, 1999; Ciraj et al, 2005a). Lampinen and Rannikko (1999)
attributed the higher DAP values recorded at two university hospitals in Finland to the
more complex BaE protocols that were employed. This is so because more images are
- 32 -
obtained to demonstrate the pathology especially for digital units where images are easily
acquired. Warren-Forward et al (1998) found the DAP value for BaE decreasing by 15 %
as compared to 50% DAP decrease for BaM because of the enormous number of images
obtained for the former. Verdun, Aroua, Trueb, Vock et al (2005) found a strong
correlation between FT and complexity of the examination.
Fluoroscopy time
The main contributor to dose during BaM and BaE examinations is fluoroscopy time
making reduction of FT an intervention for reducing dose to patients referred for such
procedures (Ciraj et al, 2005a). The fluoroscopy time is however affected by the
dynamic nature and findings of the examination. Radiologists are able to control both the
fluoroscopy time and number of radiographic exposures and should therefore justify the
techniques used during BaM and BaE (Vehmas, Lampinen, Mertjarvi & Rannikko, 2000;
Verdun et al, 2005). Radiology registrars have been found to register longer FT of the
order of 6.45 minutes (BaM) and 9.1 minutes (BaE) as compared to qualified radiologists
who recorded 3.1 minutes and 3.2 minutes for BaM and BaE respectively (Yakoumakis et
al, 1999). A total DAP reduction of 11% is feasible by decreasing the FT and thus the
fluoroscopy dose (Horton, Cook & Taylor, 1992).
Additional filtration
In fluoroscopy equipment, copper of 0.2mm to 0.5 mm is used to provide additional
filtration of the x-ray beam. In this way, the beam is hardened and only the high energy
x-rays reach the patient as the low penetrating x-rays are filtered out resulting in lower
absorbed dose to the patient and therefore lower DAP values (Geleijns et al, 1998;
Kemerink et al, 2001). This additional filtration does not however decrease the DAP and
effective dose by the same proportion. Morrell, Rogers, Jobling and Shakespeare (2004)
found the additional copper filtration to decrease the DAP by 54% and the effective dose
by only 11% with 30% more x-ray tube loading. It is therefore recommended that
fluoroscopy units with additional copper filtration must adopt lower DRLs than units
devoid of such filtration (Martin, 2004).
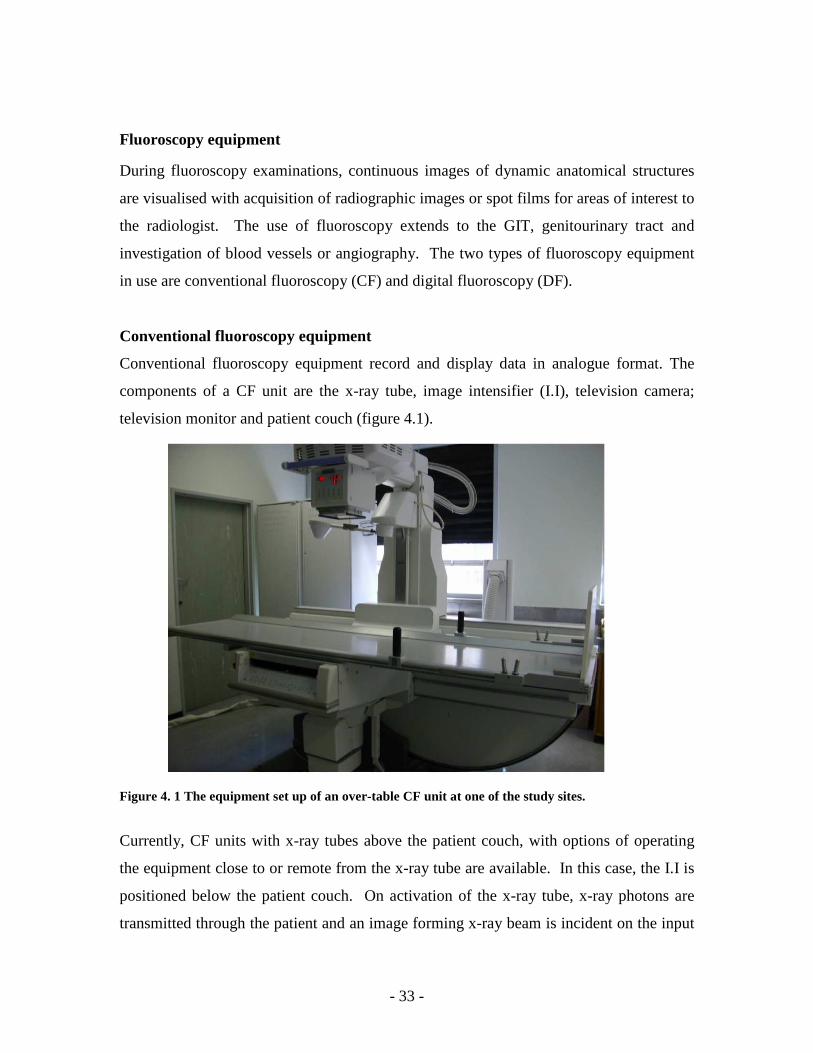
- 33 -
Fluoroscopy equipment
During fluoroscopy examinations, continuous images of dynamic anatomical structures
are visualised with acquisition of radiographic images or spot films for areas of interest to
the radiologist. The use of fluoroscopy extends to the GIT, genitourinary tract and
investigation of blood vessels or angiography. The two types of fluoroscopy equipment
in use are conventional fluoroscopy (CF) and digital fluoroscopy (DF).
Conventional fluoroscopy equipment
Conventional fluoroscopy equipment record and display data in analogue format. The
components of a CF unit are the x-ray tube, image intensifier (I.I), television camera;
television monitor and patient couch (figure 4.1).
Figure 4. 1 The equipment set up of an over-table CF unit at one of the study sites.
Currently, CF units with x-ray tubes above the patient couch, with options of operating
the equipment close to or remote from the x-ray tube are available. In this case, the I.I is
positioned below the patient couch. On activation of the x-ray tube, x-ray photons are
transmitted through the patient and an image forming x-ray beam is incident on the input
- 34 -
phosphor of the I.I. In the I.I, each x-ray is multiplied into a large number of light
photons resulting in a bright image that is visualised on the television monitor. Spot
images of areas of interest are then acquired on spot films (Bushong, 2004:358-369).
Images acquired with CF equipment cannot be manipulated or post-processed after
acquisition to alter their image detail contrast. As such, strict exposure requirements need
to be observed to allow acquisition of diagnostic quality images. Furthermore, the dose
levels delivered in CF are dependant on the sensitivity of the image receptor and film
latitude (Broadhead et al, 1995).
Digital fluoroscopy equipment
The configuration of DF equipment is similar to CF equipment except for the addition of
an analog to digital converter (ADC), a computer, operator console and two television
monitors. The ADC converts the analogue information from the image intensifier into
digital information that is interpreted by the computer.
The advantages of DF over CF equipment include:
• The ability to acquire images using x-ray spectrums with exposure levels that
result in dose saving.
• Flexibility for image processing and display resulting in recovery of any loss of
image contrast.
• Easy acquisition and immediate display of images that may result in fewer
radiographs being acquired and therefore reduced dose to the patient (Broadhead
et al, 1995)
Dynamic flat panel solid state x-ray image detector DF systems
The current advancement in DF equipment has replaced the I.I, video camera and ADC
system with direct digital conversion detectors or flat panel detectors. The flat panel
detectors are composed of Caesium Iodide scintillators that absorb the x-ray photons and
convert them to light photons. The light photons are absorbed by low noise photodiode
arrays of amorphous Silicon panels that convert the light photons into an electronic
charge. With each photodiode array representing a pixel, the charge on each pixel is read
out by low noise electronics and turned into digital data that are sent to the image
- 35 -
processor. This type of DF equipment is currently predominantly used in cardiac and
vascular systems offering:
• Improved image quality given the smaller pixel size and higher detection quantum
efficiency of the detectors
• Greater contrast resolution and
• more room space for radiology personnel when carrying out examinations given
the small size of the equipment (Cowen, Davies & Sivananthan, 2008).
DAP variation for conventional and digital equipment
Engel-Hills and Hering (2001) associated the hospital DAP variations to the different
equipment used at the hospitals. The old under-couch unit recorded the lowest mean FT
but high DAP values as compared to the digital unit with high FT but lowest DAP values.
Geleijns et al (1998) recorded mean DAP values for digital units (15 Gycm2) that were
almost half those obtained for the conventional units (28 Gycm2) attributing this to less
spot films acquired during the digital imaging. Interestingly, digital equipment was also
capable of maintaining DAP values below 15 Gycm2 when over 28 projections were
obtained. Though lower DAP values have been achieved in other studies, Geleijns et al
(1998) proposed that a DAP value of 30 Gycm2 for BaM can ensure that the effective
dose is maintained below 15mSv.
The dose saving options of digital equipment such as pulsed fluoroscopy have allowed
the recording of lower DAP values. The training of radiology personnel is however
essential in realising these dose savings and care must be taken that the achievement of
low doses is not through compromising the image quality (Martin, 2004).
Equipment set-up
The radiation dose delivered to patients is also dependant on the equipment set up.
Equipment with the automatic exposure control (AEC) component can use dose saving
techniques by selecting high tube potentials for radiography that result in less absorbed
dose for the patients and therefore lower DAP values (Yakoumakis et al, 1999). The
lower tube voltages in the investigation of patient doses resulted in high DAP values for
- 36 -
BaE (Kemerink et al, 2001). High kilovoltages of the order of 102 kV to 125 kV17 during
radiography and low kilovoltages (73 kV to 83 kV) and low tube currents (1.8 mA18 to
2.4 mA) during fluoroscopy result in decreased DAP values. The low factors used during
fluoroscopy result in poor image quality (Hart & Wall, 1994) but this can be manipulated
during post-processing of the images with digital units (Broadhead et al, 1995).
Awareness of being monitored
Crawley, Shine and Booth (1998) and Horton et al (1992) recorded lower doses for
patients when radiology personnel were aware of being monitored. The awareness of
being monitored thereby served as an incentive in reducing radiation exposure to the
patients.
With the understanding of the principle of dose limits and their need, a research
methodology was adopted from the UK national protocols to investigate the radiation
dose levels for BaM and BaE in the Western Cape, SA. The research methodology is
systematically explained in the next chapter.
17 Kilovoltage 18 milliamperes
- 37 -
CHAPTER 5 RESEARCH METHODOLOGY
5.1 Introduction
Increasing efforts to reduce radiation dose to patients during fluoroscopy examinations,
have led to a legal requirement that all fixed fluoroscopy equipment must have a DAP
meter permanently installed from January 2008 in South Africa (DoH19 SA, 2006). This
allows for routine measurement of the radiation dose to patients referred for fluoroscopy
examinations and estimation of national Diagnostic Reference dose Levels for SA when
data from the different hospitals are collected and analysed. Known reference doses
measured in Gycm2 are needed to act as guiding principles to radiology personnel when
exposing patients to ionising radiation and to maximise the benefits from the inclusion of
DAP meters on all fluoroscopy equipment.
This study investigated and measured the radiation doses received by patients during
BaM and BaE and in this chapter, the research methodology, research design, inclusion
and exclusion criteria of sites and patients, tools for data collection, statistical analysis,
validity and reliability of measurement tools, delimitation of the study, research
assumptions and ethical considerations are discussed.
5.2 Research methodology
5.2.1 Descriptive quantitative survey research
A descriptive quantitative survey method correlated to the UK national protocols (DWP,
1992) was used to establish local DRLs for BaM and BaE. A descriptive quantitative
survey method relies on collecting data through observation of participants in their
present situation without any modifications to the characteristics under investigation
(Leedy & Ormrod, 2001: 191,196). The UK protocols recommend that dose studies be
carried out on patients rather than phantoms to give a clear indication of the radiation
dose delivered in reality (DWP, 1992). Chapple, Broadhead & Faulkner (1995) used
19 Department of Health
- 38 -
phantoms to estimate doses during barium studies and obtained lower doses in
comparison to studies where real patients were used (DWP, 1992).
In this study, the radiation doses were recorded for the BaM and BaE as they were
routinely performed at the research sites. In this way, a true indication of radiation dose
received by patients referred for BaM and BaE was obtained.
5.2.2 Site and participant selection
Through telephone calls to state and private hospitals in the Western Cape, a list of
hospitals with permanently installed DAP meters was developed by the researcher. The
researcher further inquired about the number of BaM and BaE performed at the hospitals.
This allowed for suitable sites with sufficient measurement data to be obtained so that the
data collection process was completed within the allocated time frame.
Inclusion criteria
Research sites
Three state hospitals were selected as research sites for the study. In addition to having
DAP meters permanently mounted to their fluoroscopy units, they routinely performed
BaM and BaE. These sites also captured a large number of patients and had a variety of
equipment that is; digital and conventional fluoroscopy units enabling investigation of
doses with both types of the equipment. The specifications of the fluoroscopy units used
at the study sites are given in Appendix 120.
Patient participants
The study included both male and female patients referred for BaM and BaE that were
between 18 years and 85 years and weighed 50 kg to 90 kg. The 50 kg to 90 kg weight
range was in order to effect a mean weight for the sample that would be not more or less
than 5 kg from 70 kg that is to say; 65 kg to 75 kg. This is a good indication of the
typical weight of an average adult patient (DWP, 1992) and therefore appropriate to the
calculation of a reference dose for an adult population. The plan was that at least 10 BaM
20 Fluoroscopy equipment specifications for equipment at the 3 study site (page 93)
- 39 -
and 10 BaE patients would be selected from each of 3 research sites with a total of 30
patients for each examination in this study (DWP, 1992).
Exclusion criteria
Research sites
Hospitals that did not have permanently fitted DAP meters on their fluoroscopy units
were excluded from the study. Furthermore, hospitals with DAP meters but performed
very few BaM and BaE were also excluded. The number of BaM and BaE performed by
a hospital was forecasted from the number of patients that attended in the year prior
(2007) to this research project.
Patient participants
The researcher excluded patient participants;
• younger than 18 and older than 85 years,
• weighing less than 50 kg or greater than 90 kg,
• in whom other contrast media other than barium sulphate was used for the
investigation of the GIT and
• that were very frail.
5.2.3 Time frame
The intended time frame for data collection was June 2008 to February 2009. Data
collection was extended to June 2009 so that adequate data could be collected.
5.2.4 Pilot study
A pilot study was conducted at one of the research sites. This tested the relevancy of the
research variables included on the data capture sheet and allowed for the necessary
changes to be made prior to the main study (Leedy & Ormrod, 2001:116).

- 40 -
5.2.5 Data collected
The data pertaining to the study objectives were recorded on the data capture sheet in
Appendix 221. These included the demographics of the patients, the indication for the
BaM or BaE, equipment and exposure factors, DAP value, degree of difficulty of the
examination, number of images obtained and grade or level of training of the radiologist
performing the BaM or BaE. Only data from completed examinations were included in
the data analysis.
Patient demographics
The demographics of the patients that were recorded were; age, gender, weight and the
indication for the BaM or BaE.
• Age
The DWP (1992) recommends that adults rather than children be considered when setting
reference doses. The age of the patients assisted in ensuring that only adult patients were
recruited for the study.
• Weight
When obtaining reference doses, the patients’ weights are determined to ensure the mean
weight of the sample corresponds to that of an adult patient. Only then can reference
doses be generalised to the adult population.
• Indication
The indication or reason for referral for the BaM or BaE was obtained from the patient’s
request form. Depending on the indication for the study, more images may be acquired
and long FT recorded while establishing the radiological finding. The indication for their
study may therefore be used to explain long FT and high number of images acquired
during the study.
Exposure factors for radiography and fluoroscopy
All the fluoroscopy units in the study used the automated brightness control (ABC) where
the exposure factors are automatically selected by the fluoroscopy unit for the anatomical
area being irradiated. For each radiographic image acquired, the tube potential (kV), the
21 Data capture sheet (page 94)
- 41 -
product of the tube current and time in milli ampere seconds (mAs) and time in seconds
were recorded. For fluoroscopy, the tube potential (kV), the tube current (mA) and the
fluoroscopy time in minutes were also recorded at the end of the examination.
The number of images
The number of images was the number of images recorded in the radiography phase for
the digital units and the number of spot images for the conventional unit.
DAP value
The total DAP reading in Gray per square centimetre (Gycm2) was recorded at the end of
each examination from the DAP meter display.
Level of difficulty of the examination
This was ascertained by the radiologist performing the examination from his knowledge
and experience of performing BaM and BaE. The radiation doses tend to be higher for
difficult examinations as many images are acquired and long FT recorded.
Level of training of the radiologist
The level of training of the radiologist was obtained by the researcher through a verbal
communication with the radiologists performing the BaM or BaE.
5.2.6 Validity and reliability of the measurement instruments
Jackson (2008) describes validity of a measurement instrument as the extent to which the
instrument measures its intended variable whereas instrument reliability is the degree of
consistency of measurement values in the same participant.
• Error in measurement
Errors in measurement of variables are divided into method and trait errors. Method
errors arise from the researcher or practitioner and research environment, whereas trait
errors stem from the participants. Though trait errors are difficult to control, method
errors are minimised by the training of individuals in the use of the measuring
instruments and the calibration of these instruments (Jackson, 2008:67).

- 42 -
• Procedure for recording weight
The weights of the patients were measured using calibrated digital bathroom scales
(Safeway deviation ±100g) that were automatically reset to zero for every new weight
measurement. Digital bathroom scales were employed in the study because they
displayed a numerical value thereby eliminating inter-observer variation in recording of
participants’ weights. The patients’ weights were obtained under similar conditions with
the patients wearing hospitals gowns only and with shoes removed.
• Fluoroscopy units and DAP meters
Individual equipment records (IER) are documents that show the type of equipment and
the quality control (QC) tests performed on the equipment in the radiology departments
(DoH22 SA, 2006). The IER were obtained for all the fluoroscopy units and DAP meters
to establish that they passed the acceptance and QC tests. The medical physicist further
examined these records to ensure that the fluoroscopy units and DAP meters operated
within the prescribed accuracy and precision measurements (DWP, 1992). The DAP
meters were always reset to zero at the beginning of each BaM and BaE. This was
ensured by the responsible persons identified at each study site. At site 3, the in-charge
radiographer of the fluoroscopy room was the responsible person while the researcher
was the responsible person at sites 1 and 2.
• Data capturing
The radiographers involved in the data capture process in this study were trained in the
acquisition and recording of data relevant to the study thereby improving the reliability of
the data collected. Furthermore, the researcher verified the completeness of the data
capture sheet before entering the data into the computer program.
5.2.7 Delimitation of research
This research measured the radiation doses received by both male and female patients
between 18 years and 85 years weighing 50 kg to 90 kg referred for BaM and BaE at 3
hospitals in the Western Cape, SA. The radiation doses were measured using DAP
meters that were permanently installed on either digital or conventional fluoroscopy
22 Department of Health
- 43 -
equipment. The radiation doses were measured in Gycm2 using DAP meters that were
permanently installed onto the fluoroscopy units.
5.2.8 Research assumptions
The research assumptions were;
• the radiographers followed the procedure of recruiting patients into the study
• the radiographers accurately recorded all the relevant information on the data
sheet
• all equipment were accurately calibrated.
5.3 Ethical consideration
Researchers are responsible for participants’ welfare in surveys. They must; minimise
the risks, reduce possible harm, ensure voluntary participation, maintain the ethical
standard of confidentiality and anonymity, include an informed consent process and
ensure privacy of the participants. An application was submitted to the Faculty of Health
and Wellness Sciences Research Ethics Committee and approval was granted (Ref:
CPUT/HW-REC 2008/010). The study sites accepted the ethics approval of the higher
education institution. The heads of the radiology departments of the research sites signed
letters of permission for the project to commence. In view of confidentiality, these letters
and the ethics approval certificate from the university are not included as appendices but
are available on request.
Walliman (2005), proposes two perspectives from which to view ethical issues in
research; values of honesty and integrity of the researcher and ethical responsibility to the
participants.
5.3.1 Ethical responsibility to the participants
The ethical responsibility to the participants included ensuring voluntary participation,
good informed consent process, confidentiality, anonymity and privacy. After acquiring
the age of the patient from the hospital folder, the research project was explained to the
patient so as to obtain informed consent for participation in the study. Participation in the

- 44 -
study was completely voluntary with no prejudice against patients who declined their
involvement at any stage during the data collection.
Since the study sites had patients from all ethnic backgrounds, the aims and objectives of
the study were explained to the patients in English, Afrikaans or Xhosa. Consent forms
were available in all these 3 languages. Appendix 323 shows the English consent form. On
signing the consent form, the participants were assigned study codes to ensure anonymity
of the information obtained from them. The weights of the participants were measured
inside the x-ray room and the completed data capture sheets were stored in locked
cabinets that only the researcher had access to.
5.3.2 Values of honesty and integrity of the researcher
The researcher has acknowledged all sources of information and the results of the study
have been analysed without manipulation to draw false conclusions that are not derived
from the research findings (Walliman, 2005).
5.4 Barium enema examination protocols
The patient preparation, contrast medium, equipment used and projections undertaken for
the barium enema procedures at the study sites are discussed.
5.4.1 Study site 1
Site 1 used a CF unit with an over-couch x-ray tube.
Patient preparation
The patients were prepared 2 days before the BaE. Two days prior to the examination,
the patients drank plenty of fluids and had their last solid meal at 18H00 two days before
the examination. For example; a patient due for the BaE on Monday would have their
last solid meal at 18H00 on Saturday.
On Sunday, the patient drank a bottle of sodium phosphate at 8H00 and swallowed 3
solflax tablets with a glass of water. These are laxatives. The patient then continued on a
23 Consent form (page 95)
- 45 -
clear fluid diet that included fruit juice, water, jelly, black tea or coffee (no milk). The
clear fluids were taken at intervals of one glass per hour. On the day of the examination;
in this case Monday, the patient drank black tea or coffee or juice.
Barium enema contrast
Barium sulphate is an insoluble radio-opaque material that enables visualisation of the
GIT. Barium sulphate is inert, not absorbed or metabolised by the body and is eliminated
unchanged from the body (Axim pharmaceuticals, 2001; Brady & Holum, 1988: 896).
Composition
The barium sulphate at study site 1 was Axim Polibar ACB that constituted a dry white
powder of 96% barium sulphate for every 100g of the Axim Polibar ACB. An amount of
397g of barium sulphate was used for the BaE.
Dosage and mixing instructions
The 397g of the contrast was mixed with 400 millilitres (mls) to 700 mls of warm water
(400C) to give a contrast density of 76% mass per volume and 47% mass per volume
respectively.
Contraindications
Barium sulphate is contraindicated in colon obstruction, presence of suspected or
impending gastro-intestinal perforation, known hypersensitivity to Barium Sulphate, in
patients at risk of perforation e.g. acute ulcerative colitis or diverticulitis and following
rectal or colonic biopsy, sigmoidoscopy or radiotherapy (Axim pharmaceuticals, 2001;
Caroline & Kendzierski, 2008: 630).
Barium enema equipment
The barium enema equipment used was;
• a miller disposable enema catheter with tube and inflatable cuff,
• hand air pump and balloon inflator
• 397g of barium sulphate dry powder,
• drip stand
• pair of forceps
• 2 ampoules of micro Hyoscine-N-butylbromide each 20mg
- 46 -
Barium enema procedure with the conventional fluoroscopy unit
The radiographer obtained the preliminary film of the abdomen of the patient. This was
to ascertain adequate bowel preparation. The absence of faecal matter in the colon was
an indication of adequate bowel preparation. In cases where faecal matter was seen in the
colon, the procedure was cancelled and the patient was given more laxatives to allow
bowel emptying.
The radiographer mixed the barium sulphate as explained above and suspended the
barium sulphate bag on a drip stand that was approximately 2 meters high. With the
patient in the left lateral decubitus position, the radiologist performed a rectal
examination to exclude rectal obstruction, nodules, tenderness, irregularities,
haemorrhoids, pre-sacral space and faecal impaction (Holmes, Tscheslog, Hendler,
Morrel, et al, 1997: 443).
The radiologist then inserted the enema catheter that was connected by a tube to a 400 ml
to 700 ml barium sulphate suspension infusion bag. The enema tube was clamped to
prevent the barium suspension from flowing into the rectum at insertion of the catheter.
A pair of forceps was used to clamp the hand pump. Using a balloon inflator, the
radiologist then inflated the cuff on the enema catheter just distal to the point of insertion
of the rectal catheter. This aided in retention of the catheter during the procedure. The
enema tube was also connected to a hand pump that was used to inject air during the
procedure.
With intermittent screening and the patient maintained in the left lateral decubitus
position, the forceps were removed and the barium contrast suspension flowed freely into
the rectum. An image of the lateral rectum was obtained at this stage to demonstrate the
pre-sacral space. When the barium reached the hepatic flexure, 2 ml of micro Hyoscine-
N-butylbromide were administered intravenously to the patient. Micro Hyoscine-N-
butylbromide is a smooth muscle relaxant that regulates bowel movements.
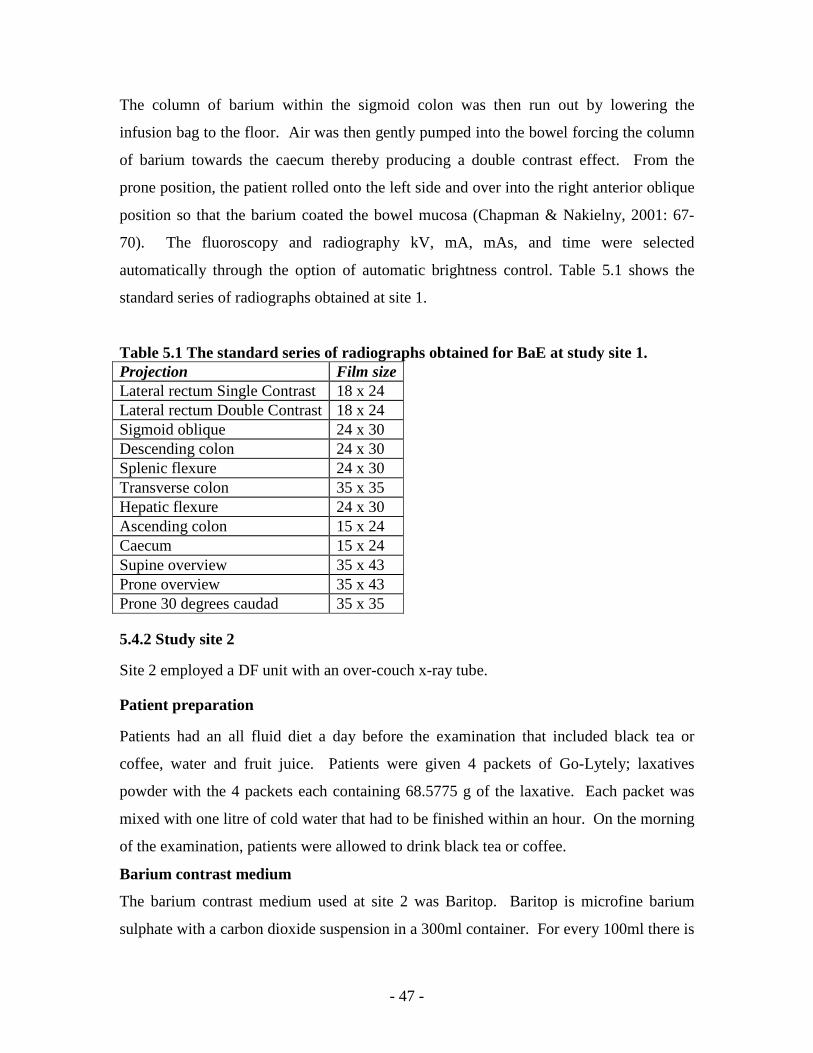
- 47 -
The column of barium within the sigmoid colon was then run out by lowering the
infusion bag to the floor. Air was then gently pumped into the bowel forcing the column
of barium towards the caecum thereby producing a double contrast effect. From the
prone position, the patient rolled onto the left side and over into the right anterior oblique
position so that the barium coated the bowel mucosa (Chapman & Nakielny, 2001: 67-
70). The fluoroscopy and radiography kV, mA, mAs, and time were selected
automatically through the option of automatic brightness control. Table 5.1 shows the
standard series of radiographs obtained at site 1.
Table 5.1 The standard series of radiographs obtained for BaE at study site 1. Projection Film size Lateral rectum Single Contrast 18 x 24 Lateral rectum Double Contrast 18 x 24 Sigmoid oblique 24 x 30 Descending colon 24 x 30 Splenic flexure 24 x 30 Transverse colon 35 x 35 Hepatic flexure 24 x 30 Ascending colon 15 x 24 Caecum 15 x 24 Supine overview 35 x 43 Prone overview 35 x 43 Prone 30 degrees caudad 35 x 35
5.4.2 Study site 2
Site 2 employed a DF unit with an over-couch x-ray tube.
Patient preparation
Patients had an all fluid diet a day before the examination that included black tea or
coffee, water and fruit juice. Patients were given 4 packets of Go-Lytely; laxatives
powder with the 4 packets each containing 68.5775 g of the laxative. Each packet was
mixed with one litre of cold water that had to be finished within an hour. On the morning
of the examination, patients were allowed to drink black tea or coffee.
Barium contrast medium
The barium contrast medium used at site 2 was Baritop. Baritop is microfine barium
sulphate with a carbon dioxide suspension in a 300ml container. For every 100ml there is
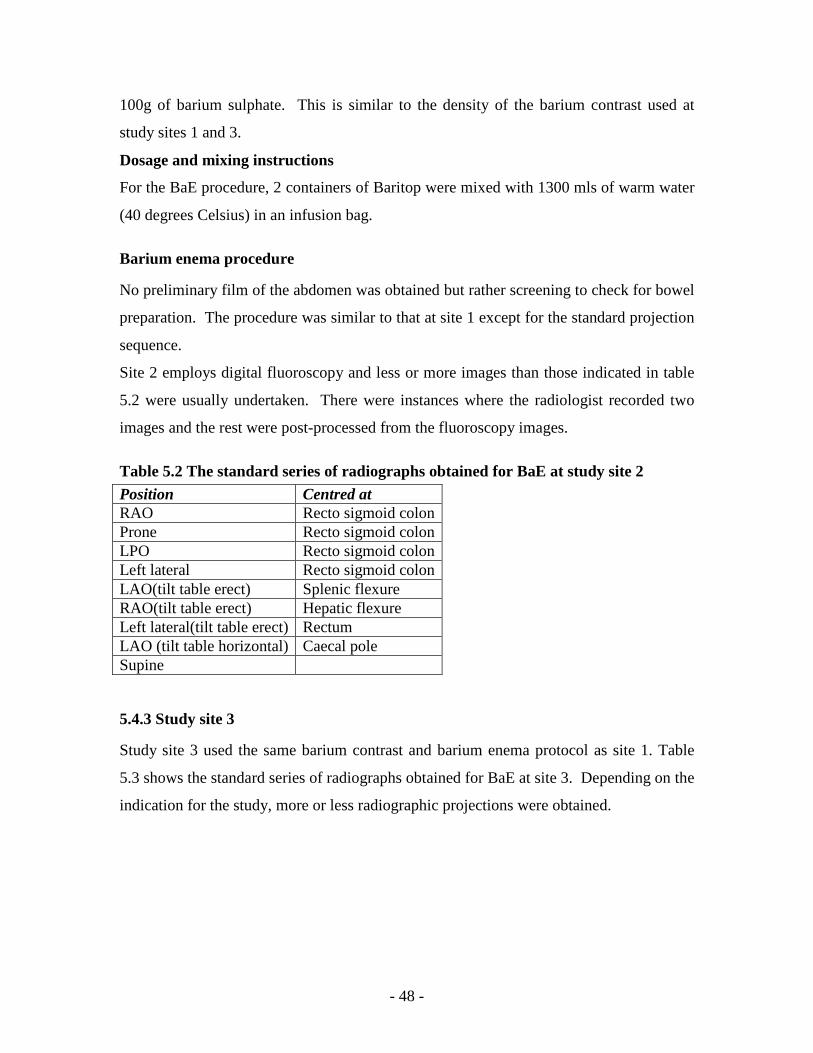
- 48 -
100g of barium sulphate. This is similar to the density of the barium contrast used at
study sites 1 and 3.
Dosage and mixing instructions
For the BaE procedure, 2 containers of Baritop were mixed with 1300 mls of warm water
(40 degrees Celsius) in an infusion bag.
Barium enema procedure
No preliminary film of the abdomen was obtained but rather screening to check for bowel
preparation. The procedure was similar to that at site 1 except for the standard projection
sequence.
Site 2 employs digital fluoroscopy and less or more images than those indicated in table
5.2 were usually undertaken. There were instances where the radiologist recorded two
images and the rest were post-processed from the fluoroscopy images.
Table 5.2 The standard series of radiographs obtained for BaE at study site 2 Position Centred at RAO Recto sigmoid colon Prone Recto sigmoid colon LPO Recto sigmoid colon Left lateral Recto sigmoid colon LAO(tilt table erect) Splenic flexure RAO(tilt table erect) Hepatic flexure Left lateral(tilt table erect) Rectum LAO (tilt table horizontal) Caecal pole Supine
5.4.3 Study site 3
Study site 3 used the same barium contrast and barium enema protocol as site 1. Table
5.3 shows the standard series of radiographs obtained for BaE at site 3. Depending on the
indication for the study, more or less radiographic projections were obtained.
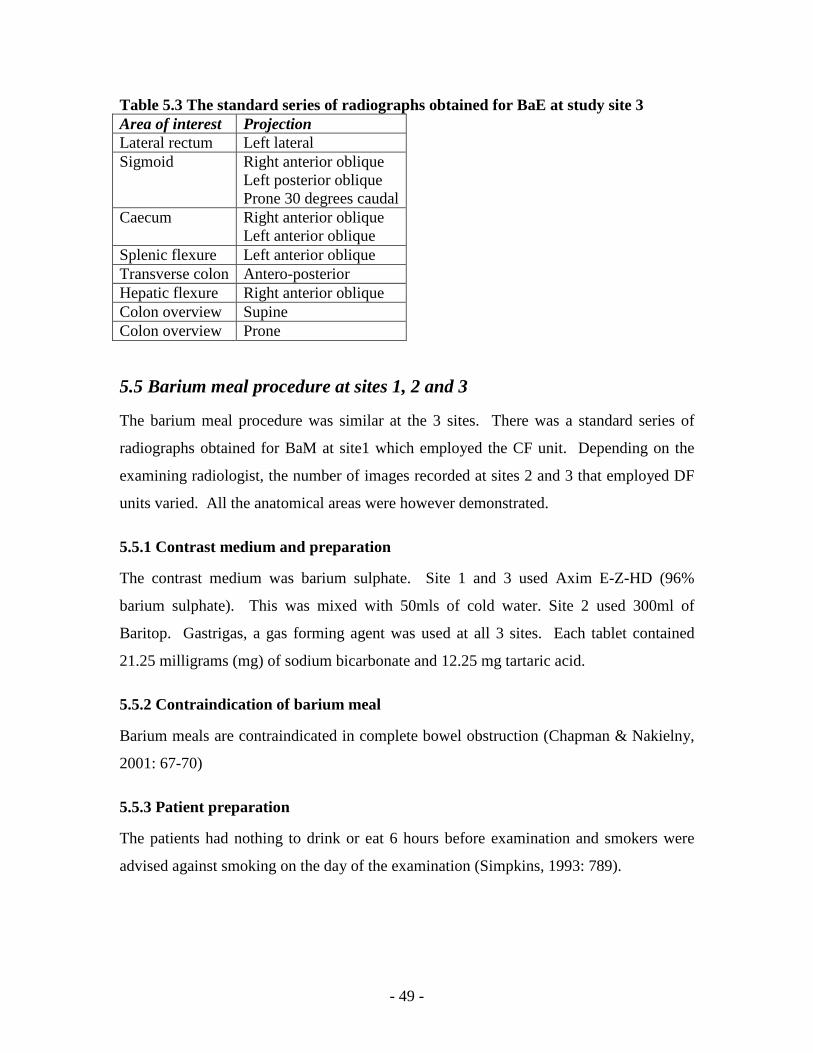
- 49 -
Table 5.3 The standard series of radiographs obtained for BaE at study site 3 Area of interest Projection Lateral rectum Left lateral Sigmoid Right anterior oblique
Left posterior oblique Prone 30 degrees caudal
Caecum Right anterior oblique Left anterior oblique
Splenic flexure Left anterior oblique Transverse colon Antero-posterior Hepatic flexure Right anterior oblique Colon overview Supine Colon overview Prone
5.5 Barium meal procedure at sites 1, 2 and 3
The barium meal procedure was similar at the 3 sites. There was a standard series of
radiographs obtained for BaM at site1 which employed the CF unit. Depending on the
examining radiologist, the number of images recorded at sites 2 and 3 that employed DF
units varied. All the anatomical areas were however demonstrated.
5.5.1 Contrast medium and preparation
The contrast medium was barium sulphate. Site 1 and 3 used Axim E-Z-HD (96%
barium sulphate). This was mixed with 50mls of cold water. Site 2 used 300ml of
Baritop. Gastrigas, a gas forming agent was used at all 3 sites. Each tablet contained
21.25 milligrams (mg) of sodium bicarbonate and 12.25 mg tartaric acid.
5.5.2 Contraindication of barium meal
Barium meals are contraindicated in complete bowel obstruction (Chapman & Nakielny,
2001: 67-70)
5.5.3 Patient preparation
The patients had nothing to drink or eat 6 hours before examination and smokers were
advised against smoking on the day of the examination (Simpkins, 1993: 789).

- 50 -
5.5.4 Technique
• The patient swallowed the gas producing agent with 5ml of water
• The patient then drank the barium suspension while lying on left side to prevent
the barium from reaching the duodenum quickly and obscuring the greater curve
of the stomach
• While lying in the supine position and slightly to the right side, the barium got up
against the gastro-oesophageal junction. Such a position aided the radiologist to
check for reflux
• An intravenous injection of micro Hyoscine-N-butylbromide (20 mg/ml) was
administered to the patient to relax the smooth muscle
• The patient then rolled onto the right side and over in a complete circle to coat the
gastric mucosa (Chapman & Nakielny, 2001: 67-70). The sequence of
radiographs recorded for the BaM is shown in table 5.4.
Table 5.4 The sequence of radiographs obtained for BaM at the 3 study sites Position Demonstrates RAO Antrum and greater curve with barium in the
fundus Supine Antrum and body LAO Lesser curve and face Left lateral tilted head up 45 degrees
Fundus
Prone Duodenal loop Prone, RAO, supine, LAO Spot views of cap x 4 Erect Fundus Erect caps; RAO, steep LAO Caps x 2 Swallow RAO Oesophagus x 2
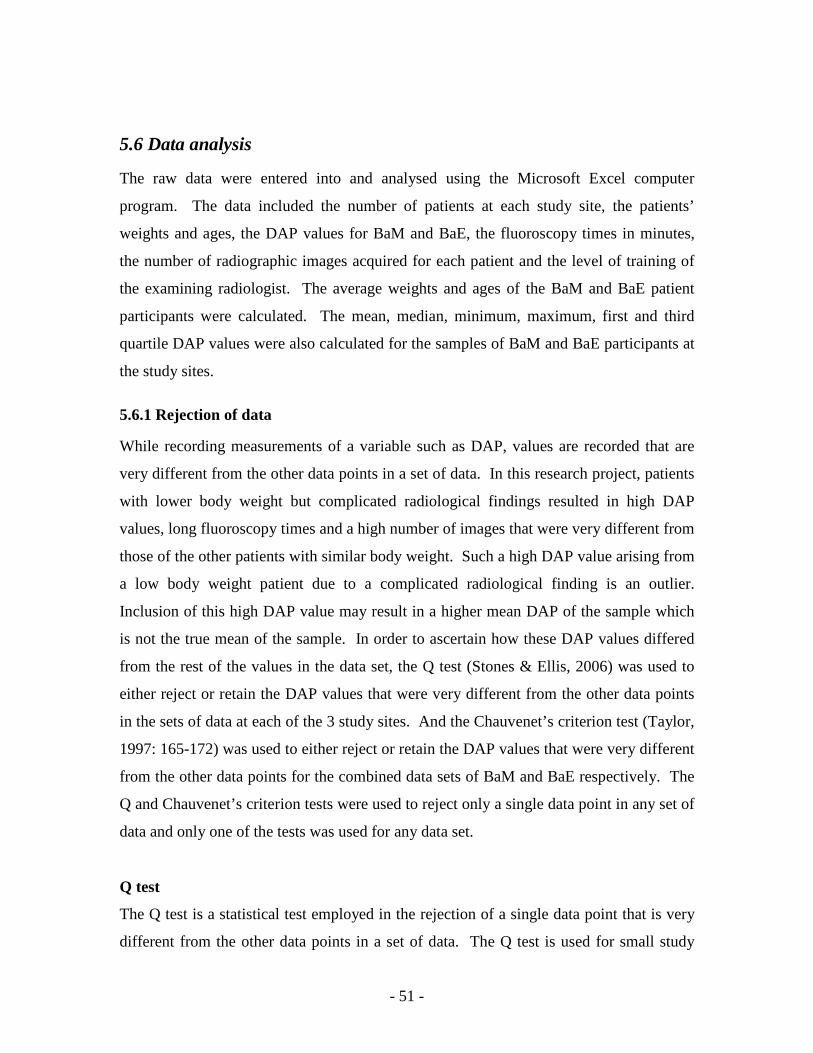
- 51 -
5.6 Data analysis
The raw data were entered into and analysed using the Microsoft Excel computer
program. The data included the number of patients at each study site, the patients’
weights and ages, the DAP values for BaM and BaE, the fluoroscopy times in minutes,
the number of radiographic images acquired for each patient and the level of training of
the examining radiologist. The average weights and ages of the BaM and BaE patient
participants were calculated. The mean, median, minimum, maximum, first and third
quartile DAP values were also calculated for the samples of BaM and BaE participants at
the study sites.
5.6.1 Rejection of data
While recording measurements of a variable such as DAP, values are recorded that are
very different from the other data points in a set of data. In this research project, patients
with lower body weight but complicated radiological findings resulted in high DAP
values, long fluoroscopy times and a high number of images that were very different from
those of the other patients with similar body weight. Such a high DAP value arising from
a low body weight patient due to a complicated radiological finding is an outlier.
Inclusion of this high DAP value may result in a higher mean DAP of the sample which
is not the true mean of the sample. In order to ascertain how these DAP values differed
from the rest of the values in the data set, the Q test (Stones & Ellis, 2006) was used to
either reject or retain the DAP values that were very different from the other data points
in the sets of data at each of the 3 study sites. And the Chauvenet’s criterion test (Taylor,
1997: 165-172) was used to either reject or retain the DAP values that were very different
from the other data points for the combined data sets of BaM and BaE respectively. The
Q and Chauvenet’s criterion tests were used to reject only a single data point in any set of
data and only one of the tests was used for any data set.
Q test
The Q test is a statistical test employed in the rejection of a single data point that is very
different from the other data points in a set of data. The Q test is used for small study
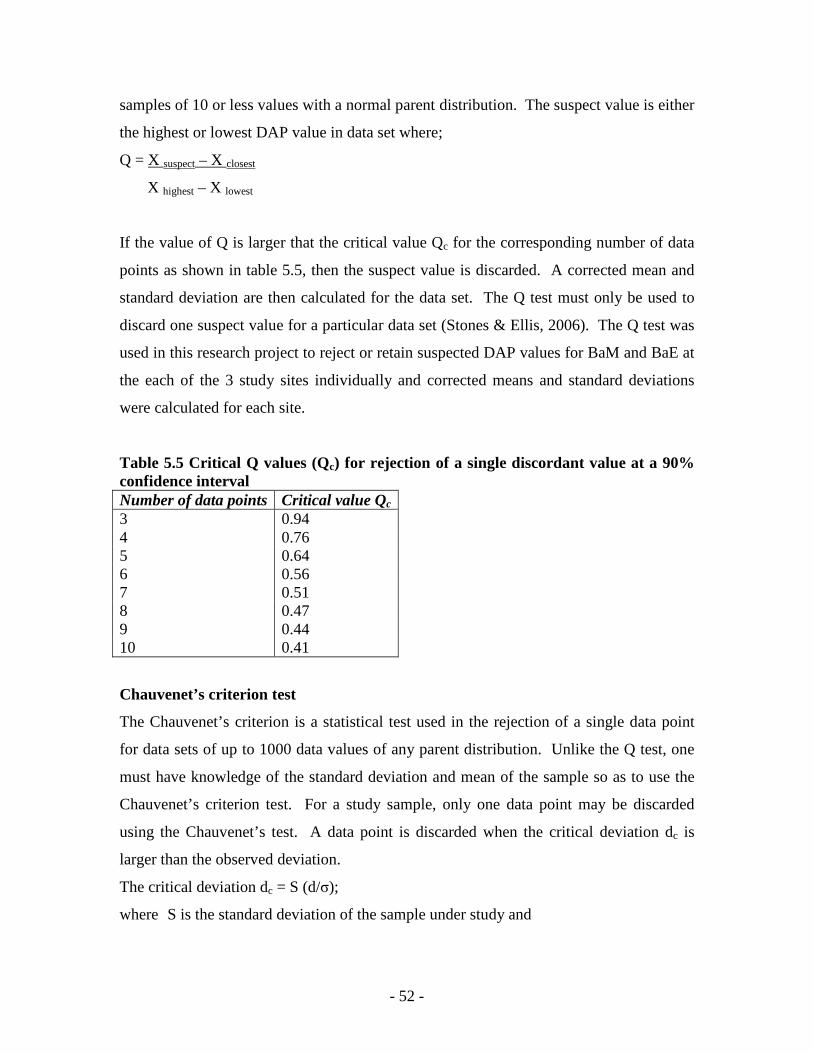
- 52 -
samples of 10 or less values with a normal parent distribution. The suspect value is either
the highest or lowest DAP value in data set where;
Q = X suspect – X closest
X highest – X lowest
If the value of Q is larger that the critical value Qc for the corresponding number of data
points as shown in table 5.5, then the suspect value is discarded. A corrected mean and
standard deviation are then calculated for the data set. The Q test must only be used to
discard one suspect value for a particular data set (Stones & Ellis, 2006). The Q test was
used in this research project to reject or retain suspected DAP values for BaM and BaE at
the each of the 3 study sites individually and corrected means and standard deviations
were calculated for each site.
Table 5.5 Critical Q values (Qc) for rejection of a single discordant value at a 90% confidence interval Number of data points Critical value Qc
3 0.94 4 0.76 5 0.64 6 0.56 7 0.51 8 0.47 9 0.44 10 0.41
Chauvenet’s criterion test
The Chauvenet’s criterion is a statistical test used in the rejection of a single data point
for data sets of up to 1000 data values of any parent distribution. Unlike the Q test, one
must have knowledge of the standard deviation and mean of the sample so as to use the
Chauvenet’s criterion test. For a study sample, only one data point may be discarded
using the Chauvenet’s test. A data point is discarded when the critical deviation dc is
larger than the observed deviation.
The critical deviation dc = S (d/σ);
where S is the standard deviation of the sample under study and

- 53 -
d is deviation of the distribution of a number of data points as per Chauvenet’s
criterion table.
σ is the deviation and the standard deviation of the distribution of a number of
data points as per Chauvenet’s criterion table.
The observed standard deviation is obtained by subtracting the suspected data point from
the mean of the sample (Taylor, 1997: 165-172). In this research study, the Chauvenet’s
criterion test was used to reject or retain suspected data points when the DAP values for
all the BaM and BaE from the 3 study sites were combined.
5.6.2 Sub-problem 1
This sub-problem required the measurement of the DAP values for patients referred for
BaM and BaE using DAP meters that were permanently fitted to the fluoroscopy units at
the 3 study sites. The DWP (1992) recommended that DRLs must be set at the third
quartile value of a sample of at least 10 adult participants of average weight of 65 kg to
75 kg. The mean weights of the patient participants and the third quartile DAP values for
BaM and BaE were calculated using the Microsoft Excel computer program.
5.6.3 Sub-problem 2
This sub-problem required the comparison of DAP values obtained in this study with
those from similar studies. The mean DAP values and DRLs of BaM and BaE from other
studies are shown in tables 4.124 and 4.225 respectively and are compared against the
mean DAP and DRLs obtained in this study. As such, it was assessed whether the values
obtained in this study were higher or lower than those from other BaM and BaE
dosimetry studies.
5.6.4 Sub-problem 3
This sub-problem sought to determine the factors contributing to the inter- and intra-
DAP level variations among participants at the same study site and among the three study
sites respectively. Carroll & Brennan (2003) and Warren- Forward et al (1998)
developed variable regression models to explain the dose variations among patients and
24 Mean and third quartile DAP values for BaM from various countries (page 28) 25 Mean and third quartile DAP values for BaE from various countries (page 30)

- 54 -
study sites. The factors contributing to dose variations for BaM in decreasing order were;
FT, patient’s weight, fluoroscopy grid ratio and x-ray beam filtration (Carroll & Brennan,
2003). These accounted for 53% of the dose variation for BaM. The factors that
accounted for the 70% of BaE dose variation in decreasing order were; FT, number of
images, level of filtration, fluoroscopic grid material, radiographic grid ratio, failed
colonoscopy prior to BaE and the fluoroscopic grid ratio (Carroll & Brennan, 2003).
The variation regression model developed by Warren-Forward et al (1998) for BaE
included FT, number of images, patient size, applied potential, difficulty of the
examination and use of digital equipment in decreasing order of affecting dose variation.
This model explained 58% of the dose variation for BaE with the FT, number of images,
patient size and applied potential accounting for 50% of the 58% dose variation.
The factors that were examined to explain the dose variations for BaM and BaE for this
research project were; the patient’s weight, fluoroscopy time, number of images, level of
training of the examining radiologist and type of equipment used that is; whether a digital
or conventional fluoroscopy unit. The relationship between DAP values and patients’
weights and fluoroscopy times were assessed using linear regression, linear correlation
coefficient, R and the coefficient of determination, R2.
5.6.5 Linear correlation coefficient, R
A regression line was drawn for the graphs comparing DAP with patients’ weights and
DAP with fluoroscopy times. The linear correlation coefficient, R was calculated using
the Microsoft excel computer program where;
n is the number of data points (Mathbits, 2009)
R is used to measure the strength and direction of the linear relationship between two
variables such as DAP and patients’ weights. R takes on values greater than or equal to
- 55 -
negative 1 and less or equal to positive 1 (-1 ≤ R ≥ +1). A positive correlation suggests
that as values of x increase, the y values increase or x values decrease as y values
decrease. A negative correlation suggests that as the values of x increase, the values of y
decrease or as the x values decrease, the y values increase. There is a strong linear
correlation between two variables when R is either positive or negative 1. When the R
values tend towards zero, there is a weak or no linear correlation between the two
variables being compared. A linear correlation coefficient, R of greater than 0.8 is
described as strong whereas one at 0.5 is described as weak. There is no linear
correlation when R is less than 0.5 (Mckillup, 2006: 186-204; Mathbits, 2009).
5.6.6 Coefficient of determination, R2
The coefficient of determination R2 is a measure of how well the regression line
represents the data on the scatter graph. R2 is also referred to as the ratio of the
explained variation to the total variation. R2 is therefore greater than or equal to 0 and
less than or equal to 1 (0 ≤ R2 ≥ 1). When the regression line passes through all data
points on the scatter graph then R2 is equal to 1. This suggests a strong linear correlation
between x and y values. Additionally, R2 represents the percentage of data closest to the
regression line. For example, if R = 0.77 then R2= 0.5929; therefore 59.29% of total
variation of y values can be explained by the linear relationship between x and y. The
remaining 40.71% of the total variation of y values remains unexplained by the linear
relationship between x and y (Mckillup, 2006: 186-204; Mathbits, 2009).
5.6.7 Significance of the linear correlation coefficient
The statistical significance of the linear correlation coefficient was ascertained by
calculating the probability levels (p-value). When the p-value was less than 0.05, the
correlation between the variables compared was statistically significant. And when the p-
value was greater than 0.05, the linear correlation between the two variables was not
statistically significant (Mckillup, 2006:55).
5.6.8 Error bars
In order to ascertain whether the differences in the mean DAP, mean FT and mean
number of images among the 3 study sites were statistically different, error bars showing
- 56 -
the standard error were plotted about the graph with the mean values. When the error
bars overlapped, the differences between the mean values were considered not to be
statistically different. However, when the error bars did not overlap, the differences in
the mean values were considered statistically different (Cumming, Fidler & Vaux, 2007).
The recommended protocol for obtaining DRLs for BaM and BaE is measuring the
radiation dose using DAP meters for adult patients weighing 50 kg to 90 kg (DWP,
1992). This protocol was followed in this study and the results are discussed in the next
chapter.
- 57 -
CHAPTER 6 RESEARCH FINDINGS
This research project investigated the radiation doses received by patients referred for
BaM and BaE using Dose Area Product meters that were permanently fitted to the
fluoroscopy units at three hospitals in the Western Cape, SA and recommended reference
dose levels for these examinations. The data collection was undertaken between June
2008 and June 2009, commencing after the legalised deadline (January 2008) for
permanent installation of DAP meters to all fixed fluoroscopy equipment in SA (DoH
SA, 2006). Despite this, some hospitals did not have DAP meters installed on their fixed
fluoroscopy units at the time of the research study citing other hospital and departmental
budget priorities superseding the acquisition of expensive DAP meters. In order to
calculate reference dose levels, the DWP (1992) recommended that dose measurements
be carried out on at least 10 patients weighing 50 kg to 90 kg for any examination. Such
a weight range would ensure that the mean weight of the study sample lay close to 70 kg
(65-75 kg) which is the average weight of an adult.
In this chapter, the mean ages, mean weights and DAP values recorded for patients
referred for BaM and BaE at 3 study sites are discussed. Furthermore, an assessment of
the relationship between the DAP value recorded and the patients’ weights, fluoroscopy
time, number of images recorded, type of equipment that is; digital or conventional and
the level of training of the radiologist performing the BaM or BaE was done using linear
regression, correlation coefficient, R and coefficient of determination, R2. The statistical
significance of the linear relationships between the variables was ascertained by the
probability value (p-value). Additionally, error bars were used to assess whether the
difference in mean DAP values, mean FT and mean images recorded at the study sites
were significantly different from each other.
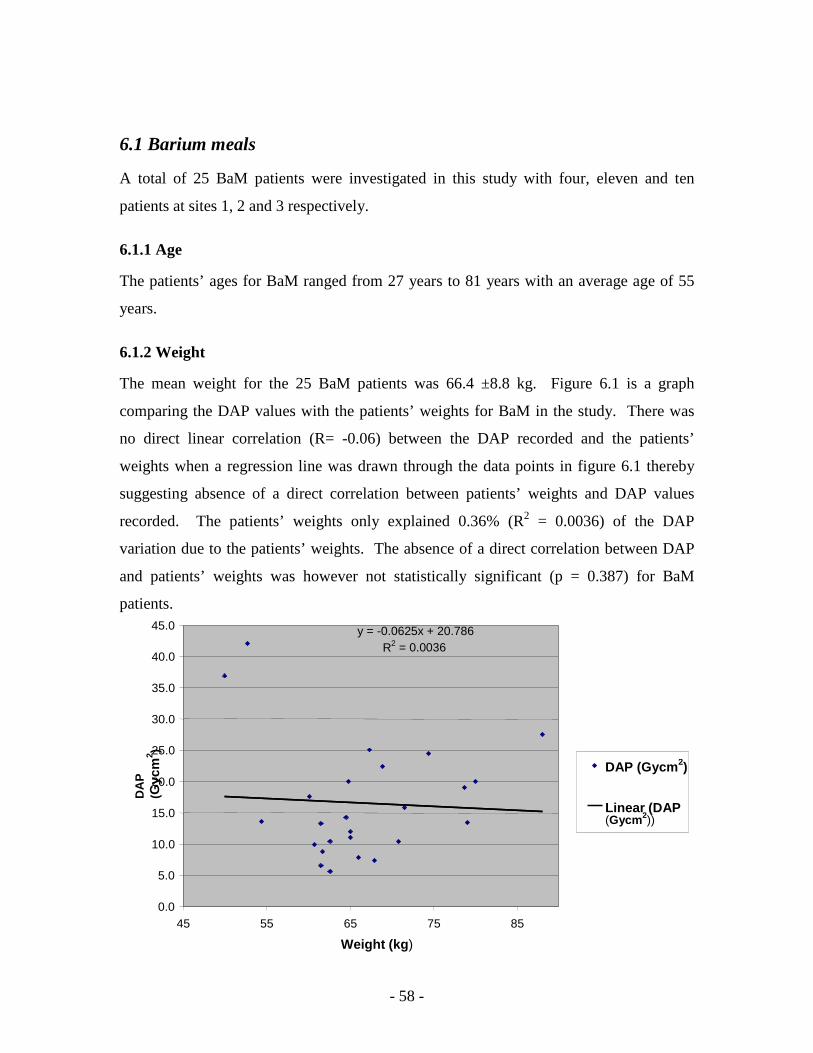
- 58 -
6.1 Barium meals
A total of 25 BaM patients were investigated in this study with four, eleven and ten
patients at sites 1, 2 and 3 respectively.
6.1.1 Age
The patients’ ages for BaM ranged from 27 years to 81 years with an average age of 55
years.
6.1.2 Weight
The mean weight for the 25 BaM patients was 66.4 ±8.8 kg. Figure 6.1 is a graph
comparing the DAP values with the patients’ weights for BaM in the study. There was
no direct linear correlation (R= -0.06) between the DAP recorded and the patients’
weights when a regression line was drawn through the data points in figure 6.1 thereby
suggesting absence of a direct correlation between patients’ weights and DAP values
recorded. The patients’ weights only explained 0.36% (R2 = 0.0036) of the DAP
variation due to the patients’ weights. The absence of a direct correlation between DAP
and patients’ weights was however not statistically significant (p = 0.387) for BaM
patients.
y = -0.0625x + 20.786R 2 = 0.0036
0.0
5.0
10.0
15.0
20.0
25.0
30.0
35.0
40.0
45.0
45 55 65 75 85
Weight (kg)
DA
P
(Gyc
m2 )
DAP (Gycm2)
Linear (DAP (Gycm2))

- 59 -
Figure 6. 1 DAP versus weight for all BaM patients
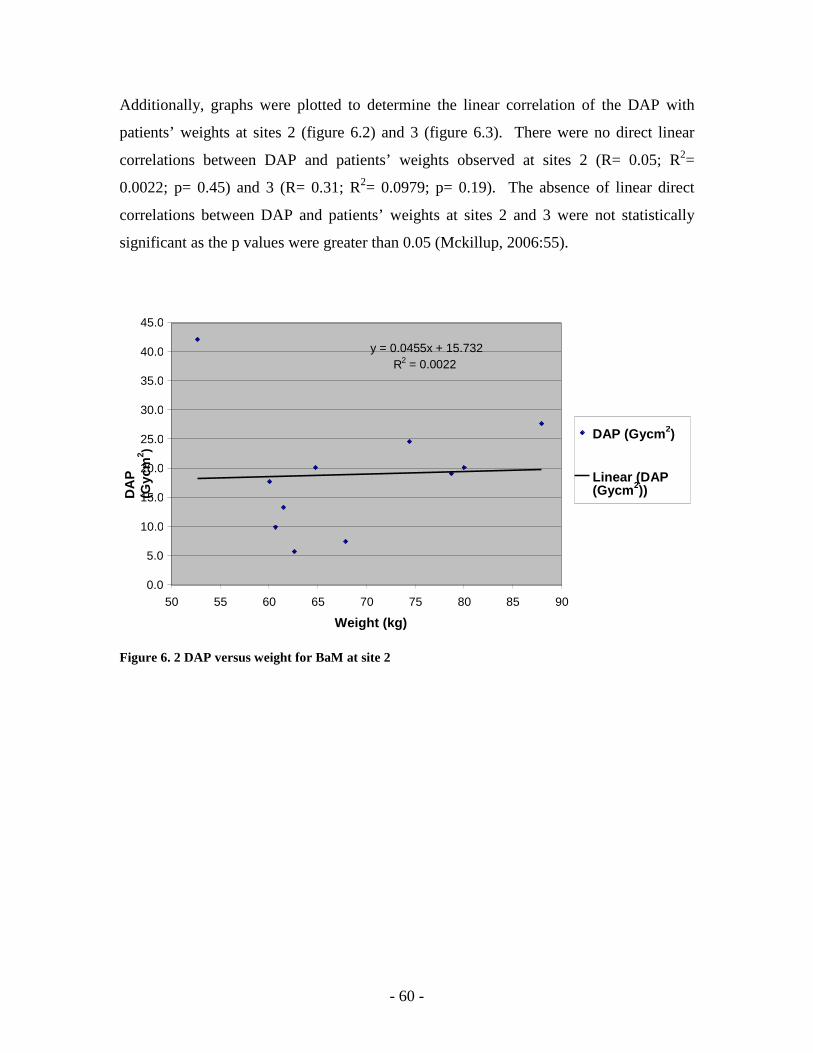
- 60 -
Additionally, graphs were plotted to determine the linear correlation of the DAP with
patients’ weights at sites 2 (figure 6.2) and 3 (figure 6.3). There were no direct linear
correlations between DAP and patients’ weights observed at sites 2 (R= 0.05; R2=
0.0022; p= 0.45) and 3 (R= 0.31; R2= 0.0979; p= 0.19). The absence of linear direct
correlations between DAP and patients’ weights at sites 2 and 3 were not statistically
significant as the p values were greater than 0.05 (Mckillup, 2006:55).
Figure 6. 2 DAP versus weight for BaM at site 2
y = 0.0455x + 15.732R 2 = 0.0022
0.0
5.0
10.0
15.0
20.0
25.0
30.0
35.0
40.0
45.0
50 55 60 65 70 75 80 85 90
Weight (kg)
DA
P
(Gyc
m2 )
DAP (Gycm2)
Linear (DAP (Gycm2))
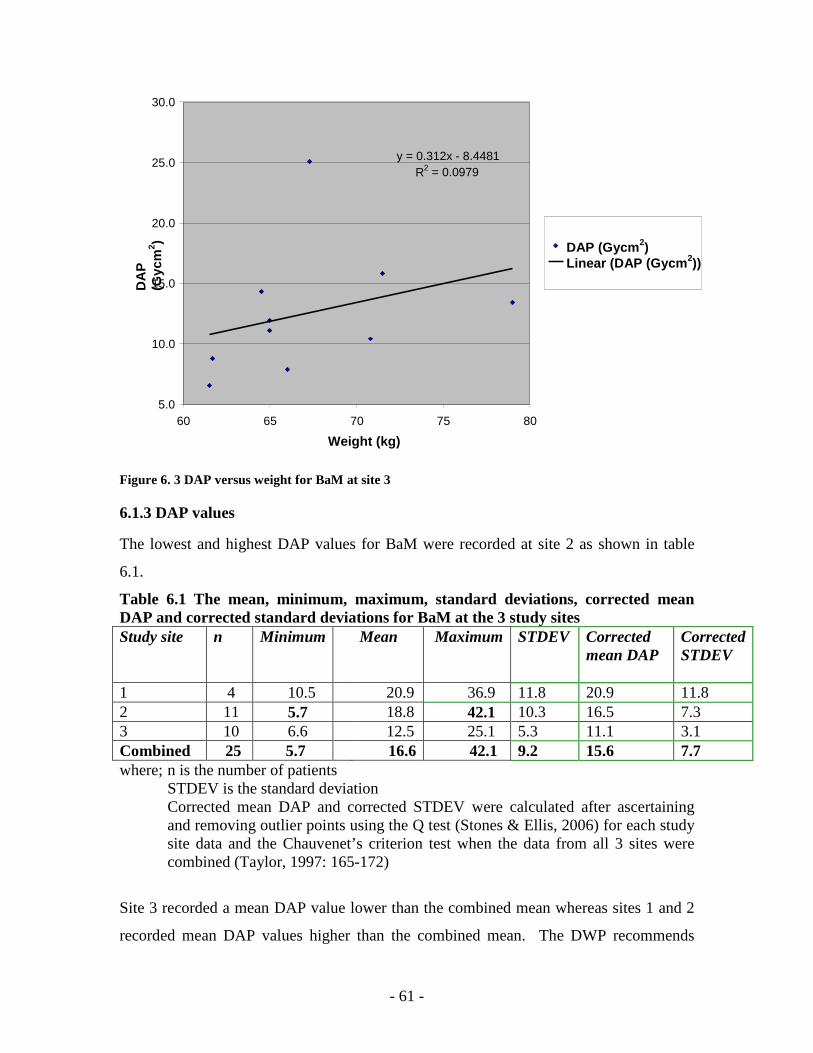
- 61 -
Figure 6. 3 DAP versus weight for BaM at site 3
6.1.3 DAP values
The lowest and highest DAP values for BaM were recorded at site 2 as shown in table
6.1.
Table 6.1 The mean, minimum, maximum, standard deviations, corrected mean DAP and corrected standard deviations for BaM at the 3 study sites Study site n Minimum Mean Maximum STDEV Corrected
mean DAP Corrected STDEV
1 4 10.5 20.9 36.9 11.8 20.9 11.8 2 11 5.7 18.8 42.1 10.3 16.5 7.3 3 10 6.6 12.5 25.1 5.3 11.1 3.1 Combined 25 5.7 16.6 42.1 9.2 15.6 7.7 where; n is the number of patients
STDEV is the standard deviation Corrected mean DAP and corrected STDEV were calculated after ascertaining and removing outlier points using the Q test (Stones & Ellis, 2006) for each study site data and the Chauvenet’s criterion test when the data from all 3 sites were combined (Taylor, 1997: 165-172)
Site 3 recorded a mean DAP value lower than the combined mean whereas sites 1 and 2
recorded mean DAP values higher than the combined mean. The DWP recommends
y = 0.312x - 8.4481 R 2 = 0.0979
5.0
10.0
15.0
20.0
25.0
30.0
60 65 70 75 80
Weight (kg)
DA
P
(Gyc
m2 ) DAP (Gycm2)
Linear (DAP (Gycm2))
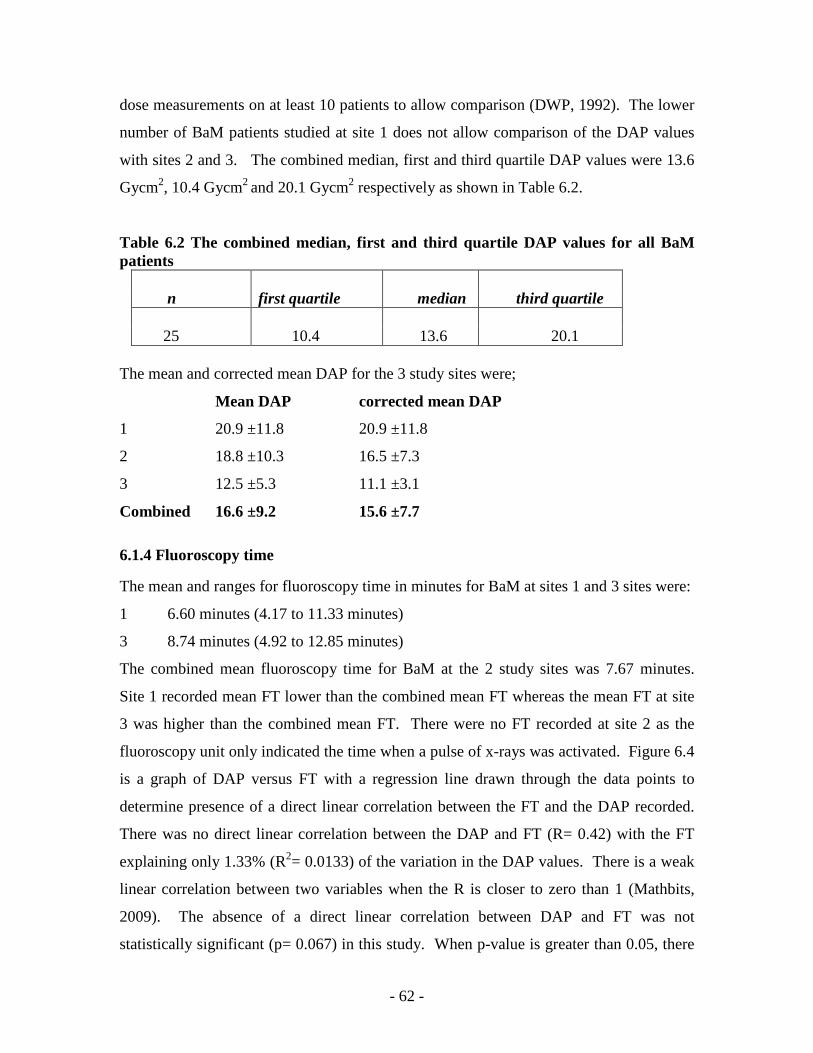
- 62 -
dose measurements on at least 10 patients to allow comparison (DWP, 1992). The lower
number of BaM patients studied at site 1 does not allow comparison of the DAP values
with sites 2 and 3. The combined median, first and third quartile DAP values were 13.6
Gycm2, 10.4 Gycm2 and 20.1 Gycm2 respectively as shown in Table 6.2.
Table 6.2 The combined median, first and third quartile DAP values for all BaM patients
n first quartile median third quartile
25 10.4 13.6 20.1 The mean and corrected mean DAP for the 3 study sites were;
Mean DAP corrected mean DAP
1 20.9 ±11.8 20.9 ±11.8
2 18.8 ±10.3 16.5 ±7.3
3 12.5 ±5.3 11.1 ±3.1
Combined 16.6 ±9.2 15.6 ±7.7
6.1.4 Fluoroscopy time
The mean and ranges for fluoroscopy time in minutes for BaM at sites 1 and 3 sites were:
1 6.60 minutes (4.17 to 11.33 minutes)
3 8.74 minutes (4.92 to 12.85 minutes)
The combined mean fluoroscopy time for BaM at the 2 study sites was 7.67 minutes.
Site 1 recorded mean FT lower than the combined mean FT whereas the mean FT at site
3 was higher than the combined mean FT. There were no FT recorded at site 2 as the
fluoroscopy unit only indicated the time when a pulse of x-rays was activated. Figure 6.4
is a graph of DAP versus FT with a regression line drawn through the data points to
determine presence of a direct linear correlation between the FT and the DAP recorded.
There was no direct linear correlation between the DAP and FT (R= 0.42) with the FT
explaining only 1.33% (R2= 0.0133) of the variation in the DAP values. There is a weak
linear correlation between two variables when the R is closer to zero than 1 (Mathbits,
2009). The absence of a direct linear correlation between DAP and FT was not
statistically significant (p= 0.067) in this study. When p-value is greater than 0.05, there
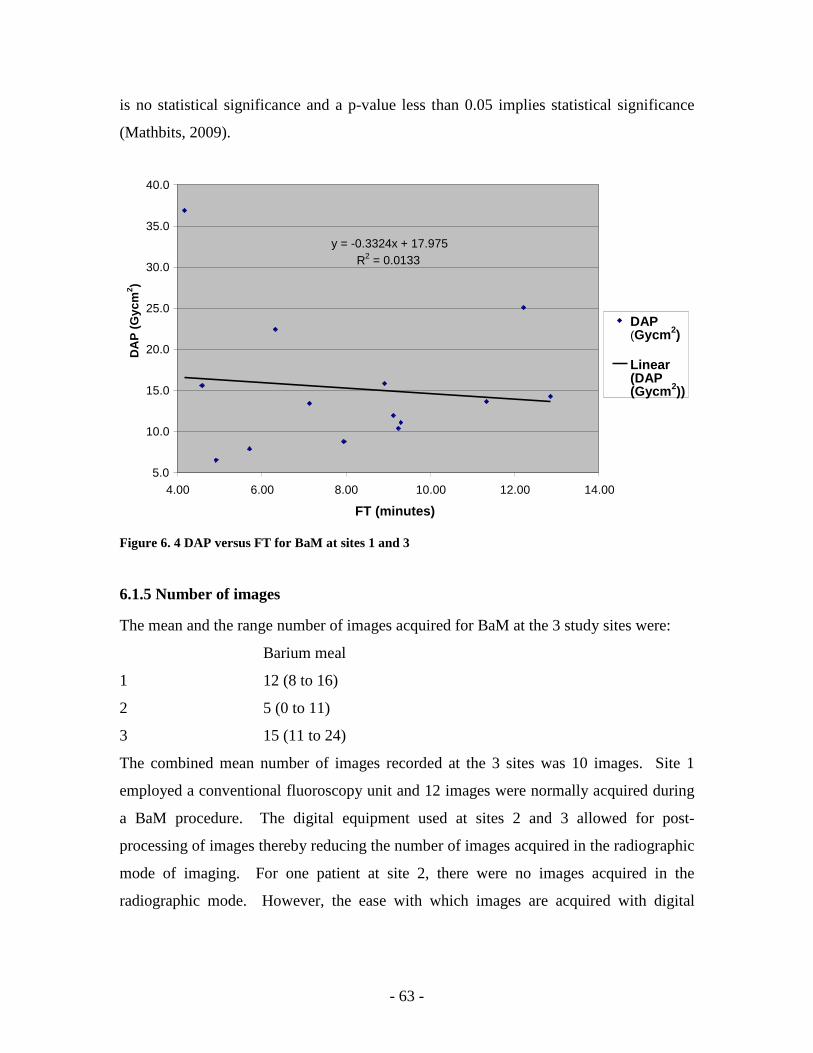
- 63 -
is no statistical significance and a p-value less than 0.05 implies statistical significance
(Mathbits, 2009).
Figure 6. 4 DAP versus FT for BaM at sites 1 and 3
6.1.5 Number of images
The mean and the range number of images acquired for BaM at the 3 study sites were:
Barium meal
1 12 (8 to 16)
2 5 (0 to 11)
3 15 (11 to 24)
The combined mean number of images recorded at the 3 sites was 10 images. Site 1
employed a conventional fluoroscopy unit and 12 images were normally acquired during
a BaM procedure. The digital equipment used at sites 2 and 3 allowed for post-
processing of images thereby reducing the number of images acquired in the radiographic
mode of imaging. For one patient at site 2, there were no images acquired in the
radiographic mode. However, the ease with which images are acquired with digital
y = -0.3324x + 17.975R 2 = 0.0133
5.0
10.0
15.0
20.0
25.0
30.0
35.0
40.0
4.00 6.00 8.00 10.00 12.00 14.00
FT (minutes)
DA
P (
Gyc
m2 )
DAP (Gycm2)
Linear (DAP (Gycm2))
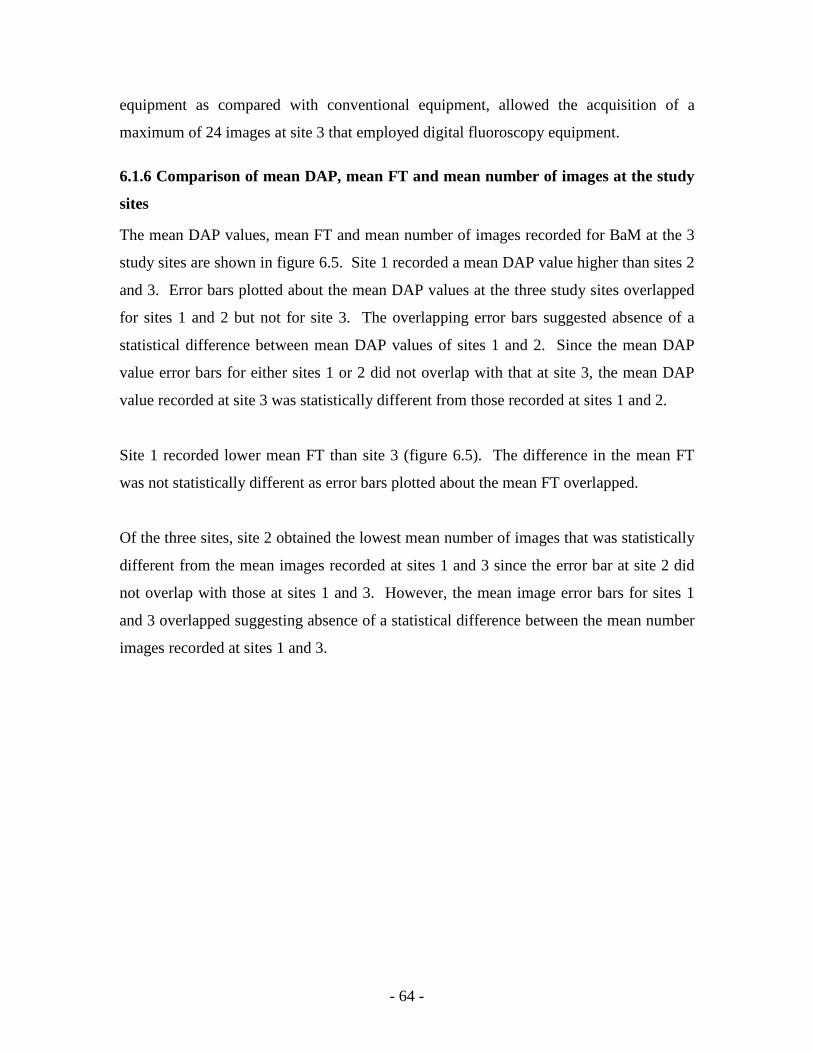
- 64 -
equipment as compared with conventional equipment, allowed the acquisition of a
maximum of 24 images at site 3 that employed digital fluoroscopy equipment.
6.1.6 Comparison of mean DAP, mean FT and mean number of images at the study
sites
The mean DAP values, mean FT and mean number of images recorded for BaM at the 3
study sites are shown in figure 6.5. Site 1 recorded a mean DAP value higher than sites 2
and 3. Error bars plotted about the mean DAP values at the three study sites overlapped
for sites 1 and 2 but not for site 3. The overlapping error bars suggested absence of a
statistical difference between mean DAP values of sites 1 and 2. Since the mean DAP
value error bars for either sites 1 or 2 did not overlap with that at site 3, the mean DAP
value recorded at site 3 was statistically different from those recorded at sites 1 and 2.
Site 1 recorded lower mean FT than site 3 (figure 6.5). The difference in the mean FT
was not statistically different as error bars plotted about the mean FT overlapped.
Of the three sites, site 2 obtained the lowest mean number of images that was statistically
different from the mean images recorded at sites 1 and 3 since the error bar at site 2 did
not overlap with those at sites 1 and 3. However, the mean image error bars for sites 1
and 3 overlapped suggesting absence of a statistical difference between the mean number
images recorded at sites 1 and 3.
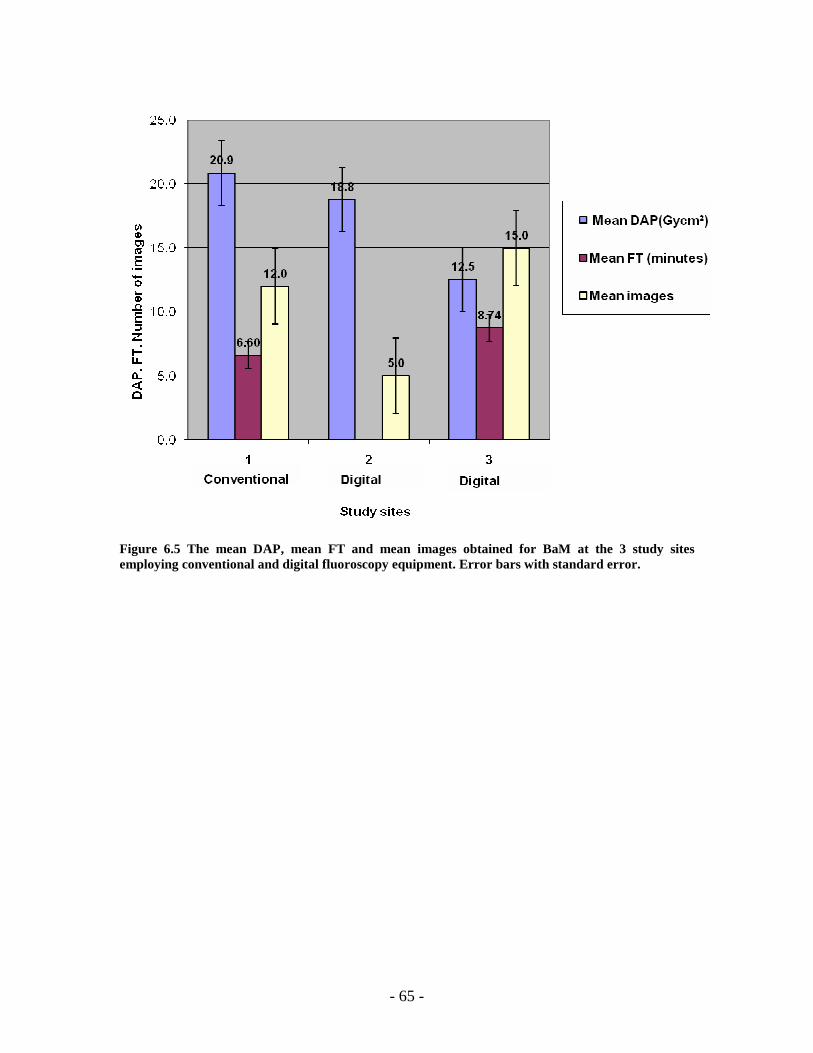
- 65 -
Figure 6.5 The mean DAP, mean FT and mean images obtained for BaM at the 3 study sites employing conventional and digital fluoroscopy equipment. Error bars with standard error.
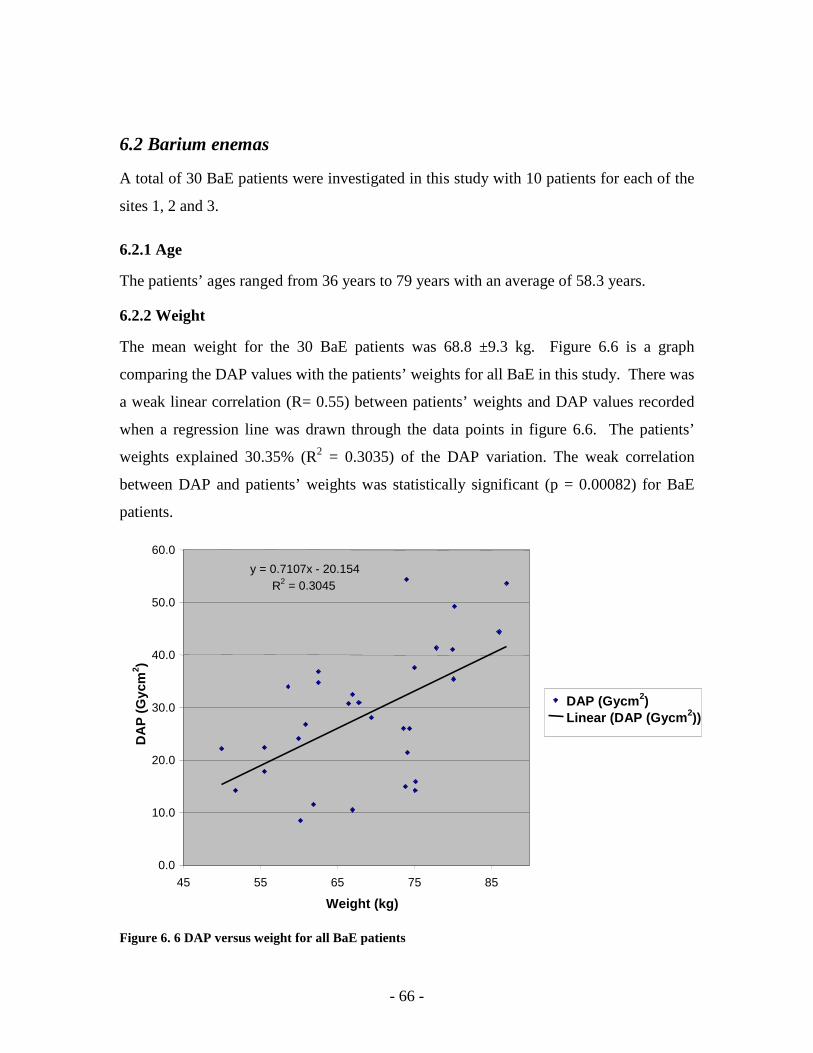
- 66 -
6.2 Barium enemas
A total of 30 BaE patients were investigated in this study with 10 patients for each of the
sites 1, 2 and 3.
6.2.1 Age
The patients’ ages ranged from 36 years to 79 years with an average of 58.3 years.
6.2.2 Weight
The mean weight for the 30 BaE patients was 68.8 ±9.3 kg. Figure 6.6 is a graph
comparing the DAP values with the patients’ weights for all BaE in this study. There was
a weak linear correlation (R= 0.55) between patients’ weights and DAP values recorded
when a regression line was drawn through the data points in figure 6.6. The patients’
weights explained 30.35% (R2 = 0.3035) of the DAP variation. The weak correlation
between DAP and patients’ weights was statistically significant (p = 0.00082) for BaE
patients.
Figure 6. 6 DAP versus weight for all BaE patients
y = 0.7107x - 20.154R 2 = 0.3045
0.0
10.0
20.0
30.0
40.0
50.0
60.0
45 55 65 75 85 Weight (kg)
DA
P (
Gyc
m2 )
DAP (Gycm2) Linear (DAP (Gycm2))
- 67 -
Additionally, graphs were plotted to determine the linear correlation of the DAP with
patients’ weights at sites 1 (figure 6.7), 2 (figure 6.8) and 3 (figure 6.9). Strong direct
linear correlations were observed at sites 1 (R= 0.77; R2= 0.596; p= 0.0046), 2 (R= 0.78;
R2= 0.6072; p= 0.0039) and 3 (R= 0.62; R2= 0.3815; p= 0.0279) and these were
statistically significant.
Figure 6.7 DAP versus weight for BaE at site 1
y = 0.636x - 12.791 R 2 =
0.596
15.0
20.0
25.0
30.0
35.0
40.0
45.0
50.0
50
55
60
65
70
75
80
85
90 Weight
(kg)
DA
P (
Gyc
m2 )
DAP (Gycm2) Linear (DAP (Gycm2))
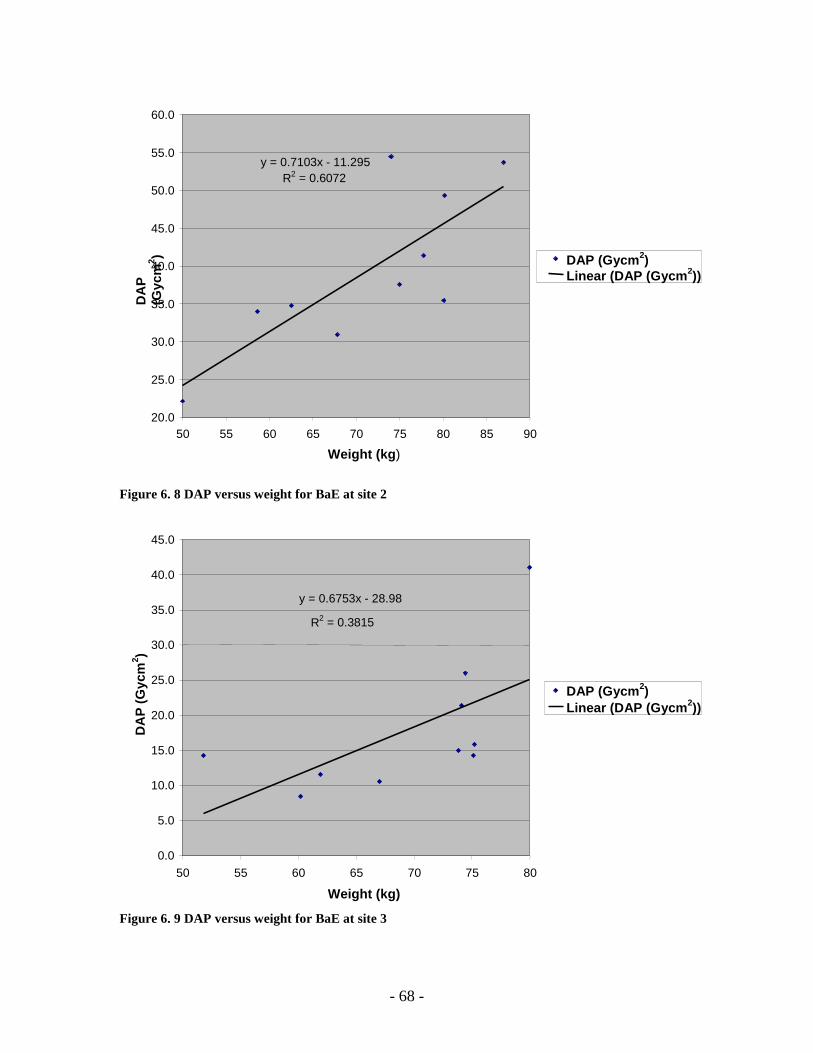
- 68 -
Figure 6. 8 DAP versus weight for BaE at site 2
Figure 6. 9 DAP versus weight for BaE at site 3
y = 0.7103x - 11.295R 2 = 0.6072
20.0
25.0
30.0
35.0
40.0
45.0
50.0
55.0
60.0
50 55 60 65 70 75 80 85 90
Weight (kg)
DA
P
(Gyc
m2 ) DAP (Gycm2)
Linear (DAP (Gycm2))
y = 0.6753x - 28.98
R2 = 0.3815
0.0
5.0
10.0
15.0
20.0
25.0
30.0
35.0
40.0
45.0
50 55 60 65 70 75 80
Weight (kg)
DA
P (
Gyc
m2 )
DAP (Gycm2) Linear (DAP (Gycm2))
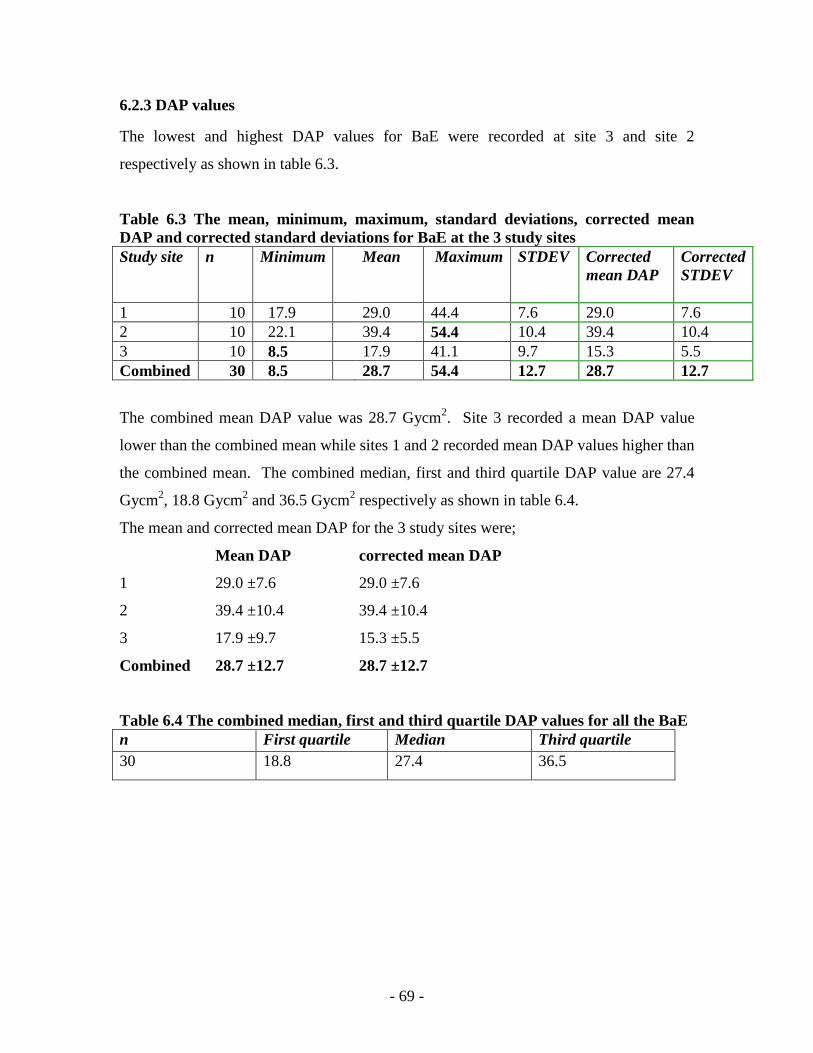
- 69 -
6.2.3 DAP values
The lowest and highest DAP values for BaE were recorded at site 3 and site 2
respectively as shown in table 6.3.
Table 6.3 The mean, minimum, maximum, standard deviations, corrected mean DAP and corrected standard deviations for BaE at the 3 study sites Study site n Minimum Mean Maximum STDEV Corrected
mean DAP Corrected STDEV
1 10 17.9 29.0 44.4 7.6 29.0 7.6 2 10 22.1 39.4 54.4 10.4 39.4 10.4 3 10 8.5 17.9 41.1 9.7 15.3 5.5 Combined 30 8.5 28.7 54.4 12.7 28.7 12.7
The combined mean DAP value was 28.7 Gycm2. Site 3 recorded a mean DAP value
lower than the combined mean while sites 1 and 2 recorded mean DAP values higher than
the combined mean. The combined median, first and third quartile DAP value are 27.4
Gycm2, 18.8 Gycm2 and 36.5 Gycm2 respectively as shown in table 6.4.
The mean and corrected mean DAP for the 3 study sites were;
Mean DAP corrected mean DAP
1 29.0 ±7.6 29.0 ±7.6
2 39.4 ±10.4 39.4 ±10.4
3 17.9 ±9.7 15.3 ±5.5
Combined 28.7 ±12.7 28.7 ±12.7
Table 6.4 The combined median, first and third quartile DAP values for all the BaE n First quartile Median Third quartile 30 18.8 27.4 36.5
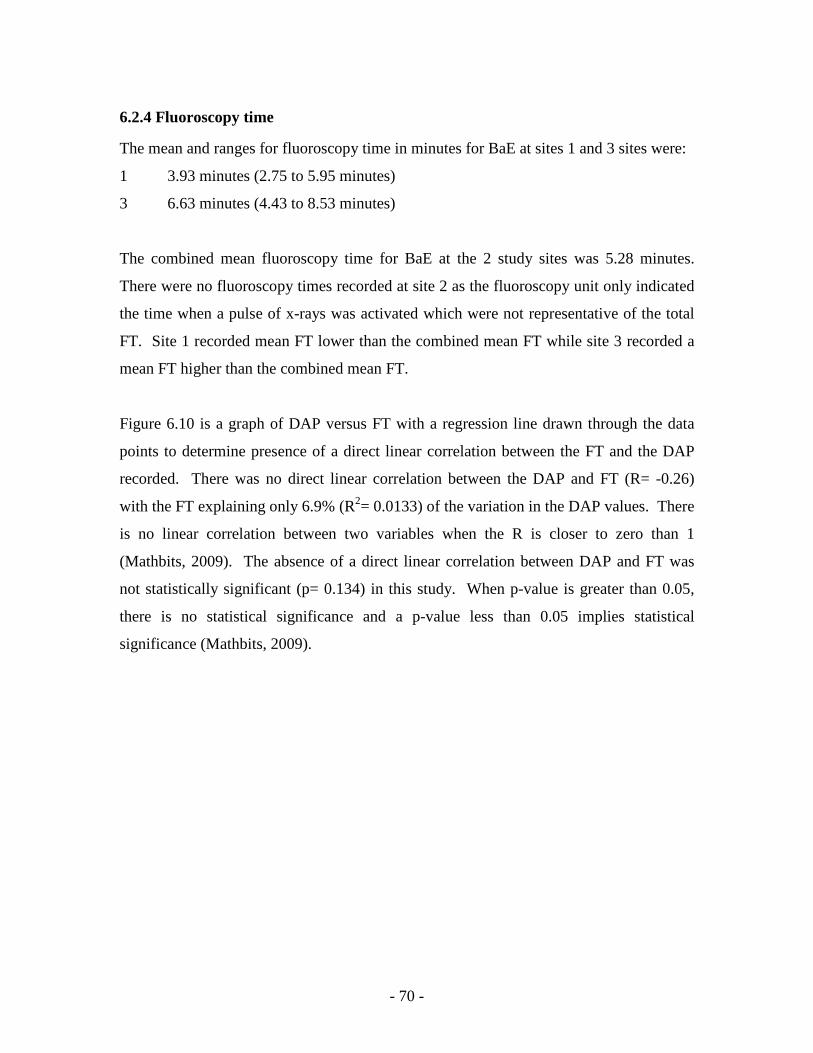
- 70 -
6.2.4 Fluoroscopy time
The mean and ranges for fluoroscopy time in minutes for BaE at sites 1 and 3 sites were:
1 3.93 minutes (2.75 to 5.95 minutes)
3 6.63 minutes (4.43 to 8.53 minutes)
The combined mean fluoroscopy time for BaE at the 2 study sites was 5.28 minutes.
There were no fluoroscopy times recorded at site 2 as the fluoroscopy unit only indicated
the time when a pulse of x-rays was activated which were not representative of the total
FT. Site 1 recorded mean FT lower than the combined mean FT while site 3 recorded a
mean FT higher than the combined mean FT.
Figure 6.10 is a graph of DAP versus FT with a regression line drawn through the data
points to determine presence of a direct linear correlation between the FT and the DAP
recorded. There was no direct linear correlation between the DAP and FT (R= -0.26)
with the FT explaining only 6.9% (R2= 0.0133) of the variation in the DAP values. There
is no linear correlation between two variables when the R is closer to zero than 1
(Mathbits, 2009). The absence of a direct linear correlation between DAP and FT was
not statistically significant (p= 0.134) in this study. When p-value is greater than 0.05,
there is no statistical significance and a p-value less than 0.05 implies statistical
significance (Mathbits, 2009).
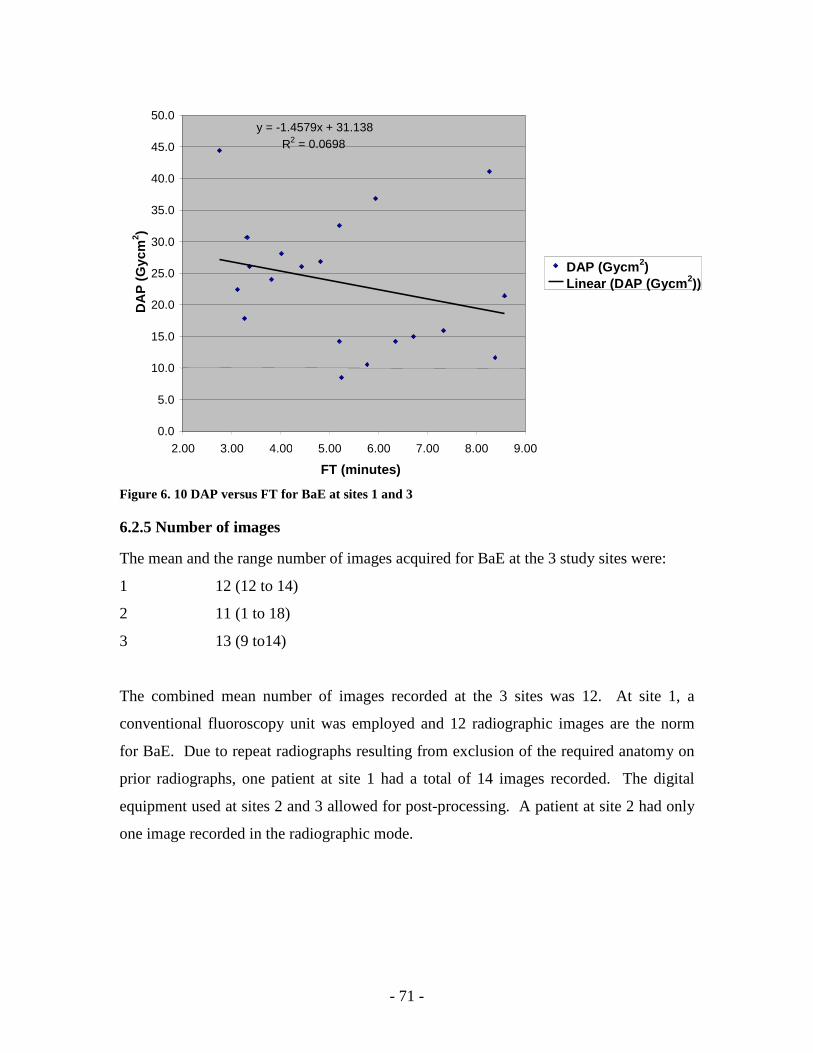
- 71 -
Figure 6. 10 DAP versus FT for BaE at sites 1 and 3
6.2.5 Number of images
The mean and the range number of images acquired for BaE at the 3 study sites were:
1 12 (12 to 14)
2 11 (1 to 18)
3 13 (9 to14)
The combined mean number of images recorded at the 3 sites was 12. At site 1, a
conventional fluoroscopy unit was employed and 12 radiographic images are the norm
for BaE. Due to repeat radiographs resulting from exclusion of the required anatomy on
prior radiographs, one patient at site 1 had a total of 14 images recorded. The digital
equipment used at sites 2 and 3 allowed for post-processing. A patient at site 2 had only
one image recorded in the radiographic mode.
y = -1.4579x + 31.138R 2 = 0.0698
0.0
5.0
10.0
15.0
20.0
25.0
30.0
35.0
40.0
45.0
50.0
2.00 3.00 4.00 5.00 6.00 7.00 8.00 9.00
FT (minutes)
DA
P (
Gyc
m2 )
DAP (Gycm2) Linear (DAP (Gycm2))
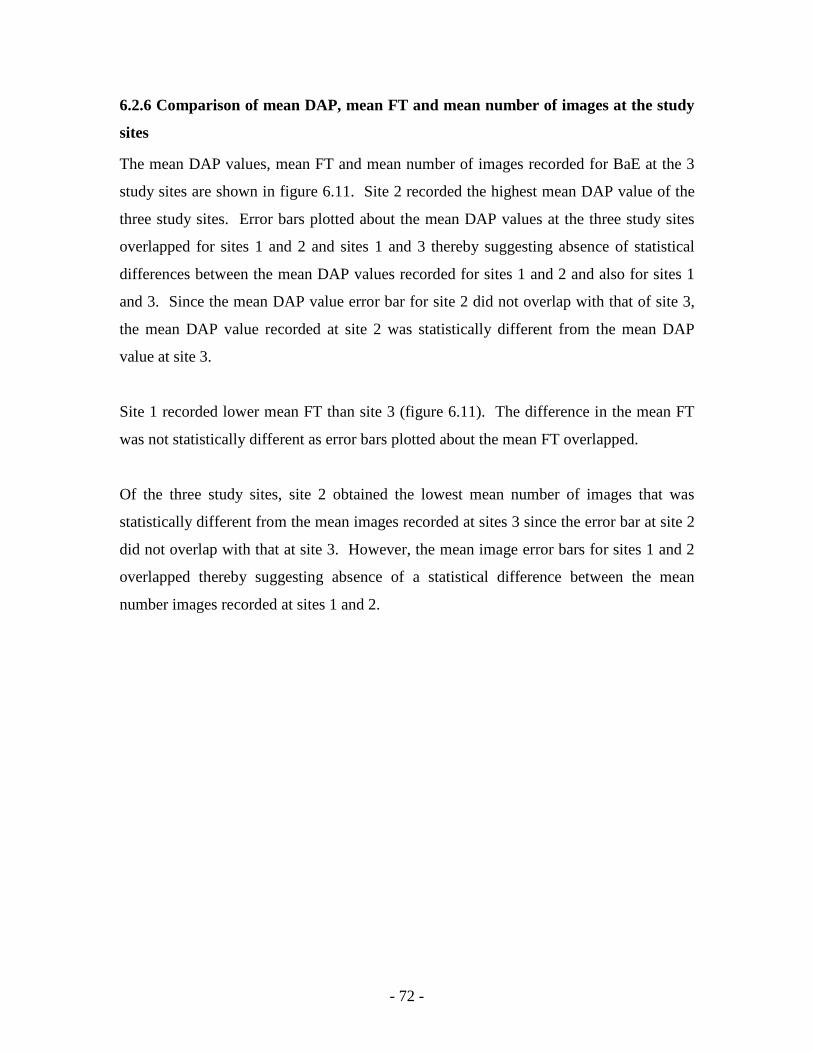
- 72 -
6.2.6 Comparison of mean DAP, mean FT and mean number of images at the study
sites
The mean DAP values, mean FT and mean number of images recorded for BaE at the 3
study sites are shown in figure 6.11. Site 2 recorded the highest mean DAP value of the
three study sites. Error bars plotted about the mean DAP values at the three study sites
overlapped for sites 1 and 2 and sites 1 and 3 thereby suggesting absence of statistical
differences between the mean DAP values recorded for sites 1 and 2 and also for sites 1
and 3. Since the mean DAP value error bar for site 2 did not overlap with that of site 3,
the mean DAP value recorded at site 2 was statistically different from the mean DAP
value at site 3.
Site 1 recorded lower mean FT than site 3 (figure 6.11). The difference in the mean FT
was not statistically different as error bars plotted about the mean FT overlapped.
Of the three study sites, site 2 obtained the lowest mean number of images that was
statistically different from the mean images recorded at sites 3 since the error bar at site 2
did not overlap with that at site 3. However, the mean image error bars for sites 1 and 2
overlapped thereby suggesting absence of a statistical difference between the mean
number images recorded at sites 1 and 2.
- 73 -
Figure 6. 11 The mean DAP, mean FT and mean images obtained for BaE at the 3 study sites employing conventional and digital fluoroscopy equipment. Error bars with standard error.
6.3 Level of training of the radiologist
The BaM and BaE at site 1 were performed by the same consultant radiologist using a
standard technique. At sites 2 and 3, the BaM and BaE were performed by radiology
registrars at various levels of training. In order to compare the resultant DAP value with
the level of training of the radiologist performing the examination, the same fluoroscopy
unit is considered to eliminate equipment related factors affecting the DAP reading. Two
radiology registrars at different levels of training performing BaE that both described as
standard examinations were compared at site 2. In addition to obtaining a higher number
of images (18 images), the first year registrar recorded a higher DAP value (37.57
Gycm2) than the registrar in the fourth year of training (1 image; 22.15 Gycm2). With the
exception of factors such as difficulty of the examination, patient’s weight and the
radiological finding influencing the DAP reading, the level of training of the radiologist
- 74 -
performing the BaM or BaE affected the dose delivered to patients referred for BaM or
BaE in this study.
6.4 Digital versus conventional fluoroscopy units
In this research project, site 1 employed a CF unit and sites 2 and 3 utilised DF units.
While site 1 recorded mean DAP values of 20.9 Gycm2 and 29.0 Gycm2 for BaM and
BaE respectively, mean DAP values of 12.5 Gycm2 and 17.9 Gycm2 were recorded at site
3 for BaM and BaE respectively (figures 6.526 and 6.1127). Despite the DF unit at site 3
recording lower mean DAP values than the CF unit at site 1 for both BaM and BaE,
overlapping error bars were obtained for BaE (figure 6.11) but not for the BaM (figure
6.5). The overlapping error bars for the BaE suggested absence a statistical difference
between the mean DAP values of the BaE at sites 1 and 3. For BaM, the error bars about
the mean DAP values did not overlap for sites 1 and 3 thereby suggesting presence of
statistical difference between the mean DAP values (Cumming et al, 2007). However, it
must be noted that only 4 BaM patients were investigated at site 1 compared to the 11
BaM patients at site 3. It is therefore unknown whether collection of more data at site 1
would have given the same results
26 The mean DAP, mean FT and mean images obtained for BaM at the 3 study sites employing CF and DF units (page 64) 27 The mean DAP, mean FT and mean images obtained for BaE at the 3 study sites employing CF and DF units (page 72)
- 75 -
CHAPTER 7 DISCUSSION
This study determined the radiation doses received by patients referred for BaM and BaE
at 3 hospitals in the Western Cape, SA and obtained potential Diagnostic Reference dose
Levels for these examinations. Additionally, the factors responsible for the variation in
radiation doses among the study sites were investigated and are discussed in this chapter.
Barium meals
The mean age of the patients was 58.7 years with mean weight of 66.4 kg. This mean
weight is within the 65 kg to 75 kg weight range recommended by the DWP (1992) for
the sample from which DRLs are determined. The first and third quartiles, mean and
median DAP values for BaM were 10.4 Gycm2, 20.1 Gycm2, 16.6 Gycm2 and 13.6
Gycm2 respectively. The DRL for BaM from this study is 20.1 Gycm2 following the
recommendation to set DRLs to the third quartile DAP value (DWP, 1992). This DRL is
higher than those obtained in the UK: 13 Gycm2 (Hart et al, 2007), Ireland: 17 Gycm2
(Carroll & Brennan, 2003) and Serbia: 18 Gycm2 (Ciraj et al, 2005b) as shown in table
4.128. The mean DAP value of 16.6 Gycm2 recorded in this study was lower than those
recorded internationally except in the UK (Hart et al, 2007) and Ireland (Carroll &
Brennan, 2003) as shown in table 4.1.
Barium enemas
The mean age of the patients was 58.3 years with mean weight of 68.8 kg. The mean
weight obtained in this study is within the 65 kg to 75 kg weight range recommended by
the DWP (1992) from which DRLs are determined. Engel-Hills and Hering (2001)
recorded mean age of 55.6 years and mean weight of 69.5 kg while investigating
radiation doses for BaE in the Western Cape, SA. The first and third quartiles, mean and
median DAP values for BaE in this study were 18.8 Gycm2, 36.5 Gycm2, 28.7 Gycm2 and
27.4 Gycm2. The DRL for BaE from this study is 36.7 Gycm2 following the DWP (1992)
to set the DRL to the third quartile DAP value. Though this DRL is higher than that
28 The mean and third quartile DAP values recorded for BaM from various countries (page 28)
- 76 -
obtained in the UK: 24 Gycm2 (Hart et al, 2007), there was a 56.5 % radiation dose
reduction when compared with a similar study in SA (Engel-Hill & Hering, 2001). The
trend to record lower DAP values in subsequent dosimetry studies in the same
geographical location (Hart et al, 2007; Hart et al, 2002; Hart et al, 1996) owing to
improved radiation protection procedures and installation of dose saving fluoroscopy
equipment was observed in this work. The mean DAP values recorded in this study were
lower than those recorded internationally except in the UK (Hart et al, 2007) as shown in
table 4.1.
Though third quartile DAP values have been recommended as the dose levels at which
DRL must be set, the median DAP values provide dose levels that are less affected by
extreme outliers such as under and over weight of the patients (Yakoumakis et al, 1999).
For this reason, the median DAP values recorded for BaM (13.6 Gycm2) and BaE (27.7
Gycm2) in this study are recommended as the DRL for the Western Cape, SA. The
adoption of the first quartile values as the DRLs is not recommended as these dose levels
may be too low that the image quality is compromised (Roberts, 1992). The first quartile
values of 10.4 Gycm2 for BaM and 18.8 Gycm2 recorded in this study can therefore be
adopted as dose level for investigation of image quality in the radiology department.
During this study, radiology personnel were very keen on knowing how DAP is
converted into effective dose so that they can actively monitor the radiation doses
delivered to the patients during BaM and BaE. This suggests that radiology personnel are
concerned about the radiation doses they deliver to their patients and are interested in
keeping them as low as reasonably achievable. The DRLs recommended in this study
will therefore serve as quick dose references for radiology personnel not to exceed when
operating under normal diagnostic and technical conditions (ICRP, 1996). The ability of
the DAP meter to integrate the absorbed dose over whole beam area for the total exposure
to the patient and provide a single measurement for BaM and BaE (DWP, 1992) allows
the exclusive use of DAP measurements without converting them to effective dose
(Matthews & Brennan, 2008). This saves the radiology personnel time spent converting
DAP values to effective dose. It was however noted during the research study period that
most radiology personnel were more familiar with radiation dose being measured in milli
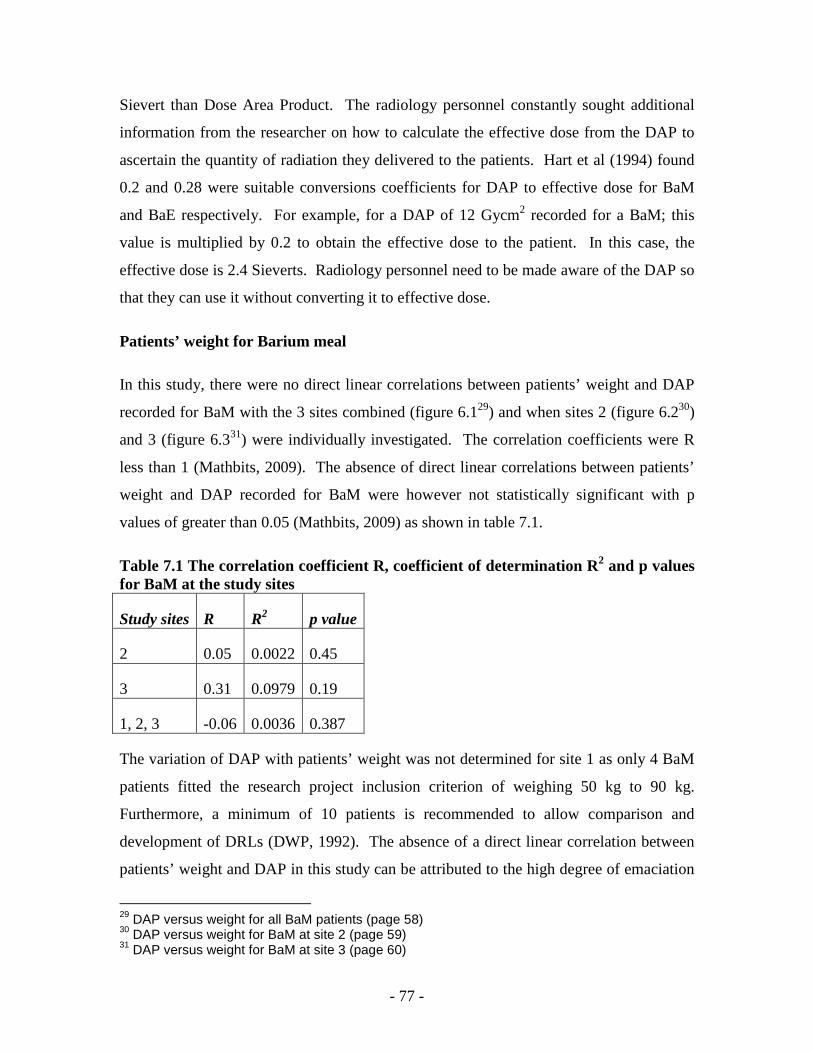
- 77 -
Sievert than Dose Area Product. The radiology personnel constantly sought additional
information from the researcher on how to calculate the effective dose from the DAP to
ascertain the quantity of radiation they delivered to the patients. Hart et al (1994) found
0.2 and 0.28 were suitable conversions coefficients for DAP to effective dose for BaM
and BaE respectively. For example, for a DAP of 12 Gycm2 recorded for a BaM; this
value is multiplied by 0.2 to obtain the effective dose to the patient. In this case, the
effective dose is 2.4 Sieverts. Radiology personnel need to be made aware of the DAP so
that they can use it without converting it to effective dose.
Patients’ weight for Barium meal
In this study, there were no direct linear correlations between patients’ weight and DAP
recorded for BaM with the 3 sites combined (figure 6.129) and when sites 2 (figure 6.230)
and 3 (figure 6.331) were individually investigated. The correlation coefficients were R
less than 1 (Mathbits, 2009). The absence of direct linear correlations between patients’
weight and DAP recorded for BaM were however not statistically significant with p
values of greater than 0.05 (Mathbits, 2009) as shown in table 7.1.
Table 7.1 The correlation coefficient R, coefficient of determination R2 and p values for BaM at the study sites
Study sites R R2 p value
2 0.05 0.0022 0.45
3 0.31 0.0979 0.19
1, 2, 3 -0.06 0.0036 0.387
The variation of DAP with patients’ weight was not determined for site 1 as only 4 BaM
patients fitted the research project inclusion criterion of weighing 50 kg to 90 kg.
Furthermore, a minimum of 10 patients is recommended to allow comparison and
development of DRLs (DWP, 1992). The absence of a direct linear correlation between
patients’ weight and DAP in this study can be attributed to the high degree of emaciation
29 DAP versus weight for all BaM patients (page 58) 30 DAP versus weight for BaM at site 2 (page 59) 31 DAP versus weight for BaM at site 3 (page 60)
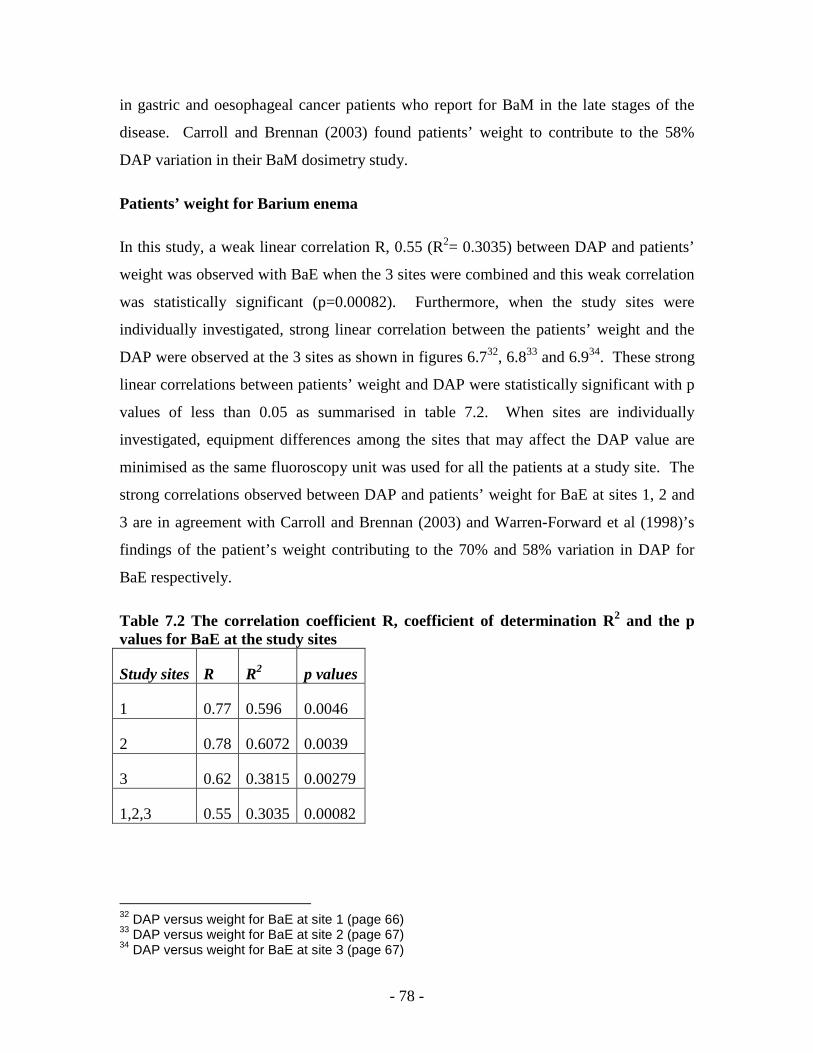
- 78 -
in gastric and oesophageal cancer patients who report for BaM in the late stages of the
disease. Carroll and Brennan (2003) found patients’ weight to contribute to the 58%
DAP variation in their BaM dosimetry study.
Patients’ weight for Barium enema
In this study, a weak linear correlation R, 0.55 (R2= 0.3035) between DAP and patients’
weight was observed with BaE when the 3 sites were combined and this weak correlation
was statistically significant (p=0.00082). Furthermore, when the study sites were
individually investigated, strong linear correlation between the patients’ weight and the
DAP were observed at the 3 sites as shown in figures 6.732, 6.833 and 6.934. These strong
linear correlations between patients’ weight and DAP were statistically significant with p
values of less than 0.05 as summarised in table 7.2. When sites are individually
investigated, equipment differences among the sites that may affect the DAP value are
minimised as the same fluoroscopy unit was used for all the patients at a study site. The
strong correlations observed between DAP and patients’ weight for BaE at sites 1, 2 and
3 are in agreement with Carroll and Brennan (2003) and Warren-Forward et al (1998)’s
findings of the patient’s weight contributing to the 70% and 58% variation in DAP for
BaE respectively.
Table 7.2 The correlation coefficient R, coefficient of determination R2 and the p values for BaE at the study sites
Study sites R R2 p values
1 0.77 0.596 0.0046
2 0.78 0.6072 0.0039
3 0.62 0.3815 0.00279
1,2,3 0.55 0.3035 0.00082
32 DAP versus weight for BaE at site 1 (page 66) 33 DAP versus weight for BaE at site 2 (page 67) 34 DAP versus weight for BaE at site 3 (page 67)
- 79 -
Fluoroscopy time
In this study, the mean FT for BaM and BaE were 7.67 minutes and 5.28 minutes
respectively. Sites 2 and 3 employed DF35 units with pulsed fluoroscopy capability.
Unlike site 3 that recorded the complete FT, the DF unit at site 2 only recorded the time
for emission of each pulse of x-rays. Such time measurements were not a true reflection
of the total FT. As such, only FT recorded at sites 1 and 3 were considered for this study.
Site 1 recorded lower mean FT for both BaM and BaE than site 3. The lower FT at site 1
is attributed to the consultant radiologist with more than 5 years experience performing
the BaM and BaE in contrast to the registrars at site 3. Yakoumakis et al (1999) found
radiologist registrars to register FT of the order of 6.45 minutes (BaM) and 9.1 minutes
(BaE) as compared to qualified radiologists who recorded 3.1 minutes (BaM) and 3.2
minutes (BaE). Though the FT may be affected by the dynamic nature and findings of
the examination, radiologists are capable of controlling the FT by modifying the
technique used for BaM and BaE (Vehmas et al, 2000; Verdun et al, 2005).
Fluoroscopy time has been identified as one of the factors responsible for DAP variation
(Carroll & Brennan, 2003) with total DAP reduction of 11% possible with decreased FT
(Horton et al, 1992). In this study however, there were no direct correlations between
DAP and FT for BaM (R=0.42) and BaE (R=-0.26). The correlation coefficients R, were
less than 1 (Mathbits, 2009). The absence of these direct correlations between the FT and
DAP were however not statistically significant for BaM (p= 0.067) and BaE (0.134). The
absence of direct correlations between DAP and FT for BaM and BaE in this study may
be attributed to comparing radiologists with different levels of experience using different
equipment types. At site 1, a consultant radiologist performed the examinations using a
CF36 unit whereas registrars using DF units performed the BaM and BaE at site 3.
Warren-Forward et al (1998) recorded lower FT with DF (1.63 minutes: 2.63 minutes) as
compared with CF (1.97 minutes: 2.47 minutes) for BaM and BaE respectively.
35 Digital fluoroscopy 36 Conventional fluoroscopy

- 80 -
Digital versus conventional fluoroscopy units
Site 1 employed a CF unit while sites 2 and 3 employed DF units. Site 3 recorded mean
DAP values lower than those at site 1 for both BaM and BaE. There was no statistical
difference between the mean DAP values for BaE at sites 1 and 3. Although, there was
statistical difference between the mean DAP value for BaM at sites 1 and 3, only 4 BaM
patients were investigated at site 1 compared to the 11 patients at site 3. It is therefore
not known whether investigating an equal number of patients at both sites would have
resulted in absence of a statistical difference between of mean DAP values.
Nevertheless, the capacity of DF units to maintain lower doses than CF units was realised
in this study. Radiology registrars associated with long FT and high number of images
maintained lower mean DAP values using the DF unit at site 3 compared to the radiology
consultant with more than 5 years experience employing the CF unit at site 1. Dose
savings of over 50% have been recorded with DF for BaM and BaE as compared to CF as
shown in table 7.3 (Broadhead et al, 1995; Geleijns et al, 1998; Warren-Forward et al,
1998). Broadhead et al (1995) found the doses delivered by DF units to be significantly
lower than those of CF units with standard errors of more that ±3 at the 95% confidence
interval. Warren-Forward et al (1998) realised 15% dose savings for BaE and attributed
these low DF dose savings to the enormous number of images obtained during BaE.
Table 7.3 Mean DAP values recorded for DF and CF units for BaM and BaE Mean DAP (Gycm2) DF CF BaM 7.75 24.18 (Broadhead et al, 1995)
15 28 (Geleijns et al, 1998) 11.39 21.26 (Warren-Forward et al,
1998) 12.5 20.9 (This study) BaE 13.88 25.35 (Broadhead et al, 1995)
25 28 (Warren-Forward et al, 1998) 17.9 29 (This study)
Despite employing a DF unit with pulsed fluoroscopy capability and acquiring images at
low mean frame rates of 7.5, dose saving of only 10% was realised at site 2 for BaM
when compared with site 1 (figure 6.5). For BaE, site 2 recorded mean DAP higher by
- 81 -
26.4% (figure 6.11) than that at site 1 in spite of the dose saving associated with low
frame rates (Trapp & Kron, 2008). The shortcoming of imaging at low frame rates is
increased image noise. In order to compensate the image noise arising from low frame
rates, manufacturers increase the mA37 setting of the DF unit. With high mA settings, the
resultant dose does not decrease by the same amount as the frame rate. For example,
decreasing the frame rate from 30 to 15 frames per second will not result in a 50% dose
saving but rather 25% to 28% (Mahesh, 2001). At site 2, high mA ranges of 82 mA to
150 mA were used for fluoroscopy. Such high mA settings among other factors such as
registrars performing the BaM and BaE may have caused the high DAP readings at site 2.
A step in realising the dose saving possibilities of DF is the training of radiology
personnel in the dose saving capabilities of such units without compromising image
quality (Martin, 2004). The increasing advancement in DF without additional training to
radiology personnel using these units results in the under utilisation of the dose saving
features of the equipment.
Awareness of being monitored
The awareness of being monitored serving as an incentive to reducing radiation doses to
the patients (Crawley et al (1998); Horton et al (1992)) was observed in this study.
Radiologists were concerned about the radiation doses they delivered to the patients and
constantly inquired whether the dose delivered to the patients was within acceptable
limits. However, without indication of which radiologist delivered what amount of
radiation dose to the patient, some registrars became reluctant about the radiation doses
they delivered to the patients. The adoption of dose measurement practices by radiology
departments and nationally with identification of departments delivering high radiation
doses may therefore result in radiology personnel minimising radiation dose to patients
citing their dose delivery being constantly monitored.
37 milliampere (tube current)

- 82 -
CHAPTER 8 CONCLUSION
Diagnostic reference levels were primarily introduced to avoid situations of high patient
radiation exposure without clinical justification. Furthermore, these dose levels were not
to be exceeded when departments were operating under normal diagnostic and technical
practices (ICRP, 1996). The DRLs were set at the third quartile level with the first
quartile serving as a dose level at which the image quality is monitored. In cases where
the third quartile DAP values are high, the median DAP values are adopted as these are
less affected by outliers such as under and over weight of patients (Yakoumakis et al,
1999).
This project investigated the radiation doses received by patients referred for BaM and
BaE so as to obtain potential diagnostic reference dose levels for these examinations in
the Western Cape, SA. The DRLs developed from this study were compared with those
obtained from similar dosimetry studies and causes of dose variation among the study
sites were determined.
The third quartile DAP values obtained in this study were 20.1 Gycm2 and 36.5 Gycm2
for BaM and BaE respectively. Though these DAP values are higher than the DRLs
recorded in the UK (Hart et al, 2007) of 13 Gycm2 and 24 Gycm2 for BaM and BaE
respectively, they are lower than those obtained an earlier study in SA (Engel-Hills,
1997). Following the ICRP (1996) recommendations on country and regional specific
DRLs, comparison with the Engel-Hills (1997) study provides an indication of doses
delivered to patients in Western Cape, SA.
Since the median values are less affected by outliers such as patients’ weight, 13.6 Gycm2
and 27.4 Gycm2; the median values obtained in this study are the recommended DRLs for
BaM and BaE respectively in the Western Cape, SA.
There was no direct correlation between patients’ weight and DAP recorded for BaM.
This was attributed to the emaciation of patients reporting for BaM. The absence of
- 83 -
direct linear correlation between DAP and patients’ weight was not statistically
significant.
Investigation of linear correlation between DAP and patients’ weight for BaE with
measurements from the 3 sites combined resulted in a weak positive correlation which
was statistically significant. When the correlation between DAP and patients’ weight for
each site for BaE was investigated, strong positive correlations that were statistically
significant were obtained suggesting that; as the patients’ weight increased, the DAP also
increased and DAP decreased with decreased patients’ weight for BaE.
There were no direct correlations between the FT and DAP recorded in this study for
BaM and BaE at sites 1 and 3. These correlations were however not statistically
significant. This was attributed to comparing radiologists with different levels of training
using different types of equipment. A consultant radiologist with more than 5 years
experience, recording short FT at a CF unit at site 1 was compared with registrars
recording high FT at a DF unit at site 3. The dose saving features of the DF unit
maintained lower DAP values despite the high FT recorded at site 3.
In this study, there was no statistical difference between the mean DAP values recorded
for the DF and CF units at sites 1 and 3 for BaE as the error bars overlapped. There was
however a statistical difference between the mean DAP values for DF and CF units for
BaM at sites 1 and 3. The difference in the number of patients investigated at sites 1 and
3 creates an uncertainty of whether a statistical difference between the mean values of the
two equipment units would have existed with equal number of patients at the study sites.
It is therefore recommended that more data be collected on DF and CF units so as to
allow dose comparisons for these units.
Despite this, the capacity of DF units to record lower radiation dose than CF units was
realised with radiology registrars associated long FT and high number of images
maintaining lower mean DAP values on the DF unit compared to a radiologist with more
than 5 years experience. However, training of radiology personnel in the dose saving
- 84 -
features of DF units may raise the dose savings to over 50% as recorded in other
dosimetry studies (Geleijns et al, 1998; Warren-Forward et al, 1998; Broadhead et al,
1995).
Limitations of the study
The results of this study provided information on the dose levels for BaM and BaE in the
Western Cape, SA. The study was however limited to public hospitals as the private
sector did not perform sufficient BaM and BaE to allow the data collection process to be
completed within the allocated research project time frame. Additionally, the private
sector employed newer advanced equipment such as multi-detector CT that was opted for
investigating of the GIT as compared to BaM and BaE.
Another limitation was the low number of BaM patients investigated at site 1. Only 4
patients were included in the study from site 1. Most patients were emaciated weighing
less than 50 kg which was the lower weight limit for inclusion in this study.
There was no FT recorded for the digital fluoroscopy unit at site 2. This was because this
unit indicated time for each pulse of x-rays that were not a representation of the complete
FT of the BaM or BaE. Since sites 2 and 3 employed DF units with the pulsed
fluoroscopy feature and registrars performed the BaM and BaE, recording the FT at the
site 2 would have allowed comparison of the DF units at the two sites.
Recommendations
Since there are currently no national Diagnostic Reference Levels for BaM and BaE in
SA, a copy of this work is going to be forwarded to the Department of Radiation Control,
SA proposing the use of 13.6 Gycm2 and 27.4 Gycm2 for BaM and BaE respectively as
initial reference doses for these examinations in the radiology departments. These DRLs
must however not be used in precise manner. Radiology departments where qualified
radiologists perform the BaM and BaE and DF units where dose saving features are
employed must achieve lower DAP readings while maintaining good image quality.
- 85 -
Furthermore, it is recommended that research with larger numbers of participants and
radiologists at the same level of training operating the two units be undertaken so as to
assess the dose delivered by DF and CF units.
The research method used to develop DRLs in this study is a standard protocol
recommended by the DWP (1992) that can be adopted by radiology departments in
developing departmental reference dose levels for radiological procedures. As such,
radiology departments will be able to investigate high radiation dose in their departments
and implement corrective action when the reference doses are exceeded without clinical
justification.
Radiation protection is an important aspect of the radiology department with the ultimate
purpose to deliver As Low As Reasonably Achievable radiation dose to patients referred
for radiological examinations so as minimise the effects and risks of over exposure to
ionising radiation. In addition to allowing active monitoring of the radiation dose
received by patients, establishing reference doses can serve as a quality assurance
measure that assesses the practises and techniques used during radiological examinations.
- 86 -
REFERENCES
Axim (Africa X-ray Industrial and Medical) Pharmaceuticals. 2001. Axim policar ACB. Midrand: EZEM. December 6. Ball, J., Moore, A.D. & Turner, S. 2008. Ball and Moore’s essential physics for radiographers. 4th edition. Chichester: Blackwell. Bartam, C.L. & Taylor, S. 2008. The large bowel. In Adam, A., Dixon, A.K., Grainger, R.G. & Allison, D.J. (eds). Grainger and Allison’s Diagnostic Radiology: a textbook of medical imaging. 5th ed. Volume one. Philadelphia, PA: Churchill Livingstone. Brady, J.E. & Holum, J.R. 1988. Fundamentals of chemistry. 3rd ed. New York: John Wiley and Sons. Broadhead, D.A., Chapple, C.L. & Faulkner, K. 1995. The effect of digital imaging on patient doses during barium studies. The British Journal of Radiology, 68(813):992-996. Bushong, S.C. 2004. Radiologic science for technologists. 8th ed. St. Louis, Mo: Mosby. Caroline, D.F. & Kendzierski, R.M. 2008. The stomach. In Adam, A., Dixon, A.K., Grainger, R.G. & Allison, D.J. (eds). Grainger and Allison’s Diagnostic Radiology: a textbook of medical imaging. 5th ed. Volume one. Philadelphia, PA: Churchill Livingstone. Carroll, E.M. & Brennan, P.C. 2003. Radiation doses for barium enema and barium meal examinations in Ireland: potential diagnostic reference levels. The British Journal Radiology, 76:393-397. Chapman, S. & Nakielny, R. (eds). 2001. A guide to radiological procedures. 4th ed. London: WB Saunders. Chapple, C.L., Broadhead, D.A. and Faulkner, K. 1995. A phantom based method for deriving typical patient doses from measurements of dose-area product on populations of patients. The British Journal Radiology, 68(814):1083-1086.
- 87 -
Ciraj, O., Marković, S. & Košutić, D. 2005a. Patient doses for barium meal examination in Serbia and Montenegro and potentials for dose reduction through changes in equipment setting. Radiation Protection Dosimetry, 114 (1-3):158-163. Ciraj, O., Košutić, D., Kovacevic, M. & Marković, S. 2005b. A survey of patient doses from conventional examinations: first results from Serbia and Montenegro. Physical Medical, XXI (4):159-163 October - December. Cowen, A.R., Davies, A.G. & Sivananthan, M.U. 2008. The design and imaging characteristics of dynamic, solid-state, flat panel x-ray detectors for digital fluoroscopy and fluorography. Clinical Radiology, 63:1073-1085. Crawley, M.T., Shine, B. & Booth, A. 1998. Radiation dose and diagnosticity of barium enema examinations by radiographers and radiologists: a comparative study. The British Journal Radiology, 71:399-405. Cumming, G., Fidler, F. & Vaux, D.L. 2007. Error bars in experimental biology. The Journal of Cell Biology, 177(1):7-11. Debatin, J.F. & Patak, M.A. 1999. MRI of the small and large bowel. European Radiology, 9:1523-1534. Delichas, M.G., Hatziioannou, K., Papanastassiou, E., Albanopoulou, P., Chatzi, E., Sioundas, A. & Psarrakos, K. 2004. Radiation doses to patients undergoing barium meal and barium enema examinations. Radiation Protection Dosimetry, 109 (3):243-247. DoH SA (Department of health South Africa). 2006. Radiography conditions (excluding radiotherapy simulators) - Annexure to licence. http://www.doh.gov.za/department/radiation/licencing/electronicproducts/conditions/radiography.pdf [accessed 24 January 2008]. DWP (Dosimetry Working Party of the Institute of Physical Sciences in Medicine). 1992. National protocol for patient dose measurement in diagnostic radiology. Chilton: NRPB (National Radiation Protection Board). Engel-Hills, P.C. 2002. Radiation dosimetry for the radiographer. The South African Radiographer, 40(1):7-10.
- 88 -
Engel-Hills, P. C. 1997. Investigation of the barium enema x-ray examination as a significant contributor to the genetically-significant dose from diagnostic radiology. Master of Science thesis of the University of Cape Town. Engel-Hills, P.C. & Hering, E.R. 2001. Dose-area product measurements during barium enema radiograph examinations-a Western Cape study. South African Medical Journal, 91(8):693-696. Gahleitner, A., Kreuzer, S., Schick, S., Nowotny, R., Breitenseher, M., Solar, P., Czerny, C., Lang, T. & Imhof, H. 1999. Dry versus conventional laser imagers: film properties and image quality. Radiology, 210:871-875. Geleijns, J., Broerse, J.J., Chandie Shaw, M.P., Schultz, F.W., Teeuwissw, W., Van Unnik, J.G. & Zoetelief, J. 1998. A comparison of patient doses for examinations of the upper gastrointestinal tract at 11 conventional and digital X-ray units in the Netherlands. The British Journal of Radiology, 71:745-753. Gelfand, D.W. 1988. Gastrointestinal radiology-a short history and prediction of the future. Commentary. American Journal of Roentgenology, 150:727-730. Grey, J.E. 1997. Technical aspects of screen-film radiography, film processing, and quality control. RadioGraphics, 17:177-187. Hart, D., Jones, D.G. & Wall, B.F. 1994. Estimation of effective dose in diagnostic radiology from entrance surface dose and dose area product measurements. Chilton: NRPB-R262. Hart, D., Hillier, M.C. & Wall, B.F. 2007. Doses to patients from radiographic and fluoroscopic x-ray imaging procedures in the UK-2005 review. Chilton: Health Protection Agency-Radiation Protection Division (HPA-RPD)-029. Hart, D., Hillier, M.V. & Wall, B. F. 2002. Doses to patients from medical X-Ray examinations in the UK: 2000 review. Chilton: NRPB – W14/ National Radiological Protection Board.
- 89 -
Hart, D., Hillier, M.C., Wall, B.F, Shrimpton, P.C. & Bungay, D. 1996. Doses to patients from medical x-ray examinations in the UK-1995 review. London: HMSO (Her Majesty’s Stationery Office), NRPB-R289. Hart, D. & Wall, B.F. 2004. UK population doses from medical X-ray examinations. European Journal of Radiology, 50:285-291. Hart, D. & Wall, B.F. 1994. Estimation of effective dose from dose-area product measurements for barium meals and barium enemas. The British Journal Radiology, 67:485-489. Holmes, H. N., Tscheslog, R. N., Hendler, C. B., Morrel, M., Brabson, C. M., Breuninger, C. C., Comerford, K. C., Follin, S. A. & Mayer BH (eds). 1997. Illustrated handbook of nursing care. Pennsylvania: Springhouse. Horton, D., Cook, A.M. & Taylor, A.D. 1992. Audit in action: a significant reduction of double-contrast barium enema screening time with no loss of examination quality. The British Journal Radiology, 65:507-509. Hoskins, P.R. & Williams, J.D. 1992. Influence of radiologist grade on fluoroscopic patient dose. The British Journal Radiology, 65:1119-1123. International Commission on Radiological Protection. 2002. Diagnostic reference levels in medical imaging: review and additional advice. Supporting guidance 2. Annals of the ICRP, 31(supplementary 4):33-52. International Commission on Radiological Protection. 1998. History, polices, procedures. Annals of ICRP, 28 (supplementary 1):1-29. International Commission on Radiological Protection. 1996. Radiological protection and safety in medicine, ICRP publication 73. Annals of the ICRP, 26 No. 2. Jackson, S. L. 2008. Research methods: a modular approach. California: Thomson Wadsworth.
- 90 -
Karen, M., Horton, M.D., Elliot, K. & Fishman, M.D. 2003. Current role of CT in imaging of the stomach. RadioGraphics, 23:75-87. Kaul, A., Bauer, B., Bernhardt, J., Nosske, D. & Veit, R. 1997. Effective doses to members of the public from the diagnostic application of ionizing radiation in Germany. European Radiology, 7:1127-1132. Kemerink, G.J., Borstlap, A.C.W., Frantzen, M.J., Schultz, F.W., Zoetelief, J. & van Engelshoven, J.M.A. 2001. Patient and occupational dosimetry in double contrast barium enema examinations. The British Journal of Radiology, 74:420-428. Lampinen, J.S. & Rannikko, S. 1999. Patient specific doses used to analyse the optimum dose delivery in barium enema examinations. The British Journal Radiology, 72:1185-1195. Leedy, P.D. & Ormrod J.E. 2001. Practical research: planning and design.7th ed. New Jersey: Merrill Prentice Hall. Mahesh, M. 2001. Fluoroscopy: patient exposure issues. RadioGraphics, 21:1033-1045. Martin, C.J. 2004. A review of factors affecting patient doses for barium enemas and meals. The British Journal of Radiology, 77:864-868. Martin, C.J. & Hunter S. 1994. Reduction of patient doses from barium meal and barium enema examinations through changes in equipment factors. The British Journal of Radiology, 67:1196-1205. Martin, A. & Harbison, S.A. 1996. An introduction to radiation protection. 3rd ed. New York: Chapman and Hall. Mathbits. 2009. Correlation coefficient. http://mathbits.com/Mathbits/TISection/Statistics2/correlation.htm [accessed 17 August 2009]. Matthews, K. & Brennan, P.C. 2008. The application of diagnostic reference levels: general principles and an Irish perceptive. Radiography, xx:1-8.
- 91 -
McKillup, S. 2005. Statistics explained: an introductory guide for life sciences. Cambridge: Cambridge University Press. McQuaruz, V.Z.S.A.M. & Tole, N.M. 1992. Radiation doses to patients during contrast examinations of the gastrointestinal tract. East African Medical Journal; 69 (12):655-659. Morrell, R.E., Rogers, A.T., Jobling, J.C. and Shakespeare, K.E. 2004. Barium enema: use of increased copper filtration to optimize dose and image quality. The British Journal of Radiology, 77:116-122. RCR (Royal College of Radiologists) and NRPB (National Radiological Protection Board). 1990. Patient dose reduction in diagnostic radiology. Documents of the NRPB, Vol. 1, No. 3. Chilton: NRPB. Roberts, P. J. 1992. Patient dosimetry in diagnostic radiology; International Commission on Radiological Units (ICRU) news. Bethesda: ICRU and Measurements. December. Rockey, D.C., Paulson, E., Niedzwiecki, D., Davis, W., Bosworth, H.B., Sanders, L., Lee, J., Henderson, J., Hatten, P., Burdick, S., Sanyal, A, Rubin, D.T., Sterling, M., Akerkar, G., Bhutani, M.S., Binmoeller, K., Garvie, J., Bini, E.J., McQuaid, K., Foster, W.L., Thompson, W.M., Dachman, A. & Halvorsen, R. 2005. Analysis of air contrast barium enema, computed tomographic colonography, and colonoscopy: a prospective comparison. Lancet, 365:305-311. Ruiz-Cruces, R., Ruiz, F., Pĕrez-Martĭnez, M., Lŏpez, J., Tort Ausina, I. & Dĭez de Los Rĭos, A. 2000. Patient dose from barium procedures. The British Journal of Radiology, 73:752-761. Samei, E., Seibert, A., Andriole, K., Badano, A., Crawford, J., Reiner, B., Flynn, M.J. & Chang, P. 2004. PACS equipment overview; general guidelines for purchasing and acceptance testing of PACS equipment. RadioGraphics, 24:313-334. Schueller, G., Kaindl, E., Langenberger, H., Stadler, A., Schueller-Weidekemm, C., Semturs, F. & Helbich, T.H. 2007. Validation of image quality in full-field digital mammography: Is the replacement of wet by dry laser printers justified? European Journal of Radiology, 62:267-272.
- 92 -
Seeram, E. 2009. Computed Tomography; physical principles, clinical applications and quality control. 3rd ed. St. Louis, Mo: Saunders. Simpkins, K. C. 1993. Stomach and duodenum. In Sutton, D (ed). A textbook of radiology and Imaging. 3rd ed. London: Churchill Livingstone. South Africa. 1973. Public Health Act. Notice 1822 of 1973. Government Gazette, 98(3991):1-12, August 3. Sprawls, P. & Kitts, E.L. 1996. Optimum processing of mammographic film. RadioGraphics, 16:349-354. Statkiewicz-Sherer, M.A., Visconti, P.J. & Ritenour, E.R. 1993. Radiation protection in medical radiography. 2nd ed. St. Louis, Mo: Mosby. Stones, D.C. & Ellis, J. 2006. Outliers & regression. http://www.chem.utoronto.ca/coursenotes/analsci/StatsTutotial/Outliers.html [accessed 18 August 2009]. Taylor, J.R. 1997. An introduction to error analysis: the study of uncertainties in physical measurements. 2nd ed. Sausalito, California: University Science Books. Thomas, B. The colon. 1993. In Sutton, D (ed). A textbook of radiology and Imaging. 3rd ed. London: Churchill Livingstone. Trapp, J.V. & Kron, T. (eds). 2008. An introduction to radiation protection in medicine. New York: Taylor & Francis. United States Food and Drug Agency (USFDA), Department of Health and Human Services. 2006. Performance standards for ionizing radiation emitting products, 21CFR 1020. Rockville, MD: USFDA.
- 93 -
Vańo, E., Gonzalez, L., Morăn, P., Calzado, A., Delgado, V., Fernandez, J.M. & Ruiz, M.J. 1992. Valores de referencia de dosis al paciente en exploraciones de radiodiagnŏstico. Radiologia, 34:27-31. Vehmas, T., Lampinen, J.S.,Mertjarvi, A. and Rannikko, S. 2000. Factors influencing patient radiation doses from barium enema examinations. Acta Radiologica, 41:167-171. Verdun, F.R., Aroua, A., Trueb, Ph.R., Vock, P. and Valley, J-F. 2005. Diagnostic and interventional radiology: a strategy to introduce reference dose level taking into account the national practice. Radiation Protection Dosimetry, 114(1-3):188-191. Wade, P. 1994. Science and practicalities of patient dose measurement procedures. Radiography today, 60(681):13-16. Wall, B. 1996. Full protection. Synergy: 41-43, April. Wall B F. 2001. Diagnostic reference levels-the way forward. The British Journal of Radiology, 74(885):785-788. Walliman, N. 2005. Your research project. 2nd edition. London: SAGE. Warren-Forward H M, Haddaway M J, Temperton D H and McCall I W. 1998. Dose-area product readings for fluoroscopic and plain film examinations, including an analysis of the source of variation for barium enema examinations. The British Journal of Radiology, 71:961-967. Yakoumakis, A., Tsalafoutas, I. A., Sandilos, P., Koulentianos, H., Kasfiki, A., Vlahos, L. and Proukakis, Ch. 1999. Patient doses from barium meal and barium enema examinations and potential for reduction through proper set-up of equipment. The British Journal of Radiology, 72:173-178. Zähringer, M., Wassmer, G., Krug, B., Winnekendonk, G., Gossmann, A. and Lackner, J. 2001. Image quality of digital chest x-rays: wet versus dry laser printers. Journal of Digital Imaging, 14(3):158-162.
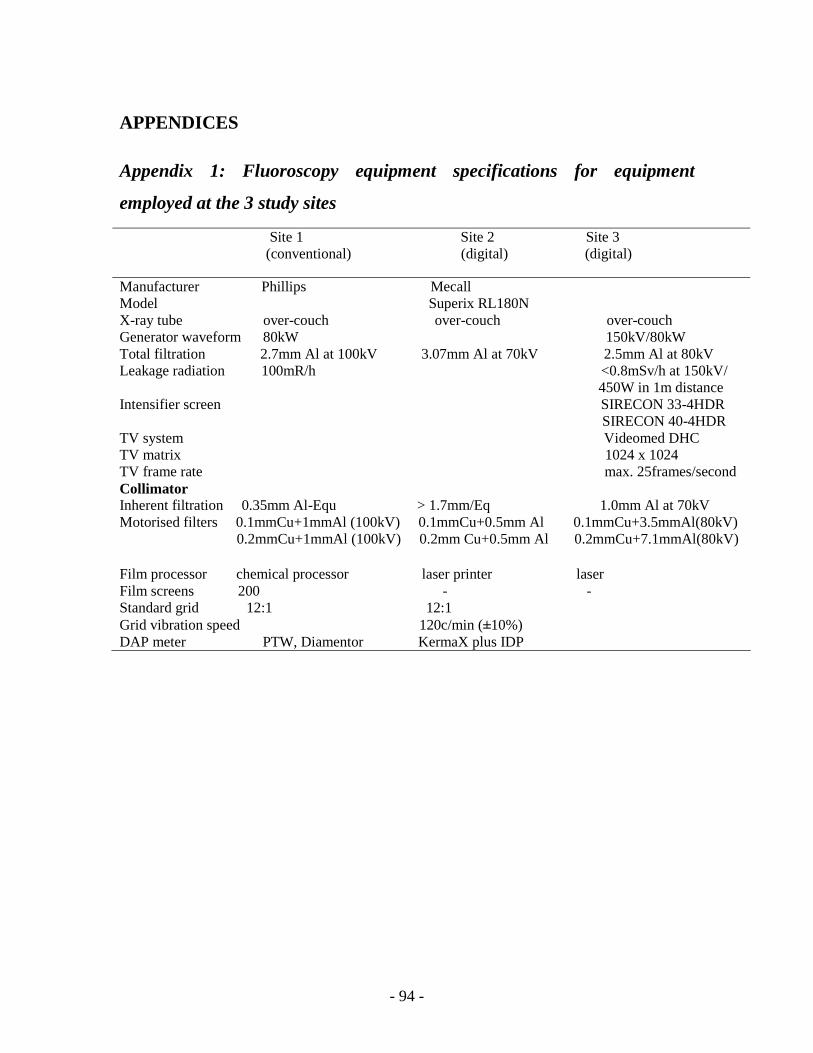
- 94 -
APPENDICES
Appendix 1: Fluoroscopy equipment specifications for equipment
employed at the 3 study sites
Site 1 Site 2 Site 3 (conventional) (digital) (digital)
Manufacturer Phillips Mecall Model Superix RL180N X-ray tube over-couch over-couch over-couch Generator waveform 80kW 150kV/80kW Total filtration 2.7mm Al at 100kV 3.07mm Al at 70kV 2.5mm Al at 80kV Leakage radiation 100mR/h <0.8mSv/h at 150kV/ 450W in 1m distance Intensifier screen SIRECON 33-4HDR SIRECON 40-4HDR TV system Videomed DHC TV matrix 1024 x 1024 TV frame rate max. 25frames/second Collimator Inherent filtration 0.35mm Al-Equ > 1.7mm/Eq 1.0mm Al at 70kV Motorised filters 0.1mmCu+1mmAl (100kV) 0.1mmCu+0.5mm Al 0.1mmCu+3.5mmAl(80kV) 0.2mmCu+1mmAl (100kV) 0.2mm Cu+0.5mm Al 0.2mmCu+7.1mmAl(80kV) Film processor chemical processor laser printer laser Film screens 200 - - Standard grid 12:1 12:1 Grid vibration speed 120c/min (±10%) DAP meter PTW, Diamentor KermaX plus IDP
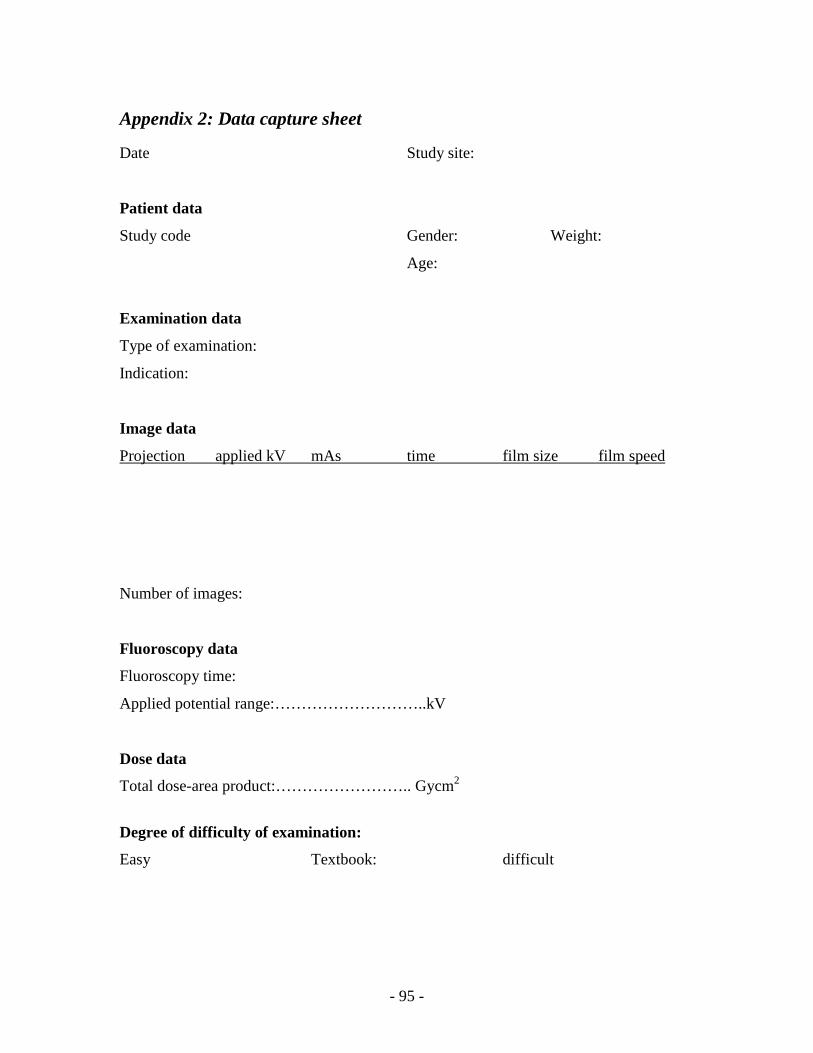
- 95 -
Appendix 2: Data capture sheet
Date Study site:
Patient data
Study code Gender: Weight:
Age:
Examination data
Type of examination:
Indication:
Image data
Projection applied kV mAs time film size film speed
Number of images:
Fluoroscopy data
Fluoroscopy time:
Applied potential range:………………………..kV
Dose data
Total dose-area product:…………………….. Gycm2
Degree of difficulty of examination:
Easy Textbook: difficult

- 96 -
Appendix 3 Consent Form
PARTICIPANT INFORMATION AND INFORMED CONSENT FORM FOR RESEARCH PROJECT INVOLVING MEASUREMENT OF RADIATION DOSES RECEIVED BY PATIENTS DURING BARIUM MEAL AND BARIUM ENEMA EXAMINATIONS TITLE OF RESEARCH PROJECT: Investigation of radiation doses received by patients during barium meals and enemas to develop potential reference values for the Western Cape PRINCIPAL INVESTIGATOR: Caroline Nabasenja
Registered for: M Tech Radiography at the Cape Peninsula University of Technology
ADDRESS: 19223 Tygerberg 7505 CONTACT NO: 0781762911 Dear Participant, Thank you for choosing our institution to take care of your health needs. As it is our goal to continuously offer quality medical care to our clients, we request your participation in a research study that involves investigating the radiation doses received by patients referred for barium meal and barium enema examinations. Please take some time to read the information presented here which will explain the details of this project. Kindly ask the principal investigator/attending radiographer about any part of the project that you do not fully understand. It is very important that you fully understand what the research will mean for you. Your participation is entirely voluntary and you will still receive our excellent services whether you agree to us using your information for this project or not. The head of the radiology department of ……………… hospital has approved the research project. The Research Ethics Committee of the university has reviewed the research proposal and granted approval for the study. What does this research study involve? In the radiology department, x-rays are used to produce images of the body. These x-rays must however be actively monitored to maximise their benefits to patients, that is to produce a diagnostic image of the x-rayed area of the body for the doctor to make an accurate diagnosis.
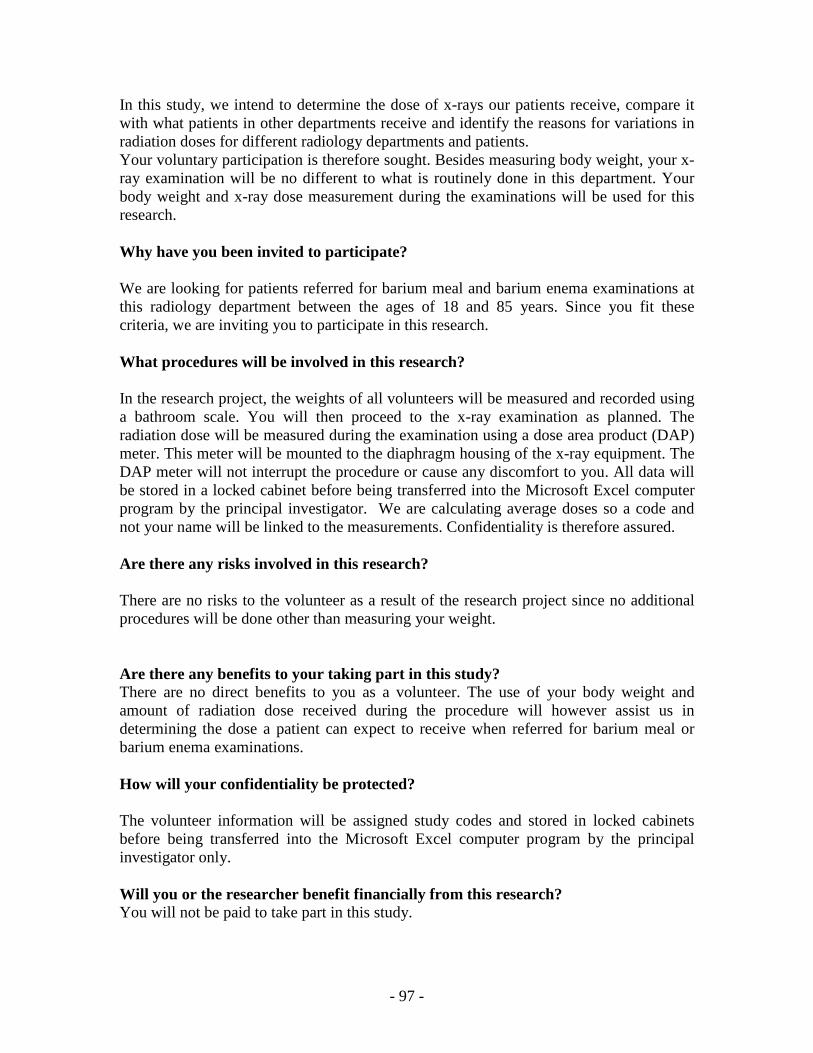
- 97 -
In this study, we intend to determine the dose of x-rays our patients receive, compare it with what patients in other departments receive and identify the reasons for variations in radiation doses for different radiology departments and patients. Your voluntary participation is therefore sought. Besides measuring body weight, your x-ray examination will be no different to what is routinely done in this department. Your body weight and x-ray dose measurement during the examinations will be used for this research. Why have you been invited to participate? We are looking for patients referred for barium meal and barium enema examinations at this radiology department between the ages of 18 and 85 years. Since you fit these criteria, we are inviting you to participate in this research. What procedures will be involved in this research? In the research project, the weights of all volunteers will be measured and recorded using a bathroom scale. You will then proceed to the x-ray examination as planned. The radiation dose will be measured during the examination using a dose area product (DAP) meter. This meter will be mounted to the diaphragm housing of the x-ray equipment. The DAP meter will not interrupt the procedure or cause any discomfort to you. All data will be stored in a locked cabinet before being transferred into the Microsoft Excel computer program by the principal investigator. We are calculating average doses so a code and not your name will be linked to the measurements. Confidentiality is therefore assured. Are there any risks involved in this research? There are no risks to the volunteer as a result of the research project since no additional procedures will be done other than measuring your weight. Are there any benefits to your taking part in this study? There are no direct benefits to you as a volunteer. The use of your body weight and amount of radiation dose received during the procedure will however assist us in determining the dose a patient can expect to receive when referred for barium meal or barium enema examinations. How will your confidentiality be protected? The volunteer information will be assigned study codes and stored in locked cabinets before being transferred into the Microsoft Excel computer program by the principal investigator only. Will you or the researcher benefit financially from this research? You will not be paid to take part in this study.
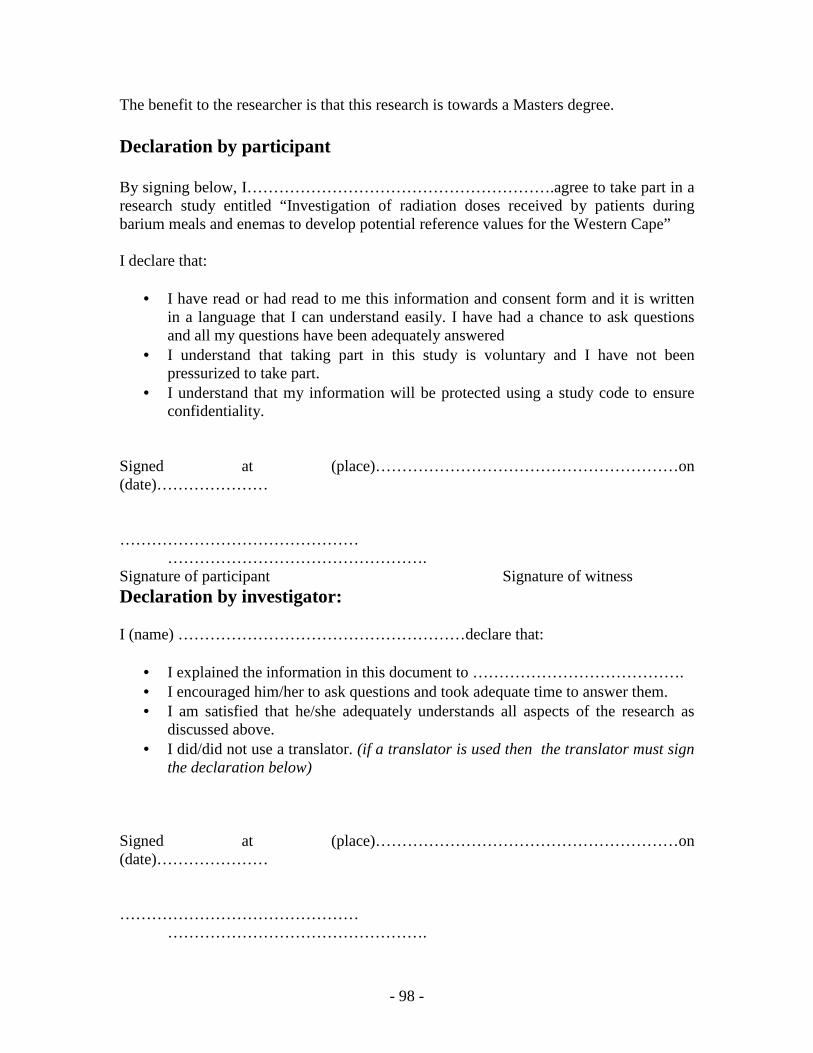
- 98 -
The benefit to the researcher is that this research is towards a Masters degree. Declaration by participant By signing below, I………………………………………………….agree to take part in a research study entitled “Investigation of radiation doses received by patients during barium meals and enemas to develop potential reference values for the Western Cape” I declare that:
• I have read or had read to me this information and consent form and it is written in a language that I can understand easily. I have had a chance to ask questions and all my questions have been adequately answered
• I understand that taking part in this study is voluntary and I have not been pressurized to take part.
• I understand that my information will be protected using a study code to ensure confidentiality.
Signed at (place)…………………………………………………on (date)………………… ……………………………………… …………………………………………. Signature of participant Signature of witness Declaration by investigator: I (name) ………………………………………………declare that:
• I explained the information in this document to …………………………………. • I encouraged him/her to ask questions and took adequate time to answer them. • I am satisfied that he/she adequately understands all aspects of the research as
discussed above. • I did/did not use a translator. (if a translator is used then the translator must sign
the declaration below) Signed at (place)…………………………………………………on (date)………………… ……………………………………… ………………………………………….
- 99 -
Signature of investigator Signature of witness Declaration by Translator I (name) ………………………………………………declare that:
• I assisted the investigator (name) ………………………………..to explain the Information in this document to (name of participant) ……………………………………..using the medium of Afrikaans /Xhosa.
• We encouraged him/her to ask questions and took adequate time to answer them. • I conveyed a factually correct version of what was related to me. • I am satisfied that the participant fully understands the content of this informed
consent document and has had all his/her question satisfactorily answered. Signed at (place)…………………………………………………on (date)………………… ……………………………………… …………………………………………. Signature of translator Signature of witness