Radiation Dose to Patients from - UCLA Brain Mapping...
195
Transcript of Radiation Dose to Patients from - UCLA Brain Mapping...


ICRP Publication 106
Radiation Dose to Patients fromRadiopharmaceuticals
Addendum 3 to ICRP Publication 53
ICRP Publication 106
Approved by the Commission in October 2007
Abstract–In this report, the Commission provides biokinetic and dosimetric models for 33radiopharmaceuticals, as well as recommendations related to breast feeding for mothers whohave undergone a nuclear medicine investigation. The report is based on Addenda 3–9 toPublication 53. Addenda 3–7 have been available on the ICRP website (www.icrp.org) as
interim reports. The work has been carried out by a Joint Task Group of ICRP Committees 2and 3.
This publication provides biokinetic models, absorbed doses, and effective doses for the
following radiopharmaceuticals: 11C-acetate; 11C-amino acids; 11C-brain receptor substances;11C-methionine; 18F-amino acids; 18F-FET; 18F-FDG; 111In-monoclonal antibodies/frag-
ments; 123I-fatty acids (BMIPP, IPPA); 123I-monoclonal antibodies/fragments; 131I-mono-
clonal antibodies/fragments; and 201Tl-ion. The publication also provides realistic maximum
models for 11C- and 18F-substances, for which no specific models are available.
� 2008 ICRP. Published by Elsevier Ltd. All rights reserved.
Keywords: Radiopharmaceuticals; Biokinetics; Dosimetry; Breast feeding
1
ICRP Publication 106
Guest Editorial
MORE THAN THREE DECADES OF WORK OF ICRP IN THE ASSESSMENT
OF DOSE TO PATIENTS FROM RADIOPHARMACEUTICALS
As early as 1971, i.e., more than three decades ago, ICRP started work on doses to
patients from radiopharmaceuticals (Publication 17; ICRP, 1971). Publication 17 was
intended to be a compilation of published data and estimates on absorbed doses
from a total of 92 compounds used at the time in nuclear medicine, to give guidance
to the nuclear medicine physician and the medical physicist in protecting the patientin radionuclide investigations. Later, Publications 53 (ICRP, 1987) and 62 (ICRP,
1991), on absorbed doses and effective dose equivalents and on effective doses,
respectively, per unit activity administered, considered radiopharmaceuticals which
had been introduced into regular use since 1987.
This series of ICRP reports takes account of new radiopharmaceuticals and has
introduced, in Publication 62, an age-related bladder voiding model. It is most
important that the assessment of age-dependent effective doses provides an opportu-
nity to express, by means of a single value, the radiation-induced risk to patients ofvarious ages (reference patients) undergoing different radiodiagnostic procedures.
These estimates also provide guidance to ethics committees when deciding upon re-
search projects involving the use of radioactive substances on volunteers who receive
no individual benefit from the study.
In view of the importance of absorbed and effective dose estimates in nuclear med-
icine, early in the 1980s, a Task Group of ICRP Committee 2, later converted to a
Joint Task Group together with Committee 3, on Radiation Dose to Patients from
Radiopharmaceuticals was appointed:
� to provide biokinetic models, absorbed doses, and effective doses using ICRP
dosimetry for current and new radiopharmaceuticals which have come into use
since Publication 17 (ICRP, 1971); and
� to supply estimated absorbed and effective doses to patients, including the rangeof variation to be expected in pathological states, for adults, children, and the
embryo and fetus.
The present report, constituting Addendum 3 to Publication 53 (ICRP, 1987),covers 33 different substances in addition to Addenda 1 and 2 in Publications 62
and 80. Together with Publication 80 (ICRP, 1998), the present Publication 106 will
cover most of the pharmaceuticals in current use in diagnostic nuclear medicine.
3
ICRP Publication 106
Consequently, as in the past, the report will support the nuclear physician in her/his
responsibility of optimising the use of various radiodiagnostic techniques.
However, due to the need for more detailed and patient-specific dosimetry and
dose planning in tumour therapy using radionuclides, the data are not intended
for therapeutic applications of radionuclides. Likewise, as in earlier reports, amounts
of administered radiopharmaceuticals, i.e. activities, required for a particular inves-
tigation are not given, since the report does not imply any recommendation regard-ing the use of a radiopharmaceutical.
Recommendations are also given for the protection of infants on breast-feeding
interruptions, and for the protection of personnel on radiation exposure of hands
in radiopharmacies.
As a former member of the Task Group on Absorbed Dose to Patients from
Radiopharmaceuticals which prepared Publication 53 (ICRP, 1987), and Chairman
of ICRP Committee 2 for several years, I wish to congratulate the Task Group
for the extremely valuable work they have done over the years. I wish to close byrepeating the plea made in 1971 in Publication 17 to secure the maximum informa-
tion possible from any investigation in the future:
‘The particular information needed for dose calculations includes fractional long-
term retention of radionuclides and labelled compounds, turnover of the radiophar-
maceutical and its metabolites, and distribution of radionuclides within different
organs.’
This means that those who are involved in diagnostic and therapeutic administra-
tion of radionuclides to patients or volunteers are requested to collect such informa-tion as completely as possible, as a basis for future advanced internal dosimetry in
nuclear medicine.ALEXANDERLEXANDER KAULAUL
References
ICRP, 1971. Protection of the Patient in Radionuclide Investigations. ICRP Publication 17. Pergamon
Press, Oxford, UK.
ICRP, 1987. Radiation dose to patients from radiopharmaceuticals. ICRP Publication 53. Ann. ICRP
18 (1–4).
ICRP, 1991. Radiation dose to patients from radiopharmaceuticals. Addendum 1 to ICRP Publication 53.
ICRP Publication 62. Ann. ICRP 22(3).
ICRP, 1998. Radiation dose to patients from radiopharmaceuticals. Addendum 2 to ICRP Publication 53.
ICRP Publication 80. Ann. ICRP 28(3).
4
CONTENTS
ABSTRACT......................................................................................................................... 1
GUEST EDITORIAL ......................................................................................................... 3
CONTENTS ........................................................................................................................ 5
PREFACE............................................................................................................................ 7
1. INTRODUCTION ........................................................................................................ 11
2. SELECTION OF RADIOPHARMACEUTICALS ..................................................... 13
3. SELECTION OF ORGANS AND TISSUES FOR DOSE CALCULATIONS ......... 15
4. BIOKINETIC MODELS AND DATA........................................................................ 17
5. METHODS FOR CALCULATING ABSORBED DOSE .......................................... 21
5.1. Calculation of absorbed dose.............................................................................. 21
5.2. Calculation of cumulated activity ....................................................................... 22
5.3. Uncertainities in absorbed dose estimates .......................................................... 24
6. EFFECTIVE DOSE ...................................................................................................... 25
6.1. Use of effective dose in nuclear medicine ........................................................... 25
6.2. Calculation of effective dose ............................................................................... 27
7. DOSE TO EMBRYO AND FETUS ............................................................................ 29
8. REFERENCES FOR THE MAIN TEXT ................................................................... 31
ANNEX A. SPECIAL BIOKINETIC AND DOSIMETRIC MODELS ..................... 35
ANNEX B. EXPLANATIONS...................................................................................... 47
ANNEX C. BIOKINETIC MODELS AND DOSE TABLES ..................................... 51
ANNEX D. RECOMMENDATIONS ON BREAST-FEEDING
INTERRUPTIONS ......................................................................................................... 163
ANNEX E. RADIATION EXPOSURE OF HANDS IN RADIOPHARMACIES:
MONITORING OF DOSES AND OPTIMISATION OF PROTECTION.................. 167
FULL BIBLIOGRAPHY................................................................................................ 185
5
PREFACE
In 1987, the International Commission on Radiological Protection (ICRP),
referred to below as ‘the Commission’, published a report entitled ‘Radiation doseto patients from radiopharmaceuticals’ (Publication 53; ICRP, 1987). This report
contained calculations of absorbed doses per unit activity administered for some
120 radiopharmaceuticals in regular use at the time. The calculations were based
on biokinetic models and best estimates of biokinetic data for individual
radiopharmaceuticals.
A first addendum to Publication 53 was published (as ICRP (1991b; included in
Publication 62). This contained biokinetic and dosimetric data for six new radiophar-
maceuticals, and a table of effective doses per unit administered activity for thoseradiopharmaceuticals that had been discussed in Publication 53.
In the second addendum to Publication 53 (ICRP, 1998; included in Publication
80), the Joint Task Group on Radiopharmaceuticals of ICRP Committees 2 and 3
presented biokinetic and dosimetric data on 10 new radiopharmaceuticals, and recal-
culations of dose data for 19 of the most frequently used radiopharmaceuticals in
Publication 53. A number of minor corrections and recalculations of older data were
also provided at that time.
In this third printed amendment to Publication 53, dosimetric and biokinetic dataare provided for 33 further radiopharmaceuticals in current use. The report also in-
cludes recommendations relating to breast feeding for mothers who have undergone
nuclear medicine procedures.
In addition, Annex E comprises recommendations concerning radiation
exposure of hands in radiopharmacies, drafted by a Working Party of ICRP
Committee 3.
The membership of the Task Group that prepared this report, except for Annex E,
was:
S. Mattsson (Chair)
L. Johansson (Secretary)7
J. Liniecki
D. Noßke
M. Stabin S. Leide-Svegborn D. TaylorThe corresponding members were:
S. Carlsson
K. Norrgren B. NosslinS. Valind
The membership of the Working Party that prepared Annex E was:
J. Liniecki (Chair)
J. Jankowski C. MartinS. Mattsson
The membership of Committees 2 and 3 during the period of preparation was:
Committee 2 (2001–2005)
ICRP Publication 106
C. Streffer (Chair)
M. Balonov8
B.B. Boecker
A. Bouville
G. Dietze K.F. Eckerman J. Inaba I.A. Liktharev J.L. LipszteinH.-G. Menzel
H. Metivier H. ParetzkeA.S. Pradhan
J.W. Stather (Vice-Chair) D.M. Taylor (Secretary)Y.-Z. Zhou
Committee 2 (2005–2009)
H.-G. Menzel (Chair, 2007–)
M. Balonov V. Berkovski W.E. Bolch A. Bouville G. DietzeK.F. Eckerman
J.D. Harrison (Secretary) N. IshigureP. Jacob (2006–)
J.L. Lipsztein F. PaquetH. Paretzke (–2006)
A.S. Pradhan J.W. Stather(Vice-Chair, –2008)
C. Streffer (Chair, –2007)
Y.-Z. ZhouCommittee 3 (2001–2005)
F.A. Mettler, Jr (Chair)
J.-M. Cosset C. CousinsM.J. Guiberteau
I.A. Gusev L.K. Harding (Secretary)M. Hiraoka
J. Liniecki (Vice-Chair) S. MattssonP. Ortiz Lopez
L.V. Pinillos-Ashton M.M. RehaniH. Ringertz
M. Rosenstein C. SharpE. Vano
W. YinCommittee 3 (2005–2009)
C. Cousins (Chair, 2005–)
J.-M. Cosset (Vice-Chair) I.A. GusevJ.W. Hopewell (2006–)
Y. Li J. LinieckiP. Ortiz Lopez
S. Mattsson L.V. Pinillos-AshtonH. Ringertz
M. Rosenstein E. Vano (Secretary)Y. Yonekura
The report was approved for publication by Committee 3 at its meeting in Berlin,
Germany in October 2007, by delegation of authority from the Commission with
respect to reports on doses to patients from radiopharmaceuticals.
ICRP Publication 106
References
ICRP, 1987. Radiation dose to patients from radiopharmaceuticals. ICRP Publication 53. Ann. ICRP
18(1–4).
ICRP, 1991b. Radiation dose to patients from radiopharmaceuticals. Addendum 1 to ICRP Publication
53, in: Radiological protection in biomedical research. ICRP Publication 62. Ann. ICRP 22(3).
ICRP, 1998. Radiation dose to patients from radiopharmaceuticals. Addendum 2 to ICRP Publication 53.
ICRP Publication 80. Ann. ICRP 28(3).
9

1. INTRODUCTION
(1) The administration of radioactive substances to humans for diagnosis, therapy,
or research purposes is a well-established and developing branch of medical practice,
and is, in most countries, recognised under the name of ‘nuclear medicine and molec-ular imaging’. New methods and new radiopharmaceuticals are being introduced
continually. Reasonably accurate dosimetry for representative groups of patients
for each specific investigation is needed in order to optimise use of the various alter-
native radiodiagnostic techniques, and to estimate the collective radiation exposure
and risk from nuclear medicine investigations. The limited, but increasing, use of
radiopharmaceuticals for therapy requires even more detailed and patient-specific
dosimetry and dose planning, including both tumour and normal tissue. The data
presented in this report are intended for diagnostic nuclear medicine and not fortherapeutic applications.
(2) With regard to dose calculations for radiopharmaceuticals for diagnostic pur-
poses, important material has been published previously by the Commission. In
1987, Publication 53 (ICRP, 1987) was published containing dose estimates for
approximately 120 substances and superseding Publication 17 (ICRP, 1971). In
1991, dose data for six additional substances were published in Publication 62
(ICRP, 1991b), and data for another 10 substances were published within Publica-
tion 80 (ICRP, 1998). Most of the further work of the Task Group on RadiationDose to Patients from Radiopharmaceuticals has been available on the ICRP’s web-
site (www.icrp.org), and open for comments and corrections. This material, covering
33 different substances in current use, is published in the present report. Together
with Publication 80, this will cover most of the pharmaceuticals in current use in
diagnostic nuclear medicine.
(3) Important material regarding dose calculations from radiopharmaceuticals has
also been published in reports from the International Commission on Radiation
Units and Measurements, especially ICRU Reports 32 and 67 (ICRU, 1979,2002). At national level, several absorbed dose catalogues for radiopharmaceuticals
and collections of published values have also appeared (Roedler et al., 1978; NCRP,
1982; Johansson et al., 1992; ARSAC, 2006). Of particular importance is the work of
the Medical Internal Radiation Dose (MIRD) Committee of the United States Soci-
ety of Nuclear Medicine, and the dosimetry work performed at the Radiation Inter-
nal Dose Information Center at Oak Ridge Associated Universities in Oak Ridge,
TN, USA (now disbanded), and the Radiation Dose Assessment Resource (RA-
DAR) (www.doseinfo-radar.com).(4) A personal computer software code called ‘MIRDOSE’ has been developed
(Stabin, 1996) to facilitate automated and standardised internal dose calculations
for nuclear medicine applications. This code has been completely rewritten and re-
named ‘OLINDA’ (Organ Level INternal Dose Assessment) (Stabin et al., 2005).
The OLINDA/EXM code (EXM stands for EXponential Modelling) allows users
to fit data to one, two, or three exponential functions. The OLINDA/EXM code uses
the same technical basis (phantoms, organ masses, equations, relationships assumed,
and other details) as the MIRDOSE code and the RADAR system.
11
ICRP Publication 106
(5) Important basic material regarding reference biokinetic and dosimetric models
and reference data for workers and members of the public exposed to radionuclides
have been published by the Commission, giving dose coefficients for intake of radio-
nuclides by inhalation and ingestion (ICRP, 1973, 1979, 1980, 1981, 1993, 1994,
1996).(6) The Task Group has made extensive use of the information and material avail-
able from these sources.
12
2. SELECTION OF RADIOPHARMACEUTICALS
(7) Certain general principles were followed in establishing the list of radiophar-
maceuticals for inclusion in this report. A radiopharmaceutical that has been de-
scribed in the literature and proposed for use in humans has been included if thereis evidence that it has been in, or is coming into, common use, provided that accept-
able and sufficient metabolic data for making absorbed dose calculations are avail-
able. The list of radiopharmaceuticals covers not only those used in the practice of
nuclear medicine, but also some of those used in clinical research.
(8) It is important to note that the inclusion of a radiopharmaceutical in this re-
port does not imply any recommendation regarding its use. For this reason, the
amounts of administered radiopharmaceutical required for a particular investigation
are not given. The list is based on the judgement of the Task Group regarding theirpast, present, or potential future application in nuclear medicine procedures. Data
relating to these substances were obtained by an extensive search of the literature.
Some of the information had been published in scientific journals covering subjects
other than nuclear medicine.
(9) Complete radionuclide and radiochemical purity is assumed in all absorbed
dose calculations.
13


3. SELECTION OF ORGANS AND TISSUES FOR DOSE CALCULATIONS
(10) Absorbed doses are calculated for a large number of organs and tissues (called
the ‘target organs and tissues’). These absorbed doses may arise as a result of
radioactive decays occurring in other regions (called the ‘source regions’). Thus, ab-sorbed doses in a particular organ or tissue are typically the sum of contributions from
various sources, usually including the target organ or tissue itself. Two groups of tar-
get organs and tissues are included in the calculation of absorbed dose (Table 3.1):
� target organs and tissues, for which the absorbed dose is always calculated(Group 1); and
� other organs and tissues which, for some reason, receive significantly higher
absorbed doses than the average to the rest of the body, or which are of special
interest in the investigation (included as appropriate) (Group 2).
(11) The absorbed dose to organs and tissues not included in the table can usually
be approximated by using the absorbed dose quoted for ‘Other tissues’, e.g. muscle.
The absorbed doses given in Table 3.1 are the mean absorbed doses to an organ or
region. In general, these mean absorbed doses are calculated assuming uniform dis-
tribution of the radionuclide in the source regions.
Table 3.1. Organs and tissues for which absorbed
dose is calculated.
Group 1 Group 2
Adrenals Lachrymal glands
Bone surfaces Salivary glands
Breast Spinal cord
Brain
Gallbladder wall
Gastrointestinal tract
Stomach wall
Small intestine wall
Large intestine wall
Heart wall
Kidneys
Liver
Lungs
Oesophagus
Other tissues*
Ovaries
Pancreas
Red bone marrow
Skin
Spleen
Testes
Thymus
Thyroid
Urinary bladder wall
Uterus
* Mainly muscle tissues.
15

ICRP Publication 106
(12) An exception is made to this assumption in the case of the kidneys, where
non-uniform distribution of radionuclides may be taken into consideration. How-
ever, even in this case, absorbed doses to other organs and tissues are calculated un-
der the assumption that the radionuclide is distributed uniformly throughout both
kidneys; this is justified because, in practice, use of a non-uniform distribution whencalculating the absorbed doses to these other organs and tissues would only result in
very small changes (<10%) in the results obtained.
(13) Discussions were held regarding whether or not to calculate doses to regions
of the brain that will receive doses considerably higher than the average dose, such as
the putamen and nucleus caudatus from fluoropropyl-carbomethoxy-iodophenyl-
tropan (FP-CIT). As S-values for the calculation of regional doses in this case have
been published (Bouchet et al., 1999), the decision was made to include the absorbed
dose to the region of the brain that receives the highest absorbed dose as a footnoteto the dose table. However, this dose is not used in calculation of the effective dose
for these radiopharmaceuticals. It is important to stress that the doses are small, even
if the central regions of the brain receive doses 10 times the average; this is still far
from levels where known deterministic effects can be observed.
(14) The lens of the eye is considered as a tissue at risk in Publication 60 (ICRP,
1991a) because of the possibility of inducing opacities that may interfere with vision.
The radionuclides in radiopharmaceuticals currently used in nuclear medicine do not
concentrate in the tissues of the healthy human eye, with the possible exception ofiodo-amphetamine which is utilised in the synthesis of melanin (Winchell et al.,
1980). For this reason, the lens is not included in the list of target organs and tissues.
16
4. BIOKINETIC MODELS AND DATA
(15) The Task Group has encountered several problems in finding good biokinetic
information from measurements on man. In general, published data are scarce, espe-
cially with regard to quantitative measurements. The clinician is often only interestedin the initial distribution and metabolism of a test substance, whereas for dosimetry
calculations, long-term retention is of prime importance.
(16) The Task Group wishes to repeat the pleas made in Publications 17 and 53
(ICRP, 1971, 1987) for securing the maximum information possible from any inves-
tigation. The particular information needed for dose calculations includes fractional
long-term retention of radionuclides and labelled compounds, turnover of the radio-
pharmaceutical and its metabolites, fractional gastrointestinal absorption values for
orally administered compounds, distribution of radionuclides within different or-gans, and their excretion pathways. Collection of such data should be encouraged
by professional and scientific societies and by regulatory authorities, and the data
should be made available by publication and by storage in accessible databases.
The editors and referees of scientific journals are encouraged to request such infor-
mation in papers on new radiopharmaceuticals.
(17) For each compound, the Task Group has agreed upon a biokinetic model giv-
ing quantitative estimates for the distribution and metabolism of the radiopharma-
ceutical in the body. The literature on which this model is based is referenced. Inappropriate cases, the range of pathological variation expected in the metabolic data
is also indicated.
(18) Some models have been developed within a generic framework for application
to a class of radiopharmaceutical, e.g. monoclonal antibodies and brain receptor
substances. Each of the generic model frameworks is a compromise between biolog-
ical realism and practical considerations regarding the amount and quality of infor-
mation available to determine parameter values for specific compounds.
(19) Worst-case models have been developed for substances labelled with very-short-lived radionuclides, often used for positron emission tomography
investigations.
(20) For absorbed dose calculations, knowledge of the time–activity curve in dif-
ferent organs and tissues of the body after administration of a radiopharmaceutical
is needed. The best way to get this information is by pharmacokinetic analysis, which
includes the use of knowledge about mechanisms affecting radionuclide localisation
by listing the physiological assumptions regarding its behaviour in body tissues. On
the basis of this knowledge, a model is defined, delineating the detailed distributionand flow, or transfer, of the radionuclide.
(21) This model, in turn, allows the derivation of a mathematical model, consisting
of differential and/or integral equations for the variation with time of the amounts of
radionuclide in different parts of the body. The model may be either compartmental
or non-compartmental. Knowledge of the values for compartment sizes, flow rates,
and other physiological parameters allows numerical solution of the equations,
giving activity–time relationships for all parts of the system which are then integrated
to obtain the cumulated activities needed for calculations of absorbed dose.
17
ICRP Publication 106
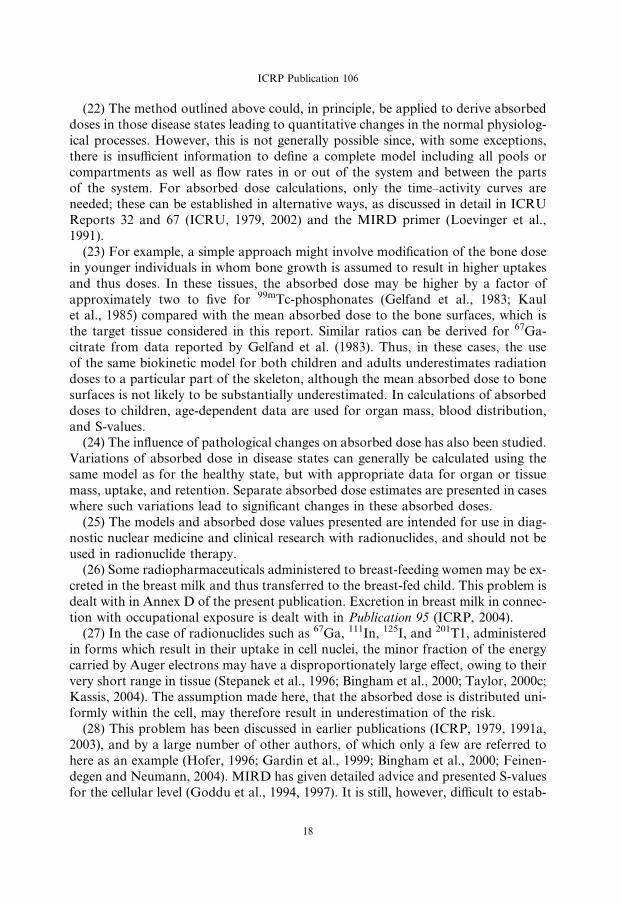
(22) The method outlined above could, in principle, be applied to derive absorbed
doses in those disease states leading to quantitative changes in the normal physiolog-
ical processes. However, this is not generally possible since, with some exceptions,
there is insufficient information to define a complete model including all pools or
compartments as well as flow rates in or out of the system and between the partsof the system. For absorbed dose calculations, only the time–activity curves are
needed; these can be established in alternative ways, as discussed in detail in ICRU
Reports 32 and 67 (ICRU, 1979, 2002) and the MIRD primer (Loevinger et al.,
1991).
(23) For example, a simple approach might involve modification of the bone dose
in younger individuals in whom bone growth is assumed to result in higher uptakes
and thus doses. In these tissues, the absorbed dose may be higher by a factor of
approximately two to five for 99mTc-phosphonates (Gelfand et al., 1983; Kaulet al., 1985) compared with the mean absorbed dose to the bone surfaces, which is
the target tissue considered in this report. Similar ratios can be derived for 67Ga-
citrate from data reported by Gelfand et al. (1983). Thus, in these cases, the use
of the same biokinetic model for both children and adults underestimates radiation
doses to a particular part of the skeleton, although the mean absorbed dose to bone
surfaces is not likely to be substantially underestimated. In calculations of absorbed
doses to children, age-dependent data are used for organ mass, blood distribution,
and S-values.(24) The influence of pathological changes on absorbed dose has also been studied.
Variations of absorbed dose in disease states can generally be calculated using the
same model as for the healthy state, but with appropriate data for organ or tissue
mass, uptake, and retention. Separate absorbed dose estimates are presented in cases
where such variations lead to significant changes in these absorbed doses.
(25) The models and absorbed dose values presented are intended for use in diag-
nostic nuclear medicine and clinical research with radionuclides, and should not be
used in radionuclide therapy.(26) Some radiopharmaceuticals administered to breast-feeding women may be ex-
creted in the breast milk and thus transferred to the breast-fed child. This problem is
dealt with in Annex D of the present publication. Excretion in breast milk in connec-
tion with occupational exposure is dealt with in Publication 95 (ICRP, 2004).
(27) In the case of radionuclides such as 67Ga, 111In, 125I, and 201T1, administered
in forms which result in their uptake in cell nuclei, the minor fraction of the energy
carried by Auger electrons may have a disproportionately large effect, owing to their
very short range in tissue (Stepanek et al., 1996; Bingham et al., 2000; Taylor, 2000c;Kassis, 2004). The assumption made here, that the absorbed dose is distributed uni-
formly within the cell, may therefore result in underestimation of the risk.
(28) This problem has been discussed in earlier publications (ICRP, 1979, 1991a,
2003), and by a large number of other authors, of which only a few are referred to
here as an example (Hofer, 1996; Gardin et al., 1999; Bingham et al., 2000; Feinen-
degen and Neumann, 2004). MIRD has given detailed advice and presented S-values
for the cellular level (Goddu et al., 1994, 1997). It is still, however, difficult to estab-
18

ICRP Publication 106
lish the intracellular distribution of the radionuclides of interest so that such detailed
S-values can be used effectively.
(29) It is usually assumed that daughter radionuclides produced within the body
stay with, and behave metabolically like, their parent nuclide. This may be an over-
simplification in some cases, and if specific information to the contrary is available,the dose estimates presented here should be modified appropriately.
(30) For some substances, such as iodine-labelled compounds, pertechnetate, and
some radiopharmaceuticals used for renal studies, blocking agents may be adminis-
tered in advance or simultaneously (e.g. to induce competitive inhibition of uptake in
specific organs). In such circumstances, including blocking of the thyroid, total inhi-
bition of radionuclide uptake has been assumed, although this may be difficult to
achieve in practice.
(31) It is often possible to reduce the absorbed dose to a patient by increasing therate of elimination of the radionuclide from the body, for example by more frequent
emptying of the urinary bladder (with hydration, diuretics, and catheterisation), the
bowel (with laxatives and enema), and the gallbladder (with a meal of high fat con-
tent and cholecystokinin).
19

5. METHODS FOR CALCULATING ABSORBED DOSE
5.1. Calculation of absorbed dose
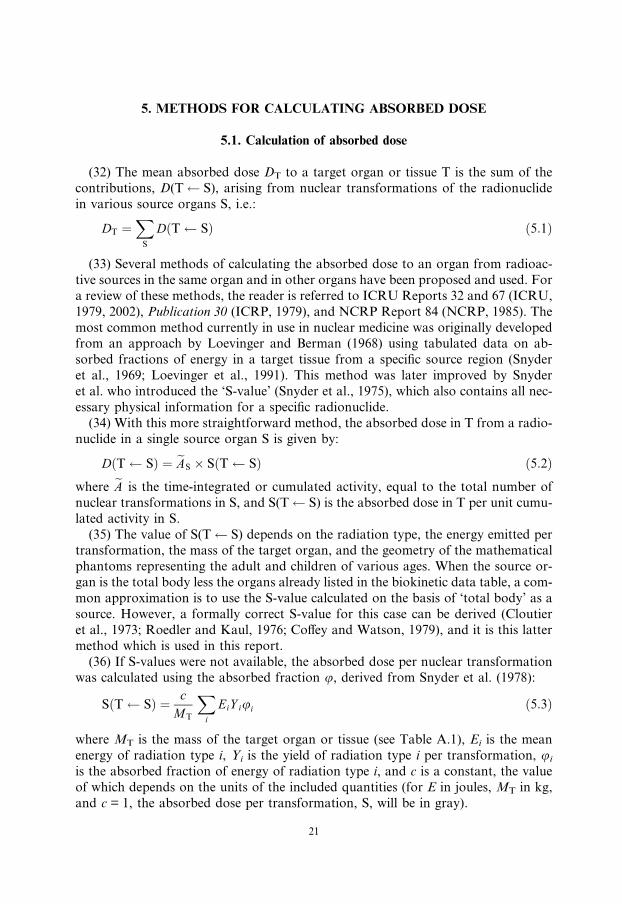
(32) The mean absorbed dose DT to a target organ or tissue T is the sum of thecontributions, D(T S), arising from nuclear transformations of the radionuclide
in various source organs S, i.e.:
DT ¼X
S
DðT SÞ ð5:1Þ
(33) Several methods of calculating the absorbed dose to an organ from radioac-
tive sources in the same organ and in other organs have been proposed and used. For
a review of these methods, the reader is referred to ICRU Reports 32 and 67 (ICRU,
1979, 2002), Publication 30 (ICRP, 1979), and NCRP Report 84 (NCRP, 1985). The
most common method currently in use in nuclear medicine was originally developedfrom an approach by Loevinger and Berman (1968) using tabulated data on ab-
sorbed fractions of energy in a target tissue from a specific source region (Snyder
et al., 1969; Loevinger et al., 1991). This method was later improved by Snyder
et al. who introduced the ‘S-value’ (Snyder et al., 1975), which also contains all nec-
essary physical information for a specific radionuclide.
(34) With this more straightforward method, the absorbed dose in T from a radio-
nuclide in a single source organ S is given by:
DðT SÞ ¼ eAS � SðT SÞ ð5:2Þwhere eA is the time-integrated or cumulated activity, equal to the total number of
nuclear transformations in S, and S(T S) is the absorbed dose in T per unit cumu-
lated activity in S.
(35) The value of S(T S) depends on the radiation type, the energy emitted pertransformation, the mass of the target organ, and the geometry of the mathematical
phantoms representing the adult and children of various ages. When the source or-
gan is the total body less the organs already listed in the biokinetic data table, a com-
mon approximation is to use the S-value calculated on the basis of ‘total body’ as a
source. However, a formally correct S-value for this case can be derived (Cloutier
et al., 1973; Roedler and Kaul, 1976; Coffey and Watson, 1979), and it is this latter
method which is used in this report.
(36) If S-values were not available, the absorbed dose per nuclear transformationwas calculated using the absorbed fraction u, derived from Snyder et al. (1978):
SðT SÞ ¼ cMT
Xi
EiY iui ð5:3Þ
where MT is the mass of the target organ or tissue (see Table A.1), Ei is the mean
energy of radiation type i, Yi is the yield of radiation type i per transformation, ui
is the absorbed fraction of energy of radiation type i, and c is a constant, the value
of which depends on the units of the included quantities (for E in joules, MT in kg,
and c = 1, the absorbed dose per transformation, S, will be in gray).
21

ICRP Publication 106
5.2. Calculation of cumulated activity
(37) For a more detailed description of the mathematical analysis of biokinetic
models, reference should be made to MIRD Pamphlet No. 12 (Berman, 1977) and
ICRU Report 32 (ICRU, 1979). The following text only serves as a short accountof the calculation of cumulated activity in selected cases.
(38) The cumulated activity eAS in a source organ or tissue S depends on the admin-
istered activity, A0, the physical half-life, T, and the biokinetics of the radiopharma-
ceutical. eAS which represents the number of disintegrations occurring in source
region S is obtained by integrating the time-dependent activity:
eASðtÞ ¼Z t
0
ASðuÞdu ð5:4Þ
where AS(u) is the activity at time u in the source organ or tissue considered. Due tothe relatively short physical half-life of radionuclides used in nuclear medicine, the
upper integration limit, t, can be taken as infinity.
(39) Although the mechanisms by which radionuclides are distributed within, or
excreted from, the body are not necessarily well represented by first-order kinetic
models, such models are generally adequate for representing overall uptake and
retention of radionuclides in individual organs and tissues. Since this is all that is re-
quired for dosimetric calculations, these models are used extensively in this report.
(40) A general first-order kinetic model can be represented as a system of n com-partments, interlinked with constant rate coefficients. In such a system, the rate of
change of the amount of material (qi) in compartment i is given by:
dqi
dt¼ �kiiqiðtÞ � kpqiðtÞ þ
Xn
j¼1j–i
kijqjðtÞ ð5:5Þ
where kii is the fraction of the amount of material in compartment i leaving per unit
time, kij is the fraction of the amount of material in compartment j flowing to com-
partment i per unit time, and kp is the radioactive decay constant, as appropriate.
(41) A direct correspondence between compartments and anatomical regions of
the body does not usually exist. However, for absorbed dose calculations, it is nec-
essary to know the amount of substance in different regions of the body. Therefore,for practical reasons, specific organs and tissues are considered instead of compart-
ments. The activity in an organ or tissue can usually be described sufficiently accu-
rately by a sum of exponentials:
ASðtÞ ¼Xn
i¼1
kie�ðkiþkpÞt ð5:6Þ
where ki is a constant, and ki is the biological elimination constant of the exponential
component i.(42) The constants in this equation are often derived directly from measurements.
Expressed in terms of fractional distributions to the organ or tissue, fractions of
22
ICRP Publication 106
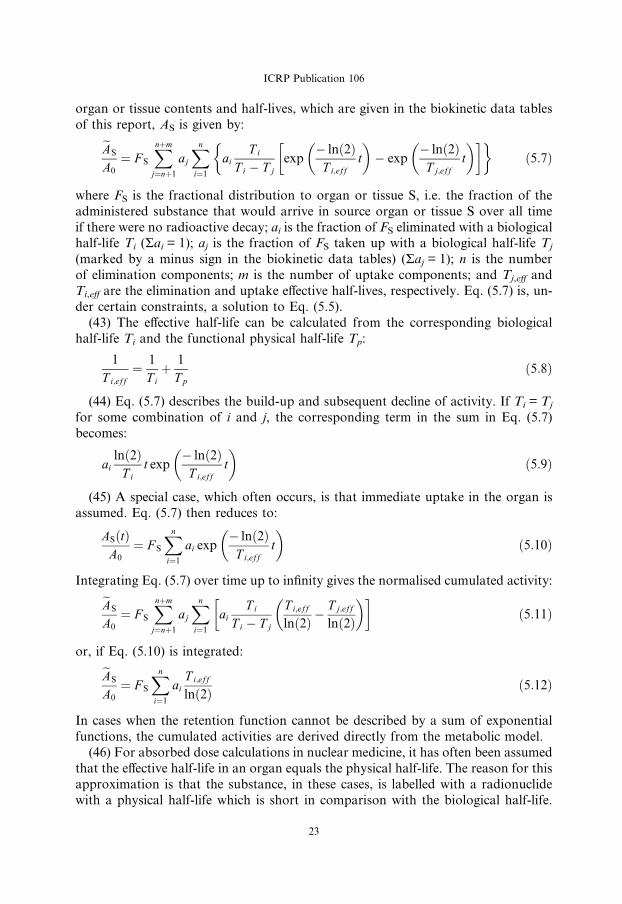
organ or tissue contents and half-lives, which are given in the biokinetic data tables
of this report, AS is given by:
eAS
A0
¼ F S
Xnþm
j¼nþ1
aj
Xn
i¼1
aiT i
T i � T jexp
� lnð2ÞT i;eff
t� �
� exp� lnð2ÞT j;eff
t� �� �� �
ð5:7Þ
where FS is the fractional distribution to organ or tissue S, i.e. the fraction of the
administered substance that would arrive in source organ or tissue S over all time
if there were no radioactive decay; ai is the fraction of FS eliminated with a biologicalhalf-life Ti (Rai = 1); aj is the fraction of FS taken up with a biological half-life Tj
(marked by a minus sign in the biokinetic data tables) (Raj = 1); n is the number
of elimination components; m is the number of uptake components; and Tj,eff and
Ti,eff are the elimination and uptake effective half-lives, respectively. Eq. (5.7) is, un-
der certain constraints, a solution to Eq. (5.5).
(43) The effective half-life can be calculated from the corresponding biological
half-life Ti and the functional physical half-life Tp:
1
T i;eff¼ 1
T iþ 1
T pð5:8Þ
(44) Eq. (5.7) describes the build-up and subsequent decline of activity. If Ti = Tj
for some combination of i and j, the corresponding term in the sum in Eq. (5.7)
becomes:
ailnð2Þ
T it exp
� lnð2ÞT i;eff
t� �
ð5:9Þ
(45) A special case, which often occurs, is that immediate uptake in the organ is
assumed. Eq. (5.7) then reduces to:
ASðtÞA0
¼ F S
Xn
i¼1
ai exp� lnð2Þ
T i;efft
� �ð5:10Þ
Integrating Eq. (5.7) over time up to infinity gives the normalised cumulated activity:
eAS
A0
¼ F S
Xnþm
j¼nþ1
aj
Xn
i¼1
aiT i
T i � T j
T i;eff
lnð2Þ �T j;eff
lnð2Þ
� �� �ð5:11Þ
or, if Eq. (5.10) is integrated:
eAS
A0
¼ F S
Xn
i¼1
aiT i;eff
lnð2Þ ð5:12Þ
In cases when the retention function cannot be described by a sum of exponential
functions, the cumulated activities are derived directly from the metabolic model.
(46) For absorbed dose calculations in nuclear medicine, it has often been assumed
that the effective half-life in an organ equals the physical half-life. The reason for this
approximation is that the substance, in these cases, is labelled with a radionuclide
with a physical half-life which is short in comparison with the biological half-life.
23
ICRP Publication 106
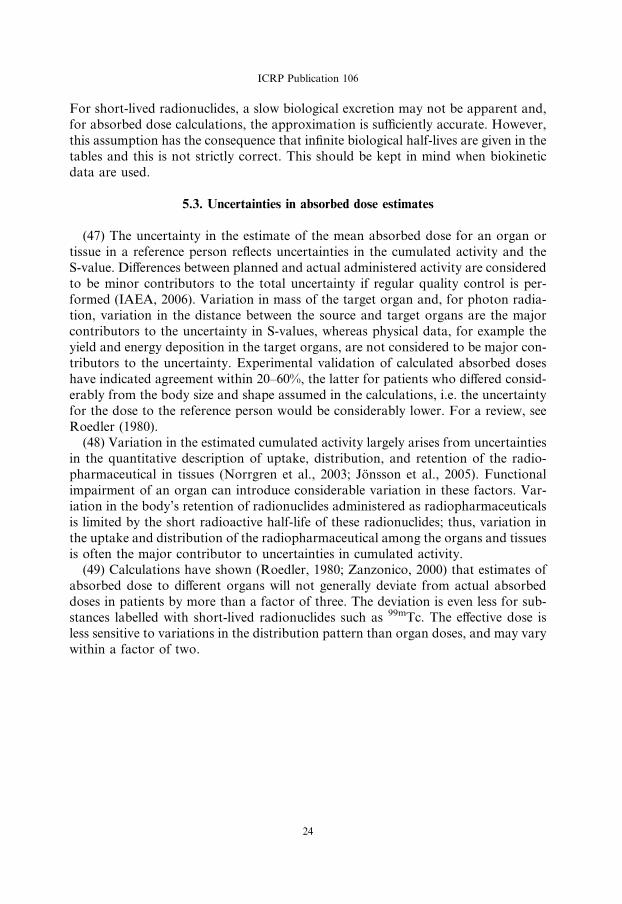
For short-lived radionuclides, a slow biological excretion may not be apparent and,
for absorbed dose calculations, the approximation is sufficiently accurate. However,
this assumption has the consequence that infinite biological half-lives are given in the
tables and this is not strictly correct. This should be kept in mind when biokinetic
data are used.
5.3. Uncertainties in absorbed dose estimates
(47) The uncertainty in the estimate of the mean absorbed dose for an organ or
tissue in a reference person reflects uncertainties in the cumulated activity and the
S-value. Differences between planned and actual administered activity are considered
to be minor contributors to the total uncertainty if regular quality control is per-
formed (IAEA, 2006). Variation in mass of the target organ and, for photon radia-tion, variation in the distance between the source and target organs are the major
contributors to the uncertainty in S-values, whereas physical data, for example the
yield and energy deposition in the target organs, are not considered to be major con-
tributors to the uncertainty. Experimental validation of calculated absorbed doses
have indicated agreement within 20–60%, the latter for patients who differed consid-
erably from the body size and shape assumed in the calculations, i.e. the uncertainty
for the dose to the reference person would be considerably lower. For a review, see
Roedler (1980).(48) Variation in the estimated cumulated activity largely arises from uncertainties
in the quantitative description of uptake, distribution, and retention of the radio-
pharmaceutical in tissues (Norrgren et al., 2003; Jonsson et al., 2005). Functional
impairment of an organ can introduce considerable variation in these factors. Var-
iation in the body’s retention of radionuclides administered as radiopharmaceuticals
is limited by the short radioactive half-life of these radionuclides; thus, variation in
the uptake and distribution of the radiopharmaceutical among the organs and tissues
is often the major contributor to uncertainties in cumulated activity.(49) Calculations have shown (Roedler, 1980; Zanzonico, 2000) that estimates of
absorbed dose to different organs will not generally deviate from actual absorbed
doses in patients by more than a factor of three. The deviation is even less for sub-
stances labelled with short-lived radionuclides such as 99mTc. The effective dose is
less sensitive to variations in the distribution pattern than organ doses, and may vary
within a factor of two.
24
6. EFFECTIVE DOSE
6.1. Use of effective dose in nuclear medicine
(50) Radiation exposure of the different organs and tissues in the body results indifferent probabilities of harm and different severities. The Commission calls the
combination of probability and severity of harm ’detriment’, meaning health
detriment.
(51) The detriment depends on the type of radiation or, more specifically, the ion-
isation density. This is accounted for by introducing the concept of equivalent dose.
The mean equivalent dose HT in a target organ or tissue T is given by (ICRP 1991a):
H T ¼X
R
wRDT;R ð6:1Þ
where DT,R is the mean absorbed dose from radiation R in tissue or organ T, and wR
is the radiation weighting factor. For all types of radiation used in diagnostic nuclear
medicine, wR equals 1.0 (even if this value may not be appropriate for Auger
emitters).
(52) To reflect the combined detriment from stochastic effects due to the equivalent
doses in all the organs and tissues of the body, the equivalent dose in each organ andtissue is multiplied by a tissue weighting factor, and the results are summed over the
whole body to give the effective dose. The special unit for effective dose is the sievert
(Sv).
(53) The effective dose was developed primarily for radiation protection of occu-
pationally exposed persons (ICRP, 1977, 1991a). It attributes weighting factors wT to
organs or tissues, representing the fraction of the total stochastic risk (i.e. fatal can-
cer and serious inherited disorders) resulting from the irradiation of that organ or
tissue T when the whole body is irradiated uniformly. The effective dose is calculatedby adding the weighted organ or tissue mean dose equivalents, HT, i.e.:
E ¼X
T
wTHT ð6:2Þ
where E is the effective dose, wT is the relative radiation sensitivity of organ or tissue
T (see Table 6.1.), and HT is the mean equivalent dose in target organ or tissue T.
For the radionuclides used in diagnostic nuclear medicine, it is numerically equal
to that of the mean absorbed dose, since the radiation weighting factor wR is takenas unity for these radionuclides.
(54) If the body is irradiated uniformly, all the HTs are the same and the equivalent
dose at any point in the body is equal to the effective dose E.
(55) The weighting factors used in computing this quantity are appropriate to a
population of workers and also valid for the general population.
(56) Many readers will be aware that the Commission recently issued its 2007 Rec-
ommendations (ICRP, 2007), superseding the 1990 Recommendations, and that
these include updated and amended tissue weighting factors (and radiation weightingfactors). Currently, work is in progress within ICRP to generate correspondingly
25
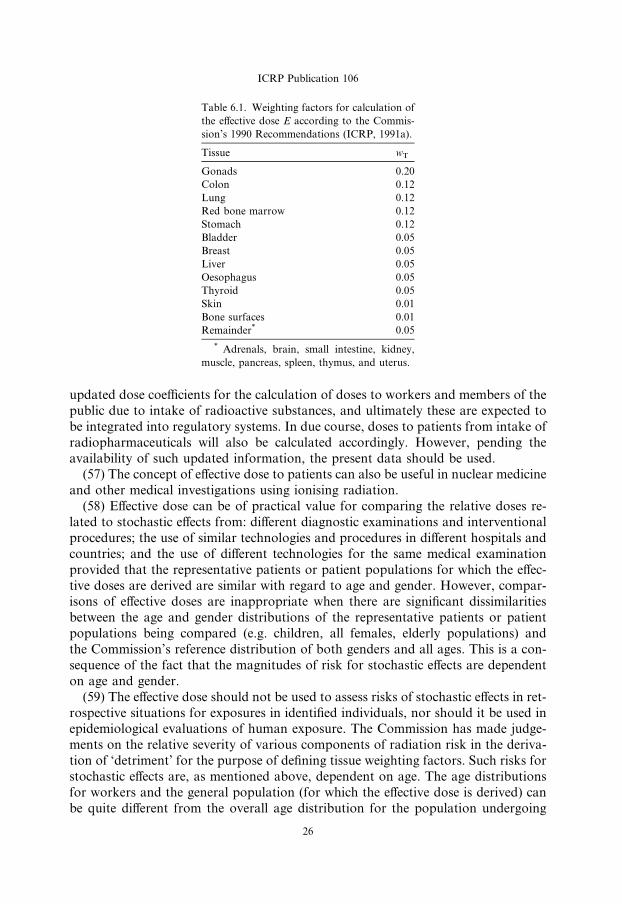
Table 6.1. Weighting factors for calculation of
the effective dose E according to the Commis-
sion’s 1990 Recommendations (ICRP, 1991a).
Tissue wT
Gonads 0.20
Colon 0.12
Lung 0.12
Red bone marrow 0.12
Stomach 0.12
Bladder 0.05
Breast 0.05
Liver 0.05
Oesophagus 0.05
Thyroid 0.05
Skin 0.01
Bone surfaces 0.01
Remainder* 0.05
* Adrenals, brain, small intestine, kidney,
muscle, pancreas, spleen, thymus, and uterus.
ICRP Publication 106
updated dose coefficients for the calculation of doses to workers and members of the
public due to intake of radioactive substances, and ultimately these are expected to
be integrated into regulatory systems. In due course, doses to patients from intake of
radiopharmaceuticals will also be calculated accordingly. However, pending the
availability of such updated information, the present data should be used.(57) The concept of effective dose to patients can also be useful in nuclear medicine
and other medical investigations using ionising radiation.
(58) Effective dose can be of practical value for comparing the relative doses re-
lated to stochastic effects from: different diagnostic examinations and interventional
procedures; the use of similar technologies and procedures in different hospitals and
countries; and the use of different technologies for the same medical examination
provided that the representative patients or patient populations for which the effec-
tive doses are derived are similar with regard to age and gender. However, compar-isons of effective doses are inappropriate when there are significant dissimilarities
between the age and gender distributions of the representative patients or patient
populations being compared (e.g. children, all females, elderly populations) and
the Commission’s reference distribution of both genders and all ages. This is a con-
sequence of the fact that the magnitudes of risk for stochastic effects are dependent
on age and gender.
(59) The effective dose should not be used to assess risks of stochastic effects in ret-
rospective situations for exposures in identified individuals, nor should it be used inepidemiological evaluations of human exposure. The Commission has made judge-
ments on the relative severity of various components of radiation risk in the deriva-
tion of ‘detriment’ for the purpose of defining tissue weighting factors. Such risks for
stochastic effects are, as mentioned above, dependent on age. The age distributions
for workers and the general population (for which the effective dose is derived) can
be quite different from the overall age distribution for the population undergoing
26

ICRP Publication 106
medical procedures using ionising radiation, and will also differ from one type of
medical procedure to another, depending on the prevalence of the ages and genders
of individuals for the medical condition being evaluated.
(60) For these reasons, risk assessment for medical uses of ionising radiation is
best evaluated using appropriate risk values for the individual tissues at risk, andfor the age and gender distribution of the population groups undergoing the medical
procedures.
(61) For the exposure of young children, the risk would be higher, perhaps by a
factor of two or three (ICRP, 1991a, Annex C). For many common types of diagnos-
tic examination, the higher risk will be offset by the reduction in administered activ-
ity relative to that to an adult. For an age at exposure of approximately 60 years, the
risk would be lower, perhaps by a factor of three. At higher ages at exposure, the
risks are even less (ICRP, 1991a, Annex C). The specific demographics of the med-ically exposed population present obstacles to applying the concept of effective dose
as a tool for comparing doses from medical irradiation with other sources of expo-
sure to humans.
6.2. Calculation of effective dose
(62) The organs and tissues considered for calculation of the effective dose equiv-
alent are listed in Table 6.1. Those with specific weighting factors are always includedin the calculation. For the gonads, the arithmetic mean of the absorbed doses to ova-
ries and testes is used in conjunction with the weighting factor of 0.20. Absorbed
doses to blood and blood vessels are not included in the calculation.
(63) The definition of ‘colon’ or ‘large intestine’ follows that given in Publication
67 (ICRP, 1993, Para. 14). The weighting factor is applied to the mass average of the
equivalent dose in the walls of the upper and lower large intestine of the gastrointes-
tinal tract. Since the ratio between the masses of the walls of the upper large intestine
(ULI) and lower large intestine (LLI) is independent of age, the equivalent dose tothe colon Hcolon is given as:
H colon ¼ 0:57HULI þ 0:43H LLI ð6:3Þwhere HULI and HLLI are the equivalent doses in the walls of the ULI and LLI,
respectively.
(64) The biokinetic model presented here contains no information on uptake and
retention of radionuclides in the oesophagus. Since the transit time of materialsthrough the oesophagus is normally quite rapid in comparison with the physical
half-life, only the absorbed dose from penetrating radiation emitted from other
source regions is considered. In the absence of absorbed fraction values for the
oesophagus, the dose to the thymus has been used previously as a surrogate (ICRP,
1991b) and this method is utilised in the present report.
(65) The weighting factor for the remainder, 0.05, is applied on the mass-weighted
average dose of those organs listed in the footnote of Table 6.1. In those cases in
which a single remainder tissue or organ receives an equivalent dose which exceedsthe dose to any other organ, a weighting factor of 0.025 should be applied to that
27
ICRP Publication 106
organ, and 0.025 to the average dose in the rest of the remainder tissues or organs as
defined above. This ‘rule’ may also apply for any other organ that is recognised as
radiation sensitive.
(66) As many radiopharmaceuticals are excreted rapidly in urine, the absorbed
dose to the wall of the urinary bladder is often large compared with the absorbeddose to other organs and tissues in the same study, and may contribute considerably
to the effective dose. In cases where the contribution is more than 50%, a note at the
foot of the dosimetry table states the actual contribution.
(67) The presence of chemical forms of the radionuclide other than that intended
may change the distribution and kinetics of the radionuclide. This may lead to a dif-
ferent distribution of the absorbed dose to some organs and tissues.
(68) In this report, complete radiochemical purity has been assumed, unless other-
wise stated.
28
7. DOSE TO EMBRYO AND FETUS
(69) The absorbed dose to the uterus, which is included in the dose tabulations,
may be used as a substitute for the absorbed dose to the embryo if the subject is
in the first 2–3 months of pregnancy. Similarly, the absorbed dose to the fetus fromradioactive substances without placental transfer is expected to be in the same range
as the dose to the uterus. For radioactive substances with placental transfer, the ab-
sorbed dose to organs and tissues of the mother may, as a first approximation, be
taken as representative of the absorbed dose to the corresponding organs and tissues
of the fetus.
(70) More detailed radiation dose estimates for the fetus from administration of a
number of radiopharmaceuticals to women at various stages of pregnancy are given
by Russell et al. (1997). Their data illustrate that the majority of studies will proba-bly involve fetal doses <10 mGy. Only studies using 131I-iodide, 201Tl-chloride, and67Ga-citrate appear to result in fetal doses >10 mGy, according to present knowl-
edge. Therapeutic administrations are routinely contraindicated in the case of preg-
nancy or breast feeding as they may result in very high fetal doses. In addition,
beyond 10–13 weeks of gestation, the fetal thyroid may receive extremely high doses
in cases of therapy using 131I-iodide (Watson et al., 1989; Berg et al., 1998). For sub-
stances in their ionic form, a comprehensive compilation of doses to the embryo and
fetus is found in Publication 88 (ICRP, 2001a).
29

8. REFERENCES FOR THE MAIN TEXT
ARSAC, 2006. Notes for Guidance on the Clinical Administration of Radiopharmaceuticals and Use of
Sealed Radioactive Sources. Administration of Radioactive Substances Advisory Committee, Health
Protection Agency, UK.
Berg, G., Nystrom, E., Jacobsson, L., et al., 1998. Radioiodine treatment of hyperthyroidism in a
pregnant woman. J. Nucl. Med. 39, 357–361.
Berman, M., 1977. Kinetic Models for Absorbed Dose Calculation. Medical Internal Radiation
Committee (MIRD) Pamphlet No. 12. Society of Nuclear Medicine, New York, NY.
Bingham, D., Gardin, I., Hoyes, K.P., 2000. The problem of Auger emitters for radiological protection.
Radiat. Prot. Dosim. 92, 219–228.
Bouchet, L.G., Bolch, W.E., Weber, D.A., Atkins, H.L., Poston Sr., J.W., 1999. Radionuclide S-values in
a revised dosimetric model of the adult head and brain. MIRD Pamphlet No. 15. J. Nucl. Med. 40,
62S–101S.
Cloutier, R.J., Watson, E.E., Rohrer, R.H., Smith, E.M., 1973. Calculating the radiation dose to an organ.
J. Nucl. Med. 14, 53–55.
Coffey, J.L., Watson, E.E., 1979. Calculating doses from remaining body activity. A comparison of two
methods. Med. Phys. 6, 307–308.
Feinendegen, L.E., Neumann, R.D., 2004. Dosimetry and risk from low- versus high-LET radiation of
Auger events and the role of nuclide carriers. Int. J. Radiat. Biol. 80, 813–822.
Gardin, I., Faraggi, M., Le Guludec, D., Bok, B., 1999. Cell irradiation caused by diagnostic nuclear
medicine procedures: dose heterogeneity and biological consequences. Eur. J. Nucl. Med. 26, 1617–
1626.
Gelfand, M.J., Thomas, S.R., Kereiakes, J.G., 1983. Absorbed radiation dose from routine imaging of the
skeleton in children. Ann. Radiol. 26, 421–423.
Goddu, S.M., Howell, R.W., Rao, D.V., 1994. Cellular dosimetry: absorbed fractions for monoenergetic
electron and alpha particle sources and S-values for radionuclides uniformly distributed in different cell
compartments. J. Nucl. Med. 35, 303–316.
Goddu, S.M., Howell, R.W., Bouchet, L.G., Bolch, W.E., Rao, D., 1997. MIRD Cellular S Values.
Society of Nuclear Medicine, Inc, Reston, VA.
Hofer, K.G., 1996. Biophysical aspects of Auger processes. A review. Acta Oncol. 35, 789–796.
IAEA, 2006. Quality Assurance for Radioactivity Measurement in Nuclear Medicine. Technical Report
Series No. 454. International Atomic Energy Agency, Vienna.
ICRP, 1971. Protection of the Patient in Radionuclide Investigations. ICRP Publication 17. Pergamon
Press, Oxford.
ICRP, 1973. Alkaline Earth Metabolism in Adult Man. ICRP Publication 20. Pergamon Press, Oxford.
ICRP, 1977. Recommendations of the International Commission on Radiological Protection. ICRP
Publication 26. Pergamon Press, Oxford.
ICRP, 1979. Limits for intakes of radionuclides by workers. ICRP Publication 30, Part 1. Ann. ICRP
2(3/4).
ICRP, 1980. Limits for intakes of radionuclides by workers. ICRP Publication 30, Part 2. Ann. ICRP
4(3/4).
ICRP, 1981. Limits for intakes of radionuclides by workers. ICRP Publication 30, Part 3. Ann. ICRP
6(2/3).
ICRP, 1987. Radiation dose to patients from radiopharmaceuticals. ICRP Publication 53. Ann. ICRP
18(1–4).
ICRP, 1991a. 1990 Recommendations of the International Commission on Radiological Protection. ICRP
Publication 60. Ann. ICRP 21(1–3).
ICRP, 1991b. Radiation dose to patients from radiopharmaceuticals. Addendum 1 to ICRP Publication
53. ICRP Publication 62. Ann. ICRP 22(3).
ICRP, 1993. Age-dependent doses to members of the public from intake of radionuclides. Part 2: ingestion
dose coefficients. ICRP Publication 67. Ann. ICRP 23(3/4).
31

ICRP Publication 106
ICRP, 1994. Dose coefficients for intake of radionuclides by workers. ICRP Publication 68. Ann. ICRP
24(4).
ICRP, 1996. Age-dependent doses to members of the public from intake of radionuclides. Part 5. ICRP
Publication 72. Ann. ICRP 26(1).
ICRP, 1998. Radiation dose to patients from radiopharmaceuticals. Addendum 2 to ICRP Publication 53.
ICRP Publication 80. Ann. ICRP 28(3).
ICRP, 2001a. Doses to the embryo and fetus from intake of radionuclides by the mother. ICRP
Publication 88. Ann. ICRP 31(1–3).
ICRP, 2003. Relative biological effectiveness (RBE), quality factor (Q) and radiation weighting factor
(wR). ICRP Publication 92. Ann. ICRP 33(4).
ICRP, 2004. Doses to infants from ingestion of radionuclides in mothers’ milk. ICRP Publication 95. Ann.
ICRP 34(3/4).
ICRP, 2007. The 2007 Recommendations of the International Commission on Radiological Protection.
ICRP Publication 103. Ann. ICRP 37(1–3).
ICRU, 1979. Methods of Assessment of Absorbed Dose in Clinical Use of Radionuclides. ICRU Report
32. International Commission on Radiation Units and Measurements, Bethesda, MD.
ICRU, 2002. Absorbed-dose specification in nuclear medicine. ICRU Report 67. J. ICRU 2, 1–110.
Johansson, L., Mattsson, S., Nosslin, B., Leide-Svegborn, S., 1992. Effective dose from radiopharma-
ceuticals. Eur. J. Nucl. Med. 19, 933–938.
Jonsson, L., Ljungberg, M., Strand, S.E., 2005. Evaluation of accuracy in activity calculations for the
conjugate view method from Monte Carlo simulated scintillation camera images using experimental
data in an anthropomorphic phantom. J. Nucl. Med. 46, 1679–1686.
Kassis, A.M., 2004. The amazing world of Auger electrons. Int. J. Radiat. Biol. 80, 789–903.
Kaul, A., Krauss, O., Petrausch, G., 1985. Strahlenexposition durch Tc-99m-Methylendiphosphonat —
lokale Dosisverteilung in Wachstum zonen des kindlichen Skelett und Organdosen. In: Poretti, G.
(Ed.), Medizinische Physik. Deutsche Gesellschaft fur medizinische Physik, Bern.
Loevinger, R., Berman, M., 1968. A schema for absorbed-dose calculations for biologically distributed
radionuclides. MIRD Pamphlet No. 1. J. Nucl. Med. 9 (Suppl. 1), 7–14.
Loevinger, R., Budinger, T.F., Watson, E.E., 1991. MIRD Primer for Absorbed Dose Calculations.
Revised edition. Society of Nuclear Medicine, New York, NY.
NCRP, 1982. Nuclear Medicine – Factors Influencing the Choice and Use of Radionuclides in Diagnosis
and Therapy. NCRP Report No. 70. National Council on Radiation Protection and Measurements,
Bethesda, MD.
NCRP, 1985. General Concepts for the Dosimetry of Internally Deposited Radionuclides. NCRP Report
No. 84. National Council on Radiation Protection and Measurements, Bethesda, MD.
Norrgren, K., Svegborn, S.L., Areberg, J., Mattsson, S., 2003. Accuracy of the quantification of organ
acticity from planar gamma camera images. Cancer Biother. Radiopharm., 18.
Roedler, H.D., 1980. Accuracy of Internal Dose Calculations with Special Consideration of Radiophar-
maceutical Biokinetics. Third International Radiopharmaceutical Dosimetry Symposium, Oak Ridge,
TN. HHS Publication (FDA 81-8166). Department of Health and Human Welfare, Bureau of
Radiological Health, Rockville, MD.
Roedler, H.D., Kaul, A., 1976. Dose to Target Organs from Remaining Body Activity: Results of the
Formally Exact and Approximate Solution. Radiopharmaceutical Dosimetry Symposium, Oak Ridge,
TN. HEW Publication (FDA 76-8044). pp. 155–163.
Roedler, H.D., Kaul, A., Hine, G.J., 1978. Internal Radiation Dose in Diagnostic Nuclear Medicine.
Hoffman, Berlin.
Russell, J.R., Stabin, M.G., Sparks, R.B., Watson, E.E., 1997. Radiation absorbed dose to the embryo/
fetus from radiopharmaceuticals. J. Nucl. Med. 73, 756–769.
Snyder, W.S., Ford, M.R., Warner, G.G., 1978. Estimates of Specific Absorbed Fractions for Photon
Sources Uniformly Distributed in Various Organs of a Heterogeneous Phantom. Medical Internal
Radiation Dose Committee (NM/MIRD) Pamphlet No. 5, revised. Society of Nuclear Medicine, New
York, NY.
32
ICRP Publication 106
Snyder, W.S., Ford, M.R., Warner, G.G., Fisher Jr, H.R., 1969. Estimates of absorbed fractions for
monoenergetic photon sources uniformly distributed in various organs of a heterogeneous phantom.
MIRD Pamphlet No. 5. J. Nucl. Med. 10 (Suppl. 3).
Snyder, W.S., Ford, M.R., Warner, G.G., Watson, S.B., 1975. ‘‘S’’ Absorbed Dose per Unit Cumulated
Activity for Selected Radionuclides and Organs. MIRD Pamphlet No. 11. Society of Nuclear
Medicine, New York, NY.
Stabin, M.G., 1996. MIRDOSE: Personal computer software for internal dose assessment in nuclear
medicine. J. Nucl. Med. 37, 538–546.
Stabin, M.G., Sparks, R.B., Crowe, E., 2005. OLINDA/EXM: the second-generation personal computer
software for internal dose assessment in nuclear medicine. J. Nucl. Med. 46, 1023–1027.
Stepanek, J., Larsson, B., Weinreich, R., 1996. Auger-electron spectra of radionuclides for therapy and
diagnostics. Acta Oncol. 35, 863–868.
Taylor, D.M., 2000c. Subcellular distribution of gallium-67 and other Auger-emitting radionuclides in
human and animal tissues. Radiat. Prot. Dosim. 92, 229–231.
Watson, E.E., Stabin, M.G., Eckerman, K.F., 1989. A model of the peritoneal cavity for use in internal
dosimetry. J. Nucl. Med. 30, 2002–2011.
Winchell, H.S., Horst, W.D., Braun, L., Oldendorf, W.H., Hattner, R., Parker, H., 1980. N-Isopropyl
(123I)p-iodoamphetamine: single-pass brain uptake and washout; binding to brain synaptosomes; and
localisation in dog and monkey brain. J. Nucl. Med. 21, 947–952.
Zanzonico, P.B., 2000. Internal radionuclide radiation dosimetry: a review of basic concepts and recent
developments. J. Nucl. Med. 41, 297–308.
33

ANNEX A. SPECIAL BIOKINETIC AND DOSIMETRIC MODELS
A.1. Organ and tissue masses for different ages
(A 1) The masses of the organs and tissues are inherent in the S-values used (Sta-
bin and Siegel, 2003; Stabin et al., 2005). The masses of the phantoms used for cal-
culation of the S-values are those presented by Stabin and Siegel (2003) (Table A.1).The phantoms were produced by Cristy and Eckerman (1987), based predominantly
on data in Publication 23 (ICRP, 1975). Since the masses refer to the phantoms used,
they may deviate somewhat from those in Publications 23 (ICRP, 1975) and 89
(ICRP, 2002).
A.2. Blood volume and blood flow models
(A 2) Substances that remain largely in the blood are assumed to be distributedaccording to the relative blood volume of the different organs. An example of such
substances are labelled blood cells and radionuclides attached to macro-molecules,
but this blood distribution model has also been used, where appropriate, for other
substances. This model requires information on blood volumes in different organs
and tissues. These data were taken from Leggett and Williams (1991) and Williams
and Leggett (1989), and were also proposed by the Commission in Publication 89
(ICRP, 2002). The haematocrit, or fractional red cell content of the blood, has been
considered constant for blood circulating through all tissues. The data are presentedin Table A.2 and refer to adults. The fractional blood volumes used for children have
been calculated assuming that the blood content in an organ or tissue per unit mass
of tissue relative to that of the total body is independent of age. The total blood vol-
ume in children is taken from Publication 89 (ICRP, 2002) and is presented in Table
A.1.
(A 3) In the biokinetic models used in this report, the term ‘uptake’ or ‘content’ of
a radionuclide in an organ or tissue usually includes the radioactivity in blood in that
organ or tissue. However, when the blood distribution model is used, a specified frac-tion of the activity is associated with the blood. In this case, the activity in blood in
an organ or tissue has been added to the activity in that organ or tissue for purposes
of dose calculations.
(A 4) Table A.2 also presents the fractional cardiac output to different organs and
tissues. These fractions, which are also proposed in Publication 89 (ICRP, 2002),
were taken from Leggett and Williams (1995). These data have been applied as a
model for the activity distribution of radionuclides with very short physical half-lives
(seconds up to a few minutes), e.g. a number of positron emitters.
A.3. Gastrointestinal tract model
(A 5) The model presented in Publication 30 (ICRP, 1979) for the gastrointestinal
tract has been used for adults and children aged 1–15 years. The model, shown in
35
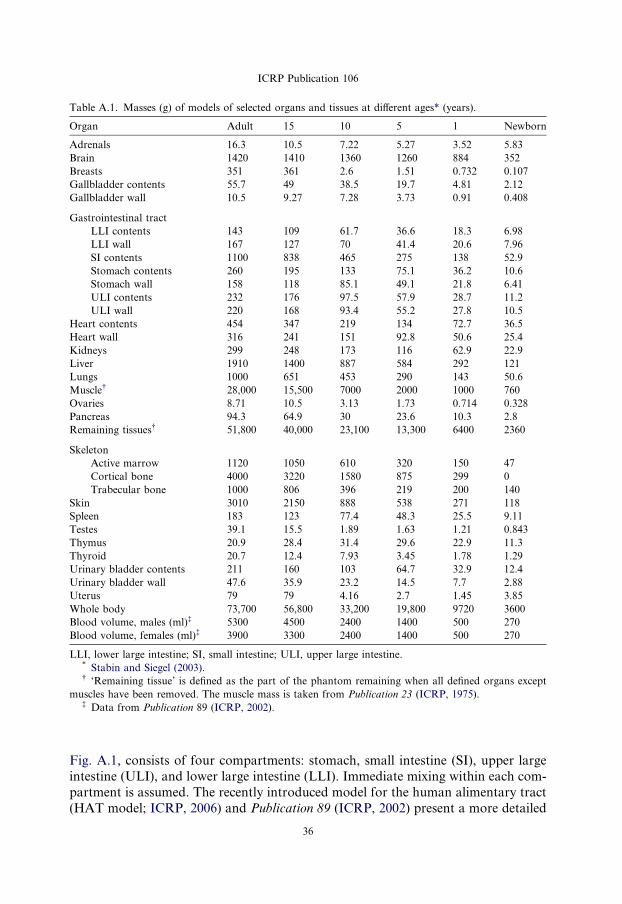
Table A.1. Masses (g) of models of selected organs and tissues at different ages* (years).
Organ Adult 15 10 5 1 Newborn
Adrenals 16.3 10.5 7.22 5.27 3.52 5.83
Brain 1420 1410 1360 1260 884 352
Breasts 351 361 2.6 1.51 0.732 0.107
Gallbladder contents 55.7 49 38.5 19.7 4.81 2.12
Gallbladder wall 10.5 9.27 7.28 3.73 0.91 0.408
Gastrointestinal tract
LLI contents 143 109 61.7 36.6 18.3 6.98
LLI wall 167 127 70 41.4 20.6 7.96
SI contents 1100 838 465 275 138 52.9
Stomach contents 260 195 133 75.1 36.2 10.6
Stomach wall 158 118 85.1 49.1 21.8 6.41
ULI contents 232 176 97.5 57.9 28.7 11.2
ULI wall 220 168 93.4 55.2 27.8 10.5
Heart contents 454 347 219 134 72.7 36.5
Heart wall 316 241 151 92.8 50.6 25.4
Kidneys 299 248 173 116 62.9 22.9
Liver 1910 1400 887 584 292 121
Lungs 1000 651 453 290 143 50.6
Muscle� 28,000 15,500 7000 2000 1000 760
Ovaries 8.71 10.5 3.13 1.73 0.714 0.328
Pancreas 94.3 64.9 30 23.6 10.3 2.8
Remaining tissues� 51,800 40,000 23,100 13,300 6400 2360
Skeleton
Active marrow 1120 1050 610 320 150 47
Cortical bone 4000 3220 1580 875 299 0
Trabecular bone 1000 806 396 219 200 140
Skin 3010 2150 888 538 271 118
Spleen 183 123 77.4 48.3 25.5 9.11
Testes 39.1 15.5 1.89 1.63 1.21 0.843
Thymus 20.9 28.4 31.4 29.6 22.9 11.3
Thyroid 20.7 12.4 7.93 3.45 1.78 1.29
Urinary bladder contents 211 160 103 64.7 32.9 12.4
Urinary bladder wall 47.6 35.9 23.2 14.5 7.7 2.88
Uterus 79 79 4.16 2.7 1.45 3.85
Whole body 73,700 56,800 33,200 19,800 9720 3600
Blood volume, males (ml)� 5300 4500 2400 1400 500 270
Blood volume, females (ml)� 3900 3300 2400 1400 500 270
LLI, lower large intestine; SI, small intestine; ULI, upper large intestine.* Stabin and Siegel (2003).� ‘Remaining tissue’ is defined as the part of the phantom remaining when all defined organs except
muscles have been removed. The muscle mass is taken from Publication 23 (ICRP, 1975).� Data from Publication 89 (ICRP, 2002).
ICRP Publication 106
Fig. A.1, consists of four compartments: stomach, small intestine (SI), upper large
intestine (ULI), and lower large intestine (LLI). Immediate mixing within each com-
partment is assumed. The recently introduced model for the human alimentary tract
(HAT model; ICRP, 2006) and Publication 89 (ICRP, 2002) present a more detailed
36
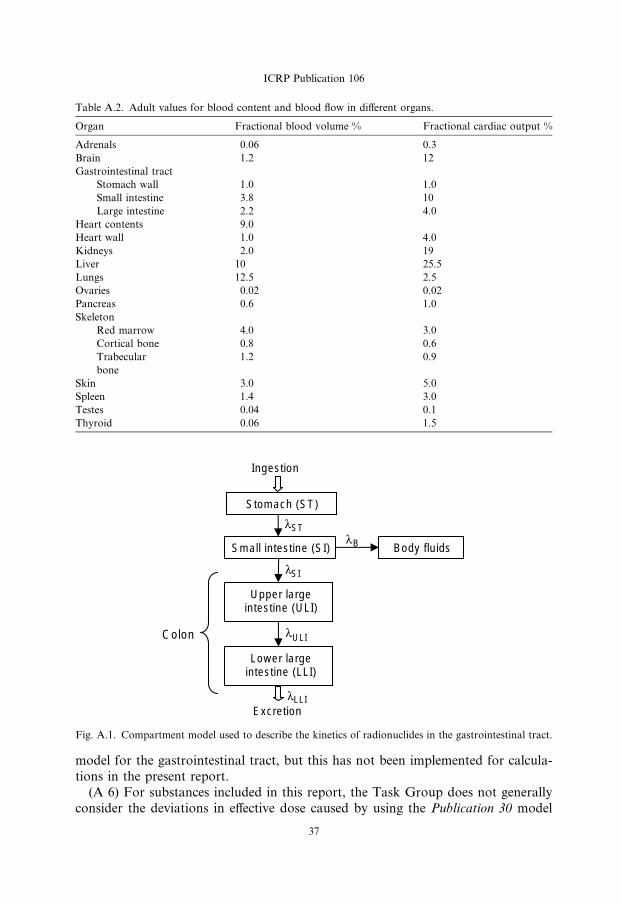
Table A.2. Adult values for blood content and blood flow in different organs.
Organ Fractional blood volume % Fractional cardiac output %
Adrenals 0.06 0.3
Brain 1.2 12
Gastrointestinal tract
Stomach wall 1.0 1.0
Small intestine 3.8 10
Large intestine 2.2 4.0
Heart contents 9.0
Heart wall 1.0 4.0
Kidneys 2.0 19
Liver 10 25.5
Lungs 12.5 2.5
Ovaries 0.02 0.02
Pancreas 0.6 1.0
Skeleton
Red marrow 4.0 3.0
Cortical bone 0.8 0.6
Trabecular 1.2 0.9
bone
Skin 3.0 5.0
Spleen 1.4 3.0
Testes 0.04 0.1
Thyroid 0.06 1.5
Small intestine (SI)
ST
Upper large intestine (ULI)
SI
Lower large intestine (LLI)
ULI
Body fluidsB
LLIExcretion
Stomach (ST)
Ingestion
Colon
λλ
λ
λ
λ
Fig. A.1. Compartment model used to describe the kinetics of radionuclides in the gastrointestinal tract.
ICRP Publication 106
model for the gastrointestinal tract, but this has not been implemented for calcula-
tions in the present report.
(A 6) For substances included in this report, the Task Group does not generally
consider the deviations in effective dose caused by using the Publication 30 model
37
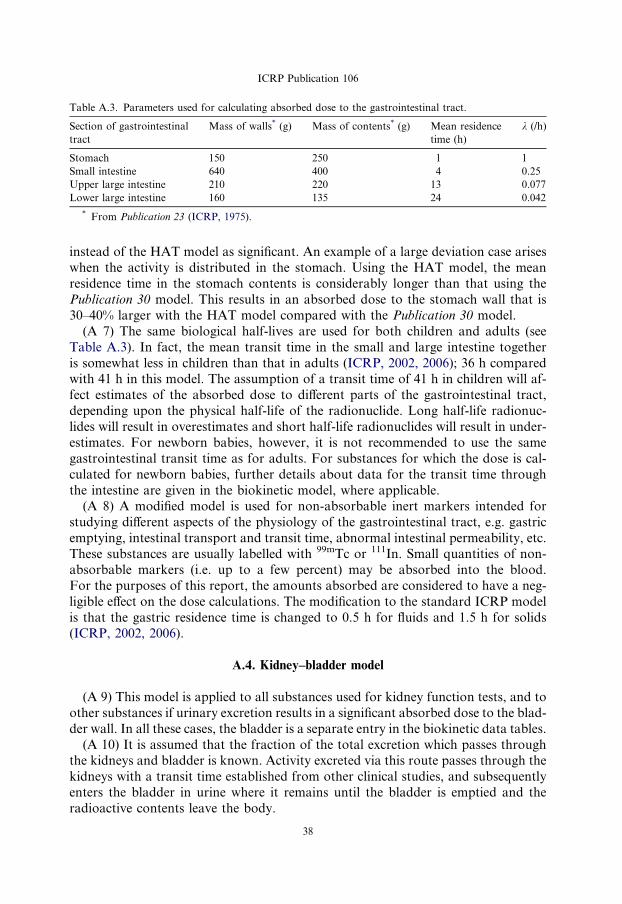
Table A.3. Parameters used for calculating absorbed dose to the gastrointestinal tract.
Section of gastrointestinal
tract
Mass of walls* (g) Mass of contents* (g) Mean residence
time (h)
k (/h)
Stomach 150 250 1 1
Small intestine 640 400 4 0.25
Upper large intestine 210 220 13 0.077
Lower large intestine 160 135 24 0.042
* From Publication 23 (ICRP, 1975).
ICRP Publication 106
instead of the HAT model as significant. An example of a large deviation case arises
when the activity is distributed in the stomach. Using the HAT model, the mean
residence time in the stomach contents is considerably longer than that using the
Publication 30 model. This results in an absorbed dose to the stomach wall that is
30–40% larger with the HAT model compared with the Publication 30 model.
(A 7) The same biological half-lives are used for both children and adults (see
Table A.3). In fact, the mean transit time in the small and large intestine together
is somewhat less in children than that in adults (ICRP, 2002, 2006); 36 h comparedwith 41 h in this model. The assumption of a transit time of 41 h in children will af-
fect estimates of the absorbed dose to different parts of the gastrointestinal tract,
depending upon the physical half-life of the radionuclide. Long half-life radionuc-
lides will result in overestimates and short half-life radionuclides will result in under-
estimates. For newborn babies, however, it is not recommended to use the same
gastrointestinal transit time as for adults. For substances for which the dose is cal-
culated for newborn babies, further details about data for the transit time through
the intestine are given in the biokinetic model, where applicable.(A 8) A modified model is used for non-absorbable inert markers intended for
studying different aspects of the physiology of the gastrointestinal tract, e.g. gastric
emptying, intestinal transport and transit time, abnormal intestinal permeability, etc.
These substances are usually labelled with 99mTc or 111In. Small quantities of non-
absorbable markers (i.e. up to a few percent) may be absorbed into the blood.
For the purposes of this report, the amounts absorbed are considered to have a neg-
ligible effect on the dose calculations. The modification to the standard ICRP model
is that the gastric residence time is changed to 0.5 h for fluids and 1.5 h for solids(ICRP, 2002, 2006).
A.4. Kidney–bladder model
(A 9) This model is applied to all substances used for kidney function tests, and to
other substances if urinary excretion results in a significant absorbed dose to the blad-
der wall. In all these cases, the bladder is a separate entry in the biokinetic data tables.
(A 10) It is assumed that the fraction of the total excretion which passes throughthe kidneys and bladder is known. Activity excreted via this route passes through the
kidneys with a transit time established from other clinical studies, and subsequently
enters the bladder in urine where it remains until the bladder is emptied and the
radioactive contents leave the body.
38
ICRP Publication 106
(A 11) The rate at which a radionuclide is excreted is determined from knowledge
of the amount of activity in the total body, ATB, which is assumed to be described by
the sum of a series of exponential functions:
ATB ¼Xn
i¼1
ai expð�ðki þ kpÞtÞ
where ki is the biological elimination constant for component I, kp is the radioactive
decay constant, and ai is the fraction of the administered activity associated with
component i.
The cumulated activity in the kidneys from the excretion process, eAK , is given by:
eAK ¼ fr1� expð�kpT KÞ
kp
Xn
i¼1
aiki
ki þ kp
where fr is the fraction of excreted activity which is eliminated through the kidneys,
and T K is the mean transit time through the kidneys appropriate for the given radio-
pharmaceutical and physiological status; unless otherwise stated, this is assumed to
be 5 min.
(A 12) The expression is approximate, since fr may differ for the individual com-ponents of whole-body clearance. However, for practical application, this approxi-
mation is judged to be adequate. The cumulated activity in the kidneys given in
the biokinetic data tables for the individual substances is the sum of the cumulated
activity from the excretion process and a contribution from activity distributed uni-
formly in the remaining organs and tissues, which can include the kidneys.
(A 13) The cumulated activity in bladder contents, eAB, is given by:
eAB ¼ fr
X1
i¼1
ai1� expð�kptvÞ
kp� 1� expð�ðki þ kpÞtvÞ
ki þ kp
� �
� 1
1� expð�ðkp þ kpÞtv
� �
where tv, is the bladder filling and voiding interval, which for the purpose of the pres-
ent model is assumed to be constant and equal to 3.5 h for adults and children aged
P10 years; the average urinary cycle in humans (Syed, 1976). The first voiding is as-
sumed to occur at time tv after administration of the radiopharmaceutical to the pa-
tient. In the equations above, the effect of kidney residence time has been neglectedsince it is usually much shorter than the physical half-life of the radionuclide; if this is
not the case, this equation should be multiplied by expð�kpT KÞ.(A 14) Calculating the radiation absorbed dose to the bladder wall involves con-
sideration of a complex relationship between urine flow rate, voiding period, and the
urine volume initially present in the bladder when the radiopharmaceutical is admin-
istered, and is critically dependent on the model used to describe the geometrical
relationships between the wall of the bladder and its contents. Such a model was
developed by Snyder and Ford (1976) to investigate the effects of the above physio-logical variables on absorbed dose to the bladder wall, and was extended by Smith
39
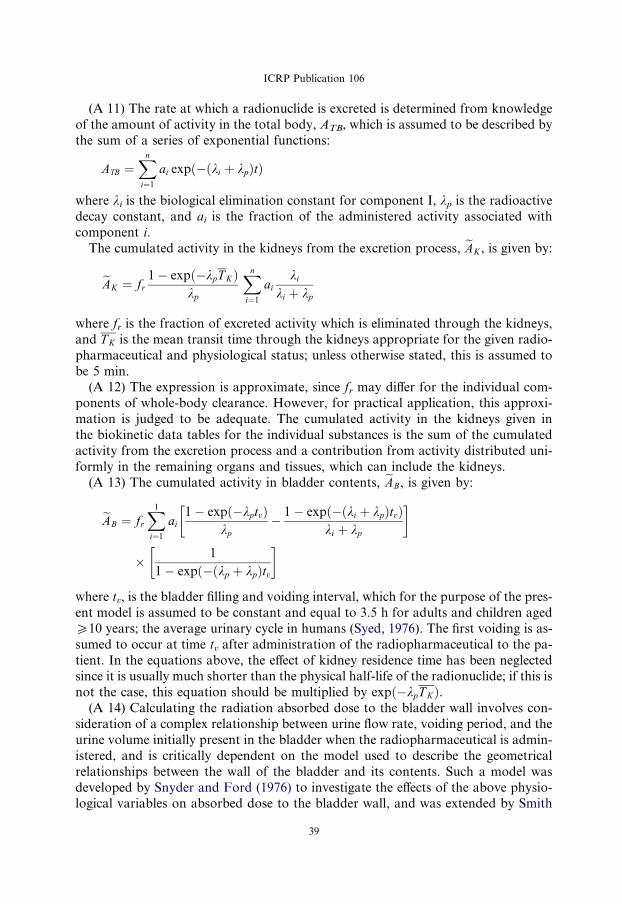
Table A.4. Parameters used for calculating absorbed dose to the urinary bladder wall.
Age (years) Adult 15 10 5 1 Newborn
Voiding period (h) 3.5 3.5 3.5 3.0 2.0 2.0
Mass of wall* (g) 40–50 35–40 25 16 9 4
Mass of wall used (g) 47.6 35.9 23.2 14.5 7.7 2.88
Volume (ml) 211 160 103 64.7 32.9 12.4
Excretion (ml/day)* 1200–1600 1200 700 500 400 300
* The lower limit of the interval applies for females and the upper limit applies for males. Data from
Publication 89 (ICRP, 2002).
ICRP Publication 106
et al. (1982) to examine these effects for any radiopharmaceutical. The MIRD Com-
mittee has published a dynamic bladder model (Thomas et al., 1999) incorporating
more physiologically realistic features providing for a varying bladder volume, vary-
ing initial content and voiding interval, and a night gap in the voiding pattern.
(A 15) Within the ranges of urine flow rate of 0.5–2 1/day, voiding period of 0.5–8
h, and initial bladder contents of 0–300 ml, the predicted bladder wall dose varies
over a range of about 25 times for radiopharmaceuticals that are cleared rapidlyby the renal system (e.g. 99mTc-MAG3), reducing to a range of about five times
for substances that are cleared more slowly (e.g. 131I-iodide). For voiding periods
of P3.5 h, the bladder dose predicted by the simplified method used in this report
lies within the spread of doses obtained using the above ranges of parameter values,
but may be as much as five times lower than the highest values. As the voiding period
decreases, the simple method leads to a further underestimate of the dose, which, for
a period of 0.5 h, may be of the order of 25 times.
(A 16) An age-related bladder voiding model is used. The voiding periods arebased upon urinary production rates as described in Publication 89 (ICRP, 2002)
and volume of the content as described by Stabin and Siegel (2003). The voiding
periods are presented in Table A.4.
(A 17) The S-values used for calculation of the absorbed dose to the bladder wall
relate to the contents and the wall of the bladder as the source and target tissue,
respectively. It should be noted that the S-values, which for electrons and beta par-
ticles represent a surface dose to the bladder wall, are based on fixed average bladder
contents (Table A.4). These S-values have been used in the present report in conjunc-tion with cumulated activities in the bladder contents estimated for an age-dependent
bladder voiding interval presented in Table A.4. This method does not allow for the
variation in dose rate to the wall as the bladder fills with urine containing
radionuclides.
A.5. Model for radiopharmaceuticals used to measure glomerular filtration rate
(A 18) For a variety of labelled inulin and inulin-like radiopharmaceuticals usedfor the measurement of glomerular filtration rate, the following biokinetic model
has been used. After intravenous administration and initial rapid distribution in
extracellular fluid, it is assumed that the radionuclide is excreted exclusively by the
kidneys according to the kidney–bladder model. In the normal case, total body
40

ICRP Publication 106
retention is described by a mono-exponential function with a half-time of 100 min,
fraction excreted by the kidneys of 1.0, and renal transit time of 5 min.
(A 19) For chelated compounds (DTPA, EDTA) and the contrast medium sodium
iothalamate, there is evidence of a small degree of in-vivo dissociation of the radio-
active label, leading to longer retention of approximately 1% of the administeredradionuclide. This fraction is assumed to be distributed uniformly and to be elimi-
nated with a half-time of 7 days. This is a simplifying approximation, since the dis-
sociated label will exhibit specific biokinetics depending upon its chemical form.
Nevertheless, it is considered adequate for estimating the contributions to absorbed
dose from this dissociated label, provided that the examinations are conducted with
a blocked thyroid for those radiopharmaceuticals for which the dissociated label
would concentrate preferentially in the thyroid.
(A 20) In the abnormal case, it is assumed that the retention half-time of the majorcomponent is increased to 1000 min and that the renal transit time is increased to 20
min.
A.6. Models for bone-seeking radionuclides administered as radiopharmaceuticals
(A 21) For calculation of effective dose, the radiation-sensitive part of bone tissues
has been identified as a 10-lm-thick layer on bone surfaces, representing endosteal
and periosteal cells (ICRP, 1991a). The Task Group are aware that this figure is sub-ject to revision, and that future dose estimates should be based on an extended bone
surface volume (Gossner et al., 2000). However, for the present report, the dose esti-
mates were produced using the earlier established method.
(A 22) The mean absorbed dose to bone surfaces and red marrow is presented in
this report. Calculation of the absorbed dose for these tissues is a complex task since
they comprise an intricate mixture of soft tissues and bone. For the present report,
the calculations are based on S-values derived by Stabin and Siegel (2003), based on
methods for calculating the absorbed fraction for the non-penetrating radiationdeveloped by Eckerman and Stabin (2000) and Bouchet et al. (2000). The S-values
from bone tissues to bone surfaces and red marrow are dependent on the distribution
of activity within the bone. Two different cases can be distinguished:
� surface-deposited activity in trabecular and cortical bone (‘bone surface seekers’);and
� activity deposited uniformly throughout the entire volume of the mineral bone in
trabecular and cortical bone (‘bone volume seekers’).
(A 23) In Publication 30 (ICRP, 1979), a general rule concerning short-lived radio-
nuclides was introduced and used for various elements: ‘radionuclides with a phys-
ical half-life less than 15 days are assumed to be surface deposited.’ The same
general rule, extended to apply to the effective half-time, is adopted in the present
report. Thus, for the absorbed dose calculations, substances with an effective half-
time of <15 days have been assumed to be surface deposited, and those with a
effective half-time >15 days have been assumed to be volume distributed, unless
41

ICRP Publication 106
otherwise stated. In cases with two or more biological excretion half-times, the
different components are considered separately, thus a fraction excreted slowly from
the skeleton may be considered to be volume deposited, while the remaining part is
surface deposited, provided that the physical half-life is sufficiently long.
(A 24) If nothing is known about the distribution of cumulated activity betweencortical and trabecular bone, it is assumed to be distributed uniformly on surfaces
or throughout the volume, as appropriate.
(A 25) The distribution of activity thus follows the surface area or mass distribution
of mineral bone. For adults, the mass ratio cortical:trabecular bone, according to Pub-
lication 89, is 80:20 and the surface area ratio is 40:60 (ICRP, 2002). Since no reference
values for the distribution between cortical and trabecular bone for children are avail-
able, and since the information on this matter in the open literature is very scarce, the
Task Group has also adopted these values for 15- and 10-year-old children. For 5- and1-year-old children, the mass ratio cortical:trabecular bone used for the calculations is
assumed to be 60:40 and the surface area ratio is assumed to be 30:70.
(A 26) A few radiopharmaceuticals are concentrated to a significant extent in the
metaphyseal growth plates of children’s bones. This factor is not taken into account
in the dose calculations given herein. Thus, radiation doses to this part of the skel-
eton may be underestimated for children. However, the mean absorbed dose to bone
surfaces is not likely to be underestimated substantially.
A.7. Model for colloids taken up preferentially in the liver, spleen, and red bone marrow
(A 27) Colloids of 99mTc-sulphur and 198Au were discussed in MIRD Report Nos.
3 and 4, respectively (Atkins et al., 1975; Cloutier et al., 1975). The colloids were as-
sumed to be taken up preferentially in the liver, spleen, and red bone marrow, with a
uniform distribution of any residue in the remainder of the body. Uptake fractions
were given for three patient categories: normal liver condition, early to intermediate
diffuse parenchymal liver disease, and intermediate to advanced diffuse parenchymalliver disease. These categories differ not only in biokinetics, but also with regard to
liver and spleen mass. In the normal case, the uptake in liver, spleen, and red marrow
was set at 85, 7, and 5% for sulphur colloid and 90, 3, and 7% for gold colloid,
respectively. These values were estimates based on clinical studies, but no details
about the methods used for calculating the percentages were given. However, the val-
ues are in good agreement with results obtained from animal studies.
(A 28) Studies on man have shown a decreased uptake of colloids with increasing
degree of liver disease, with corresponding increases in uptake for other organs (Her-zog et al., 1987; Groshar et al., 2002). The change in uptake depends on the particle
size of the administered colloid.
(A 29) The Task Group has adopted the same view as the MIRD Committee with
regard to choice of patient categories, definition of organs with an active uptake, or-
gan masses, and biokinetic differences between large and small colloids. The uptake
values used are based on the report by Herzog et al. (1987), which contains results of
quantitative measurements with conjugate view whole-body counting and double-
42

ICRP Publication 106
window regional counting over liver and spleen. For all types of colloid, immediate
uptake is assumed. The biological half-time is assumed to be long compared with the
physical half-life of the radionuclide, except for iodine-labelled albumin micro-
aggregates. For these substances, the metabolic breakdown of the particles is as-
sumed to be represented by biological half-times (fraction) of 3 h (0.8) and 5 days(0.2).
(A 30) The organ masses for different patient categories and uptake data for dif-
ferent sizes of colloid are presented in Tables A.5–A.7. For further details, the reader
is referred to the biokinetic data on the individual substances.
A.8. Model for liver and biliary excretion
(A 31) This model is intended for substances that are actively taken up in hepato-cytes and excreted, via the biliary tract, to the intestine. Typical examples are a large
Table A.5. Organ mass (kg): based on Atkins et al. (1975).
Organ Condition
1* 2� 3�
Total body 70 70 70
Liver 1.8 2.4 1.4
Spleen 0.17 0.25 0.4
Red marrow 1.5 1.5 1.5
* Normal liver.� Early to intermediate diffuse parenchymal liver disease.� Intermediate to advanced diffuse parenchymal liver disease.
Table A.6. Uptake values (fractions) for large colloids (100–1000 nm diameter).*
Organ Condition�
1 2 3
Liver 0.70 0.50 0.30
Spleen 0.10 0.20 0.30
Red marrow 0.10 0.15 0.25
Remaining 0.10 0.15 0.15
* Examples: 99mTc micro-aggregated albumin, 99mTc-phytate.� See footnote to Table A.3.
Table A.7. Uptake values (fractions) for small colloids (<100 nm diameter).*
Organ Condition�
1 2 3
Liver 0.70 0.50 0.30
Spleen 0.10 0.20 0.30
Red marrow 0.15 0.25 0.30
Remaining 0.05 0.15 0.10
* Examples: 99mTc mini-/micro-aggregated albumin.� See footnote to Table A.3.
43

ICRP Publication 106
group of technetium-labelled iminodiacetic acid (IDA) derivatives (e.g. BIDA,
HIDA, EIDA, PIPIDA, PBIDA, and DISIDA).
(A 32) Several biokinetic models have been presented in the literature for techne-
tium-labelled IDA derivatives (Ryan et al., 1977; Wistow et al., 1977; Taavitsainen
et al., 1980; Brown et al., 1981, 1982; Wu et al., 1984). The substance is assumedto be rapidly taken up in the liver from the blood and then excreted, via the biliary
tract, partly to the gallbladder for temporary storage and partly directly to the intes-
tine. A minor portion of the radiopharmaceutical is excreted in the urine. In patho-
logical states (liver disease, occlusion of the biliary tract, congenial biliary atresia),
the same model is used but with different kinetic data (transfer factors). The com-
partmental model is shown in Fig. A.2.
(A 33) Similar models have been used for all substances that undergo biliary excre-
tion. For each substance, the fraction and half-time for movement between compart-ments are specified in the biokinetic data table. Unless otherwise stated in the model,
it is assumed that 65% of the activity entering the liver is transferred directly from the
liver to the small intestine, and 35% goes to the gallbladder (Wu et al., 1984).
(A 34) The gallbladder empties at intervals on stimulation by food. It is assumed
to empty in an identical manner for all substances. The first emptying is after 3 h,
during which time 75% of the radioactive material present in the bile is assumed
to be excreted to the small intestine. The second emptying is after 9 h, again associ-
ated with the excretion of 75% of the radioactive material in the bile. For the doseestimation, the third and final emptying is assumed to occur after 24 h when all
the radioactive material is excreted. Earlier emptying can be induced by a meal of
high fat content or by cholecystokinin.
(A 35) The final excretion from the body follows the models for the gastrointesti-
nal tract and for the kidney–bladder system (see above).
Extra-cellular
fluid (blood)
Liver Gallbladder
Kidney Smallintestine
1
2
3
4 5
Excretion Excretion
Fig. A.2. Model for liver and biliary excretion. The flows are defined as follows: 1, uptake in liver; 2,
uptake in kidney; 3, excretion from liver to gallbladder; 4, excretion from liver directly to small intestine; 5,
emptying of gallbladder to small intestine.
44
ICRP Publication 106
A.9. Salivary glands
(A 36) Some substances are actively taken up in the salivary glands. In those
cases, an approximate absorbed dose in the salivary glands is estimated and in-
cluded in the dose table. This organ is not included in the presently used tablesof S-values. Johansson (1996) presented S-values for self-irradiation of the salivary
glands for 99mTc. The calculation method lined up in this report has also been used
by the Task Group for other radionuclides, utilising the unit density sphere model
in the formerly freely available MIRDOSE3 program (Stabin, 1996). The S-values
have been calculated considering the three pairs of salivary glands (parotid, sub-
maxillary, and sublingual) with masses according to Publication 23 (ICRP, 1975).
Those masses do not deviate significantly from those reported in the updated ver-
sion, Publication 89 (ICRP, 2002). To estimate the absorbed dose from source inother organs, the brain is used as a substitute target organ, except in cases when
the brain is also a source.
A.10. References for Annex A
Atkins, H.L., Cloutier, R.J., Lathrop, K.A. et al., 1975. Technetium-99m-sulfur colloid in various liver
conditions. MIRD Dose Estimate Report No. 3. J. Nucl. Med. 16, 108A–108B.
Bouchet, L.G., Bolch, W.E., Howell, R.W., Rao, D.V., 2000. S values for radionuclides localized within
the skeleton. J. Nucl. Med. 41, 189–212.
Brown, P.H., Krishnamurthy, G.T., Bobba, V.R., Kingston, E., 1981. Radiation-dose calculation for Tc-
99m HIDA in health and disease. J. Nucl. Med. 22, 177–183.
Brown, P.H., Krishnamurthy, G.T., Bobba, V.R., Kingston, E., Turner, F.E., 1982. Radiation-dose
calculation for five Tc-99m IDA hepatobiliary agents. J. Nucl. Med. 23, 1025–1030.
Cloutier, R.J., Freeman, L.M., McAfee, J.G. et al., 1975. Summary of current radiation dose estimates to
humans with various liver conditions from 198Au colloidal gold. MIRD Dose Estimate Report No. 4. J.
Nucl. Med. 16, 173–174.
Cristy, M., Eckerman, K., 1987. Specific Absorbed Fractions of Energy at Various Ages from Internal
Photon Sources. Oak Ridge National Laboratory, Oak Ridge, TN.
Eckerman, K.F., Stabin, M.G., 2000. Electron absorbed fractions and dose conversion factors for marrow
and bone by skeletal region. Health Phys. 78, 199–214.
Gossner, W., Masse, R., Stather, J.W., 2000. Cells at risk for dosimetric modelling relevant to bone
tumour induction. Radiat. Prot. Dosim. 92, 209–213.
Groshar, D., Slobodin, G., Zuckerman, E., 2002. Quantitation of liver and spleen uptake of 99mTc-
phytate colloid using SPECT: detection of liver cirrhosis. J. Nucl. Med. 43, 312–317.
Herzog, H., Spohr, G., Notohamiprodjo, G., Feinendegen, L.E., 1987. Absolute quantification of
pharmacokinetic distribution of RES colloids in individuals with normal liver function. Nucl. Med.
Commun. 8, 157–175.
ICRP, 1975. Report of the Task Group on Reference Man. ICRP Publication 23. Pergamon Press,
Oxford.
ICRP, 1979. Limits for intakes of radionuclides by workers. ICRP Publication 30, Part 1. Ann. ICRP
2(3/4).
ICRP, 1991a. 1990 Recommendations of the International Commission on Radiological Protection. ICRP
Publication 60. Ann. ICRP 21(1–3).
ICRP, 2002. Basic anatomical and physiological data for use in radiological protection: reference values.
ICRP Publication 89. Ann. ICRP 31(3/4).
ICRP, 2006. Human alimentary tract model for radiological protection. ICRP Publication 100. Ann.
ICRP 35(1/2).
45

ICRP Publication 106
Johansson, L., 1996. Absorbed dose in the salivary glands from technetium-99m labeled radiopharma-
ceuticals, in: Schlafke-Stelson, A., Stabin, M.G., Sparks, R.B.. Sixth International Radiopharmaceu-
tical Dosimetry Symposium, Oak Ridge Institute for Science and Education, Gatlinburg, TN, pp 513–
521.
Leggett, R.W., Williams, L.R., 1991. Suggested reference values for regional blood volumes in humans.
Health Phys. 60, 139–154.
Leggett, R.W., Williams, L.R., 1995. A proposed blood circulation model for reference man. Health Phys.
69, 187–201.
Ryan, J., Cooper, M., Loberg, M., Harvey, E., Sikorski, S., 1977. Technetium-99m-labelled N-(2,6-
dimethylphenyl carbamoylmethyl)-iminodiacetic acid (Tc99mHIDA): a new radiopharmaceutical for
hepatobiliary imaging studies. J. Nucl. Med. 18, 997–1004.
Smith, T., Veall, N., Wootton, R., 1982. Bladder wall dose from administered radiopharmaceuticals: the
effect of variation in urine flow rate, voiding interval and initial bladder content. Radiat. Prot. Dosim.
2, 183–189.
Snyder, W.S., Ford, M.R., 1976. Estimation of doses to the urinary bladder and to the gonads, in:
Cloutier, R.J., Coffey, J.L., Snyder, W.S., et al. (Eds.), Radiopharmaceutical Dosimetry Symposium,
Oak Ridge, TN. HEW Publication (FDA 76-8044). Department of Health, Education and Welfare,
Bureau of Radiological Health, Rockville, MD, pp. 313–349.
Stabin, M.G., 1996. MIRDOSE: personal computer software for internal dose assessment in nuclear
medicine. J. Nucl. Med. 37, 538–546.
Stabin, M.G., Siegel, J.A., 2003. Physical models and dose factors for use in internal dose assessment.
Health Phys. 83, 294–310.
Stabin, M.G., Sparks, R.B., Crowe, E., 2005. OLINDA/EXM: the second-generation personal computer
software for internal dose assessment in nuclear medicine. J. Nucl. Med. 46, 1023–1027.
Syed, I.B., 1976. Dosimetry of indium-113m radiopharmaceuticals with special attention to the urinary
bladder, in: Cloutier, R.J., Coffey, J.L., Snyder, W.S., et al. (Eds.), Radiopharmaceutical Dosimetry
Symposium, Oak Ridge, TN. HEW Publication (FDA 76-8044). Department of Health, Education and
Welfare, Bureau of Radiological Health, Rockville, MD, pp. 360–369.
Taavitsainen, M., Riihimaki, E., Tahti, E., 1980. Body disappearance and liver mean transit time of 99m-
Tc-diethyl-IDA. Eur. J. Nucl. Med. 5, 147–150.
Thomas, S.R., Stabin, M.G., Chen, C.-T., Samaratunga, R.C., 1999. A dynamic urinary bladder model
for radiation dose calculations. MIRD Pamphlet No. 14, revised. J. Nucl. Med. 40, 102S–123S.
Williams, L.R., Leggett, R.W., 1989. Reference values for resting blood flow to organs of man. Clin. Phys.
Physiol. Meas. 10, 187–217.
Wistow, B.W., Subramanian, G., Van Heertum, R.L. et al., 1977. An evaluation on 99mTc-labeled
hepatobiliary agents. J. Nucl. Med. 18, 455–461.
Wu, R.K., Siegel, J.A., Rattner, Z., Malmud, L.S., 1984. Tc-99m HIDA dosimetry in patients with various
hepatic disorders. J. Nucl. Med. 25, 905–912.
46

ANNEX B. EXPLANATIONS
B.1. Where can the most recent ICRP information about a specific substance be found?
Radiopharmaceutical This publication Publication 80 Publication 53
3H-neutral fat, free fatty acids x11C-acetate x11C-amino acids (generic model) x11C-brain receptor substances
(generic model)
x
11C-methionine x11C-thymidine x11C (realistic maximum model) x14C-neutral fat, free fatty acids x14C-urea x15O-water x18F-amino acids (generic model) x18F-brain receptor substances
(generic model)
x
18F-FDG x18F-L-dopa x18F (realistic maximum model) x51Cr-EDTA x67Ga-citrate x68Ga-EDTA x75Se-amino acids x75Se-HCAT x99mTc-apticide x99mTc-colloids (small) x99mTc-EC x99mTc-ECD x99mTc-furifosmin x99mTc-HIG x99mTc-HM-PAO x99mTc-IDA derivatives x99mTc-MAA x99mTc-MAG3 x99mTc-markers, non-absorbable x99mTc-MIBI x99mTc-monoclonal
antibodies/fragments
x
99mTc-pertechnegas x99mTc-pertechnetate x99mTc-phosphates
and phosphonates
x
99mTc-RBC x x99mTc-Technegas x99mTc-tetrofosmin (rest/exercise) x99mTc-WBC x111In-HIG x
47
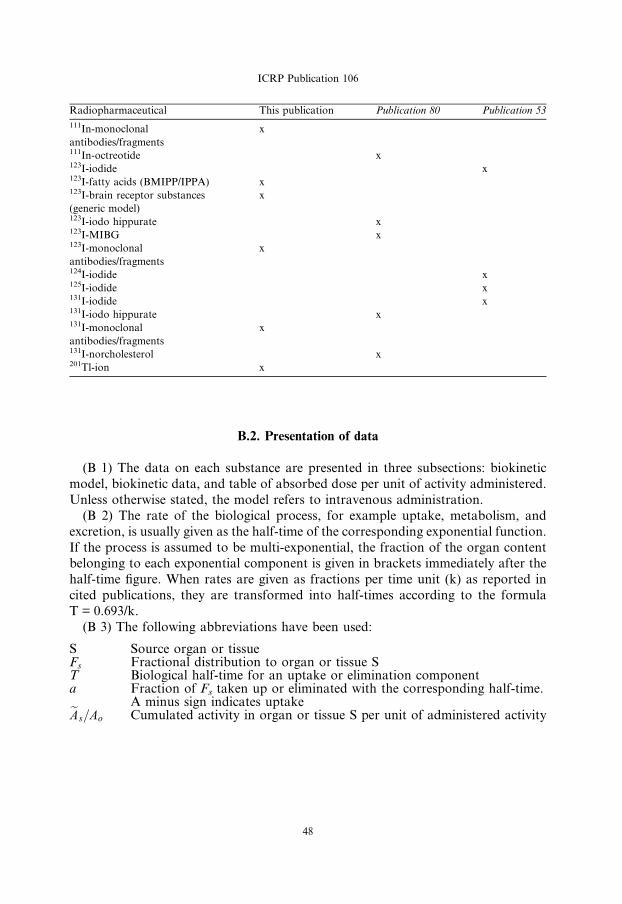
Radiopharmaceutical This publication Publication 80 Publication 53
111In-monoclonal
antibodies/fragments
x
111In-octreotide x123I-iodide x123I-fatty acids (BMIPP/IPPA) x123I-brain receptor substances
(generic model)
x
123I-iodo hippurate x123I-MIBG x123I-monoclonal
antibodies/fragments
x
124I-iodide x125I-iodide x131I-iodide x131I-iodo hippurate x131I-monoclonal
antibodies/fragments
x
131I-norcholesterol x201Tl-ion x
ICRP Publication 106
B.2. Presentation of data
(B 1) The data on each substance are presented in three subsections: biokinetic
model, biokinetic data, and table of absorbed dose per unit of activity administered.
Unless otherwise stated, the model refers to intravenous administration.
(B 2) The rate of the biological process, for example uptake, metabolism, and
excretion, is usually given as the half-time of the corresponding exponential function.
If the process is assumed to be multi-exponential, the fraction of the organ contentbelonging to each exponential component is given in brackets immediately after the
half-time figure. When rates are given as fractions per time unit (k) as reported in
cited publications, they are transformed into half-times according to the formula
T = 0.693/k.
(B 3) The following abbreviations have been used:
S
Source organ or tissue Fs Fractional distribution to organ or tissue S T Biological half-time for an uptake or elimination component a Fraction of Fs taken up or eliminated with the corresponding half-time.A minus sign indicates uptake
eAs=Ao Cumulated activity in organ or tissue S per unit of administered activity48
ICRP Publication 106
(B 4) The tables sometimes contain empty spaces under the headings T and a, usu-
ally because the kinetics are described by complex exponential, or non-exponential,
expressions, which cannot easily be defined in the table. This is the case for activity in
the gastrointestinal tract, the gallbladder, and the urinary bladder. In these cases, the
tables only present the cumulated activities together with the fractional distribution.(B 5) The relative cumulated activities are presented in hours (h). Average organ
or tissue absorbed doses are given as milligrays (mGy) per megabecquerel (MBq).
The effective dose is given as millisieverts (mSv) per megabecquerel. All dose values
are given in exponential notation (e.g. 2.6E � 02 = 2.6 · 10�2 or 0.026 and
4.9E + 01 = 4.9 · 10+1 or 49). The calculations have been performed without round-
ing, but the final result is given with two digits.
(B 6) Dose calculations have been performed for adults and 15-, 10-, 5-, and 1-
year-old children. The organs (or tissues) are presented in alphabetical order except‘Remaining organs’, which is placed at the end. The dose to organs or tissues not
mentioned in the table can usually be approximated with the value given for
‘Remaining organs’.
49
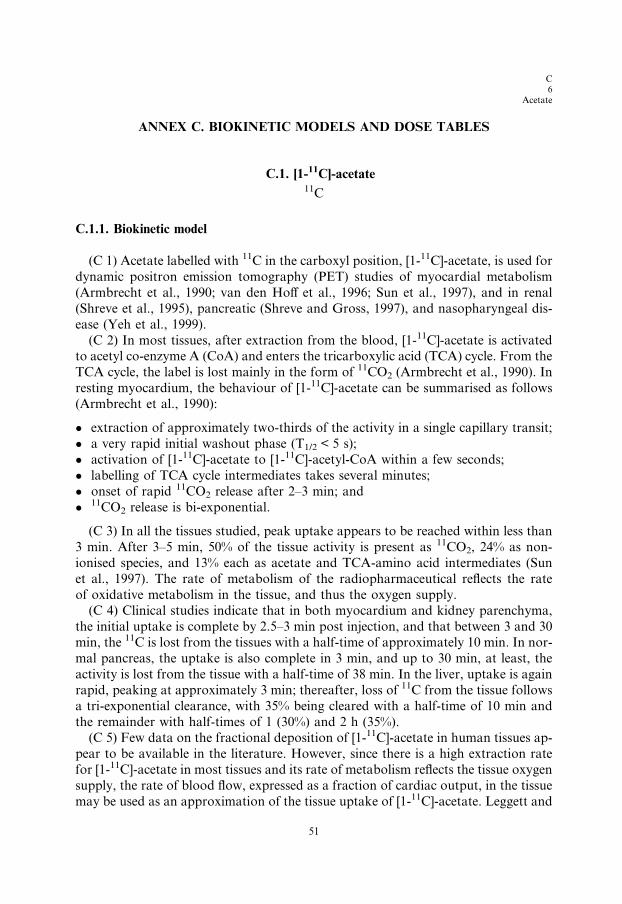
C6
Acetate
ANNEX C. BIOKINETIC MODELS AND DOSE TABLES
C.1. [1-11C]-acetate11C
C.1.1. Biokinetic model
(C 1) Acetate labelled with 11C in the carboxyl position, [1-11C]-acetate, is used for
dynamic positron emission tomography (PET) studies of myocardial metabolism
(Armbrecht et al., 1990; van den Hoff et al., 1996; Sun et al., 1997), and in renal
(Shreve et al., 1995), pancreatic (Shreve and Gross, 1997), and nasopharyngeal dis-
ease (Yeh et al., 1999).
(C 2) In most tissues, after extraction from the blood, [1-11C]-acetate is activatedto acetyl co-enzyme A (CoA) and enters the tricarboxylic acid (TCA) cycle. From the
TCA cycle, the label is lost mainly in the form of 11CO2 (Armbrecht et al., 1990). In
resting myocardium, the behaviour of [1-11C]-acetate can be summarised as follows
(Armbrecht et al., 1990):
� extraction of approximately two-thirds of the activity in a single capillary transit;
� a very rapid initial washout phase (T1/2 < 5 s);
� activation of [1-11C]-acetate to [1-11C]-acetyl-CoA within a few seconds;
� labelling of TCA cycle intermediates takes several minutes;
� onset of rapid 11CO2 release after 2–3 min; and
� 11CO2 release is bi-exponential.
(C 3) In all the tissues studied, peak uptake appears to be reached within less than
3 min. After 3–5 min, 50% of the tissue activity is present as 11CO2, 24% as non-
ionised species, and 13% each as acetate and TCA-amino acid intermediates (Sun
et al., 1997). The rate of metabolism of the radiopharmaceutical reflects the rate
of oxidative metabolism in the tissue, and thus the oxygen supply.(C 4) Clinical studies indicate that in both myocardium and kidney parenchyma,
the initial uptake is complete by 2.5–3 min post injection, and that between 3 and 30
min, the 11C is lost from the tissues with a half-time of approximately 10 min. In nor-
mal pancreas, the uptake is also complete in 3 min, and up to 30 min, at least, the
activity is lost from the tissue with a half-time of 38 min. In the liver, uptake is again
rapid, peaking at approximately 3 min; thereafter, loss of 11C from the tissue follows
a tri-exponential clearance, with 35% being cleared with a half-time of 10 min and
the remainder with half-times of 1 (30%) and 2 h (35%).(C 5) Few data on the fractional deposition of [1-11C]-acetate in human tissues ap-
pear to be available in the literature. However, since there is a high extraction rate
for [1-11C]-acetate in most tissues and its rate of metabolism reflects the tissue oxygen
supply, the rate of blood flow, expressed as a fraction of cardiac output, in the tissue
may be used as an approximation of the tissue uptake of [1-11C]-acetate. Leggett and
51
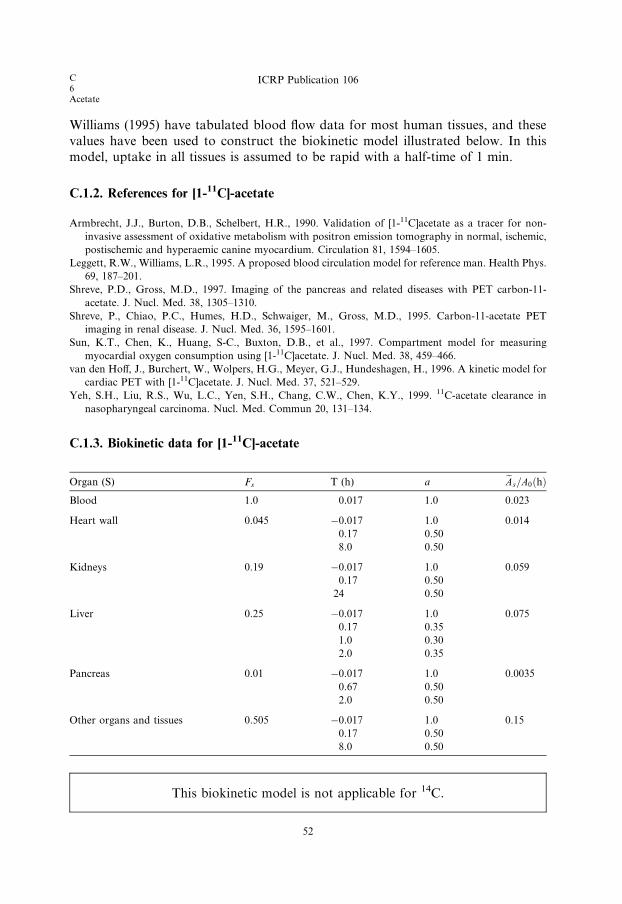
C6Acetate
ICRP Publication 106
Williams (1995) have tabulated blood flow data for most human tissues, and these
values have been used to construct the biokinetic model illustrated below. In this
model, uptake in all tissues is assumed to be rapid with a half-time of 1 min.
C.1.2. References for [1-11C]-acetate
Armbrecht, J.J., Burton, D.B., Schelbert, H.R., 1990. Validation of [1-11C]acetate as a tracer for non-
invasive assessment of oxidative metabolism with positron emission tomography in normal, ischemic,
postischemic and hyperaemic canine myocardium. Circulation 81, 1594–1605.
Leggett, R.W., Williams, L.R., 1995. A proposed blood circulation model for reference man. Health Phys.
69, 187–201.
Shreve, P.D., Gross, M.D., 1997. Imaging of the pancreas and related diseases with PET carbon-11-
acetate. J. Nucl. Med. 38, 1305–1310.
Shreve, P., Chiao, P.C., Humes, H.D., Schwaiger, M., Gross, M.D., 1995. Carbon-11-acetate PET
imaging in renal disease. J. Nucl. Med. 36, 1595–1601.
Sun, K.T., Chen, K., Huang, S-C., Buxton, D.B., et al., 1997. Compartment model for measuring
myocardial oxygen consumption using [1-11C]acetate. J. Nucl. Med. 38, 459–466.
van den Hoff, J., Burchert, W., Wolpers, H.G., Meyer, G.J., Hundeshagen, H., 1996. A kinetic model for
cardiac PET with [1-11C]acetate. J. Nucl. Med. 37, 521–529.
Yeh, S.H., Liu, R.S., Wu, L.C., Yen, S.H., Chang, C.W., Chen, K.Y., 1999. 11C-acetate clearance in
nasopharyngeal carcinoma. Nucl. Med. Commun 20, 131–134.
C.1.3. Biokinetic data for [1-11C]-acetate
Organ (S) Fs T (h) a eAs=A0ðhÞBlood 1.0 0.017 1.0 0.023
Heart wall 0.045 �0.017 1.0 0.014
0.17 0.50
8.0 0.50
Kidneys 0.19 �0.017 1.0 0.059
0.17 0.50
24 0.50
Liver 0.25 �0.017 1.0 0.075
0.17 0.35
1.0 0.30
2.0 0.35
Pancreas 0.01 �0.017 1.0 0.0035
0.67 0.50
2.0 0.50
Other organs and tissues 0.505 �0.017 1.0 0.15
0.17 0.50
8.0 0.50
This biokinetic model is not applicable for 14C.
52
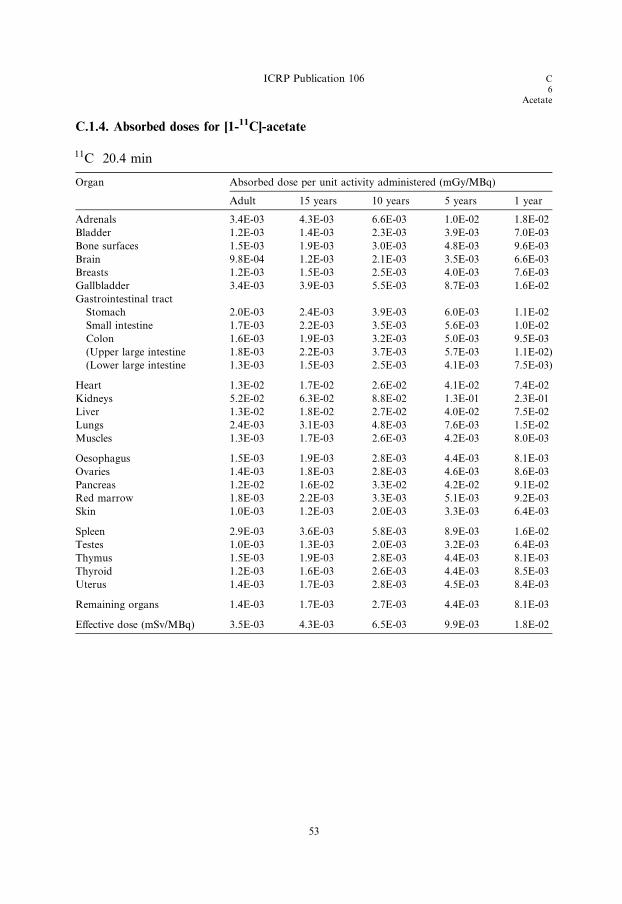
C.1.4. Absorbed doses for [1-11C]-acetate
11C 20.4 min
Organ Absorbed dose per unit activity administered (mGy/MBq)
Adult 15 years 10 years 5 years 1 year
Adrenals 3.4E-03 4.3E-03 6.6E-03 1.0E-02 1.8E-02
Bladder 1.2E-03 1.4E-03 2.3E-03 3.9E-03 7.0E-03
Bone surfaces 1.5E-03 1.9E-03 3.0E-03 4.8E-03 9.6E-03
Brain 9.8E-04 1.2E-03 2.1E-03 3.5E-03 6.6E-03
Breasts 1.2E-03 1.5E-03 2.5E-03 4.0E-03 7.6E-03
Gallbladder 3.4E-03 3.9E-03 5.5E-03 8.7E-03 1.6E-02
Gastrointestinal tract
Stomach 2.0E-03 2.4E-03 3.9E-03 6.0E-03 1.1E-02
Small intestine 1.7E-03 2.2E-03 3.5E-03 5.6E-03 1.0E-02
Colon 1.6E-03 1.9E-03 3.2E-03 5.0E-03 9.5E-03
(Upper large intestine 1.8E-03 2.2E-03 3.7E-03 5.7E-03 1.1E-02)
(Lower large intestine 1.3E-03 1.5E-03 2.5E-03 4.1E-03 7.5E-03)
Heart 1.3E-02 1.7E-02 2.6E-02 4.1E-02 7.4E-02
Kidneys 5.2E-02 6.3E-02 8.8E-02 1.3E-01 2.3E-01
Liver 1.3E-02 1.8E-02 2.7E-02 4.0E-02 7.5E-02
Lungs 2.4E-03 3.1E-03 4.8E-03 7.6E-03 1.5E-02
Muscles 1.3E-03 1.7E-03 2.6E-03 4.2E-03 8.0E-03
Oesophagus 1.5E-03 1.9E-03 2.8E-03 4.4E-03 8.1E-03
Ovaries 1.4E-03 1.8E-03 2.8E-03 4.6E-03 8.6E-03
Pancreas 1.2E-02 1.6E-02 3.3E-02 4.2E-02 9.1E-02
Red marrow 1.8E-03 2.2E-03 3.3E-03 5.1E-03 9.2E-03
Skin 1.0E-03 1.2E-03 2.0E-03 3.3E-03 6.4E-03
Spleen 2.9E-03 3.6E-03 5.8E-03 8.9E-03 1.6E-02
Testes 1.0E-03 1.3E-03 2.0E-03 3.2E-03 6.4E-03
Thymus 1.5E-03 1.9E-03 2.8E-03 4.4E-03 8.1E-03
Thyroid 1.2E-03 1.6E-03 2.6E-03 4.4E-03 8.5E-03
Uterus 1.4E-03 1.7E-03 2.8E-03 4.5E-03 8.4E-03
Remaining organs 1.4E-03 1.7E-03 2.7E-03 4.4E-03 8.1E-03
Effective dose (mSv/MBq) 3.5E-03 4.3E-03 6.5E-03 9.9E-03 1.8E-02
ICRP Publication 106 C6
Acetate
53


C6
Amino acids
C.2. 11C-labelled amino acids (generic model)11C
C.2.1. Biokinetic model
(C 6) The methionine analogue [75Se]-selenomethionine has been used in nuclear
medicine for many years (ICRP, 1987), and more recently, a number of other amino
acids labelled with 11C or 18F have been utilised, or proposed, for clinical applications
such as LL-[methyl-11C]-methionine (Deloar et al., 1998b), LL-[2-18F]-fluorotyrosine
(Coenen et al., 1989; Cottrall et al., 1973; Taylor and Cottrall, 1973), [18F]-p-fluoro-phenylalanine (Cottrall et al., 1973), 6-[18F]-fluorotryptophan (Atkins et al., 1972;
Taylor and Cottrall, 1973), cis-4-[18F]-fluoroproline and trans-4-[18F]-fluoroproline
(Wester et al., 1999a,b), and LL-3-[18F]-fluoro-a-methyl tyrosine (Inoue et al., 1996).
(C 7) The Commission has only published biokinetic models for [75Se]-selenomethi-
onine (ICRP, 1987) and LL-[methyl-11C]-methionine (ICRP, 2001b). Taylor (2000b)
developed the generic biokinetic model described below for use in assessment of the
internal dose received by human subjects injected intravenously with amino acids la-
belled with 11C, 18F, or 75Se. Comparison of the radiation doses to adults calculatedusing this generic model with those calculated using compound-specific models for
[11C]-labelled and [18F]-labelled amino acids and for [75Se]-selenomethionine indicated
that, in general, the effective doses, as well as the organ and tissue doses, calculated
using the generic model agreed within a factor of two or less with those calculated
using compound-specific models. It was further noted that the generic model tended
to overestimate, rather than underestimate, the organ and tissue doses. It was con-
cluded that for [11C]-, [18F]-, and [75Se]-labelled amino acids or their analogues, the
generic biokinetic model could be applied for general radiation protection purposes.(C 8) The generic model assumes that, following entry of a labelled amino acid
into the blood stream, the radiopharmaceutical is taken up instantaneously by the
organs and tissues. This is followed by a phase of rapid elimination of that fraction
of the injected material which goes directly into the excretory pathways or is excreted
following early metabolism, a second phase which represents loss due to metabolic
breakdown of labelled proteins and other compounds with relatively rapid turnover
times, and a final phase representing elimination of the small fraction of the radio-
nuclide which had been incorporated into structural proteins or other body compo-nents with very slow turnover.
(C 9) In the model, elimination of the radionuclide from the various organs and
tissues is assumed to approximate a three-component exponential relationship with
biological half-times of 0.5, 50, and 5000 days. The long biological half-time assigned
to the small final component of the model reflects the evidence that 14C incorporated
into structural tissues such as bone is retained with a very long half-time (Stenhouse
and Baxter, 1977; Stenstrom et al., 1996).
(C 10) The generic model assumes that 20% of the administered activity is excreteddirectly from the blood to the urinary bladder with biological half-times of 0.2 h
55
C6Amino acids
ICRP Publication 106
(0.25) and 6 h (0.75) in the blood. It has also been assumed that 3% of the injected
activity is excreted into the small intestine, half with a biological half-time of 6 h and
half with a biological half-time of 12 h. Since labelled amino acids are potentially
important for studies of protein synthesis in the brain (Bergmann et al., 1995;
Schmidt et al., 1997; Shoup et al., 1999), it was assumed that 1.5% of the injected
activity deposits in brain, from where it is released back to the circulation with bio-
logical half-times of 50 (70%) and 5000 days (30%). The parameters of this generic
model are shown in the biokinetic data table.(C 11) Taylor (2000b) pointed out that the biokinetic data from humans or ani-
mals that were used to derive both the compound-specific and the generic models
are subject to quite large uncertainties (coefficients of variation ranging from approx-
imately 20% to approximately 80%); therefore, when comparing doses calculated by
the generic and compound-specific biokinetic models, differences in individual tissue
or organ doses of a factor of two, or even three, should be regarded as good
agreement.
(C 12) This agreement appears to be close enough for the single generic biokineticmodel to be used for normal prospective radiation dosimetry, and for general assess-
ment of the risk from the use of amino acids labelled with 11C, 18F, or 75Se. In sit-
uations where compound-specific retrospective dosimetry is necessary, for example
in the case of accidental intake of a large amount of a radionuclide compound, it
might reasonably be expected that some subject- and compound-specific biokinetic
information would be available upon which a more accurate person-specific dose
assessment could be based.
This model is not appropriate for the interpretation of bio-assay data following
intake of 14C-labelled amino acids.
C.2.2. References for 11C-labelled amino acids
Atkins, H.L., Christman, D.R., Fowler, J.S., et al., 1972. Organic Radiopharmaceuticals Labeled with
Isotopes of Short Half-Life. V. 18F-Labeled 5- and 6-Fluorotryptophan. J. Nucl. Med. 13, 713–719.
Bergmann, R., Brust, P., Kampf, G., Coenen, H.H., Stocklin, G., 1995. Evaluation of radioselenium
labeled selenomethionine, a potential tracer for brain protein synthesis by PET. Nucl. Med. Biol. 22,
475–481.
Coenen, H.H., Kling, P., Stocklin, G., 1989. Cerebral metabolism of l-[2-18F]fluorotyrosine, a new PET
tracer of protein synthesis. J. Nucl. Med. 30, 1367–1372.
Cottrall, M.F., Taylor, D.M., McElwain, T.J., 1973. Investigations of 18F-p-fluorophenylalanine for
pancreas scanning. Br. J. Radiol. 46, 277–288.
Deloar, H.M., Fujiwara, T., Nakamura, T., Itoh, M., Imai, D., Miyake, M., Watanuki, S., 1998b.
Estimation of internal absorbed dose of l-[methyl-11C] methionine using whole body positron emission
tomography. Eur. J. Nucl. Med. 25, 629–633.
ICRP, 1987. Radiation dose to patients from radiopharmaceuticals. ICRP Publication 53. Ann. ICRP 18,
149–150.
Inoue, T., Tomiyoshi, K., Higuichi, T., Ahmed, K., Sarwar, M., Aoyagi, K., Amano, S., Alyafei, S.,
Zhang, H., Endo, K., 1996. Biodistribution studies on l-3-[fluorine-18]fluoro-a-methyl tyrosine: a
potential tumor-detecting agent. J. Nucl. Med. 39, 663–667.
56

ICRP Publication 106 C6
Amino acids
Schmidt, D., Langen, K-J., Herzog, H., Wirths, J., Holschbach, M., Kiwit, J.C.W., Ziemons, K., Coenen,
H.H., Muller-Gartner, H.W., 1997. Whole-body kinetics and dosimetry of l-3-[123I]iodo-a-methylty-
rosine. Eur. J. Nucl. Med. 24, 1162–1166.
Shoup, T.M., Olson, J., Hoffman, J.M., Votaw, J., Eshima, D., Eshima, L., Camp, M., Stabin, M., Votaw,
D., Goodman, M., 1999. Synthesis and evaluation of [18F]1-amino-3-fluorocyclobutane-1-carboxylic
acid to image brain tumours. J. Nucl. Med. 40, 331–338.
Stenhouse, M.J., Baxter, M.S., 1977. Bomb 14C as a biological tracer. Nature (Lond.) 267, 828–832.
Stenstrom, K., Leide-Svegborn, S., Erlandsson, B., Hellborg, R., Mattsson, S., Nilsson, L-E., Nosslin, B.,
Skog, G., Wiebert, A., 1996. Application of accelerator mass spectrometry (AMS) for high-sensitivity
measurements of 14CO2 in long-term studies of fat metabolism. Appl. Radiat. Isot. 47, 417–422.
Taylor, D.M., 2000b. Generic models for radionuclide dosimetry: 11C, 18F or 75Se-labelled amino acids.
Appl. Radiat. Isot. 52, 911–922.
Taylor, D.M., Cottrall, M.F., 1973. Evaluation of amino acids labelled with 18F for pancreas
scanningRadiopharmaceuticals and Labelled Compounds, Vol. I. IAEA, Vienna, pp. 441–443.
Wester, H.J., Herz, M., Senkowitsch-Schmidtke, R., Schwaiger, M., Stocklin, G., Hamacher, K., 1999a.
Preclinical evaluation of 4-[18F]fluoroprolines: diasteromeric effect on metabolism and uptake in mice.
Nucl. Med. Biol. 26, 259–265.
Wester, H.J., Herz, M., Weber, W., Heiss, P., Senkowitsch-Schmidtke, R., Schwaiger, M., Stocklin, G.,
1999b. Synthesis and radiopharmacology of O-(2-[18F]fluoroethyl)-LL-tyrosine for tumor imaging. J.
Nucl. Med. 40, 205–212.
57
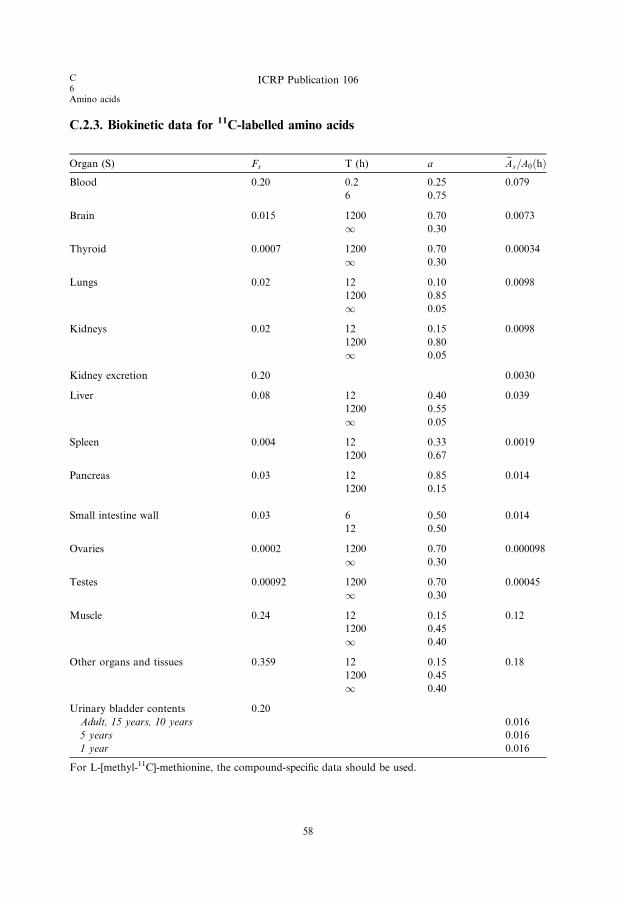
C.2.3. Biokinetic data for 11C-labelled amino acids
Organ (S) Fs T (h) a eAs=A0ðhÞBlood 0.20 0.2 0.25 0.079
6 0.75
Brain 0.015 1200 0.70 0.0073
1 0.30
Thyroid 0.0007 1200 0.70 0.00034
1 0.30
Lungs 0.02 12 0.10 0.0098
1200 0.85
1 0.05
Kidneys 0.02 12 0.15 0.0098
1200 0.80
1 0.05
Kidney excretion 0.20 0.0030
Liver 0.08 12 0.40 0.039
1200 0.55
1 0.05
Spleen 0.004 12 0.33 0.0019
1200 0.67
Pancreas 0.03 12 0.85 0.014
1200 0.15
Small intestine wall 0.03 6 0.50 0.014
12 0.50
Ovaries 0.0002 1200 0.70 0.000098
1 0.30
Testes 0.00092 1200 0.70 0.00045
1 0.30
Muscle 0.24 12 0.15 0.12
1200 0.45
1 0.40
Other organs and tissues 0.359 12 0.15 0.18
1200 0.45
1 0.40
Urinary bladder contents 0.20
Adult, 15 years, 10 years 0.016
5 years 0.016
1 year 0.016
For L-[methyl-11C]-methionine, the compound-specific data should be used.
58
C6Amino acids
ICRP Publication 106

C.2.4. Absorbed doses for 11C-labelled amino acids
11C 20.4 min
Organ Absorbed dose per unit activity administered (mGy/MBq)
Adult 15 years 10 years 5 years 1 year
Adrenals 4.5E-03 5.4E-03 8.4E-03 1.3E-02 2.4E-02
Bladder 1.3E-02 1.6E-02 2.4E-02 3.8E-02 7.1E-02
Bone surfaces 3.1E-03 3.7E-03 5.7E-03 8.8E-03 1.9E-02
Brain 2.3E-03 2.4E-03 2.9E-03 3.7E-03 5.9E-03
Breasts 2.3E-03 2.6E-03 4.0E-03 6.2E-03 1.2E-02
Gallbladder 4.1E-03 4.7E-03 7.3E-03 1.1E-02 2.0E-02
Gastrointestinal tract
Stomach 3.5E-03 3.9E-03 5.9E-03 9.0E-03 1.7E-02
Small intestine 7.3E-03 9.0E-03 1.5E-02 2.4E-02 4.8E-02
Colon 3.4E-03 3.8E-03 5.9E-03 9.1E-03 1.7E-02
(Upper large intestine 3.6E-03 4.0E-03 6.2E-03 9.7E-03 1.8E-02)
(Lower large intestine 3.2E-03 3.5E-03 5.5E-03 8.3E-03 1.5E-02)
Heart 6.0E-03 7.4E-03 1.1E-02 1.8E-02 3.3E-02
Kidneys 1.4E-02 1.7E-02 2.5E-02 3.8E-02 6.9E-02
Liver 9.0E-03 1.2E-02 1.8E-02 2.7E-02 5.2E-02
Lungs 6.3E-03 8.6E-03 1.3E-02 2.1E-02 4.1E-02
Muscles 2.3E-03 3.4E-03 6.5E-03 1.7E-02 2.9E-02
Oesophagus 2.8E-03 3.2E-03 4.8E-03 7.3E-03 1.4E-02
Ovaries 4.7E-03 4.7E-03 1.1E-02 1.9E-02 4.2E-02
Pancreas 4.1E-02 5.8E-02 1.2E-01 1.5E-01 3.4E-01
Red marrow 3.6E-03 4.1E-03 6.3E-03 9.6E-03 1.8E-02
Skin 2.1E-03 2.3E-03 3.6E-03 5.5E-03 1.1E-02
Spleen 6.3E-03 8.6E-03 1.3E-02 2.1E-02 3.9E-02
Testes 4.3E-03 9.2E-03 6.4E-02 7.4E-02 1.0E-01
Thymus 2.8E-03 3.2E-03 4.8E-03 7.3E-03 1.4E-02
Thyroid 5.2E-03 7.9E-03 1.2E-02 2.6E-02 5.0E-02
Uterus 3.6E-03 4.1E-03 6.5E-03 9.9E-03 1.9E-02
Remaining organs 2.6E-03 3.8E-03 6.8E-03 1.4E-02 2.2E-02
Effective dose (mSv/MBq) 5.6E-03 7.5E-03 1.8E-02 2.5E-02 4.5E-02
59
ICRP Publication 106 C6
Amino acids

C6
Brain receptor substances
C.3. 11C-labelled brain receptor substances (generic model)
11C
C.3.1. Biokinetic model
(C 13) A large number of radiopharmaceuticals labelled with 11C are being devel-
oped for PET studies of different types of receptor in the human brain. For most of
these agents, the available biokinetic data are insufficient to construct realisticcompound-specific biokinetic models for calculating the internal radiation dose
delivered to persons undergoing investigation. A generic model for brain receptor
substances that predicts the internal dose with sufficient accuracy for general
radiation protection purposes has, therefore, been developed (Nosslin et al., 2003).
(C 14) Biokinetic data for 13 11C radiopharmaceuticals used clinically for imaging
different brain receptors indicate that, despite differences in chemical structure, their
uptake and retention in the human brain and other tissues is broadly similar. The
adopted model assumes instantaneous deposition of 5% of the injected activity inthe brain, with the remaining activity being distributed rapidly and uniformly
throughout all other tissues. Elimination from all tissues is assumed to occur with
a half-time of 2 h. It is further assumed that 75% of the injected 11C is excreted in
urine, and 25% via the gallbladder, with a half-time of 2 h.
61

Table C.1. Brain receptor substances – comparison of 11C retention in brain up to approximately 90 min.
Substance Brain Other tissues Reference
Uptake (%) Tmax (h) Tb (h)
Acetylcholine esterase receptor agents
N-Methylpiperidyl-acetate
N-Methylpiperidyl-propionate
5 0.2 0.1–� No human information but
some animal data
Mulholland et al., 1995; Iyo
et al., 1997; Tanaka et al., 2001
Benzodiazepine receptor agents
Flumazenil 7 0.1 �0.5 No human data for
[11C]flumazenil, dosimetry
based on data for
[123I]flumazenil
Pappata et al., 1988; Persson
et al., 1989; Verhoeff et al.,
1993; Westera et al., 1996
Dopamine receptor agents
Raclopride 1.5 0.4 �3 No human data, data from
positron emission tomography
imaging in monkeys
Farde et al., 1986; Herscovitch
et al., 1997
FLB-457 5 0.3 0.5–12 No human data Votaw et al., 1995; Farde et al.,
1997; Olsson et al., 1999
Epidepride n.a. n.a. Human data for
[123I]epidepride
Spiperone 1 0.5 �0.5 Human data for
[76Br]spiperone, mouse data
for [11C]methylspiperone
Burns et al., 1984; ICRP, 1987
Dopamine transporter agents
Methylphenidate 9 0.1–0.2 1.25+ No human data Volkow et al., 1995
Opiate receptor agents
Carfentanil 3 0.1 1–2 Human data for plasma
clearance of fentanyl
McClain and Hug, 1980; Frost
et al., 1990; Kim et al., 1997
Serotonin receptor agents
OMeWAY-100634 9 0.1 �1 Human plasma clearance data Osman et al., 1996; Pike et al.,
1995; Wilson et al., 1998
COWAY 3-4 0.1 0.05–3 Human plasma clearance data Houle et al., 2000a
McN-5652 3 0.2 3+ No human data Szabo et al., 1999
DASB 8 0.8–1.8 No human data Houle et al., 2000b
n.a., not available.
62
C6Bra
inrecep
tor
sub
stan
ces
ICR
PP
ub
licatio
n1
06
ICRP Publication 106 C6
Brain receptor substances
C.3.2. References and further reading for 11C-labelled brain receptor substances
Burns, H.D., Dannals, R.F., Langstrom, B., Ravert, H.T., Zemyan, S.E., Duelfer, T., Wong, D.F., Frost,
J.J., Kuhar, M.J., Wagner, H.N., 1984. 3-N-[11C]methylspiperone, a ligand binding to dopamine
receptors: radiochemical synthesis and biodistribution studies in mice. J. Nucl. Med. 25, 1222–1227.
Farde, L., Hall, H., Ehrin, E., Sedvall, G., 1986. Quantitative analysis of D2 dopamine receptor binding in
the living human brain. Science 231, 258–261.
Farde, L., Suhara, T., Nyberg, S., Karlsson, P., Nakashima, Y., Hietala, J., Halldin, C., 1997. A PET
study of [11C]FLB 457 binding to extrastriatal D2-dopamine receptors in healthy subjects and
antipsychotic drug-treated patients. Psychopharmacology 133, 394–404.
Frost, J.J., Mayberg, H.S., Sadzot, B., Dannals, R.F., Lever, J.R., Ravert, H.T., Wilson, A.A., Wagner
Jr., H.N., Links, J.M., 1990. Comparison of [11C]diprenorphine and [11C]carfentanil binding to opiate
receptors in humans by positron emission tomography. J. Cereb. Blood Flow Metab. 10, 484–492.
Herscovitch, P., Schmall, B., Doudet, D., Carson, R., Eckelman, W., 1997. Biodistribution and radiation
dose estimates for [11-C]raclopride (abstract). J. Nucl. Med. 5 (Suppl.), 224.
Houle, S., DaSilva, J.N., Wilson, A.A., 2000a. Imaging the 5-HT1A receptors with PET: WAY-100635 and
analogues. Nucl. Med. Biol. 27, 463–466.
Houle, S., Ginovart, N., Hussey, D., Meyer, J.H., Wilson, A.A., 2000b. Imaging the serotonin transporter
system with positron emission tomography: initial human studies with [11C]DAPP and [11C]DASB.
Eur. J. Nucl. Med. 27, 1719–1722.
ICRP, 1987. Radiation dose to patients from radiopharmaceuticals. ICRP Publication 53. Ann. ICRP 18
(1–4).
Iyo, M., Namba, H., Fukushi, K., Shinotoh, H., Nagatsuka, S., Suhara, T., Sudo, Y., Suzuki, K., Irie, T.,
1997. Measurement of acetylcholinesterase by positron emission tomography in the brains of healthy
controls and patients with Alzheimer’s disease. Lancet 349, 1805–1809.
Kim, S., Wagner Jr., H.N., Villemagne, V.L., Kao, P-F., Dannals, R.F., Ravert, H.T., Joh, T., Dixon,
R.B., Civelik, A.C., 1997. Longer occupancy of opioid receptors by nalmefene compared to naloxone
as measured in vivo by a dual detector system. J. Nucl. Med. 38, 1726–1731.
McClain, D.A., Hug Jr., C.C., 1980. Intravenous fentanyl kinetics. Clin. Pharmacol. Ther. 28, 106–114.
Mulholland, G.K., Kilbourn, M.R., Sherman, P., Carey, J.E., Frey, K.A., Koeppe, R.A., Kuhl, D.E.,
1995. Synthesis, in vivo biodistribution and dosimetry of [11C]N-methylpiperidyl benzilate
([11C]NMPB), a muscarinic acetylcholine receptor antagonist. Nucl. Med. Biol. 22, 13–17.
Nosslin, B., Johansson, L., Leide-Svegborn, S., Liniecki, J., Mattsson, S., Taylor, D., 2003. A generic
model for 11C-labelled radiopharmaceuticals for imaging receptors in the human brain, Presented at
Workshop of Internal Dosimetry of Radionuclides in Oxford, 9–12 September 2002. Rad. Prot.
Dosim. 105, 587–591.
Olsson, H., Halldin, C., Swahn, G., Farde, L., 1999. Quantification of [11C]FLB 457 binding to
extrastriatal dopamine receptors in the human brain. J. Cereb. Blood Flow Metab. 19, 1164–1173.
Osman, S., Lundkvist, C., Pike, V.W., Halldin, C., McCarron, J.A., Swahn, C-G., Ginovart, N., Luthra,
S.K., Bench, C.J., Grasby, P.M., Wikstrom, H., Barf, T., Cliffe, I.A., Fletcher, A., Farde, L., 1996.
Characterization of the radioactive metabolites of the 5-HT1A receptor radioligand, [O-methy-11C]-
WAY-100635, in monkey and human plasma by HPLC: comparison of the behaviour of an identified
radioactive metabolite with parent radioligand in monkey using PET. Nucl. Med. Biol. 23, 627–634.
Pappata, S., Samson, Y., Chavoix, C., Prenant, C., Maziere, M., Baron, J.C., 1988. Regional specific
binding of [11C]RO 15 1788 to central type benzodiazepine receptors in human brain: quantitative
evaluation by PET. J. Cereb. Blood Flow Metab. 8, 304–313.
Persson, A., Pauli, S., Swahn, C.G., Halldin, C., Sedvall, G., 1989. Cerebral uptake of 11C-Ro 15 1788 and
its acid metabolite 11C-Ro 15 3890: PET study in human volunteers. Human Psychopharmacol. 4, 215–
220.
Pike, V.W., McCarron, J.A., Hume, S.P., Ashworth, S., Opacka-Juffry, J., Osman, S., Lammertsma, A.A.,
Poole, K.G., Fletcher, A., White, A.C., Cliffe, I.A., 1995. Preclinical development of a radioligand for
studies of central 5-HT1A receptors in vivo – [11C]WAY-100635. Med. Chem. Res. 5, 208–227.
63

C6Brain receptor substances
ICRP Publication 106
Szabo, Z., Scheffel, U., Mathews, W.B., Ravert, H.T., Szabo, K., Kraut, M., Palmon, S., Ricaurte, G.A.,
Dannals, R.F., 1999. Kinetic analysis of [11C]McN5652: a serotonin transporter radioligand. J. Cereb.
Blood Flow Metab. 19, 967–981.
Tanaka, N., Fukushi, K., Shinotoh, H., Nagatsuka, S., Namba, H., Iyo, M., Aotsuka, A., Ota, T.,
Tanada, S., Irie, T., 2001. Positron emission tomographic measurement of brain acetylcholinesterase
activity using N-[11C]methylpiperidin-4-yl acetate without arterial blood sampling: methodology of
shape analysis and its diagnostic power for Alzheimer’s disease. J. Cereb. Blood Flow Metab. 21, 295–
306.
Verhoeff, N.P., Buseman Sokole, E.B., Hengst, D., Stubbs, J.B., van Royen, E.A., 1993. Dosimetry of
iodine-123 iomazenil in humans. Eur. J. Nucl. Med. 20, 580–584.
Volkow, N.D., Ding, Y.-S., Fowler, J.S., Wang, G.-J., Logan, J., Gatley, S.J., Schlyer, D.J., Pappas, N.,
1995. A new PET ligand for the dopamine transporter: studies in human brain. J. Nucl. Med. 36, 2162–
2168.
Votaw, J.R., Ansari, M.S., Scott Mason, N., Schmidt, D., de Paulis, T., Holburn, G., Clanton, J.A.,
Votlaw, D.B., Manning, R.G., Kessler, R.M., 1995. Dosimetry of iodine-123-epidepride: a dopamine
D2 receptor ligand. J. Nucl. Med. 36, 1316–1321.
Westera, G., Buck, A., Burger, C., Leenders, K.L., von Schultness, G.K., Schubiger, A.P., 1996. Carbon-
11 and iodine-123 labelled iomazenil: a direct PET-SPECT comparison. Eur. J. Nucl. Med. 23, 5–12.
Wilson, A.A., Inaba, T., Fischer, N., Dixon, L.M., Nobrega, J., DaSilva, J.N., Houle, S., 1998.
Derivatives of WAY 100635 as potential imaging agents for 5-HT1A receptors: syntheses,
radiosyntheses, and in vitro and in vivo evaluation. Nucl. Med. Biol. 25, 769–776.
C.3.3. Biokinetic data for 11C-labelled brain receptor substances
Organ (S) Fs T (h) a eAs=A0ðhÞBrain 0.05 2.0 1.0 0.021
Other organs and tissues 0.95 2.0 1.0 0.40
Gallbladder contents 0.0875 0.0062
Gastrointestinal tract contents
Small intestine 0.25 0.010
Upper large intestine 0.25 0.0012
Urinary bladder contents 0.75
Adult, 15 years, 10 years 0.045
5 years 0.044
1 year 0.042
64
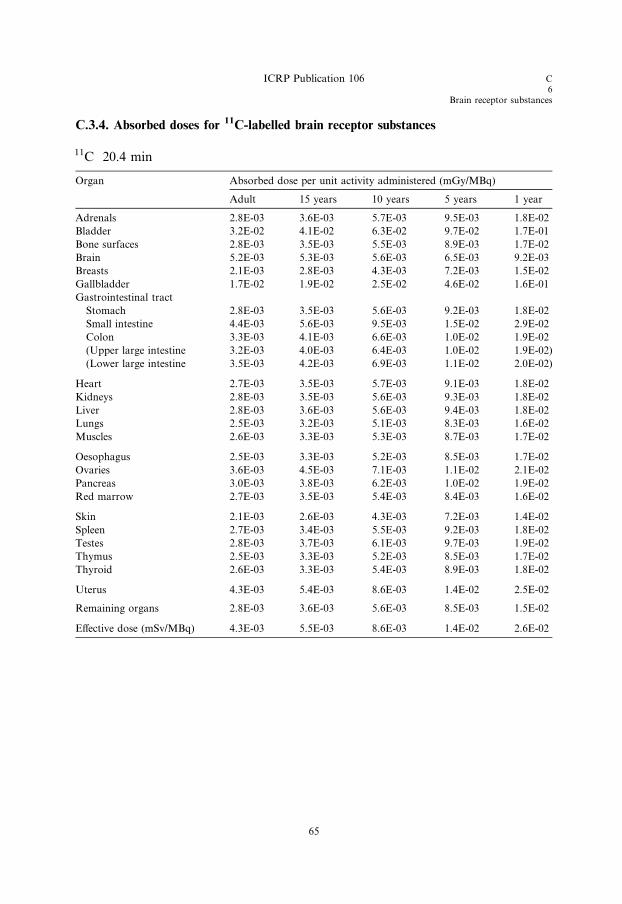
C.3.4. Absorbed doses for 11C-labelled brain receptor substances
11C 20.4 min
Organ Absorbed dose per unit activity administered (mGy/MBq)
Adult 15 years 10 years 5 years 1 year
Adrenals 2.8E-03 3.6E-03 5.7E-03 9.5E-03 1.8E-02
Bladder 3.2E-02 4.1E-02 6.3E-02 9.7E-02 1.7E-01
Bone surfaces 2.8E-03 3.5E-03 5.5E-03 8.9E-03 1.7E-02
Brain 5.2E-03 5.3E-03 5.6E-03 6.5E-03 9.2E-03
Breasts 2.1E-03 2.8E-03 4.3E-03 7.2E-03 1.5E-02
Gallbladder 1.7E-02 1.9E-02 2.5E-02 4.6E-02 1.6E-01
Gastrointestinal tract
Stomach 2.8E-03 3.5E-03 5.6E-03 9.2E-03 1.8E-02
Small intestine 4.4E-03 5.6E-03 9.5E-03 1.5E-02 2.9E-02
Colon 3.3E-03 4.1E-03 6.6E-03 1.0E-02 1.9E-02
(Upper large intestine 3.2E-03 4.0E-03 6.4E-03 1.0E-02 1.9E-02)
(Lower large intestine 3.5E-03 4.2E-03 6.9E-03 1.1E-02 2.0E-02)
Heart 2.7E-03 3.5E-03 5.7E-03 9.1E-03 1.8E-02
Kidneys 2.8E-03 3.5E-03 5.6E-03 9.3E-03 1.8E-02
Liver 2.8E-03 3.6E-03 5.6E-03 9.4E-03 1.8E-02
Lungs 2.5E-03 3.2E-03 5.1E-03 8.3E-03 1.6E-02
Muscles 2.6E-03 3.3E-03 5.3E-03 8.7E-03 1.7E-02
Oesophagus 2.5E-03 3.3E-03 5.2E-03 8.5E-03 1.7E-02
Ovaries 3.6E-03 4.5E-03 7.1E-03 1.1E-02 2.1E-02
Pancreas 3.0E-03 3.8E-03 6.2E-03 1.0E-02 1.9E-02
Red marrow 2.7E-03 3.5E-03 5.4E-03 8.4E-03 1.6E-02
Skin 2.1E-03 2.6E-03 4.3E-03 7.2E-03 1.4E-02
Spleen 2.7E-03 3.4E-03 5.5E-03 9.2E-03 1.8E-02
Testes 2.8E-03 3.7E-03 6.1E-03 9.7E-03 1.9E-02
Thymus 2.5E-03 3.3E-03 5.2E-03 8.5E-03 1.7E-02
Thyroid 2.6E-03 3.3E-03 5.4E-03 8.9E-03 1.8E-02
Uterus 4.3E-03 5.4E-03 8.6E-03 1.4E-02 2.5E-02
Remaining organs 2.8E-03 3.6E-03 5.6E-03 8.5E-03 1.5E-02
Effective dose (mSv/MBq) 4.3E-03 5.5E-03 8.6E-03 1.4E-02 2.6E-02
ICRP Publication 106 C6
Brain receptor substances
65

C6Brain receptor substances
ICRP Publication 106C6Brain receptor substances
ICRP Publication 106

C6
Methionine
C.4. L-[Methyl-11C]-methionine11C
C.4.1. Biokinetic model
(C 15) The amino acid L-[methyl-11C]-methionine can be applied in tumour diag-
nosis and to the study of protein synthesis using PET. Deloar et al. (1998b) reported
quantitative PET studies on the distribution of L-[methyl-11C]-methionine in five
healthy, male volunteers, aged 22–40 years. The data suggested that approximately
90% of the activity was lost from all tissues during the first 90 min after injection,
with biological half-times of approximately 20–30 min. Thereafter, the activity ap-
peared to be lost more slowly, with a half-time that could be considered to be long
in relation to the physical half-life of 11C.(C 16) The biokinetic model presented below was developed on the basis of the
human data of Deloar et al. (1998b). In the study of Deloar et al., the uptake of
L-[methyl-11C]-methionine into the brains of the five volunteers was estimated to
be 2.8 ± 0.7% of the injected activity; some seven times higher than the value of
0.4% previously estimated by Comar et al. (1976).
C.4.2. References for L-[methyl-11C]-methionine
Comar, D., Catron, J.C., Maziere, M., Marazanop, C., 1976. Labelling and metabolism of methionine-
methyl-11C. Eur. J. Nucl. Med. 1, 11–14.
Deloar, H.M., Fujiwara, T., Nakamura, T., Itoh, M., Imai, D., Miyake, M., Watanuki, S., 1998b.
Estimation of internal absorbed dose of L-[methyl-11C]-methionine using whole body positron
emission tomography. Eur. J Nucl. Med. 25, 629–633.
67

C.4.3. Biokinetic data for L-[methyl-11C]-methionine
Organ (S) Fs T (h) a eAs=A0ðhÞBrain 0.030 0.4 0.90 0.0086
12 0.10
Lungs 0.050 0.4 0.90 0.014
12 0.10
Kidneys 0.022 0.4 0.90 0.0063
12 0.10
Kidney excretion 0.026
Liver 0.22 0.4 0.90 0.063
12 0.10
Spleen 0.010 0.4 0.90 0.0029
12 0.10
Pancreas 0.016 0.4 0.90 0.0046
12 0.10
Other organs and tissues 0.652 0.4 0.90 0.19
12 0.10
Gallbladder contents 0.077 0.0033
Gastrointestinal tract contents
Small intestine 0.22 0.0055
Upper large intestine 0.22 0.00064
Lower large intestine 0.22 0.000024
Urinary bladder contents 0.78
Adult, 15 years, 10 years 0.13
5 years 0.13
1 year 0.13
This biokinetic model is not applicable for 14C.
C6Methionine
ICRP Publication 106
68
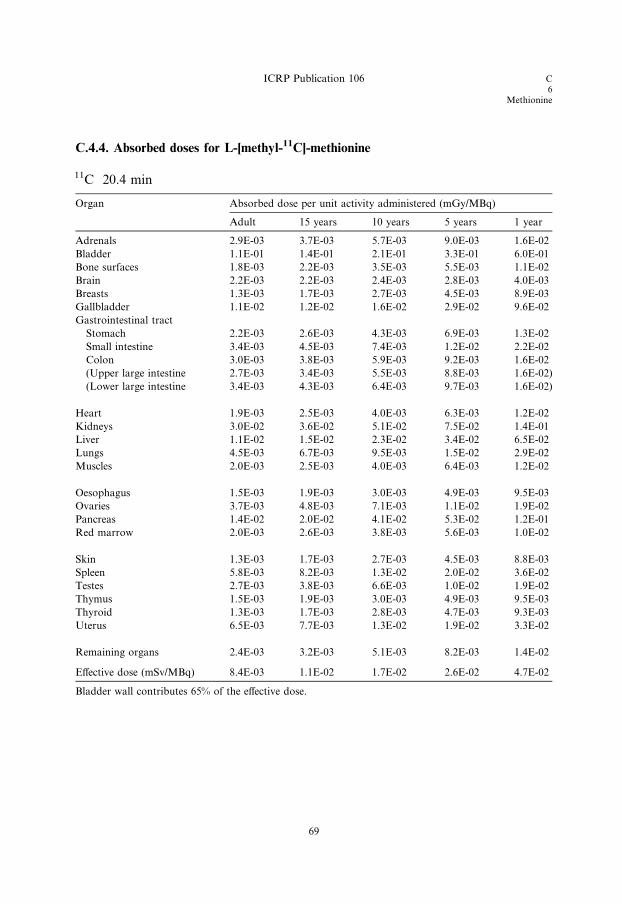
C.4.4. Absorbed doses for L-[methyl-11C]-methionine
11C 20.4 min
Organ Absorbed dose per unit activity administered (mGy/MBq)
Adult 15 years 10 years 5 years 1 year
Adrenals 2.9E-03 3.7E-03 5.7E-03 9.0E-03 1.6E-02
Bladder 1.1E-01 1.4E-01 2.1E-01 3.3E-01 6.0E-01
Bone surfaces 1.8E-03 2.2E-03 3.5E-03 5.5E-03 1.1E-02
Brain 2.2E-03 2.2E-03 2.4E-03 2.8E-03 4.0E-03
Breasts 1.3E-03 1.7E-03 2.7E-03 4.5E-03 8.9E-03
Gallbladder 1.1E-02 1.2E-02 1.6E-02 2.9E-02 9.6E-02
Gastrointestinal tract
Stomach 2.2E-03 2.6E-03 4.3E-03 6.9E-03 1.3E-02
Small intestine 3.4E-03 4.5E-03 7.4E-03 1.2E-02 2.2E-02
Colon 3.0E-03 3.8E-03 5.9E-03 9.2E-03 1.6E-02
(Upper large intestine 2.7E-03 3.4E-03 5.5E-03 8.8E-03 1.6E-02)
(Lower large intestine 3.4E-03 4.3E-03 6.4E-03 9.7E-03 1.6E-02)
Heart 1.9E-03 2.5E-03 4.0E-03 6.3E-03 1.2E-02
Kidneys 3.0E-02 3.6E-02 5.1E-02 7.5E-02 1.4E-01
Liver 1.1E-02 1.5E-02 2.3E-02 3.4E-02 6.5E-02
Lungs 4.5E-03 6.7E-03 9.5E-03 1.5E-02 2.9E-02
Muscles 2.0E-03 2.5E-03 4.0E-03 6.4E-03 1.2E-02
Oesophagus 1.5E-03 1.9E-03 3.0E-03 4.9E-03 9.5E-03
Ovaries 3.7E-03 4.8E-03 7.1E-03 1.1E-02 1.9E-02
Pancreas 1.4E-02 2.0E-02 4.1E-02 5.3E-02 1.2E-01
Red marrow 2.0E-03 2.6E-03 3.8E-03 5.6E-03 1.0E-02
Skin 1.3E-03 1.7E-03 2.7E-03 4.5E-03 8.8E-03
Spleen 5.8E-03 8.2E-03 1.3E-02 2.0E-02 3.6E-02
Testes 2.7E-03 3.8E-03 6.6E-03 1.0E-02 1.9E-02
Thymus 1.5E-03 1.9E-03 3.0E-03 4.9E-03 9.5E-03
Thyroid 1.3E-03 1.7E-03 2.8E-03 4.7E-03 9.3E-03
Uterus 6.5E-03 7.7E-03 1.3E-02 1.9E-02 3.3E-02
Remaining organs 2.4E-03 3.2E-03 5.1E-03 8.2E-03 1.4E-02
Effective dose (mSv/MBq) 8.4E-03 1.1E-02 1.7E-02 2.6E-02 4.7E-02
Bladder wall contributes 65% of the effective dose.
ICRP Publication 106 C6
Methionine
69

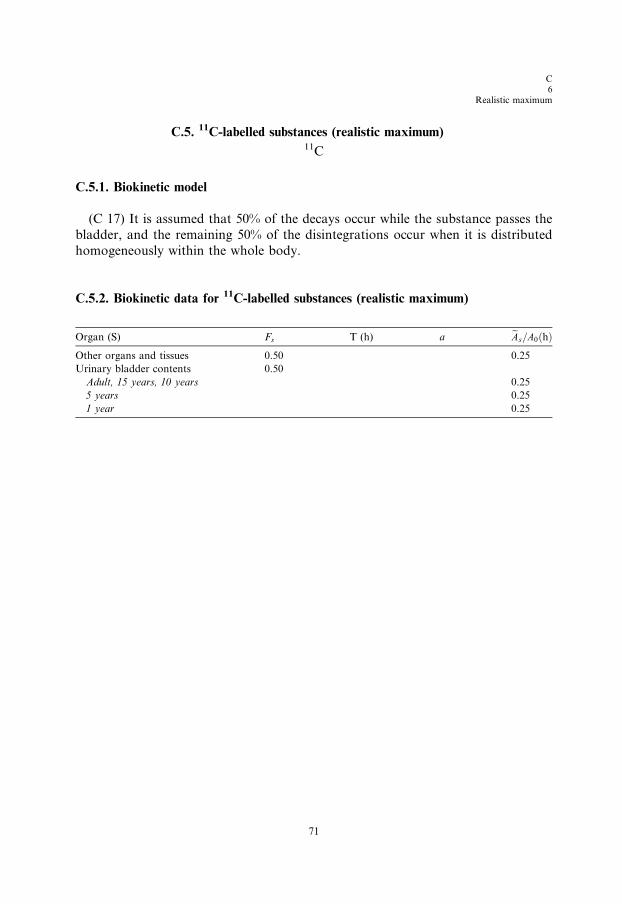
C6
Realistic maximum
C.5. 11C-labelled substances (realistic maximum)11C
C.5.1. Biokinetic model
(C 17) It is assumed that 50% of the decays occur while the substance passes the
bladder, and the remaining 50% of the disintegrations occur when it is distributed
homogeneously within the whole body.
C.5.2. Biokinetic data for 11C-labelled substances (realistic maximum)
Organ (S) F T (h) a eA =A ðhÞ
s71
s 0
Other organs and tissues
0.50 0.25Urinary bladder contents
0.50Adult, 15 years, 10 years
0.255 years
0.251 year
0.25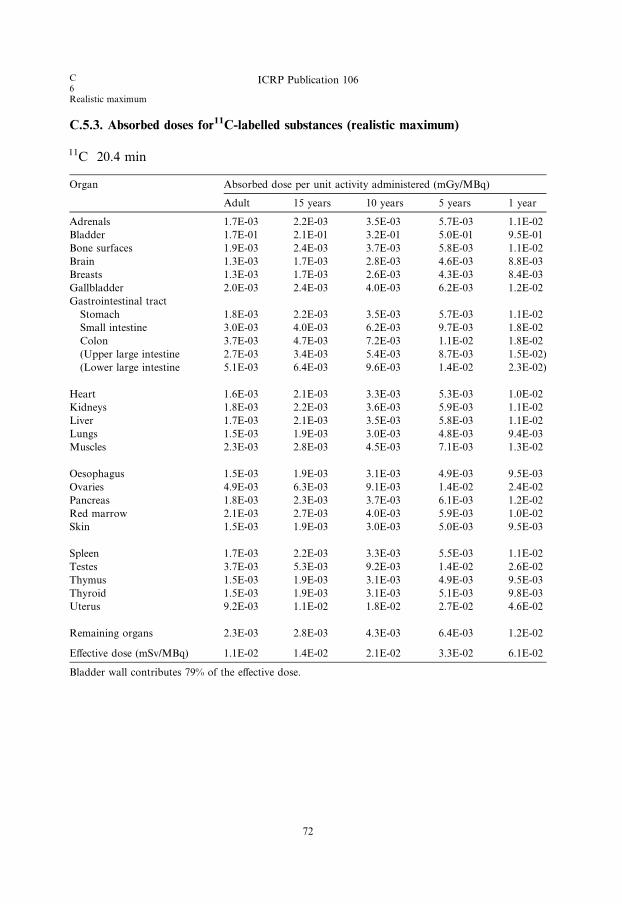
C6Realistic maximum
ICRP Publication 106
C.5.3. Absorbed doses for11C-labelled substances (realistic maximum)
11C 20.4 min
Organ
Absorbed dose per unit activity administered (mGy/MBq)Adult
15 years72
10 years
5 years 1 yearAdrenals
1.7E-03 2.2E-03 3.5E-03 5.7E-03 1.1E-02Bladder
1.7E-01 2.1E-01 3.2E-01 5.0E-01 9.5E-01Bone surfaces
1.9E-03 2.4E-03 3.7E-03 5.8E-03 1.1E-02Brain
1.3E-03 1.7E-03 2.8E-03 4.6E-03 8.8E-03Breasts
1.3E-03 1.7E-03 2.6E-03 4.3E-03 8.4E-03Gallbladder
2.0E-03 2.4E-03 4.0E-03 6.2E-03 1.2E-02Gastrointestinal tract
Stomach
1.8E-03 2.2E-03 3.5E-03 5.7E-03 1.1E-02Small intestine
3.0E-03 4.0E-03 6.2E-03 9.7E-03 1.8E-02Colon
3.7E-03 4.7E-03 7.2E-03 1.1E-02 1.8E-02(Upper large intestine
2.7E-03 3.4E-03 5.4E-03 8.7E-03 1.5E-02)(Lower large intestine
5.1E-03 6.4E-03 9.6E-03 1.4E-02 2.3E-02)Heart
1.6E-03 2.1E-03 3.3E-03 5.3E-03 1.0E-02Kidneys
1.8E-03 2.2E-03 3.6E-03 5.9E-03 1.1E-02Liver
1.7E-03 2.1E-03 3.5E-03 5.8E-03 1.1E-02Lungs
1.5E-03 1.9E-03 3.0E-03 4.8E-03 9.4E-03Muscles
2.3E-03 2.8E-03 4.5E-03 7.1E-03 1.3E-02Oesophagus
1.5E-03 1.9E-03 3.1E-03 4.9E-03 9.5E-03Ovaries
4.9E-03 6.3E-03 9.1E-03 1.4E-02 2.4E-02Pancreas
1.8E-03 2.3E-03 3.7E-03 6.1E-03 1.2E-02Red marrow
2.1E-03 2.7E-03 4.0E-03 5.9E-03 1.0E-02Skin
1.5E-03 1.9E-03 3.0E-03 5.0E-03 9.5E-03Spleen
1.7E-03 2.2E-03 3.3E-03 5.5E-03 1.1E-02Testes
3.7E-03 5.3E-03 9.2E-03 1.4E-02 2.6E-02Thymus
1.5E-03 1.9E-03 3.1E-03 4.9E-03 9.5E-03Thyroid
1.5E-03 1.9E-03 3.1E-03 5.1E-03 9.8E-03Uterus
9.2E-03 1.1E-02 1.8E-02 2.7E-02 4.6E-02Remaining organs
2.3E-03 2.8E-03 4.3E-03 6.4E-03 1.2E-02Effective dose (mSv/MBq)
1.1E-02 1.4E-02 2.1E-02 3.3E-02 6.1E-02Bladder wall contributes 79% of the effective dose.
O8
Water
C.6. 15O-water15O
C.6.1. Biokinetic model
(C 18) Water labelled with 15O is widely used to evaluate regional cerebral blood
flow using PET, and has been proposed for blood flow measurement in other organs
and tissues. Early biokinetic models based on equilibrium tracer distribution in bodywater are inaccurate for use with 15O-water. On account of the short half-life of 15O
(2.04 min), uniform radionuclide concentration in body water is not attained; conse-
quently, such models underestimate dose values for this substance.
(C 19) A more satisfactory method of kinetic modelling is based on organ blood
flow rates. Using this model, the concentration of 15O-water in a given organ is
derived by convolution of the arterial blood concentration (arterial input function)
and the transit time function (impulse response) of the organ. The latter is given by
exp[� (F/Vd + k)t], where F (ml min�1g�1) is the organ blood flow, Vd (ml g tissue�1/ml · ml blood�1) is its relative water distribution space, and k (min�1) is the
radioactive decay constant of 15O. Thus, following intravenous administration of15O-water and measurement of the arterial blood concentration, a retention equation
can be derived for organs for which values of F and Vd are known.
(C 20) In practice, a measured amount of 15O-water activity is injected via a fore-
arm vein, and the arterial blood concentration is monitored continuously from the
other forearm. Residence time (min) in a given organ is calculated as the product
of the areas under the curves of the arterial input function (min ml�1 normalisedper administered MBq) and the organ transit time function (min), multiplied by
the total blood flow to the organ (ml min�1). The latter is given by F · M, where
M is the mass (g) of the organ. The table lists organ residence times that lead to
organ doses equal to the mean values that have been estimated using the blood flow
model at four different centres (Berridge et al., 1991; Herscovitch et al., 1993; Brihaye
et al., 1995; Eichling et al., 1997). Direct measurements of the retention in some
organs by PET (Smith et al., 1994) have shown good agreement with the model
for brain, heart, liver, and spleen.
C.6.2. References for 15O-water
Berridge, M.S., Adler, L.P., Rao, P.S., 1991. Radiation absorbed dose for O-15-butanol and O-15 water
estimated by positron emission tomography. J. Nucl. Med. 32, 1043.
Brihaye, C., Depresseux, J.C., Comar, D., 1995. Radiation dosimetry for bolus administration of oxygen-
15 water. J. Nucl. Med. 36, 651–656.
Eichling, J.O., Bergman, S.R., Schwarz, S.W., Siegel, B.A. 1997. Equivalent dose estimates in adults for
intravenously administered O-15 water. Unpublished; personal communication through S. Schwarz..
Herscovitch, P., Carson, R.E., Stabin, M., et al., 1993. A new kinetic approach to estimate the radiation
dosimetry of flow-based radiotracers. J. Nucl. Med. 34, 155P.
73
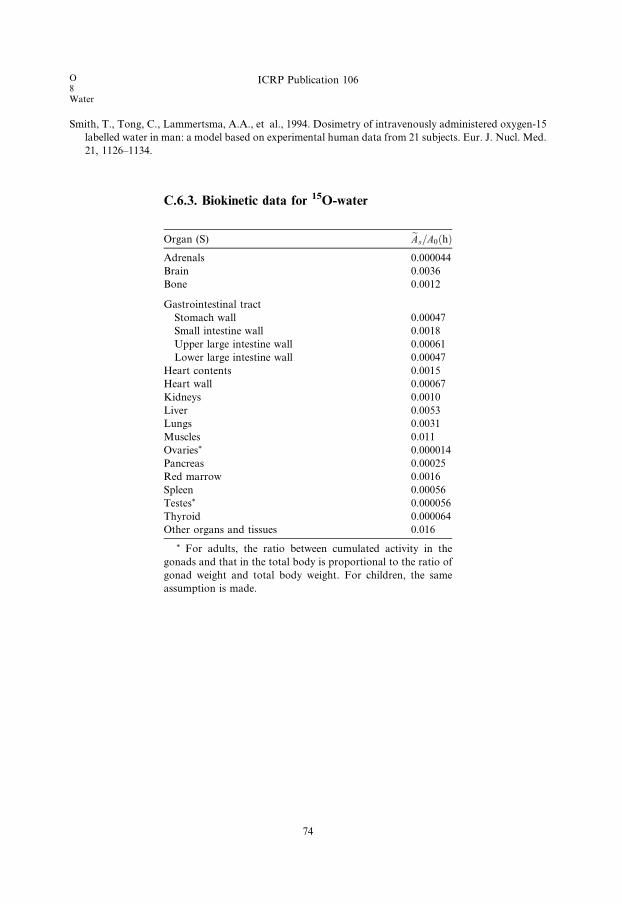
O8Water
ICRP Publication 106
Smith, T., Tong, C., Lammertsma, A.A., et al., 1994. Dosimetry of intravenously administered oxygen-15
labelled water in man: a model based on experimental human data from 21 subjects. Eur. J. Nucl. Med.
21, 1126–1134.
C.6.3. Biokinetic data for 15O-water
Organ (S) eAs=A0ðhÞAdrenals 0.000044
Brain 0.0036
Bone 0.0012
Gastrointestinal tract
Stomach wall 0.00047
Small intestine wall 0.0018
Upper large intestine wall 0.00061
Lower large intestine wall 0.00047
Heart contents 0.0015
Heart wall 0.00067
Kidneys 0.0010
Liver 0.0053
Lungs 0.0031
Muscles 0.011
Ovaries* 0.000014
Pancreas 0.00025
Red marrow 0.0016
Spleen 0.00056
Testes* 0.000056
Thyroid 0.000064
Other organs and tissues 0.016
* For adults, the ratio between cumulated activity in the
gonads and that in the total body is proportional to the ratio of
gonad weight and total body weight. For children, the same
assumption is made.
74
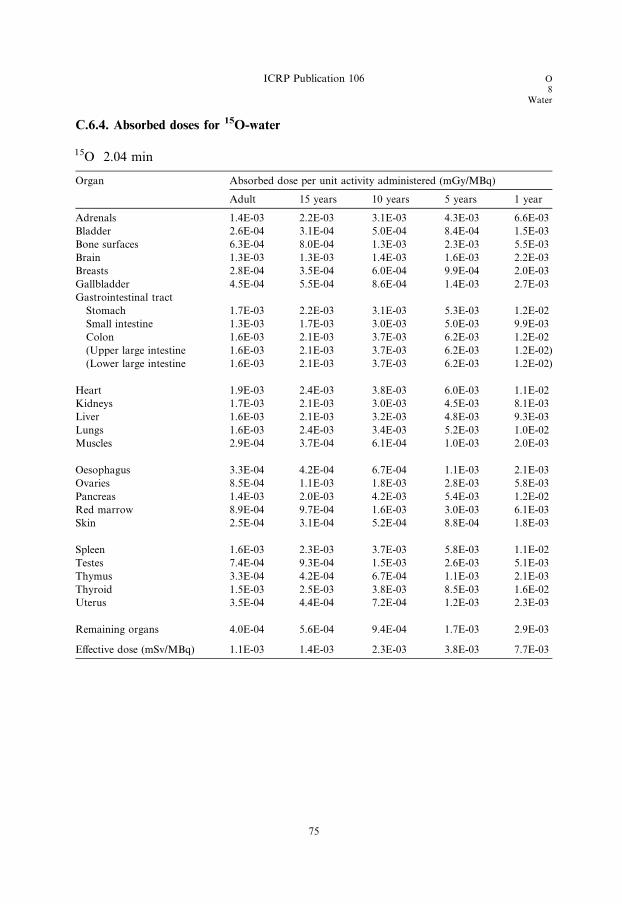
C.6.4. Absorbed doses for 15O-water
15O 2.04 min
Organ Absorbed dose per unit activity administered (mGy/MBq)
Adult 15 years 10 years 5 years 1 year
Adrenals 1.4E-03 2.2E-03 3.1E-03 4.3E-03 6.6E-03
Bladder 2.6E-04 3.1E-04 5.0E-04 8.4E-04 1.5E-03
Bone surfaces 6.3E-04 8.0E-04 1.3E-03 2.3E-03 5.5E-03
Brain 1.3E-03 1.3E-03 1.4E-03 1.6E-03 2.2E-03
Breasts 2.8E-04 3.5E-04 6.0E-04 9.9E-04 2.0E-03
Gallbladder 4.5E-04 5.5E-04 8.6E-04 1.4E-03 2.7E-03
Gastrointestinal tract
Stomach 1.7E-03 2.2E-03 3.1E-03 5.3E-03 1.2E-02
Small intestine 1.3E-03 1.7E-03 3.0E-03 5.0E-03 9.9E-03
Colon 1.6E-03 2.1E-03 3.7E-03 6.2E-03 1.2E-02
(Upper large intestine 1.6E-03 2.1E-03 3.7E-03 6.2E-03 1.2E-02)
(Lower large intestine 1.6E-03 2.1E-03 3.7E-03 6.2E-03 1.2E-02)
Heart 1.9E-03 2.4E-03 3.8E-03 6.0E-03 1.1E-02
Kidneys 1.7E-03 2.1E-03 3.0E-03 4.5E-03 8.1E-03
Liver 1.6E-03 2.1E-03 3.2E-03 4.8E-03 9.3E-03
Lungs 1.6E-03 2.4E-03 3.4E-03 5.2E-03 1.0E-02
Muscles 2.9E-04 3.7E-04 6.1E-04 1.0E-03 2.0E-03
Oesophagus 3.3E-04 4.2E-04 6.7E-04 1.1E-03 2.1E-03
Ovaries 8.5E-04 1.1E-03 1.8E-03 2.8E-03 5.8E-03
Pancreas 1.4E-03 2.0E-03 4.2E-03 5.4E-03 1.2E-02
Red marrow 8.9E-04 9.7E-04 1.6E-03 3.0E-03 6.1E-03
Skin 2.5E-04 3.1E-04 5.2E-04 8.8E-04 1.8E-03
Spleen 1.6E-03 2.3E-03 3.7E-03 5.8E-03 1.1E-02
Testes 7.4E-04 9.3E-04 1.5E-03 2.6E-03 5.1E-03
Thymus 3.3E-04 4.2E-04 6.7E-04 1.1E-03 2.1E-03
Thyroid 1.5E-03 2.5E-03 3.8E-03 8.5E-03 1.6E-02
Uterus 3.5E-04 4.4E-04 7.2E-04 1.2E-03 2.3E-03
Remaining organs 4.0E-04 5.6E-04 9.4E-04 1.7E-03 2.9E-03
Effective dose (mSv/MBq) 1.1E-03 1.4E-03 2.3E-03 3.8E-03 7.7E-03
ICRP Publication 106 O8
Water
75

F9
Amino acids
C.7. 18F-labelled amino acids (generic model)18F
C.7.1. Biokinetic model
(C 21) The generic biokinetic model for 18F-labelled amino acids is the same as the
generic biokinetic model for 11C-labelled amino acids (see Section C.2.1).
C.7.2. Further reading for 18F-labelled amino acids
Coenen, H.H., Kling, P., Stocklin, G., 1989. Cerebral metabolism of l-[2-18F]Fluorotyrosine, a new PET
tracer of protein synthesis. J. Nucl. Med. 30, 1367–1372.
Cottrall, M.F., Taylor, D.M., McElwain, T.J., 1973. Investigations of 18F-p-fluorophenylalanine for
pancreas scanning. Br. J. Radiol. 46, 277–288.
ICRP, 1987. Radiation dose to patients from radiopharmaceuticals. ICRP Publication 53. Ann. ICRP 18
(1–4), 149–150.
ICRP, 2001b. Radiation dose to patients from radiopharmaceuticals. Addendum 4 to ICRP Publication,
53.
Inoue, T., Tomiyoshi, K., Higuichi, T., Ahmed, K., Sarwar, M., Aoyagi, K., Amano, S., Alyafei, S.,
Zhang, H., Endo, K., 1996. Biodistribution studies on l-3-[Fluorine-18]fluoro-a-methyl tyrosine: a
potential tumor-detecting agent. J. Nucl. Med. 39, 663–667.
Schmidt, D., Langen, K-J., Herzog, H., Wirths, J., Holschbach, M., Kiwit, J.C.W., Ziemons, K., Coenen,
H.H., Muller-Gartner, H.W., 1997. Whole-body kinetics and dosimetry of l-3-[123I]iodo-a-methylty-
rosine. Eur. J. Nucl. Med. 24, 1162–1166.
Shoup, T.M., Olson, J., Hoffman, J.M., Votaw, J., Eshima, D., Eshima, L., Camp, M., Stabin, M., Votaw,
D., Goodman, M., 1999. Synthesis and evaluation of [18F]1-Amino-3-fluorocyclobutane-1-carboxylic
acid to image brain tumours. J. Nucl. Med. 40, 331–338.
Stenhouse, M.J., Baxter, M.S., 1977. Bomb 14C as a biological tracer. Nature (Lond.) 267, 828–832.
Stenstrom, K., Leide-Svegborn, S., Erlandsson, B., Hellborg, R., Mattsson, S., Nilsson, L-E., Nosslin, B.,
Skog, G., Wiebert, A., 1996. Application of accelerator mass spectrometry (AMS) for high-sensitivity
measurements of 14CO2 in long-term studies of fat metabolism. Appl. Radiat. Isot. 47, 417–422.
Taylor, D.M., 2000b. Generic models for radionuclide dosimetry: 11C, 18F or 75Se-labelled amino acids.
Appl. Radiat. Isot. 52, 911–922.
Taylor, D.M., Cottrall, M.F., 1973. Evaluation of amino acids labelled with 18F for pancreas
scanningRadiopharmaceuticals and Labelled Compounds, Vol. I. IAEA, Vienna, pp. 441–443.
Wester, H.J., Herz, M., Senkowitsch-Schmidtke, R., Schwaiger, M., Stocklin, G., Hamacher, K., 1999a.
Preclinical evaluation of 4-[18F]fluoroprolines: diasteromeric effect on metabolism and uptake in mice.
Nucl. Med. Biol. 26, 259–265.
Wester, H.J., Herz, M., Weber, W., Heiss, P., Senkowitsch-Schmidtke, R., Schwaiger, M., Stocklin, G.,
1999b. Synthesis and radiopharmacology of O-(2-[18F]fluoroethyl)-LL-tyrosine for tumor imaging. J.
Nucl. Med. 40, 205–212.
77
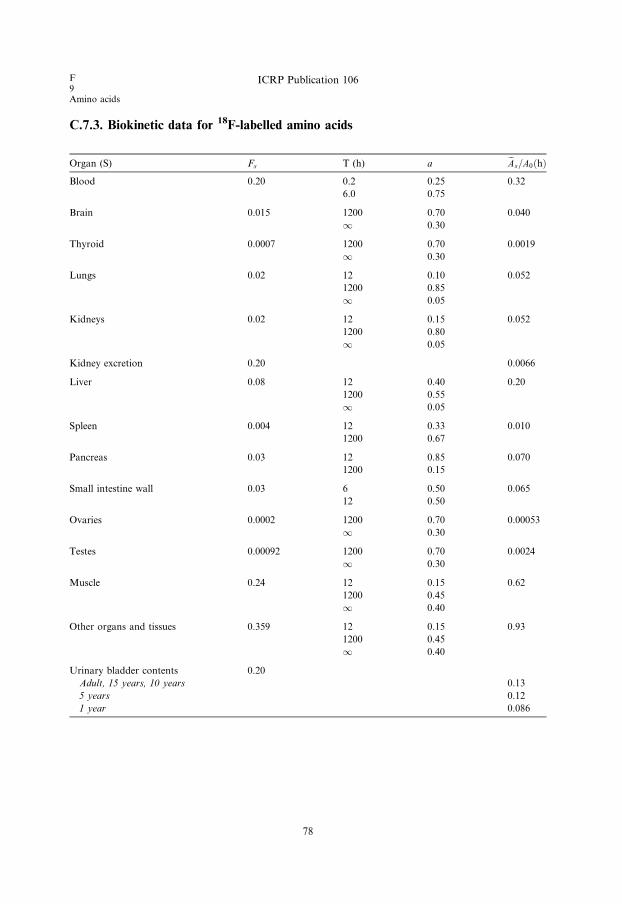
C.7.3. Biokinetic data for 18F-labelled amino acids
Organ (S) Fs T (h) a eAs=A0ðhÞ
Blood 0.20 0.2 0.25 0.32
6.0 0.75
Brain 0.015 1200 0.70 0.040
1 0.30
Thyroid 0.0007 1200 0.70 0.0019
1 0.30
Lungs 0.02 12 0.10 0.052
1200 0.85
1 0.05
Kidneys 0.02 12 0.15 0.052
1200 0.80
1 0.05
Kidney excretion 0.20 0.0066
Liver 0.08 12 0.40 0.20
1200 0.55
1 0.05
Spleen 0.004 12 0.33 0.010
1200 0.67
Pancreas 0.03 12 0.85 0.070
1200 0.15
Small intestine wall 0.03 6 0.50 0.065
12 0.50
Ovaries 0.0002 1200 0.70 0.00053
1 0.30
Testes 0.00092 1200 0.70 0.0024
1 0.30
Muscle 0.24 12 0.15 0.62
1200 0.45
1 0.40
Other organs and tissues 0.359 12 0.15 0.93
1200 0.45
1 0.40
Urinary bladder contents 0.20
Adult, 15 years, 10 years 0.13
5 years 0.12
1 year 0.086
F9Amino acids
ICRP Publication 106
78
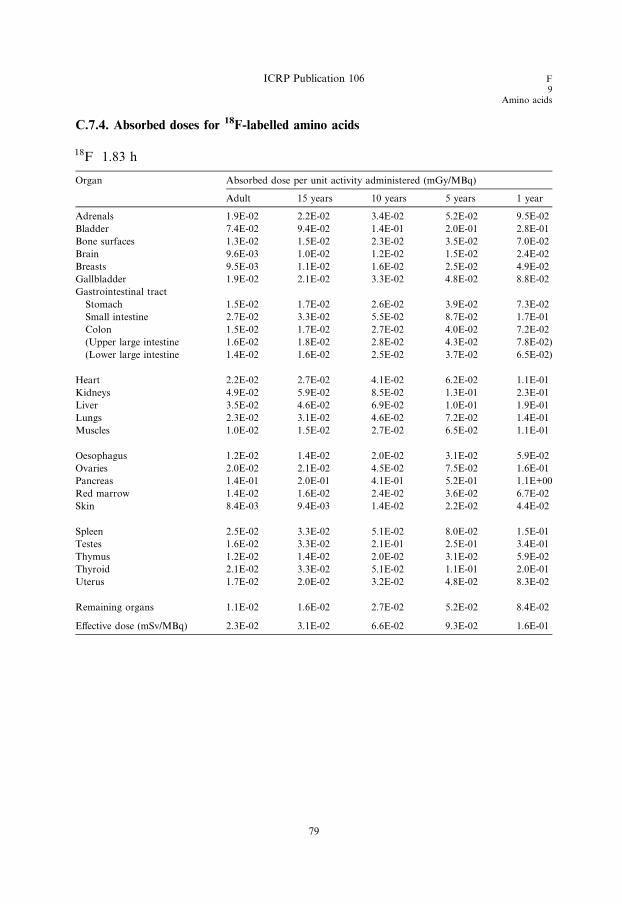
C.7.4. Absorbed doses for 18F-labelled amino acids
18F 1.83 h
Organ Absorbed dose per unit activity administered (mGy/MBq)
Adult 15 years 10 years 5 years 1 year
Adrenals 1.9E-02 2.2E-02 3.4E-02 5.2E-02 9.5E-02
Bladder 7.4E-02 9.4E-02 1.4E-01 2.0E-01 2.8E-01
Bone surfaces 1.3E-02 1.5E-02 2.3E-02 3.5E-02 7.0E-02
Brain 9.6E-03 1.0E-02 1.2E-02 1.5E-02 2.4E-02
Breasts 9.5E-03 1.1E-02 1.6E-02 2.5E-02 4.9E-02
Gallbladder 1.9E-02 2.1E-02 3.3E-02 4.8E-02 8.8E-02
Gastrointestinal tract
Stomach 1.5E-02 1.7E-02 2.6E-02 3.9E-02 7.3E-02
Small intestine 2.7E-02 3.3E-02 5.5E-02 8.7E-02 1.7E-01
Colon 1.5E-02 1.7E-02 2.7E-02 4.0E-02 7.2E-02
(Upper large intestine 1.6E-02 1.8E-02 2.8E-02 4.3E-02 7.8E-02)
(Lower large intestine 1.4E-02 1.6E-02 2.5E-02 3.7E-02 6.5E-02)
Heart 2.2E-02 2.7E-02 4.1E-02 6.2E-02 1.1E-01
Kidneys 4.9E-02 5.9E-02 8.5E-02 1.3E-01 2.3E-01
Liver 3.5E-02 4.6E-02 6.9E-02 1.0E-01 1.9E-01
Lungs 2.3E-02 3.1E-02 4.6E-02 7.2E-02 1.4E-01
Muscles 1.0E-02 1.5E-02 2.7E-02 6.5E-02 1.1E-01
Oesophagus 1.2E-02 1.4E-02 2.0E-02 3.1E-02 5.9E-02
Ovaries 2.0E-02 2.1E-02 4.5E-02 7.5E-02 1.6E-01
Pancreas 1.4E-01 2.0E-01 4.1E-01 5.2E-01 1.1E+00
Red marrow 1.4E-02 1.6E-02 2.4E-02 3.6E-02 6.7E-02
Skin 8.4E-03 9.4E-03 1.4E-02 2.2E-02 4.4E-02
Spleen 2.5E-02 3.3E-02 5.1E-02 8.0E-02 1.5E-01
Testes 1.6E-02 3.3E-02 2.1E-01 2.5E-01 3.4E-01
Thymus 1.2E-02 1.4E-02 2.0E-02 3.1E-02 5.9E-02
Thyroid 2.1E-02 3.3E-02 5.1E-02 1.1E-01 2.0E-01
Uterus 1.7E-02 2.0E-02 3.2E-02 4.8E-02 8.3E-02
Remaining organs 1.1E-02 1.6E-02 2.7E-02 5.2E-02 8.4E-02
Effective dose (mSv/MBq) 2.3E-02 3.1E-02 6.6E-02 9.3E-02 1.6E-01
ICRP Publication 106 F9
Amino acids
79

F9
Brain receptor substances
C.8. 18F-labelled brain receptor substances (generic model)18F
C.8.1. Biokinetic model
(C 22) A large number of radiopharmaceuticals labelled with 18F and 123I have
been developed for PET and single photon emission computer tomographic
(SPECT) studies of different types of receptor in the human brain. For many of thesesubstances, the available biokinetic data are insufficient to construct realistic
compound-specific biokinetic models for the calculation of absorbed dose to persons
undergoing an investigation. Therefore, a generic model for radionuclide-labelled
brain receptor substances that would predict the internal radiation dose with suffi-
cient accuracy for general radiation protection purpose has been developed.
(C 23) A generic model for 11C-labelled brain receptor substances has been pub-
lished previously (Nosslin et al., 2003). A review of the literature has identified bioki-
netic and dosimetric data for five 18F-labelled and 15 123I-labelled compoundsconsidered to be potential substances for the clinical imaging of brain receptors,
e.g. acetylcholinesterase receptors, benzodiazepine receptors, dopamine receptors,
dopamine transporters, and serotonin receptors. These data indicate that despite
fairly large differences in chemical structure, the patterns of uptake in the human
brain, and other tissues for which information is available, appear to be sufficiently
similar to justify a generic model for each radionuclide.
(C 24) For some compounds, the published data on the dosimetry of 18F- and 123I-
labelled receptor radiopharmaceuticals were derived from PET and SPECT studiesin humans, and for other compounds, the biokinetic models were derived, at least
in part, from studies of biodistribution in experimental animals.
(C 25) The generic model adopted for 18F-labelled substances assumes that frac-
tions of 0.07, 0.08, 0.05, 0.02, 0.02, and 0.002 of the administered activity are distrib-
uted instantaneously to the brain, liver, lungs, kidneys, stomach wall, and thyroid,
respectively, from where they are excreted with a biological half-time of 10 h. The
remaining activity is assumed to be distributed uniformly throughout the rest of
the body and eliminated with a biological half-time of 10 h. A biological half-timeof 10 h means that approximately 98% of the 18F will decay in the tissue of interest.
It is assumed that of the activity entering the liver, 30% would be eliminated via the
gallbladder and the remainder would pass directly into the small intestine. A total of
60% of the administered activity is assumed to be excreted in the urine and 40% via
the gastrointestinal tract.
81
F9Brain receptor substances
ICRP Publication 106
C.8.2. References and further reading for 18F-labelled brain receptor substances
Booij, J., Sokole, E.B., Stabin, M.G., Janssen, A.G.M., de Bruin, K., van Royen, E.A., 1998. Human
biodistribution and dosimetry of [123I]FP-CIT: a potent radioligand for imaging of dopamine
transporters. Eur. J. Nucl. Med. 25, 24–30.
Booij, J., Sokole, E.B., Stabin, M.G., Janssen, A.G.M., de Bruin, K., van Royen, E.A., 1998. Human
biodistribution and dosimetry of [123I]FP-CIT: a potent radioligand for imaging of dopamine
transporters: erratum. Eur. J. Nucl. Med. 25, 458.
Boundy, K.L., Barnden, L.R., Rowe, C.C., Reid, M., Kassiou, M., Katsifis, A.G., Lambrecht, R.L., 1995.
Human dosimetry and biodistribution of iodine-123-iododexetimide: a SPECT imaging agent for
cholinergic muscarinic neuroreceptors. J. Nucl. Med. 36, 1332–1338.
Deterding, T.A., Votaw, J.R., Wang, C.K., Eshima, D., Eshima, L., Keil, R., Malveaux, E., Kilts, C.D.,
Goodman, M.M., Hoffman, J.M., 2001. Biodistribution and radiation dosimetry of the dopamine
transporter ligand [18F]FECNT. J. Nucl. Med. 42, 376–381.
Grunder, G., Siessmeier, T., Lange-Asschenfeldt, C., Vernaleken, I., Buchholz, H.-G., Stoeter, P.,
Drzezga, A., Luddens, H., Rosch, F., Bartenstein, P., 2001. [18F]Fluoroethylflumaazenil: a novel tracer
for PET imaging of human benzodiazepine receptors. Eur. J. Nucl. Med. 28, 1463–1470.
Grunder, G., Siessmeier, T., Piel, M., Vernaleken, I., Buchholz, H.-G., Zhou, Y., Hiemke, C., Wong, D.P.,
Rosch, F., Bartenstein, P., 2003. Quantification of D2-like dopamine receptors in the human brain with
[18F]-desmethoxyfallypride. J. Nucl. Med. 44, 109–116.
Kauppinen, T.A., Bergstrom, K.A., Heikman, P., Hiltunen, J., Ahonen, A.K., 2003. Biodistribution and
radiation dosimetry of [123I]ADAM in healthy human subjects: preliminary results. Eur. J. Nucl. Med.
30, 132–136.
Kuikka, J.T., Bergstrom, K.A., Ahonen, A., Lansimies, E., 1994. The dosimetry of iodine-123 labelled 2b-
carbomethoxy-3b-(4-iodophenyl)tropane. Eur. J. Nucl. Med. 21, 53–56.
Mitterhauser, M., Wadsak, W., Wabnegger, L., Mien, L-K., Togel, S., Langer, O., Sieghart, W.,
Viernstein, H., Kletter, K., Dudczak, R., 2004. Biological evaluation of 20-[18F]fluoroflumazenil
([18F]FFMZ): a potential GABA receptor ligand for PET. Nucl. Med. Biol. 31, 291–295.
Mozley, P.D., Stubbs, J.T., Kim, H-J., McElgin, W., Chumpradit, S., Kung, M-P., Romaniallo, G., Kung,
H.F., 1995. Dosimetry of a D2/D3 dopamine receptor antagonist that can be used with PET or
SPECT. J. Nucl. Med. 36, 1322–1331.
Mozley, P.D., Stubbs, J.T., Kim, H-J., McElgin, W., Kung, M-P., Meegalla, S., Kung, H.F., 1996.
Dosimetry of an iodine-123-labeled tropane to image dopamine transporters. J. Nucl. Med. 37, 151–
159.
Nosslin, B., Johansson, L., Leide-Svegborn, S., Liniecki, J., Mattsson, S., Taylor, D.M., 2003. A generic
model for [11C]-labelled radiopharmaceuticals for imaging receptors in the human brain. Rad. Prot.
Dosim. 105, 587–591.
Taylor, D.M., 2000a. Unpublished assessments.
van de Wiele, C., De Vos, F., De Sutter, J., Dumont, F., Slegers, G., Dierkx, R.A., Thierens, H., 1999.
Biokinetics and dosimetry of (iodine-123)-iodomethyl-N,N-dimethyltamoxifen, an (anti)oestrogen
receptor radioligand. Eur. J. Nucl. Med. 26, 1259–1264.
Verhoeff, N.P., Sokole, E.B., Stabin, M., Hengst, D., Kung, H.F., Van Royen, E.A., Janssen, A.G., 1993.
Dosimetry of iodine-123 iodobenzamide in healthy volunteers. Eur. J. Nucl. Med. 20, 747–752.
Verhoeff, N.P., Busemann Sokole, E., Hengst, D., Stubbs, J.B., van Royen, E.A., 1993. Dosimetry of
iodine-123 iomazenil in humans. Eur. J. Nucl. Med. 20, 580–584.
Versijpt, J., Dumont, F., Thierens, H., Jansen, H., De Vos, F., Slegers, G., Santens, P., Dierckx, R.A.,
Korf, J., 2000. Biodistribution and dosimetry of [123I]iodo-PK 11195: a potential agent for SPET
imaging of the peripheral benzodiazepine receptor. Eur. J. Nucl. Med. 27, 1326–1333.
Volkow, N.D., Ding, Y.S., Fowler, J.S., Wang, G.J., Logan, J., Gatley, S.J., Schlyer, D.J., Pappas, N.,
1995. A new PET ligand for the dopamine transporter: studies in human brain. J. Nucl. Med. 36, 2162–
2168.
82

ICRP Publication 106 F9
Brain receptor substances
Votaw, J.R., Ansari, M.S., Scott Mason, N., Schmidt, D., de Paulis, T., Holburn, G., Clanton, J.A.,
Votlaw, D.B., Manning, R.G., Kessler, R.M., 1995. Dosimetry of iodine-123-epidepride: a dopamine
D2 receptor ligand. J. Nucl. Med. 36, 1316–1321.
Waterhouse, R.N., Stabin, M.G., Page, J.G., 2003. Preclinical acute toxicity studies and rodent-based
dosimetry estimates of the novel sigma-1 receptor radiotracer [18F]FPS. Nucl. Med. Biol. 30, 555–563.
C.8.3. Biokinetic data for 18F-labelled brain receptor substances
Organ (S) Fs T (h) a eAs=A0ðhÞBrain 0.07 10 1.0 0.16
Thyroid 0.002 10 1.0 0.0045
Lungs 0.05 10 1.0 0.11
Kidneys 0.02 10 1.0 0.045
Kidney excretion 0.90 0.011
Liver 0.08 10 1.0 0.18
Stomach wall 0.02 10 1.0 0.045
Other organs and tissues 0.758 10 1.0 1.7
Gallbladder contents 0.024 0.080
Gastrointestinal tract contents
Stomach 0.02 0.0022
Small intestine 0.10 0.019
Upper large intestine 0.10 0.011
Lower large intestine 0.10 0.0020
Urinary bladder contents 0.90
Adult, 15 years, 10 years 0.20
5 years 0.17
1 year 0.12
83
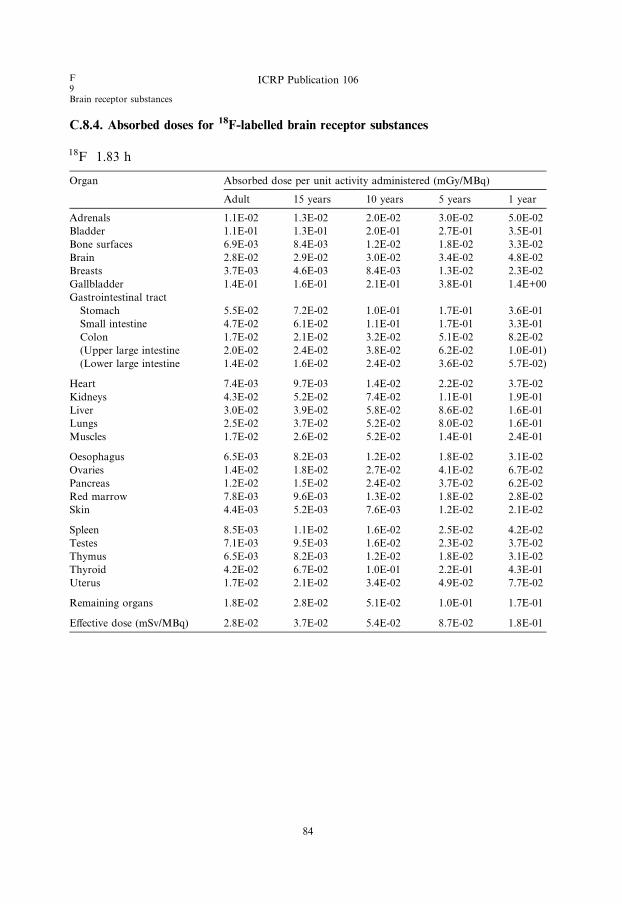
C.8.4. Absorbed doses for 18F-labelled brain receptor substances
18F 1.83 h
Organ Absorbed dose per unit activity administered (mGy/MBq)
Adult 15 years 10 years 5 years 1 year
Adrenals 1.1E-02 1.3E-02 2.0E-02 3.0E-02 5.0E-02
Bladder 1.1E-01 1.3E-01 2.0E-01 2.7E-01 3.5E-01
Bone surfaces 6.9E-03 8.4E-03 1.2E-02 1.8E-02 3.3E-02
Brain 2.8E-02 2.9E-02 3.0E-02 3.4E-02 4.8E-02
Breasts 3.7E-03 4.6E-03 8.4E-03 1.3E-02 2.3E-02
Gallbladder 1.4E-01 1.6E-01 2.1E-01 3.8E-01 1.4E+00
Gastrointestinal tract
Stomach 5.5E-02 7.2E-02 1.0E-01 1.7E-01 3.6E-01
Small intestine 4.7E-02 6.1E-02 1.1E-01 1.7E-01 3.3E-01
Colon 1.7E-02 2.1E-02 3.2E-02 5.1E-02 8.2E-02
(Upper large intestine 2.0E-02 2.4E-02 3.8E-02 6.2E-02 1.0E-01)
(Lower large intestine 1.4E-02 1.6E-02 2.4E-02 3.6E-02 5.7E-02)
Heart 7.4E-03 9.7E-03 1.4E-02 2.2E-02 3.7E-02
Kidneys 4.3E-02 5.2E-02 7.4E-02 1.1E-01 1.9E-01
Liver 3.0E-02 3.9E-02 5.8E-02 8.6E-02 1.6E-01
Lungs 2.5E-02 3.7E-02 5.2E-02 8.0E-02 1.6E-01
Muscles 1.7E-02 2.6E-02 5.2E-02 1.4E-01 2.4E-01
Oesophagus 6.5E-03 8.2E-03 1.2E-02 1.8E-02 3.1E-02
Ovaries 1.4E-02 1.8E-02 2.7E-02 4.1E-02 6.7E-02
Pancreas 1.2E-02 1.5E-02 2.4E-02 3.7E-02 6.2E-02
Red marrow 7.8E-03 9.6E-03 1.3E-02 1.8E-02 2.8E-02
Skin 4.4E-03 5.2E-03 7.6E-03 1.2E-02 2.1E-02
Spleen 8.5E-03 1.1E-02 1.6E-02 2.5E-02 4.2E-02
Testes 7.1E-03 9.5E-03 1.6E-02 2.3E-02 3.7E-02
Thymus 6.5E-03 8.2E-03 1.2E-02 1.8E-02 3.1E-02
Thyroid 4.2E-02 6.7E-02 1.0E-01 2.2E-01 4.3E-01
Uterus 1.7E-02 2.1E-02 3.4E-02 4.9E-02 7.7E-02
Remaining organs 1.8E-02 2.8E-02 5.1E-02 1.0E-01 1.7E-01
Effective dose (mSv/MBq) 2.8E-02 3.7E-02 5.4E-02 8.7E-02 1.8E-01
F9Brain receptor substances
ICRP Publication 106
84
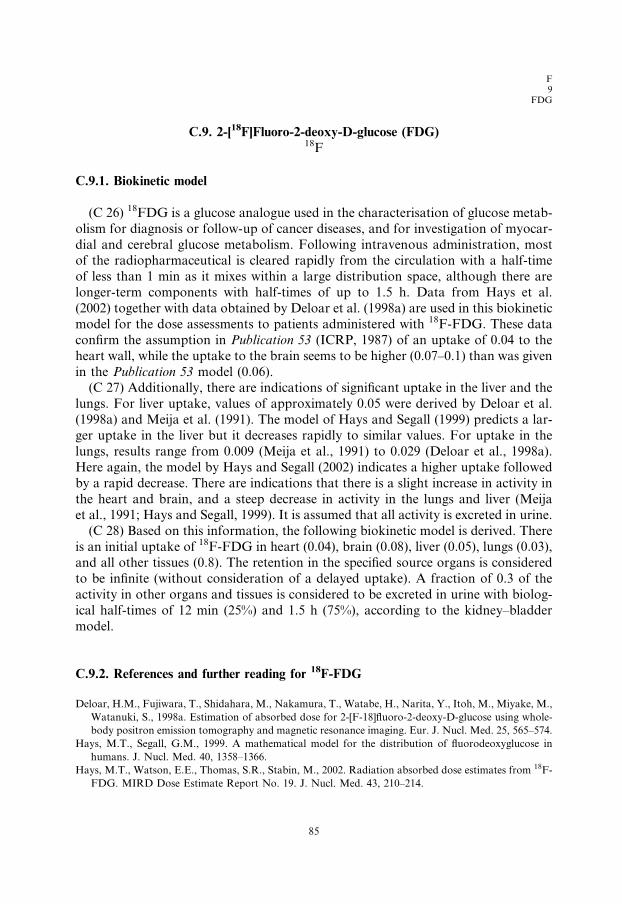
F9
FDG
C.9. 2-[18F]Fluoro-2-deoxy-D-glucose (FDG)18F
C.9.1. Biokinetic model
(C 26) 18FDG is a glucose analogue used in the characterisation of glucose metab-
olism for diagnosis or follow-up of cancer diseases, and for investigation of myocar-
dial and cerebral glucose metabolism. Following intravenous administration, mostof the radiopharmaceutical is cleared rapidly from the circulation with a half-time
of less than 1 min as it mixes within a large distribution space, although there are
longer-term components with half-times of up to 1.5 h. Data from Hays et al.
(2002) together with data obtained by Deloar et al. (1998a) are used in this biokinetic
model for the dose assessments to patients administered with 18F-FDG. These data
confirm the assumption in Publication 53 (ICRP, 1987) of an uptake of 0.04 to the
heart wall, while the uptake to the brain seems to be higher (0.07–0.1) than was given
in the Publication 53 model (0.06).(C 27) Additionally, there are indications of significant uptake in the liver and the
lungs. For liver uptake, values of approximately 0.05 were derived by Deloar et al.
(1998a) and Meija et al. (1991). The model of Hays and Segall (1999) predicts a lar-
ger uptake in the liver but it decreases rapidly to similar values. For uptake in the
lungs, results range from 0.009 (Meija et al., 1991) to 0.029 (Deloar et al., 1998a).
Here again, the model by Hays and Segall (2002) indicates a higher uptake followed
by a rapid decrease. There are indications that there is a slight increase in activity in
the heart and brain, and a steep decrease in activity in the lungs and liver (Meijaet al., 1991; Hays and Segall, 1999). It is assumed that all activity is excreted in urine.
(C 28) Based on this information, the following biokinetic model is derived. There
is an initial uptake of 18F-FDG in heart (0.04), brain (0.08), liver (0.05), lungs (0.03),
and all other tissues (0.8). The retention in the specified source organs is considered
to be infinite (without consideration of a delayed uptake). A fraction of 0.3 of the
activity in other organs and tissues is considered to be excreted in urine with biolog-
ical half-times of 12 min (25%) and 1.5 h (75%), according to the kidney–bladder
model.
C.9.2. References and further reading for 18F-FDG
Deloar, H.M., Fujiwara, T., Shidahara, M., Nakamura, T., Watabe, H., Narita, Y., Itoh, M., Miyake, M.,
Watanuki, S., 1998a. Estimation of absorbed dose for 2-[F-18]fluoro-2-deoxy-D-glucose using whole-
body positron emission tomography and magnetic resonance imaging. Eur. J. Nucl. Med. 25, 565–574.
Hays, M.T., Segall, G.M., 1999. A mathematical model for the distribution of fluorodeoxyglucose in
humans. J. Nucl. Med. 40, 1358–1366.
Hays, M.T., Watson, E.E., Thomas, S.R., Stabin, M., 2002. Radiation absorbed dose estimates from 18F-
FDG. MIRD Dose Estimate Report No. 19. J. Nucl. Med. 43, 210–214.
85
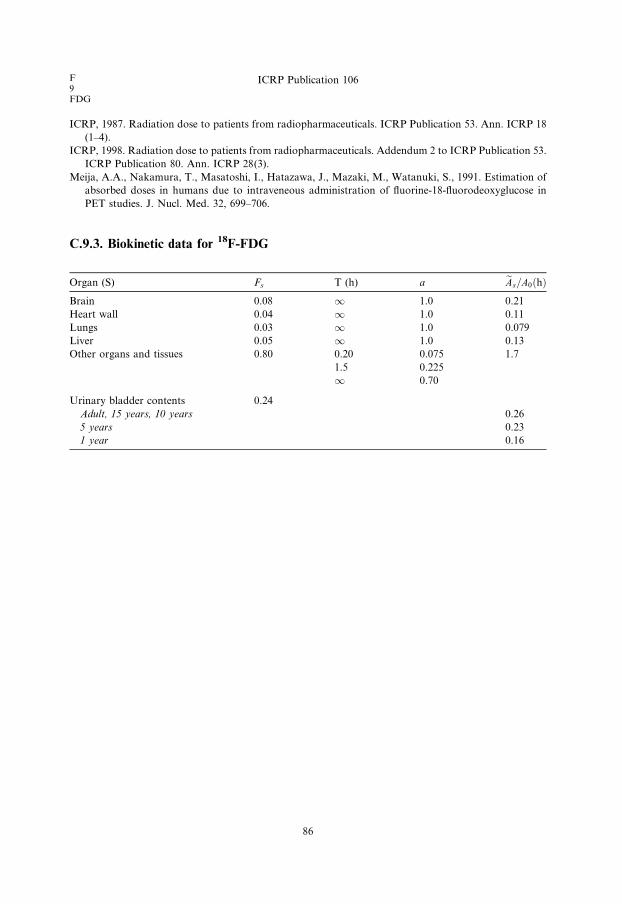
F9FDG
ICRP Publication 106
ICRP, 1987. Radiation dose to patients from radiopharmaceuticals. ICRP Publication 53. Ann. ICRP 18
(1–4).
ICRP, 1998. Radiation dose to patients from radiopharmaceuticals. Addendum 2 to ICRP Publication 53.
ICRP Publication 80. Ann. ICRP 28(3).
Meija, A.A., Nakamura, T., Masatoshi, I., Hatazawa, J., Mazaki, M., Watanuki, S., 1991. Estimation of
absorbed doses in humans due to intraveneous administration of fluorine-18-fluorodeoxyglucose in
PET studies. J. Nucl. Med. 32, 699–706.
C.9.3. Biokinetic data for 18F-FDG
Organ (S) Fs T (h) a eAs=A0ðhÞBrain 0.08 1 1.0 0.21
Heart wall 0.04 1 1.0 0.11
Lungs 0.03 1 1.0 0.079
Liver 0.05 1 1.0 0.13
Other organs and tissues 0.80 0.20 0.075 1.7
1.5 0.225
1 0.70
Urinary bladder contents 0.24
Adult, 15 years, 10 years 0.26
5 years 0.23
1 year 0.16
86
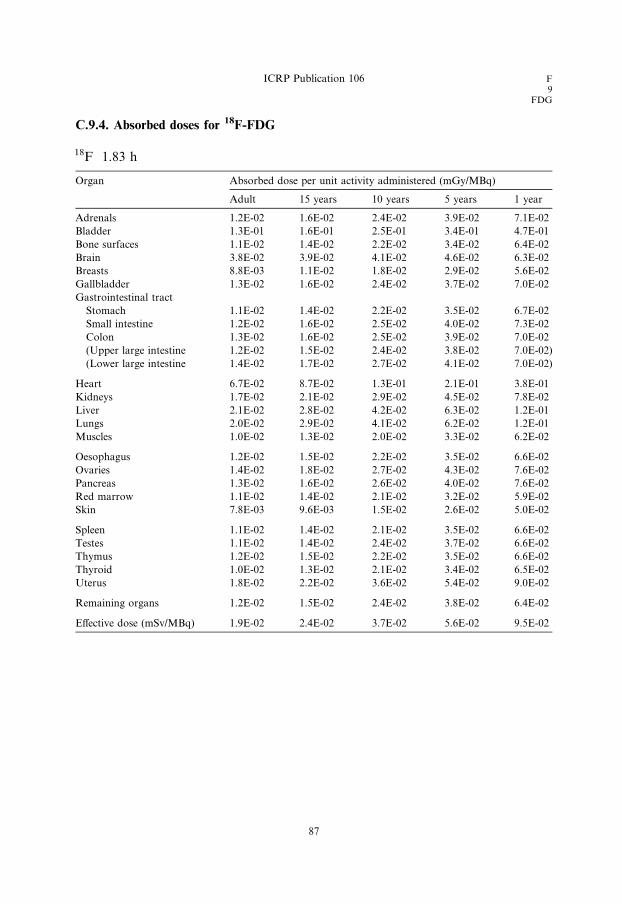
C.9.4. Absorbed doses for 18F-FDG
18F 1.83 h
Organ Absorbed dose per unit activity administered (mGy/MBq)
Adult 15 years 10 years 5 years 1 year
Adrenals 1.2E-02 1.6E-02 2.4E-02 3.9E-02 7.1E-02
Bladder 1.3E-01 1.6E-01 2.5E-01 3.4E-01 4.7E-01
Bone surfaces 1.1E-02 1.4E-02 2.2E-02 3.4E-02 6.4E-02
Brain 3.8E-02 3.9E-02 4.1E-02 4.6E-02 6.3E-02
Breasts 8.8E-03 1.1E-02 1.8E-02 2.9E-02 5.6E-02
Gallbladder 1.3E-02 1.6E-02 2.4E-02 3.7E-02 7.0E-02
Gastrointestinal tract
Stomach 1.1E-02 1.4E-02 2.2E-02 3.5E-02 6.7E-02
Small intestine 1.2E-02 1.6E-02 2.5E-02 4.0E-02 7.3E-02
Colon 1.3E-02 1.6E-02 2.5E-02 3.9E-02 7.0E-02
(Upper large intestine 1.2E-02 1.5E-02 2.4E-02 3.8E-02 7.0E-02)
(Lower large intestine 1.4E-02 1.7E-02 2.7E-02 4.1E-02 7.0E-02)
Heart 6.7E-02 8.7E-02 1.3E-01 2.1E-01 3.8E-01
Kidneys 1.7E-02 2.1E-02 2.9E-02 4.5E-02 7.8E-02
Liver 2.1E-02 2.8E-02 4.2E-02 6.3E-02 1.2E-01
Lungs 2.0E-02 2.9E-02 4.1E-02 6.2E-02 1.2E-01
Muscles 1.0E-02 1.3E-02 2.0E-02 3.3E-02 6.2E-02
Oesophagus 1.2E-02 1.5E-02 2.2E-02 3.5E-02 6.6E-02
Ovaries 1.4E-02 1.8E-02 2.7E-02 4.3E-02 7.6E-02
Pancreas 1.3E-02 1.6E-02 2.6E-02 4.0E-02 7.6E-02
Red marrow 1.1E-02 1.4E-02 2.1E-02 3.2E-02 5.9E-02
Skin 7.8E-03 9.6E-03 1.5E-02 2.6E-02 5.0E-02
Spleen 1.1E-02 1.4E-02 2.1E-02 3.5E-02 6.6E-02
Testes 1.1E-02 1.4E-02 2.4E-02 3.7E-02 6.6E-02
Thymus 1.2E-02 1.5E-02 2.2E-02 3.5E-02 6.6E-02
Thyroid 1.0E-02 1.3E-02 2.1E-02 3.4E-02 6.5E-02
Uterus 1.8E-02 2.2E-02 3.6E-02 5.4E-02 9.0E-02
Remaining organs 1.2E-02 1.5E-02 2.4E-02 3.8E-02 6.4E-02
Effective dose (mSv/MBq) 1.9E-02 2.4E-02 3.7E-02 5.6E-02 9.5E-02
ICRP Publication 106 F9
FDG
87

F9
L-DOPA
C.10. [18F]Fluoro-L-DOPA18F
C.10.1. Biokinetic model
(C 29) The amino acid analogue 6-fluoro-L-dopa (L-DOPA) is taken up rapidly
into the human brain and transformed into the important catecholamine neurotrans-
mitter dopamine (Luxen et al., 1992; Pauwels et al., 1994). After labelling with thepositron-emitting radioisotope 18F, the resulting 18F-L-DOPA can be used for the
scintigraphic investigation of normal and pathological dopamine metabolism in
the human brain and tumours (Luxen et al., 1992; Meyer et al., 1995; Heiss et al.,
1996), and for the quantitative assessment of dopaminergic function in Parkinson’s
disease and other conditions.
(C 30) Studies in normal human volunteers and dogs after administration of18F-L-DOPA have shown that the activity is more or less uniformly distributed
throughout the body tissues, and is removed by a bi-exponential process with biolog-ical half-times of approximately 12 h (67–94%) and 1.7–3.9 h (6–33%) (Harvey et al.,
1985; Boyes et al., 1986). Both these half-times appear to be age-dependent (Harvey
et al., 1985). The 18F is excreted through the kidneys; 50% with a half-time of 0.7 h
and 50% with a half-time of approximately 12 h (Harvey et al., 1985).
(C 31) On the basis of the biokinetic data given by Harvey et al. (1985) and Dha-
wan et al. (1996), the biokinetic model for 18F-L-DOPA illustrated in the biokinetic
data table was developed. This model assumes that 100% of the 18F is distributed
homogeneously in the body and eliminated through the kidneys with biologicalhalf-times of 1 h (50%) and 12 h (50%). This model was, in spite of observations cited
above, assumed to be independent of age.
(C 32) Human studies have shown that the uptake of 18F-L-DOPA in the striatum
and cerebellum can be increased approximately two-fold by administration of the
amino decarboxylase inhibitor carbidopa (Melega et al., 1990; Hoffman et al.,
1992; Brown et al., 1998).
C.10.2. References and further reading for 18F-L-DOPA
Boyes, R.E., Cumming, P., Martin, W.R.W., McGeer, E.G., 1986. Determination of plasma [18F]-6-
fluorodopa during positron emission tomography; elimination and metabolism in carbidopa treated
subjects. Life Sci. 39, 2243–2252.
Brown, W.D., Oakes, T.R., DeJesus, O.T., Taylor, M.D., Roberts, A.D., Nickles, R.J., Holden, J.E.,
1998. Fluorine-18-fluoro-L-DOPA dosimetry with carbidopa pretreatment. J. Nucl. Med. 39, 1884–
1891.
Dhawan, V., Belakhlef, A., Robeson, W., Ishikawa, T., Margouleff, C., Takikawa, S., Chaly, T.,
Kazumata, K., Margouleff, D., Eidelberg, D., 1996. Bladder wall radiation dose in humans from
fluorine-18-FDOPA. J. Nucl Med. 37, 1850–1852.
Harvey, J., Firnau, G., Garnett, E.S., 1985. Estimation of the radiation dose in man due to 6-[18F]fluoro-
L-dopa. J. Nucl. Med. 26, 931–935.
89

F9L-DOPA
ICRP Publication 106
Heiss, W.D., Wienhard, K., Wagner, R., Lanfermann, H., Thiel, A., Herhoiz, K., Pietrak, U., 1996. F-
DOPA as an amino acid tracer to detect brain tumors. J Nucl. Med. 37, 1180–1182.
Hoffman, J.M., Melega, W.P., Hawk, T.C., Grafton, S.C., Luxen, A., Mahoney, D.K., Bardo, J.R.,
Huang, S.-C., Mazziotta, J.C., Phelps, M.E., 1992. The effects of carbidopa administration of 6-
[18F]fluoro-L-DOPA kinetics in positron emission tomography. J. Nucl. Med. 33, 1472–1477.
Lu, E., Meyer, E., Kuwabara, H., Ma, Y., Shiraishi, M., Evans, A.C., 1995. Reduction of radiation
absorbed dose in F-18-DOPA PET studies by hydration-induced voiding. J. Nucl. Med. 36 (Suppl.),
98P.
Luxen, A., Guillaume, M., Melega, W.P., Pike, V.W., Solin, O., Wagner, R., 1992. Production of
6[18F]fluoro-L-DOPA and its metabolism in vivo – a critical review. Nucl. Med. Biol. 19, 149–158.
Melega, W.P., Hoffman, J.M., Luxen, A., Nissenson, C.H.K., Phelps, M.E., Barrio, J.P., 1990. The effects
of carbidopa on the metabolism of 6-[18F]fluoro-L-dopa in rats, monkeys and humans. Life Sci. 47,
149–157.
Meyer, G.-J., Waters, S.L., Coenen, H.H., Luxen, A., Maziere, B., Langstrom, B., 1995. PET
radiopharmaceuticals in Europe: current use and data relevant for the formulation of summaries of
product characteristics (SPCs). Eur. J. Nucl. Med. 22, 1420–1432.
Pauwels, T., Dethy, S., Goldman, S., Monclus, M., Luxen, A., 1994. Effect of catechol-O-methyl
transferase inhibition on peripheral and central metabolism of 6-[18F]Fluoro-L-DOPA. Eur. J
Pharmacol. 257, 53–58.
C.10.3. Biokinetic data for 18F-L-DOPA
Organ (S) Fs T (h) a eAs=A0ðhÞTotal body 1.0 1.0 0.50 1.6
12 0.50
Kidney excretion 1.0 0.032
Urinary bladder contents 1.0
Adult, 15 years, 10 years 0.60
5 years 0.53
1 year 0.37
90

C.10.4. Absorbed doses for 18F-L-DOPA
18F 1.83 h
Organ Absorbed dose per unit activity administered (mGy/MBq)
Adult 15 years 10 years 5 years 1 year
Adrenals 9.9E-03 1.3E-02 1.9E-02 3.1E-02 5.5E-02
Bladder 3.0E-01 3.8E-01 5.7E-01 7.8E-01 1.0E+00
Bone surfaces 9.6E-03 1.2E-02 1.8E-02 2.8E-02 5.1E-02
Brain 7.1E-03 8.8E-03 1.5E-02 2.4E-02 4.4E-02
Breasts 6.7E-03 8.5E-03 1.3E-02 2.1E-02 3.9E-02
Gallbladder 1.0E-02 1.3E-02 2.0E-02 2.9E-02 5.0E-02
Gastrointestinal tract
Stomach 9.5E-03 1.2E-02 1.8E-02 2.8E-02 5.0E-02
Small intestine 1.3E-02 1.7E-02 2.6E-02 3.9E-02 6.5E-02
Colon 1.5E-02 1.8E-02 2.7E-02 4.1E-02 6.3E-02
(Upper large intestine 1.2E-02 1.5E-02 2.3E-02 3.6E-02 5.9E-02)
(Lower large intestine 1.8E-02 2.2E-02 3.3E-02 4.7E-02 6.9E-02)
Heart 8.9E-03 1.1E-02 1.8E-02 2.8E-02 5.0E-02
Kidneys 3.1E-02 3.7E-02 5.2E-02 7.8E-02 1.4E-01
Liver 9.1E-03 1.2E-02 1.8E-02 2.9E-02 5.2E-02
Lungs 7.9E-03 1.0E-02 1.6E-02 2.5E-02 4.6E-02
Muscles 9.9E-03 1.2E-02 1.9E-02 3.0E-02 5.1E-02
Oesophagus 8.2E-03 1.0E-02 1.6E-02 2.5E-02 4.7E-02
Ovaries 1.7E-02 2.2E-02 3.3E-02 4.7E-02 7.4E-02
Pancreas 1.0E-02 1.3E-02 2.0E-02 3.1E-02 5.6E-02
Red marrow 9.8E-03 1.2E-02 1.9E-02 2.7E-02 4.7E-02
Skin 7.0E-03 8.5E-03 1.4E-02 2.2E-02 4.0E-02
Spleen 9.5E-03 1.2E-02 1.8E-02 2.9E-02 5.3E-02
Testes 1.3E-02 1.8E-02 3.0E-02 4.5E-02 7.0E-02
Thymus 8.2E-03 1.0E-02 1.6E-02 2.5E-02 4.7E-02
Thyroid 8.1E-03 1.0E-02 1.7E-02 2.7E-02 5.0E-02
Uterus 2.8E-02 3.3E-02 5.3E-02 7.5E-02 1.1E-01
Remaining organs 1.0E-02 1.3E-02 1.9E-02 3.0E-02 5.2E-02
Effective dose (mSv/MBq) 2.5E-02 3.2E-02 4.9E-02 7.0E-02 1.0E-01
Bladder wall contributes 51% of the effective dose.
ICRP Publication 106 F9
L-DOPA
91


Se34
Amino acids
C.11. 75Se-labelled amino acids (generic model)75Se
C.11.1. Biokinetic model
(C 33) The generic biokinetic model for 75Se-labelled amino acids is the same as
the generic biokinetic model for 11C-labelled amino acids (see Section C.2.1).
C.11.2. Further reading for 75Se-labelled amino acids
Bergmann, R., Brust, P., Kampf, G., Coenen, H.H., Stocklin, G., 1995. Evaluation of radioselenium
labeled selenomethionine, a potential tracer for brain protein synthesis by PET. Nucl. Med. Biol. 22,
475–481.
Coenen, H.H., Kling, P., Stocklin, G., 1989. Cerebral metabolism of l-[2-18F]fluorotyrosine, a new PET
tracer of protein synthesis. J. Nucl. Med. 30, 1367–1372.
Cottrall, M.F., Taylor, D.M., McElwain, T.J., 1973. Investigations of 18F-p-fluorophenylalanine for
pancreas scanning. Br. J. Radiol. 46, 277–288.
Deloar, H.M., Fujiwara, T., Nakamura, T., Itoh, M., Imai, D., Miyake, M., Watanuki, S., 1998b.
Estimation of internal absorbed dose of l-[methyl-11C] methionine using whole body positron emission
tomography. Eur. J. Nucl. Med. 25, 629–633.
ICRP, 1987. Radiation dose to patients from radiopharmaceuticals. ICRP Publication 53. Ann. ICRP 18
(1–4), 149–150.
ICRP, 2001b. Radiation dose to patients from radiopharmaceuticals. Addendum 4 to ICRP Publication,
53.
Inoue, T., Tomiyoshi, K., Higuichi, T., Ahmed, K., Sarwar, M., Aoyagi, K., Amano, S., Alyafei, S.,
Zhang, H., Endo, K., 1996. Biodistribution studies on l-3-[Fluorine-18]fluoro-a-methyl tyrosine: a
potential tumor-detecting agent. J. Nucl. Med. 39, 663–667.
Schmidt, D., Langen, K-J., Herzog, H., Wirths, J., Holschbach, M., Kiwit, J.C.W., Ziemons, K., Coenen,
H.H., Muller-Gartner, H-W., 1997. Whole-body kinetics and dosimetry of l-3-[123I]iodo-a-methylty-
rosine. Eur. J. Nucl. Med. 24, 1162–1166.
Shoup, T.M., Olson, J., Hoffman, J.M., Votaw, J., Eshima, D., Eshima, L., Camp, M., Stabin, M., Votaw,
D., Goodman, M., 1999. Synthesis and evaluation of [18F]1-amino-3-fluorocyclobutane-1-carboxylic
acid to image brain tumours. J. Nucl. Med. 40, 331–338.
Stenhouse, M.J., Baxter, M.S., 1977. Bomb 14C as a biological tracer. Nature (Lond.) 267, 828–
832.
Stenstrom, K., Leide-Svegborn, S., Erlandsson, B., Hellborg, R., Mattsson, S., Nilsson, L-E., Nosslin, B.,
Skog, G., Wiebert, A., 1996. Application of accelerator mass spectrometry (AMS) for high-sensitivity
measurements of 14CO2 in long-term studies of fat metabolism. Appl. Radiat. Isot. 47, 417–
422.
Taylor, D.M., 2000b. Generic models for radionuclide dosimetry: 11C, 18F or 75Se-labelled amino acids.
Appl. Radiat. Isot. 52, 911–922.
Taylor, D.M., Cottrall, M.F., 1973. Evaluation of amino acids labelled with 18F for pancreas scanning. In:
Radiopharmaceuticals and Labelled Compounds, Vol. I. IAEA, Vienna, pp. 441–443.
Wester, H.J., Herz, M., Senkowitsch-Schmidtke, R., Schwaiger, M., Stocklin, G., Hamacher, K., 1999a.
Preclinical evaluation of 4-[18F]fluoroprolines: diasteromeric effect on metabolism and uptake in mice.
Nucl. Med. Biol. 26, 259–265.
93

Se34Amino acids
ICRP Publication 106
Wester, H.J., Herz, M., Weber, W., Heiss, P., Senkowitsch-Schmidtke, R., Schwaiger, M., Stocklin, G.,
1999b. Synthesis and radiopharmacology of O-(2-[18F]fluoroethyl)-LL-tyrosine for tumor imaging. J.
Nucl. Med. 40, 205–212.
94
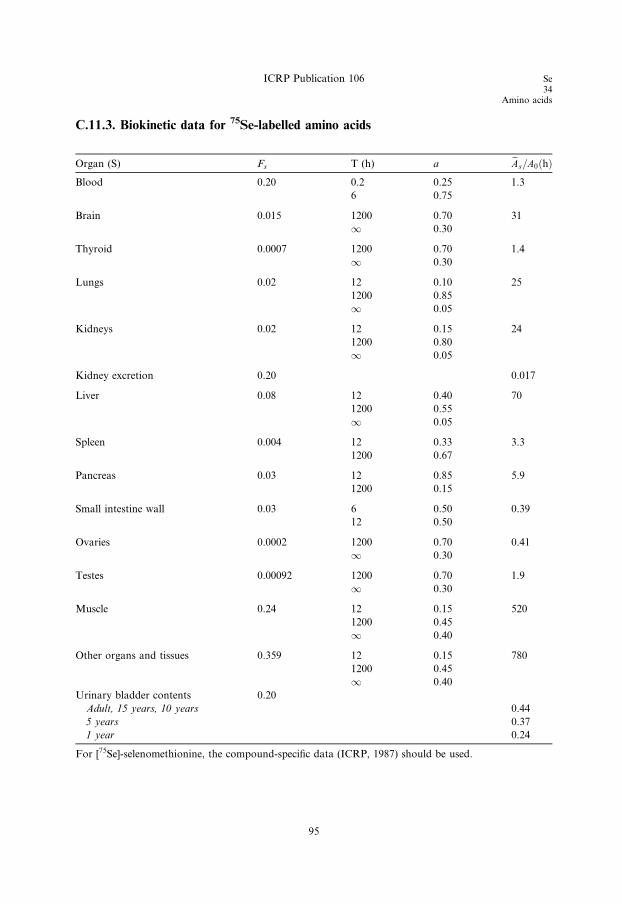
C.11.3. Biokinetic data for 75Se-labelled amino acids
Organ (S) Fs T (h) a eAs=A0ðhÞBlood 0.20 0.2 0.25 1.3
6 0.75
Brain 0.015 1200 0.70 31
1 0.30
Thyroid 0.0007 1200 0.70 1.4
1 0.30
Lungs 0.02 12 0.10 25
1200 0.85
1 0.05
Kidneys 0.02 12 0.15 24
1200 0.80
1 0.05
Kidney excretion 0.20 0.017
Liver 0.08 12 0.40 70
1200 0.55
1 0.05
Spleen 0.004 12 0.33 3.3
1200 0.67
Pancreas 0.03 12 0.85 5.9
1200 0.15
Small intestine wall 0.03 6 0.50 0.39
12 0.50
Ovaries 0.0002 1200 0.70 0.41
1 0.30
Testes 0.00092 1200 0.70 1.9
1 0.30
Muscle 0.24 12 0.15 520
1200 0.45
1 0.40
Other organs and tissues 0.359 12 0.15 780
1200 0.45
1 0.40
Urinary bladder contents 0.20
Adult, 15 years, 10 years 0.44
5 years 0.37
1 year 0.24
For [75Se]-selenomethionine, the compound-specific data (ICRP, 1987) should be used.
ICRP Publication 106 Se34
Amino acids
95

C.11.4. Absorbed doses for 75Se-labelled amino acids
75Se 119.8 days
Organ Absorbed dose per unit activity administered (mGy/MBq)
Adult 15 years 10 years 5 years 1 year
Adrenals 2.6E+00 3.1E+00 4.6E+00 6.7E+00 1.2E+01
Bladder 2.0E+00 2.6E+00 3.6E+00 5.3E+00 9.0E+00
Bone surfaces 2.9E+00 3.3E+00 4.7E+00 6.8E+00 1.2E+01
Brain 1.7E+00 1.7E+00 2.0E+00 2.7E+00 3.9E+00
Breasts 1.3E+00 1.6E+00 2.2E+00 3.4E+00 6.4E+00
Gallbladder 2.7E+00 3.3E+00 5.2E+00 7.4E+00 1.0E+01
Gastrointestinal tract
Stomach 2.3E+00 2.8E+00 4.2E+00 5.9E+00 1.0E+01
Small intestine 2.0E+00 2.4E+00 3.6E+00 5.5E+00 9.5E+00
Colon 2.1E+00 2.6E+00 3.9E+00 6.0E+00 1.0E+01
(Upper large intestine 2.1E+00 2.6E+00 3.7E+00 6.1E+00 9.8E+00)
(Lower large intestine 2.2E+00 2.6E+00 4.1E+00 5.9E+00 1.1E+01)
Heart 2.3E+00 2.8E+00 4.0E+00 5.7E+00 1.0E+01
Kidneys 3.8E+00 4.6E+00 6.3E+00 9.2E+00 1.6E+01
Liver 3.0E+00 3.8E+00 5.6E+00 7.7E+00 1.4E+01
Lungs 2.1E+00 2.8E+00 3.9E+00 5.7E+00 1.0E+01
Muscles 1.7E+00 2.3E+00 3.6E+00 6.6E+00 1.2E+01
Oesophagus 2.0E+00 2.4E+00 3.5E+00 5.2E+00 9.4E+00
Ovaries 2.7E+00 3.0E+00 5.4E+00 8.8E+00 1.7E+01
Pancreas 3.6E+00 4.7E+00 7.8E+00 1.1E+01 2.0E+01
Red marrow 1.9E+00 2.2E+00 3.2E+00 4.5E+00 7.6E+00
Skin 1.2E+00 1.3E+00 2.0E+00 3.1E+00 5.7E+00
Spleen 2.2E+00 2.9E+00 4.3E+00 6.4E+00 1.1E+01
Testes 2.3E+00 3.9E+00 1.7E+01 2.0E+01 2.8E+01
Thymus 2.0E+00 2.4E+00 3.5E+00 5.2E+00 9.4E+00
Thyroid 2.8E+00 4.0E+00 6.1E+00 1.1E+01 2.1E+01
Uterus 2.3E+00 2.7E+00 4.2E+00 6.5E+00 1.1E+01
Remaining organs 1.8E+00 2.3E+00 3.4E+00 5.3E+00 8.8E+00
Effective dose (mSv/MBq) 2.2E+00 2.9E+00 5.3E+00 7.6E+00 1.3E+01
For [75Se]-selenomethionine, the compound-specific data (ICRP, 1987) should be used.
Se34Amino acids
ICRP Publication 106
96
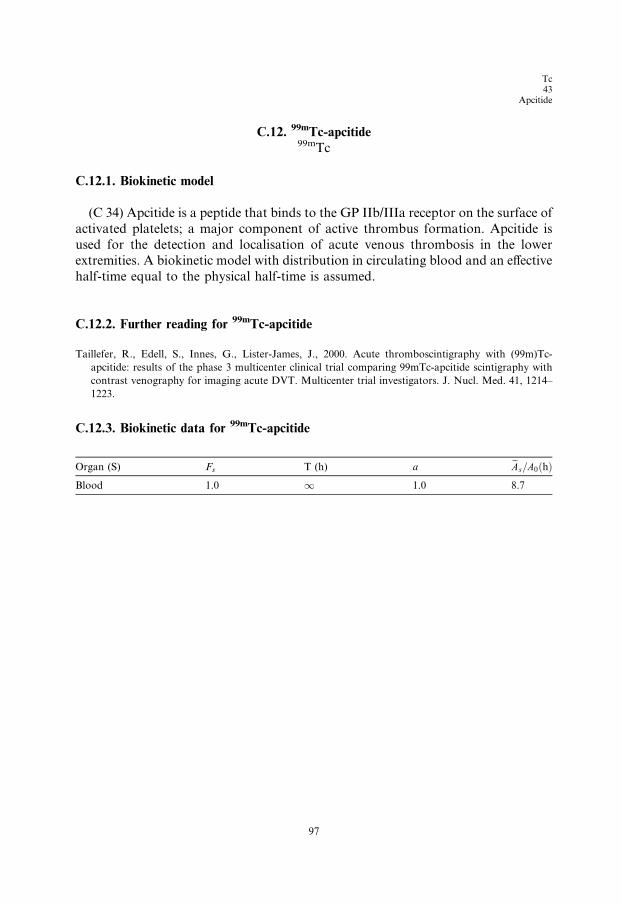
Tc43
Apcitide
C.12. 99mTc-apcitide99mTc
C.12.1. Biokinetic model
(C 34) Apcitide is a peptide that binds to the GP IIb/IIIa receptor on the surface of
activated platelets; a major component of active thrombus formation. Apcitide is
used for the detection and localisation of acute venous thrombosis in the lowerextremities. A biokinetic model with distribution in circulating blood and an effective
half-time equal to the physical half-time is assumed.
C.12.2. Further reading for 99mTc-apcitide
Taillefer, R., Edell, S., Innes, G., Lister-James, J., 2000. Acute thromboscintigraphy with (99m)Tc-
apcitide: results of the phase 3 multicenter clinical trial comparing 99mTc-apcitide scintigraphy with
contrast venography for imaging acute DVT. Multicenter trial investigators. J. Nucl. Med. 41, 1214–
1223.
C.12.3. Biokinetic data for 99mTc-apcitide
Organ (S) Fs T (h) a eAs=A0ðhÞBlood 1.0 1 1.0 8.7
97
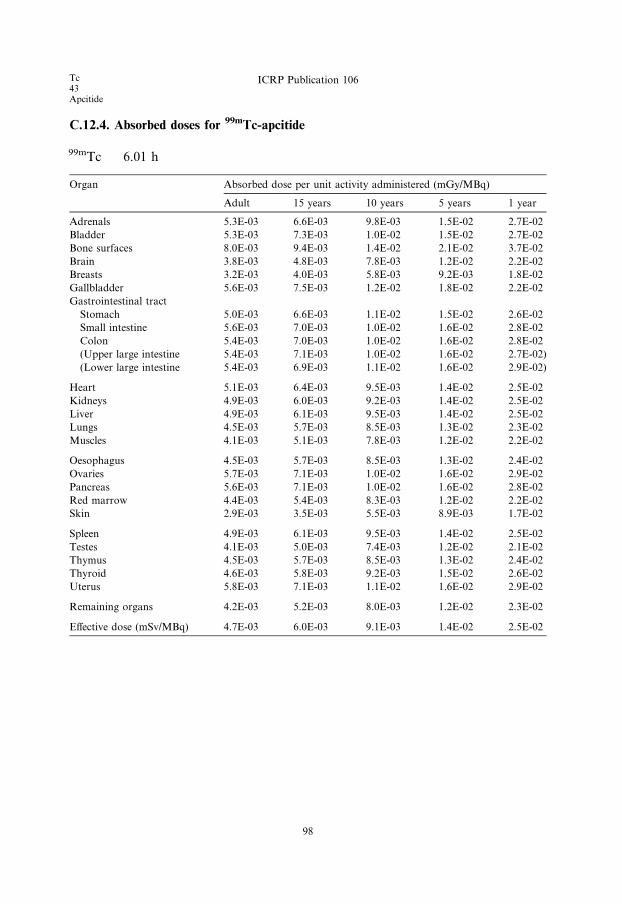
C.12.4. Absorbed doses for 99mTc-apcitide
99mTc 6.01 h
Organ Absorbed dose per unit activity administered (mGy/MBq)
Adult 15 years 10 years 5 years 1 year
Adrenals 5.3E-03 6.6E-03 9.8E-03 1.5E-02 2.7E-02
Bladder 5.3E-03 7.3E-03 1.0E-02 1.5E-02 2.7E-02
Bone surfaces 8.0E-03 9.4E-03 1.4E-02 2.1E-02 3.7E-02
Brain 3.8E-03 4.8E-03 7.8E-03 1.2E-02 2.2E-02
Breasts 3.2E-03 4.0E-03 5.8E-03 9.2E-03 1.8E-02
Gallbladder 5.6E-03 7.5E-03 1.2E-02 1.8E-02 2.2E-02
Gastrointestinal tract
Stomach 5.0E-03 6.6E-03 1.1E-02 1.5E-02 2.6E-02
Small intestine 5.6E-03 7.0E-03 1.0E-02 1.6E-02 2.8E-02
Colon 5.4E-03 7.0E-03 1.0E-02 1.6E-02 2.8E-02
(Upper large intestine 5.4E-03 7.1E-03 1.0E-02 1.6E-02 2.7E-02)
(Lower large intestine 5.4E-03 6.9E-03 1.1E-02 1.6E-02 2.9E-02)
Heart 5.1E-03 6.4E-03 9.5E-03 1.4E-02 2.5E-02
Kidneys 4.9E-03 6.0E-03 9.2E-03 1.4E-02 2.5E-02
Liver 4.9E-03 6.1E-03 9.5E-03 1.4E-02 2.5E-02
Lungs 4.5E-03 5.7E-03 8.5E-03 1.3E-02 2.3E-02
Muscles 4.1E-03 5.1E-03 7.8E-03 1.2E-02 2.2E-02
Oesophagus 4.5E-03 5.7E-03 8.5E-03 1.3E-02 2.4E-02
Ovaries 5.7E-03 7.1E-03 1.0E-02 1.6E-02 2.9E-02
Pancreas 5.6E-03 7.1E-03 1.0E-02 1.6E-02 2.8E-02
Red marrow 4.4E-03 5.4E-03 8.3E-03 1.2E-02 2.2E-02
Skin 2.9E-03 3.5E-03 5.5E-03 8.9E-03 1.7E-02
Spleen 4.9E-03 6.1E-03 9.5E-03 1.4E-02 2.5E-02
Testes 4.1E-03 5.0E-03 7.4E-03 1.2E-02 2.1E-02
Thymus 4.5E-03 5.7E-03 8.5E-03 1.3E-02 2.4E-02
Thyroid 4.6E-03 5.8E-03 9.2E-03 1.5E-02 2.6E-02
Uterus 5.8E-03 7.1E-03 1.1E-02 1.6E-02 2.9E-02
Remaining organs 4.2E-03 5.2E-03 8.0E-03 1.2E-02 2.3E-02
Effective dose (mSv/MBq) 4.7E-03 6.0E-03 9.1E-03 1.4E-02 2.5E-02
Tc43Apcitide
ICRP Publication 106
98
Tc43
Ethylenedicysteine (EC)
C.13. 99mTc-ethylenedicysteine (EC)99mTc
C.13.1. Biokinetic model
(C 35) The substance 99mTc-ethylenedicysteine (EC) is used for renal studies. The
biokinetic behaviour of the substance is very similar to that of hippuran with a half-
time in the total body of 25 min (ICRP, 1987). The cumulated amount found in urine
at different times is as follows: 40 min, 70%; 60 min, 80%; 90 min, 95% (Liniecki,
1998). The clearance is approximately 70% of that of hippuran.
C.13.2. References and further reading for 99mTc-EC
ICRP, 1987. Radiation dose to patients from radiopharmaceuticals. ICRP Publication 53. Ann. ICRP 18
(1–4).
Liniecki, J., 1998. Private communication. Department of Nuclear Medicine, Medical University of Lodz,
Lodz..
Surma, M.J., 1998a. Verification of 99mTc-ethylenedicysteine (99mTc-EC) distribution model in the
organism. Nucl. Med. Rev. 1, 29–32.
Surma, M.J., 1998b. 99mTc-Ethylenedicysteine (99mTc-EC) renal clearance determination error for the
multiple- and single-sample methods. Nucl. Med. Rev. 1, 33–40.
Surma, M.J., Wiewiora, J., Liniecki, J., 1994. Usefulness of 99mTc-N,N 0-ethylene-1-dicysteine complex for
dynamic kidney investigations. Nucl. Med. Comm. 15, 628–635.
99

C.13.3. Biokinetic data for 99mTc-EC
Organ (S) Fs T (h) a eAs=A0ðhÞ
Normal renal function
Total body (excl. bladder contents) 1.0 0.42 1.0 0.56
Kidney excretion 1.0 0.062
Urinary bladder contents 1.0
Adult, 15 years, 10 years 2.3
5 years 2.0
1 year 1.3
Abnormal renal function
Total body (excl. bladder contents) 1.0 4.2 1.0 3.6
Kidney excretion 1.0 0.20
Liver 0.04 4.2 1.0 0.14
Urinary bladder contents 1.0
Adult, 15 years, 10 years 1.0
5 years 0.86
1 year 0.58
Acute unilateral renal blockage
Total body (excl. bladder contents) 1.0 0.42 0.5 4.4
120 0.5
Abnormal kidney 0.5 120 1.0 4.1
Normal kidney excretion 1.0 0.033
Urinary bladder contents 1.0
Adult, 15 years, 10 years 1.2
5 years 1.0
1 year 0.66
Tc43Ethylenedicysteine (EC)
ICRP Publication 106
100
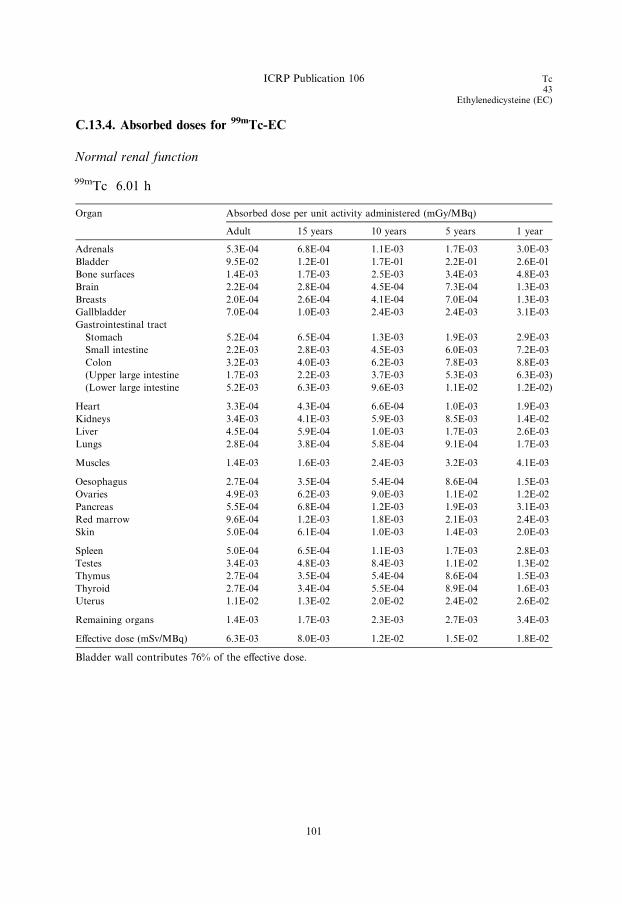
C.13.4. Absorbed doses for 99mTc-EC
Normal renal function
99mTc 6.01 h
Organ Absorbed dose per unit activity administered (mGy/MBq)
Adult 15 years 10 years 5 years 1 year
Adrenals 5.3E-04 6.8E-04 1.1E-03 1.7E-03 3.0E-03
Bladder 9.5E-02 1.2E-01 1.7E-01 2.2E-01 2.6E-01
Bone surfaces 1.4E-03 1.7E-03 2.5E-03 3.4E-03 4.8E-03
Brain 2.2E-04 2.8E-04 4.5E-04 7.3E-04 1.3E-03
Breasts 2.0E-04 2.6E-04 4.1E-04 7.0E-04 1.3E-03
Gallbladder 7.0E-04 1.0E-03 2.4E-03 2.4E-03 3.1E-03
Gastrointestinal tract
Stomach 5.2E-04 6.5E-04 1.3E-03 1.9E-03 2.9E-03
Small intestine 2.2E-03 2.8E-03 4.5E-03 6.0E-03 7.2E-03
Colon 3.2E-03 4.0E-03 6.2E-03 7.8E-03 8.8E-03
(Upper large intestine 1.7E-03 2.2E-03 3.7E-03 5.3E-03 6.3E-03)
(Lower large intestine 5.2E-03 6.3E-03 9.6E-03 1.1E-02 1.2E-02)
Heart 3.3E-04 4.3E-04 6.6E-04 1.0E-03 1.9E-03
Kidneys 3.4E-03 4.1E-03 5.9E-03 8.5E-03 1.4E-02
Liver 4.5E-04 5.9E-04 1.0E-03 1.7E-03 2.6E-03
Lungs 2.8E-04 3.8E-04 5.8E-04 9.1E-04 1.7E-03
Muscles 1.4E-03 1.6E-03 2.4E-03 3.2E-03 4.1E-03
Oesophagus 2.7E-04 3.5E-04 5.4E-04 8.6E-04 1.5E-03
Ovaries 4.9E-03 6.2E-03 9.0E-03 1.1E-02 1.2E-02
Pancreas 5.5E-04 6.8E-04 1.2E-03 1.9E-03 3.1E-03
Red marrow 9.6E-04 1.2E-03 1.8E-03 2.1E-03 2.4E-03
Skin 5.0E-04 6.1E-04 1.0E-03 1.4E-03 2.0E-03
Spleen 5.0E-04 6.5E-04 1.1E-03 1.7E-03 2.8E-03
Testes 3.4E-03 4.8E-03 8.4E-03 1.1E-02 1.3E-02
Thymus 2.7E-04 3.5E-04 5.4E-04 8.6E-04 1.5E-03
Thyroid 2.7E-04 3.4E-04 5.5E-04 8.9E-04 1.6E-03
Uterus 1.1E-02 1.3E-02 2.0E-02 2.4E-02 2.6E-02
Remaining organs 1.4E-03 1.7E-03 2.3E-03 2.7E-03 3.4E-03
Effective dose (mSv/MBq) 6.3E-03 8.0E-03 1.2E-02 1.5E-02 1.8E-02
Bladder wall contributes 76% of the effective dose.
ICRP Publication 106 Tc43
Ethylenedicysteine (EC)
101

Abnormal renal function99mTc 6.01 h
Organ Absorbed dose per unit activity administered (mGy/MBq)
Adult 15 years 10 years 5 years 1 year
Adrenals 2.6E-03 3.3E-03 5.0E-03 7.4E-03 1.3E-02
Bladder 4.4E-02 5.6E-02 8.1E-02 1.0E-01 1.3E-01
Bone surfaces 3.6E-03 4.3E-03 6.4E-03 9.2E-03 1.6E-02
Brain 1.5E-03 1.8E-03 3.0E-03 4.8E-03 8.5E-03
Breasts 1.3E-03 1.6E-03 2.3E-03 3.7E-03 7.0E-03
Gallbladder 2.7E-03 3.6E-03 5.9E-03 8.3E-03 1.0E-02
Gastrointestinal tract
Stomach 2.2E-03 2.9E-03 4.7E-03 6.5E-03 1.1E-02
Small intestine 3.1E-03 3.9E-03 6.0E-03 8.8E-03 1.4E-02
Colon 3.4E-03 4.4E-03 6.7E-03 9.6E-03 1.4E-02
(Upper large intestine 2.8E-03 3.7E-03 5.6E-03 8.6E-03 1.3E-02)
(Lower large intestine 4.3E-03 5.3E-03 8.2E-03 1.1E-02 1.6E-02)
Heart 2.1E-03 2.6E-03 3.9E-03 5.8E-03 1.0E-02
Kidneys 1.1E-02 1.3E-02 1.8E-02 2.6E-02 4.5E-02
Liver 2.8E-03 3.5E-03 5.3E-03 7.5E-03 1.3E-02
Lungs 1.8E-03 2.3E-03 3.4E-03 5.2E-03 9.5E-03
Muscles 2.1E-03 2.6E-03 4.0E-03 5.8E-03 1.0E-02
Oesophagus 1.8E-03 2.2E-03 3.3E-03 5.2E-03 9.3E-03
Ovaries 4.3E-03 5.4E-03 7.9E-03 1.1E-02 1.6E-02
Pancreas 2.6E-03 3.3E-03 4.9E-03 7.4E-03 1.3E-02
Red marrow 2.1E-03 2.6E-03 4.0E-03 5.6E-03 9.3E-03
Skin 1.3E-03 1.6E-03 2.5E-03 3.9E-03 7.0E-03
Spleen 2.3E-03 3.0E-03 4.6E-03 6.8E-03 1.2E-02
Testes 2.9E-03 3.9E-03 6.4E-03 9.2E-03 1.4E-02
Thymus 1.8E-03 2.2E-03 3.3E-03 5.2E-03 9.3E-03
Thyroid 1.8E-03 2.2E-03 3.6E-03 5.7E-03 1.0E-02
Uterus 6.9E-03 8.3E-03 1.3E-02 1.7E-02 2.2E-02
Remaining organs 2.2E-03 2.8E-03 4.2E-03 6.4E-03 1.1E-02
Effective dose (mSv/MBq) 4.6E-03 5.9E-03 8.8E-03 1.2E-02 1.8E-02
Tc43Ethylenedicysteine (EC)
ICRP Publication 106
102
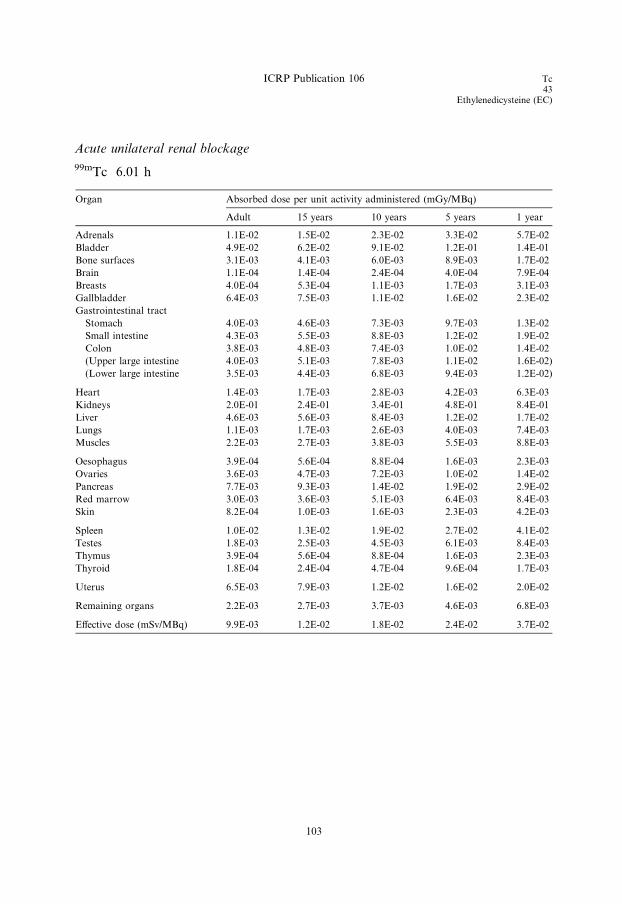
Acute unilateral renal blockage
99mTc 6.01 h
Organ Absorbed dose per unit activity administered (mGy/MBq)
Adult 15 years 10 years 5 years 1 year
Adrenals 1.1E-02 1.5E-02 2.3E-02 3.3E-02 5.7E-02
Bladder 4.9E-02 6.2E-02 9.1E-02 1.2E-01 1.4E-01
Bone surfaces 3.1E-03 4.1E-03 6.0E-03 8.9E-03 1.7E-02
Brain 1.1E-04 1.4E-04 2.4E-04 4.0E-04 7.9E-04
Breasts 4.0E-04 5.3E-04 1.1E-03 1.7E-03 3.1E-03
Gallbladder 6.4E-03 7.5E-03 1.1E-02 1.6E-02 2.3E-02
Gastrointestinal tract
Stomach 4.0E-03 4.6E-03 7.3E-03 9.7E-03 1.3E-02
Small intestine 4.3E-03 5.5E-03 8.8E-03 1.2E-02 1.9E-02
Colon 3.8E-03 4.8E-03 7.4E-03 1.0E-02 1.4E-02
(Upper large intestine 4.0E-03 5.1E-03 7.8E-03 1.1E-02 1.6E-02)
(Lower large intestine 3.5E-03 4.4E-03 6.8E-03 9.4E-03 1.2E-02)
Heart 1.4E-03 1.7E-03 2.8E-03 4.2E-03 6.3E-03
Kidneys 2.0E-01 2.4E-01 3.4E-01 4.8E-01 8.4E-01
Liver 4.6E-03 5.6E-03 8.4E-03 1.2E-02 1.7E-02
Lungs 1.1E-03 1.7E-03 2.6E-03 4.0E-03 7.4E-03
Muscles 2.2E-03 2.7E-03 3.8E-03 5.5E-03 8.8E-03
Oesophagus 3.9E-04 5.6E-04 8.8E-04 1.6E-03 2.3E-03
Ovaries 3.6E-03 4.7E-03 7.2E-03 1.0E-02 1.4E-02
Pancreas 7.7E-03 9.3E-03 1.4E-02 1.9E-02 2.9E-02
Red marrow 3.0E-03 3.6E-03 5.1E-03 6.4E-03 8.4E-03
Skin 8.2E-04 1.0E-03 1.6E-03 2.3E-03 4.2E-03
Spleen 1.0E-02 1.3E-02 1.9E-02 2.7E-02 4.1E-02
Testes 1.8E-03 2.5E-03 4.5E-03 6.1E-03 8.4E-03
Thymus 3.9E-04 5.6E-04 8.8E-04 1.6E-03 2.3E-03
Thyroid 1.8E-04 2.4E-04 4.7E-04 9.6E-04 1.7E-03
Uterus 6.5E-03 7.9E-03 1.2E-02 1.6E-02 2.0E-02
Remaining organs 2.2E-03 2.7E-03 3.7E-03 4.6E-03 6.8E-03
Effective dose (mSv/MBq) 9.9E-03 1.2E-02 1.8E-02 2.4E-02 3.7E-02
ICRP Publication 106 Tc43
Ethylenedicysteine (EC)
103


Tc43
Ethyl cysteinate dimer (ECD)
C.14. 99mTc-ECD99mTc
C.14.1. Biokinetic model
(C 36) N,N 0-1,2-ethylenediylbis-L-cysteinediethylester (ECD, Neurolite), labelled
with 99mTc, is a neutral lipophilic complex that crosses the intact blood–brain barrier
rapidly and is retained in the brain for a long time, making it possible to performdetailed tomographic studies of the regional cerebral blood flow.
(C 37) Kinetic data from humans (Holman et al., 1989; Vallabhajosula et al., 1989;
Leveille et al., 1992) have shown that the substance is cleared rapidly from the blood
after intravenous injection. Uptake in the brain reaches a maximum of 4.9–6.5%
within 1 min and remains relatively constant over several hours. Early whole-body
imaging also shows uptake in lungs, liver, kidneys, and thyroid.
(C 38) In the model, it is assumed that there is immediate cellular uptake of the
substance in the brain (0.06), lungs (0.06), liver (0.20), kidneys (0.10), and thyroid(0.003). The activity in the brain is cleared bi-exponentially with half-times of 1 h
(0.40) and 1.5 days (0.60). At 48 h, approximately 80% has been excreted in urine
and 20% in faeces. Activity in the liver is assumed to be excreted through the intes-
tines, partly via the gallbladder, according to the model described in Section A.9 in
Publication 53 (ICRP, 1987). The rest of the activity is assumed to be excreted via the
kidneys and urinary bladder.
(C 39) For children, the fractional uptake in the brain is higher due to the relative
weight of the brain (Barthel et al., 1997).
C.14.2. References for 99mTc-ECD
Barthel, H., Wiener, M., Dannenberg, C., Bettin, S., Sattler, B., Knapp, W.H., 1997. Age-specific cerebral
perfusion in 4- to 15-year-old children: a high-resolution brain SPET study using 99mTc-ECD. Eur. J.
Nucl. Med. 24, 1245–1252.
Holman, B.L., Hellman, R.S., Goldsmith, S.J., Mena, I., Leveille, J., Gherardi, P.G., Moretti, J.L.,
Bischof-Delaloye, A., Hill, T.C., Rigo, P.M., Van Heertum, R.L., Ell, P.J., Buell, U., De Roo, M.C.,
Morgan, R.A., 1989. Biodistribution, dosimetry and clinical evaluation of technetium-99m ethyl
cysteinate dimer in normal subjects and in patients with chronic cerebral infarction. J. Nucl. Med. 30,
1018–1024.
ICRP, 1987. Radiation dose to patients from radiopharmaceuticals. ICRP Publication 53. Ann. ICRP 18
(1–4).
Leveille, J., Demonceau, G., Walovitch, R.C., 1992. Intrasubject comparison between technetium-99m-
ECD and technetium-99m-HMPAO in healthy human subjects. J. Nucl. Med. 33, 480–484.
Vallabhajosula, S., Zimmerman, R.E., Picard, M., Stritzke, P., Mena, I., Hellman, R.S., Tikofsky, R.S.,
Stabin, M.G., Morgan, R.A., Goldsmith, S.J., 1989. Technetium-99m ECD: a new brain imaging
agent: in vivo kinetics and biodistribution studies in normal human subjects. J. Nucl. Med. 30, 599–
604.
105
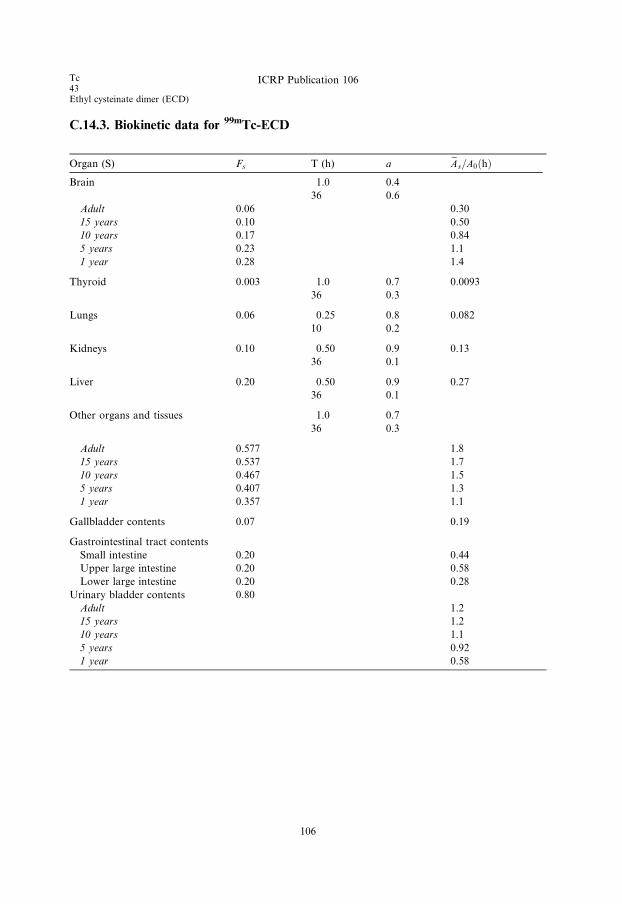
C.14.3. Biokinetic data for 99mTc-ECD
Organ (S) Fs T (h) a eAs=A0ðhÞBrain 1.0 0.4
36 0.6
Adult 0.06 0.30
15 years 0.10 0.50
10 years 0.17 0.84
5 years 0.23 1.1
1 year 0.28 1.4
Thyroid 0.003 1.0 0.7 0.0093
36 0.3
Lungs 0.06 0.25 0.8 0.082
10 0.2
Kidneys 0.10 0.50 0.9 0.13
36 0.1
Liver 0.20 0.50 0.9 0.27
36 0.1
Other organs and tissues 1.0 0.7
36 0.3
Adult 0.577 1.8
15 years 0.537 1.7
10 years 0.467 1.5
5 years 0.407 1.3
1 year 0.357 1.1
Gallbladder contents 0.07 0.19
Gastrointestinal tract contents
Small intestine 0.20 0.44
Upper large intestine 0.20 0.58
Lower large intestine 0.20 0.28
Urinary bladder contents 0.80
Adult 1.2
15 years 1.2
10 years 1.1
5 years 0.92
1 year 0.58
Tc43Ethyl cysteinate dimer (ECD)
ICRP Publication 106
106
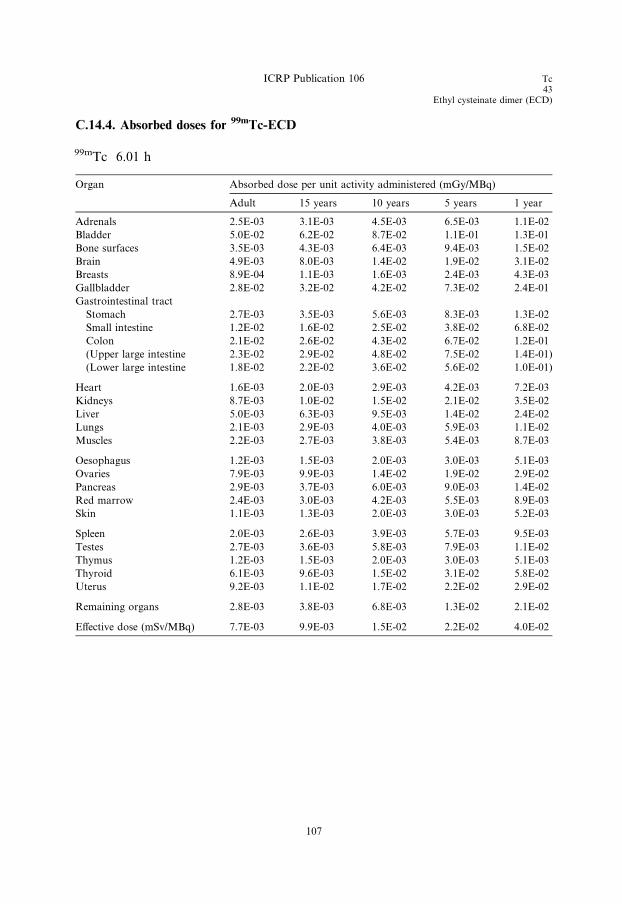
C.14.4. Absorbed doses for 99mTc-ECD
99mTc 6.01 h
Organ Absorbed dose per unit activity administered (mGy/MBq)
Adult 15 years 10 years 5 years 1 year
Adrenals 2.5E-03 3.1E-03 4.5E-03 6.5E-03 1.1E-02
Bladder 5.0E-02 6.2E-02 8.7E-02 1.1E-01 1.3E-01
Bone surfaces 3.5E-03 4.3E-03 6.4E-03 9.4E-03 1.5E-02
Brain 4.9E-03 8.0E-03 1.4E-02 1.9E-02 3.1E-02
Breasts 8.9E-04 1.1E-03 1.6E-03 2.4E-03 4.3E-03
Gallbladder 2.8E-02 3.2E-02 4.2E-02 7.3E-02 2.4E-01
Gastrointestinal tract
Stomach 2.7E-03 3.5E-03 5.6E-03 8.3E-03 1.3E-02
Small intestine 1.2E-02 1.6E-02 2.5E-02 3.8E-02 6.8E-02
Colon 2.1E-02 2.6E-02 4.3E-02 6.7E-02 1.2E-01
(Upper large intestine 2.3E-02 2.9E-02 4.8E-02 7.5E-02 1.4E-01)
(Lower large intestine 1.8E-02 2.2E-02 3.6E-02 5.6E-02 1.0E-01)
Heart 1.6E-03 2.0E-03 2.9E-03 4.2E-03 7.2E-03
Kidneys 8.7E-03 1.0E-02 1.5E-02 2.1E-02 3.5E-02
Liver 5.0E-03 6.3E-03 9.5E-03 1.4E-02 2.4E-02
Lungs 2.1E-03 2.9E-03 4.0E-03 5.9E-03 1.1E-02
Muscles 2.2E-03 2.7E-03 3.8E-03 5.4E-03 8.7E-03
Oesophagus 1.2E-03 1.5E-03 2.0E-03 3.0E-03 5.1E-03
Ovaries 7.9E-03 9.9E-03 1.4E-02 1.9E-02 2.9E-02
Pancreas 2.9E-03 3.7E-03 6.0E-03 9.0E-03 1.4E-02
Red marrow 2.4E-03 3.0E-03 4.2E-03 5.5E-03 8.9E-03
Skin 1.1E-03 1.3E-03 2.0E-03 3.0E-03 5.2E-03
Spleen 2.0E-03 2.6E-03 3.9E-03 5.7E-03 9.5E-03
Testes 2.7E-03 3.6E-03 5.8E-03 7.9E-03 1.1E-02
Thymus 1.2E-03 1.5E-03 2.0E-03 3.0E-03 5.1E-03
Thyroid 6.1E-03 9.6E-03 1.5E-02 3.1E-02 5.8E-02
Uterus 9.2E-03 1.1E-02 1.7E-02 2.2E-02 2.9E-02
Remaining organs 2.8E-03 3.8E-03 6.8E-03 1.3E-02 2.1E-02
Effective dose (mSv/MBq) 7.7E-03 9.9E-03 1.5E-02 2.2E-02 4.0E-02
ICRP Publication 106 Tc43
Ethyl cysteinate dimer (ECD)
107

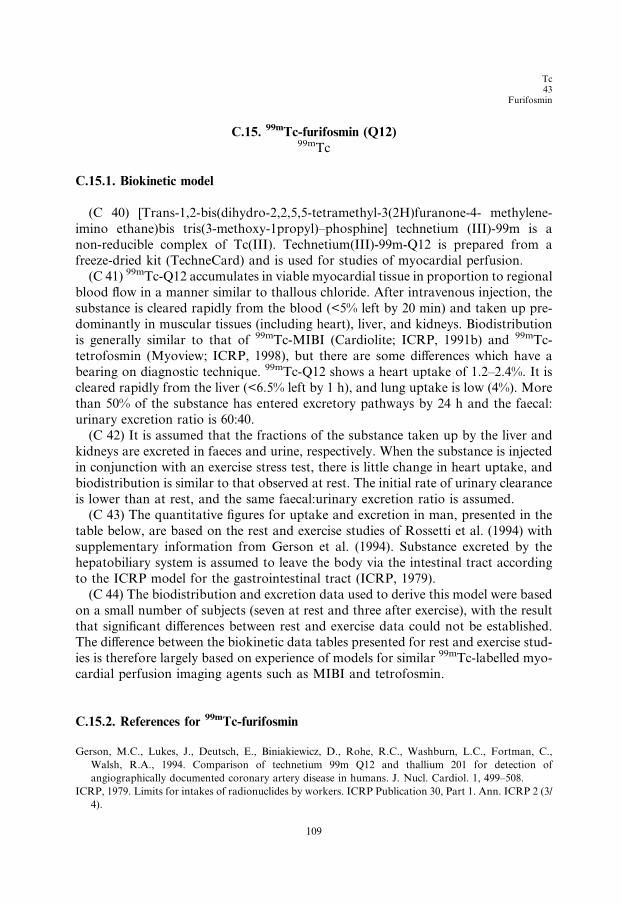
Tc43
Furifosmin
C.15. 99mTc-furifosmin (Q12)99mTc
C.15.1. Biokinetic model
(C 40) [Trans-1,2-bis(dihydro-2,2,5,5-tetramethyl-3(2H)furanone-4- methylene-
imino ethane)bis tris(3-methoxy-1propyl)–phosphine] technetium (III)-99m is a
non-reducible complex of Tc(III). Technetium(III)-99m-Q12 is prepared from afreeze-dried kit (TechneCard) and is used for studies of myocardial perfusion.
(C 41) 99mTc-Q12 accumulates in viable myocardial tissue in proportion to regional
blood flow in a manner similar to thallous chloride. After intravenous injection, the
substance is cleared rapidly from the blood (<5% left by 20 min) and taken up pre-
dominantly in muscular tissues (including heart), liver, and kidneys. Biodistribution
is generally similar to that of 99mTc-MIBI (Cardiolite; ICRP, 1991b) and 99mTc-
tetrofosmin (Myoview; ICRP, 1998), but there are some differences which have a
bearing on diagnostic technique. 99mTc-Q12 shows a heart uptake of 1.2–2.4%. It iscleared rapidly from the liver (<6.5% left by 1 h), and lung uptake is low (4%). More
than 50% of the substance has entered excretory pathways by 24 h and the faecal:
urinary excretion ratio is 60:40.
(C 42) It is assumed that the fractions of the substance taken up by the liver and
kidneys are excreted in faeces and urine, respectively. When the substance is injected
in conjunction with an exercise stress test, there is little change in heart uptake, and
biodistribution is similar to that observed at rest. The initial rate of urinary clearance
is lower than at rest, and the same faecal:urinary excretion ratio is assumed.(C 43) The quantitative figures for uptake and excretion in man, presented in the
table below, are based on the rest and exercise studies of Rossetti et al. (1994) with
supplementary information from Gerson et al. (1994). Substance excreted by the
hepatobiliary system is assumed to leave the body via the intestinal tract according
to the ICRP model for the gastrointestinal tract (ICRP, 1979).
(C 44) The biodistribution and excretion data used to derive this model were based
on a small number of subjects (seven at rest and three after exercise), with the result
that significant differences between rest and exercise data could not be established.The difference between the biokinetic data tables presented for rest and exercise stud-
ies is therefore largely based on experience of models for similar 99mTc-labelled myo-
cardial perfusion imaging agents such as MIBI and tetrofosmin.
C.15.2. References for 99mTc-furifosmin
Gerson, M.C., Lukes, J., Deutsch, E., Biniakiewicz, D., Rohe, R.C., Washburn, L.C., Fortman, C.,
Walsh, R.A., 1994. Comparison of technetium 99m Q12 and thallium 201 for detection of
angiographically documented coronary artery disease in humans. J. Nucl. Cardiol. 1, 499–508.
ICRP, 1979. Limits for intakes of radionuclides by workers. ICRP Publication 30, Part 1. Ann. ICRP 2 (3/
4).
109

Tc43Furifosmin
ICRP Publication 106
ICRP, 1991b. Radiation dose to patients from radiopharmaceuticals. Addendum 1 to ICRP Publication
53, in: Radiological protection in biomedical research. ICRP Publication 62. Ann. ICRP 22 (3).
ICRP, 1998. Radiation dose to patients from radiopharmaceuticals. Addendum 2 to ICRP Publication 53.
ICRP Publication 80. Ann. ICRP 28 (3).
Rossetti, C., Vanoli, G., Paganelli, G., Kwiatkowski, M., Zito, F., Colombo, F., Bonino, C., Carpinelli,
A., Casati, R., Deutsch, K., Marmion, M., Woulfe, S.R., Lunghi, F., Deutsch, E., Fazio, F., 1994.
Human biodistribution, dosimetry and clinical use of technetium (III)-99m-Q12. J. Nucl. Med. 35,
1571–1580.
110
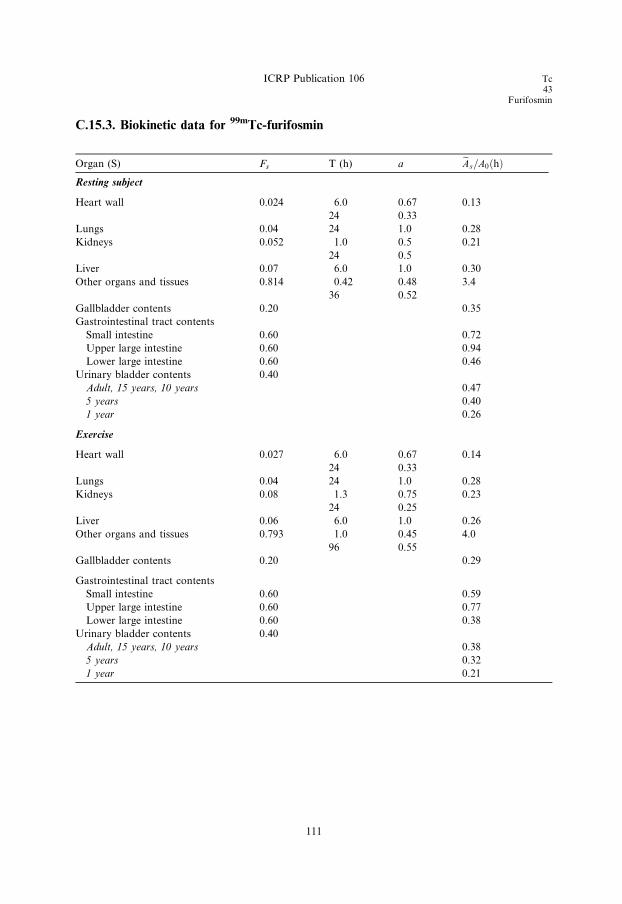
C.15.3. Biokinetic data for 99mTc-furifosmin
Organ (S) Fs T (h) a eAs=A0ðhÞResting subject
Heart wall 0.024 6.0 0.67 0.13
24 0.33
Lungs 0.04 24 1.0 0.28
Kidneys 0.052 1.0 0.5 0.21
24 0.5
Liver 0.07 6.0 1.0 0.30
Other organs and tissues 0.814 0.42 0.48 3.4
36 0.52
Gallbladder contents 0.20 0.35
Gastrointestinal tract contents
Small intestine 0.60 0.72
Upper large intestine 0.60 0.94
Lower large intestine 0.60 0.46
Urinary bladder contents 0.40
Adult, 15 years, 10 years 0.47
5 years 0.40
1 year 0.26
Exercise
Heart wall 0.027 6.0 0.67 0.14
24 0.33
Lungs 0.04 24 1.0 0.28
Kidneys 0.08 1.3 0.75 0.23
24 0.25
Liver 0.06 6.0 1.0 0.26
Other organs and tissues 0.793 1.0 0.45 4.0
96 0.55
Gallbladder contents 0.20 0.29
Gastrointestinal tract contents
Small intestine 0.60 0.59
Upper large intestine 0.60 0.77
Lower large intestine 0.60 0.38
Urinary bladder contents 0.40
Adult, 15 years, 10 years 0.38
5 years 0.32
1 year 0.21
ICRP Publication 106 Tc43
Furifosmin
111
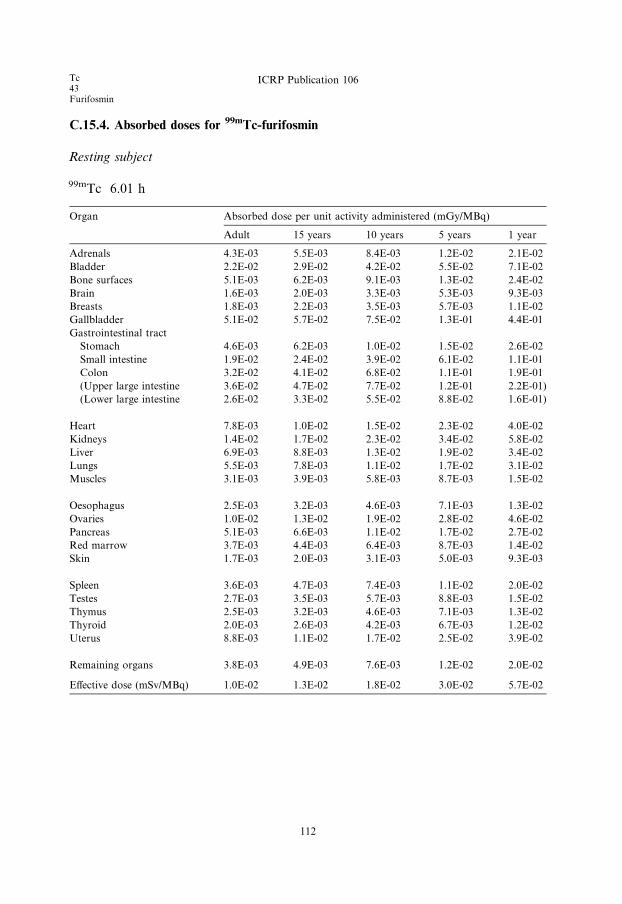
C.15.4. Absorbed doses for 99mTc-furifosmin
Resting subject
99mTc 6.01 h
Organ Absorbed dose per unit activity administered (mGy/MBq)
Adult 15 years 10 years 5 years 1 year
Adrenals 4.3E-03 5.5E-03 8.4E-03 1.2E-02 2.1E-02
Bladder 2.2E-02 2.9E-02 4.2E-02 5.5E-02 7.1E-02
Bone surfaces 5.1E-03 6.2E-03 9.1E-03 1.3E-02 2.4E-02
Brain 1.6E-03 2.0E-03 3.3E-03 5.3E-03 9.3E-03
Breasts 1.8E-03 2.2E-03 3.5E-03 5.7E-03 1.1E-02
Gallbladder 5.1E-02 5.7E-02 7.5E-02 1.3E-01 4.4E-01
Gastrointestinal tract
Stomach 4.6E-03 6.2E-03 1.0E-02 1.5E-02 2.6E-02
Small intestine 1.9E-02 2.4E-02 3.9E-02 6.1E-02 1.1E-01
Colon 3.2E-02 4.1E-02 6.8E-02 1.1E-01 1.9E-01
(Upper large intestine 3.6E-02 4.7E-02 7.7E-02 1.2E-01 2.2E-01)
(Lower large intestine 2.6E-02 3.3E-02 5.5E-02 8.8E-02 1.6E-01)
Heart 7.8E-03 1.0E-02 1.5E-02 2.3E-02 4.0E-02
Kidneys 1.4E-02 1.7E-02 2.3E-02 3.4E-02 5.8E-02
Liver 6.9E-03 8.8E-03 1.3E-02 1.9E-02 3.4E-02
Lungs 5.5E-03 7.8E-03 1.1E-02 1.7E-02 3.1E-02
Muscles 3.1E-03 3.9E-03 5.8E-03 8.7E-03 1.5E-02
Oesophagus 2.5E-03 3.2E-03 4.6E-03 7.1E-03 1.3E-02
Ovaries 1.0E-02 1.3E-02 1.9E-02 2.8E-02 4.6E-02
Pancreas 5.1E-03 6.6E-03 1.1E-02 1.7E-02 2.7E-02
Red marrow 3.7E-03 4.4E-03 6.4E-03 8.7E-03 1.4E-02
Skin 1.7E-03 2.0E-03 3.1E-03 5.0E-03 9.3E-03
Spleen 3.6E-03 4.7E-03 7.4E-03 1.1E-02 2.0E-02
Testes 2.7E-03 3.5E-03 5.7E-03 8.8E-03 1.5E-02
Thymus 2.5E-03 3.2E-03 4.6E-03 7.1E-03 1.3E-02
Thyroid 2.0E-03 2.6E-03 4.2E-03 6.7E-03 1.2E-02
Uterus 8.8E-03 1.1E-02 1.7E-02 2.5E-02 3.9E-02
Remaining organs 3.8E-03 4.9E-03 7.6E-03 1.2E-02 2.0E-02
Effective dose (mSv/MBq) 1.0E-02 1.3E-02 1.8E-02 3.0E-02 5.7E-02
Tc43Furifosmin
ICRP Publication 106
112

Exercise
99mTc 6.01 h
Organ Absorbed dose per unit activity administered (mGy/MBq)
Adult 15 years 10 years 5 years 1 year
Adrenals 4.5E-03 5.7E-03 8.7E-03 1.3E-02 2.2E-02
Bladder 1.8E-02 2.3E-02 3.4E-02 4.4E-02 5.8E-02
Bone surfaces 5.5E-03 6.6E-03 9.7E-03 1.4E-02 2.6E-02
Brain 1.9E-03 2.4E-03 3.9E-03 6.3E-03 1.1E-02
Breasts 2.0E-03 2.5E-03 3.9E-03 6.2E-03 1.2E-02
Gallbladder 4.3E-02 4.9E-02 6.3E-02 1.1E-01 3.6E-01
Gastrointestinal tract
Stomach 4.6E-03 6.2E-03 1.0E-02 1.5E-02 2.5E-02
Small intestine 1.6E-02 2.1E-02 3.3E-02 5.1E-02 9.2E-02
Colon 2.7E-02 3.4E-02 5.7E-02 8.9E-02 1.7E-01
(Upper large intestine 3.0E-02 3.9E-02 6.4E-02 1.0E-01 1.9E-01)
(Lower large intestine 2.2E-02 2.8E-02 4.7E-02 7.4E-02 1.4E-01)
Heart 8.7E-03 1.1E-02 1.7E-02 2.5E-02 4.4E-02
Kidneys 1.5E-02 1.8E-02 2.5E-02 3.6E-02 6.1E-02
Liver 6.3E-03 7.9E-03 1.2E-02 1.7E-02 3.0E-02
Lungs 5.6E-03 8.0E-03 1.1E-02 1.7E-02 3.1E-02
Muscles 3.2E-03 4.0E-03 6.0E-03 9.0E-03 1.6E-02
Oesophagus 2.9E-03 3.6E-03 5.2E-03 8.1E-03 1.4E-02
Ovaries 9.2E-03 1.2E-02 1.7E-02 2.5E-02 4.2E-02
Pancreas 5.2E-03 6.7E-03 1.1E-02 1.6E-02 2.7E-02
Red marrow 3.7E-03 4.5E-03 6.6E-03 9.1E-03 1.5E-02
Skin 1.8E-03 2.2E-03 3.4E-03 5.5E-03 1.0E-02
Spleen 3.9E-03 4.9E-03 7.8E-03 1.2E-02 2.1E-02
Testes 2.8E-03 3.6E-03 5.7E-03 8.9E-03 1.5E-02
Thymus 2.9E-03 3.6E-03 5.2E-03 8.1E-03 1.4E-02
Thyroid 2.4E-03 3.0E-03 4.9E-03 7.8E-03 1.4E-02
Uterus 7.9E-03 9.9E-03 1.5E-02 2.2E-02 3.6E-02
Remaining organs 3.8E-03 4.9E-03 7.5E-03 1.2E-02 2.0E-02
Effective dose (mSv/MBq) 8.9E-03 1.1E-02 1.6E-02 2.7E-02 5.1E-02
ICRP Publication 106 Tc43
Furifosmin
113

Tc43Furifosmin
ICRP Publication 106
T43
Monoclonal antibodies
C.16. 99mTc-labelled monoclonal tumour-associated antibodies99mTc
C.16.1. Biokinetic model
(C 45) Radiolabelled monoclonal antibodies against antigenic substances within
or on the surface of malignant cells are used in medical research and for diagnosis
and treatment of cancer. The antibody is an immunoglobulin, usually IgG1 or IgG2a,and is used either as the intact molecule (molecular weight 150 kDa) or as fragments
F(ab 0)2 (100 kDa) and Fab 0 (50 kDa). Antibodies against a large number of tumour-
associated antigens have been produced and investigated, but only a few are now in
regular use as commercial products for diagnostic purposes.
(C 46) There is great variation in production with regard to type of antigen, type
of cells used (mouse, goat, human etc.), and possible genetic modification (chimeric,
humanised). There is also variation in the mode of application of the product, with
regard to amount of substance administered, possible pre-treatment with unlabelledantibody or other modifying substances, route of administration (intravenous injec-
tion or infusion, subcutaneous or intraperitoneal injection etc.), type of radionuclide
used as label, and method of labelling.
(C 47) In spite of these variations, certain common features in the behaviour of the
antibodies can be distinguished. Directly after intravenous injection, the highest
activity is seen in organs with high vascular perfusion, such as liver, spleen, bone
marrow, and kidneys. Organ uptake is mainly a function of molecular size; intact
molecules are taken up mainly in the liver and bone marrow, while smaller fragmentsconcentrate to a higher degree in the kidneys. Also, the rate of degradation and elim-
ination is mainly a function of molecular size, being more rapid with the smaller
fragments.
(C 48) Based on these general properties, a set of models can be defined, assuming
principal uptake in the above-mentioned organs and an even distribution of the
remainder in the rest of the body. The quantitative data for uptake and elimination
have been defined after an extensive survey of published reports, and are to be looked
upon as typical values for the intact antibody and ‘large’ and ‘small’ fragments.(C 49) The antibodies and fragments are metabolised within the body. The tech-
netium thus set free is then assumed to be handled by the body according to the
biokinetic model for pertechnetate (ICRP, 1987). The contribution from released
technetium can be calculated as:
T p � T eff
T eff
where Tp is the physical half-life, and Teff is the effective half-life for the antibody.
115
Tc43Monoclonal antibodies
ICRP Publication 106
C.16.2. References and further reading for 99mTc-labelled monoclonal antibodies
Bischof Delaloye, A., Delaloye, B., 1995. Radiolabelled monoclonal antibodies in tumour imaging and
therapy: out of fashion? Eur. J. Nucl. Med. 22, 571–580.
Britton, K.E., Granowska, M., 1987. Radioimmunoscintigraphy in tumour identification. Cancer Surv. 6,
247–267.
Fishman, A.J., Khaw, B.A., Strauss, H.N., 1989. Quo vadis radioimmune imaging. J. Nucl. Med. 20,
1911–1915.
ICRP, 1987. Radiation dose to patients from radiopharmaceuticals. ICRP Publication 53. Ann. ICRP 18
(1–4).
116
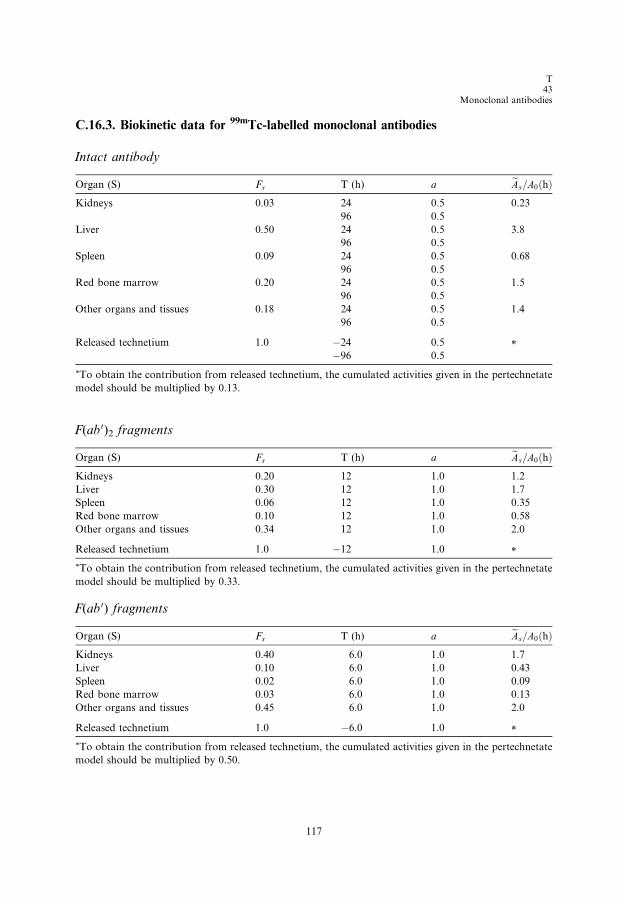
T43
Monoclonal antibodies
C.16.3. Biokinetic data for 99mTc-labelled monoclonal antibodies
Intact antibody
Organ (S) Fs T (h) a eAs=A0ðhÞKidneys 0.03 24 0.5 0.23
96 0.5
Liver 0.50 24 0.5 3.8
96 0.5
Spleen 0.09 24 0.5 0.68
96 0.5
Red bone marrow 0.20 24 0.5 1.5
96 0.5
Other organs and tissues 0.18 24 0.5 1.4
96 0.5
Released technetium 1.0 �24 0.5 *�96 0.5
*To obtain the contribution from released technetium, the cumulated activities given in the pertechnetate
model should be multiplied by 0.13.
F(ab 0)2 fragments
Organ (S) Fs T (h) a eAs=A0ðhÞKidneys 0.20 12 1.0 1.2
Liver 0.30 12 1.0 1.7
Spleen 0.06 12 1.0 0.35
Red bone marrow 0.10 12 1.0 0.58
Other organs and tissues 0.34 12 1.0 2.0
Released technetium 1.0 �12 1.0 *
*To obtain the contribution from released technetium, the cumulated activities given in the pertechnetate
model should be multiplied by 0.33.
F(ab 0) fragments
Organ (S) Fs T (h) a eAs=A0ðhÞKidneys 0.40 6.0 1.0 1.7
Liver 0.10 6.0 1.0 0.43
Spleen 0.02 6.0 1.0 0.09
Red bone marrow 0.03 6.0 1.0 0.13
Other organs and tissues 0.45 6.0 1.0 2.0
Released technetium 1.0 �6.0 1.0 *
*To obtain the contribution from released technetium, the cumulated activities given in the pertechnetate
model should be multiplied by 0.50.
117

Tc43Monoclonal antibodies
ICRP Publication 106
C.16.4. Absorbed doses for 99mTc-labelled monoclonal antibodies
Intact antibody
99mTc 6.01 h
Organ Absorbed dose per unit activity administered (mGy/MBq)
Adult 15 years 10 years 5 years 1 year
Adrenals 1.0E-02 1.2E-02 1.8E-02 2.4E-02 3.7E-02
Bladder 3.7E-03 4.9E-03 6.9E-03 9.6E-03 1.6E-02
Bone surfaces 1.2E-02 1.6E-02 2.6E-02 4.4E-02 1.0E-01
Brain 1.4E-03 1.7E-03 2.6E-03 4.2E-03 7.9E-03
Breasts 2.1E-03 2.6E-03 4.3E-03 6.6E-03 1.2E-02
Gallbladder 1.5E-02 1.7E-02 2.4E-02 3.7E-02 6.1E-02
Gastrointestinal tract
Stomach 8.4E-03 1.1E-02 1.6E-02 2.6E-02 4.6E-02
Small intestine 5.6E-03 7.0E-03 1.1E-02 1.7E-02 2.9E-02
Colon 8.9E-03 1.1E-02 1.9E-02 3.0E-02 5.4E-02
(Upper large intestine 1.2E-02 1.5E-02 2.5E-02 4.1E-02 7.3E-02)
(Lower large intestine 4.9E-03 6.4E-03 1.0E-02 1.6E-02 2.8E-02)
Heart 5.5E-03 6.9E-03 1.0E-02 1.4E-02 2.5E-02
Kidneys 1.9E-02 2.2E-02 3.2E-02 4.5E-02 7.4E-02
Liver 4.5E-02 5.8E-02 8.5E-02 1.2E-01 2.1E-01
Lungs 4.9E-03 6.3E-03 8.7E-03 1.3E-02 2.2E-02
Muscle 2.9E-03 3.7E-03 5.4E-03 7.9E-03 1.4E-02
Oesophagus 2.5E-03 3.0E-03 4.3E-03 6.5E-03 1.1E-02
Ovaries 4.0E-03 5.1E-03 7.6E-03 1.1E-02 1.9E-02
Pancreas 1.1E-02 1.4E-02 2.0E-02 3.0E-02 4.8E-02
Red marrow 1.7E-02 1.9E-02 3.0E-02 5.2E-02 1.1E-01
Salivary glands 4.2E-03 5.4E-03 7.6E-03 1.1E-02 1.7E-02
Skin 1.6E-03 1.9E-03 3.0E-03 4.7E-03 8.9E-03
Spleen 6.0E-02 8.4E-02 1.3E-01 1.9E-01 3.4E-01
Testes 1.3E-03 1.6E-03 2.6E-03 4.2E-03 7.7E-03
Thymus 2.5E-03 3.0E-03 4.3E-03 6.5E-03 1.1E-02
Thyroid 4.0E-03 6.0E-03 9.2E-03 1.9E-02 3.5E-02
Uterus 3.3E-03 4.2E-03 6.6E-03 1.0E-02 1.7E-02
Remaining organs 3.1E-03 4.0E-03 5.8E-03 8.7E-03 1.4E-02
Effective dose (mSv/MBq) 9.8E-03 1.2E-02 1.9E-02 3.0E-02 5.4E-02
118
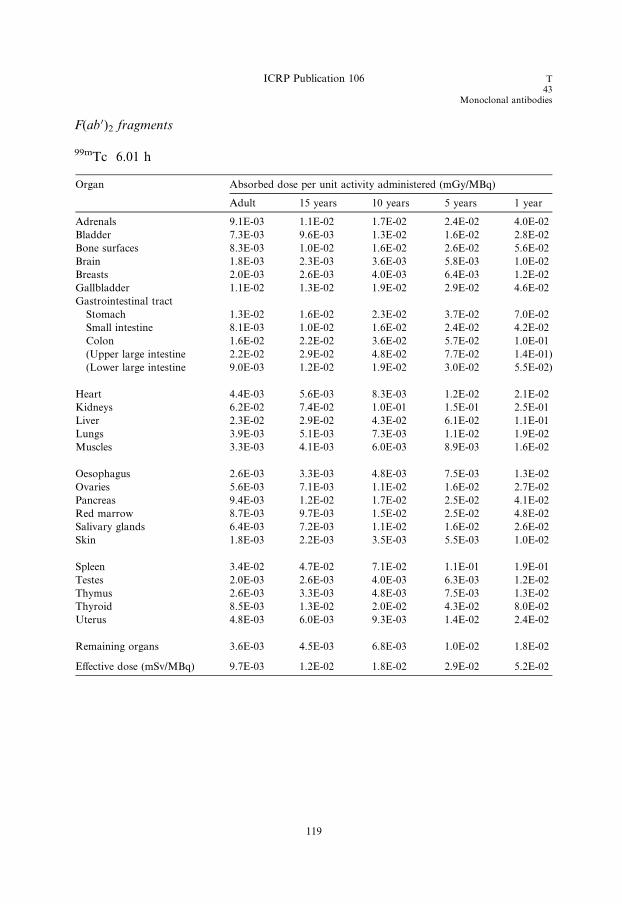
ICRP Publication 106 T43
Monoclonal antibodies
F(ab 0)2 fragments
99mTc 6.01 h
Organ Absorbed dose per unit activity administered (mGy/MBq)
Adult 15 years 10 years 5 years 1 year
Adrenals 9.1E-03 1.1E-02 1.7E-02 2.4E-02 4.0E-02
Bladder 7.3E-03 9.6E-03 1.3E-02 1.6E-02 2.8E-02
Bone surfaces 8.3E-03 1.0E-02 1.6E-02 2.6E-02 5.6E-02
Brain 1.8E-03 2.3E-03 3.6E-03 5.8E-03 1.0E-02
Breasts 2.0E-03 2.6E-03 4.0E-03 6.4E-03 1.2E-02
Gallbladder 1.1E-02 1.3E-02 1.9E-02 2.9E-02 4.6E-02
Gastrointestinal tract
Stomach 1.3E-02 1.6E-02 2.3E-02 3.7E-02 7.0E-02
Small intestine 8.1E-03 1.0E-02 1.6E-02 2.4E-02 4.2E-02
Colon 1.6E-02 2.2E-02 3.6E-02 5.7E-02 1.0E-01
(Upper large intestine 2.2E-02 2.9E-02 4.8E-02 7.7E-02 1.4E-01)
(Lower large intestine 9.0E-03 1.2E-02 1.9E-02 3.0E-02 5.5E-02)
Heart 4.4E-03 5.6E-03 8.3E-03 1.2E-02 2.1E-02
Kidneys 6.2E-02 7.4E-02 1.0E-01 1.5E-01 2.5E-01
Liver 2.3E-02 2.9E-02 4.3E-02 6.1E-02 1.1E-01
Lungs 3.9E-03 5.1E-03 7.3E-03 1.1E-02 1.9E-02
Muscles 3.3E-03 4.1E-03 6.0E-03 8.9E-03 1.6E-02
Oesophagus 2.6E-03 3.3E-03 4.8E-03 7.5E-03 1.3E-02
Ovaries 5.6E-03 7.1E-03 1.1E-02 1.6E-02 2.7E-02
Pancreas 9.4E-03 1.2E-02 1.7E-02 2.5E-02 4.1E-02
Red marrow 8.7E-03 9.7E-03 1.5E-02 2.5E-02 4.8E-02
Salivary glands 6.4E-03 7.2E-03 1.1E-02 1.6E-02 2.6E-02
Skin 1.8E-03 2.2E-03 3.5E-03 5.5E-03 1.0E-02
Spleen 3.4E-02 4.7E-02 7.1E-02 1.1E-01 1.9E-01
Testes 2.0E-03 2.6E-03 4.0E-03 6.3E-03 1.2E-02
Thymus 2.6E-03 3.3E-03 4.8E-03 7.5E-03 1.3E-02
Thyroid 8.5E-03 1.3E-02 2.0E-02 4.3E-02 8.0E-02
Uterus 4.8E-03 6.0E-03 9.3E-03 1.4E-02 2.4E-02
Remaining organs 3.6E-03 4.5E-03 6.8E-03 1.0E-02 1.8E-02
Effective dose (mSv/MBq) 9.7E-03 1.2E-02 1.8E-02 2.9E-02 5.2E-02
119

Tc43Monoclonal antibodies
ICRP Publication 106
F(ab 0) fragments
99mTc 6.01 h
Organ Absorbed dose per unit activity administered (mGy/MBq)
Adult 15 years 10 years 5 years 1 year
Adrenals 8.4E-03 1.1E-02 1.6E-02 2.4E-02 4.2E-02
Bladder 1.0E-02 1.3E-02 1.7E-02 2.0E-02 3.7E-02
Bone surfaces 6.3E-03 7.5E-03 1.1E-02 1.7E-02 3.2E-02
Brain 2.0E-03 2.5E-03 4.1E-03 6.5E-03 1.2E-02
Breasts 1.9E-03 2.5E-03 3.8E-03 6.0E-03 1.1E-02
Gallbladder 8.7E-03 1.1E-02 1.7E-02 2.4E-02 3.6E-02
Gastrointestinal tract
Stomach 1.6E-02 2.1E-02 2.9E-02 4.6E-02 9.0E-02
Small intestine 1.0E-02 1.3E-02 2.0E-02 3.0E-02 5.2E-02
Colon 2.3E-02 3.0E-02 4.9E-02 8.0E-02 1.5E-01
(Upper large intestine 3.1E-02 4.0E-02 6.6E-02 1.1E-01 2.0E-01)
(Lower large intestine 1.2E-02 1.6E-02 2.6E-02 4.1E-02 7.6E-02)
Heart 3.7E-03 4.7E-03 7.1E-03 1.1E-02 1.8E-02
Kidneys 8.9E-02 1.1E-01 1.5E-01 2.1E-01 3.7E-01
Liver 8.7E-03 1.1E-02 1.7E-02 2.4E-02 4.0E-02
Lungs 3.1E-03 4.2E-03 6.2E-03 9.5E-03 1.7E-02
Muscles 3.4E-03 4.2E-03 6.2E-03 9.4E-03 1.7E-02
Oesophagus 2.6E-03 3.3E-03 4.9E-03 7.8E-03 1.4E-02
Ovaries 6.8E-03 8.6E-03 1.3E-02 1.9E-02 3.3E-02
Pancreas 8.1E-03 1.0E-02 1.5E-02 2.2E-02 3.5E-02
Red marrow 4.7E-03 5.5E-03 8.1E-03 1.2E-02 2.0E-02
Salivary glands 7.9E-03 9.8E-03 1.4E-02 1.9E-02 3.1E-02
Skin 1.9E-03 2.3E-03 3.7E-03 5.9E-03 1.1E-02
Spleen 1.4E-02 1.8E-02 2.8E-02 4.1E-02 7.0E-02
Testes 2.5E-03 3.2E-03 4.9E-03 7.5E-03 1.4E-02
Thymus 2.6E-03 3.3E-03 4.9E-03 7.8E-03 1.4E-02
Thyroid 1.2E-02 1.9E-02 2.9E-02 6.2E-02 1.2E-01
Uterus 5.8E-03 7.3E-03 1.1E-02 1.7E-02 2.8E-02
Remaining organs 3.7E-03 4.6E-03 6.9E-03 1.0E-02 1.8E-02
Effective dose (mSv/MBq) 1.1E-02 1.4E-02 2.0E-02 3.2E-02 5.9E-02
120
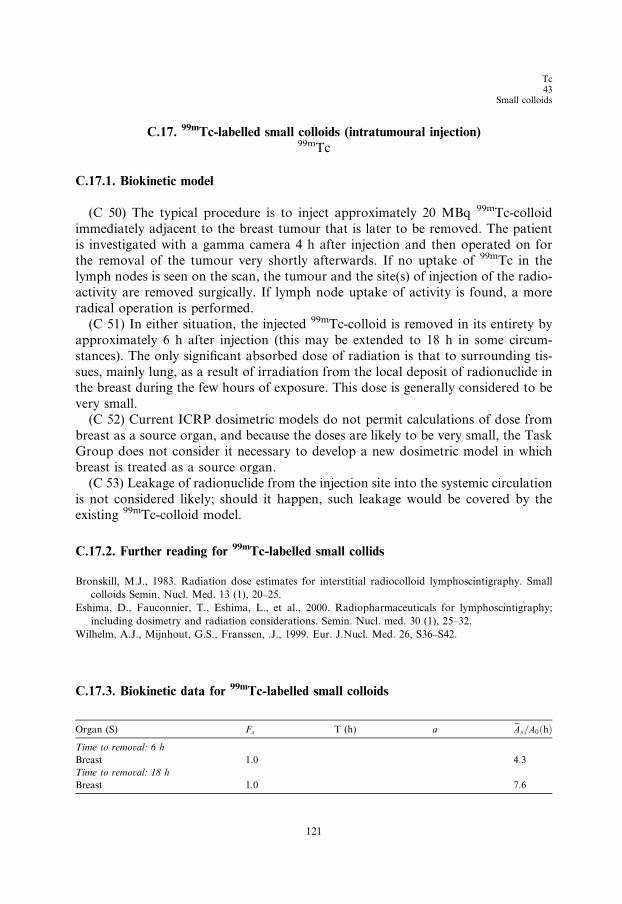
Tc43
Small colloids
C.17. 99mTc-labelled small colloids (intratumoural injection)99mTc
C.17.1. Biokinetic model
(C 50) The typical procedure is to inject approximately 20 MBq 99mTc-colloid
immediately adjacent to the breast tumour that is later to be removed. The patient
is investigated with a gamma camera 4 h after injection and then operated on forthe removal of the tumour very shortly afterwards. If no uptake of 99mTc in the
lymph nodes is seen on the scan, the tumour and the site(s) of injection of the radio-
activity are removed surgically. If lymph node uptake of activity is found, a more
radical operation is performed.
(C 51) In either situation, the injected 99mTc-colloid is removed in its entirety by
approximately 6 h after injection (this may be extended to 18 h in some circum-
stances). The only significant absorbed dose of radiation is that to surrounding tis-
sues, mainly lung, as a result of irradiation from the local deposit of radionuclide inthe breast during the few hours of exposure. This dose is generally considered to be
very small.
(C 52) Current ICRP dosimetric models do not permit calculations of dose from
breast as a source organ, and because the doses are likely to be very small, the Task
Group does not consider it necessary to develop a new dosimetric model in which
breast is treated as a source organ.
(C 53) Leakage of radionuclide from the injection site into the systemic circulation
is not considered likely; should it happen, such leakage would be covered by theexisting 99mTc-colloid model.
C.17.2. Further reading for 99mTc-labelled small collids
Bronskill, M.J., 1983. Radiation dose estimates for interstitial radiocolloid lymphoscintigraphy. Small
colloids Semin. Nucl. Med. 13 (1), 20–25.
Eshima, D., Fauconnier, T., Eshima, L., et al., 2000. Radiopharmaceuticals for lymphoscintigraphy;
including dosimetry and radiation considerations. Semin. Nucl. med. 30 (1), 25–32.
Wilhelm, A.J., Mijnhout, G.S., Franssen, .J., 1999. Eur. J.Nucl. Med. 26, S36–S42.
C.17.3. Biokinetic data for 99mTc-labelled small colloids
Organ (S) Fs T (h) a eAs=A0ðhÞ
121
Time to removal: 6 h
Breast
1.0 4.3Time to removal: 18 h
Breast
1.0 7.6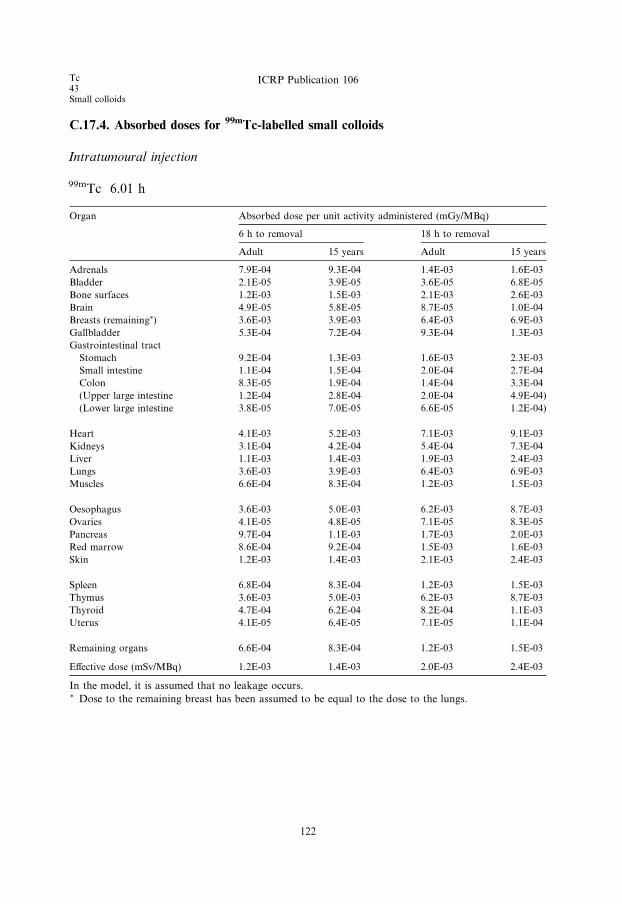
Tc43Small colloids
ICRP Publication 106
C.17.4. Absorbed doses for 99mTc-labelled small colloids
Intratumoural injection
99mTc 6.01 h
Organ
Absorbed dose per unit activity administered (mGy/MBq)6 h to removal
122
18 h to removal
Adult
15 years Adult 15 yearsAdrenals
7.9E-04 9.3E-04 1.4E-03 1.6E-03Bladder
2.1E-05 3.9E-05 3.6E-05 6.8E-05Bone surfaces
1.2E-03 1.5E-03 2.1E-03 2.6E-03Brain
4.9E-05 5.8E-05 8.7E-05 1.0E-04Breasts (remaining*)
3.6E-03 3.9E-03 6.4E-03 6.9E-03Gallbladder
5.3E-04 7.2E-04 9.3E-04 1.3E-03Gastrointestinal tract
Stomach
9.2E-04 1.3E-03 1.6E-03 2.3E-03Small intestine
1.1E-04 1.5E-04 2.0E-04 2.7E-04Colon
8.3E-05 1.9E-04 1.4E-04 3.3E-04(Upper large intestine
1.2E-04 2.8E-04 2.0E-04 4.9E-04)(Lower large intestine
3.8E-05 7.0E-05 6.6E-05 1.2E-04)Heart
4.1E-03 5.2E-03 7.1E-03 9.1E-03Kidneys
3.1E-04 4.2E-04 5.4E-04 7.3E-04Liver
1.1E-03 1.4E-03 1.9E-03 2.4E-03Lungs
3.6E-03 3.9E-03 6.4E-03 6.9E-03Muscles
6.6E-04 8.3E-04 1.2E-03 1.5E-03Oesophagus
3.6E-03 5.0E-03 6.2E-03 8.7E-03Ovaries
4.1E-05 4.8E-05 7.1E-05 8.3E-05Pancreas
9.7E-04 1.1E-03 1.7E-03 2.0E-03Red marrow
8.6E-04 9.2E-04 1.5E-03 1.6E-03Skin
1.2E-03 1.4E-03 2.1E-03 2.4E-03Spleen
6.8E-04 8.3E-04 1.2E-03 1.5E-03Thymus
3.6E-03 5.0E-03 6.2E-03 8.7E-03Thyroid
4.7E-04 6.2E-04 8.2E-04 1.1E-03Uterus
4.1E-05 6.4E-05 7.1E-05 1.1E-04Remaining organs
6.6E-04 8.3E-04 1.2E-03 1.5E-03Effective dose (mSv/MBq) 1.2E-03 1.4E-03 2.0E-03 2.4E-03
In the model, it is assumed that no leakage occurs.* Dose to the remaining breast has been assumed to be equal to the dose to the lungs.
Tc43
Tetrofosmin
C.18. 99mTc-tetrofosmin99mTc
C.18.1. Biokinetic model
(C 54) Technetium-99m-1,2-bis[bis(2-ethoxyethyl)phosphino]ethane is a lipophilic
technetium phosphine dioxo cation([99mTc(tetrofosmin)2O2]+) prepared from a
freeze-dried kit (Myoview). It is used for studies of myocardial perfusion.
Technetium-99m-tetrofosmin accumulates in viable myocardial tissue in proportion
to regional blood flow in a manner similar to thallous chloride. After intravenous
injection, the substance is cleared rapidly from the blood (<5% left by 10 min)and taken up predominantly in muscular tissues (including heart), liver, kidneys,
and salivary glands, with a smaller amount in the thyroid.
(C 55) Biodistribution is generally similar to that of technetium-99m-MIBI (Car-
diolite; ICRP, 1991b), but there are some differences that have a bearing on diagnos-
tic technique. Technetium-99m-tetrofosmin shows a heart uptake of 1.2% and is
cleared very rapidly from the liver (<4.5% left by 1 h) and lungs. More than 80%
of the substance is excreted in 48 h, and the faecal:urinary excretion is 54:46. When
the substance is injected in conjunction with an exercise stress test, there is a consid-erable increase of the uptake in skeletal muscle but little change in heart uptake. Ini-
tial rates of urinary and faecal clearance are lower than at rest and the faecal:urinary
excretion ratio is 46:54.
(C 56) The quantitative figures for uptake and excretion in man, presented in the
table below, are based on reports by Smith et al. (1992) and Higley et al. (1993). Sub-
stance excreted by the hepatobiliary system is assumed to leave the body via the
intestinal tract according to the Publication 30 gastrointestinal tract model (ICRP,
1979). The kidney–bladder model presented in Publication 53 (ICRP, 1987) is usedfor the substance excreted in urine.
C.18.2. References for 99mTc-tetrofosmin
Higley, B., Smith, F.W., Smith, T., Gemmell, H.G., Gupta, P.D., Gvozdanovic, D.V., Graham, D., Hinge,
D., Davidson, J., Lahiri, A., 1993. Technetium-99m-1,2-bis[bis(2-ethoxyethyl) phosphino]ethane:
human biodistribution, dosimetry and safety of a new myocardial perfusion imaging agent. J. Nucl.
Med. 34, 30–38.
ICRP, 1979. Limits for intakes of radionuclides by workers. ICRP Publication 30, Part 1. Ann. ICRP 2 (3/4).
ICRP, 1987. Radiation dose to patients from radiopharmaceuticals. ICRP Publication 53. Ann. ICRP 18
(1–4).
ICRP, 1991b. Radiation dose to patients from radiopharmaceuticals. Addendum 1 to ICRP Publication
53, in: Radiological protection in biomedical research. ICRP Publication 62. Ann. ICRP 22 (3).
Smith, T., Lahiri, A., Gemmell, H.G., Davidson, J., Smith, F.W., Pickett, R.D., Higley, B., 1992.
Dosimetry of 99mTc-P53 a new myocardial perfusion imaging agent. In: Schlafke-Stelson, A., Watson,
E.E. (Eds.), Fifth International Radiopharmaceutical Dosimetry Symposium. CONF-910529. Oak
Ridge Associated Universities, Oak Ridge, TN, pp. 467–481.
123
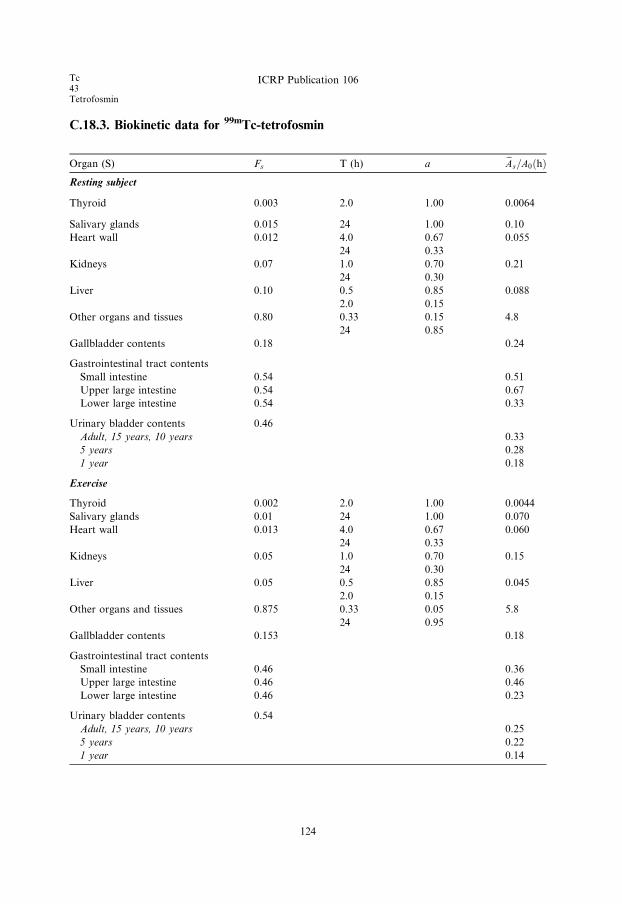
Tc43Tetrofosmin
ICRP Publication 106
C.18.3. Biokinetic data for 99mTc-tetrofosmin
Organ (S) Fs T (h) a eAs=A0ðhÞResting subject
Thyroid 0.003 2.0 1.00 0.0064
Salivary glands 0.015 24 1.00 0.10
Heart wall 0.012 4.0 0.67 0.055
24 0.33
Kidneys 0.07 1.0 0.70 0.21
24 0.30
Liver 0.10 0.5 0.85 0.088
2.0 0.15
Other organs and tissues 0.80 0.33 0.15 4.8
24 0.85
Gallbladder contents 0.18 0.24
Gastrointestinal tract contents
Small intestine 0.54 0.51
Upper large intestine 0.54 0.67
Lower large intestine 0.54 0.33
Urinary bladder contents 0.46
Adult, 15 years, 10 years 0.33
5 years 0.28
1 year 0.18
Exercise
Thyroid 0.002 2.0 1.00 0.0044
Salivary glands 0.01 24 1.00 0.070
Heart wall 0.013 4.0 0.67 0.060
24 0.33
Kidneys 0.05 1.0 0.70 0.15
24 0.30
Liver 0.05 0.5 0.85 0.045
2.0 0.15
Other organs and tissues 0.875 0.33 0.05 5.8
24 0.95
Gallbladder contents 0.153 0.18
Gastrointestinal tract contents
Small intestine 0.46 0.36
Upper large intestine 0.46 0.46
Lower large intestine 0.46 0.23
Urinary bladder contents 0.54
Adult, 15 years, 10 years 0.25
5 years 0.22
1 year 0.14
124
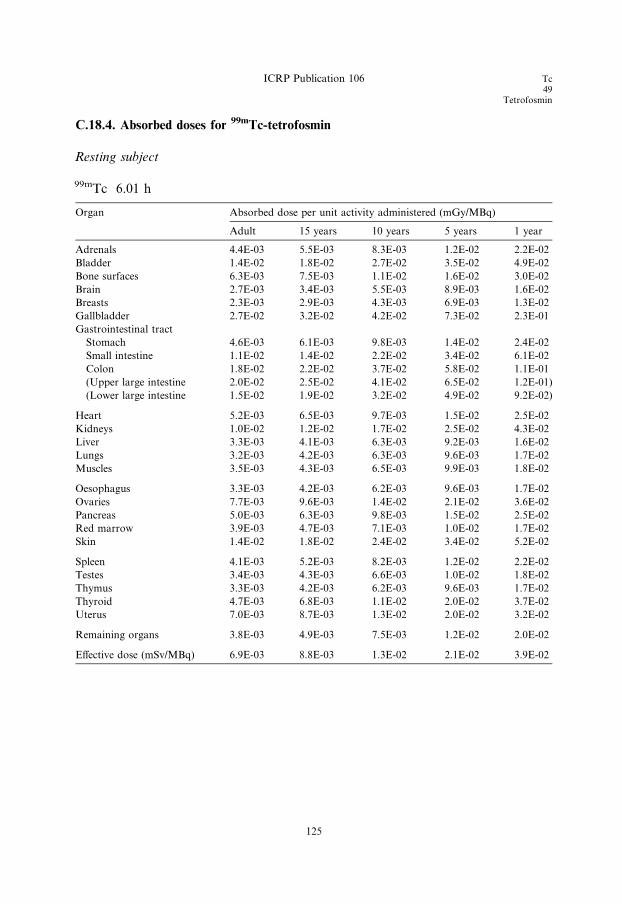
ICRP Publication 106 Tc49
Tetrofosmin
C.18.4. Absorbed doses for 99mTc-tetrofosmin
Resting subject
99mTc 6.01 h
Organ Absorbed dose per unit activity administered (mGy/MBq)
Adult 15 years 10 years 5 years 1 year
Adrenals 4.4E-03 5.5E-03 8.3E-03 1.2E-02 2.2E-02
Bladder 1.4E-02 1.8E-02 2.7E-02 3.5E-02 4.9E-02
Bone surfaces 6.3E-03 7.5E-03 1.1E-02 1.6E-02 3.0E-02
Brain 2.7E-03 3.4E-03 5.5E-03 8.9E-03 1.6E-02
Breasts 2.3E-03 2.9E-03 4.3E-03 6.9E-03 1.3E-02
Gallbladder 2.7E-02 3.2E-02 4.2E-02 7.3E-02 2.3E-01
Gastrointestinal tract
Stomach 4.6E-03 6.1E-03 9.8E-03 1.4E-02 2.4E-02
Small intestine 1.1E-02 1.4E-02 2.2E-02 3.4E-02 6.1E-02
Colon 1.8E-02 2.2E-02 3.7E-02 5.8E-02 1.1E-01
(Upper large intestine 2.0E-02 2.5E-02 4.1E-02 6.5E-02 1.2E-01)
(Lower large intestine 1.5E-02 1.9E-02 3.2E-02 4.9E-02 9.2E-02)
Heart 5.2E-03 6.5E-03 9.7E-03 1.5E-02 2.5E-02
Kidneys 1.0E-02 1.2E-02 1.7E-02 2.5E-02 4.3E-02
Liver 3.3E-03 4.1E-03 6.3E-03 9.2E-03 1.6E-02
Lungs 3.2E-03 4.2E-03 6.3E-03 9.6E-03 1.7E-02
Muscles 3.5E-03 4.3E-03 6.5E-03 9.9E-03 1.8E-02
Oesophagus 3.3E-03 4.2E-03 6.2E-03 9.6E-03 1.7E-02
Ovaries 7.7E-03 9.6E-03 1.4E-02 2.1E-02 3.6E-02
Pancreas 5.0E-03 6.3E-03 9.8E-03 1.5E-02 2.5E-02
Red marrow 3.9E-03 4.7E-03 7.1E-03 1.0E-02 1.7E-02
Skin 1.4E-02 1.8E-02 2.4E-02 3.4E-02 5.2E-02
Spleen 4.1E-03 5.2E-03 8.2E-03 1.2E-02 2.2E-02
Testes 3.4E-03 4.3E-03 6.6E-03 1.0E-02 1.8E-02
Thymus 3.3E-03 4.2E-03 6.2E-03 9.6E-03 1.7E-02
Thyroid 4.7E-03 6.8E-03 1.1E-02 2.0E-02 3.7E-02
Uterus 7.0E-03 8.7E-03 1.3E-02 2.0E-02 3.2E-02
Remaining organs 3.8E-03 4.9E-03 7.5E-03 1.2E-02 2.0E-02
Effective dose (mSv/MBq) 6.9E-03 8.8E-03 1.3E-02 2.1E-02 3.9E-02
125
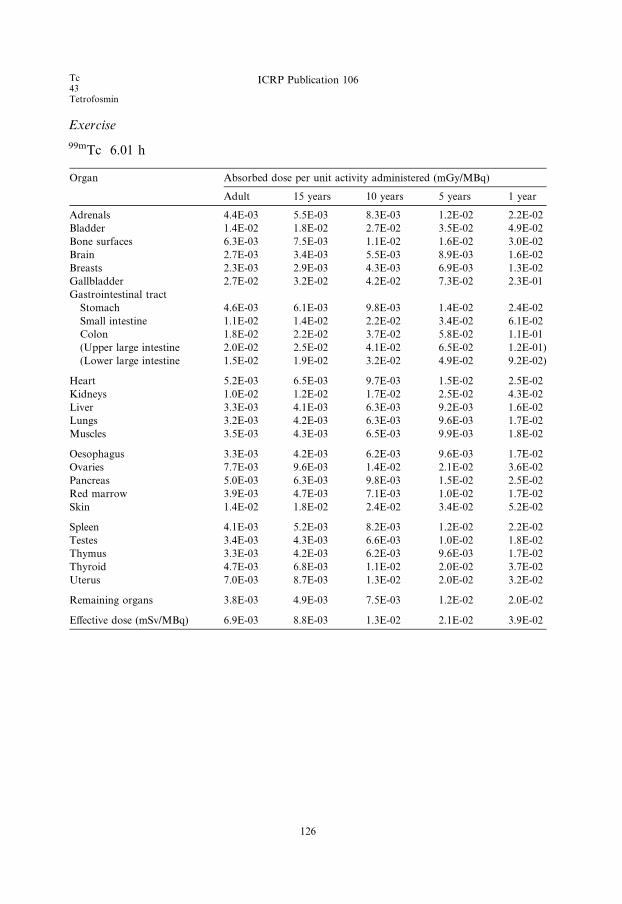
Tc43Tetrofosmin
ICRP Publication 106
Exercise
99mTc 6.01 h
Organ Absorbed dose per unit activity administered (mGy/MBq)
Adult 15 years 10 years 5 years 1 year
Adrenals 4.4E-03 5.5E-03 8.3E-03 1.2E-02 2.2E-02
Bladder 1.4E-02 1.8E-02 2.7E-02 3.5E-02 4.9E-02
Bone surfaces 6.3E-03 7.5E-03 1.1E-02 1.6E-02 3.0E-02
Brain 2.7E-03 3.4E-03 5.5E-03 8.9E-03 1.6E-02
Breasts 2.3E-03 2.9E-03 4.3E-03 6.9E-03 1.3E-02
Gallbladder 2.7E-02 3.2E-02 4.2E-02 7.3E-02 2.3E-01
Gastrointestinal tract
Stomach 4.6E-03 6.1E-03 9.8E-03 1.4E-02 2.4E-02
Small intestine 1.1E-02 1.4E-02 2.2E-02 3.4E-02 6.1E-02
Colon 1.8E-02 2.2E-02 3.7E-02 5.8E-02 1.1E-01
(Upper large intestine 2.0E-02 2.5E-02 4.1E-02 6.5E-02 1.2E-01)
(Lower large intestine 1.5E-02 1.9E-02 3.2E-02 4.9E-02 9.2E-02)
Heart 5.2E-03 6.5E-03 9.7E-03 1.5E-02 2.5E-02
Kidneys 1.0E-02 1.2E-02 1.7E-02 2.5E-02 4.3E-02
Liver 3.3E-03 4.1E-03 6.3E-03 9.2E-03 1.6E-02
Lungs 3.2E-03 4.2E-03 6.3E-03 9.6E-03 1.7E-02
Muscles 3.5E-03 4.3E-03 6.5E-03 9.9E-03 1.8E-02
Oesophagus 3.3E-03 4.2E-03 6.2E-03 9.6E-03 1.7E-02
Ovaries 7.7E-03 9.6E-03 1.4E-02 2.1E-02 3.6E-02
Pancreas 5.0E-03 6.3E-03 9.8E-03 1.5E-02 2.5E-02
Red marrow 3.9E-03 4.7E-03 7.1E-03 1.0E-02 1.7E-02
Skin 1.4E-02 1.8E-02 2.4E-02 3.4E-02 5.2E-02
Spleen 4.1E-03 5.2E-03 8.2E-03 1.2E-02 2.2E-02
Testes 3.4E-03 4.3E-03 6.6E-03 1.0E-02 1.8E-02
Thymus 3.3E-03 4.2E-03 6.2E-03 9.6E-03 1.7E-02
Thyroid 4.7E-03 6.8E-03 1.1E-02 2.0E-02 3.7E-02
Uterus 7.0E-03 8.7E-03 1.3E-02 2.0E-02 3.2E-02
Remaining organs 3.8E-03 4.9E-03 7.5E-03 1.2E-02 2.0E-02
Effective dose (mSv/MBq) 6.9E-03 8.8E-03 1.3E-02 2.1E-02 3.9E-02
126
In49
Monoclonal antibodies
C.19. 111In-labelled monoclonal tumour-associated antibodies111In
C.19.1. Biokinetic model
(C 57) The models for indium-labelled monoclonal tumour-associated antibodies
and fragments are the same as those used for the corresponding technetium-labelled
substances, with the modification that released indium is handled by the bodyaccording to the model for ionic indium (ICRP, 1987).
This biokinetic model is not intended to apply to therapeutic use of the
substance.
C.19.2. References and further reading for 111In-labelled monoclonal antibodies
Bischof Delaloye, A., Delaloye, B., 1995. Radiolabelled monoclonal antibodies in tumour imaging and
therapy: out of fashion? Eur. J. Nucl. Med. 22, 571–580.
Britton, K.E., Granowska, M., 1987. Radioimmunoscintigraphy in tumour identification. Cancer Surv. 6,
247–267.
Fishman, A.J., Khaw, B.A., Strauss, H.N., 1989. Quo vadis radioimmune imaging. J. Nucl. Med. 20,
1911–1915.
ICRP, 1987. Radiation dose to patients from radiopharmaceuticals. ICRP Publication 53. Ann. ICRP 18
(1–4).
127

In49Monoclonal antibodies
ICRP Publication 106
C.19.3. Biokinetic data for 111In-labelled monoclonal antibodies
Intact antibody
Organ (S) Fs T (h) a eAs=A0ðhÞKidneys 0.03 24 0.5 1.2
96 0.5
Liver 0.50 24 0.5 21
96 0.5
Spleen 0.09 24 0.5 3.7
96 0.5
Red bone marrow 0.20 24 0.5 8.3
96 0.5
Other organs and tissues 0.18 24 0.5 7.5
96 0.5
Released indium 1.0 �24 0.5 *�96 0.5
*To obtain the contribution from released indium, the cumulated activities given in the model for ionic
indium should be multiplied by 0.58.
F(ab 0)2 fragments
Organ (S) Fs T (h) a eAs=A0ðhÞKidneys 0.20 12 1.0 2.9
Liver 0.30 12 1.0 4.4
Spleen 0.06 12 1.0 0.88
Red bone marrow 0.10 12 1.0 1.5
Other organs and tissues 0.34 12 1.0 5.0
Released indium 1.0 �12 1.0 *
*To obtain the contribution from released indium, the cumulated activities given in the model for ionic
indium should be multiplied by 0.85.
F(ab 0) fragments
Organ (S) Fs T (h) a eAs=A0ðhÞKidneys 0.40 6.0 1.0 3.2
Liver 0.10 6.0 1.0 0.80
Spleen 0.02 6.0 1.0 0.16
Red bone marrow 0.03 6.0 1.0 0.24
Other organs and tissues 0.45 6.0 1.0 3.6
Released indium 1.0 �6.0 1.0 *
*To obtain the contribution from released indium, the cumulated activities given in the model for ionic
indium should be multiplied by 0.92.
128
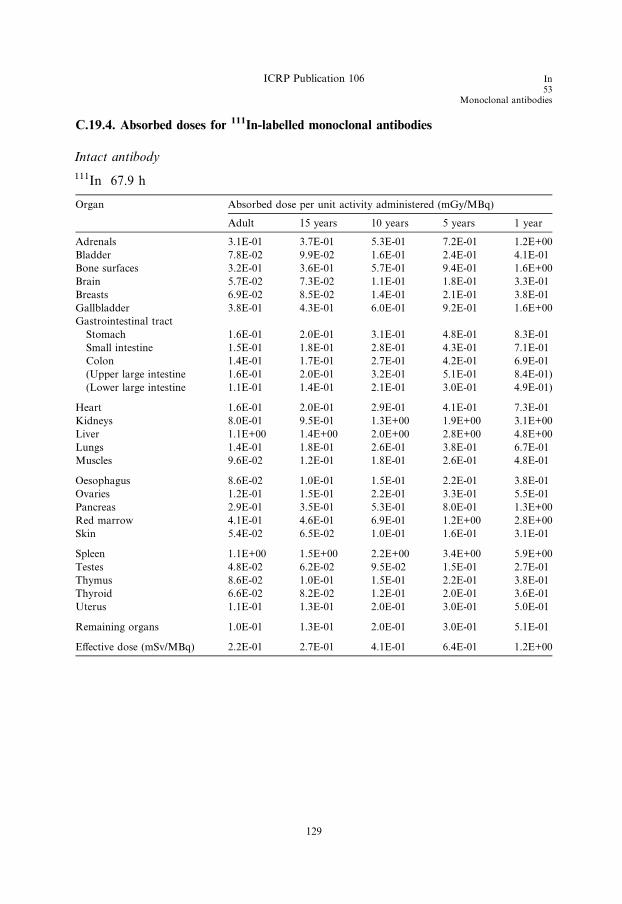
ICRP Publication 106 In53
Monoclonal antibodies
C.19.4. Absorbed doses for 111In-labelled monoclonal antibodies
Intact antibody
111In 67.9 h
Organ Absorbed dose per unit activity administered (mGy/MBq)
Adult 15 years 10 years 5 years 1 year
Adrenals 3.1E-01 3.7E-01 5.3E-01 7.2E-01 1.2E+00
Bladder 7.8E-02 9.9E-02 1.6E-01 2.4E-01 4.1E-01
Bone surfaces 3.2E-01 3.6E-01 5.7E-01 9.4E-01 1.6E+00
Brain 5.7E-02 7.3E-02 1.1E-01 1.8E-01 3.3E-01
Breasts 6.9E-02 8.5E-02 1.4E-01 2.1E-01 3.8E-01
Gallbladder 3.8E-01 4.3E-01 6.0E-01 9.2E-01 1.6E+00
Gastrointestinal tract
Stomach 1.6E-01 2.0E-01 3.1E-01 4.8E-01 8.3E-01
Small intestine 1.5E-01 1.8E-01 2.8E-01 4.3E-01 7.1E-01
Colon 1.4E-01 1.7E-01 2.7E-01 4.2E-01 6.9E-01
(Upper large intestine 1.6E-01 2.0E-01 3.2E-01 5.1E-01 8.4E-01)
(Lower large intestine 1.1E-01 1.4E-01 2.1E-01 3.0E-01 4.9E-01)
Heart 1.6E-01 2.0E-01 2.9E-01 4.1E-01 7.3E-01
Kidneys 8.0E-01 9.5E-01 1.3E+00 1.9E+00 3.1E+00
Liver 1.1E+00 1.4E+00 2.0E+00 2.8E+00 4.8E+00
Lungs 1.4E-01 1.8E-01 2.6E-01 3.8E-01 6.7E-01
Muscles 9.6E-02 1.2E-01 1.8E-01 2.6E-01 4.8E-01
Oesophagus 8.6E-02 1.0E-01 1.5E-01 2.2E-01 3.8E-01
Ovaries 1.2E-01 1.5E-01 2.2E-01 3.3E-01 5.5E-01
Pancreas 2.9E-01 3.5E-01 5.3E-01 8.0E-01 1.3E+00
Red marrow 4.1E-01 4.6E-01 6.9E-01 1.2E+00 2.8E+00
Skin 5.4E-02 6.5E-02 1.0E-01 1.6E-01 3.1E-01
Spleen 1.1E+00 1.5E+00 2.2E+00 3.4E+00 5.9E+00
Testes 4.8E-02 6.2E-02 9.5E-02 1.5E-01 2.7E-01
Thymus 8.6E-02 1.0E-01 1.5E-01 2.2E-01 3.8E-01
Thyroid 6.6E-02 8.2E-02 1.2E-01 2.0E-01 3.6E-01
Uterus 1.1E-01 1.3E-01 2.0E-01 3.0E-01 5.0E-01
Remaining organs 1.0E-01 1.3E-01 2.0E-01 3.0E-01 5.1E-01
Effective dose (mSv/MBq) 2.2E-01 2.7E-01 4.1E-01 6.4E-01 1.2E+00
129

In49Monoclonal antibodies
ICRP Publication 106
F(ab 0)2 fragments
111In 67.9 h
Organ Absorbed dose per unit activity administered (mGy/MBq)
Adult 15 years 10 years 5 years 1 year
Adrenals 2.7E-01 3.3E-01 4.7E-01 6.6E-01 1.1E+00
Bladder 8.8E-02 1.1E-01 1.7E-01 2.6E-01 4.4E-01
Bone surfaces 3.2E-01 3.6E-01 5.7E-01 9.3E-01 1.6E+00
Brain 6.5E-02 8.3E-02 1.3E-01 2.0E-01 3.8E-01
Breasts 6.6E-02 8.2E-02 1.3E-01 1.9E-01 3.5E-01
Gallbladder 2.9E-01 3.3E-01 4.6E-01 7.0E-01 1.1E+00
Gastrointestinal tract
Stomach 1.4E-01 1.7E-01 2.7E-01 4.0E-01 6.8E-01
Small intestine 1.5E-01 1.8E-01 2.8E-01 4.1E-01 6.7E-01
Colon 1.4E-01 1.7E-01 2.6E-01 3.9E-01 6.4E-01
(Upper large intestine 1.5E-01 1.9E-01 2.9E-01 4.5E-01 7.3E-01)
(Lower large intestine 1.2E-01 1.5E-01 2.2E-01 3.2E-01 5.2E-01)
Heart 1.4E-01 1.7E-01 2.5E-01 3.5E-01 6.2E-01
Kidneys 1.2E+00 1.4E+00 1.9E+00 2.7E+00 4.6E+00
Liver 6.7E-01 8.6E-01 1.3E+00 1.7E+00 3.0E+00
Lungs 1.2E-01 1.6E-01 2.3E-01 3.3E-01 5.9E-01
Muscles 9.5E-02 1.2E-01 1.8E-01 2.6E-01 4.7E-01
Oesophagus 8.7E-02 1.1E-01 1.5E-01 2.3E-01 4.0E-01
Ovaries 1.3E-01 1.6E-01 2.3E-01 3.4E-01 5.7E-01
Pancreas 2.3E-01 2.8E-01 4.1E-01 6.2E-01 1.0E+00
Red marrow 4.0E-01 4.5E-01 6.8E-01 1.2E+00 2.7E+00
Skin 5.6E-02 6.7E-02 1.1E-01 1.7E-01 3.1E-01
Spleen 4.9E-01 6.7E-01 1.0E+00 1.5E+00 2.6E+00
Testes 5.7E-02 7.3E-02 1.1E-01 1.7E-01 3.1E-01
Thymus 8.7E-02 1.1E-01 1.5E-01 2.3E-01 4.0E-01
Thyroid 7.5E-02 9.3E-02 1.4E-01 2.2E-01 4.0E-01
Uterus 1.2E-01 1.4E-01 2.1E-01 3.2E-01 5.2E-01
Remaining organs 9.9E-02 1.2E-01 1.8E-01 2.7E-01 4.8E-01
Effective dose (mSv/MBq) 2.0E-01 2.4E-01 3.6E-01 5.5E-01 1.0E+00
130

ICRP Publication 106 In49
Monoclonal antibodies
F(ab 0) fragments
111In 67.9 h
Organ Absorbed dose per unit activity administered (mGy/MBq)
Adult 15 years 10 years 5 years 1 year
Adrenals 2.6E-01 3.2E-01 4.6E-01 6.4E-01 1.1E+00
Bladder 9.0E-02 1.1E-01 1.7E-01 2.6E-01 4.4E-01
Bone surfaces 3.2E-01 3.6E-01 5.7E-01 9.4E-01 1.6E+00
Brain 6.7E-02 8.5E-02 1.3E-01 2.1E-01 3.9E-01
Breasts 6.5E-02 8.0E-02 1.2E-01 1.9E-01 3.4E-01
Gallbladder 2.7E-01 3.0E-01 4.3E-01 6.5E-01 1.0E+00
Gastrointestinal tract
Stomach 1.3E-01 1.6E-01 2.5E-01 3.8E-01 6.4E-01
Small intestine 1.5E-01 1.8E-01 2.7E-01 4.0E-01 6.6E-01
Colon 1.4E-01 1.7E-01 2.5E-01 3.9E-01 6.2E-01
(Upper large intestine 1.5E-01 1.8E-01 2.8E-01 4.4E-01 7.0E-01)
(Lower large intestine 1.2E-01 1.5E-01 2.2E-01 3.2E-01 5.2E-01)
Heart 1.3E-01 1.6E-01 2.4E-01 3.4E-01 5.9E-01
Kidneys 1.3E+00 1.5E+00 2.0E+00 2.9E+00 4.9E+00
Liver 5.9E-01 7.5E-01 1.1E+00 1.5E+00 2.6E+00
Lungs 1.2E-01 1.5E-01 2.2E-01 3.2E-01 5.7E-01
Muscles 9.5E-02 1.2E-01 1.7E-01 2.6E-01 4.7E-01
Oesophagus 8.7E-02 1.1E-01 1.5E-01 2.3E-01 4.0E-01
Ovaries 1.3E-01 1.6E-01 2.3E-01 3.5E-01 5.7E-01
Pancreas 2.2E-01 2.6E-01 3.9E-01 5.8E-01 9.4E-01
Red marrow 4.0E-01 4.5E-01 6.9E-01 1.2E+00 2.8E+00
Skin 5.6E-02 6.7E-02 1.1E-01 1.7E-01 3.1E-01
Spleen 3.4E-01 4.5E-01 6.8E-01 1.0E+00 1.7E+00
Testes 5.9E-02 7.5E-02 1.1E-01 1.8E-01 3.1E-01
Thymus 8.7E-02 1.1E-01 1.5E-01 2.3E-01 4.0E-01
Thyroid 7.6E-02 9.5E-02 1.4E-01 2.3E-01 4.0E-01
Uterus 1.2E-01 1.4E-01 2.1E-01 3.2E-01 5.2E-01
Remaining organs 9.7E-02 1.2E-01 1.8E-01 2.7E-01 4.7E-01
Effective dose (mSv/MBq) 2.0E-01 2.4E-01 3.5E-01 5.4E-01 1.0E+00
131

In49Monoclonal antibodies
ICRP Publication 106
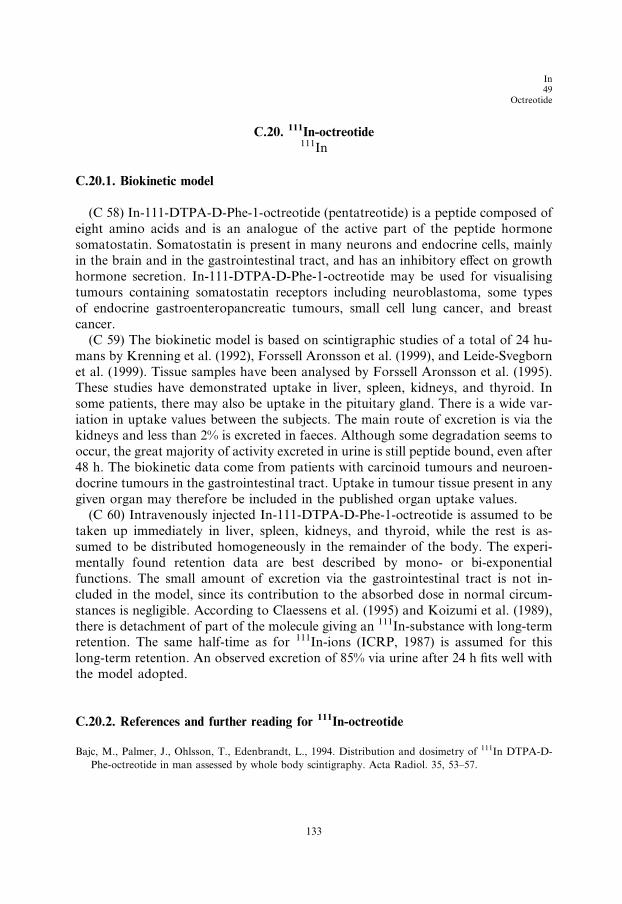
In49
Octreotide
C.20. 111In-octreotide111In
C.20.1. Biokinetic model
(C 58) In-111-DTPA-D-Phe-1-octreotide (pentatreotide) is a peptide composed of
eight amino acids and is an analogue of the active part of the peptide hormone
somatostatin. Somatostatin is present in many neurons and endocrine cells, mainlyin the brain and in the gastrointestinal tract, and has an inhibitory effect on growth
hormone secretion. In-111-DTPA-D-Phe-1-octreotide may be used for visualising
tumours containing somatostatin receptors including neuroblastoma, some types
of endocrine gastroenteropancreatic tumours, small cell lung cancer, and breast
cancer.
(C 59) The biokinetic model is based on scintigraphic studies of a total of 24 hu-
mans by Krenning et al. (1992), Forssell Aronsson et al. (1999), and Leide-Svegborn
et al. (1999). Tissue samples have been analysed by Forssell Aronsson et al. (1995).These studies have demonstrated uptake in liver, spleen, kidneys, and thyroid. In
some patients, there may also be uptake in the pituitary gland. There is a wide var-
iation in uptake values between the subjects. The main route of excretion is via the
kidneys and less than 2% is excreted in faeces. Although some degradation seems to
occur, the great majority of activity excreted in urine is still peptide bound, even after
48 h. The biokinetic data come from patients with carcinoid tumours and neuroen-
docrine tumours in the gastrointestinal tract. Uptake in tumour tissue present in any
given organ may therefore be included in the published organ uptake values.(C 60) Intravenously injected In-111-DTPA-D-Phe-1-octreotide is assumed to be
taken up immediately in liver, spleen, kidneys, and thyroid, while the rest is as-
sumed to be distributed homogeneously in the remainder of the body. The experi-
mentally found retention data are best described by mono- or bi-exponential
functions. The small amount of excretion via the gastrointestinal tract is not in-
cluded in the model, since its contribution to the absorbed dose in normal circum-
stances is negligible. According to Claessens et al. (1995) and Koizumi et al. (1989),
there is detachment of part of the molecule giving an 111In-substance with long-termretention. The same half-time as for 111In-ions (ICRP, 1987) is assumed for this
long-term retention. An observed excretion of 85% via urine after 24 h fits well with
the model adopted.
C.20.2. References and further reading for 111In-octreotide
Bajc, M., Palmer, J., Ohlsson, T., Edenbrandt, L., 1994. Distribution and dosimetry of 111In DTPA-D-
Phe-octreotide in man assessed by whole body scintigraphy. Acta Radiol. 35, 53–57.
133
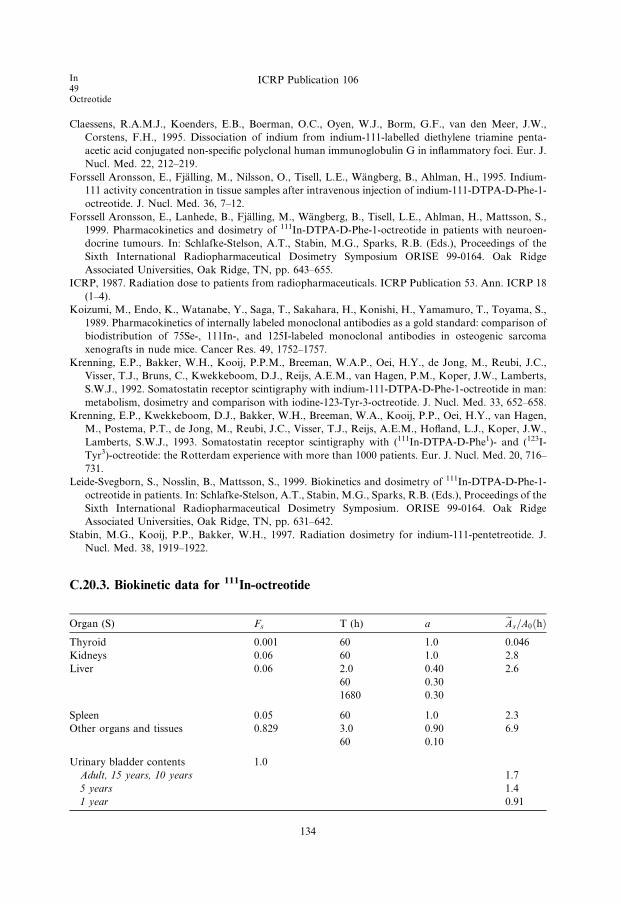
In49Octreotide
ICRP Publication 106
Claessens, R.A.M.J., Koenders, E.B., Boerman, O.C., Oyen, W.J., Borm, G.F., van den Meer, J.W.,
Corstens, F.H., 1995. Dissociation of indium from indium-111-labelled diethylene triamine penta-
acetic acid conjugated non-specific polyclonal human immunoglobulin G in inflammatory foci. Eur. J.
Nucl. Med. 22, 212–219.
Forssell Aronsson, E., Fjalling, M., Nilsson, O., Tisell, L.E., Wangberg, B., Ahlman, H., 1995. Indium-
111 activity concentration in tissue samples after intravenous injection of indium-111-DTPA-D-Phe-1-
octreotide. J. Nucl. Med. 36, 7–12.
Forssell Aronsson, E., Lanhede, B., Fjalling, M., Wangberg, B., Tisell, L.E., Ahlman, H., Mattsson, S.,
1999. Pharmacokinetics and dosimetry of 111In-DTPA-D-Phe-1-octreotide in patients with neuroen-
docrine tumours. In: Schlafke-Stelson, A.T., Stabin, M.G., Sparks, R.B. (Eds.), Proceedings of the
Sixth International Radiopharmaceutical Dosimetry Symposium ORISE 99-0164. Oak Ridge
Associated Universities, Oak Ridge, TN, pp. 643–655.
ICRP, 1987. Radiation dose to patients from radiopharmaceuticals. ICRP Publication 53. Ann. ICRP 18
(1–4).
Koizumi, M., Endo, K., Watanabe, Y., Saga, T., Sakahara, H., Konishi, H., Yamamuro, T., Toyama, S.,
1989. Pharmacokinetics of internally labeled monoclonal antibodies as a gold standard: comparison of
biodistribution of 75Se-, 111In-, and 125I-labeled monoclonal antibodies in osteogenic sarcoma
xenografts in nude mice. Cancer Res. 49, 1752–1757.
Krenning, E.P., Bakker, W.H., Kooij, P.P.M., Breeman, W.A.P., Oei, H.Y., de Jong, M., Reubi, J.C.,
Visser, T.J., Bruns, C., Kwekkeboom, D.J., Reijs, A.E.M., van Hagen, P.M., Koper, J.W., Lamberts,
S.W.J., 1992. Somatostatin receptor scintigraphy with indium-111-DTPA-D-Phe-1-octreotide in man:
metabolism, dosimetry and comparison with iodine-123-Tyr-3-octreotide. J. Nucl. Med. 33, 652–658.
Krenning, E.P., Kwekkeboom, D.J., Bakker, W.H., Breeman, W.A., Kooij, P.P., Oei, H.Y., van Hagen,
M., Postema, P.T., de Jong, M., Reubi, J.C., Visser, T.J., Reijs, A.E.M., Hofland, L.J., Koper, J.W.,
Lamberts, S.W.J., 1993. Somatostatin receptor scintigraphy with (111In-DTPA-D-Phe1)- and (123I-
Tyr3)-octreotide: the Rotterdam experience with more than 1000 patients. Eur. J. Nucl. Med. 20, 716–
731.
Leide-Svegborn, S., Nosslin, B., Mattsson, S., 1999. Biokinetics and dosimetry of 111In-DTPA-D-Phe-1-
octreotide in patients. In: Schlafke-Stelson, A.T., Stabin, M.G., Sparks, R.B. (Eds.), Proceedings of the
Sixth International Radiopharmaceutical Dosimetry Symposium. ORISE 99-0164. Oak Ridge
Associated Universities, Oak Ridge, TN, pp. 631–642.
Stabin, M.G., Kooij, P.P., Bakker, W.H., 1997. Radiation dosimetry for indium-111-pentetreotide. J.
Nucl. Med. 38, 1919–1922.
C.20.3. Biokinetic data for 111In-octreotide
Organ (S) Fs T (h) a eAs=A0ðhÞThyroid 0.001 60 1.0 0.046
Kidneys 0.06 60 1.0 2.8
Liver 0.06 2.0 0.40 2.6
60 0.30
1680 0.30
Spleen 0.05 60 1.0 2.3
Other organs and tissues 0.829 3.0 0.90 6.9
60 0.10
Urinary bladder contents 1.0
Adult, 15 years, 10 years 1.7
5 years 1.4
1 year 0.91
134
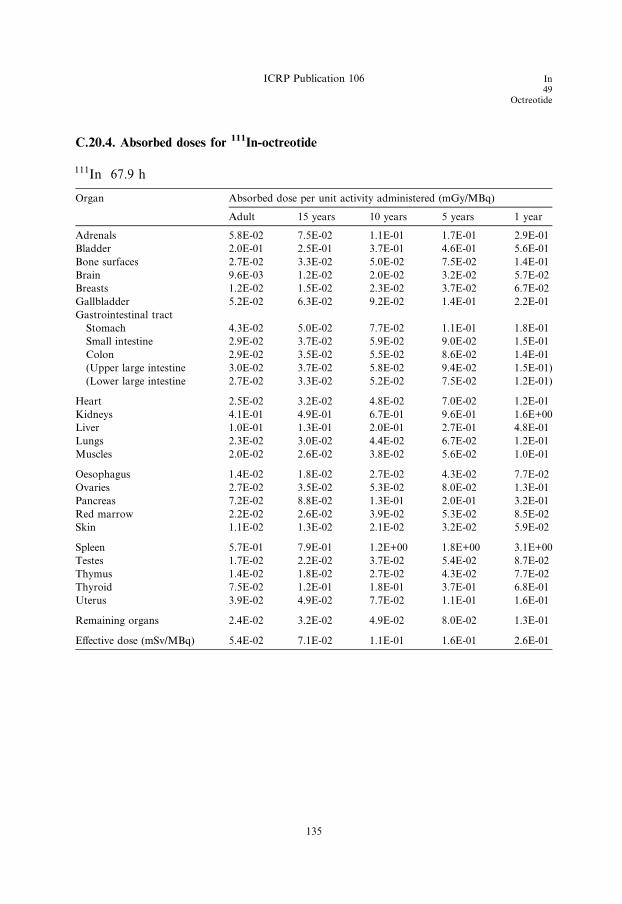
C.20.4. Absorbed doses for 111In-octreotide
111In 67.9 h
Organ Absorbed dose per unit activity administered (mGy/MBq)
Adult 15 years 10 years 5 years 1 year
Adrenals 5.8E-02 7.5E-02 1.1E-01 1.7E-01 2.9E-01
Bladder 2.0E-01 2.5E-01 3.7E-01 4.6E-01 5.6E-01
Bone surfaces 2.7E-02 3.3E-02 5.0E-02 7.5E-02 1.4E-01
Brain 9.6E-03 1.2E-02 2.0E-02 3.2E-02 5.7E-02
Breasts 1.2E-02 1.5E-02 2.3E-02 3.7E-02 6.7E-02
Gallbladder 5.2E-02 6.3E-02 9.2E-02 1.4E-01 2.2E-01
Gastrointestinal tract
Stomach 4.3E-02 5.0E-02 7.7E-02 1.1E-01 1.8E-01
Small intestine 2.9E-02 3.7E-02 5.9E-02 9.0E-02 1.5E-01
Colon 2.9E-02 3.5E-02 5.5E-02 8.6E-02 1.4E-01
(Upper large intestine 3.0E-02 3.7E-02 5.8E-02 9.4E-02 1.5E-01)
(Lower large intestine 2.7E-02 3.3E-02 5.2E-02 7.5E-02 1.2E-01)
Heart 2.5E-02 3.2E-02 4.8E-02 7.0E-02 1.2E-01
Kidneys 4.1E-01 4.9E-01 6.7E-01 9.6E-01 1.6E+00
Liver 1.0E-01 1.3E-01 2.0E-01 2.7E-01 4.8E-01
Lungs 2.3E-02 3.0E-02 4.4E-02 6.7E-02 1.2E-01
Muscles 2.0E-02 2.6E-02 3.8E-02 5.6E-02 1.0E-01
Oesophagus 1.4E-02 1.8E-02 2.7E-02 4.3E-02 7.7E-02
Ovaries 2.7E-02 3.5E-02 5.3E-02 8.0E-02 1.3E-01
Pancreas 7.2E-02 8.8E-02 1.3E-01 2.0E-01 3.2E-01
Red marrow 2.2E-02 2.6E-02 3.9E-02 5.3E-02 8.5E-02
Skin 1.1E-02 1.3E-02 2.1E-02 3.2E-02 5.9E-02
Spleen 5.7E-01 7.9E-01 1.2E+00 1.8E+00 3.1E+00
Testes 1.7E-02 2.2E-02 3.7E-02 5.4E-02 8.7E-02
Thymus 1.4E-02 1.8E-02 2.7E-02 4.3E-02 7.7E-02
Thyroid 7.5E-02 1.2E-01 1.8E-01 3.7E-01 6.8E-01
Uterus 3.9E-02 4.9E-02 7.7E-02 1.1E-01 1.6E-01
Remaining organs 2.4E-02 3.2E-02 4.9E-02 8.0E-02 1.3E-01
Effective dose (mSv/MBq) 5.4E-02 7.1E-02 1.1E-01 1.6E-01 2.6E-01
ICRP Publication 106 In49
Octreotide
135

In49Monoclonal antibodies
ICRP Publication 106
I53
Fatty acids
C.21. 123I-labelled fatty acids (123I-BMIPP and 123I-IPPA)123I
C.21.1. Biokinetic models
(C 61) Free fatty acids are major energy sources for the myocardium, and iodine-
labelled free fatty acids are used to study the energy metabolism of the heart. Long-
chain fatty acids are taken up rapidly by the heart and metabolised by b-oxidation(Tamaki et al., 2000). The first iodine-labelled free fatty acids that were developed
had the disadvantage that the release of radio-iodide was too high. This was over-
come by the introduction of 123I-para-iodophenyl pentadecanoic acid (123I-IPPA),
a terminally phenylated straight-chain fatty acid, where the iodine was substituted
in the phenyl group (Machulla et al., 1980; Reske et al., 1982; Reske, 1985; Dudczak
et al., 1986).
(C 62) The rapid clearance of 123I-IPPA from the myocardium is, however, a
problem when tomography (SPECT) is performed. This problem has been over-come by the introduction of a methyl group on the 3-carbon of the fatty acid.
3-Methyl-branched fatty acids are metabolised in the peroxisomes by initial al-
pha-oxidation followed by peroxisomal beta-oxidation, a process that is slower
than the mitochondrial beta-oxidation (Casteels et al., 2003). This principle was
first utilised by Knapp et al. (1986) by the introduction of beta-methyl-p-(123I)-iodo-
phenylpentadecanoic acid (123I-BMIPP). See also references in Knapp et al.
(1995b).
(C 63) After intravenous injection, 123I-IPPA and 123I-BMIPP are cleared rapidlyfrom the blood (biological half-time 2.5–3.0 min) (Knapp et al., 1995a) due to fast
uptake in various organs and tissues (Torizuka et al., 1991; Yoshizumi et al.,
2000). Whole-body pictures shortly after the injection (Torizuka et al., 1991; Sloof
et al., 1997; Yoshizumi et al., 2000; Caveliers et al., 1998) show a concentration of
activity in liver and heart, and a uniform distribution in the rest of the body.
(C 64) After the uptake, only some 123I-IPPA and 123I-BMIPP will be metabolised
immediately to water-soluble low-molecular-weight products. 123I-IPPA is, to a large
extent, metabolised like long-chain fatty acids by rapid mitochondrial beta-oxidation ending up with p-(123I)-iodobenzoic acid, which is excreted in a conjugated
form in the urine. The metabolism of 123I-BMIPP is slower than that of 123I-IPPA
due to the methyl group on the beta-carbon. The end product is p-(123I)-iodophenyl
acetic acid, which is also excreted as a conjugate in the urine. In either case, no re-
lease of free iodine has been detected. The initially unmetabolised part of 123I-IPPA
and 123I-BMIPP will become incorporated into the fat stores in the body, which have
a slow turnover, thus causing considerably delayed metabolism.
(C 65) Time–activity curves for the heart and liver indicate bi-exponential elimina-tion of 123I-BMIPP (Torizuka et al., 1991; De Geeter et al., 1998). Out of these
curves, initial uptake in the heart has been calculated to be 5.0–5.7% of the activity
administered (excluding blood activity) and 13–14% in the liver. For 123I-BMIPP, the
137
I53Fatty acids
ICRP Publication 106
biological half-time of the fast phase is approximately 1 h and that of the slow phase
is approximately 2 days. The fast phase corresponds to a fraction of 0.43 of uptake
in the heart. In the liver, the fast-eliminated fraction is 0.33–0.36. The final metab-
olite is excreted via the kidney and urinary bladder. After 16 h, 15% (Dudczak
et al., 1986) has been excreted, and after 24 h, 22.6% has been excreted (Torizuka
et al., 1991). There are no data for 123I-BMIPP covering longer time periods, but
from studies on labelled fatty acids (Gunnarsson et al., 2003), one must assume up-
take into body fat and consequently a slow turnover of part of the administeredactivity.
(C 66) The biokinetic model for 123I-BMIPP adopted here assumes initial uptake
of 6% of the administered activity in the heart and 14% in the liver. The rest is as-
sumed to be distributed uniformly in the remaining organs and tissues. From the
heart, 40% is excreted with a biological half-time of 1 h and 60% with a half-time
of 48 h. For the liver, the fractions are 30% and 70%, respectively. Elimination from
the rest of the body is assumed to be bi-exponential, with a fast phase with a half-
time of 48 h and a slow phase with a half-time exceeding 100 h (Gunnarssonet al., 2003).
(C 67) The faster phase corresponds to the combined fast and slow phases of the
heart and liver, and represents the turnover of a more dynamic fat pool of the body.
The slow phase represents the turnover of the rest of the body fat. The size of the
latter long-lasting pool is taken to be 20% of the administered activity; a high value
according to data in the literature (Gunnarsson et al., 2003).
(C 68) For 123I-IPPA, data suitable for dose estimations are non-existent. The ini-
tial uptake to the heart, liver, and other organs and tissues is assumed to be the sameas for 123I-BMIPP. The first phase elimination from heart and liver, however, should
be much faster since the beta-oxidation is not inhibited. The model assumes a half-
life that is five times lower, i.e. a biological half-time of 10 min for the initial fast
phase. For the slow phase of the heart and liver, and for elimination from the rest
of the body, the same figures are used as in the 123I-BMIPP model.
Note that the models are intended for123
I alone.
C.21.2. References for 123I-labelled fatty acids
Casteels, M., Foulon, V., Mannaerts, G.P., van Veldhoven, P., 2003. Alpha-oxidation of 3-methyl-
substituted fatty acids and its thiamine dependence. Eur. J. Biochem. 270, 1619–1627.
Caveliers, V., Franken, P.R., Florian, F.L., Lou, H., Knapp Jr., F.F., 1998. Intra-individual comparison
of 3(R)-BMIPP and 3(S)-BMIPP isomers in humans. J. Nucl. Med. 39, 1672–1675.
De Geeter, F., Caveliers, V., Pansar, I., Bossuyt, A., Franken, P.R., 1998. Effect of oral glucose loading on
the biodistribution of BMIPP in normal volunteers. J. Nucl. Med. 39, 1850–1856.
Dudczak, R., Schmoliner, R., Angelberger, P., Knapp, F.F., Goodman, M.M., 1986. Structurally
modified fatty acids: clinical potential as tracers of metabolism. Eur. J. Nucl. Med. 12, S45–S48.
Gunnarsson, M., Stenstrom, K., Leide-Svegborn, S., Faarinen, M., Magnusson, C.E., Aberg, M., Skog,
G., Hellborg, R., Mattsson, S., 2003. Biokinetics and radiation dosimetry for patients undergoing a
glycerol tri[1-14C]oleate fat malabsorption breath test. Appl. Radiat. Isot. 58, 517–526.
138
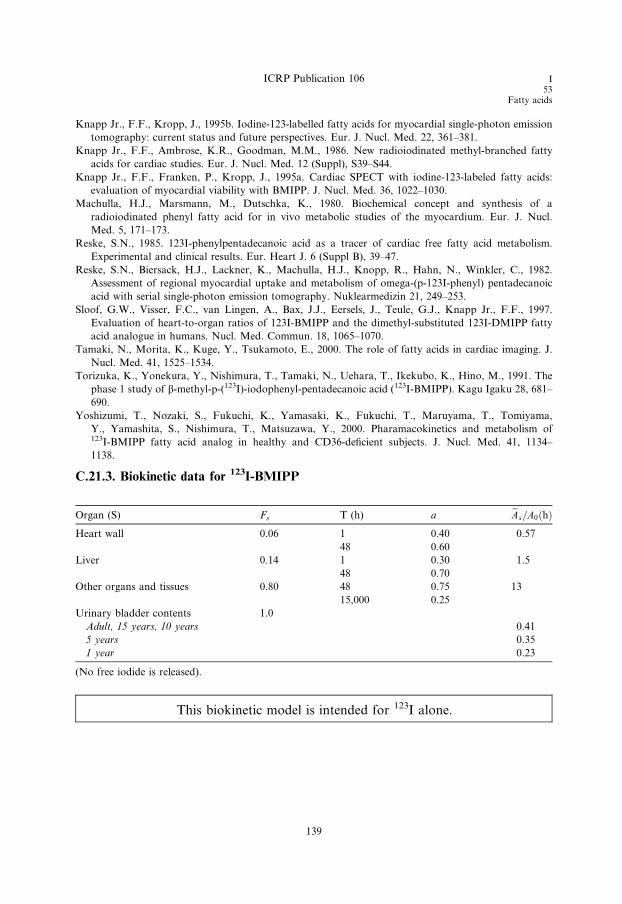
ICRP Publication 106 I53
Fatty acids
Knapp Jr., F.F., Kropp, J., 1995b. Iodine-123-labelled fatty acids for myocardial single-photon emission
tomography: current status and future perspectives. Eur. J. Nucl. Med. 22, 361–381.
Knapp Jr., F.F., Ambrose, K.R., Goodman, M.M., 1986. New radioiodinated methyl-branched fatty
acids for cardiac studies. Eur. J. Nucl. Med. 12 (Suppl), S39–S44.
Knapp Jr., F.F., Franken, P., Kropp, J., 1995a. Cardiac SPECT with iodine-123-labeled fatty acids:
evaluation of myocardial viability with BMIPP. J. Nucl. Med. 36, 1022–1030.
Machulla, H.J., Marsmann, M., Dutschka, K., 1980. Biochemical concept and synthesis of a
radioiodinated phenyl fatty acid for in vivo metabolic studies of the myocardium. Eur. J. Nucl.
Med. 5, 171–173.
Reske, S.N., 1985. 123I-phenylpentadecanoic acid as a tracer of cardiac free fatty acid metabolism.
Experimental and clinical results. Eur. Heart J. 6 (Suppl B), 39–47.
Reske, S.N., Biersack, H.J., Lackner, K., Machulla, H.J., Knopp, R., Hahn, N., Winkler, C., 1982.
Assessment of regional myocardial uptake and metabolism of omega-(p-123I-phenyl) pentadecanoic
acid with serial single-photon emission tomography. Nuklearmedizin 21, 249–253.
Sloof, G.W., Visser, F.C., van Lingen, A., Bax, J.J., Eersels, J., Teule, G.J., Knapp Jr., F.F., 1997.
Evaluation of heart-to-organ ratios of 123I-BMIPP and the dimethyl-substituted 123I-DMIPP fatty
acid analogue in humans. Nucl. Med. Commun. 18, 1065–1070.
Tamaki, N., Morita, K., Kuge, Y., Tsukamoto, E., 2000. The role of fatty acids in cardiac imaging. J.
Nucl. Med. 41, 1525–1534.
Torizuka, K., Yonekura, Y., Nishimura, T., Tamaki, N., Uehara, T., Ikekubo, K., Hino, M., 1991. The
phase 1 study of b-methyl-p-(123I)-iodophenyl-pentadecanoic acid (123I-BMIPP). Kagu Igaku 28, 681–
690.
Yoshizumi, T., Nozaki, S., Fukuchi, K., Yamasaki, K., Fukuchi, T., Maruyama, T., Tomiyama,
Y., Yamashita, S., Nishimura, T., Matsuzawa, Y., 2000. Pharamacokinetics and metabolism of123I-BMIPP fatty acid analog in healthy and CD36-deficient subjects. J. Nucl. Med. 41, 1134–
1138.
C.21.3. Biokinetic data for 123I-BMIPP
Organ (S) Fs T (h) a eAs=A0ðhÞHeart wall 0.06 1 0.40 0.57
48 0.60
Liver 0.14 1 0.30 1.5
48 0.70
Other organs and tissues 0.80 48 0.75 13
15,000 0.25
Urinary bladder contents 1.0
Adult, 15 years, 10 years 0.41
5 years 0.35
1 year 0.23
(No free iodide is released).
This biokinetic model is intended for 123I alone.
139
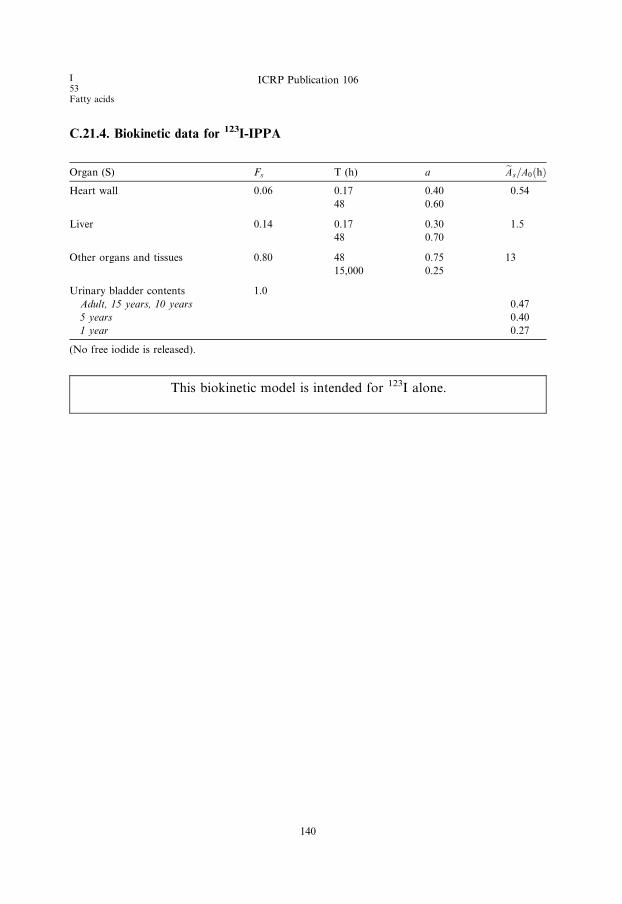
I53Fatty acids
ICRP Publication 106
C.21.4. Biokinetic data for 123I-IPPA
Organ (S) Fs T (h) a eAs=A0ðhÞHeart wall 0.06 0.17 0.40 0.54
48 0.60
Liver 0.14 0.17 0.30 1.5
48 0.70
Other organs and tissues 0.80 48 0.75 13
15,000 0.25
Urinary bladder contents 1.0
Adult, 15 years, 10 years 0.47
5 years 0.40
1 year 0.27
(No free iodide is released).
This biokinetic model is intended for 123I alone.
140

ICRP Publication 106 I53
Fatty acids
C.21.5. Absorbed doses for 123I-labelled fatty acid (BMIPP)
123I 13.2 h
Organ Absorbed dose per unit activity administered (mGy/MBq)
Adult 15 years 10 years 5 years 1 year
Adrenals 1.5E-02 1.9E-02 2.9E-02 4.4E-02 7.9E-02
Bladder 3.9E-02 5.1E-02 7.3E-02 1.1E-01 2.0E-01
Bone surfaces 2.0E-02 2.4E-02 3.8E-02 5.9E-02 1.1E-01
Brain 9.6E-03 1.2E-02 2.0E-02 3.3E-02 5.9E-02
Breasts 8.9E-03 1.1E-02 1.7E-02 2.7E-02 5.3E-02
Gallbladder 1.9E-02 2.3E-02 3.5E-02 5.4E-02 8.7E-02
Gastrointestinal tract
Stomach 1.3E-02 1.7E-02 2.7E-02 4.2E-02 7.7E-02
Small intestine 1.4E-02 1.7E-02 2.7E-02 4.3E-02 7.9E-02
Colon 1.4E-02 1.8E-02 2.7E-02 4.3E-02 7.7E-02
(Upper large intestine 1.4E-02 1.8E-02 2.7E-02 4.5E-02 7.8E-02)
(Lower large intestine 1.4E-02 1.7E-02 2.7E-02 4.1E-02 7.6E-02)
Heart 5.3E-02 6.8E-02 1.0E-01 1.6E-01 2.8E-01
Kidneys 1.3E-02 1.6E-02 2.6E-02 4.0E-02 7.2E-02
Liver 3.6E-02 4.6E-02 6.9E-02 9.8E-02 1.8E-01
Lungs 1.3E-02 1.7E-02 2.6E-02 4.0E-02 7.4E-02
Muscles 1.1E-02 1.4E-02 2.1E-02 3.3E-02 6.2E-02
Oesophagus 1.3E-02 1.6E-02 2.4E-02 3.8E-02 6.9E-02
Ovaries 1.4E-02 1.8E-02 2.7E-02 4.3E-02 8.0E-02
Pancreas 1.6E-02 2.0E-02 3.1E-02 4.9E-02 8.7E-02
Red marrow 1.1E-02 1.3E-02 2.0E-02 3.0E-02 5.5E-02
Skin 7.5E-03 9.0E-03 1.4E-02 2.3E-02 4.4E-02
Spleen 1.2E-02 1.6E-02 2.5E-02 3.8E-02 7.0E-02
Testes 1.0E-02 1.3E-02 2.0E-02 3.3E-02 6.1E-02
Thymus 1.3E-02 1.6E-02 2.4E-02 3.8E-02 6.9E-02
Thyroid 1.1E-02 1.4E-02 2.3E-02 3.7E-02 6.9E-02
Uterus 1.6E-02 1.9E-02 3.1E-02 4.8E-02 8.7E-02
Remaining organs 1.1E-02 1.4E-02 2.1E-02 3.4E-02 6.2E-02
Effective dose (mSv/MBq) 1.6E-02 2.0E-02 3.1E-02 4.7E-02 8.7E-02
141
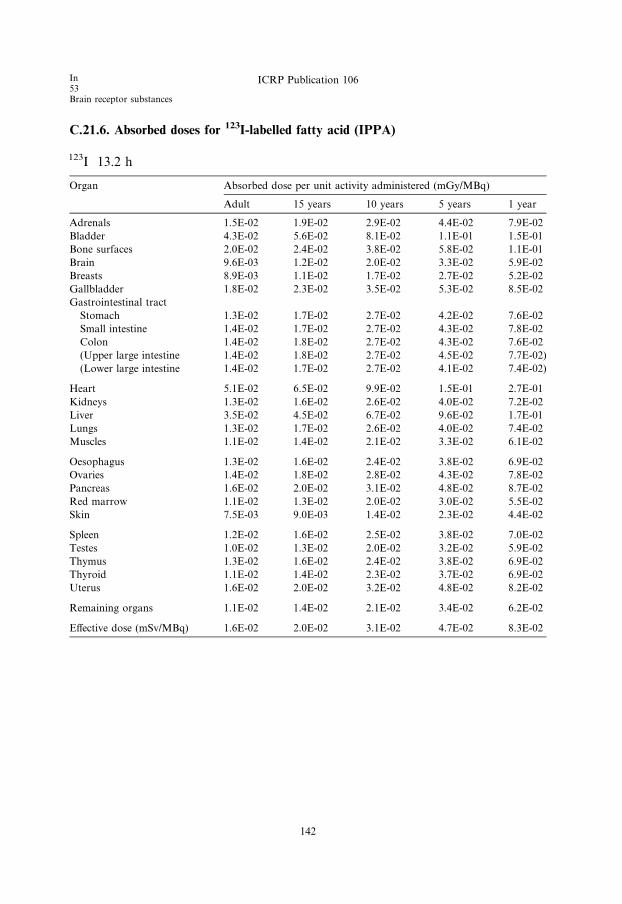
C.21.6. Absorbed doses for 123I-labelled fatty acid (IPPA)
123I 13.2 h
Organ Absorbed dose per unit activity administered (mGy/MBq)
Adult 15 years 10 years 5 years 1 year
Adrenals 1.5E-02 1.9E-02 2.9E-02 4.4E-02 7.9E-02
Bladder 4.3E-02 5.6E-02 8.1E-02 1.1E-01 1.5E-01
Bone surfaces 2.0E-02 2.4E-02 3.8E-02 5.8E-02 1.1E-01
Brain 9.6E-03 1.2E-02 2.0E-02 3.3E-02 5.9E-02
Breasts 8.9E-03 1.1E-02 1.7E-02 2.7E-02 5.2E-02
Gallbladder 1.8E-02 2.3E-02 3.5E-02 5.3E-02 8.5E-02
Gastrointestinal tract
Stomach 1.3E-02 1.7E-02 2.7E-02 4.2E-02 7.6E-02
Small intestine 1.4E-02 1.7E-02 2.7E-02 4.3E-02 7.8E-02
Colon 1.4E-02 1.8E-02 2.7E-02 4.3E-02 7.6E-02
(Upper large intestine 1.4E-02 1.8E-02 2.7E-02 4.5E-02 7.7E-02)
(Lower large intestine 1.4E-02 1.7E-02 2.7E-02 4.1E-02 7.4E-02)
Heart 5.1E-02 6.5E-02 9.9E-02 1.5E-01 2.7E-01
Kidneys 1.3E-02 1.6E-02 2.6E-02 4.0E-02 7.2E-02
Liver 3.5E-02 4.5E-02 6.7E-02 9.6E-02 1.7E-01
Lungs 1.3E-02 1.7E-02 2.6E-02 4.0E-02 7.4E-02
Muscles 1.1E-02 1.4E-02 2.1E-02 3.3E-02 6.1E-02
Oesophagus 1.3E-02 1.6E-02 2.4E-02 3.8E-02 6.9E-02
Ovaries 1.4E-02 1.8E-02 2.8E-02 4.3E-02 7.8E-02
Pancreas 1.6E-02 2.0E-02 3.1E-02 4.8E-02 8.7E-02
Red marrow 1.1E-02 1.3E-02 2.0E-02 3.0E-02 5.5E-02
Skin 7.5E-03 9.0E-03 1.4E-02 2.3E-02 4.4E-02
Spleen 1.2E-02 1.6E-02 2.5E-02 3.8E-02 7.0E-02
Testes 1.0E-02 1.3E-02 2.0E-02 3.2E-02 5.9E-02
Thymus 1.3E-02 1.6E-02 2.4E-02 3.8E-02 6.9E-02
Thyroid 1.1E-02 1.4E-02 2.3E-02 3.7E-02 6.9E-02
Uterus 1.6E-02 2.0E-02 3.2E-02 4.8E-02 8.2E-02
Remaining organs 1.1E-02 1.4E-02 2.1E-02 3.4E-02 6.2E-02
Effective dose (mSv/MBq) 1.6E-02 2.0E-02 3.1E-02 4.7E-02 8.3E-02
In53Brain receptor substances
ICRP Publication 106
142
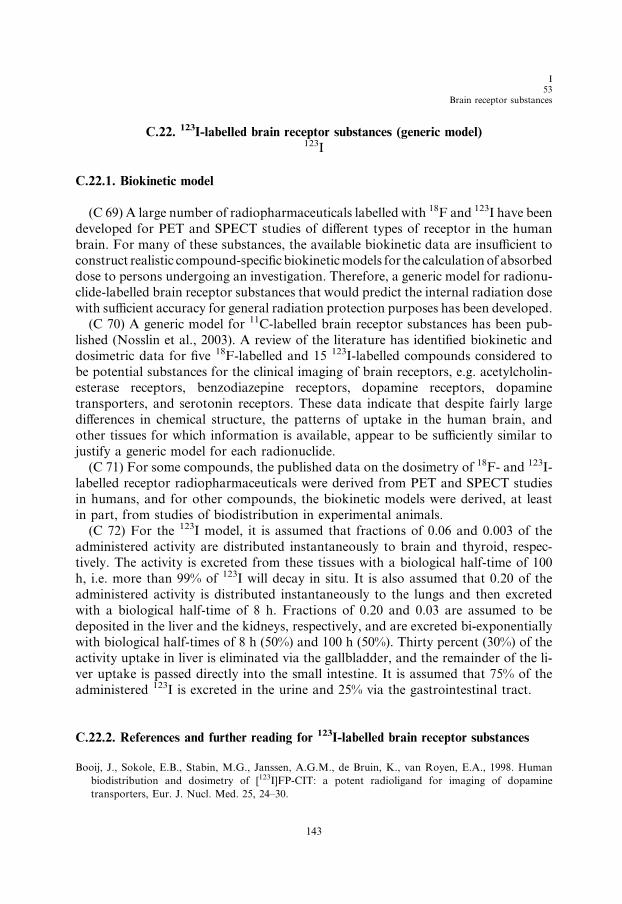
ICRP Publication 106 I53
Brain receptor substances
C.22. 123I-labelled brain receptor substances (generic model)123I
C.22.1. Biokinetic model
(C 69) A large number of radiopharmaceuticals labelled with 18F and 123I have been
developed for PET and SPECT studies of different types of receptor in the human
brain. For many of these substances, the available biokinetic data are insufficient toconstruct realistic compound-specific biokinetic models for the calculation of absorbed
dose to persons undergoing an investigation. Therefore, a generic model for radionu-
clide-labelled brain receptor substances that would predict the internal radiation dose
with sufficient accuracy for general radiation protection purposes has been developed.
(C 70) A generic model for 11C-labelled brain receptor substances has been pub-
lished (Nosslin et al., 2003). A review of the literature has identified biokinetic and
dosimetric data for five 18F-labelled and 15 123I-labelled compounds considered to
be potential substances for the clinical imaging of brain receptors, e.g. acetylcholin-esterase receptors, benzodiazepine receptors, dopamine receptors, dopamine
transporters, and serotonin receptors. These data indicate that despite fairly large
differences in chemical structure, the patterns of uptake in the human brain, and
other tissues for which information is available, appear to be sufficiently similar to
justify a generic model for each radionuclide.
(C 71) For some compounds, the published data on the dosimetry of 18F- and 123I-
labelled receptor radiopharmaceuticals were derived from PET and SPECT studies
in humans, and for other compounds, the biokinetic models were derived, at leastin part, from studies of biodistribution in experimental animals.
(C 72) For the 123I model, it is assumed that fractions of 0.06 and 0.003 of the
administered activity are distributed instantaneously to brain and thyroid, respec-
tively. The activity is excreted from these tissues with a biological half-time of 100
h, i.e. more than 99% of 123I will decay in situ. It is also assumed that 0.20 of the
administered activity is distributed instantaneously to the lungs and then excreted
with a biological half-time of 8 h. Fractions of 0.20 and 0.03 are assumed to be
deposited in the liver and the kidneys, respectively, and are excreted bi-exponentiallywith biological half-times of 8 h (50%) and 100 h (50%). Thirty percent (30%) of the
activity uptake in liver is eliminated via the gallbladder, and the remainder of the li-
ver uptake is passed directly into the small intestine. It is assumed that 75% of the
administered 123I is excreted in the urine and 25% via the gastrointestinal tract.
C.22.2. References and further reading for 123I-labelled brain receptor substances
Booij, J., Sokole, E.B., Stabin, M.G., Janssen, A.G.M., de Bruin, K., van Royen, E.A., 1998. Human
biodistribution and dosimetry of [123I]FP-CIT: a potent radioligand for imaging of dopamine
transporters, Eur. J. Nucl. Med. 25, 24–30.
143

I53Brain receptor substances
ICRP Publication 106
Booij, J., Sokole, E.B., Stabin, M.G., Janssen, A.G.M., de Bruin, K., van Royen, E.A., 1998. Human
biodistribution and dosimetry of [123I]FP-CIT: a potent radioligand for imaging of dopamine
transporters: Erratum. Eur. J. Nucl. Med. 25, 458.
Boundy, K.L., Barnden, L.R., Rowe, C.C., Reid, M., Kassiou, M., Katsifis, A.G., Lambrecht, R.L., 1995.
Human dosimetry and biodistribution of iodine-123-iododexetimide: a SPECT imaging agent for
cholinergic muscarinic neuroreceptors. J. Nucl. Med. 36, 1332–1338.
Deterding, T.A., Votaw, J.R., Wang, C.K., Eshima, D., Eshima, L., Keil, R., Malveaux, E., Kilts, C.D.,
Goodman, M.M., Hoffman, J.M., 2001. Biodistribution and radiation dosimetry of the dopamine
transporter ligand [18F]FECNT. J Nucl Med. 42, 376–381.
Grunder, G., Siessmeier, T., Lange-Asschenfeldt, C., Vernaleken, I., Buchholz, H.-G., Stoeter, P.,
Drzezga, A., Luddens, H., Rosch, F., Bartenstein, P., 2001. [18F]Fluoroethylflumaazenil: a novel tracer
for PET imaging of human benzodiazepine receptors. Eur. J. Nucl. Med. 28, 1463–1470.
Grunder, G., Siessmeier, T., Piel, M., Vernaleken, I., Buchholz, H.-G., Zhou, Y., Hiemke, C., Wong, D.P.,
Rosch, F., Bartenstein, P., 2003. Quantification of D2-like dopamine receptors in the human brain with
[18F]-desmethoxyfallypride. J. Nucl. Med. 44, 109–116.
Kauppinen, T.A., Bergstrom, K.A., Heikman, P., Hiltunen, J., Ahonen, A.K., 2003. Biodistribution and
radiation dosimetry of [123I]ADAM in healthy human subjects: preliminary results. Eur. J. Nucl. Med.
30, 132–136.
Kuikka, J.T., Bergstrom, K.A., Ahonen, A., Lansimies, E., 1994. The dosimetry of iodine-123 labelled 2b-
carbomethoxy-3b-(4-iodophenyl)tropane. Eur. J. Nucl. Med., 21, 53–56.
Mitterhauser, M., Wadsak, W., Wabnegger, L., Mien, L-K., Togel, S., Langer, O., Sieghart, W.,
Viernstein, H., Kletter, K., Dudczak, R., 2004. Biological evaluation of 20-[18F]fluoroflumazenil
([18F]FFMZ) a potential GABA receptor ligand for PET. Nucl. Med. Biol. 31, 291–295.
Mozley, P.D., Stubbs, J.T., Kim, H-J., McElgin, W., Chumpradit, S., Kung, M-P., Romaniallo, G., Kung,
H.F., 1995. Dosimetry of a D2/D3 dopamine receptor antagonist that can be used with PET or
SPECT. J. Nucl. Med. 36, 1322–1331.
Mozley, P.D., Stubbs, J.T., Kim, H-J., McElgin, W., Kung, M-P., Meegalla, S., Kung, H.F., 1996.
Dosimetry of an iodine-123-labeled tropane to image dopamine transporters. J. Nucl. Med. 37, 151–
159.
Nosslin, B., Johansson, L., Leide-Svegborn, S., Liniecki, J., Mattsson, S., Taylor, D.M., 2003. A generic
model for [11C]-labelled radiopharmaceuticals for imaging receptors in the human brain. Rad. Prot.
Dosim. 105, 587–591.
Taylor, D.M., 2000a. Unpublished assessments..
van de Wiele, C., De Vos, F., De Sutter, J., Dumont, F., Slegers, G., Dierkx, R.A., Thierens, H., 1999.
Biokinetics and dosimetry of (iodine-123)-iodomethyl-N,N-dimethyltamoxifen, an (anti)oestrogen
receptor radioligand. Eur. J. Nucl. Med. 26, 1259–1264.
Verhoeff, N.P., Sokole, E.B., Stabin, M., Hengst, D., Kung, H.F., van Royen, E.A., Janssen, A.G., 1993.
Dosimetry of iodine-123 iodobenzamide in healthy volunteers. Eur. J. Nucl. Med. 20, 747–
752.
Verhoeff, N.P., Busemann Sokole, E., Hengst, D., Stubbs, J.B., van Royen, E.A., 1993. Dosimetry of
iodine-123 iomazenil in humans. Eur. J. Nucl. Med. 20, 580–584.
Versijpt, J., Dumont, F., Thierens, H., Jansen, H., de Vos, F., Slegers, G., Santens, P., Dierckx, R.A.,
Korf, J., 2000. Biodistribution and dosimetry of [123I]iodo-PK 11195: a potential agent for SPET
imaging of the peripheral benzodiazepine receptor. Eur. J. Nucl. Med. 27, 1326–1333.
Volkow, N.D., Ding, Y.-S., Fowler, J.S., Wang, G.-J., Logan, J., Gatley, S.J., Schlyer, D.J., Pappas, N.,
1995. A new PET ligand for the dopamine transporter: studies in human brain. J. Nucl. Med. 36, 2162–
2168.
Votaw, J.R., Ansari, M.S., Scott Mason, N., Schmidt, D., de Paulis, T., Holburn, G., Clanton, J.A.,
Votlaw, D.B., Manning, R.G., Kessler, R.M., 1995. Dosimetry of iodine-123-epidepride: a dopamine
D2 receptor ligand. J. Nucl. Med. 36, 1316–1321.
Waterhouse, R.N., Stabin, M.G., Page, J.G., 2003. Preclinical acute toxicity studies and rodent-based
dosimetry estimates of the novel sigma-1 receptor radiotracer [18F]FPS. Nucl. Med. Biol. 30, 555–563.
144

ICRP Publication 106 I53
Brain receptor substances
C.22.3. Biokinetic data for 123I-labelled brain receptor substances
Organ (S) Fs T (h) a eAs=A0ðhÞBrain 0.06 100 1.0 1.0
Thyroid 0.003 100 1.0 0.050
Lungs 0.20 8 1.0 1.4
Kidneys 0.03 8 0.50 0.36
100 0.50
Kidney excretion 0.75 0.020
Liver 0.20 8 0.50 2.4
100 0.50
Stomach wall 0.05 8 1.0 0.36
Other organs and tissues 0.457 8 0.50 5.5
100 0.50
Gallbladder contents 0.06 0.67
Gastrointestinal tract contents
Stomach 0.05 0.030
Small intestine 0.25 1.2
Upper large intestine 0.25 2.3
Lower large intestine 0.25 1.9
Urinary bladder contents 0.75
Adult, 15 years, 10 years 0.55
5 years 0.47
1 year 0.31
145

I53Brain receptor substances
ICRP Publication 106
C.22.4. Absorbed doses for 123I-labelled brain receptor substances
123I 13.2 h
Organ Absorbed dose per unit activity administered (mGy/MBq)
Adult 15 years 10 years 5 years 1 year
Adrenals 1.6E-02 2.1E-02 3.2E-02 4.8E-02 8.5E-02
Bladder 5.2E-02 6.6E-02 9.9E-02 1.3E-01 1.9E-01
Bone surfaces 1.7E-02 2.1E-02 3.3E-02 5.1E-02 1.0E-01
Brain 2.9E-02 2.9E-02 3.0E-02 3.4E-02 4.6E-02
Breasts 6.3E-03 7.8E-03 1.3E-02 2.1E-02 4.0E-02
Gallbladder 1.8E-01 2.1E-01 2.7E-01 4.7E-01 1.5E+00
Gastrointestinal tract
Stomach 5.7E-02 7.6E-02 1.1E-01 1.8E-01 3.8E-01
Small intestine 6.3E-02 8.0E-02 1.3E-01 2.1E-01 3.8E-01
Colon 1.6E-01 2.0E-01 3.4E-01 5.5E-01 1.0E+00
(Upper large intestine 1.5E-01 1.9E-01 3.2E-01 5.2E-01 9.7E-01)
(Lower large intestine 1.7E-01 2.1E-01 3.6E-01 5.8E-01 1.1E+00)
Heart 1.2E-02 1.6E-02 2.5E-02 3.9E-02 7.1E-02
Kidneys 4.6E-02 5.5E-02 7.9E-02 1.2E-01 2.0E-01
Liver 5.8E-02 7.5E-02 1.1E-01 1.6E-01 3.0E-01
Lungs 4.1E-02 5.9E-02 8.3E-02 1.3E-01 2.4E-01
Muscles 1.0E-02 1.3E-02 2.0E-02 3.1E-02 5.8E-02
Oesophagus 7.6E-03 9.8E-03 1.5E-02 2.4E-02 4.4E-02
Ovaries 3.7E-02 4.9E-02 7.6E-02 1.1E-01 2.0E-01
Pancreas 1.9E-02 2.5E-02 4.3E-02 6.9E-02 1.2E-01
Red marrow 1.2E-02 1.4E-02 2.1E-02 2.9E-02 4.7E-02
Skin 5.2E-03 6.3E-03 1.0E-02 1.7E-02 3.2E-02
Spleen 1.2E-02 1.6E-02 2.5E-02 4.0E-02 7.3E-02
Testes 7.0E-03 9.2E-03 1.6E-02 2.6E-02 4.8E-02
Thymus 7.6E-03 9.8E-03 1.5E-02 2.4E-02 4.4E-02
Thyroid 5.5E-02 8.7E-02 1.3E-01 2.9E-01 5.4E-01
Uterus 2.3E-02 3.0E-02 5.0E-02 7.8E-02 1.4E-01
Remaining organs 1.3E-02 1.8E-02 2.9E-02 4.8E-02 7.7E-02
Effective dose (mSv/MBq) 5.0E-02 6.1E-02 9.6E-02 1.5E-01 3.2E-01
146
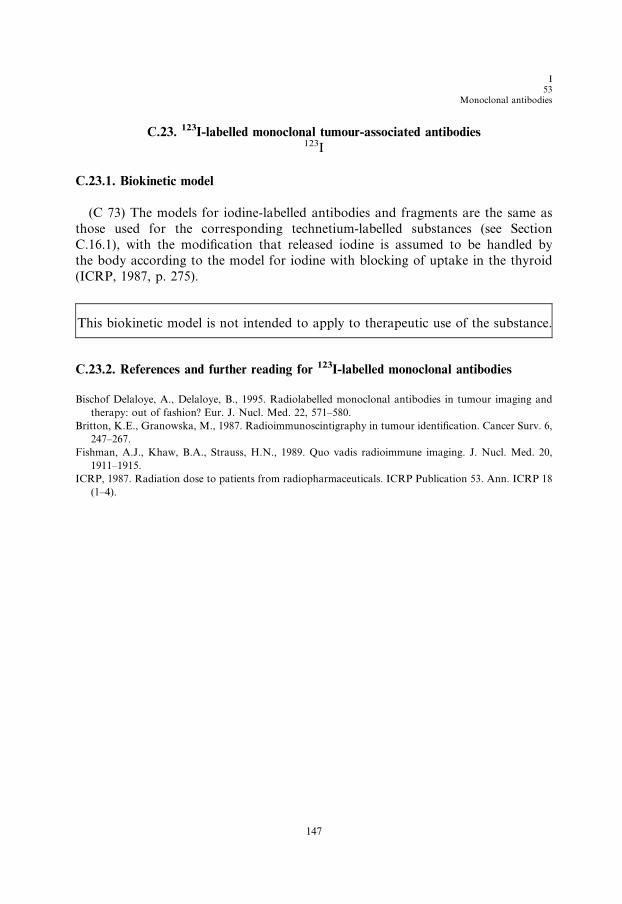
ICRP Publication 106 I53
Monoclonal antibodies
C.23. 123I-labelled monoclonal tumour-associated antibodies123I
C.23.1. Biokinetic model
(C 73) The models for iodine-labelled antibodies and fragments are the same as
those used for the corresponding technetium-labelled substances (see Section
C.16.1), with the modification that released iodine is assumed to be handled bythe body according to the model for iodine with blocking of uptake in the thyroid
(ICRP, 1987, p. 275).
This biokinetic model is not intended to apply to therapeutic use of the substance.
C.23.2. References and further reading for 123I-labelled monoclonal antibodies
Bischof Delaloye, A., Delaloye, B., 1995. Radiolabelled monoclonal antibodies in tumour imaging and
therapy: out of fashion? Eur. J. Nucl. Med. 22, 571–580.
Britton, K.E., Granowska, M., 1987. Radioimmunoscintigraphy in tumour identification. Cancer Surv. 6,
247–267.
Fishman, A.J., Khaw, B.A., Strauss, H.N., 1989. Quo vadis radioimmune imaging. J. Nucl. Med. 20,
1911–1915.
ICRP, 1987. Radiation dose to patients from radiopharmaceuticals. ICRP Publication 53. Ann. ICRP 18
(1–4).
147

I53Monoclonal antibodies
ICRP Publication 106
C.23.3. Biokinetic data for 123I-labelled monoclonal antibodies
Intact antibody
Organ (S) Fs T (h) a eAs=A0ðhÞKidneys 0.03 24 0.5 0.44
96 0.5
Liver 0.50 24 0.5 7.3
96 0.5
Spleen 0.09 24 0.5 1.3
96 0.5
Red bone marrow 0.20 24 0.5 2.9
96 0.5
Other organs and tissues 0.18 24 0.5 2.6
96 0.5
Released iodine 1.0 �24 0.5 *�96 0.5
*To obtain the contribution from released 123I, the cumulated activity given in the model for iodide with
blocked thyroid should be multiplied by 0.24.
F(ab 0)2 fragments
Organ (S) Fs T (h) a eAs=A0ðhÞKidneys 0.20 12 1.0 1.8
Liver 0.30 12 1.0 2.7
Spleen 0.06 12 1.0 0.54
Red bone marrow 0.10 12 1.0 0.91
Other organs and tissues 0.34 12 1.0 3.1
Released iodine 1.0 �12 1.0 *
*To obtain the contribution from released 123I, the cumulated activity given in the model for iodide with
blocked thyroid should be multiplied by 0.52.
F(ab 0) fragments
Organ (S) Fs T (h) a eAs=A0ðhÞKidneys 0.40 6.0 1.0 2.4
Liver 0.10 6.0 1.0 0.60
Spleen 0.02 6.0 1.0 0.12
Red bone marrow 0.03 6.0 1.0 0.18
Other organs and tissues 0.45 6.0 1.0 2.7
Released iodine 1.0 �6.0 1.0 *
*To obtain the contribution from released 123I, the cumulated activity given in the model for iodide with
blocked thyroid should be multiplied by 0.69.
148
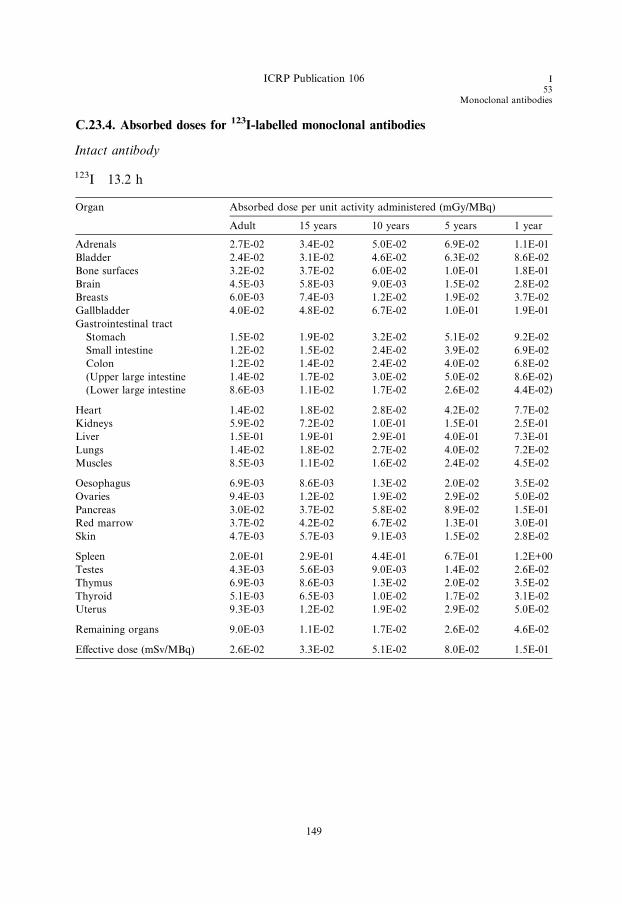
ICRP Publication 106 I53
Monoclonal antibodies
C.23.4. Absorbed doses for 123I-labelled monoclonal antibodies
Intact antibody
123I 13.2 h
Organ Absorbed dose per unit activity administered (mGy/MBq)
Adult 15 years 10 years 5 years 1 year
Adrenals 2.7E-02 3.4E-02 5.0E-02 6.9E-02 1.1E-01
Bladder 2.4E-02 3.1E-02 4.6E-02 6.3E-02 8.6E-02
Bone surfaces 3.2E-02 3.7E-02 6.0E-02 1.0E-01 1.8E-01
Brain 4.5E-03 5.8E-03 9.0E-03 1.5E-02 2.8E-02
Breasts 6.0E-03 7.4E-03 1.2E-02 1.9E-02 3.7E-02
Gallbladder 4.0E-02 4.8E-02 6.7E-02 1.0E-01 1.9E-01
Gastrointestinal tract
Stomach 1.5E-02 1.9E-02 3.2E-02 5.1E-02 9.2E-02
Small intestine 1.2E-02 1.5E-02 2.4E-02 3.9E-02 6.9E-02
Colon 1.2E-02 1.4E-02 2.4E-02 4.0E-02 6.8E-02
(Upper large intestine 1.4E-02 1.7E-02 3.0E-02 5.0E-02 8.6E-02)
(Lower large intestine 8.6E-03 1.1E-02 1.7E-02 2.6E-02 4.4E-02)
Heart 1.4E-02 1.8E-02 2.8E-02 4.2E-02 7.7E-02
Kidneys 5.9E-02 7.2E-02 1.0E-01 1.5E-01 2.5E-01
Liver 1.5E-01 1.9E-01 2.9E-01 4.0E-01 7.3E-01
Lungs 1.4E-02 1.8E-02 2.7E-02 4.0E-02 7.2E-02
Muscles 8.5E-03 1.1E-02 1.6E-02 2.4E-02 4.5E-02
Oesophagus 6.9E-03 8.6E-03 1.3E-02 2.0E-02 3.5E-02
Ovaries 9.4E-03 1.2E-02 1.9E-02 2.9E-02 5.0E-02
Pancreas 3.0E-02 3.7E-02 5.8E-02 8.9E-02 1.5E-01
Red marrow 3.7E-02 4.2E-02 6.7E-02 1.3E-01 3.0E-01
Skin 4.7E-03 5.7E-03 9.1E-03 1.5E-02 2.8E-02
Spleen 2.0E-01 2.9E-01 4.4E-01 6.7E-01 1.2E+00
Testes 4.3E-03 5.6E-03 9.0E-03 1.4E-02 2.6E-02
Thymus 6.9E-03 8.6E-03 1.3E-02 2.0E-02 3.5E-02
Thyroid 5.1E-03 6.5E-03 1.0E-02 1.7E-02 3.1E-02
Uterus 9.3E-03 1.2E-02 1.9E-02 2.9E-02 5.0E-02
Remaining organs 9.0E-03 1.1E-02 1.7E-02 2.6E-02 4.6E-02
Effective dose (mSv/MBq) 2.6E-02 3.3E-02 5.1E-02 8.0E-02 1.5E-01
149
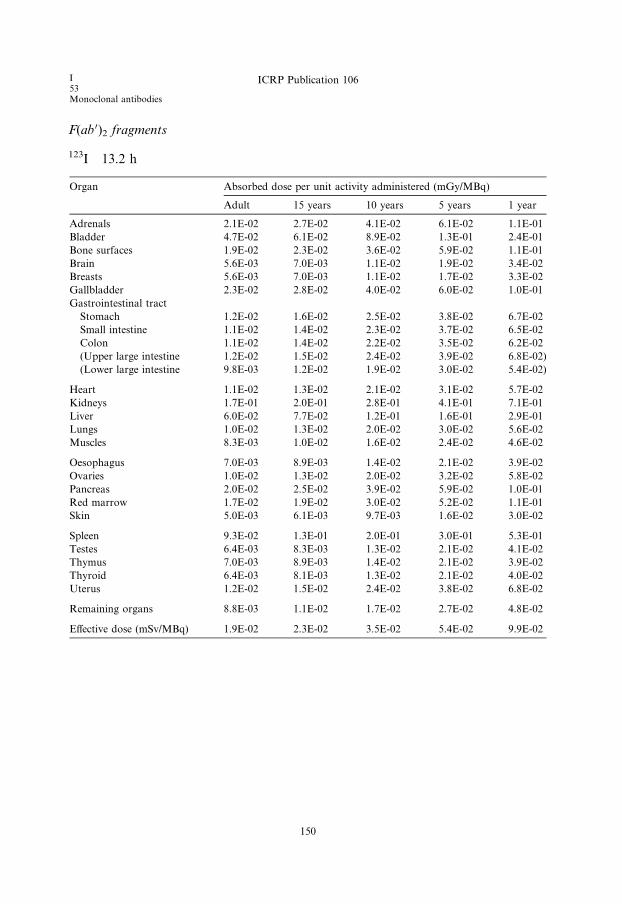
I53Monoclonal antibodies
ICRP Publication 106
F(ab 0)2 fragments
123I 13.2 h
Organ Absorbed dose per unit activity administered (mGy/MBq)
Adult 15 years 10 years 5 years 1 year
Adrenals 2.1E-02 2.7E-02 4.1E-02 6.1E-02 1.1E-01
Bladder 4.7E-02 6.1E-02 8.9E-02 1.3E-01 2.4E-01
Bone surfaces 1.9E-02 2.3E-02 3.6E-02 5.9E-02 1.1E-01
Brain 5.6E-03 7.0E-03 1.1E-02 1.9E-02 3.4E-02
Breasts 5.6E-03 7.0E-03 1.1E-02 1.7E-02 3.3E-02
Gallbladder 2.3E-02 2.8E-02 4.0E-02 6.0E-02 1.0E-01
Gastrointestinal tract
Stomach 1.2E-02 1.6E-02 2.5E-02 3.8E-02 6.7E-02
Small intestine 1.1E-02 1.4E-02 2.3E-02 3.7E-02 6.5E-02
Colon 1.1E-02 1.4E-02 2.2E-02 3.5E-02 6.2E-02
(Upper large intestine 1.2E-02 1.5E-02 2.4E-02 3.9E-02 6.8E-02)
(Lower large intestine 9.8E-03 1.2E-02 1.9E-02 3.0E-02 5.4E-02)
Heart 1.1E-02 1.3E-02 2.1E-02 3.1E-02 5.7E-02
Kidneys 1.7E-01 2.0E-01 2.8E-01 4.1E-01 7.1E-01
Liver 6.0E-02 7.7E-02 1.2E-01 1.6E-01 2.9E-01
Lungs 1.0E-02 1.3E-02 2.0E-02 3.0E-02 5.6E-02
Muscles 8.3E-03 1.0E-02 1.6E-02 2.4E-02 4.6E-02
Oesophagus 7.0E-03 8.9E-03 1.4E-02 2.1E-02 3.9E-02
Ovaries 1.0E-02 1.3E-02 2.0E-02 3.2E-02 5.8E-02
Pancreas 2.0E-02 2.5E-02 3.9E-02 5.9E-02 1.0E-01
Red marrow 1.7E-02 1.9E-02 3.0E-02 5.2E-02 1.1E-01
Skin 5.0E-03 6.1E-03 9.7E-03 1.6E-02 3.0E-02
Spleen 9.3E-02 1.3E-01 2.0E-01 3.0E-01 5.3E-01
Testes 6.4E-03 8.3E-03 1.3E-02 2.1E-02 4.1E-02
Thymus 7.0E-03 8.9E-03 1.4E-02 2.1E-02 3.9E-02
Thyroid 6.4E-03 8.1E-03 1.3E-02 2.1E-02 4.0E-02
Uterus 1.2E-02 1.5E-02 2.4E-02 3.8E-02 6.8E-02
Remaining organs 8.8E-03 1.1E-02 1.7E-02 2.7E-02 4.8E-02
Effective dose (mSv/MBq) 1.9E-02 2.3E-02 3.5E-02 5.4E-02 9.9E-02
150
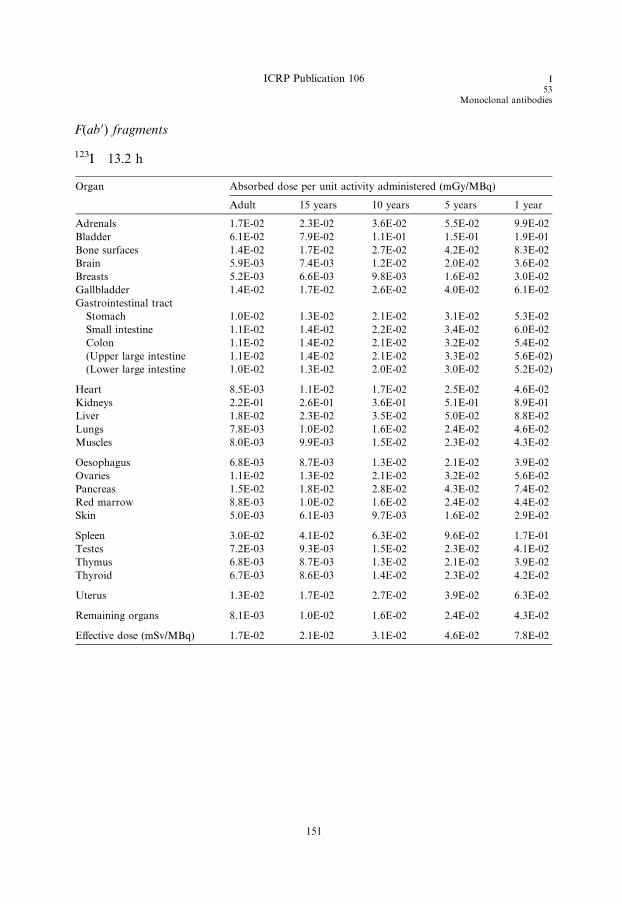
ICRP Publication 106 I53
Monoclonal antibodies
F(ab 0) fragments
123I 13.2 h
Organ Absorbed dose per unit activity administered (mGy/MBq)
Adult 15 years 10 years 5 years 1 year
Adrenals 1.7E-02 2.3E-02 3.6E-02 5.5E-02 9.9E-02
Bladder 6.1E-02 7.9E-02 1.1E-01 1.5E-01 1.9E-01
Bone surfaces 1.4E-02 1.7E-02 2.7E-02 4.2E-02 8.3E-02
Brain 5.9E-03 7.4E-03 1.2E-02 2.0E-02 3.6E-02
Breasts 5.2E-03 6.6E-03 9.8E-03 1.6E-02 3.0E-02
Gallbladder 1.4E-02 1.7E-02 2.6E-02 4.0E-02 6.1E-02
Gastrointestinal tract
Stomach 1.0E-02 1.3E-02 2.1E-02 3.1E-02 5.3E-02
Small intestine 1.1E-02 1.4E-02 2.2E-02 3.4E-02 6.0E-02
Colon 1.1E-02 1.4E-02 2.1E-02 3.2E-02 5.4E-02
(Upper large intestine 1.1E-02 1.4E-02 2.1E-02 3.3E-02 5.6E-02)
(Lower large intestine 1.0E-02 1.3E-02 2.0E-02 3.0E-02 5.2E-02)
Heart 8.5E-03 1.1E-02 1.7E-02 2.5E-02 4.6E-02
Kidneys 2.2E-01 2.6E-01 3.6E-01 5.1E-01 8.9E-01
Liver 1.8E-02 2.3E-02 3.5E-02 5.0E-02 8.8E-02
Lungs 7.8E-03 1.0E-02 1.6E-02 2.4E-02 4.6E-02
Muscles 8.0E-03 9.9E-03 1.5E-02 2.3E-02 4.3E-02
Oesophagus 6.8E-03 8.7E-03 1.3E-02 2.1E-02 3.9E-02
Ovaries 1.1E-02 1.3E-02 2.1E-02 3.2E-02 5.6E-02
Pancreas 1.5E-02 1.8E-02 2.8E-02 4.3E-02 7.4E-02
Red marrow 8.8E-03 1.0E-02 1.6E-02 2.4E-02 4.4E-02
Skin 5.0E-03 6.1E-03 9.7E-03 1.6E-02 2.9E-02
Spleen 3.0E-02 4.1E-02 6.3E-02 9.6E-02 1.7E-01
Testes 7.2E-03 9.3E-03 1.5E-02 2.3E-02 4.1E-02
Thymus 6.8E-03 8.7E-03 1.3E-02 2.1E-02 3.9E-02
Thyroid 6.7E-03 8.6E-03 1.4E-02 2.3E-02 4.2E-02
Uterus 1.3E-02 1.7E-02 2.7E-02 3.9E-02 6.3E-02
Remaining organs 8.1E-03 1.0E-02 1.6E-02 2.4E-02 4.3E-02
Effective dose (mSv/MBq) 1.7E-02 2.1E-02 3.1E-02 4.6E-02 7.8E-02
151

I53Monoclonal Antibodies
ICRP Publication 106
ICRP Publication 106 I53
Monoclonal antibodies
C.24. 131I-labelled monoclonal tumour-associated antibodies131I
C.24.1. Biokinetic model
(C 74) The model for iodine-labelled antibodies and fragments is the same as that
used for the corresponding technetium-labelled substances (see Section C.16.1), with
the modification that released iodine is assumed to be handled by the body accordingto the model for iodine with blocking of uptake in the thyroid (ICRP, 1987, p. 275).
This biokinetic model is not intended to apply to therapeutic use of the substance.
C.24.2. References and further reading for 131I-labelled monoclonal antibodies
Bischof Delaloye, A., Delaloye, B., 1995. Radiolabelled monoclonal antibodies in tumour imaging and
therapy: out of fashion? Eur. J. Nucl. Med. 22, 571–580.
Britton, K.E., Granowska, M., 1987. Radioimmunoscintigraphy in tumour identification. Cancer Surv. 6,
247–267.
Fishman, A.J., Khaw, B.A., Strauss, H.N., 1989. Quo vadis radioimmune imaging. J. Nucl. Med. 20,
1911–1915.
ICRP, 1987. Radiation dose to patients from radiopharmaceuticals. ICRP Publication 53. Ann. ICRP 18
(1–4).
153
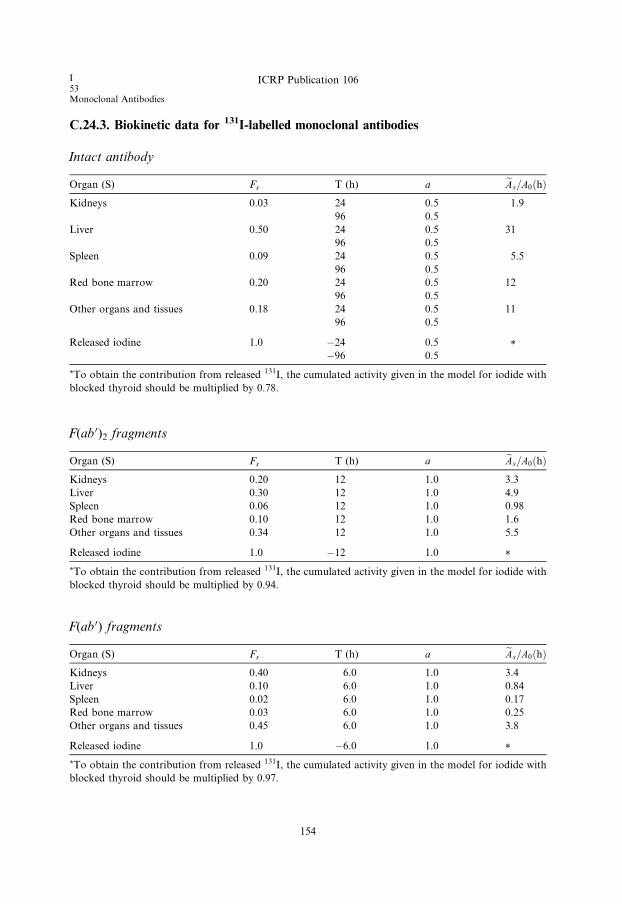
I53Monoclonal Antibodies
ICRP Publication 106
C.24.3. Biokinetic data for 131I-labelled monoclonal antibodies
Intact antibody
Organ (S) Fs T (h) a eAs=A0ðhÞKidneys 0.03 24 0.5 1.9
96 0.5
Liver 0.50 24 0.5 31
96 0.5
Spleen 0.09 24 0.5 5.5
96 0.5
Red bone marrow 0.20 24 0.5 12
96 0.5
Other organs and tissues 0.18 24 0.5 11
96 0.5
Released iodine 1.0 �24 0.5 *�96 0.5
*To obtain the contribution from released 131I, the cumulated activity given in the model for iodide with
blocked thyroid should be multiplied by 0.78.
F(ab 0)2 fragments
Organ (S) Fs T (h) a eAs=A0ðhÞKidneys 0.20 12 1.0 3.3
Liver 0.30 12 1.0 4.9
Spleen 0.06 12 1.0 0.98
Red bone marrow 0.10 12 1.0 1.6
Other organs and tissues 0.34 12 1.0 5.5
Released iodine 1.0 �12 1.0 *
*To obtain the contribution from released 131I, the cumulated activity given in the model for iodide with
blocked thyroid should be multiplied by 0.94.
F(ab 0) fragments
Organ (S) Fs T (h) a eAs=A0ðhÞKidneys 0.40 6.0 1.0 3.4
Liver 0.10 6.0 1.0 0.84
Spleen 0.02 6.0 1.0 0.17
Red bone marrow 0.03 6.0 1.0 0.25
Other organs and tissues 0.45 6.0 1.0 3.8
Released iodine 1.0 �6.0 1.0 *
*To obtain the contribution from released 131I, the cumulated activity given in the model for iodide with
blocked thyroid should be multiplied by 0.97.
154

C.24.4. Absorbed doses for 131I-labelled monoclonal antibodies
Intact antibody
131I 8.04 days
Organ Absorbed dose per unit activity administered (mGy/MBq)
Adult 15 years 10 years 5 years 1 year
Adrenals 2.6E-01 3.2E-01 4.7E-01 6.6E-01 1.1E+00
Bladder 5.0E-01 6.4E-01 9.8E-01 1.3E+00 1.8E+00
Bone surfaces 4.5E-01 4.7E-01 8.1E-01 1.4E+00 2.3E+00
Brain 6.2E-02 7.9E-02 1.3E-01 2.1E-01 4.1E-01
Breasts 8.2E-02 1.0E-01 1.7E-01 2.7E-01 5.2E-01
Gallbladder 3.5E-01 3.9E-01 5.4E-01 8.5E-01 1.6E+00
Gastrointestinal tract
Stomach 1.6E-01 2.0E-01 3.1E-01 5.0E-01 9.3E-01
Small intestine 1.3E-01 1.7E-01 2.7E-01 4.3E-01 7.5E-01
Colon 1.3E-01 1.6E-01 2.6E-01 4.1E-01 7.3E-01
(Upper large intestine 1.5E-01 1.8E-01 3.0E-01 4.9E-01 8.8E-01)
(Lower large intestine 1.0E-01 1.3E-01 2.0E-01 3.1E-01 5.4E-01)
Heart 1.5E-01 1.9E-01 3.0E-01 4.4E-01 7.9E-01
Kidneys 1.0E+00 1.2E+00 1.7E+00 2.5E+00 4.4E+00
Liver 2.4E+00 3.2E+00 4.9E+00 7.3E+00 1.4E+01
Lungs 1.4E-01 1.8E-01 2.6E-01 3.9E-01 7.2E-01
Muscles 9.8E-02 1.2E-01 1.9E-01 3.0E-01 5.6E-01
Oesophagus 8.8E-02 1.1E-01 1.7E-01 2.6E-01 4.9E-01
Ovaries 1.1E-01 1.4E-01 2.2E-01 3.4E-01 6.1E-01
Pancreas 2.7E-01 3.3E-01 5.1E-01 7.8E-01 1.3E+00
Red marrow 7.4E-01 8.2E-01 1.4E+00 2.7E+00 6.6E+00
Skin 6.8E-02 8.5E-02 1.4E-01 2.2E-01 4.3E-01
Spleen 4.0E+00 5.8E+00 9.0E+00 1.4E+01 2.6E+01
Testes 6.4E-02 8.3E-02 1.4E-01 2.2E-01 4.1E-01
Thymus 8.8E-02 1.1E-01 1.7E-01 2.6E-01 4.9E-01
Thyroid 7.0E-02 8.9E-02 1.4E-01 2.3E-01 4.5E-01
Uterus 1.1E-01 1.4E-01 2.2E-01 3.5E-01 6.1E-01
Remaining organs 1.1E-01 1.4E-01 2.2E-01 3.5E-01 6.2E-01
Effective dose (mSv/MBq) 4.2E-01 5.5E-01 8.6E-01 1.4E+00 2.7E+00
ICRP Publication 106 I53
Monoclonal antibodies
155
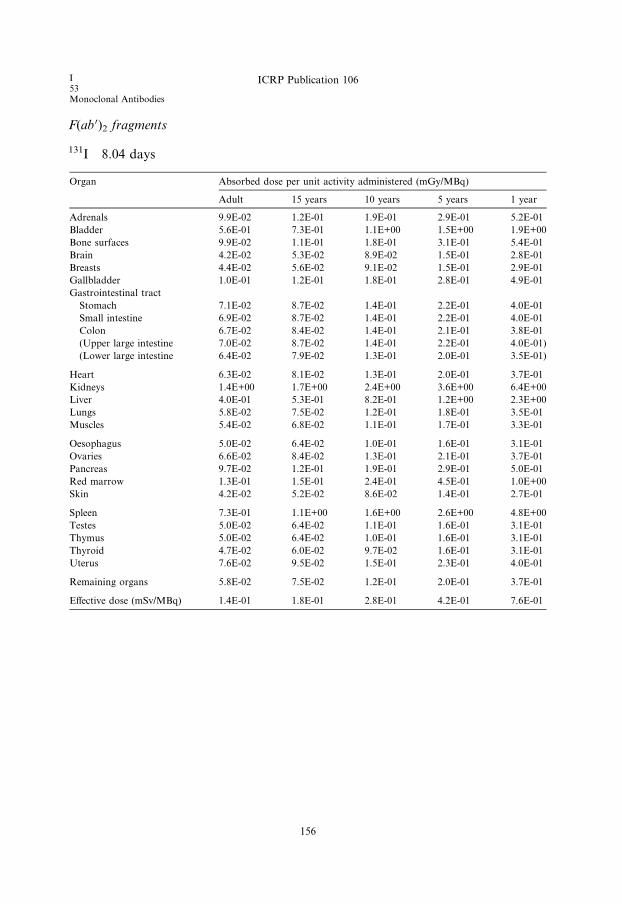
I53Monoclonal Antibodies
ICRP Publication 106
F(ab 0)2 fragments
131I 8.04 days
Organ Absorbed dose per unit activity administered (mGy/MBq)
Adult 15 years 10 years 5 years 1 year
Adrenals 9.9E-02 1.2E-01 1.9E-01 2.9E-01 5.2E-01
Bladder 5.6E-01 7.3E-01 1.1E+00 1.5E+00 1.9E+00
Bone surfaces 9.9E-02 1.1E-01 1.8E-01 3.1E-01 5.4E-01
Brain 4.2E-02 5.3E-02 8.9E-02 1.5E-01 2.8E-01
Breasts 4.4E-02 5.6E-02 9.1E-02 1.5E-01 2.9E-01
Gallbladder 1.0E-01 1.2E-01 1.8E-01 2.8E-01 4.9E-01
Gastrointestinal tract
Stomach 7.1E-02 8.7E-02 1.4E-01 2.2E-01 4.0E-01
Small intestine 6.9E-02 8.7E-02 1.4E-01 2.2E-01 4.0E-01
Colon 6.7E-02 8.4E-02 1.4E-01 2.1E-01 3.8E-01
(Upper large intestine 7.0E-02 8.7E-02 1.4E-01 2.2E-01 4.0E-01)
(Lower large intestine 6.4E-02 7.9E-02 1.3E-01 2.0E-01 3.5E-01)
Heart 6.3E-02 8.1E-02 1.3E-01 2.0E-01 3.7E-01
Kidneys 1.4E+00 1.7E+00 2.4E+00 3.6E+00 6.4E+00
Liver 4.0E-01 5.3E-01 8.2E-01 1.2E+00 2.3E+00
Lungs 5.8E-02 7.5E-02 1.2E-01 1.8E-01 3.5E-01
Muscles 5.4E-02 6.8E-02 1.1E-01 1.7E-01 3.3E-01
Oesophagus 5.0E-02 6.4E-02 1.0E-01 1.6E-01 3.1E-01
Ovaries 6.6E-02 8.4E-02 1.3E-01 2.1E-01 3.7E-01
Pancreas 9.7E-02 1.2E-01 1.9E-01 2.9E-01 5.0E-01
Red marrow 1.3E-01 1.5E-01 2.4E-01 4.5E-01 1.0E+00
Skin 4.2E-02 5.2E-02 8.6E-02 1.4E-01 2.7E-01
Spleen 7.3E-01 1.1E+00 1.6E+00 2.6E+00 4.8E+00
Testes 5.0E-02 6.4E-02 1.1E-01 1.6E-01 3.1E-01
Thymus 5.0E-02 6.4E-02 1.0E-01 1.6E-01 3.1E-01
Thyroid 4.7E-02 6.0E-02 9.7E-02 1.6E-01 3.1E-01
Uterus 7.6E-02 9.5E-02 1.5E-01 2.3E-01 4.0E-01
Remaining organs 5.8E-02 7.5E-02 1.2E-01 2.0E-01 3.7E-01
Effective dose (mSv/MBq) 1.4E-01 1.8E-01 2.8E-01 4.2E-01 7.6E-01
156
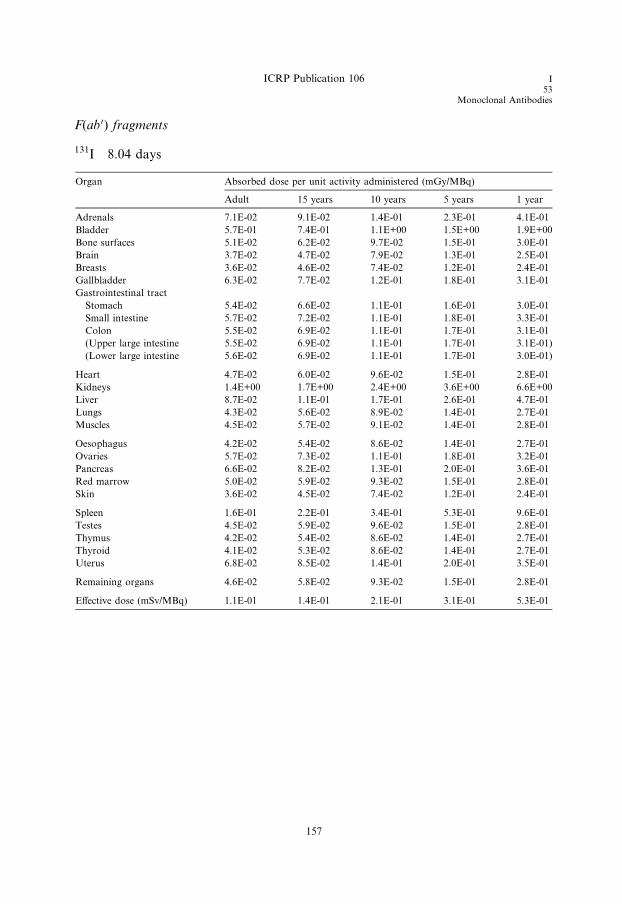
ICRP Publication 106 I53
Monoclonal Antibodies
F(ab 0) fragments
131I 8.04 days
Organ Absorbed dose per unit activity administered (mGy/MBq)
Adult 15 years 10 years 5 years 1 year
Adrenals 7.1E-02 9.1E-02 1.4E-01 2.3E-01 4.1E-01
Bladder 5.7E-01 7.4E-01 1.1E+00 1.5E+00 1.9E+00
Bone surfaces 5.1E-02 6.2E-02 9.7E-02 1.5E-01 3.0E-01
Brain 3.7E-02 4.7E-02 7.9E-02 1.3E-01 2.5E-01
Breasts 3.6E-02 4.6E-02 7.4E-02 1.2E-01 2.4E-01
Gallbladder 6.3E-02 7.7E-02 1.2E-01 1.8E-01 3.1E-01
Gastrointestinal tract
Stomach 5.4E-02 6.6E-02 1.1E-01 1.6E-01 3.0E-01
Small intestine 5.7E-02 7.2E-02 1.1E-01 1.8E-01 3.3E-01
Colon 5.5E-02 6.9E-02 1.1E-01 1.7E-01 3.1E-01
(Upper large intestine 5.5E-02 6.9E-02 1.1E-01 1.7E-01 3.1E-01)
(Lower large intestine 5.6E-02 6.9E-02 1.1E-01 1.7E-01 3.0E-01)
Heart 4.7E-02 6.0E-02 9.6E-02 1.5E-01 2.8E-01
Kidneys 1.4E+00 1.7E+00 2.4E+00 3.6E+00 6.6E+00
Liver 8.7E-02 1.1E-01 1.7E-01 2.6E-01 4.7E-01
Lungs 4.3E-02 5.6E-02 8.9E-02 1.4E-01 2.7E-01
Muscles 4.5E-02 5.7E-02 9.1E-02 1.4E-01 2.8E-01
Oesophagus 4.2E-02 5.4E-02 8.6E-02 1.4E-01 2.7E-01
Ovaries 5.7E-02 7.3E-02 1.1E-01 1.8E-01 3.2E-01
Pancreas 6.6E-02 8.2E-02 1.3E-01 2.0E-01 3.6E-01
Red marrow 5.0E-02 5.9E-02 9.3E-02 1.5E-01 2.8E-01
Skin 3.6E-02 4.5E-02 7.4E-02 1.2E-01 2.4E-01
Spleen 1.6E-01 2.2E-01 3.4E-01 5.3E-01 9.6E-01
Testes 4.5E-02 5.9E-02 9.6E-02 1.5E-01 2.8E-01
Thymus 4.2E-02 5.4E-02 8.6E-02 1.4E-01 2.7E-01
Thyroid 4.1E-02 5.3E-02 8.6E-02 1.4E-01 2.7E-01
Uterus 6.8E-02 8.5E-02 1.4E-01 2.0E-01 3.5E-01
Remaining organs 4.6E-02 5.8E-02 9.3E-02 1.5E-01 2.8E-01
Effective dose (mSv/MBq) 1.1E-01 1.4E-01 2.1E-01 3.1E-01 5.3E-01
157

ICRP Publication 106 Tl81
Ion
C.25. 201Tl-ion201Tl
C.25.1. Biokinetic model
(C 75) Intravenously injected ionic monovalent thallium leaves the blood rapidly
by uptake into the cells of all organs and tissues. The distribution is largely deter-
mined by the magnitude of the regional blood flow, and is therefore dependent onthe degree of physical activity. Compared with the situation at rest, which is consid-
ered in the present model, uptake in muscles increases two- to three-fold during exer-
cise, with a corresponding reduction in other tissues.
(C 76) The organ uptake data in the model are based on the reports by Samson
et al. (1978), Atkins et al. (1977), and Chen et al. (1983). Bartlett et al. (1984) have
shown that 80% of thallium is excreted by way of the gastrointestinal tract and
20% by the renal tract. The whole-body retention curve can be represented by a
bi-exponential function, with half-times of 7 days for 63% of the injected activityand 28 days for 37% of the injected activity (Chen et al., 1983). It is assumed here
that all organs and tissues have similar retention kinetics, with the exception of
the heart which shows more rapid initial clearance (Freeman et al., 1986).
(C 77) The uptake of thallium ions in the testes has been studied extensively.
Direct organ measurements at autopsy in two cases (Samson et al., 1978) showed
0.11–0.12%, while Hosain and Hosain (1981) and Gupta et al. (1981) derived values
of 0.8–1.0% from gamma camera images of the testicular–scrotal region. More
recent studies, however, indicate lower uptake (Rao et al., 1995; Nettleton et al.,2004; Thomas et al., 2005). Thomas et al. (2005) measured testicular uptake in 28
individuals using a collimation method so that the testes were shielded from body
background with lead during imaging. However, activity in the scrotum could still
influence the measurements. Based on data from Thomas et al. (2005) and Krahwin-
kel et al. (1988), uptake in the testes of 0.3% has been adopted.
C.25.2. References for 201Tl-ion
Atkins, H.L., Budinger, T.F., Lebowitz, E., Ansari, A.N., Greene, M.W., Fairchild, R.G., Ellis, K.J.,
1977. Thallium-201 for medical use. Part 3: Human distribution and physical imaging properties. J.
Nucl. Med. 18, 133–140.
Bartlett, R.D., Lathrop, K.A., Faulhaber, P.F., Harper, P.V., 1984. Transfer of thallous ion to and from
gastrointestinal sections. J. Nucl. Med. 25, P92.
Chen, C.T., Lathrop, K.A., Harper, P.V., Bartlett, R.D., Stark, V.J., Fultz, K.R., Faulhaber, P.F., 1983.
Quantitative measurement of long term in vivo thallium distribution in the human. J. Nucl. Med. 24,
P50.
Freeman, M.R., Kanwar, N., Armstrong, P.W., 1986. The variability of thallium half life at rest as
compared to exercise. J. Nucl. Med. 27, 997.
Gupta, S.M., Herrera, N., Spencer, R.P., Hosain, F., Crucitti, T.W., 1981. Testicular-scrotal content of201Tl and 67Ga after intravenous administration. Int. J. Nucl. Med. Biol. 8, 211–213.
159

Tl81Ion
ICRP Publication 106
Hosain, P., Hosain, F., 1981. Revision of gonadal radiation dose to man from thallium-201. In:
Proceedings of the Third International Radiopharmaceutical Dosimetry Symposium, Oak Ridge 1980
(FDA 81-8166). Oak Ridge National Laboratories, Oak Ridge, TN, pp. 333–345.
Krahwinkel, W., Herzog, H., Feinendegen, L.E., 1988. Pharmacokinetics of thallium-201 in normal
individuals after routine myocardial scintigraphy. J. Nucl. Med. 29, 1582–1586.
Nettleton, J.S., Lawson, R.S., Prescott, M.C., Morris, I.D., 2004. Uptake, localization, and dosimetry of111In and 201Tl in human testes. J. Nucl. Med. 45, 138–146.
Rao, D.V., Shepstone, B.J., Wilkins, H.B., Howell, R.W., 1995. Kinetics and dosimetry of thallium-201 in
human testes. J. Nucl. Med. 36, 607–609.
Samson, G., Wackers, F.J.Th., Becker, A.E., Busemann Sokole, E., van der Schoot, J.B., 1978.
Distribution of thallium-201 in man. In: Oeff, K., Schmidt, H.A.E. (Eds.), Nuklearmedizin und
biokybernetik, Vol. 1. Medico-informationsdienste, Berlin, pp. 385–389.
Thomas, S.R., Stabin, M.G., Castronovo, F.P., 2005. Radiation-absorbed dose from 201Tl-thallous
chloride. J. Nucl. Med. 46, 502–508.
160

ICRP Publication 106 Tl81
Ion
C.25.3. Biokinetic data for 201Tl-ion
Organ (S) Fs T (h) a eAs=A0ðhÞBone 0.06 168 0.63 4.9
672 0.37
Thyroid 0.002 168 0.63 0.16
672 0.37
Heart wall 0.04 10 0.50 1.9
168 0.32
672 0.18
Lungs 0.04 168 0.63 3.3
672 0.37
Kidneys 0.06 168 0.63 4.9
672 0.37
Liver 0.09 168 0.63 7.3
672 0.37
Spleen 0.007 168 0.63 0.57
672 0.37
Red marrow 0.06 168 0.63 4.9
672 0.37
Stomach wall 0.006 168 0.63 0.49
672 0.37
Small intestine wall 0.03 168 0.63 2.4
672 0.37
Muscles 0.41 168 0.63 33
672 0.37
Ovaries 0.0003 168 0.63 0.024
672 0.37
Testes 0.003 168 0.63 0.24
672 0.37
Other organs and tissues 0.19 168 0.63 16
672 0.37
Gastrointestinal tract contents
Small intestine 0.80 0.77
Upper large intestine 0.80 2.2
Lower large intestine 0.80 3.3
Urinary bladder contents 0.20
Adult, 15 years, 10 years 0.087
5 years 0.074
1 year 0.050
161

C.25.4. Absorbed doses for 201Tl-ion
201Tl 3.05 days
Organ Absorbed dose per unit activity administered (mGy/MBq)
Adult 15 years 10 years 5 years 1 year
Adrenals 5.7E-02 7.0E-02 1.0E-01 1.5E-01 2.7E-01
Bladder 3.9E-02 5.4E-02 7.9E-02 1.2E-01 2.2E-01
Bone surfaces 3.8E-01 3.9E-01 6.9E-01 1.2E+00 1.9E+00
Brain 2.2E-02 2.4E-02 3.6E-02 5.4E-02 1.0E-01
Breasts 2.4E-02 2.7E-02 4.4E-02 6.6E-02 1.3E-01
Gallbladder 6.5E-02 8.1E-02 1.3E-01 1.9E-01 3.1E-01
Gastrointestinal tract
Stomach 1.1E-01 1.5E-01 2.2E-01 3.5E-01 7.3E-01
Small intestine 1.4E-01 1.8E-01 3.1E-01 5.0E-01 9.4E-01
Colon 2.5E-01 3.2E-01 5.5E-01 9.2E-01 1.8E+00
(Upper large intestine 1.8E-01 2.3E-01 3.9E-01 6.4E-01 1.2E+00)
(Lower large intestine 3.4E-01 4.5E-01 7.6E-01 1.3E+00 2.5E+00)
Heart 1.9E-01 2.4E-01 3.8E-01 6.0E-01 1.1E+00
Kidneys 4.8E-01 5.8E-01 8.2E-01 1.2E+00 2.2E+00
Liver 1.5E-01 2.0E-01 3.1E-01 4.5E-01 8.4E-01
Lungs 1.1E-01 1.6E-01 2.3E-01 3.6E-01 6.9E-01
Muscles 5.2E-02 8.2E-02 1.6E-01 4.5E-01 7.6E-01
Oesophagus 3.6E-02 4.2E-02 6.0E-02 9.0E-02 1.6E-01
Ovaries 1.2E-01 1.2E-01 2.9E-01 4.9E-01 1.1E+00
Pancreas 5.7E-02 7.0E-02 1.1E-01 1.6E-01 2.8E-01
Red marrow 1.1E-01 1.3E-01 2.2E-01 4.5E-01 1.1E+00
Skin 2.1E-02 2.4E-02 3.8E-02 5.8E-02 1.1E-01
Spleen 1.2E-01 1.7E-01 2.6E-01 4.1E-01 7.4E-01
Testes 1.8E-01 4.1E-01 3.1E+00 3.6E+00 4.9E+00
Thymus 3.6E-02 4.2E-02 6.0E-02 9.0E-02 1.6E-01
Thyroid 2.2E-01 3.5E-01 5.4E-01 1.2E+00 2.3E+00
Uterus 5.0E-02 6.2E-02 9.9E-02 1.5E-01 2.7E-01
Remaining organs 5.4E-02 8.2E-02 1.6E-01 3.4E-01 5.5E-01
Effective dose (mSv/MBq) 1.4E-01 2.0E-01 5.6E-01 7.9E-01 1.3E+00
Tl81Ion
ICRP Publication 106
162
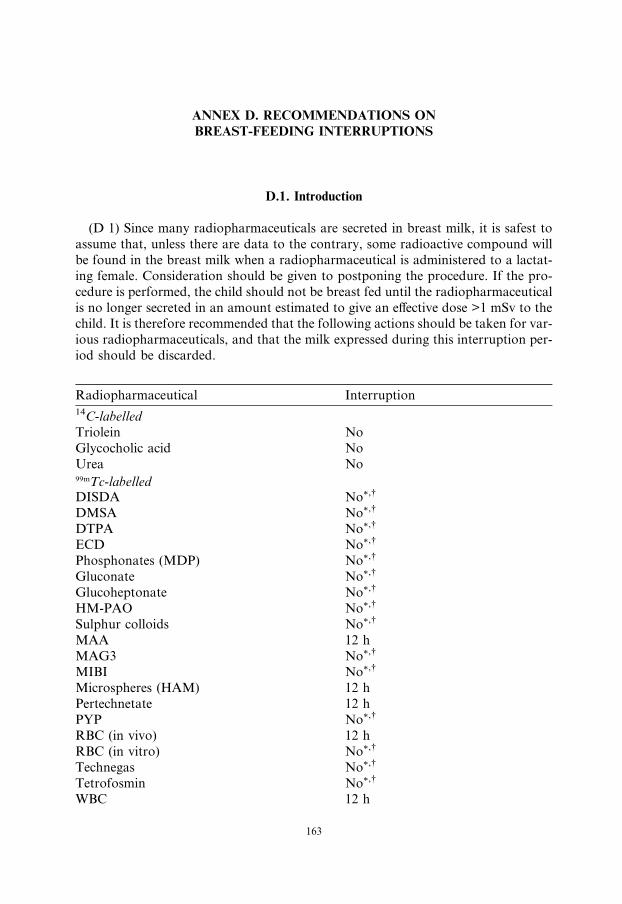
ANNEX D. RECOMMENDATIONS ON
BREAST-FEEDING INTERRUPTIONS
D.1. Introduction
(D 1) Since many radiopharmaceuticals are secreted in breast milk, it is safest to
assume that, unless there are data to the contrary, some radioactive compound will
be found in the breast milk when a radiopharmaceutical is administered to a lactat-
ing female. Consideration should be given to postponing the procedure. If the pro-
cedure is performed, the child should not be breast fed until the radiopharmaceutical
is no longer secreted in an amount estimated to give an effective dose >1 mSv to thechild. It is therefore recommended that the following actions should be taken for var-
ious radiopharmaceuticals, and that the milk expressed during this interruption per-
iod should be discarded.
Radiopharmaceutical
163
Interruption
14C-labelledTriolein
NoGlycocholic acid
NoUrea
No 99mTc-labelled DISDA No*,�DMSA
No*,�DTPA
No*,�ECD
No*,�Phosphonates (MDP)
No*,�Gluconate
No*,�Glucoheptonate
No*,�HM-PAO
No*,�Sulphur colloids
No*,�MAA
12 hMAG3
No*,�MIBI
No*,�Microspheres (HAM)
12 hPertechnetate
12 hPYP
No*,�RBC (in vivo)
12 hRBC (in vitro)
No*,�Technegas
No*,�Tetrofosmin
No*,�WBC
12 h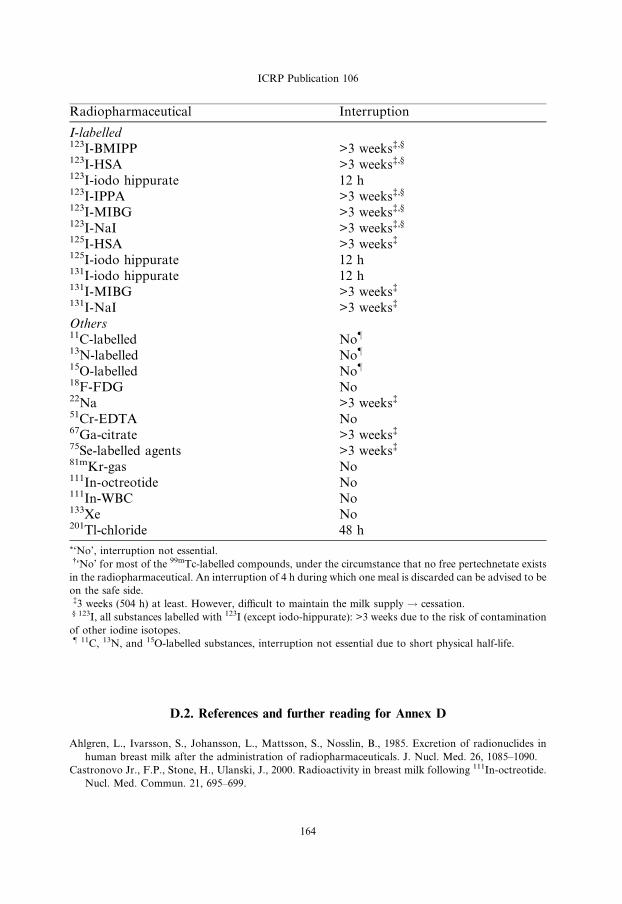
ICRP Publication 106
Radiopharmaceutical
164
Interruption
I-labelled
123I-BMIPP >3 weeks�,§123I-HSA
>3 weeks�,§123I-iodo hippurate
12 h 123I-IPPA >3 weeks�,§123I-MIBG
>3 weeks�,§123I-NaI
>3 weeks�,§125I-HSA
>3 weeks�125I-iodo hippurate
12 h 131I-iodo hippurate 12 h 131I-MIBG >3 weeks�131I-NaI
>3 weeks�Others
11C-labelled No–13N-labelled
No–15O-labelled
No–18F-FDG
No 22Na >3 weeks�51Cr-EDTA
No 67Ga-citrate >3 weeks�75Se-labelled agents
>3 weeks�81mKr-gas
No 111In-octreotide No 111In-WBC No 133Xe No 201Tl-chloride 48 h*‘No’, interruption not essential.�‘No’ for most of the 99mTc-labelled compounds, under the circumstance that no free pertechnetate exists
in the radiopharmaceutical. An interruption of 4 h during which one meal is discarded can be advised to be
on the safe side.�3 weeks (504 h) at least. However, difficult to maintain the milk supply ! cessation.§ 123I, all substances labelled with 123I (except iodo-hippurate): >3 weeks due to the risk of contamination
of other iodine isotopes.– 11C, 13N, and 15O-labelled substances, interruption not essential due to short physical half-life.
D.2. References and further reading for Annex D
Ahlgren, L., Ivarsson, S., Johansson, L., Mattsson, S., Nosslin, B., 1985. Excretion of radionuclides in
human breast milk after the administration of radiopharmaceuticals. J. Nucl. Med. 26, 1085–1090.
Castronovo Jr., F.P., Stone, H., Ulanski, J., 2000. Radioactivity in breast milk following 111In-octreotide.
Nucl. Med. Commun. 21, 695–699.
ICRP Publication 106
Evans, J.L., Mountford, P.J., Herring, A.N., Richardson, M.A., 1993. Secretion of radioactivity in breast
milk following administration of 99Tcm-MAG3. Nucl. Med. Commun. 14, 108–111.
Johnston, R.E., Mukherji, S.K., Perry, R.J., Stabin, M.G., 1996. Radiation dose from breastfeeding
following administration of thallium-201. J. Nucl. Med. 37, 2079–2082.
McCauley, E., Mackie, A., 2002. Breast milk activity during early lactation following maternal 99Tcm
macroaggregated albumin lung perfusion scan. Br. J. Radiol. 75, 464–466.
Mountford, P.J., Coakley, A.J., 1989. A review of the secretion of radioactivity in human breast milk:
data, quantitative analysis and recommendations. Nucl. Med. Commun. 10, 15–27.
Rose, M.R., Prescott, M.C., Herman, K.J., 1990. Excretion of iodine-123-hippuran, technetium-99m-red
blood cells, and technetium-99m-macroaggregated albumin into breast milk. J. Nucl. Med. 31, 978–
984.
Rubow, S., Klopper, J., Wasserman, H., Baard, B., van Niekerk, M., 1994. The excretion of
radiopharmaceuticals in human breast milk: additional data and dosimetry. Eur. J. Nucl. Med. 21,
144–153.
Stabin, M.G., Breitz, H.B., 2000. Breast milk excretion of radiopharmaceuticals: mechanisms, findings,
and radiation dosimetry. J. Nucl. Med. 41, 863–873.
Tobin, R.E., Schneider, P.B., 1976. Uptake of 67Ga in the lactating breast and its persistence in milk: case
report. J. Nucl. Med. 17, 1055–1056.
165


ANNEX E. RADIATION EXPOSURE OF HANDS IN RADIOPHARMACIES:
MONITORING OF DOSES AND OPTIMISATION OF PROTECTION
E.1. Introduction
(E 1) The preparation of radiopharmaceuticals takes place in a radiopharmacy,
which may serve a single nuclear medicine unit or may distribute radiopharmaceuti-
cals to users in several hospitals. The radiopharmaceuticals are then administered to
patients for diagnostic tests or therapy. The most common radionuclide used in nu-
clear medicine is 99mTc, which is added to manufactured pharmaceutical kits. The
high activity of the radionuclide used for labelling forms a source of radiation expo-sure to radiopharmacists. The distribution of dose across the hands is often highly
non-homogenous. Whereas personal dose equivalents, recorded by dosimeters
placed at the thorax, show yearly values well below the dose limits, the dose equiv-
alents to hands and fingers may reach values up to two orders of magnitude greater
than the thorax and have the potential to exceed the annual dose limit of 500 mSv.
(E 2) 99mTc is obtained from 99Mo/99mTc generators by controlled elution, and the
radionuclide is used subsequently for preparation of various radiopharmaceuticals,
using appropriate ligands and following specific labelling protocols. The activitiesof 99mTc administered to individual patients vary from approximately 70 to 1300
MBq. In a busy nuclear medicine department, the daily usage of 99mTc activity
may reach 50 GBq, and radiopharmacies that serve a number of nuclear medicine
departments may handle over 200 GBq.
(E 3) The activities dispensed have been increasing over the last 20 years due to the
rise in the number of patients investigated and also due to some increase in the activ-
ity administered to an average patient to allow single photon emission computed
tomographic (SPECT) imaging procedures to be performed (Gemmell and Staff,1988; ARSAC, 2006). Doses to the hands of operators have also increased with
the activities handled.
(E 4) Medical physicists have been aware for some time that exposure of the hands
of radiopharmacists could be significant (Neil, 1969; Anderson et al., 1972; Bjurman
et al., 1982), and more detailed studies were carried out in the late 1980s (Harding
et al., 1985; Koback and Plato, 1985; Clarke and Brisco, 1986; Williams et al.,
1987; Stuardo, 1990; Batchelor et al., 1991a,b). However, these studies aimed to
determine the average dose to the hands to demonstrate compliance with earlierICRP recommendations (ICRP, 1977).
(E 5) Systematic studies to determine the dose to specific parts of the hand to dem-
onstrate compliance with later ICRP recommendations were initiated in the UK,
where a large radiopharmacy in the Western Infirmary, Glasgow was preparing
radiopharmaceuticals for nuclear medicine departments in 12 hospitals (Montgom-
ery et al., 1997, 1999; Dhanse et al., 2000). Observations made over several years
showed that exposure of the hands had been rising steadily because of the increased
167
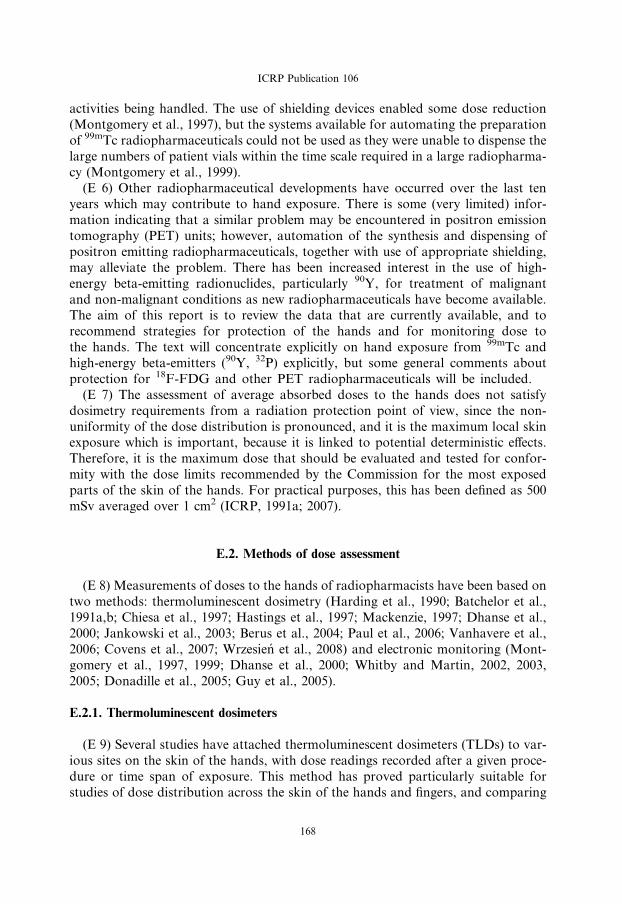
ICRP Publication 106
activities being handled. The use of shielding devices enabled some dose reduction
(Montgomery et al., 1997), but the systems available for automating the preparation
of 99mTc radiopharmaceuticals could not be used as they were unable to dispense the
large numbers of patient vials within the time scale required in a large radiopharma-
cy (Montgomery et al., 1999).(E 6) Other radiopharmaceutical developments have occurred over the last ten
years which may contribute to hand exposure. There is some (very limited) infor-
mation indicating that a similar problem may be encountered in positron emission
tomography (PET) units; however, automation of the synthesis and dispensing of
positron emitting radiopharmaceuticals, together with use of appropriate shielding,
may alleviate the problem. There has been increased interest in the use of high-
energy beta-emitting radionuclides, particularly 90Y, for treatment of malignant
and non-malignant conditions as new radiopharmaceuticals have become available.The aim of this report is to review the data that are currently available, and to
recommend strategies for protection of the hands and for monitoring dose to
the hands. The text will concentrate explicitly on hand exposure from 99mTc and
high-energy beta-emitters (90Y, 32P) explicitly, but some general comments about
protection for 18F-FDG and other PET radiopharmaceuticals will be included.
(E 7) The assessment of average absorbed doses to the hands does not satisfy
dosimetry requirements from a radiation protection point of view, since the non-
uniformity of the dose distribution is pronounced, and it is the maximum local skinexposure which is important, because it is linked to potential deterministic effects.
Therefore, it is the maximum dose that should be evaluated and tested for confor-
mity with the dose limits recommended by the Commission for the most exposed
parts of the skin of the hands. For practical purposes, this has been defined as 500
mSv averaged over 1 cm2 (ICRP, 1991a; 2007).
E.2. Methods of dose assessment
(E 8) Measurements of doses to the hands of radiopharmacists have been based on
two methods: thermoluminescent dosimetry (Harding et al., 1990; Batchelor et al.,
1991a,b; Chiesa et al., 1997; Hastings et al., 1997; Mackenzie, 1997; Dhanse et al.,
2000; Jankowski et al., 2003; Berus et al., 2004; Paul et al., 2006; Vanhavere et al.,
2006; Covens et al., 2007; Wrzesien et al., 2008) and electronic monitoring (Mont-
gomery et al., 1997, 1999; Dhanse et al., 2000; Whitby and Martin, 2002, 2003,
2005; Donadille et al., 2005; Guy et al., 2005).
E.2.1. Thermoluminescent dosimeters
(E 9) Several studies have attached thermoluminescent dosimeters (TLDs) to var-
ious sites on the skin of the hands, with dose readings recorded after a given proce-
dure or time span of exposure. This method has proved particularly suitable for
studies of dose distribution across the skin of the hands and fingers, and comparing
168
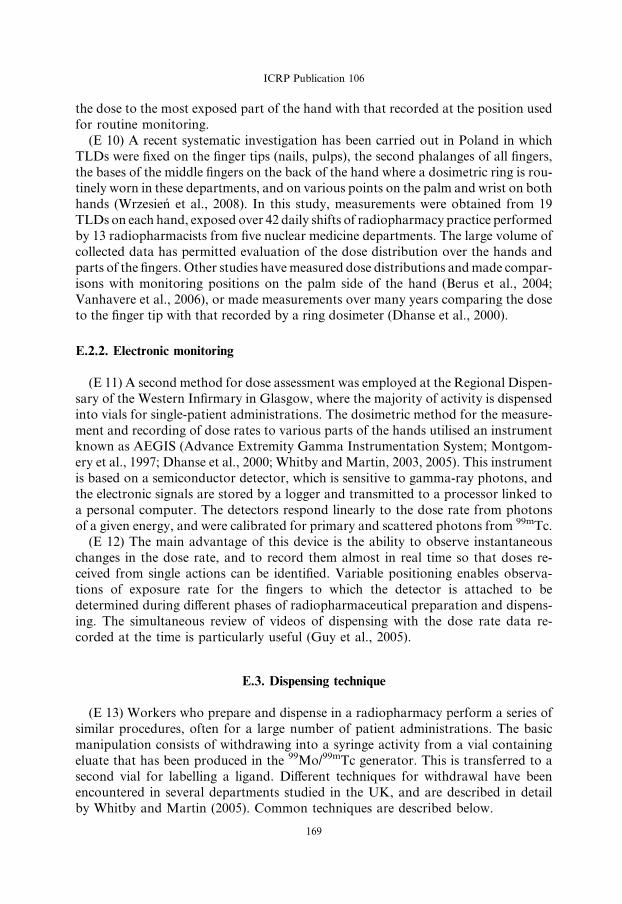
ICRP Publication 106
the dose to the most exposed part of the hand with that recorded at the position used
for routine monitoring.
(E 10) A recent systematic investigation has been carried out in Poland in which
TLDs were fixed on the finger tips (nails, pulps), the second phalanges of all fingers,
the bases of the middle fingers on the back of the hand where a dosimetric ring is rou-tinely worn in these departments, and on various points on the palm and wrist on both
hands (Wrzesien et al., 2008). In this study, measurements were obtained from 19
TLDs on each hand, exposed over 42 daily shifts of radiopharmacy practice performed
by 13 radiopharmacists from five nuclear medicine departments. The large volume of
collected data has permitted evaluation of the dose distribution over the hands and
parts of the fingers. Other studies have measured dose distributions and made compar-
isons with monitoring positions on the palm side of the hand (Berus et al., 2004;
Vanhavere et al., 2006), or made measurements over many years comparing the doseto the finger tip with that recorded by a ring dosimeter (Dhanse et al., 2000).
E.2.2. Electronic monitoring
(E 11) A second method for dose assessment was employed at the Regional Dispen-
sary of the Western Infirmary in Glasgow, where the majority of activity is dispensed
into vials for single-patient administrations. The dosimetric method for the measure-
ment and recording of dose rates to various parts of the hands utilised an instrumentknown as AEGIS (Advance Extremity Gamma Instrumentation System; Montgom-
ery et al., 1997; Dhanse et al., 2000; Whitby and Martin, 2003, 2005). This instrument
is based on a semiconductor detector, which is sensitive to gamma-ray photons, and
the electronic signals are stored by a logger and transmitted to a processor linked to
a personal computer. The detectors respond linearly to the dose rate from photons
of a given energy, and were calibrated for primary and scattered photons from 99mTc.
(E 12) The main advantage of this device is the ability to observe instantaneous
changes in the dose rate, and to record them almost in real time so that doses re-ceived from single actions can be identified. Variable positioning enables observa-
tions of exposure rate for the fingers to which the detector is attached to be
determined during different phases of radiopharmaceutical preparation and dispens-
ing. The simultaneous review of videos of dispensing with the dose rate data re-
corded at the time is particularly useful (Guy et al., 2005).
E.3. Dispensing technique
(E 13) Workers who prepare and dispense in a radiopharmacy perform a series of
similar procedures, often for a large number of patient administrations. The basic
manipulation consists of withdrawing into a syringe activity from a vial containing
eluate that has been produced in the 99Mo/99mTc generator. This is transferred to a
second vial for labelling a ligand. Different techniques for withdrawal have been
encountered in several departments studied in the UK, and are described in detail
by Whitby and Martin (2005). Common techniques are described below.
169

Fig. E.1. Positions of hands used for dispensing radiopharmaceutical with the inversion technique, showing
the arrangement commonly used with the index finger pushing against the syringe barrel as the plunger is
pulled by the thumb and middle finger (Martin and Whitby, 2005) (with permission from Lippincott
Williams and Wilkins).
ICRP Publication 106
E.3.1. Inversion technique
(E 14) Use of an inverted vial with the syringe needle inserted into liquid pooled
near the neck. A typical application of the technique, in which the thumb and middle
finger withdraw the plunger with the index finger pushing against the barrel of the
syringe, is shown in Fig. E.1.
E.3.2. V-technique
(E 15) The vial is held at 20–40� to the horizontal, and the syringe angled at 20–40�in the opposite direction to form a V-configuration (Fig. E.2). In a modification to
170
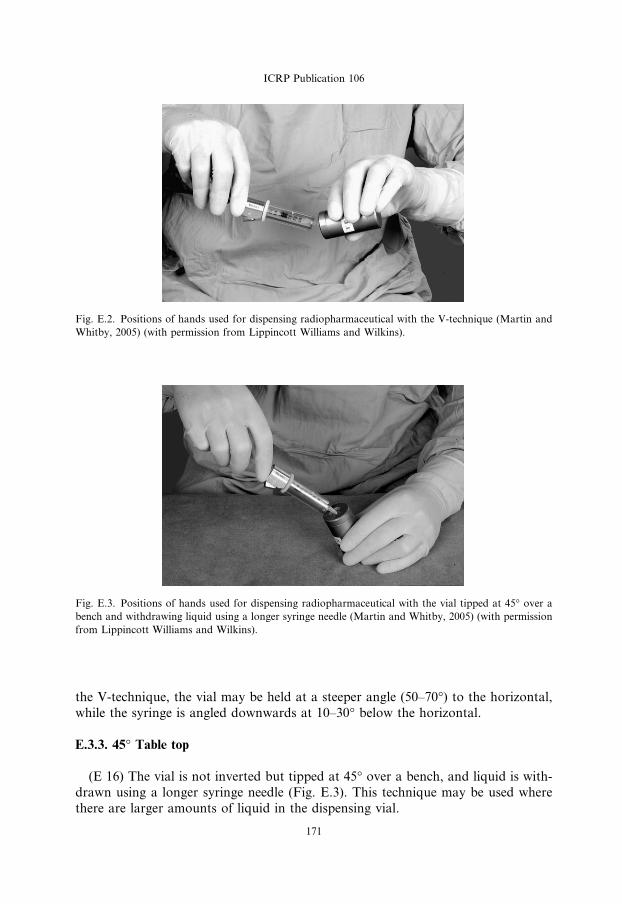
Fig. E.2. Positions of hands used for dispensing radiopharmaceutical with the V-technique (Martin and
Whitby, 2005) (with permission from Lippincott Williams and Wilkins).
Fig. E.3. Positions of hands used for dispensing radiopharmaceutical with the vial tipped at 45� over a
bench and withdrawing liquid using a longer syringe needle (Martin and Whitby, 2005) (with permission
from Lippincott Williams and Wilkins).
ICRP Publication 106
the V-technique, the vial may be held at a steeper angle (50–70�) to the horizontal,
while the syringe is angled downwards at 10–30� below the horizontal.
E.3.3. 45� Table top
(E 16) The vial is not inverted but tipped at 45� over a bench, and liquid is with-
drawn using a longer syringe needle (Fig. E.3). This technique may be used where
there are larger amounts of liquid in the dispensing vial.
171

ICRP Publication 106
E.3.4. Purpose-built jig
(E 17) In some departments, a purpose-built jig is used to hold a vial containing
eluted activity at a defined position to avoid direct contact of the vial with the hand
of the worker.(E 18) The dispensing technique employed is less important in determining the mag-
nitude of the dose than the skill of the operator and the use made of local shielding
devices (see Section E.5). Doses can be increased considerably if the procedure takes
a longer time, for example if the radiopharmacist needs to make small adjustments to
remove air bubbles (Berus et al., 2004). Thus, it is important that staff undergo an
extensive period of training and practice with non-radioactive liquids prior to dispens-
ing radiopharmaceuticals for the first time. Although the dispensing technique is less
important in determining the magnitude of doses received, it does affect the fingerswhich receive the highest doses. Therefore, it should be taken into account when
determining the positions on the fingers at which monitoring should be carried out.
(E 19) There has been some debate regarding the size of syringe that is most appro-
priate for dispensing. A 1-ml syringe is perhaps the best choice, as it allows the vol-
ume of radiopharmaceutical to be judged more readily so that manipulations can be
performed more rapidly, but this results in the fingers being closer to the radiophar-
maceutical. A 2-ml syringe is often recommended, as the radiopharmaceutical in the
base of a larger syringe will be further away from the fingers manipulating the plun-ger. However, amounts of solution in the syringe are more difficult to judge and this
may increase the time taken to dispense. Thus, there is a balance between competing
factors about which the radiopharmacist and radiation protection expert should
liaise to assess the risk and determine the best approach.
E.4. Hand exposure and dose distribution
(E 20) Results of studies on hand exposure are often expressed in terms of dose to
a given location on either hand, related to the amount of 99mTc activity processed
(lSv/GBq). A study of several UK radiopharmacies showed that doses to the most
exposed parts of the hands from dispensing radiopharmaceuticals varied from 4 to
40 lGy/GBq (Whitby and Martin, 2005). A substantial amount of other data (Ko-
back and Plato, 1985; Williams et al., 1987; Chiesa et al., 1997; Hastings et al., 1997;
Mackenzie, 1997; Dhanse et al., 2000; Harding et al., 1990; Jankowski et al., 2003;
Paul et al., 2006; Tandon et al., 2007; Covens et al., 2007; Wrzesien et al., 2008)for individual pharmacists or other staff members dispensing 99mTc-labelled radio-
pharmaceuticals shows doses varying from a few lGy to more than 100 lGy per
GBq handled.
(E 21) All studies demonstrate the importance of the skill of the radiopharmacist and
the speed with which syringe manipulations are performed. As a rule, workers with lim-
ited experience receive doses to the fingers which are significantly higher than those of
highly skilled radiopharmacists who can perform the manipulations more rapidly. The
dispensing time will be kept to a minimum by close attention to staff training.
172

ICRP Publication 106
(E 22) During the dispensing process, the majority of the exposure to the hand
originates from activity within the syringe, as the radiopharmaceutical is drawn up
and dispensed (Dhanse et al., 2000; Whitby and Martin, 2003). The tip of the index
finger on the dominant hand is likely to receive the highest dose. The exposure to the
tip of the thumb can also be significant and may be similar to that of the index finger,especially where a syringe shield is used (Whitby and Martin, 2005).
(E 23) As the active volume is drawn into the syringe, it is often the thumb and
middle finger which draw back the plunger (Fig. E.1), with the index finger pushing
against the end of the syringe shield. Therefore, the index finger tends to be nearer to
the active volume than any other part of the hand. However, the finger placement
used by different individuals varies, even when the same dispensing technique is used,
and the distribution of dose across the hand varies for every individual as it is related
to the exact position that the fingers adopt during the dispensing process. Some indi-viduals place the tip of the index finger further along the barrel of the syringe when
withdrawing or dispensing a volume of activity, so it will not be as highly exposed as
other fingers. Thus, when a syringe shield is employed, small differences in the posi-
tions of the index finger and thumb relative to the active volume within the syringe
can have a significant effect on exposure.
(E 24) The dose to the non-dominant hand, which holds the vial, also depends on
the use of a syringe shield and dispensing technique. Staff employing the inversion
technique (Fig. E.1) or modified V-technique have the potential to expose thenon-dominant hand to a greater dose than those employing the V- or 45� table
top techniques (Figs. E.2 and E.3; Whitby and Martin, 2005). This is because the
vial is held with the neck towards the bottom of the hand, so the wrist lies closer
to the radiation field from the vial and syringe (Fig. E.1). As the user inverts the vial,
the active volume collects near the neck of the vial, increasing the exposure by broad-
ening the radiation field (Whitby and Martin, 2003). Using the V- and 45� table top
techniques, the non-dominant hand is largely to the rear of the top of the vial and is
further from the radiopharmaceutical in the syringe, so exposure is less significantthan that to the fingers of the dominant hand.
(E 25) For procedures where dispensing is undertaken from vials containing more
liquid, the vial does not have to be inverted and a long syringe needle can be used to
reach the base of the vial. Although there will be more activity in the vial, the hand
dose will tend to be lower because the radiopharmaceutical is in the bottom of the
vial, further from the hand, and the protection offered by the vial shield or lead
pot is more effective.
(E 26) There is general agreement that, irrespective of local differences in tech-nique, the most exposed parts of the hands are likely to be the tips of the index
and middle fingers, and the thumb of the dominant hand. The hand that manipulates
the syringe will tend to receive a higher dose, and the dose to the non-dominant
hand will typically be approximately half this value. The differences in handling
techniques, including ways of manipulating the syringe, and the relative positions
of the syringe and vial for withdrawal of active solutions are of secondary impor-
tance for the magnitude of doses to hands compared with the use of syringe
shielding.
173

ICRP Publication 106
(E 27) Similar issues to those discussed above also apply to staff members in nucle-
ar medicine departments. Although radiopharmaceuticals may be dispensed by the
radiopharmacist directly into syringes, ready for injection, it is more usual, particu-
larly where one radiopharmacy serves several hospitals, to dispense into a vial which
is then sent to the nuclear medicine department. Thus, withdrawal of radiopharma-ceuticals into a syringe may also be undertaken by a nurse/technician or a physician
prior to injection into the patient, although the activities handled will be much lower.
Doses from giving the injection are variable, but again use of a syringe shield is the
most effective way of keeping these to a minimum. The non-dominant hand is some-
times used to support the syringe needle, and if this is done the tips of the fingers on
this hand are likely to receive the highest doses (Covens et al., 2007). If a Venflon nee-
dle is inserted into the patient’s vein beforehand, the injection may proceed more rap-
idly and the dose to the hand of the nurse or physician kept to a minimum.
E.5. Use of syringe and vial shields
(E 28) The application of shielding for the syringe and vial is the single most
important factor in reducing the magnitude of doses to the finger tips. Syringe shields
have the disadvantage that they are heavy and make manipulations more difficult,
but they provide the most effective method for reducing hand doses. Doses to the fin-gers for the parts of procedures for which syringe shields are used are only 10–25% of
those for similar parts when a shield is not used. The maximum dose rates (averaged
over 1-s intervals) are reduced to approximately 40% of those where no shield is
used, and the lengths of the periods of exposure to high dose rates are reduced from
6–10 s to 2–4 s.
(E 29) The reason for this is that the syringe shield provides protection around the
barrel of the syringe, but there is still a narrow pencil beam of radiation emerging
from the end in the direction in which the fingers are positioned in order to manip-ulate the plunger. The maximum dose rates are smaller because of the shielding, but
the periods of exposure, as the fingers move through the high dose rate parts of the
field, are also shorter because the lateral extent of the field with high dose rates is less
(Whitby and Martin, 2003).
(E 30) Due to the dose reduction that is achieved, syringe shields should also be
used for intravenous injection of patients. The poor visibility of the pharmaceutical
within traditional syringe shields, which only have narrow lead glass windows, may
increase the time to dispense, and some reports have suggested that this may out-weigh the shielding advantage (Berus et al., 2004). Syringe shields made entirely from
lead glass are now available, which provide good visibility and so should not slow
down the procedure (Figs. E.1–3). They allow the technician to check volumes of li-
quid more quickly and determine whether there are any bubbles present in the syr-
inge. The disadvantage of glass shields is that they are relatively brittle, they often
break, and they are more expensive to replace. The metal syringe shields with win-
dows are more substantial, but as stated above, they limit the view of the liquid in
the syringe and may therefore slow down procedures.
174
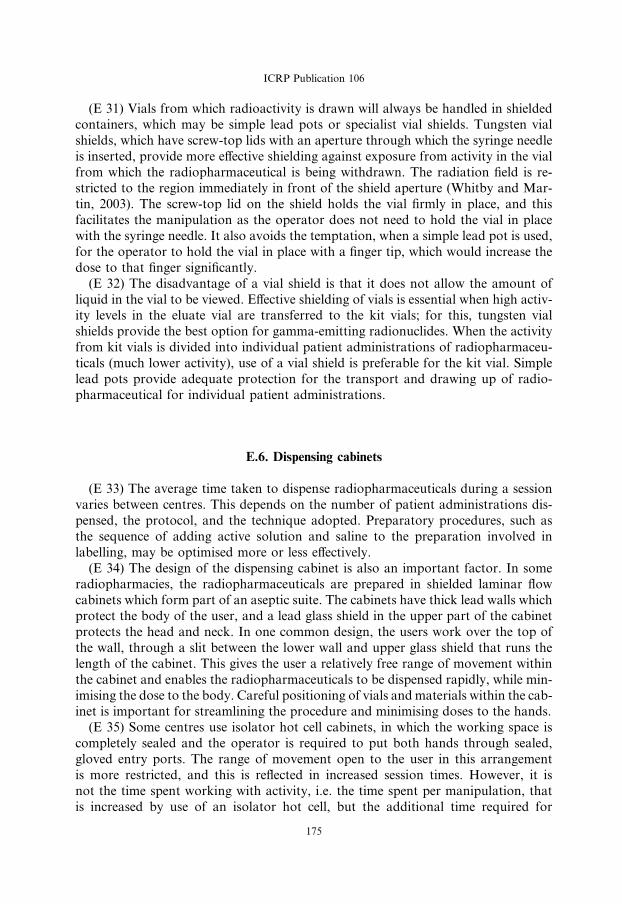
ICRP Publication 106
(E 31) Vials from which radioactivity is drawn will always be handled in shielded
containers, which may be simple lead pots or specialist vial shields. Tungsten vial
shields, which have screw-top lids with an aperture through which the syringe needle
is inserted, provide more effective shielding against exposure from activity in the vial
from which the radiopharmaceutical is being withdrawn. The radiation field is re-stricted to the region immediately in front of the shield aperture (Whitby and Mar-
tin, 2003). The screw-top lid on the shield holds the vial firmly in place, and this
facilitates the manipulation as the operator does not need to hold the vial in place
with the syringe needle. It also avoids the temptation, when a simple lead pot is used,
for the operator to hold the vial in place with a finger tip, which would increase the
dose to that finger significantly.
(E 32) The disadvantage of a vial shield is that it does not allow the amount of
liquid in the vial to be viewed. Effective shielding of vials is essential when high activ-ity levels in the eluate vial are transferred to the kit vials; for this, tungsten vial
shields provide the best option for gamma-emitting radionuclides. When the activity
from kit vials is divided into individual patient administrations of radiopharmaceu-
ticals (much lower activity), use of a vial shield is preferable for the kit vial. Simple
lead pots provide adequate protection for the transport and drawing up of radio-
pharmaceutical for individual patient administrations.
E.6. Dispensing cabinets
(E 33) The average time taken to dispense radiopharmaceuticals during a session
varies between centres. This depends on the number of patient administrations dis-
pensed, the protocol, and the technique adopted. Preparatory procedures, such as
the sequence of adding active solution and saline to the preparation involved in
labelling, may be optimised more or less effectively.
(E 34) The design of the dispensing cabinet is also an important factor. In someradiopharmacies, the radiopharmaceuticals are prepared in shielded laminar flow
cabinets which form part of an aseptic suite. The cabinets have thick lead walls which
protect the body of the user, and a lead glass shield in the upper part of the cabinet
protects the head and neck. In one common design, the users work over the top of
the wall, through a slit between the lower wall and upper glass shield that runs the
length of the cabinet. This gives the user a relatively free range of movement within
the cabinet and enables the radiopharmaceuticals to be dispensed rapidly, while min-
imising the dose to the body. Careful positioning of vials and materials within the cab-inet is important for streamlining the procedure and minimising doses to the hands.
(E 35) Some centres use isolator hot cell cabinets, in which the working space is
completely sealed and the operator is required to put both hands through sealed,
gloved entry ports. The range of movement open to the user in this arrangement
is more restricted, and this is reflected in increased session times. However, it is
not the time spent working with activity, i.e. the time spent per manipulation, that
is increased by use of an isolator hot cell, but the additional time required for
175

ICRP Publication 106
operators to insert and withdraw their hands from the gloved area in order to per-
form other tasks within the room.
(E 36) The dose data available from centres where hand doses have been studied in
detail with a heavy workload dispensing of the order of 100–200 GBq/day led to the
conclusion that there is a potential for approaching, and possibly exceeding, the an-nual dose limit to the pulp of fingers (500 mSv) if appropriate protection measures
are not in place (Dhanse et al., 2000; Jankowski et al., 2003; Whitby and Martin,
2005; Wrzesien et al., 2008).
E.7. Hand doses from beta-emitting therapy radionuclides
(E 37) Significant doses to the hands can be received during the administration ofradionuclides which emit high-energy beta-radiation. Medical staff often are not
aware of the high risk from exposure to beta particles, and the 500 mSv annual dose
limit can easily be exceeded if appropriate protection measures are not in place. Treat-
ments for a variety of malignancies are now undertaken in major radiotheraoy cen-
tres, of which the application of radioimmunotherapy for non-Hodgkins
lymphoma with 90Y Zevalin is the most widely used (Aubert et al., 2002; Zhu,
2004; Cremonesi et al., 2006; Rimpler et al., 2007; Rimpler and Barth, 2007). In addi-
tion, radiosynovectomy using 90Y and other beta emitters has been applied to thetreatment of rheumatoid arthritis for over 40 years (Mielcarek and Barth, 2002; Liepe
et al., 2005). These therapies require one or more GBq of 90Y. They present significant
protection problems, since the dose rates at 5 cm and 30 cm from a 1 Gbq point source
are 3500 mGy h�1 and 100 mGy h�1, respectively (Shleien et al., 1998), and the skin
dose equivalent rate from a contamination level of 1 MBq cm�2 is 2000 mSv h�1
(Delacroix et al., 2002).
(E 38) A wide range of finger doses from 1 lSv to over 100 lSv per MBq handled
have been reported (Mielcarek and Barth, 2002; Liepe et al., 2005; Rimpler et al.,2007; Rimpler and Barth, 2007), which implies that there are significant options
for improving radiation protection practices. Measurements performed in a number
of hospitals during therapy with Zevalin have shown mean/median finger doses of 3
to 6 mSv per patient for the preparation stage and 0.5 to 1 mSv per patient for the
administration of 1 – 2 GBq of 90Y (Cremonesi et al., 2006; Rimpler et al., 2007).
For the administration of therapies such as peptide receptor radiotherapy with
90Y, which are performed using an infusion pump, a median dose to the finger tip
of 5.5 mSv and a range of 2 – 29 mSv were reported by Rimpler et al. (2007).(E 39) Direct handling of any vessel containing a high-energy beta emitter may
give rise to high localised skin doses. Therefore, particular care should be taken in
the planning of administrations. Shields of 10 mm thick polymethylmethacrylate
(PMMA) must be used to absorb the beta radiation and reduce bremsstrahlung pro-
duction in order to ensure that doses are kept to a minimum, and dedicated hot cells
may be used for radiopharmaceutical preparation. The mean and maximum ranges
of 90Y beta particles in PMMA are 4.0 mm and 9.2 mm, respectively. Specialised
syringe shields made of 5 – 10 mm thick PMMA should always be used. Forceps
176
ICRP Publication 106
should be used for manipulations of syringes and vials where close contact with any
thin-walled vessel containing radiopharmaceutical would otherwise occur. If the
injection or infusion is carried out through tubing, then the length should be mini-
mised, since the local unshielded dose rate may be tens of mSv per minute for admin-
istrations of GBq activities, and PMMA shields should be used for infusion pumps.The wearing of disposable gloves is essential for all procedures involving unsealed
radionuclides. However, for beta emitters it can be critical in avoiding tissue reac-
tions, since the skin dose rate would be 1350 mSv h�1 if a 0.05 ml droplet containing
1 Mbq of 90Y were left on the skin (Delacroix et al., 2002).
(E 40) If adequate protection measures are not in place, the exposure of the fingers
will be high, and doses of many tens and even hundreds of mSv have been reported
from single patient administrations for a number of different 90Y therapies
(Mielcarek and Barth, 2002; Liepe et al., 2005; Rimpler et al., 2007; Rimpler andBarth, 2007). For example, during administration of 90Y for radiosynovectomy
treatment of the knee, doses of 20 to 100 lSv per MBq were received when the
non-dominant hand was used to hold the syringe needle in position for the injection
(Liepe et al., 2005). The use of grasp forceps to hold the needle reduced the dose to
the hands to less than 1 lSv per MBq.
E.8. Radiopharmaceuticals for PET imaging
(E 41) Studies reported to date for preparation of 18F-FDG are limited (Liemann
et al., 2000; Laffont et al., 2001; Cronin, 2002; Guillet et al., 2005; Vanhavere et al.,
2006; Visseaux et al., 2007; Tandon et al., 2007; Husak et al., 2007; Covens et al.,
2007). It is difficult to determine how representative the limited amount of published
data is for PET-radiopharmaceutical preparation in general. Results suggest dose
rates of 100–600 lGy/GBq handled, but shielding of the fingers at these centres
was more limited. Dose rates reported for 99mTc preparation in some of these studieswere substantially greater than those in this report, so the results may not represent
dose levels for techniques that have been optimised.
(E 42) There is more scope for automation of the dispensing process because the
numbers of vials prepared at one time is usually more limited. However, there are
issues of protection in the handling and administration, so some notes on shielding
are included here. Moreover, as 18F-FDG production increases, doses could easily
approach the dose limit if procedures are not optimised. Some of the shorter half-life
radionuclides require the injection of higher activities, and a manual injection of 2.3GBq of 15O for a single scan can give a finger dose approaching 1 mSv (Cronin,
2002).
(E 43) Dispensing technique is important for PET radiopharmaceuticals because
of the higher dose rates and the short ranges of positrons. If the radiopharmaceutical
is drawn up by hand, the inversion and V-techniques, in which the liquid is in the
mouth of the vial, are not recommended (Cronin, 2002). Instead, the 45� table top
technique should be employed, with the vial held in the lead pot or vial shield using
177

ICRP Publication 106
a pair of long-handled forceps, in order to keep both hands out of the main radiation
field.
(E 44) Since the energy of annihilation photons is 511 keV, for which the half value
thickness of lead is 4 mm, thicker shields are required for PET radiopharmaceuticals.
Vial shields should be made typically from 20–35-mm-thick lead or 20–25-mm-thicktungsten, and syringe shields from 15-mm-thick lead and 10–12-mm-thick tungsten,
and should be handled behind a 50–60-mm-thick lead shield to minimise the dose to
the body. Since such vial and syringe shields are too heavy to manipulate safely,
mechanical supports are normally required for both dispensing and injecting PET
radiopharmaceuticals (Towsen, 2003).
(E 45) The possibility of producing bremsstrahlung x rays from positron interac-
tions should be considered. Most of the 0.63-MeV positrons emitted by 18F, which
have ranges of 0.9 mm and 1.7 mm in glass and PMMA, respectively, will be ab-sorbed in the walls of the vial or syringe. However, higher energy positrons emitted
by 11C (0.96 MeV), 13N (1.2 MeV), and 15O (1.7 MeV) have ranges of several milli-
metres, and to absorb these, PMMA or plastic liners may be incorporated within vial
and syringe shields.
(E 46) Bremsstrahlung x rays make up <5% of the energy converted to radiation,
and may therefore not be considered important. However, the liners will increase the
distance of the fingers from the source as well as reducing the number of higher en-
ergy photons which are more difficult to shield against. An alternative to the leadand tungsten shields that has been used is a 10-mm-thick PMMA shield, which ab-
sorbs all the positrons and increases the distance between the syringe and the tech-
nologists’ hands, but the syringe must be placed in a shielded container as soon as
the radiopharmaceutical has been drawn up until it is injected (Cronin, 2002).
(E 47) The subject of finger doses from PET radiopharmaceuticals merits further
systematic study to determine and document the dose levels, most appropriate
administration methods, and recommendations for dosimetry.
E.9. Relative importance of different aspects of protection
(E 48) In summary, the protection benefit derived from the technique used in-
volves a balance between various factors. For example, use of shielding devices or
increasing the distance from the source will reduce the dose rate but may increase
the exposure time, so the impact on the dose to the fingers is more difficult to assess.
The relative importance of different aspects of working techniques, together with theprotection methodologies that they affect and an indication of the likely impact on
dose reduction based on experience gained, are set out in Table E.1. (Martin and
Whitby, 2003).
(E 49) In view the factors already discussed, it is understandable that doses to the
hands recorded and reported in the literature are highly variable. The most appro-
priate quantity to use for making comparisons is the assessed dose at the finger tips
per unit of activity processed during preparation of radiopharmaceuticals. These
data vary between different locations by at least an order of magnitude, and there
178
Table E.1. Protection factors.
Methodology Protection Impact
Whether or not a syringe shield is used S and T High
Shielding employed for the vial S High
Position of the fingers of the hand holding the syringe D and T Medium/high
The speed with which unshielded manipulations are performed T Medium/High
Whether the vial from which the radiopharmaceutical is being
withdrawn is angled with a long needle extending to the base, or
whether the vial is inverted and the needle inserted only 1–2 mm
within the cap
D and T Medium
Size of syringe and length of needle D and T Medium
Whether the radiopharmacy product is a vial containing
radiopharmaceutical for a single patient or several patients, or a
syringe containing the radiopharmaceutical
T Medium
Design of the dispensing cabinet S and T Medium
Ease with which manipulations can be performed within the
dispensing cabinet
D and T Low/medium
Speed with which shielded manipulations are performed T Low
T, time; D, distance; S, shielding; high, >40% reduction; medium, 20–40% reduction; low <20% reduction.
ICRP Publication 106
is also an order of magnitude variation in the workloads in different radiopharma-
cies. Predicting the magnitude of exposure on the basis of a qualitative description
of technology, mean workload, and working practice is an impossible task.
E.10. Exposure monitoring
(E 50) Monitoring of hand exposure for radiopharmacists is highly recommended.
The most appropriate method is dose measurement for pulps of the most exposed
fingers of the dominant hand. However, an individual’s technique should be ob-
served in order to determine whether other fingers are likely to receive higher doses.
If a suitable method can be determined, this should be adopted. Finger stalls, which
incorporate a dosimeter near the tip and can fit over a finger, are available (e.g.
Health Protection Agency, UK) and are suitable for regular monitoring. Thesedosimeters can be worn continuously and so provide the ideal dosimetry technique,
which is recommended for all departments that handle large quantities of radioactiv-
ity in which there is a risk that the dose limit to the finger may be approached.
(E 51) Some workers find that using a dosimeter on the tip of the finger is not
acceptable due to impairment of comfort and dexterity of manipulations. In these
situations, where it is considered that any dose is unlikely to approach the limit,
an alternative solution is to monitor the exposure of the hands at monthly intervals
by a conventional TLD ring, worn at the base of the middle finger, and to estimatethe highest doses (pulps of index, middle and thumb finger) by means of an empirical
ratio.
(E 52) When the dosimeter element in the ring is worn on the palm side, the ratio
between the dose to the finger tip and that to the ring element is between 1.5 and 3.5
179
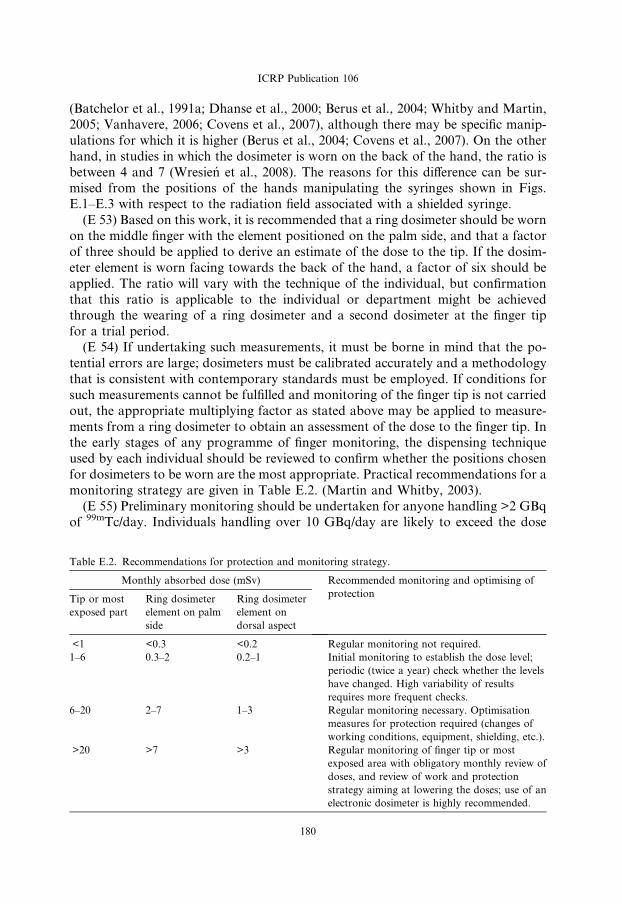
ICRP Publication 106
(Batchelor et al., 1991a; Dhanse et al., 2000; Berus et al., 2004; Whitby and Martin,
2005; Vanhavere, 2006; Covens et al., 2007), although there may be specific manip-
ulations for which it is higher (Berus et al., 2004; Covens et al., 2007). On the other
hand, in studies in which the dosimeter is worn on the back of the hand, the ratio is
between 4 and 7 (Wresien et al., 2008). The reasons for this difference can be sur-mised from the positions of the hands manipulating the syringes shown in Figs.
E.1–E.3 with respect to the radiation field associated with a shielded syringe.
(E 53) Based on this work, it is recommended that a ring dosimeter should be worn
on the middle finger with the element positioned on the palm side, and that a factor
of three should be applied to derive an estimate of the dose to the tip. If the dosim-
eter element is worn facing towards the back of the hand, a factor of six should be
applied. The ratio will vary with the technique of the individual, but confirmation
that this ratio is applicable to the individual or department might be achievedthrough the wearing of a ring dosimeter and a second dosimeter at the finger tip
for a trial period.
(E 54) If undertaking such measurements, it must be borne in mind that the po-
tential errors are large; dosimeters must be calibrated accurately and a methodology
that is consistent with contemporary standards must be employed. If conditions for
such measurements cannot be fulfilled and monitoring of the finger tip is not carried
out, the appropriate multiplying factor as stated above may be applied to measure-
ments from a ring dosimeter to obtain an assessment of the dose to the finger tip. Inthe early stages of any programme of finger monitoring, the dispensing technique
used by each individual should be reviewed to confirm whether the positions chosen
for dosimeters to be worn are the most appropriate. Practical recommendations for a
monitoring strategy are given in Table E.2. (Martin and Whitby, 2003).
(E 55) Preliminary monitoring should be undertaken for anyone handling >2 GBq
of 99mTc/day. Individuals handling over 10 GBq/day are likely to exceed the dose
Table E.2. Recommendations for protection and monitoring strategy.
Monthly absorbed dose (mSv) Recommended monitoring and optimising of
protectionTip or most
exposed part
Ring dosimeter
element on palm
side
Ring dosimeter
element on
dorsal aspect
<1 <0.3 <0.2 Regular monitoring not required.
1–6 0.3–2 0.2–1 Initial monitoring to establish the dose level;
periodic (twice a year) check whether the levels
have changed. High variability of results
requires more frequent checks.
6–20 2–7 1–3 Regular monitoring necessary. Optimisation
measures for protection required (changes of
working conditions, equipment, shielding, etc.).
>20 >7 >3 Regular monitoring of finger tip or most
exposed area with obligatory monthly review of
doses, and review of work and protection
strategy aiming at lowering the doses; use of an
electronic dosimeter is highly recommended.
180
ICRP Publication 106
levels above which it is recommended that regular monitoring is undertaken unless
effective optimisation has been adopted.
(E 56) During therapies involving the administration of radionuclides emitting
high-energy beta-radiation, finger dosimeters should always be worn on the tip or
the most exposed area. It may be appropriate for separate dosimeters to be wornfor single higher dose therapy administrations. A ring dosimeter will not provide
an adequate reflection of the maximum dose, since the dose to the finger tip can
be up to 100 times greater than that to the ring (Liepe et al., 2005), so the use of
a ratio is not appropriate. Rimpler and Barth (2007) have reported a ratio of three
between the finger and ring dosimeter when work was performed at high protection
standards, but found ratios of 30 or 40 when some shields were not used. Therefore,
the dose to the finger tip should always be monitored.
E.11. Summary of recommendations
(E 57) Finger doses for staff in larger radiopharmacies may approach or exceed
dose limits. A number of conclusions and recommendations can be drawn up based
on the studies that have been undertaken:
� The dispensing protocol and the use of shielding devices in any radiopharmacy
should be assessed carefully to optimise the strategy.
� Shielding of the syringe is the most important factor affecting finger dose, and syr-
inge shields should be used as much as possible.
� Vials from which radioactive liquid is withdrawn should always be shielded.
� The choice of manipulation technique only has a minor influence on finger dose;the most important factor is that staff are able to use the technique effectively.
� All staff should undergo a period of intense training in which they practice manip-
ulations using non-radioactive liquid prior to undertaking any dispensing of
radioactive liquid.
� Careful positioning of materials within the dispensing cabinet is important for
streamlining the procedure and minimising doses to the hands.
� The most exposed parts of the hands are likely to be the tips of the index and mid-
dle fingers, and the thumb of the dominant hand, with exposure for the index fin-ger being highest.
� Preliminary finger dose monitoring should be undertaken for any person handling
>2 GBq/day, and regular monitoring should be carried out if doses to the most
exposed part of the hand exceed 6 mSv/month.
� The finger tip or most exposed part of the hand should be monitored wherever
possible, particularly if the dose is likely to approach a dose limit.
� If it is not possible to monitor the dose to the most exposed finger tip, an empirical
multiplying factor may be applied to doses recorded by ring dosimeters worn onthe middle finger of the dominant hand to estimate this dose. Factors of three or
six should be used for the dosimeter element on the palm or back of the hand,
respectively.
181

ICRP Publication 106
� The dispensing technique should be reviewed to confirm that the positions where
dosimeters are worn are the most appropriate.
� For injections, prior venous cannulation allows the injection to proceed more rap-
idly; if the syringe is shielded, the dose to the hand of the nurse or physician will
be kept to a minimum.� Significant doses can be received from a single administration of a therapy involv-
ing a high-energy beta-particle emitter, and the following precautions are
recommended:
� Administrations of beta-emitting therapy radiopharmaceuticals should be care-
fully planned.
� 5–10 mm thick PMMA syringe shields should always be used for administration
of 90Y or similar high-energy beta-emitting therapy radionuclides.
� Close contact with any thin-walled vessel containing therapeutic levels of 90Yshould be avoided through the use of forceps or PMMA shielding.
� Doses to the most exposed finger tips should be monitored directly for each ses-
sion in which 90Y or similar high-energy beta-emitting therapy radionuclides are
administered.
REFERENCES
Anderson, D.W., Richter, C.W., Ficken, V.J., et al., 1972. Use of thermoluminescent dosimeters for
measurement of dose to the hands of nuclear medicine technicians. J. Nucl. Med. 13, 627–629.
ARSAC, 2006. Notes for guidance on the clinical administration of radiopharmaceuticals and use of
sealed radioactive sources. Administration of Radioactive Substances Advisory Committee. Health
Protection Agency, Chilton, UK.
Aubert, B., Guilabert, N., Lamon, A., et al., 2002. Which protection against radiation for new protocols of
internal radiotherapy by yttrium-90? Sixth European ALARA Network Workshop in Occupational
Exposure Optimization in Medical Field and Radiophamaceutical Industry, pp. 44–49 (http://www.
eu-alara.net/images/stories/pdf/program6/Session%20B/B_Aubert.pdf).
Batchelor, S., Baldock, C., Webber, D., 1991a. Radiation dose to the hands of a radiopharmacist. J. Hosp.
Pharm. 247 (Suppl.), 38–39.
Batchelor, S., Penfold, A., Huggins, R., 1991b. Radiation dose to the hands in nuclear medicine. Nucl.
Med. Commun. 12, 439–444.
Berus, D., Covens, P., Buls, N., et al., 2004. Extremity doses of workers in nuclear medicine: Mapping
hand doses in function of manipulation. Proceedings of the 11th International Congress of the IRPA,
Madrid, Spain, 2004; 5f8 (http://irpa11.irpa.net/papers/papers.php).
Bjurman, B., Ahlgren, B., Mattsson, S., et al, 1982. Radiation dose to staff handling 99mTc in hospitals.
III International Symposium, Radiological Protection Advances in Theory and Practice, Inverness 6–
11 June 1982. Proceedings, Vol. 2, pp. 588–593.
Chiesa, C., de Sanctis, V., Crippa, F., et al., 1997. Radiation dose to technicians per nuclear medicine
procedure: comparison between technetium–99m, gallium-67 and iodine-131 radiotracers and fluorine-
18 fluorodeoxyglucose. Eur. J. Nucl. Med. 24, 1380–1389.
Clarke, E.A., Brisco, S.L., 1986. Dispensing, injecting or imaging? A question of radiation doses. Nucl.
Med. Commun. 7, 319.
Covens, P., Berus, D., Buls, N., et al., 2007. Personal dose monitoring in hospitals: Global assessment,
critical applications and future needs. Rad. Prot. Dosim. 124, 250–259.
Cremonesi, M., Ferrari, M., Paganelli, G., et al., 2006. Radiation protection in radionuclide therapies
with 90Y-conjugates: risks and safety. Eur. J. Nuc. Med. Mol. Im. 33, 1321–1327.
182
ICRP Publication 106
Cronin, B.F., 2002. The technologist’s perspective. In: Valk, P.E., Bailey, D.L., Townsend, D.W., et al.
(Eds.), Positron Emission Tomography; Basic Science and Clinical Practice. Springer-Verlag, London,
pp. 777–791.
Delacroix, D., Guerre, J.P., Leblanc, P., et al., 2002. Radionuclide and radiation protection data
handbook. Rad. Prot. Dosim. 98, 1–168.
Dhanse, S., Martin, C.J., Hilditch, T.E., et al., 2000. A study of doses to the hands during dispensing of
radiopharmaceuticals. Nucl. Med. Commun. 21, 511–519.
Donadille, L., Bouachri, A.El., Lahaye, T., et al., 2005. Feasibility study of an activity extremity
dosimetry prototype. Radiat. Prot. Dosim. 115, 548–552.
Gemmell, H.G., Staff, R.T., 1998. Single-photon emission-computed tomography (SPECT). In: Sharp,
P.F., Gemmell, H.G., Smith, F.W. (Eds.), Practical nuclear medicine, 2nd ed. Oxford University Press,
Oxford, UK, pp. 13–24.
Guillet, B., Quentin, P., Waultier, S., et al., 2005. Technologist radiation exposure in routine clinical
practice with 18F FDG PET. J. Nucl. Med. Technol. 33, 175–179.
Guy, M.J., Greaves, C.D., Morton, R.J., et al., 2005. Development of a combined audiovisual and
extremity dose monitoring software tool for use in nuclear medicine. Nucl. Med. Comm. 26, 1147–
1153.
Harding, L.K., Hesslewood, S., Ghose, S.K., et al., 1985. The value of syringe shields in a nuclear
medicine department. Nucl. Med. Commun. 6, 449–454.
Harding, L.K., Mostafa, A.B., Thomson, W.H., 1990. Staff radiation doses associated with medicine
procedures – a review of some recent measurements. Nucl. Med. Commun. 11, 272–277.
Hastings, D.L., Hillel, P.G., Jeans, S.P., et al., 1997. An assessment of finger doses received by staff while
preparing and injecting radiopharmaceuticals. Nucl. Med. Commun. 18, 785–790.
Husak, V., Ptacek, J., Drymlova, J., et al., 2007. Radiation dose to the hands of nuclear medicine staff
preparing radiopharmaceuticals with gamma emitters including positron radionuclide 18F. Ceska
Radiologie 61, 80–84.
ICRP, 1977. Recommendations of the International Commission on Radiological Protection. ICRP
Publication 26. Ann. ICRP 1(3).
ICRP, 1991a. 1990 Recommendations of the International Commission on Radiological Protection. ICRP
Publication 60. Ann. ICRP 21(1–3).
ICRP, 2007. The 2007 Recommendations of the International Commission on Radiological Protection.
ICRP Publication 103. Ann. ICRP 37 (2–4).
Jankowski, J., Olszewski, J., Kluska, K., 2003. Distribution of equivalent doses to skin of the hands of
nuclear medicine personnel. Radiat. Prot. Dosim. 106, 177–180.
Koback, R., Plato, P., 1985. Influence of dosemeter positioning on reported doses to the upper extremities.
Radiat. Prot. Dosim. 11, 257–262.
Laffont, S., Deuvillers, A., Garin, E., et al., 2001. Radiation protection and radiation dose to technicians
and patient during PET study (18FDG). Medecine Nucleaire 25, 395–400.
Liemann, H., Will, E., Beuthien-Baumann, B., 2000. Investigations of radiation exposure of the medical
personnel during F-18 FDG PRT studies. Nuklear Medizin 39, 77–81, [in German].
Liepe, K., Andreeff, M., Wunderlich, G., et al., 2005. Radiation protection in radiosynovectomy of the
knee. Health Phys. 89, 151–154.
Mackenzie, A., 1997. Reduction of extremity dose in the radiopharmacy. Nucl. Med. Commun. 18, 578–
581.
Martin, C.J., Whitby, M., 2003. Application of ALARP to extremity doses for hospital workers. J. Radiol.
Prot. 23, 405–421.
Mielccarek, J., Barth, I., 2002. Occupational beta radiation exposure during radiosynoviorthesis. Sixth
European ALARA Network Workshop in Occupational Exposure Optimization in Medical Field and
Radiophamaceutical Industry, pp. 43–46 (http://www.eu-alara.net/images/stories/pdf/program6/Ses-
sion%20B/I_Barth.pdf).
Montgomery, A., Martin, C.J., Anstee, D., et al., 1997. Application of a gamma extremity monitoring
system in a radiopharmaceutical dispensary. Nucl. Med. Commun. 18, 673–679.
183
ICRP Publication 106
Montgomery, A., Anstee, D.E., Martin, C.J., et al., 1999. Reduction in finger dose for radiopharma-
ceutical dispensing afforded by a syringe shield and an automatic dose dispenser. Nucl. Med. Commun.
20, 189–194.
Neil, C.M., 1969. The question of radiation exposure to the hand from handling 99mTc. J. Nucl. Med. 10,
732–734.
Paul, G.S., Sharma, S.K., Rath, G.K., 2006. Finger doses for staff handling radiopharmaceuticals in
nuclear medicine. J. Nucl. Med. Technol. 34, 169–173.
Rimpler, A., Barth, I., Senftleben, S., et al., 2007. Beta radiation exposure of staff during therapies with Y-
90 labeled substances. Beta-Days in Capri (Italy), 20–22 Sept. 2007 (http://www.uznuclear.rug.ac.be/
betadayscapri/).
Rimpler, A., Barth, I., 2007. Beta radiation exposure of medical staff and implications for extremity dose
monitoring. Rad. Prot. Dosim. 125, 335–339.
Shleien, B., Slaback Jr., L.A.S., Birky, B.K., 1998. Handbook of Health Physics and Radiological Health.
Williams and Wilkins, Baltimore, MD.
Stuardo, E., 1990. Hand dose levels in Chilean nuclear medicine laboratories. Radiat. Prot. Dosim. 34,
127–130.
Tandon, P., Venkatesh, M., Bhatt, B.C., 2007. Extremity dosimetry for radiation workers handling
unsealed radionuclides in nuclear medicine departments in India. Health Phys. 92, 112–118.
Towsen, J.E.C., 2002. Radiation dosimetry and protection in PET. In: Valk, P.E., Bailey, D.L.,
Townsend, D.W., et al. (Eds.), Positron Emission Tomography; Basic Science and Clinical Practice.
Springer-Verlag, London, pp. 265–279.
Vanhavere, F., Berus, D., Buls, N., et al., 2006. Use of extremity dose meters in a hospital environment.
Radiat. Prot. Dosim. 118, 190–195.
Visseaux, H., Vuillez, J.P., Giraud, J.Y., 2007. Dosimetric study and radioprotection optimization in 18F-
FDG scintigraphy. Medecine Nucleaire 28, 205–217.
Whitby, M., Martin, C.J., 2002. Options for shielding the hand during dispensing and administration of
radiopharmaceuticals. Sixth European ALARA Network Workshop in Occupational Exposure
Optimization in Medical Field and Radiopharmaceutical Industry, pp. 167–170 (http://www.eu-alara.
net/images/stories/pdf/program6/Session%20C/M_Whithy.pdf).
Whitby, M., Martin, C.J., 2003. Investigation using an advanced extremity gamma instrumentation
system of options for shielding the hand during the preparation and injection of radiopharmaceuticals.
J. Radiol. Prot. 23, 79–96.
Whitby, M., Martin, C.J., 2005. A multi-centre study of dispensing methods and hand doses in hospital
radiopharmacies. Nucl. Med. Commun. 26, 49–60.
Williams, E.D., Laird, E.E., Forster, E., 1987. Monitoring radiation dose to the hands in nuclear medicine:
location of dosemeters. Nucl. Med. Commun. 8, 449–503.
Wrzesien, M., Olszewski, J., Jankowski, J., 2008. Hand exposure to ionising radiation of nuclear medicine
workers. Rad. Prot. Dosim. 130, 325–330.
Zhu, X., 2004. Radiation safety considerations with yttrium-90 ibritumomab tiuxetan (Zevalin). Semin.
Nucl. Med. 34, 20–23.
184
FULL BIBLIOGRAPHY
Ahlgren, L., Ivarsson, S., Johansson, L., Mattsson, S., Nosslin, B., 1985. Excretion of radionuclides
in human breast milk after the administration of radiopharmaceuticals. J. Nucl. Med. 26, 1085–
1090.
Anderson, D.W., Richter, C.W., Ficken, V.J., et al., 1972. Use of thermoluminescent dosimeters for
measurement of dose to the hands of nuclear medicine technicians. J. Nucl. Med. 13, 627–629.
Armbrecht, J.J., Burton, D.B., Schelbert, H.R., 1990. Validation of [1-11C]acetate as a tracer for non-
invasive assessment of oxidative metabolism with positron emission tomography in normal, ischemic,
postischemic and hyperaemic canine myocardium. Circulation 81, 1594–1605.
ARSAC, 2006. Notes for Guidance on the Clinical Administration of Radiopharmaceuticals and Use of
Sealed Radioactive Sources. Administration of Radioactive Substances Advisory Committee, Health
Protection Agency, Chilton, UK.
Atkins, H.L., Christman, D.R., Fowler, J.S., et al., 1972. Organic radiopharmaceuticals labeled with
isotopes of short half-life. V. 18F-Labeled 5- and 6-Fluorotryptophan. J. Nucl. Med. 13, 713–719.
Atkins, H.L., Cloutier, R.J., Lathrop, K.A., et al., 1975. Technetium-99m-sulfur colloid in various liver
conditions. MIRD Dose Estimate Report No. 3. J. Nucl. Med. 16, 108A–108B.
Atkins, H.L., Budinger, T.F., Lebowitz, E., et al., 1977. Thallium-201 for medical use. Part 3: Human
distribution and physical imaging properties. J. Nucl. Med. 18, 133–140.
Aubert, B., Guilabert, N., Lamon, A., et al., 2002. What protection against radiation for new protocols of
internal radiotherapy by yttrium-90? Sixth European ALARA Network Workshop in Occupational
Exposure Optimization in Medical Field and Radiophamaceutical Industry, pp. 44–49 (http://www.
eu-alara.net/images/stories/pdf/program6/Session%20B/B_Aubert.pdf).
Bajc, M., Palmer, J., Ohlsson, T., et al., 1994. Distribution and dosimetry of 111In DTPA-D-phe-
octreotide in man assessed by whole body scintigraphy. Acta Radiol. 35, 53–57.
Barthel, H., Wiener, M., Dannenberg, C., Bettin, S., Sattler, B., Knapp, W.H., 1997. Age-specific cerebral
perfusion in 4- to 15-year-old children: a high-resolution brain SPET study using 99mTc-ECD. Eur. J.
Nucl. Med. 24, 1245–1252.
Bartlett, R.D., Lathrop, K.A., Faulhaber, P.F., Harper, P.V., 1984. Transfer of thallous ion to and from
gastrointestinal sections. J. Nucl. Med. 25, P92.
Batchelor, S., Baldock, C., Webber, D., 1991a. Radiation dose to the hands of a radiopharmacist. J. Hosp.
Pharm. 247 (Suppl.), 38–39.
Batchelor, S., Penfold, A., Huggins, R., 1991b. Radiation dose to the hands in nuclear medicine. Nucl.
Med. Commun. 12, 439–444.
Berg, G., Nystrom, E., Jacobsson, L., et al., 1998. Radioiodine treatment of hyperthyroidism in a
pregnant woman. J. Nucl. Med. 39, 357–361.
Bergmann, R., Brust, P., Kampf, G., Coenen, H.H., Stocklin, G., 1995. Evaluation of radioselenium
labeled selenomethionine, a potential tracer for brain protein synthesis by PET. Nucl. Med. Biol. 22,
475–481.
Berman, M., 1977. Kinetic Models for Absorbed Dose Calculation. Medical Internal Radiation
Committee (MIRD) Pamphlet No. 12. Society of Nuclear Medicine, New York, NY.
Berridge, M.S., Adler, L.P., Rao, P.S., 1991. Radiation absorbed dose for O-15-butanol and O-15 water
estimated by positron emission tomography. J. Nucl. Med. 32, 1043.
Berus, D., Covens, P., Buls, N., et al., 2004. Extremity doses of workers in nuclear medicine: mapping
hand doses in function of manipulation. Proceedings of the 11th International Congress of the IRPA,
Madrid, 2004; 5f8 (http://irpa11.irpa.net/papers/papers.php).
Bingham, D., Gardin, I., Hoyes, K.P., 2000. The problem of Auger emitters for radiological protection.
Radiat. Prot. Dosim. 92, 219–228.
Bischof Delaloye, A., Delaloye, B., 1995. Radiolabelled monoclonal antibodies in tumour imaging and
therapy: out of fashion? Eur. J. Nucl. Med. 22, 571–580.
Bjurman, B., Ahlgren, B., Mattsson, S., et al, 1982. Radiation dose to staff handling 99mTc in hospitals.
III International Symposium, Radiological Protection Advances in Theory and Practice, Inverness
6–11 June 1982. Proceedings, Vol. 2, pp. 588–593.
185
ICRP Publication 106
Booij, J., Sokole, E.B., Stabin, M.G., Janssen, A.G.M., de Bruin, K., van Royen, E.A., 1998. Human
biodistribution and dosimetry of [123I]FP-CIT: a potent radioligand for imaging of dopamine
transporters. Eur. J. Nucl. Med. 25, 24–30.
Booij, J., Sokole, E.B., Stabin, M.G., Janssen, A.G.M., de Bruin, K., van Royen, E.A., 1998. Human
biodistribution and dosimetry of [123I]FP-CIT: a potent radioligand for imaging of dopamine
transporters: erratum. Eur. J. Nucl. Med. 25, 458.
Bouchet, L.G., Bolch, W.E., Weber, D.A., Atkins, H.L., Poston Sr., J.W., 1999. Radionuclide S-values in
a revised dosimetric model of the adult head and brain. MIRD Pamphlet No. 15. J. Nucl. Med. 40,
62S–101S.
Bouchet, L.G., Bolch, W.E., Howell, R.W., Rao, D.V., 2000. S values for radionuclides localized within
the skeleton. J. Nucl. Med. 41, 189–212.
Boundy, K.L., Barnden, L.R., Rowe, C.C., et al., 1995. Human dosimetry and biodistribution of iodine-
123-iododexetimide: a SPECT imaging agent for cholinergic muscarinic neuroreceptors. J. Nucl. Med.
36, 1332–1338.
Boyes, R.E., Cumming, P., Martin, W.R.W., McGeer, E.G., 1986. Determination of plasma [18F]-6-
fluorodopa during positron emission tomography; elimination and metabolism in carbidopa treated
subjects. Life Sci. 39, 2243–2252.
Brihaye, C., Depresseux, J.C., Comar, D., 1995. Radiation dosimetry for bolus administration of oxygen-
15 water. J. Nucl. Med. 36, 651–656.
Britton, K.E., Granowska, M., 1987. Radioimmunoscintigraphy in tumour identification. Cancer Surv. 6,
247–267.
Bronskill, M.J., 1983. Radiation dose estimates for interstitial radiocolloid lymphoscintigraphy. Semin.
Nucl. Med. 13(1), 20–25.
Brown, P.H., Krishnamurthy, G.T., Bobba, V.R., Kingston, E., 1981. Radiation-dose calculation for Tc-
99m HIDA in health and disease. J. Nucl. Med. 22, 177–183.
Brown, P.H., Krishnamurthy, G.T., Bobba, V.R., Kingston, E., Turner, F.E., 1982. Radiation-dose
calculation for five Tc-99m IDA hepatobiliary agents. J. Nucl. Med. 23, 1025–1030.
Brown, W.D., Oakes, T.R., DeJesus, O.T., et al., 1998. Fluorine-18-fluoro-L-DOPA dosimetry with
carbidopa pretreatment. J. Nucl. Med. 39, 1884–1891.
Burns, H.D., Dannals, R.F., Langstrom, B., et al., 1984. 3-N-[11C]methylspiperone, a ligand binding to
dopamine receptors: radiochemical synthesis and biodistribution studies in mice. J. Nucl. Med. 25,
1222–1227.
Casteels, M., Foulon, V., Mannaerts, G.P., van Veldhoven, P., 2003. Alpha-oxidation of 3-methyl-
substituted fatty acids and its thiamine dependence. Eur. J. Biochem. 270, 1619–1627.
Castronovo Jr., F.P., Stone, H., Ulanski, J., 2000. Radioactivity in breast milk following 111In-octreotide.
Nucl. Med. Commun. 21, 695–699.
Caveliers, V., Franken, P.R., Florian, F.L., Lou, H., Knapp Jr., F.F., 1998. Intra-individual comparison
of 3(R)-BMIPP and 3(S)-BMIPP isomers in humans. J. Nucl. Med. 39, 1672–1675.
Chen, C.T., Lathrop, K.A., Harper, P.V., et al., 1983. Quantitative measurement of long term in vivo
thallium distribution in the human. J. Nucl. Med. 24, P50.
Chiesa, C., de Sanctis, V., Crippa, F., et al., 1997. Radiation dose to technicians per nuclear medicine
procedure: comparison between technetium–99m, gallium-67 and iodine-131 radiotracers and fluorine-
18 fluorodeoxyglucose. Eur. J. Nucl. Med. 24, 1380–1389.
Claessens, R.A.M.J., Koenders, E.B., Boerman, O.C., et al., 1995. Dissociation of indium from indium-
111-labelled diethylene triamine penta-acetic acid conjugated non-specific polyclonal human immu-
noglobulin G in inflammatory foci. Eur. J. Nucl. Med. 22, 212–219.
Clarke, E.A., Brisco, S.L., 1986. Dispensing, injecting or imaging? A question of radiation doses. Nucl.
Med. Commun. 7, 319.
Cloutier, R.J., Watson, E.E., Rohrer, R.H., Smith, E.M., 1973. Calculating the radiation dose to an organ.
J. Nucl. Med. 14, 53–55.
Cloutier, R.J., Freeman, L.M., McAfee, J.G., et al., 1975. Summary of current radiation dose estimates to
humans with various liver conditions from 198Au colloidal gold. MIRD Dose Estimate Report No. 4. J.
Nucl. Med. 16, 173–174.
186

ICRP Publication 106
Coenen, H.H., Kling, P., Stocklin, G., 1989. Cerebral metabolism of l-[2-18F]fluorotyrosine, a new PET
tracer of protein synthesis. J. Nucl. Med. 30, 1367–1372.
Coffey, J.L., Watson, E.E., 1979. Calculating doses from remaining body activity. A comparison of two
methods. Med. Phys. 6, 307–308.
Comar, D., Catron, J.C., Maziere, M., Marazanop, C., 1976. Labelling and metabolism of methionine-
methyl-11C. Eur. J. Nucl. Med. 1, 11–14.
Cottrall, M.F., Taylor, D.M., McElwain, T.J., 1973. Investigations of 18F-p-fluorophenylalanine for
pancreas scanning. Br. J. Radiol. 46, 277–288.
Covens, P., Berus, D., Buls, N., et al., 2007. Personal dose monitoring in hospitals: Global assessment,
critical applications and future needs. Rad. Prot. Dosim. 124, 250–259.
Cremonesi, M., Ferrari, M., Paganelli, G., et al., 2006. Radiation protection in radionuclide therapies with90Y-conjugates: risks and safety. Eur. J. Nuc. Med. Mol. Im. 33, 1321–1327.
Cronin, B.F., 2002. The technologist’s perspective, in Valk, P.E., Bailey, D.L., Townsend, D.W., et al.
(Eds.), Positron Emission Tomography; Basic Science and Clinical Practice. Springer-Verlag, London,
pp. 777–791.
Cristy, M., Eckerman, K., 1987. Specific Absorbed Fractions of Energy at Various Ages from Internal
Photon Sources. Oak Ridge National Laboratory, Oak Ridge, TN.
De Geeter, F., Caveliers, V., Pansar, I., Bossuyt, A., Franken, P.R., 1998. Effect of oral glucose loading on
the biodistribution of BMIPP in normal volunteers. J. Nucl. Med. 39, 1850–1856.
Delacroix, D., Guerre, J.P., Leblanc, P., et al., 2002. Radionuclide and Radiation Protection Data
Handbook. Rad. Prot. Dosim. 98(1). Nuclear Technology Publishing, Ashford.
Deloar, H.M., Fujiwara, T., Shidahara, M., et al., 1998a. Estimation of absorbed dose for 2-[F-18]fluoro-
2-deoxy-D-glucose using whole-body positron emission tomography and magnetic resonance imaging.
Eur. J. Nucl. Med. 25, 565–574.
Deloar, H.M., Fujiwara, T., Nakamura, T., et al., 1998. Estimation of internal absorbed dose of
l-[methyl-11C]-methionine using whole body positron emission tomography. Eur. J. Nucl. Med. 25,
629–633.
Deterding, T.A., Votaw, J.R., Wang, C.K., et al., 2001. Biodistribution and radiation dosimetry of the
dopamine transporter ligand [18F]FECNT. J. Nucl. Med. 42, 376–381.
Dhanse, S., Martin, C.J., Hilditch, T.E., et al., 2000. A study of doses to the hands during dispensing of
radiopharmaceuticals. Nucl. Med. Commun. 21, 511–519.
Dhawan, V., Belakhlef, A., Robeson, W., et al., 1996. Bladder wall radiation dose in humans from
fluorine-18-FDOPA. J. Nucl. Med. 37, 1850–1852.
Donadille, L., Bouachri, A.El., Lahaye, T., et al., 2005. Feasibility study of an activity extremity
dosimetry prototype. Radiat. Prot. Dosim. 115, 548–552.
Dudczak, R., Schmoliner, R., Angelberger, P., Knapp, F.F., Goodman, M.M., 1986. Structurally
modified fatty acids: clinical potential as tracers of metabolism. Eur. J. Nucl. Med. 12, S45–
S48.
Eckerman, K.F., Stabin, M.G., 2000. Electron absorbed fractions and dose conversion factors for marrow
and bone by skeletal region. Health Phys. 78, 199–214.
Eichling, J.O., Bergman, S.R., Schwarz, S.W., et al., 1997. Equivalent dose estimates in adults for
intravenously administered O-15 water. Unpublished; personal communication through S. Schwarz.
Evans, J.L., Mountford, P.J., Herring, A.N., Richardson, M.A., 1993. Secretion of radioactivity in breast
milk following administration of 99Tcm-MAG3. Nucl. Med. Commun. 14, 108–111.
Eshima, D., Fauconnier, T., Eshima, L., et al., 2000. Radiopharmaceuticals for lymphoscintigraphy;
including dosimetry and radiation considerations. Semin. Nucl. Med. 30(1) 25–32.
Farde, L., Hall, H., Ehrin, E., Sedvall, G., 1986. Quantitative analysis of D2 dopamine receptor binding in
the living human brain. Science 231, 258–261.
Farde, L., Suhara, T., Nyberg, S., et al., 1997. A PET study of [11C]FLB 457 binding to extrastriatal D2-
dopamine receptors in healthy subjects and antipsychotic drug-treated patients. Psychopharmacology
133, 394–404.
Feinendegen, L.E., Neumann, R.D., 2004. Dosimetry and risk from low- versus high-LET radiation of
Auger events and the role of nuclide carriers. Int. J. Radiat. Biol. 80, 813–822.
187
ICRP Publication 106
Fishman, A.J., Khaw, B.A., Strauss, H.N., 1989. Quo vadis radioimmune imaging. J. Nucl. Med. 20,
1911–1915.
Forssell Aronsson, E., Fjalling, M., Nilsson, O., et al., 1995. Indium-111 activity concentration in tissue
samples after intravenous injection of indium-111-DTPA-D-Phe-1-octreotide. J. Nucl. Med. 36, 7–12.
Forssell Aronsson, E., Lanhede, B., Fjalling, M., et al., 1996. Pharmacokinetics and dosimetry of 111In-
DTPA-D-Phe-1-octreotide in patients with neuroendocrine tumours, in: Schlafke-Stelson, AT., Stabin,
M.G., Sparks, R.B. (Eds.), Proceedings of the Sixth International Radiopharmaceutical Dosimetry
Symposium. Oak Ridge Associated Universities, Oak Ridge, TN, pp. 643–655.
Freeman, M.R., Kanwar, N., Armstrong, P.W., 1986. The variability of thallium half life at rest as
compared to exercise. J. Nucl. Med. 27, 997.
Frost, J.J., Mayberg, H.S., Sadzot, B., et al., 1990. Comparison of [11C]diprenorphine and [11C]carfentanil
binding to opiate receptors in humans by positron emission tomography. J. Cereb. Blood Flow Metab.
10, 484–492.
Gardin, I., Faraggi, M., Le Guludec, D., Bok, B., 1999. Cell irradiation caused by diagnostic nuclear
medicine procedures: dose heterogeneity and biological consequences. Eur. J. Nucl. Med. 26, 1617–
1626.
Gelfand, M.J., Thomas, S.R., Kereiakes, J.G., 1983. Absorbed radiation dose from routine imaging of the
skeleton in children. Ann. Radiol. 26, 421–423.
Gemmell, H.G., Staff, R.T. 1998. Single-photon emission-computed tomography (SPECT) In: Practical
Nuclear Medicine 2nd Edition, ed. P.F. Sharp, H.G. Gemmell, F.W. Smith, Oxford University press,
Oxford, pp 13–24.
Gerson, M.C., Lukes, J., Deutsch, E., et al., 1994. Comparison of technetium 99m Q12 and thallium 201
for detection of angiographically documented coronary artery disease in humans. J. Nucl. Cardiol. 1,
499–508.
Goddu, S.M., Howell, R.W., Rao, D.V., 1994. Cellular dosimetry: absorbed fractions for monoenergetic
electron and alpha particle sources and S-values for radionuclides uniformly distributed in different cell
compartments. J. Nucl. Med. 35, 303–316.
Goddu, S.M., Howell, R.W., Bouchet, L.G., Bolch, W.E., Rao, D., 1997. MIRD Cellular S Values.
Society of Nuclear Medicine, Inc, Reston, VA.
Gossner, W., Masse, R., Stather, J.W., 2000. Cells at risk for dosimetric modelling relevant to bone
tumour induction. Radiat. Prot. Dosim. 92, 209–213.
Groshar, D., Slobodin, G., Zuckerman, E., 2002. Quantitation of liver and spleen uptake of 99mTc-
phytate colloid using SPECT: detection of liver cirrhosis. J. Nucl. Med. 43, 312–317.
Grunder, G., Siessmeier, T., Lange-Asschenfeldt, C., et al., 2001. [18F]Fluoroethylflumaazenil: a novel
tracer for PET imaging of human benzodiazepine receptors. Eur. J. Nucl. Med. 28, 1463–1470.
Grunder, G., Siessmeier, T., Piel, M., et al., 2003. Quantification of D2-like dopamine receptors in the
human brain with [18F]-desmethoxyfallypride. J. Nucl. Med. 44, 109–116.
Guillet, B., Quentin, P., Waultier, S., et al., 2005. Technologist radiation exposure in routine clinical
practice with 18F FDG PET. J. Nucl. Med. Technol. 33, 175–179.
Gunnarsson, M., Stenstrom, K., Leide-Svegborn, S., et al., 2003. Biokinetics and radiation dosimetry for
patients undergoing a glycerol tri[1-14C]oleate fat malabsorption breath test. Appl. Radiat. Isot. 58,
517–526.
Gupta, S.M., Herrera, N., Spencer, R.P., et al., 1981. Testicular-scrotal content of 201Tl and 67Ga after
intravenous administration. Int. J. Nucl. Med. Biol. 8, 211–213.
Guy, M.J., Greaves, C.D., Morton, R.J., et al., 2005. Development of a combined audiovisual and
extremity dose monitoring software tool for use in nuclear medicine. Nucl. Med. Comm. 26, 1147–
1153.
Harding, L.K., Hesslewood, S., Ghose, S.K., et al., 1985. The value of syringe shields in a nuclear
medicine department. Nucl. Med. Commun. 6, 449–454.
Harding, L.K., Mostafa, A.B., Thomson, W.H., 1990. Staff radiation doses associated with medicine
procedures – a review of some recent measurements. Nucl. Med. Commun. 11, 272–277.
Harvey, J., Firnau, G., Garnett, E.S., 1985. Estimation of the radiation dose in man due to 6-[18F]fluoro-
L-dopa. J. Nucl. Med. 26, 931–935.
188

ICRP Publication 106
Hastings, D.L., Hillel, P.G., Jeans, S.P., et al., 1997. Assessment of finger doses received by staff while
preparing and injecting radiopharmaceuticals. Nucl. Med. Commun. 18, 785–790.
Hays, M.T., Segall, G.M., 1999. A mathematical model for the distribution of fluorodeoxyglucose in
humans. J. Nucl. Med. 40, 1358–1366.
Hays, M.T., Watson, E.E., Thomas, S.R., Stabin, M., 2002. Radiation absorbed dose estimates from 18F-
FDG. MIRD Dose Estimate Report No. 19. J. Nucl. Med. 43, 210–214.
Heiss, W.D., Wienhard, K., Wagner, R., et al., 1996. F-DOPA as an amino acid tracer to detect brain
tumors. J Nucl. Med. 37, 1180–1182.
Herscovitch, P., Carson, R.E., Stabin, M., et al., 1993. A new kinetic approach to estimate the radiation
dosimetry of flow-based radiotracers. J. Nucl. Med. 34, 155P.
Herscovitch, P., Schmall, B., Doudet, D., Carson, R., Eckelman, W., 1997. Biodistribution and radiation
dose estimates for [11-C]raclopride (abstract). J. Nucl. Med. 5 (Suppl.), 224.
Herzog, H., Spohr, G., Notohamiprodjo, G., Feinendegen, L.E., 1987. Absolute quantification of
pharmacokinetic distribution of RES colloids in individuals with normal liver function. Nucl. Med.
Commun. 8, 157–175.
Higley, B., Smith, F.W., Smith, T., et al., 1993. Technetium-99m-1,2-bis[bis(2-ethoxyethyl) phos-
phino]ethane: human biodistribution, dosimetry and safety of a new myocardial perfusion imaging
agent. J. Nucl. Med. 34, 30–38.
Hofer, K.G., 1996. Biophysical aspects of Auger processes. A review. Acta Oncol. 35, 789–796.
van den Hoff, J., Burchert, W., Wolpers, H.G., Meyer, G.J., Hundeshagen, H., 1996. A kinetic model for
cardiac PET with [1-11C]acetate. J. Nucl. Med. 37, 521–529.
Hoffman, J.M., Melega, W.P., Hawk, T.C., et al., 1992. The effects of carbidopa administration
of 6-[18F]fluoro-L-DOPA kinetics in positron emission tomography. J. Nucl. Med. 33, 1472–
1477.
Holman, B.L., Hellman, R.S., Goldsmith, S.J., et al., 1989. Biodistribution, dosimetry and clinical
evaluation of technetium-99m ethyl cysteinate dimer in normal subjects and in patients with chronic
cerebral infarction. J. Nucl. Med. 30, 1018–1024.
Hosain, P., Hosain, F., 1981. Revision of gonadal radiation dose to man from thallium-201, in:
Proceedings of the Third International Radiopharmaceutical Dosimetry Symposium, Oak Ridge 1980
(FDA 81-8166) Oak Ridge National Laboratories, Oak Ridge, TN, pp. 333–345.
Houle, S., DaSilva, J.N., Wilson, A.A., 2000a. Imaging the 5-HT1A receptors with PET: WAY-100635 and
analogues. Nucl. Med. Biol. 27, 463–466.
Houle, S., Ginovart, N., Hussey, D., Meyer, J.H., Wilson, A.A., 2000b. Imaging the serotonin transporter
system with positron emission tomography: initial human studies with [11C]DAPP and [11C]DASB.
Eur. J. Nucl. Med. 27, 1719–1722.
Husak, V., Ptacek, J., Drymlova, J., et al., 2007. Radiation dose to the hands of nuclear medicine staff
preparing radiopharmaceuticals with gamma emitters including positron radionuclide 18F. Ceska
Radiologie 61, 80–84.
IAEA, 2006. Quality Assurance for Radioactivity Measurement in Nuclear Medicine. Technical Report
Series No. 454. International Atomic Energy Agency, Vienna.
Inoue, T., Tomiyoshi, K., Higuichi, T., et al., 1996. Biodistribution studies on l-3-[fluorine-18]fluoro-a-
methyl tyrosine: a potential tumor-detecting agent. J. Nucl. Med. 39, 663–667.
ICRP, 1971. Protection of the Patient in Radionuclide Investigations. ICRP Publication 17. Pergamon
Press, Oxford.
ICRP, 1973. Alkaline Earth Metabolism in Adult Man. ICRP Publication 20. Pergamon Press, Oxford.
ICRP, 1975. Report of the Task Group on Reference Man. ICRP Publication 23. Pergamon Press,
Oxford.
ICRP, 1977. Recommendations of the International Commission on Radiological Protection. ICRP
Publication 26. Ann. ICRP 1(3).
ICRP, 1979. Limits for intakes of radionuclides by workers. ICRP Publication 30, Part 1. Ann. ICRP
2(3/4).
ICRP, 1980. Limits for intakes of radionuclides by workers. ICRP Publication 30, Part 2. Ann. ICRP
4(3/4).
189
ICRP Publication 106
ICRP, 1981. Limits for intakes of radionuclides by workers. ICRP Publication 30, Part 3. Ann. ICRP
6(2/3).
ICRP, 1987. Radiation dose to patients from radiopharmaceuticals. ICRP Publication 53. Ann. ICRP
18(1–4).
ICRP, 1991a. 1990 Recommendations of the International Commission on Radiological Protection. ICRP
Publication 60. Ann. ICRP 21(1–3).
ICRP, 1991b. Radiation dose to patients from radiopharmaceuticals. Addendum 1 to ICRP Publication
53. ICRP Publication 62. Ann. ICRP 22(3).
ICRP, 1993. Age-dependent doses to members of the public from intake of radionuclides. Part 2: ingestion
dose coefficients. ICRP Publication 67. Ann. ICRP 23(3/4).
ICRP, 1994. Dose coefficients for intake of radionuclides by workers. ICRP Publication 68. Ann. ICRP
24(4).
ICRP, 1996. Age-dependent doses to members of the public from intake of radionuclides. Part 5. ICRP
Publication 72. Ann. ICRP 26(1).
ICRP, 1998. Radiation dose to patients from radiopharmaceuticals. Addendum 2 to ICRP Publication 53.
ICRP Publication 80. Ann. ICRP 28(3).
ICRP, 2001a. Doses to the embryo and fetus from intake of radionuclides by the mother. ICRP
Publication 88. Ann. ICRP 31(1–3).
ICRP, 2001b. Radiation dose to patients from radiopharmaceuticals. Addendum 4 to ICRP Publication
53.
ICRP, 2002. Basic anatomical and physiological data for use in radiological protection: reference values.
ICRP Publication 89. Ann. ICRP 31(3/4).
ICRP, 2003. Relative biological effectiveness (RBE), quality factor (Q) and radiation weighting factor
(wR). ICRP Publication 92. Ann. ICRP 33(4).
ICRP, 2004. Doses to infants from ingestion of radionuclides in mothers’ milk. ICRP Publication 95. Ann.
ICRP 34(3/4).
ICRP, 2006. Human alimentary tract model for radiological protection. ICRP Publication 100. Ann.
ICRP 35(1/2).
ICRP, 2007. The 2007 Recommendations of the International Commission on Radiological Protection.
ICRP Publication 103. Ann. ICRP 37(2–4).
ICRU, 1979. Methods of Assessment of Absorbed Dose in Clinical Use of Radionuclides. ICRU Report
32. International Commission on Radiation Units and Measurements, Bethesda, MD.
ICRU, 2002. Absorbed-dose specification in nuclear medicine. ICRU Report 67. J. ICRU 2, 1–110.
Iyo, M., Namba, H., Fukushi, K., et al., 1997. Measurement of acetylcholinesterase by positron emission
tomography in the brains of healthy controls and patients with Alzheimer’s disease. Lancet 349, 1805–
1809.
Jankowski, J., Olszewski, J., Kluska, K., 2003. Distribution of equivalent doses to skin of the hands of
nuclear medicine personnel. Radiat. Prot. Dosim. 106, 177–180.
Johansson, L., Mattsson, S., Nosslin, B., Leide-Svegborn, S., 1992. Effective dose from radiopharma-
ceuticals. Eur. J. Nucl. Med. 19, 933–938.
Johansson, L., 1996. Absorbed dose in the salivary glands from technetium-99m labeled radiopharma-
ceuticals, in: Schlafke-Stelson, A, Stabin, M.G., Sparks, R.B. (Eds.), Sixth International Radiophar-
maceutical Dosimetry Symposium, Gatlinburg, TN. Oak Ridge Institute for Science and Education,
pp. 513–521.
Johnston, R.E., Mukherji, S.K., Perry, R.J., Stabin, M.G., 1996. Radiation dose from breastfeeding
following administration of thallium-201. J. Nucl. Med. 37, 2079–2082.
Jonsson, L., Ljungberg, M., Strand, S.E., 2005. Evaluation of accuracy in activity calculations for the
conjugate view method from Monte Carlo simulated scintillation camera images using experimental
data in an anthropomorphic phantom. J. Nucl. Med. 46, 1679–1686.
Kassis, A.M., 2004. The amazing world of Auger electrons. Int. J. Radiat. Biol. 80, 789–903.
Kaul, A., Krauss, O., Petrausch, G., 1985. Strahlenexposition durch Tc-99m-Methylendiphosphonat —
lokale Dosisverteilung in Wachstum zonen des kindlichen Skelett und Organdosen, in: Poretti, G.
(Ed.), Medizinische Physik. Deutsche Gesellschaft fur medizinische Physik, Bern.
190
ICRP Publication 106
Kauppinen, T.A., Bergstrom, K.A., Heikman, P., Hiltunen, J., Ahonen, A.K., 2003. Biodistribution and
radiation dosimetry of [123I]ADAM in healthy human subjects: preliminary results. Eur. J. Nucl. Med.
30, 132–136.
Kim, S., Wagner Jr., H.N., Villemagne, V.L., et al., 1997. Longer occupancy of opioid receptors by
nalmefene compared to naloxone as measured in vivo by a dual detector system. J. Nucl. Med. 38,
1726–1731.
Knapp Jr., F.F., Ambrose, K.R., Goodman, M.M., 1986. New radioiodinated methyl-branched fatty
acids for cardiac studies. Eur. J. Nucl. Med. 12 (Suppl.), S39–S44.
Knapp Jr., F.F., Franken, P., Kropp, J., 1995a. Cardiac SPECT with iodine-123-labeled fatty acids:
evaluation of myocardial viability with BMIPP. J. Nucl. Med. 36, 1022–1030.
Knapp Jr., F.F., Kropp, J., 1995b. Iodine-123-labelled fatty acids for myocardial single-photon emission
tomography: current status and future perspectives. Eur. J. Nucl. Med. 22, 361–381.
Koback, R., Plato, P., 1985. Influence of dosemeter positioning on reported doses to the upper extremities.
Radiat. Prot. Dosim. 11, 257–262.
Koizumi, M., Endo, K., Watanabe, Y., et al., 1989. Pharmacokinetics of internally labeled mono-
clonal antibodies as a gold standard: comparison of biodistribution of 75Se-, 111In-, and 125I-
labeled monoclonal antibodies in osteogenic sarcoma xenografts in nude mice. Cancer Res. 49,
1752–1757.
Krahwinkel, W., Herzog, H., Feinendegen, L.E., 1988. Pharmacokinetics of thallium-201 in normal
individuals after routine myocardial scintigraphy. J. Nucl. Med. 29, 1582–1586.
Krenning, E.P., Bakker, W.H., Kooij, P.P.M., et al., 1992. Somatostatin receptor scintigraphy with
indium-111-DTPA-D-Phe-1-octreotide in man: metabolism, dosimetry and comparison with iodine-
123-Tyr-3-octreotide. J. Nucl. Med. 33, 652–658.
Krenning, E.P., Kwekkeboom, D.J., Bakker, W.H., et al., 1993. Somatostatin receptor scintigraphy with
(111In-DTPA-D-Phe1)- and (123I-Tyr3)-octreotide: the Rotterdam experience with more than 1000
patients. Eur. J. Nucl. Med. 20, 716–731.
Kuikka, J.T., Bergstrom, K.A., Ahonen, A., Lansimies, E., 1994. The dosimetry of iodine-123 labelled 2b-
carbomethoxy-3b-(4-iodophenyl)tropane. Eur. J. Nucl. Med. 21, 53–56.
Laffont, S., Deuvillers, A., Garin, E., et al., 2001. Radiation protection and radiation dose to technicians
and patient during PET study (18FDG). Medecine Nucleaire 25, 395–400.
Leggett, R.W., Williams, L.R., 1991. Suggested reference values for regional blood volumes in humans.
Health Phys., 139–154.
Leggett, R.W., Williams, L.R., 1995. A proposed blood circulation model for reference man. Health Phys.
69, 187–201.
Leide-Svegborn, S., Nosslin, B., Mattsson, S., 1996. Biokinetics and dosimetry of 111In-DTPA-D-Phe-1-
octreotide in patients, in: Schlafke-Stelson, AT., Stabin, M.G., Sparks, R.B. (Eds.), Proceedings of the
Sixth International Radiopharmaceutical Dosimetry Symposium. Oak Ridge Associated Universities,
Oak Ridge, TN, pp. 631–642.
Leveille, J., Demonceau, G., Walovitch, R.C., 1992. Intrasubject comparison between technetium-99m-
ECD and technetium-99m-HMPAO in healthy human subjects. J. Nucl. Med. 33, 480–484.
Liemann, H., Will, E., Beuthien-Baumann, B., 2000. Investigations of radiation exposure of the medical
personnel during F-18 FDG PRT studies. Nuklear Medizin 39, 77–81, [in German].
Liepe, K., Andreeff, M., Wunderlich, G., et al., 2005. Radiation protection in radiosynovectomy of the
knee. Health Phys. 89, 151–154.
Liniecki, J., 1998. Private communication. Department of Nuclear Medicine. Medical University of Lodz,
Lodz.
Loevinger, R., Berman, M., 1968. A schema for absorbed-dose calculations for biologically distributed
radionuclides. MIRD Pamphlet No. 1. J. Nucl. Med. 9 (Suppl. 1), 7–14.
Loevinger, R., Budinger, T.F., Watson, E.E., 1991. MIRD Primer for Absorbed Dose Calculations.
Revised edition. Society of Nuclear Medicine, New York, NY.
Lu, E., Meyer, E., Kuwabara, H., Ma, Y., Shiraishi, M., Evans, A.C., 1995. Reduction of radiation
absorbed dose in F-18-DOPA PET studies by hydration-induced voiding. J. Nucl. Med. 36 (Suppl.),
98P.
191

ICRP Publication 106
Luxen, A., Guillaume, M., Melega, W.P., Pike, V.W., Solin, O., Wagner, R., 1992. Production of
6[18F]fluoro-L-DOPA and its metabolism in vivo – a critical review. Nucl. Med. Biol. 19, 149–
158.
Machulla, H.J., Marsmann, M., Dutschka, K., 1980. Biochemical concept and synthesis of a
radioiodinated phenyl fatty acid for in vivo metabolic studies of the myocardium. Eur. J. Nucl.
Med. 5, 171–173.
Mackenzie, A., 1997. Reduction of extremity dose in the radiopharmacy. Nucl. Med. Commun. 18, 578–
581.
Martin, C.J., Whitby, M., 2003. Application of ALARP to extremity doses for hospital workers. J. Radiol.
Prot. 23, 405–421.
McClain, D.A., Hug Jr., C.C., 1980. Intravenous fentanyl kinetics. Clin. Pharmacol. Ther. 28, 106–114.
McCauley, E., Mackie, A., 2002. Breast milk activity during early lactation following maternal 99Tcm
macroaggregated albumin lung perfusion scan. Br. J. Radiol. 75, 464–466.
Meija, A.A., Nakamura, T., Masatoshi, I., Hatazawa, J., Mazaki, M., Watanuki, S., 1991. Estimation of
absorbed doses in humans due to intraveneous administration of fluorine-18-fluorodeoxyglucose in
PET studies. J. Nucl. Med. 32, 699–706.
Melega, W.P., Hoffman, J.M., Luxen, A., Nissenson, C.H.K., Phelps, M.E., Barrio, J.P., 1990. The effects
of carbidopa on the metabolism of 6-[18F]fluoro-L-dopa in rats, monkeys and humans. Life Sci. 47,
149–157.
Meyer, G.-J., Waters, S.L., Coenen, H.H., Luxen, A., Maziere, B., Langstrom, B., 1995. PET
radiopharmaceuticals in Europe: current use and data relevant for the formulation of summaries of
product characteristics (SPCs). Eur. J. Nucl. Med. 22, 1420–1432.
Mielcarek, J., Barth, I., 2002. Occupational beta radiation exposure during radiosynoviorthesis. Sixth
European ALARA Network Workshop in Occupational Exposure Optimization in Medical Field and
Radiophamaceutical Industry, pp. 43–46 (http://www.eu-alara.net/images/stories/pdf/program6/Ses-
sion%20B/I_Barth.pdf).
Mitterhauser, M., Wadsak, W., Wabnegger, L., et al., 2004. Biological evaluation of 2 0-[18F]fluoroflu-
mazenil ([18F]FFMZ): a potential GABA receptor ligand for PET. Nucl. Med. Biol. 31, 291–295.
Montgomery, A., Martin, C.J., Anstee, D., et al., 1997. Application of a gamma extremity monitoring
system in a radiopharmaceutical dispensary. Nucl. Med. Commun. 18, 673–679.
Montgomery, A., Anstee, D.E., Martin, C.J., et al., 1999. Reduction in finger dose for radiopharma-
ceutical dispensing afforded by a syringe shield and an automatic dose dispenser. Nucl. Med. Commun.
20, 189–194.
Mountford, P.J., Coakley, A.J., 1989. A review of the secretion of radioactivity in human breast milk:
data, quantitative analysis and recommendations. Nucl. Med. Commun. 10, 15–27.
Mozley, P.D., Stubbs, J.T., Kim, H-J., et al., 1995. Dosimetry of a D2/D3 dopamine receptor antagonist
that can be used with PET or SPECT. J. Nucl. Med. 36, 1322–1331.
Mozley, P.D., Stubbs, J.T., Kim, H-J., et al., 1996. Dosimetry of an iodine-123-labeled tropane to image
dopamine transporters. J. Nucl. Med. 37, 151–159.
Mulholland, G.K., Kilbourn, M.R., Sherman, P., et al., 1995. Synthesis, in vivo biodistribution and
dosimetry of [11C]N-methylpiperidyl benzilate ([11C]NMPB), a muscarinic acetylcholine receptor
antagonist. Nucl. Med. Biol. 22, 13–17.
NCRP, 1982. Nuclear Medicine – Factors Influencing the Choice and Use of Radionuclides in Diagnosis
and Therapy. NCRP Report No. 70. National Council on Radiation Protection and Measurements,
Bethesda, MD.
NCRP, 1985. General Concepts for the Dosimetry of Internally Deposited Radionuclides. NCRP Report
No. 84. National Council on Radiation Protection and Measurements, Bethesda, MD.
Neil, C.M., 1969. The question of radiation exposure to the hand from handling 99mTc. J. Nucl. Med. 10,
732–734.
Nettleton, J.S., Lawson, R.S., Prescott, M.C., Morris, I.D., 2004. Uptake, localization, and dosimetry of111In and 201Tl in human testes. J. Nucl. Med. 45, 138–146.
Norrgren, K., Svegborn, S.L., Areberg, J., Mattsson, S., 2003. Accuracy of the quantification of organ
acticity from planar gamma camera images. Cancer Biother. Radiopharm, 18.
192

ICRP Publication 106
Nosslin, B., Johansson, L., Leide-Svegborn, S., Liniecki, J., Mattsson, S., Taylor, D., 2003. A generic
model for 11C-labelled radiopharmaceuticals for imaging receptors in the human brain. Rad. Prot.
Dosim. 105, 587–591.
Olsson, H., Halldin, C., Swahn, G., Farde, L., 1999. Quantification of [11C]FLB 457 binding to
extrastriatal dopamine receptors in the human brain. J. Cereb. Blood Flow Metab. 19, 1164–1173.
Osman, S., Lundkvist, C., Pike, V.W., et al., 1996. Characterization of the radioactive metabolites of the
5-HT1A receptor radioligand, [O-methy-11C]WAY-100635, in monkey and human plasma by HPLC:
comparison of the behaviour of an identified radioactive metabolite with parent radioligand in monkey
using PET. Nucl. Med. Biol. 23, 627–634.
Pappata, S., Samson, Y., Chavoix, C., Prenant, C., Maziere, M., Baron, J.C., 1988. Regional specific
binding of [11C]RO 15 1788 to central type benzodiazepine receptors in human brain: quantitative
evaluation by PET. J. Cereb. Blood Flow Metab. 8, 304–313.
Paul, G.S., Sharma, S.K., Rath, G.K., 2006. Finger doses for staff handling radiopharmaceuticals in
nuclear medicine. J. Nucl. Med. Technol. 34, 169–173.
Pauwels, T., Dethy, S., Goldman, S., Monclus, M., Luxen, A., 1994. Effect of catechol-O-methyl
transferase inhibition on peripheral and central metabolism of 6-[18F]fluoro-L-DOPA. Eur. J.
Pharmacol. 257, 53–58.
Persson, A., Pauli, S., Swahn, C.G., Halldin, C., Sedvall, G., 1989. Cerebral uptake of 11C-Ro 15 1788 and
its acid metabolite 11C-Ro 15 3890: PET study in human volunteers. Human Psychopharmacol. 4, 215–
220.
Pike, V.W., McCarron, J.A., Hume, S.P., et al., 1995. Preclinical development of a radioligand for studies
of central 5-HT1A receptors in vivo – [11C]WAY-100635. Med. Chem. Res. 5, 208–227.
Rao, D.V., Shepstone, B.J., Wilkins, H.B., Howell, R.W., 1995. Kinetics and dosimetry of thallium-201 in
human testes. J. Nucl. Med. 36, 607–609.
Reske, S.N., Biersack, H.J., Lackner, K., et al., 1982. Assessment of regional myocardial uptake and
metabolism of omega-(p-123I-phenyl) pentadecanoic acid with serial single-photon emission tomog-
raphy. Nuklearmedizin 21, 249–253.
Reske, S.N., 1985. 123I-phenylpentadecanoic acid as a tracer of cardiac free fatty acid metabolism.
Experimental and clinical results. Eur. Heart J. 6 (Suppl. B), 39–47.
Rimpler, A., Barth, I., Senftleben, S., et al., 2007. Beta radiation exposure of staff during therapies with
Y-90 labeled substances. Beta-Days in Capri (Italy), 20–22 Sept. 2007 (http://www.uznuclear.
rug.ac.be/betadayscapri/).
Rimpler, A., Barth, I., 2007. Beta radiation exposure of medical staff and implications for extremity dose
monitoring. Rad. Prot. Dosim. 125, 335–339.
Roedler, H.D., 1980. Accuracy of Internal Dose Calculations with Special Consideration of Radiophar-
maceutical Biokinetics. Third International Radiopharmaceutical Dosimetry Symposium, Oak Ridge,
TN. HHS Publication (FDA 81-8166). Department of Health and Human Welfare, Bureau of
Radiological Health, Rockville, MD.
Roedler, H.D., Kaul, A., 1976. Dose to Target Organs from Remaining Body Activity: Results of the
Formally Exact and Approximate Solution. Radiopharmaceutical Dosimetry Symposium, Oak Ridge,
TN. HEW Publication (FDA 76-8044). pp. 155–163.
Roedler, H.D., Kaul, A., Hine, G.J., 1978. Internal Radiation Dose in Diagnostic Nuclear Medicine.
Hoffman, Berlin.
Rose, M.R., Prescott, M.C., Herman, K.J., 1990. Excretion of iodine-123-hippuran, technetium-99m-red
blood cells, and technetium-99m-macroaggregated albumin into breast milk. J. Nucl. Med. 31, 978–
984.
Rossetti, C., Vanoli, G., Paganelli, G., et al., 1994. Human biodistribution, dosimetry and clinical use of
technetium (III)-99m-Q12. J. Nucl. Med. 35, 1571–1580.
Rubow, S., Klopper, J., Wasserman, H., Baard, B., van Niekerk, M., 1994. The excretion of
radiopharmaceuticals in human breast milk: additional data and dosimetry. Eur. J. Nucl. Med. 21,
144–153.
Russell, J.R., Stabin, M.G., Sparks, R.B., Watson, E.E., 1997. Radiation absorbed dose to the embryo/
fetus from radiopharmaceuticals. J. Nucl. Med. 73, 756–769.
193

ICRP Publication 106
Ryan, J., Cooper, M., Loberg, M., Harvey, E., Sikorski, S., 1977. Technetium-99m-labelled N-(2,6-
dimethylphenyl carbamoylmethyl)-iminodiacetic acid (Tc99mHIDA): a new radiopharmaceutical for
hepatobiliary imaging studies. J. Nucl. Med. 18, 997–1004.
Samson, G., Wackers, F.J.Th., Becker, A.E., et al., 1978. Distribution of thallium-201 in man, in: Oeff, K,
Schmidt, H.A.E. (Eds.), Nuklearmedizin und biokybernetik, Vol. 1. Medico-informationsdienste,
Berlin, pp. 385–389.
Schmidt, D., Langen, K-J., Herzog, H., et al., 1997. Whole-body kinetics and dosimetry of l-3-[123I]iodo-
a-methyltyrosine. Eur. J. Nucl. Med. 24, 1162–1166.
Shleien, B., Slaback, L.A.S, Jr., Birky, B.K., 1998. Handbook of Health Physics and Radiological Health.
Williams and Wilkins, Baltimore, MD.
Shoup, T.M., Olson, J., Hoffman, J.M., et al., 1999. Synthesis and evaluation of [18F]1-amino-3-
fluorocyclobutane-1-carboxylic acid to image brain tumours. J. Nucl. Med. 40, 331–338.
Shreve, P., Chiao, P.C., Humes, H.D., Schwaiger, M., Gross, M.D., 1995. Carbon-11-acetate PET
imaging in renal disease. J. Nucl. Med. 36, 1595–1601.
Shreve, P.D., Gross, M.D., 1997. Imaging of the pancreas and related diseases with PET carbon-11-
acetate. J. Nucl. Med. 38, 1305–1310.
Sloof, G.W., Visser, F.C., van Lingen, A., et al., 1997. Evaluation of heart-to-organ ratios of 123I-BMIPP
and the dimethyl-substituted 123I-DMIPP fatty acid analogue in humans. Nucl. Med. Commun. 18,
1065–1070.
Smith, T., Veall, N., Wootton, R., 1982. Bladder wall dose from administered radiopharmaceuticals: the
effect of variation in urine flow rate, voiding interval and initial bladder content. Radiat. Prot. Dosim.
2, 183–189.
Smith, T., Lahiri, A., Gemmell, H.G., et al., 1992. Dosimetry of 99mTc-P53, a new myocardial perfusion
imaging agent, in: Schlafke-Stelson, A, Watson, E.E. (Eds.), Fifth International Radiopharmaceutical
Dosimetry Symposium. CONF-910529. Oak Ridge Associated Universities, Oak Ridge, TN, pp. 467–
481.
Smith, T., Tong, C., Lammertsma, A.A., et al., 1994. Dosimetry of intravenously administered oxygen-15
labelled water in man: a model based on experimental human data from 21 subjects. Eur. J. Nucl. Med.
21, 1126–1134.
Snyder, W.S., Ford, M.R., Warner, G.G., Fisher Jr, H.R., 1969. Estimates of absorbed fractions for
monoenergetic photon sources uniformly distributed in various organs of a heterogeneous phantom.
MIRD Pamphlet No. 5. J. Nucl. Med. 10 (Suppl. 3).
Snyder, W.S., Ford, M.R., Warner, G.G., Watson, S.B., 1975. ‘‘S’’ Absorbed Dose per Unit Cumulated
Activity for Selected Radionuclides and Organs. MIRD Pamphlet No. 11. Society of Nuclear
Medicine, New York, NY.
Snyder, W.S., Ford, M.R., 1976. Estimation of doses to the urinary bladder and to the gonads, in:
Cloutier, R.J., et al., (Eds.), Radiopharmaceutical Dosimetry Symposium, Oak Ridge, TN. HEW
Publication (FDA 76-8044). Department of Health, Education and Welfare, Bureau of Radiological
Health, Rockville, MD, pp. 313–349.
Snyder, W.S., Ford, M.R., Warner, G.G., 1978. Estimates of Specific Absorbed Fractions for Photon
Sources Uniformly Distributed in Various Organs of a Heterogeneous Phantom. Medical Internal
Radiation Dose Committee (NM/MIRD) Pamphlet No. 5, revised. Society of Nuclear Medicine, New
York, NY.
Stabin, M.G., 1996. MIRDOSE: personal computer software for internal dose assessment in nuclear
medicine. J. Nucl. Med. 37, 538–546.
Stabin, M.G., Kooij, P.P., Bakker, W.H., 1997. Radiation dosimetry for indium-111-pentetreotide. J.
Nucl. Med. 38, 1919–1922.
Stabin, M.G., Breitz, H.B., 2000. Breast milk excretion of radiopharmaceuticals: mechanisms, findings,
and radiation dosimetry. J. Nucl. Med. 41, 863–873.
Stabin, M.G., Siegel, J.A., 2003. Physical models and dose factors for use in internal dose assessment.
Health Phys. 83, 294–310.
Stabin, M.G., Sparks, R.B., Crowe, E., 2005. OLINDA/EXM: the second-generation personal computer
software for internal dose assessment in nuclear medicine. J. Nucl. Med. 46, 1023–1027.
194
ICRP Publication 106
Stenhouse, M.J., Baxter, M.S., 1977. Bomb 14C as a biological tracer. Nature (Lond.) 267, 828–
832.
Stenstrom, K., Leide-Svegborn, S., Erlandsson, B., et al., 1996. Application of accelerator mass
spectrometry (AMS) for high-sensitivity measurements of 14CO2 in long-term studies of fat
metabolism. Appl. Radiat. Isot. 47, 417–422.
Stepanek, J., Larsson, B., Weinreich, R., 1996. Auger-electron spectra of radionuclides for therapy and
diagnostics. Acta Oncol. 35, 863–868.
Stuardo, E., 1990. Hand dose levels in Chilean nuclear medicine laboratories. Radiat. Prot. Dosim. 34,
127–130.
Sun, K.T., Chen, K., Huang, S-C., et al., 1997. Compartment model for measuring myocardial oxygen
consumption using [1-11C]acetate. J. Nucl. Med. 38, 459–466.
Surma, M.J., Wiewiora, J., Liniecki, J., 1994. Usefulness of 99mTc-N,N 0-ethylene-1-dicysteine complex for
dynamic kidney investigations. Nucl. Med. Comm. 15, 628–635.
Surma, M.J., 1998a. Verification of 99mTc-ethylenedicysteine (99mTc-EC) distribution model in the
organism. Nucl. Med. Rev. 1, 29–32.
Surma, M.J., 1998b. 99mTc-Ethylenedicysteine (99mTc-EC) renal clearance determination error for the
multiple- and single-sample methods. Nucl. Med. Rev. 1, 33–40.
Syed, I.B., 1976. Dosimetry of indium-113m radiopharmaceuticals with special attention to the urinary
bladder, in: Cloutier, R.J., et al., (Eds.), Radiopharmaceutical Dosimetry Symposium, Oak Ridge, TN.
HEW Publication (FDA 76-8044). Department of Health, Education and Welfare, Bureau of
Radiological Health, Rockville, MD, pp. 360–369.
Szabo, Z., Scheffel, U., Mathews, W.B., et al., 1999. Kinetic analysis of [11C]McN5652: a serotonin
transporter radioligand. J. Cereb. Blood Flow Metab. 19, 967–981.
Taavitsainen, M., Riihimaki, E., Tahti, E., 1980. Body disappearance and liver mean transit time of 99m-
Tc-diethyl-IDA. Eur. J. Nucl. Med. 5, 147–150.
Taillefer, R., Edell, S., Innes, G., Lister-James, J., 2000. Acute thromboscintigraphy with (99m)Tc-
apcitide: results of the phase 3 multicenter clinical trial comparing 99mTc-apcitide scintigraphy with
contrast venography for imaging acute DVT. Multicenter trial investigators. J. Nucl. Med. 41, 1214–
1223.
Tamaki, N., Morita, K., Kuge, Y., Tsukamoto, E., 2000. The role of fatty acids in cardiac imaging. J.
Nucl. Med. 41, 1525–1534.
Tanaka, N., Fukushi, K., Shinotoh, H., et al., 2001. Positron emission tomographic measurement of brain
acetylcholinesterase activity using N-[11C]methylpiperidin-4-yl acetate without arterial blood sampling:
methodology of shape analysis and its diagnostic power for Alzheimer’s disease. J. Cereb. Blood Flow
Metab. 21, 295–306.
Tandon, P., Venkatesh, M., Bhatt, B.C., 2007. Extremity dosimetry for radiation workers handling
unsealed radionuclides in nuclear medicine departments in India. Health Phys. 92, 112–118.
Taylor, D.M., 2000a. Unpublished assessments.
Taylor, D.M., 2000b. Generic models for radionuclide dosimetry: 11C, 18F or 75Se-labelled amino acids.
Appl. Radiat. Isot. 52, 911–922.
Taylor, D.M., 2000c. Subcellular distribution of gallium-67 and other Auger-emitting radionuclides in
human and animal tissues. Radiat. Prot. Dosim. 92, 229–231.
Taylor, D.M., Cottrall, M.F., 1973. Evaluation of amino acids labelled with 18F for pancreas scanning, in:
Radiopharmaceuticals and Labelled Compounds, Vol. I. IAEA, Vienna, pp. 441–443.
Thomas, S.R., Stabin, M.G., Chen, C.-T., Samaratunga, R.C., 1999. A dynamic urinary bladder
model for radiation dose calculations. MIRD Pamphlet No. 14, revised. J. Nucl. Med. 40, 102S–
123S.
Thomas, S.R., Stabin, M.G., Castronovo, F.P., 2005. Radiation-absorbed dose from 201Tl-thallous
chloride. J. Nucl. Med. 46, 502–508.
Tobin, R.E., Schneider, P.B., 1976. Uptake of 67Ga in the lactating breast and its persistence in milk: case
report. J. Nucl. Med. 17, 1055–1056.
Torizuka, K., Yonekura, Y., Nishimura, T., et al., 1991. The phase 1 study of b-methyl-p-(123I)-
iodophenyl-pentadecanoic acid (123I-BMIPP). Kagu Igaku 28, 681–690.
195
ICRP Publication 106
Towsen, J.E.C., 2002. Radiation dosimetry and protection in PET, in: Valk, PE., Bailey, D.L., Townsend,
D.W., et al. (Eds.), Positron Emission Tomography; Basic Science and Clinical Practice. Springer-
Verlag, London, pp. 265–279.
Vallabhajosula, S., Zimmerman, R.E., Picard, M., et al., 1989. Technetium-99m ECD: a new brain
imaging agent: in vivo kinetics and biodistribution studies in normal human subjects. J. Nucl. Med. 30,
599–604.
Vanhavere, F., Berus, D., Buls, N., et al., 2006. Use of extremity dose meters in a hospital environment.
Radiat. Prot. Dosim. 118, 190–195.
Verhoeff, N.P., Sokole, E.B., Stabin, M., et al., 1993. Dosimetry of iodine-123 iodobenzamide in healthy
volunteers. Eur. J. Nucl. Med. 20, 747–752.
Verhoeff, N.P., Busemann Sokole, E., Hengst, D., Stubbs, J.B., van Royen, E.A., 1993. Dosimetry of
iodine-123 iomazenil in humans. Eur. J. Nucl. Med. 20, 580–584.
Versijpt, J., Dumont, F., Thierens, H., et al., 2000. Biodistribution and dosimetry of [123I]iodo-PK 11195:
a potential agent for SPET imaging of the peripheral benzodiazepine receptor. Eur. J. Nucl. Med. 27,
1326–1333.
Visseaux, H., Vuillez, J.P., Giraud, J.Y., 2007. Dosimetric study and radioprotection optimization in 18F-
FDG scintigraphy. Medecine Nucleaire 28, 205–217.
Votaw, J.R., Ansari, M.S., Scott Mason, N., et al., 1995. Dosimetry of iodine-123-epidepride: a dopamine
D2 receptor ligand. J. Nucl. Med. 36, 1316–1321.
Volkow, N.D., Ding, Y.S., Fowler, J.S., et al., 1995. A new PET ligand for the dopamine transporter:
studies in human brain. J. Nucl. Med. 36, 2162–2168.
Waterhouse, R.N., Stabin, M.G., Page, J.G., 2003. Preclinical acute toxicity studies and rodent-based
dosimetry estimates of the novel sigma-1 receptor radiotracer [18F]FPS. Nucl. Med. Biol. 30, 555–563.
Watson, E.E., Stabin, M.G., Eckerman, K.F., 1989. A model of the peritoneal cavity for use in internal
dosimetry. J. Nucl. Med. 30, 2002–2011.
Wester, H.J., Herz, M., Senkowitsch-Schmidtke, R., Schwaiger, M., Stocklin, G., Hamacher, K., 1999a.
Preclinical evaluation of 4-[18F]fluoroprolines: diasteromeric effect on metabolism and uptake in mice.
Nucl. Med. Biol. 26, 259–265.
Wester, H.J., Herz, M., Weber, W., et al., 1999b. Synthesis and radiopharmacology of O-(2-
[18F]fluoroethyl)-LL-tyrosine for tumor imaging. J. Nucl. Med. 40, 205–212.
Westera, G., Buck, A., Burger, C., Leenders, K.L., von Schultness, G.K., Schubiger, A.P., 1996. Carbon-
11 and iodine-123 labelled iomazenil: a direct PET-SPECT comparison. Eur. J. Nucl. Med. 23, 5–12.
Whitby, M., Martin, C.J., 2002. Options for shielding the hand during dispensing and administration of
radiopharmaceuticals. Sixth European ALARA Network Workshop in Occupational Exposure
Optimization in Medical Field and Radiopharmaceutical Industry, pp. 167–170 (http://www.
eualara.net/images/stories/pdf/program6/Session%20C/M_Whithy.pdf).
Whitby, M., Martin, C.J., 2003. Investigation using an advanced extremity gamma instrumentation
system of options for shielding the hand during the preparation and injection of radiopharmaceuticals.
J. Radiol. Prot. 23, 79–96.
Whitby, M., Martin, C.J., 2005. A multi-centre study of dispensing methods and hand doses in hospital
radiopharmacies. Nucl. Med. Commun. 26, 49–60.
van de Wiele, C., De Vos, F., De Sutter, J., et al., 1999. Biokinetics and dosimetry of (iodine-123)-
iodomethyl-N,N-dimethyltamoxifen, an (anti)oestrogen receptor radioligand. Eur. J. Nucl. Med. 26,
1259–1264.
Wilhelm, A.J., Mijnhout, G.S., Franssen, E.J., 1999. Radiopharmaceuticals in sentinel lymph-node
detection - an overview. Eur. J. Nucl. Med. 26, S36–S42.
Williams, E.D., Laird, E.E., Forster, E., 1987. Monitoring radiation dose to the hands in nuclear medicine:
location of dosemeters. Nucl. Med. Commun. 8, 449–503.
Williams, L.R., Leggett, R.W., 1989. Reference values for resting blood flow to organs of man. Clin. Phys.
Physiol. Meas. 10, 187–217.
Wilson, A.A., Inaba, T., Fischer, N., et al., 1998. Derivatives of WAY 100635 as potential imaging agents
for 5-HT1A receptors: syntheses, radiosyntheses, and in vitro and in vivo evaluation. Nucl. Med. Biol.
25, 769–776.
196
ICRP Publication 106
Winchell, H.S., Horst, W.D., Braun, L., Oldendorf, W.H., Hattner, R., Parker, H., 1980. N-Isopropyl
(123I)p-iodoamphetamine: single-pass brain uptake and washout; binding to brain synaptosomes; and
localisation in dog and monkey brain. J. Nucl. Med. 21, 947–952.
Wistow, B.W., Subramanian, G., Van Heertum, R.L., et al., 1977. An evaluation on 99mTc-labeled
hepatobiliary agents. J. Nucl. Med. 18, 455–461.
Wrzesien, M., Olszewski, J., Jankowski, J., 2008. Hand exposure to ionising radiation of nuclear medicine
workers. Rad. Prot. Dosim. 130, 325–330.
Wu, R.K., Siegel, J.A., Rattner, Z., Malmud, L.S., 1984. Tc-99m HIDA dosimetry in patients with various
hepatic disorders. J. Nucl. Med. 25, 905–912.
Yeh, S.H., Liu, R.S., Wu, L.C., Yen, S.H., Chang, C.W., Chen, K.Y., 1999. 11C-acetate clearance in
nasopharyngeal carcinoma. Nucl. Med. Commun 20, 131–134.
Yoshizumi, T., Nozaki, S., Fukuchi, K., et al., 2000. Pharamacokinetics and metabolism of 123I-BMIPP
fatty acid analog in healthy and CD36-deficient subjects. J. Nucl. Med. 41, 1134–1138.
Zanzonico, P.B., 2000. Internal radionuclide radiation dosimetry: a review of basic concepts and recent
developments. J. Nucl. Med. 41, 297–308.
Zhu, X., 2004. Radiation safety considerations with yttrium-90 ibritumomab tiuxetan (Zevalin). Semin.
Nucl. Med. 34, 20–23.
197