Radial landscape mapping
21
Radial Landscape Mapping (a revolution in brand mapping)
-
Upload
masood-akhtar -
Category
Business
-
view
580 -
download
1
Transcript of Radial landscape mapping
Radial Landscape Mapping (a revolution in brand mapping)

Why we need brand maps?
Knowing how your brand is perceived in the market place is of
paramount importance.
Brand strategists are always keen to understand how their brand
aligns against a battery of perceptual equity and image statements.
Existing brand maps generated through statistical correspondence
analysis are thought by many to be confusing.


Radial landscape mapping is based on a statistical data reduction technique* designed to measure the
extent to which a set of brand personality attributes are associated with a set of known brands. Analysis
results are illustrated using a ‘Radial Landscape Map’ where brand personality attributes are positioned
out around the perimeter depending on their mutual association/correlation. Individual brands are
positioned inside the map.
Introducing…Radial Landscape Maps
(A revolution in brand mapping)
* Adapted statistical correspondence analysis
Brand personality attribute
Fun
Family
Expert
Brand X
Brand Y Caring
Brand Z Boring
Basic
Irritating Tired
Brand W
In some cases, the brand attributes start to cluster together representing an underlying theme or latent construct.
Brand W: Close to the centre - it is almost equally associated with all the personality attributes, but has a marginally higher association with vibrancy, expert and fun.
Brand X: Has a significantly higher association with fun, vibrant and expert.
Brand Y: is being pulled towards family and caring.
Brand Z: Is regarded as a basic, tired and boring brand.
Vibrant

Mapping Brands & Attributes
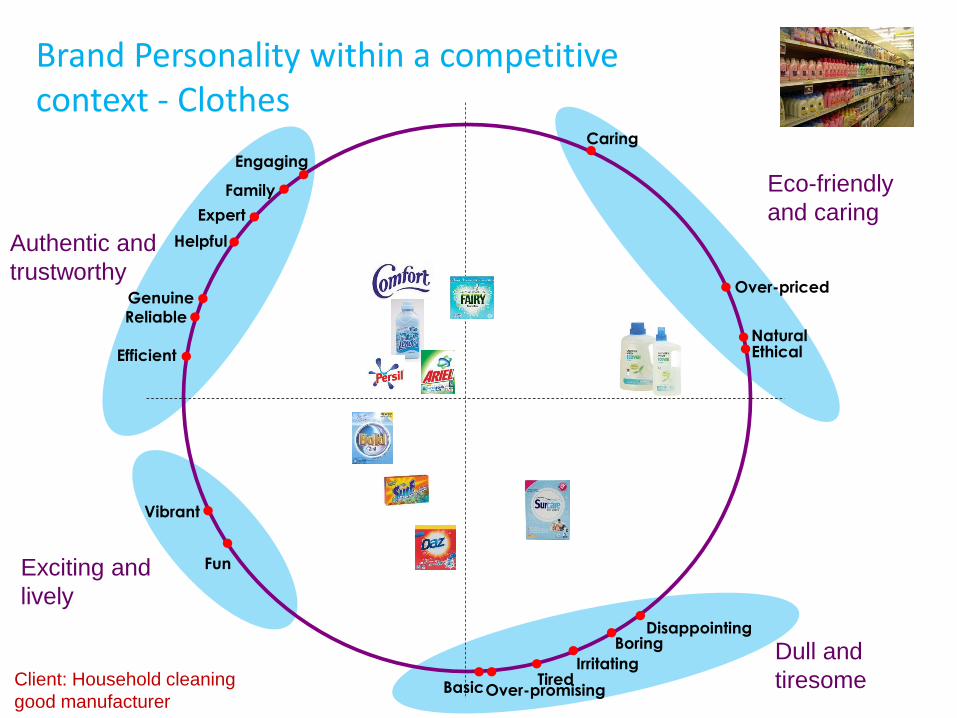
Authentic and
trustworthy
Exciting and
lively
Dull and
tiresome
Eco-friendly
and caring
Brand Personality within a competitive context - Clothes
Over-priced
Natural Ethical
Caring
Disappointing
Over-promising
Boring
Basic Tired
Irritating
Fun
Vibrant
Efficient
Reliable Genuine
Helpful
Expert
Family
Engaging
Client: Household cleaning
good manufacturer

Authentic Mexican Food
Great Tasting Food
High Quality Ingredients
Food from scratch
Clean/comfortable atmosphere
Personable. Friendly employees
Treats you like a valued customer
Crave Menu Items
Variety of menu items
Has drive-thru
Healthy nutritious items
Has large portions
Food prepared how you want it
Modern up to date
Gets order right
Simple menu
Open late night/24 hours
Food timely/fast
Convenient nearby location
Good value for money Low prices
Case: Restaurants (competitive brand positioning)
The Menu
Convenience
Value
Service Delivery
Food Quality
Brand A
Brand B
Brand C
Brand D Brand A is perceived to be a convenient offering and to lesser degree a value offering.
Brand D is differentiated by the quality of the food.

Alpha (2007)
Alpha (2011)
Alpha (2012)
Beta (2007)
Beta(2011)
Beta (2012)
Gamma (2011)
Gamma (2007)
Gamma (2012)
Is affordable
Is genuine and authentic
Worth what is costs
Goes well with food
Sophisticated drink
Always doing new things
Would like to be seen drinking
For football fans
Youthful brand
Is very refreshing
Cool & edgy
Associate with music
Inspires Optimism
Good when having with friends
Is an uplifting drink
Makes moments fun
Thirst quenching brand
Great tasting
Comforting & Relaxing
For someone like me
Has a premium quality
Delta (2007)
Delta (2011/12)
Value & Affordability
Quality
Youthful & Cool Social & Fun
Personal
Base: Daily Drinkers of Alpha only Adapted Statistical Correspondence Analysis
Case: Drinks brand (evolution in image through time)

Moving beyond the brand/attribute space

Client budget size VS what is considered very
important from suppliers.
Lowest Price Less than
$100K
$100K - $249K
$250K - $449K
$450K - $749K
$750K - $999K
$1M +
Familiarity with industry
Previous experience with supplier
Provide data analysis services
Use the latest
analytical
packages
Good
reputation
Also does quantitative
research
Has an access panel
Breadth of experience in
target segment
Familiarity with client needs
Length of experience/time in business
Listens well to client needs
Consultation on best
practices and methodology
effectiveness
Provides high data quality
Good relationship with supplier
Use the latest
data collection
technology
Offers a unique methodology/
approach
Uses sophisticated collection technology/strategies
Has knowledgeable staff
Rapid response to requests
High quality analysis
Completes research on agreed timings
Flexibility on changing
project parameters
Company is financially stable
Understands new consumer
communication channels &
technologies
DELIVERY AND FINANCIAL STABILITY
KNOWLEADGE & RESPONSIVENESS
QUALITY DATA COLLECTION TECHNIQUES
PRICE & ACCESS TO MARKET
EXPERIENCE & CONSULTATIVE SKILLS

What data can we use
Structured survey questions
Unstructured social media data
Any two-way table will work to produce a Radial Landscape Map

Our unique approach to measuring social “engagement”
Note: Off the shelf ‘sentiment’ metrics are based on automated word counting and volume of conversation.
Our Approach: • Is built upon a validated Linguistics based approach known as ‘Stance Shift
Analysis’
• Uncovers the meaning of conversations.
• Generates a metric called the Semantic Engagement Index (SEITM)
• Closely maps hard sales data.

Value and Price
Coolness, funky, style, Décor
Taste and product quality
In-store customer experience
Good value
Coffee Price
Food prices
Staying in
Seating/chairs
Toilets
Richness
Latte
Amazing taste Like no other
Cool brand
Funky Stylish Artwork/Decor
Bubbles represent conversational clusters, whilst size indicates level of engagement.
Brand V
Brand X
Brand Y
Brand W
Brand Z
Brand Y is least differentiated by social conversations.
Brand Z stands out v. competitors for the taste & rich flavour of its beverages
Case: Beverage chain (400K social media conversations)

Brand positioning using socially engaged chatter
Classic
Speed
Gas Mileage
Reliable
Safety & Reliability
To Be Seen Driving
Great Acceleration
Power Safety
Interior Design
Styling
Curb Appeal
Performance
Emotional Style & Design
Elegant Feeling
Durable
Audi and Jaguar are differentiated by social conversations around style and design.
BMW is uniquely positioned on performance qualities.
Acura is least differentiated by social chatter
Note: Separate analysis - Adapted Statistical Correspondence Analysis
Bubble size represents the buzz/volume of chatter (SEI Conversational Clusters)

What is so special about the Radial Landscape Maps?
1. The maps provide a means of visualising reams of cross tabular data on brands.
2. They provide a powerful window into the positioning of brands within a competitive landscape.
3. The maps are designed with simplicity in mind.
4. The maps serve different audiences – researchers, brand managers/strategists/planners, creative and product-experience designers.
5. The maps have multiple applications outside of the immediate brand/attribute space. We can capture large amounts of unstructured social media conversations and represent in a powerful map.

“I was immediately impressed by the elegance of the visual, the ease of understanding it, and the power of the statistical analysis behind it” Leonard F. Murphy Chief Editor & Principal Consultant | GreenBook Research Industry Trends
GreenBook blog article - Radial Landscape Map – A Revolution in Brand Mapping and Data Visualisation. Click Here

Michael Wolfe CEO Bottom Line Analytics E: [email protected] M: 770.485.0270 www.bottomlineanalytics.com
Masood Akhtar Partner, Analytics (EMEA) Bottom Line Analytics E: [email protected] M: +44 7970 789 663 www.bottomlineanalytics.com