RADAR REFLECTIVITY OF THE EARTH'S SURFACE€¦ · There are distinct similarities between...
8
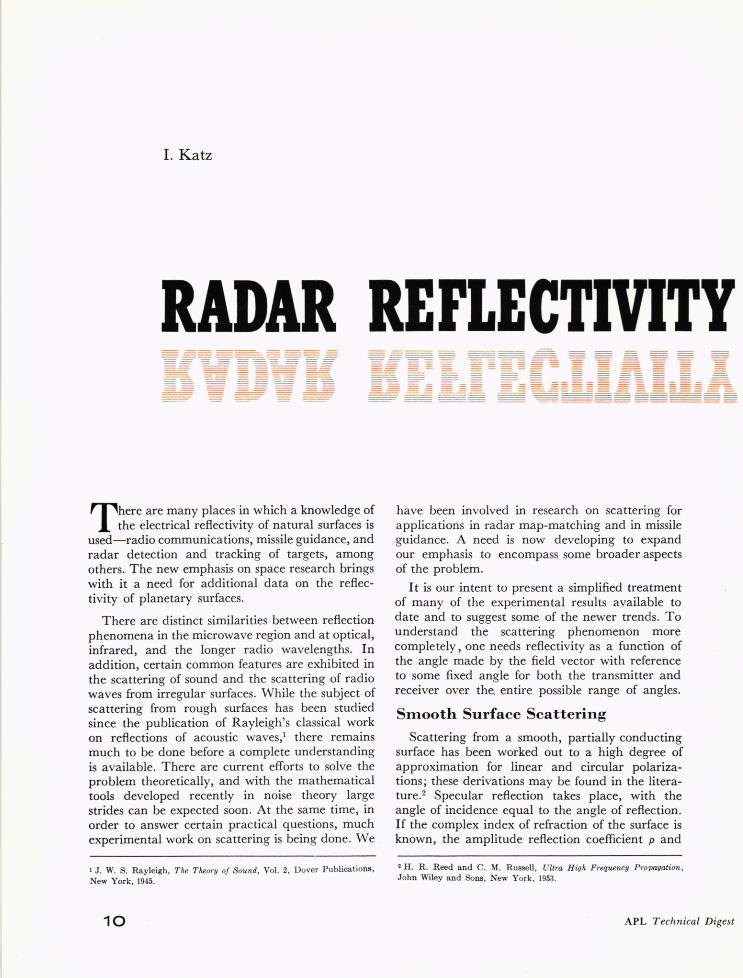
I. Katz RADAR REFLECTIVITY T here are many places in which a knowledge of the electrical reflectivity of natural surfaces is used-radio communications, missile guidance, and radar detection and tracking of targets, among others. The new emphasis on space research brings with it a need for additional data on the reflec- tivity of planetary surfaces. There are distinct similarities between reflection phenomena in the microwave region and at optical, infrared, and the longer radio wavelengths. In addition, certain common feature s are exhibited in the scattering of sound and the scattering of radio waves from irregular surfaces. While the subject of scattering from rough surfaces has been studied since the publication of Rayleigh 's classical work on reflections of acoustic waves, l there remains much to be done before a complete understanding is available. There are current efforts to solve the problem theoretically, and with the mathematical tools developed recently in noise theory large strides can be expected soon. At the same time, in order to answer certain practical questions, much experimental work on scattering is being done . We 1 J . W. S. Rayl eigh, The Theory oj Sound, Vol. 2, Dover P ubli cations, New York, 1945. 10 have been involved in research on scattering for applications in radar map-matching and in missile guidance. A need is now developing to expand our emphasis to encompass some broader aspects of the problem. It is our intent to present a simplified treatment of many of the experimental results available to date and to suggest some of the newer trends. To understand the scattering phenomenon more completely, one needs reflectivity as a function of the angle made by the field vector with reference to some fixed angle for both the transmitter and receiver over the, entire possible range of angles. Sm.ooth Surface Scattering Scattering from a smooth, partially conducting surface has been worked out to a high degree of approximation for linear and circular polariza- tions; these derivations may be found in the litera- ture. 2 Specular reflection takes place, with the angle of incidence equal to the angle of reflection. If the complex index of refraction of the surface is known, the amplitude reflection coefficient p and 2 H. R. Reed a nd C . M. Russell, Ultra Hi gh Frequency Propagation, John Wiley a nd Sons , New York, 1953. APL Technical Digest
Transcript of RADAR REFLECTIVITY OF THE EARTH'S SURFACE€¦ · There are distinct similarities between...
I. Katz
RADAR REFLECTIVITY
T here are many places in which a knowledge of the electrical reflectivity of natural surfaces is
used-radio communications, missile guidance, and radar detection and tracking of targets, among others. The new emphasis on space research brings with it a need for additional data on the reflectivity of planetary surfaces.
There are distinct similarities between reflection phenomena in the microwave region and at optical, infrared, and the longer radio wavelengths. In addition, certain common features are exhibited in the scattering of sound and the scattering of radio waves from irregular surfaces. While the subject of scattering from rough surfaces has been studied since the publication of Rayleigh's classical work on reflections of acoustic waves, l there remains much to be done before a complete understanding is available. There are current efforts to solve the problem theoretically, and with the mathematical tools developed recently in noise theory large strides can be expected soon. At the same time, in order to answer certain practical questions, much experimental work on scattering is being done. We
1 J . W. S. Rayleigh , The Theory oj Sound, Vol. 2, Dover P ublications, New York, 1945.
10
have been involved in research on scattering for applications in radar map-matching and in missile guidance. A need is now developing to expand our emphasis to encompass some broader aspects of the problem.
It is our intent to present a simplified treatment of many of the experimental results available to date and to suggest some of the newer trends. To understand the scattering phenomenon more completely, one needs reflectivity as a function of the angle made by the field vector with reference to some fixed angle for both the transmitter and receiver over the, entire possible range of angles.
Sm.ooth Surface Scattering
Scattering from a smooth, partially conducting surface has been worked out to a high degree of approximation for linear and circular polarizations; these derivations may be found in the literature. 2 Specular reflection takes place, with the angle of incidence equal to the angle of reflection. If the complex index of refraction of the surface is known, the amplitude reflection coefficient p and
2 H . R. Reed and C . M. Russell , Ultra High Frequency Propagation, J ohn Wiley and Sons, New York , 1953.
APL Technical Digest
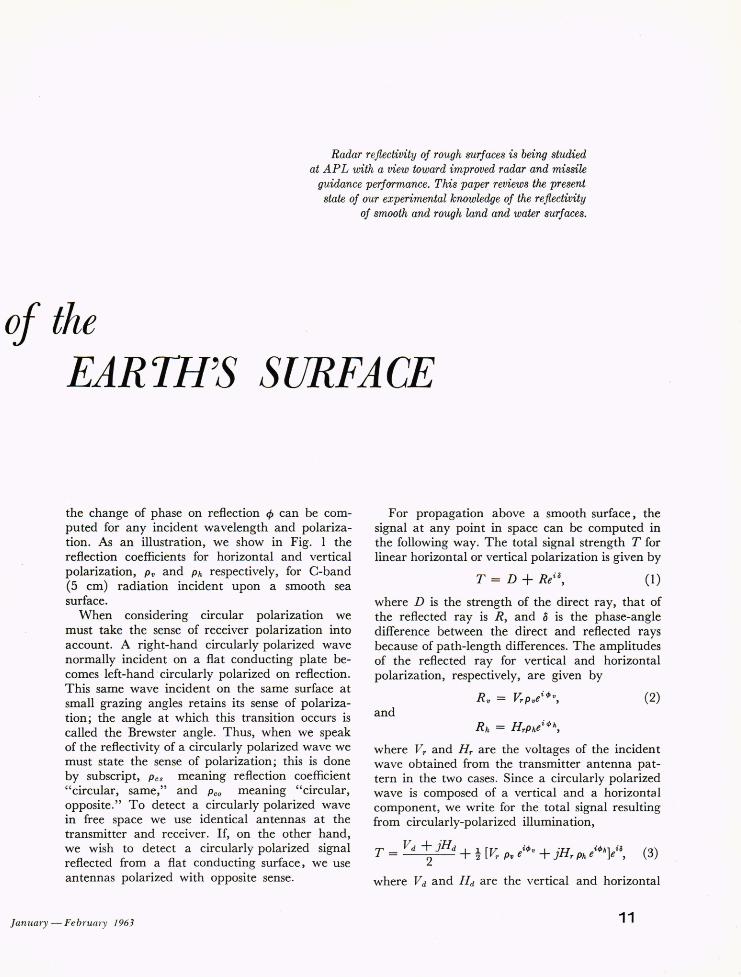
Radar reflectivity of rough surfaces is being studied at AP L with a view toward improved radar and missile
guidance performance. This paper reviews the present state of our experimental knowledge of the reflectivity
of smooth and rough land and water surfaces.
of the EAR TH'S S URFA CE
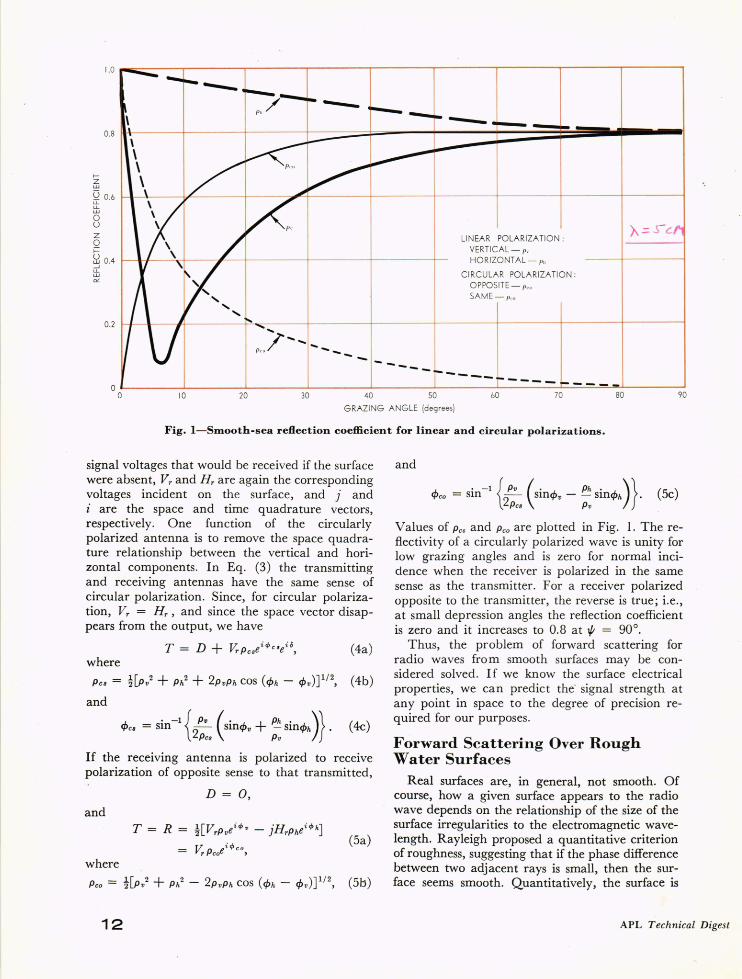
the change of phase on reflection cJ> can be computed for any incident wavelength and polarization. As an illustration, we show in Fig. 1 the reflection coefficients for horizontal and vertical polarization, Pv and Ph respectively, for C-band (5 cm) radiation incident upon a smooth sea surface.
When considering circular polariza tion we must take the sense of receiver polarization into account. A right-hand circularly polarized wave normally incident on a flat conducting plate becomes left-hand · circularly polarized on reflection. This same wave incident on the same surface at small grazing angles retains its sense of polarization; the angle at which this transition occurs is called the Brewster angle. Thus, when we speak of the reflectivity of a circularly polarized wave we must state the sense of polarization; this is done by subscript, Pcs meaning reflection coefficient "circular, same," and Pco meaning "circular, opposite." To detect a circularly polarized wave in free space we use identical antennas at the transmitter and receiver. If, on the other hand, we wish to detect a circularly polarized signal reflected from a flat conducting surface, we use antennas polarized with opposite sense.
January - February 1963
For propagation above a smooth surface, the signal at any point in space can be computed in the following way. The total signal strength T for linear horizontal or vertical polarization is given by
T = D + Rei 0, (1 )
where D is the strength of the direct ray, that of the reflected ray is R, and D is the phase-angle difference between the direct and reflected rays because of path-length differences. The amplitudes of the reflected ray for vertical and horizontal polarization, respectively, are given by
(2) and
where Vr and Hr are the voltages of the incident wave obtained from the transmitter antenna pattern in the two cases. Since a circularly polarized wave is composed of a vertical and a horizontal component, we write for the total signal resulting from circularly-polarized illumination,
T - Vd + JHd + 1 [V. icJ>" +·H icJ>h] io - 2 2" r pv e J r Ph e e, (3)
where Vd and Hd are the vertical and horizontal
11
I .o --------~-------r------_.------_,--------~------Ir------~------~------~
0.8 ~--t---t---±:::::::;;:;;;;;;;;+----_t-=::t===~:::::=-..,--.,
IZ ill
EE 0.6
o o z Q I-
LI NEAR POLARIZATION:
~ 0.4 ~-I-.'-~~---I--+----_____1f_---___t----__r___ VERTICAL - p,
HORIZONTAL - Ph Li ill ~
CIRCULAR POLARIZATION: OPPOSITE - p co
SAME- p cs
0.2 ~-l---J~------~~----+-------4-------~-------r-------t-------t------~
------°0L--------1~0--------2~0---------30L--------4~0 --------~50L-------~60~------~~-~-~-~~~0~------~90
GRAZING ANGLE (degrees)
Fig. I-SJDooth·sea reflection coefficient for linear and circular polarizations.
signal voltages that would be received if the surface were absent, Vr and Hr are again the corresponding voltages incident on the surface, and j and i are the space and time quadrature vectors, respectively. One function of the circularly polarized antenna is to remove the space quadrature relationship between the vertical and horizontal components. In Eq. (3) the transmitting and receiving antennas have the same sense of circular polarization. Since, for circular polarization, Vr = H r , and since the space vector disappears from the output, we have
(4a) where
PCB = UP v2 + Ph2 + 2PvPh cos ((j>h - (j> v)] 1/2, (4b)
and
</>" ~ Sin-l{~: (Sin</>. + ~Sin</>k)}. (4c)
If the receIVmg antenna is polarized to receive polarization of opposite sense to that transmitted,
D = 0,
and T=R ![VrPvei ~ v - jllrPhe i ~h]
v:.pcoei~co, (5a)
where
Peo = UP v2 + Ph2 - 2PvPh cos ((j>h - (j> v) ]1/2, (5b)
12
and
. - 1 {pv (. Ph .)} (j>co = sm 2 PCB sm(j>v - Pv Sm(j>h • (5c)
Values of Pes and Peo are plotted in Fig. 1. The reflectivity of a circularly polarized wave is unity for low grazing angles and is zero for normal incidence when the receiver is polarized in the same sense as the transmitter. For a receiver polarized opposite to the transmitter, the reverse is true; i.e., at small depression angles the reflection coefficient is zero and it increases to 0.8 at if; = 90°.
Thus, the problem of forward scattering for radio waves from smooth surfaces may be considered solved. If we know the surface electrical properties, we can predict the" signal strength at any point in space to the degree of precision required for our purposes.
Forward Scattering Over Rough Water Surfaces
Real surfaces are, in general, not smooth. Of course, how a given surface appears to the radio wave depends on the relationship of the size of the surface irregularities to the electromagnetic wavelength. Rayleigh proposed a quantitative criterion of roughness, suggesting that if the phase difference between two adjacent rays is small, then the surface seems smooth. Quantitatively, the surface is
APL Technical Digest
considered to be smooth if h sin1f < }./ 8, where h is a measure of the peak-to-trough irregularity height, 1f is the grazing angle, and}. is the wavelength.
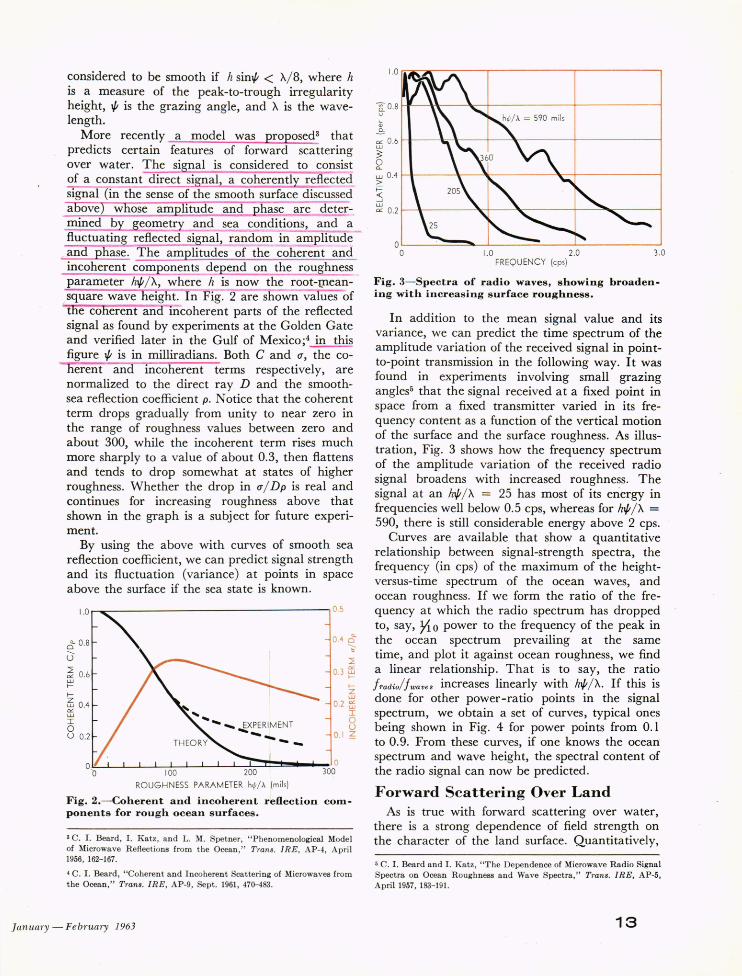
More recently a model was ro osed3 that predicts certain features of forward scattering over water. The si nal is considered to consist of a constant direct si nal, a coherentl reflected signal (in the sense of the smooth surface discussed a ove w ose am litude and p'hase are determined b geometry and sea conditions, and a fluctuating reflected signal, random in amplitude and hase. The amplitudes of the coherent and incoherent com onents de end on the roughness parameter h1f/ }., where h is now the root-tneansquare wave height. In Fig. 2 are shown values of t e co erent an incoherent parts of the reflected signal as found by experiments at the Golden Gate and verified later in the Gulf of Mexico;4 in this figure 1f is in milliradians. Both C and (1, the co-
erent and incoherent terms respectively, are normalized to the direct ray D and the smoothsea reflection coefficient p. Notice that the coherent term drops gradually from unity to near zero in the range of roughness values between zero and about 300, while the incoherent term rises much more sharply to a value of about 0.3, then flattens and tends to drop somewhat at states of higher roughness. Whether the drop in (11 Dp is real and continues for increasing roughness above that shown in the graph is a subject for future experiment.
By using the above with curves of smooth sea reflection coefficient, we can predict signal strength and its fluctuation (variance) at points in space above the surface if the sea state is known.
1.0
c5 0.8
U :2 S5 0.6 f
f-
~ 0.4 S5 I o U 0.2
_~ _______________ 1 0.5
:2 0.3 S5
f-
tZ w
0.2 S5 I o U
0.1 ~
~~-L~~L-L-~-L~-~±;~~~--~3~0~ 100
ROUGHNESS PARAM ETER hl/;/ >" (mils)
Fig. 2.- Coherent and incoherent reflection components for rough ocean surfaces.
3 C. 1. Beard,!. Katz, and L. M. Spetner, " P henomenological Model of Microwave Reflections from the Ocean," Trans . I RE, AP-4, April 1956, 162-167.
4 C. 1. Beard , "Coherent and Incoherent Scattering of Microwaves from t he Ocean ," Trans. IRE, AP-9, Sept. 1961, 470-483.
January - February 1963
1.0 ~--"'----r------,------,
s: 0.8
Q)
.Eo n:: 0.6
3 2 w O.4 Ll-----~--~--------~~1_----------_1 > i= :s ~ 0 . 2 1--\-------~~--~~------+--~~----__1
0 L---~~~~ ____ ~~ __ ~ __________ ~ o 1.0 . 2.0 3.0
FREQU ENCY (cps)
Fig.3- Spectra of radio waves, showing broadening with increasing surface roughness.
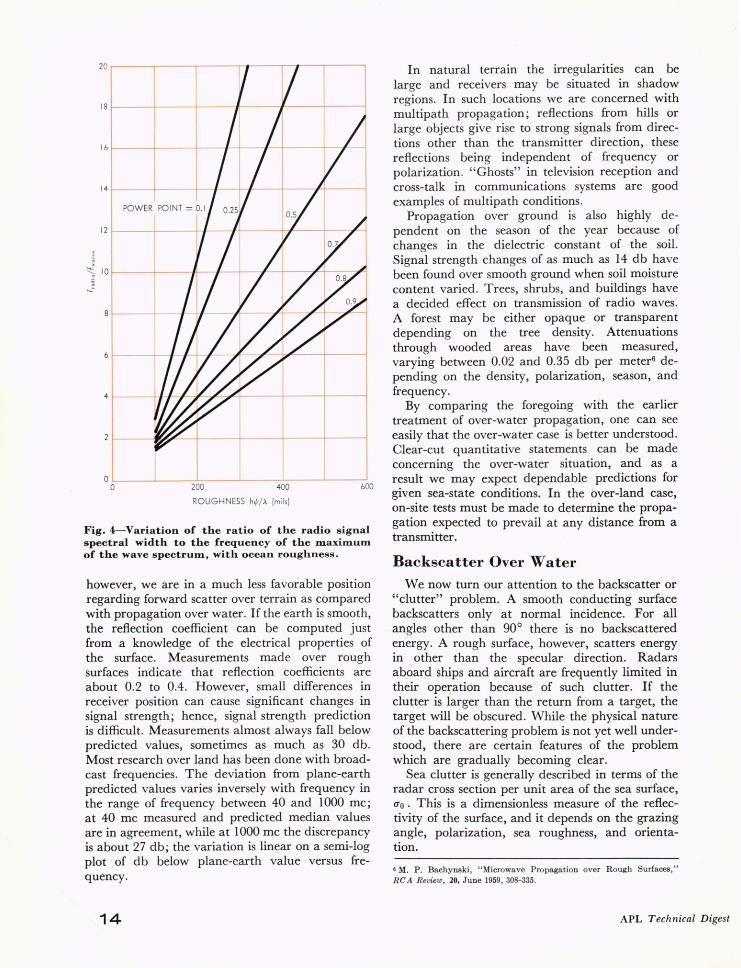
In addition to the mean signal value and its variance, we can predict the time spectrum of the amplitude variation of the received signal in pointto-point transmission in the following way. It was found in experiments involving small grazing angles5 that the signal received at a fixed point in space from a fixed transmitter varied in its frequency content as a function of the vertical motion of the surface and the surface roughness. As illustration, Fig. 3 shows how the frequency spectrum of the amplitude variation of the received radio signal broadens with increased roughne~s. The signal at an hi/; I}. = 25 has most of its energy in frequencies well below 0.5 cps, whereas for h1f/ }. = 590, there is still considerable energy above 2 cps.
Curves are available that show a quantitative relationship between signal-strength spectra, the frequency (in cps) of the maximum of the heightversus-time spectrum of the ocean waves, and ocean roughness. If we form the ratio of the frequency at which the radio spectrum has dropped to, say, Yt 0 power to the frequency of the peak in the ocean spectrum prevailing at the same time, and plot it against ocean roughness, we fi~d a linear relationship. That is to say, the ratIo f d ' If increases linearly with h1f I }.· If this is d~~~ f;;eSother power-ratio points in the signal spectrum, we obtain a set of curves, typical ones being shown in Fig. 4 for power points from 0.1 to 0.9. From these curves, if one knows the ocean spectrum and wave height, the spectral content of the radio signal can now be predicted.
Forward Scattering Over Land As is true with forward scattering over water,
there is a strong dependence of field strength on the character of the land surface. Quantitatively,
5 C. 1. Beard and 1. Katz, " T he Dependence of Microwave R adio Signa l Spectra on Ocean R oughness and Wave Spect ra ," Trans. IRE , AP-5, April 1957, 183-191.
13
2 0 ~----~-----r-----,~----.-~---r-----'
18 ~----4-----~-----+------~------r-----1
1 2 ~----4-----~~---~------~J~--~--~
, ~ 10 ~----4-----~--~-~---~~+----~~---.~
4 ~----+""-I
OL-____ ~ ____ _L ____ ~ ______ ~ ____ ~ ____ ~
o 200 400 600
RO UGHN ESS hofr/ ).. (mils)
Fig.4-Variation of the ratio of the radio signal spectral width to the frequency of the maximum of the wave spectrum, with ocean roughness.
however, we are in a much less favorable position regarding forward scatter over terrain as compared with propagation over water. If the earth is smooth, the reflection coefficient can be computed just from a knowledge of the electrical properties of the surface. Measurements made over rough surfaces indicate that reflection coefficients are about 0.2 to 0.4. However, small differences in receiver position can cause significant changes in signal strength; hence, signal strength prediction is difficult. Measurements almost always fall below predicted values, sometimes as much as 30 db. Most research over land has been done with broadcast frequencies. The deviation from plane-earth predicted values varies inversely with frequency in the range of frequency between 40 and 1000 me; at 40 me measured and predicted median values are in agreement, while at 1000 me the discrepancy is about 27 db; the variation is linear on a semi-log plot of db below plane-earth value versus frequency.
14
In natural terrain the irregularities can be large and receivers may be situated in shadow regions. In such locations we are concerned with multipath propagation; reflections from hills or large objects give rise to strong signals from directions other than the transmitter direction, these reflections being independent of frequency or polarization. "Ghosts" in television reception and cross-talk in communications systems are good examples of multipath conditions.
Propagation over ground is also highly dependent on the season of the year because of changes in the dielectric constant of the soil. Signal strength changes of as much as 14 d b have been found over smooth ground when soil moisture content varied. Trees, shrubs, and buildings have a decided effect on transmission of radio waves. A forest may be either opaque or transparent depending on the tree density. Attenuations through wooded areas have been measured, varying between 0.02 and 0.35 db per meter6 depending on the density, polarization, season, and frequency.
By comparing the foregoing with the earlier treatment of over-water propagation, one can see easily that the over-water case is better understood. Clear-cut quantitative statements can be made concerning the over-water situation, and as a result we may expect dependable predictions for given sea-state conditions. In the over-land case, on-site tests must be made to determine the propagation expected to prevail at any distance from a transmitter.
Backsca tter Over Water
We now turn our attention to the backscatter or "clutter" problem. A smooth conducting surface backscatters only at normal incidence. For all angles other than 90° there is no backscattered energy. A rough surface, however, scatters energy in other than the specular direction. Radars aboard ships and aircraft are frequently limited in their operation because of such clutter. If the clutter is larger than the return from a target, the target will be obscured. While the physical nature of the backscattering problem is not yet well understood, there are certain features of the problem which are gradually becoming clear.
Sea clutter is generally described in terms of the radar cross section per unit area of the sea surface, 0'0. This is a dimensionless measure of the reflectivity of the surface, and it depends on the grazing angle, polarization, sea roughness, and orientation.
6 M. P. Bachynski, "Microwave Propagation over R ough Surfaces," RCA Review, 20. June 1959, 308-335.
APL Technical Digest
~ ~
« 1- ::0-z ~ => . '-.. b
Zu.i OU
20
ID
f= « ~~ - IO Vl~ Vl
O~ - 20 ~ Vl
ULL
:(0 - 30 o « ~
- 40 o 10 20 30 40 50 60 70 80 90
DEPR ESSION ANGLE (degrees)
Fig. 5-Qualitative variation of radar cross section of the sea with depression angle for smooth, intermediate, and rough surface conditions.
Flying over sea surfaces varying from "smooth" to "rough" to determine the ocean cross section versus grazing angle, we would find the following. Under calm water conditions, measurements would indicate a peak in CTO at 90°, with rapidly decreasing values at angles off the vertical as illustrated in Fig. 5. If the wind waves and/ or swell increased, the measured curve would have less of a peak at 90°, but the magnitude of CTO would increase at the smaller angles and would perhaps follow the curve marked "intermediate." For a very rough sea, the CTo-versus-grazing-angle curve would be quite flat.
:0 ~
~
~ < I-
Z
20
10
X· BAN D
o = HORIZ. POLA RIZATION
I:J. = VERT. POLARIZATION
(from Naval Research Laboratory data)
As yet we do not have quantitative measures of roughness for backscattering. If the roughness measured for forward scattering holds for clutter, then at 10° and for X-band (3 cm), for example, it would take ripples of about 2 in. root-me ansquare to make the sea effectively rough. Thus, one would expect to pass from the "smooth" curve to the "rough" curve with only the slightest wind blowing over the sea. "Smooth" conditions for microwaves would indeed be rare.
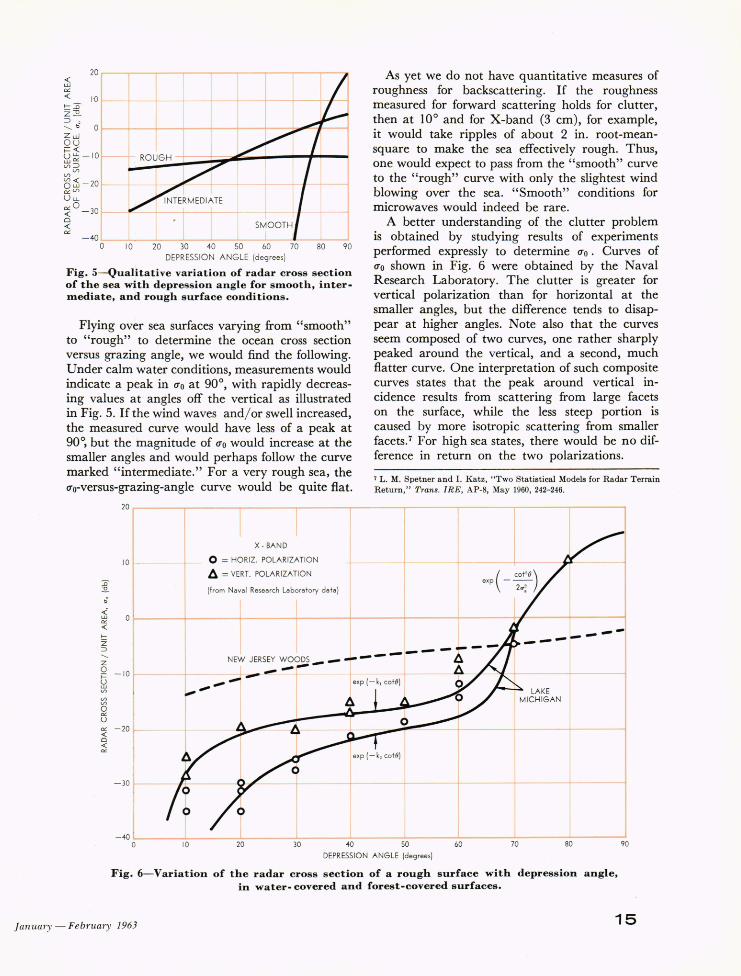
A better understanding of the clutter problem is obtained by studying results of experiments performed expressly to determine CTO. Curves of CTo shown in Fig. 6 were obtained by the Naval Research Laboratory. The clutter is greater for vertical polarization than f<;>r horizontal at the smaller angles, but the difference tends to disappear at higher angles. Note also that the curves seem composed of two curves, one rather sharply peaked around the vertical, and a second, much flatter curve. One interpretation of such composite curves states that the peak around vertical incidence results from scattering from large facets on the surface, while the less steep portion is caused by more isotropic scattering from smaller facets.7 For high sea states, there would be no difference in return on the two polarizations.
7 L. M. Spetner and I. Katz, " Two Sta t istical Models for Radar Terrain Return," Trans. IRE, AP-8, May 1960, 242- 246.
---=> '-z
--NEW JERSEY WOODS __ - ----0 f=
~ Vl
0 oc U
< 0 « ~
- 10
- 20 r--
-30 ~
-40 o
.",""'" ..,"'"
10 20
.",.,.-
30 40 50 60 70 80
DEPR ESSION ANGLE (degrees)
Fig. 6-Variation of the radar cross section of a rough surface with depression angle, in water- covered and forest-covered surfaces.
90
Jan uary - February 1963 15
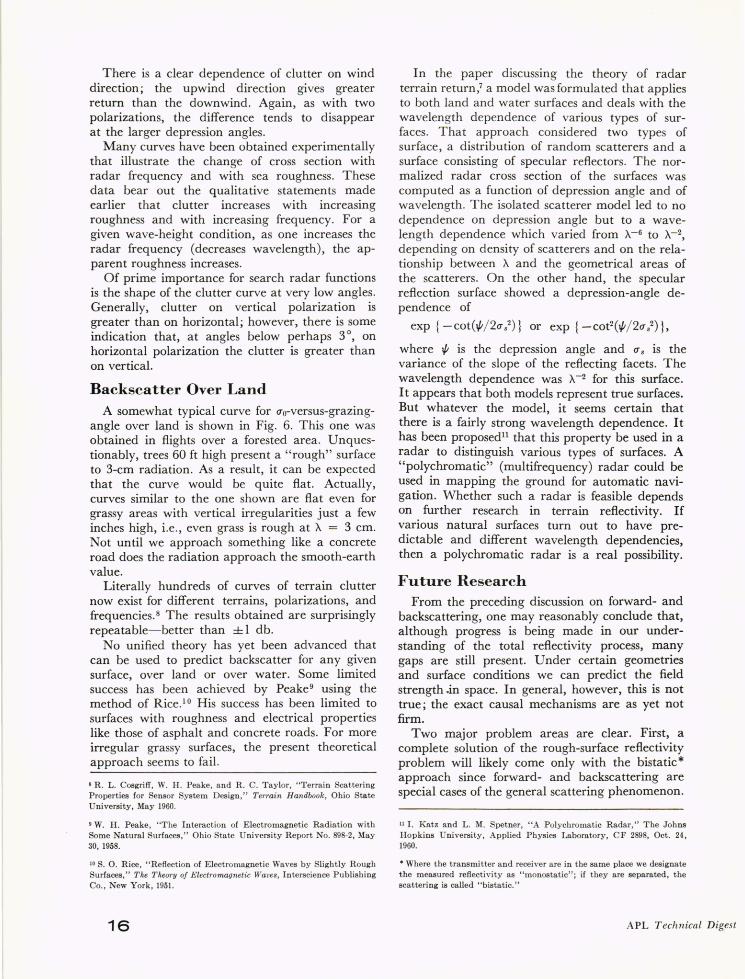
There is a clear dependence of clutter on wind direction; the upwind direction gives greater return than the downwind. Again, as with two polarizations, the difference tends to disappear at the larger depression angles.
Many curves have been obtained experimentally that illustrate the change of cross section with radar frequency and with sea roughness. These data bear out the qualitative statements made earlier that clutter increases with increasing roughness and with increasing frequency. For a given wave-height condition, as one increases the radar frequency (decreases wavelength), the apparent roughness increases.
Of prime importance for search radar functions is the shape of the clutter curve at very low angles. Generally, clutter on vertical polarization is greater than on horizontal; however, there is some indication that, at angles below perhaps 3°, on horizontal polarization the clutter is greater than on vertical.
Backscatter Over Land
A somewhat typical curve for CTo-versus-grazingangle over land is shown in Fig. 6. This one was obtained in flights over a forested area. Unquestionably, trees 60 ft high present a "rough" surface to 3-cm radiation. As a result, it can be expected that the curve would be quite flat. Actually, curves similar to the one shown are flat even for grassy areas with vertical irregularities just a few inches high, i.e., even grass is rough at ~ = 3 cm. Not until we approach something like a concrete road does the radiation approach the smooth-earth value.
Literally hundreds of curves of terrain clutter now exist for different terrains, polarizations, and frequencies. 8 The results obtained are surprisingly repeatable- better than ± I db.
No unified theory has yet been advanced that can be used to predict backscatter for any given surface, over land or over water. Some limited success has been achieved by Peake 9 using the method of Rice. l o His success has been limited to surfaces with roughness and electrical properties like those of asphalt and concrete roads. For more irregular grassy surfaces, the present theoretical approach seems to fail.
8 R . L. Cosgriff, W. H . Peake, and R. C . T aylor , "Terra in Scattering Propert ies for Sensor System Design," Terrain Handbook, Ohio State University , May 1960.
9 W. H. Peake, " T he Interaction of Elect romagnetic Radiation wi t h Some Natural Surfaces, " Ohio State Universi t y Report No. 898-2, May 30, 1958.
10 S. O. Rice, "Refl ection of Electromagnetic Waves by Slightly R ough Surfaces, " The Theory of E lectromagnetic Waves, Interscience P ublishing Co., New York , 1951.
16
In the paper discussing the theory of radar terrain return/ a model was formulated that applies to both land and water surfaces and deals with the wavelength dependence of various types of surfaces . That approach considered two types of surface, a distribution of random scatterers and a surface consisting of specular reflectors. The normalized radar cross section of the surfaces was computed as a function of depression angle and of wavelength. The isolated scatterer model led to no dependence on depression angle but to a wavelength dependence which varied from ~-6 to ~-2, depending on density of scatterers and on the relationship between ~ and the geometrical areas of the scatterers. On the other hand, the specular reflection surface showed a depression-angle dependence of
exp { -cOt(~/2CT 82) } or exp { -cot2(~/2CT 82)},
where ~ is the depression angle and CT 8 is the variance of the slope of the reflecting facets. The wavelength dependence was ~ -2 for this surface. It appears that both models represent true surfaces. But whatever the model, it seems certain that there is a fairly strong wavelength dependence. It has been proposedll that this property be used in a radar to distinguish various types of surfaces. A "polychromatic" (multifrequency) radar could be used in mapping the ground for automatic navigation. Whether such a radar is feasible depends on further research in terrain reflectivity. If various natural surfaces turn out to have predictable and different wavelength dependencies, then a polychromatic radar is a real possibility.
Future Research From the preceding discussion on forward- and
backscattering, one may reasonably conclude that, although progress is being made in our understanding of the total reflectivity process, many gaps are still present. Under certain geometries and surface conditions we can predict the field strength .in space. In general, however, this is not true; the exact causal mechanisms are as yet not firm.
Two major problem areas are clear. First, a complete solution of the rough-surface reflectivity problem will likely come only with the bistatic * approach since forward- and backscattering are special cases of the general scattering phenomenon.
11 1. Kat z and L. M. Spetner, " A Polychromatic Ra dar," The J ohns H opkins University, Applied Physics Labora tory , C F 2898, Oct. 24, 1960.
* Where t he transmitter and receiver are in t he same place we designate the m easured reflectiv ity as "monostatic"; if t hey a re separated, t he scattering is called " bista t ic."
APL T echnical Digest
Secondly, an adequate description of the surface is usually lacking. New research is being conducted in both of these areas; some concepts and trends of this research are discussed below.
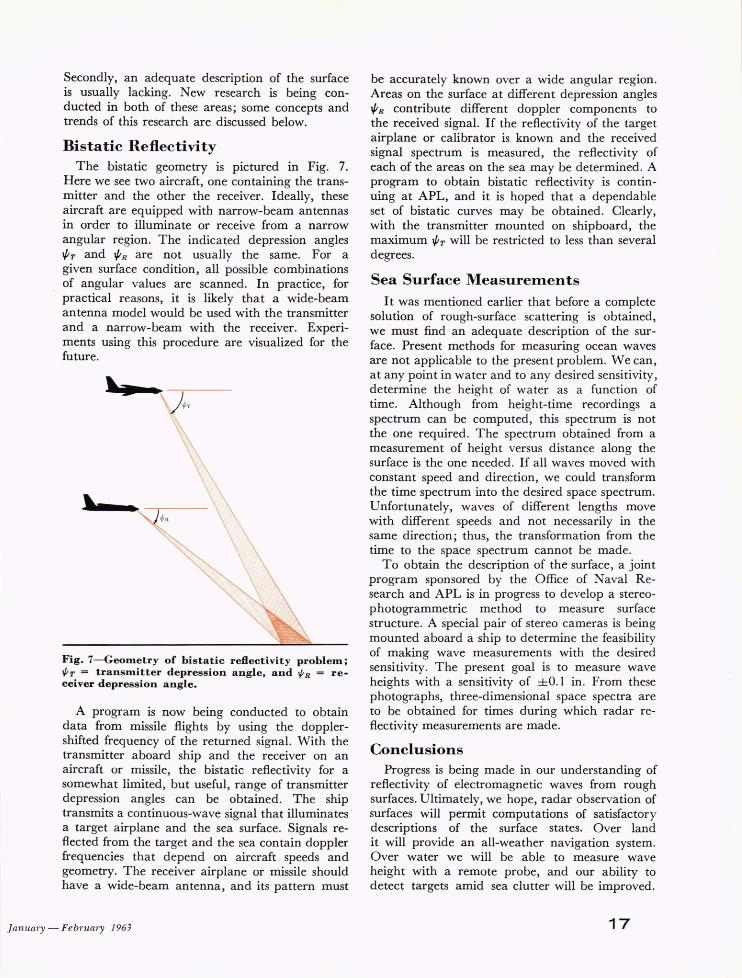
Bistatic Reflectivity The bistatic geometry is pictured in Fig. 7.
Here we see two aircraft, one containing the transmitter and the other the receiver. Ideally, these aircraft are equipped with narrow-beam antennas in order to illuminate or receive from a narrow angular region. The indicated depression angles Y;T and Y;R are not usually the same. For a given surface condition, all possible combinations of angular values are scanned. In practice, for practical reasons, it is likely that a wide-beam antenna model would be used with the transmitter and a narrow-beam with the receiver. Experiments using this procedure are visualized for the future.
,
Fig.7-Geometry of bistatic reflectivity problem; V;T = transmitter depression angle, and V;R = receiver depression angle.
A program is now being conducted to obtain data from missile flights by using the dopplershifted frequency of the returned signal. With the transmitter aboard ship and the receiver on an aircraft or missile, the bistatic reflectivity for a somewhat limited, but useful, range of transmitter depression angles can be obtained. The ship transmits a continuous-wave signal that illuminates a target airplane and the sea surface. Signals reflected from the target and the sea contain doppler frequencies that depend on aircraft speeds and geometry. The receiver airplane or missile should have a wide-beam antenna, and its pattern must
January - February 196)
be accurately known over a wide angular region. Areas on the surface at different depression angles Y;R contribute different doppler components to the received signal. If the reflectivity of the target airplane or calibrator is known and the received signal spectrum is measured, the reflectivity of each of the areas on the sea may be determined. A program to obtain bistatic reflectivity is continuing at APL, and it is hoped that a dependable set of bistatic curves may be obtained. Clearly, with the transmitter mounted on shipboard, the maximum Y;T will be restricted to less than several degrees.
Sea Surface Measurelllents
It was mentioned earlier that before a complete solution of rough-surface scattering is obtained, we must find an adequate description of the surface. Present methods for measuring ocean waves are not applicable to the present problem. We can, at any point in water and to any desired sensitivity, determine the height of water as a function of time. Although from height-time recordings a spectrum can be computed, this spectrum is not the one required. The spectrum obtained from a measurement of height versus distance along the surface is the one needed. If all waves moved with constant speed and direction, we could transform the time spectrum into the desired space spectrum. Unfortunately, waves of different lengths move with different speeds and not necessarily in the same direction; thus, the transformation from the time to the space spectrum cannot be made.
To obtain the description of the surface, a joint program sponsored by the Office of Naval Research and APL is in progress to develop a stereophotogrammetric method to measure surface structure. A special pair of stereo cameras is being mounted aboard a ship to determine the feasibility of making wave measurements with the desired sensitivity. The present goal is to measure wave heights with a sensitivity of ±O.l in. From these photographs, three-dimensional space spectra are to be obtained for times during which radar reflectivity measurements are made.
Conclusions Progress is being made in our understanding of
reflectivity of electromagnetic waves from rough surfaces. Ultimately, we hope, radar observation of surfaces will permit computations of satisfactory descriptions of the surface states. Over land it will provide an all-weather navigation system. Over water we will be able to measure wave height with a remote probe, and our ability to detect targets amid sea clutter will be improved.
17