
Racial Disparities in Military Justice - Protect Our Defenders · i RACIAL DISPARITIES IN MILITARY...
35
Findings of Substantial and Persistent Racial Disparities Within the United States Military Justice System Racial Disparities in Military Justice
Transcript of Racial Disparities in Military Justice - Protect Our Defenders · i RACIAL DISPARITIES IN MILITARY...
Findings of Substantial and Persistent Racial Disparities Within the United States Military Justice System
Racial Disparities in Military Justice


May 5, 2017Protect Our Defenders
AUTHORS:
DON CHRISTENSEN, COL (RET.)Former Chief Prosecutor USAFPresident, Protect Our Defenders
YELENA TSILKERResearch Consultant
CONTRIBUTORS:
ANGELA LEEAdvocacy & Program Associate
MIRANDA PETERSENExecutive Director
JENNIFER WELLSResearch Consultant
Protect Our Defenders (POD) is the only national organization solely dedicated to ending the epidemic of rape and sexual assault in the military and to combating a culture of pervasive misogyny, sexual harassment, and retribution against victims. We honor, support, and give voice to survivors of military sexual assault and sexual harassment – including service members, veterans, and civilians assaulted by members of the military.
Protect Our Defenders deploys a multifaceted effort towards reform. Every day, through policy reform, advocacy, public education, and pro bono support, we work to provide those who serve in our military a safe and respectful environment free from harassment and abuse, and to create a justice system that can fairly and effectively adjudicate these crimes.
These efforts are directly informed by our work with survivors, their families, and current and former military members, and are grounded in our core values.
www.protectourdefenders.com

RACIAL DISPARITIES IN MILITARY JUSTICEi
EXECUTIVE SUMMARY
Protect Our Defenders (POD) is dedicated to exposing and eradicating bias within the military justice system and to ensuring that all service members are afforded a fair, efficient, and impartial system of justice. Through our work, we have witnessed what appeared to be indications of racial disparities in the military justice system. These indicators were consistent with the experiences of POD’s President, Col Don Christensen (ret.), as a military attorney and with data he knew had been tracked by the Air Force for decades.
The military leadership has vigorously opposed any suggestions that the commander-controlled justice system is hindered by conflicts of interest or bias and has gone to great lengths to tout the fairness of the system. A system of justice is fundamentally unfair if, due to inherent bias, it fails to effectively deliver justice. In the military justice system, commanders control who will and will not be punished. When objective evidence demonstrates that the military justice system is fraught with prejudice and bias, that system cannot effectively deliver justice.
On March 7, 2016, because of these apparant racial and ethnic disparities within the military justice system, POD submitted requests under the Freedom of Information Act (FOIA) to each military service branch seeking demographic information on military justice and disciplinary proceedings.
POD received responses from four of the service branches, each of which provided data on service members’ annual military justice and disciplinary involvement broken down by racial and ethnic demographics. This report analyzes this previously unpublished data to examine whether and to what extent there are racial and ethnic disparities within military disciplinary and justice systems. All FOIA responses can be seen in Appendix D, and the full details of POD’s analysis and calculations are included in Appendices B and C.
The data shows that, for every year reported and across all service branches, black service members were substantially more likely than white service members to face military justice or disciplinary action, and these disparities failed to improve or even increased in recent years.
Depending on the service and type of disciplinary or justice action, black service members were at least 1.29 times and as much as 2.61 times more likely than white service members to have an action taken against them in an average year.
Findings for other racial groups varied, with some evidence that non-black people of color may have higher military justice or disciplinary involvement than white service members. The primary exception was Asian service members, who appear to have lower military justice or disciplinary involvement.
AIR FORCE
• From 2006 to 2015, black airmen were 1.71 times (71%) more likely to face court-martial or non-judicial punishment (NJP) than white airmen in an average year. This disparity ranged from 1.49 to 1.94 times more likely in a given year.
• Airmen of a race other than black or white, or whose race was unknown, had higher court-martial and NJP rates than white airmen. However, the inclusion of those whose race is unknown makes it difficult to draw specific conclusions.
KEY FINDINGS:

ii
MARINE CORPS
• From 2006 to 2015, black Marines were 1.32 times (32%) more likely to have a guilty finding at a court-martial or NJP proceeding than white Marines in an average year. This disparity ranged from 1.23 to 1.48 times more likely in a given year.
• The greatest disparities were generally seen for the most serious disciplinary proceedings. In an average year, black Marines were 2.61 times more likely than white Marines to receive a guilty finding at a general court-martial, while they were only 1.29 times more likely than white Marines to receive a guilty finding at an NJP proceeding.
NAVY
• From 2014 to 2015, the only complete years provided by the Navy, black sailors were 1.40 times (40%) more likely than white sailors to be referred to special or general court-martial and 1.37 times more likely to see action taken against them in the case in an average year.
• The disparity between black and white service members nearly disappeared when considering only post-referral outcomes. Black sailors were about equally likely as white sailors to be diverted from harsher military justice action or to receive a conviction at special or general court-martial. However, because black sailors were initially referred at higher rates, they remain disproportionately impacted by the military justice system.
ARMY
• From 2006 to 2015, in an average year, black service members were 1.61 times (61%) more likely to face general or special court-martial compared to white service members.
• The disparity between black and white service members ranged from 1.34 to 1.82 times more likely in any one year.
Racial disparities exist in criminal justice systems throughout the United States. Such disparities are particularly troubling in the military, which is by its nature and structure an imperfect “control” for several factors associated with criminal involvement. For example, new recruits must pass rigorous standards regarding prior criminal justice involvement, educational attainment, and illicit drug use. Further, all service members are, by virtue of their service, employed with a steady income. They are also regularly screened for drug use, resulting in an illicit drug use rate significantly lower than the civilian population.
Despite these equalizing factors, racial disparities are present at every level of military disciplinary and justice proceedings, particularly between black and white service members. The persistence of racial disparities within the military may indicate the existence of racial bias or discrimination among decision-makers in the military justice system.
RACIAL DISPARITIES IN MILITARY JUSTICEiii
RECOMMENDATIONS
The substantial racial disparities within military justice and disciplinary procedures, particularly between black and white service members, strongly indicate the need for aggressive responses to address inequities and ensure that the military has the strongest and best force possible.
To further understand and address these disparities, POD makes the following recommendations:
1. The military justice process should be reformed to empower legally trained military prosecutors, instead of the commander of the accused, to determine when to refer a case to court-martial, thereby reducing the potential for bias based on familiarity, friendship, race, or ethnicity.
2. Each branch of the service should collect and publish consistent racial and ethnic data regarding military justice involvement and outcomes.
3. Data should also be tracked for victims of crimes to determine whether there might be bias regarding victims of particular races or ethnicities.
4. Research should be conducted to assess the underlying causes of existing racial and ethnic discrepancy within military disciplinary and justice systems and to explore steps that can be taken to address inequities.
TABLE OF CONTENTS
Data Requested and Recieved 1
Methodology 2
Findings 4
Air Force (USAF) 4
Marine Corps (USMC) 6
Navy (USN) 10
Army (USA) 13
Conclusion 15
Recommendations 16
Appendix A: Information Received from Each Service Branch A1
Appendix B: Detailed Explanation of the Analytical Process A3
Appendix C: Demographic Data & Calculations A5
Appendix D: Protect Our Defenders’ Freedom of Information Act Requests and Responses from the Department of Defense
A12
RACIAL DISPARITIES IN MILITARY JUSTICE1
DATA REQUESTED AND RECIEVED
DATA REQUESTED
On March 7, 2016, Protect Our Defenders (POD) submitted requests under the Freedom of Information Act (FOIA) to each military service branch, seeking demographic information on disciplinary and military justice proceedings.
POD requested “rates per thousand by race and rank of the subject (defendant) for all General Courts-Martial, Special Courts-Martial, Summary Courts-Martial, and Article 15 non-judicial punishment (NJP) for each year over the past 10 years.” The term “rates per thousand” (RPTs) describes how many service members within a certain demographic group have military justice or other disciplinary involvement per every 1,000 service members of that demographic group, allowing comparison across groups within each branch.
The goal of POD’s analysis was to determine whether and to what extent racial and ethnic disparities exist within military disciplinary systems and the military justice system.
THE DATA POD RECEIVED
We received the following information from each service branch other than the Coast Guard, which did not provide any information:
• The Air Force provided data regarding summary, special, and general court-martial and NJP proceedings conducted from 2006 to 2015. The Air Force did not provide information regarding the outcomes of those proceedings.
• The Marine Corps provided data regarding certain case outcomes—specifically, the number of courts-martial and NJP proceedings that resulted in a guilty finding from 2006 to 2015.
• The Navy provided data on military justice referrals (when a case is sent to special or general court-martial by a commander) and post-referral actions, which included special or general court-martial and their outcomes (a finding of guilty or not guilty), diversion to less serious proceedings where the member would be considered for lesser punishment, or a decision to take no action against the service member. Full-year data was available for 2014 and 2015.
• The Army provided data regarding the combined number of special and general court-martial proceedings conducted from 2006 to 2015. The Army did not provide information regarding case outcomes or NJP proceedings.
A more detailed explantion of the process and the data received is contained in Appendix A.
2
To determine whether racial disparities exist within the military justice system, this report compares rates per thousand (RPTs) within each service branch through the calculation of disparity indices. These measures are described below. More detailed explanations are included in Appendix B.
METHODOLOGY
RATES PER THOUSAND
The military calculates RPTs by dividing the number of individuals of a certain racial group who face a justice or disciplinary action by the total number of service members of that racial group currently serving and then multiplying by 1,000:
RPT=Number of Justice or Disciplinary Actions
x 1,000Total Number of Service Members
For example, in 2015, 344 white airmen faced court-martial out of the 222,374 total white airmen serving that year—an RPT of 1.55. This number means that, for every 1,000 white service members in the USAF, 1.55 were court-martialed in 2006.
DISPARITY INDEX
POD calculated how much more or less likely each demographic group was to face court-martial or NJP proceedings compared to white service members (the majority demographic group in the military) in a given year. To compare RPTs across demographic groups, the RPT for people of color was divided by the RPT for white service members, thus calculating a “disparity index.”
Disparity Index =RPT for Service Members of Color
x 1,000RPT for White Service Members
Because “Hispanic” was treated differently among the service branches – as a mutually exclusive racial group in some cases and as an ethnicity that has overlap with racial groups in others – the comparison group for the above calculation varied slightly across the branches. Table 1 lays out these differences.
TABLE 1: COMPARISON GROUP IN EACH SERVICE BRANCH
COMPARISON GROUP (DENOMINATOR) IN DISPARITY INDEX CALCULATION
ARMY White, although the Army did not indicate whether Hispanic soldiers were included in this category.
AIR FORCE White, including Hispanic and non-Hispanic
NAVY White, including Hispanic in part and excluding Hispanic in part. “Hispanic” was treated as a race in the criminal justice data and as an ethnicity in personnel data. Both data sets were used in the calculation of RPTs.
MARINE CORPS Non-Hispanic White (for comparison with other races)Non-Hispanic (for comparison with Hispanic)

RACIAL DISPARITIES IN MILITARY JUSTICE3
POST-REFERRAL DISPARITY INDICES FOR THE NAVY
Because the Navy (USN) provided disposition information for individual cases, in addition to the above analyses, it was possible to determine whether USN cases were handled differently after initial referral to special or general court-martial. This was done by first determining the proportion of referred cases that had a particular outcome for each demographic group and then comparing these proportions through an adjusted disparity index calculation, as shown below:
Proportion=Number of USN Members with a Given Case Outcome in a Racial Group
x 1,000Total Number of Case Referrals for Racial Group
Post-Referral Disparity Index =
Number of USN Members with a Given Case Outcome in a Racial Group x 1,000
Total Number of Case Referrals for Racial Group
These post-referral disparity indices help demonstrate if there are differences in how harshly service members are treated after becoming involved with the military justice system.
4
FINDINGS
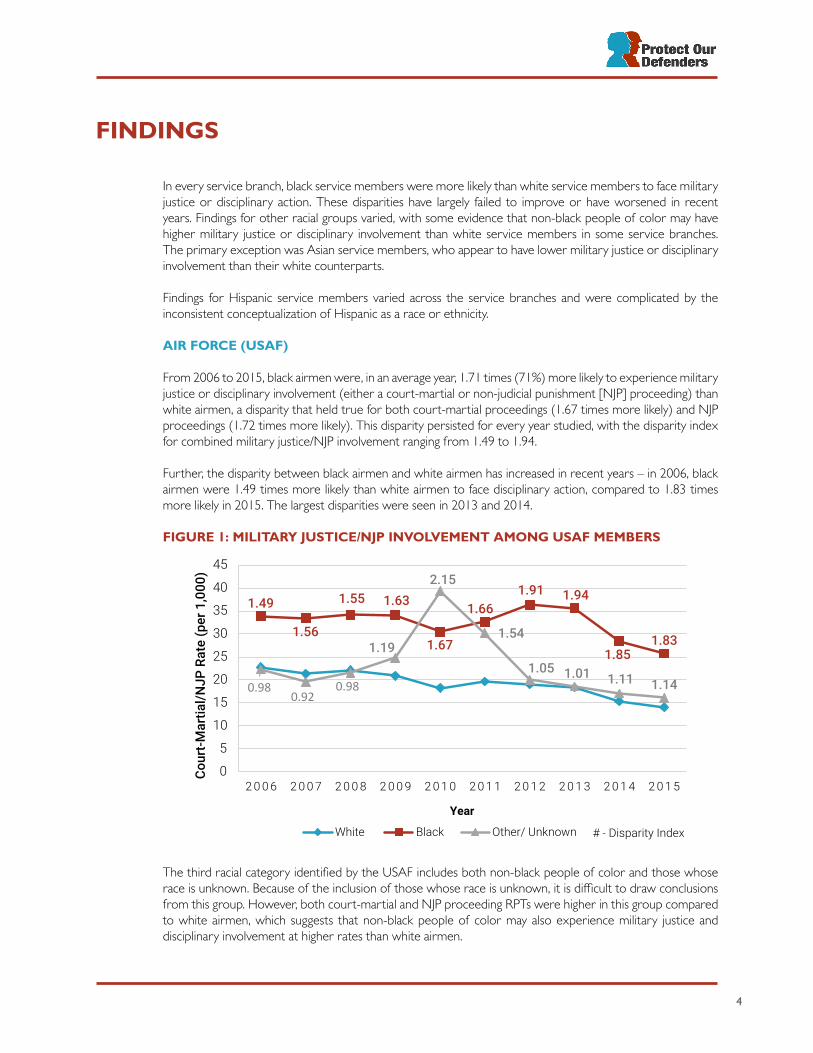
In every service branch, black service members were more likely than white service members to face military justice or disciplinary action. These disparities have largely failed to improve or have worsened in recent years. Findings for other racial groups varied, with some evidence that non-black people of color may have higher military justice or disciplinary involvement than white service members in some service branches. The primary exception was Asian service members, who appear to have lower military justice or disciplinary involvement than their white counterparts.
Findings for Hispanic service members varied across the service branches and were complicated by the inconsistent conceptualization of Hispanic as a race or ethnicity.
AIR FORCE (USAF)
From 2006 to 2015, black airmen were, in an average year, 1.71 times (71%) more likely to experience military justice or disciplinary involvement (either a court-martial or non-judicial punishment [NJP] proceeding) than white airmen, a disparity that held true for both court-martial proceedings (1.67 times more likely) and NJP proceedings (1.72 times more likely). This disparity persisted for every year studied, with the disparity index for combined military justice/NJP involvement ranging from 1.49 to 1.94.
Further, the disparity between black airmen and white airmen has increased in recent years – in 2006, black airmen were 1.49 times more likely than white airmen to face disciplinary action, compared to 1.83 times more likely in 2015. The largest disparities were seen in 2013 and 2014.
FIGURE 1: MILITARY JUSTICE/NJP INVOLVEMENT AMONG USAF MEMBERS
The third racial category identified by the USAF includes both non-black people of color and those whose race is unknown. Because of the inclusion of those whose race is unknown, it is difficult to draw conclusions from this group. However, both court-martial and NJP proceeding RPTs were higher in this group compared to white airmen, which suggests that non-black people of color may also experience military justice and disciplinary involvement at higher rates than white airmen.
White Black Other/ Unknown
1.49
1.56
1.55 1.63
1.67
1.661.91 1.94
1.851.83
0.980.92
0.98
1.19
2.15
1.54
1.05 1.01 1.11 1.14
0
5
10
15
20
25
30
35
40
45
2 0 0 6 2 0 0 7 2 0 0 8 2 0 0 9 2 0 1 0 2 0 1 1 2 0 1 2 2 0 1 3 2 0 1 4 2 0 1 5
Year
Cour
t-Mar
tial/N
JP R
ate
(per
1,0
00)
# - Disparity Index
RACIAL DISPARITIES IN MILITARY JUSTICE5
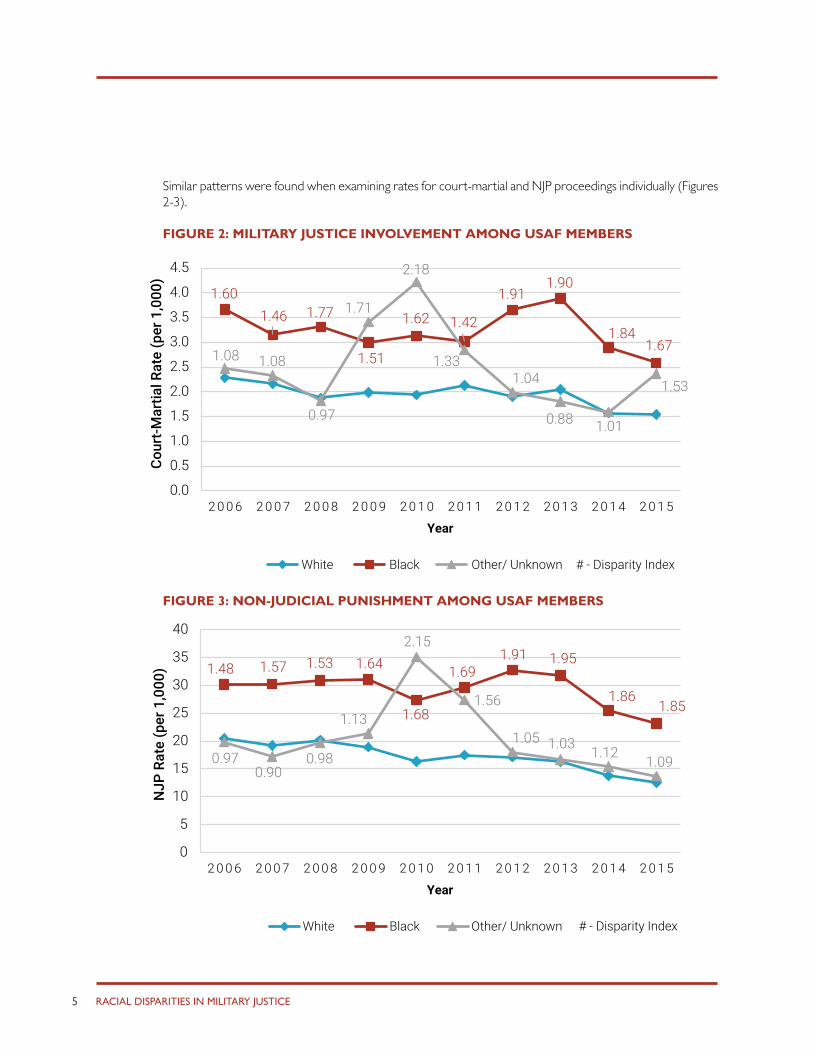
Similar patterns were found when examining rates for court-martial and NJP proceedings individually (Figures 2-3).
FIGURE 2: MILITARY JUSTICE INVOLVEMENT AMONG USAF MEMBERS
FIGURE 3: NON-JUDICIAL PUNISHMENT AMONG USAF MEMBERS
1.601.46 1.77
1.51
1.62 1.42
1.911.90
1.841.67
1.08 1.08
0.97
1.71
2.18
1.331.04
0.88 1.01
1.53
0.0
0.5
1.0
1.5
2.0
2.5
3.0
3.5
4.0
4.5
2 0 0 6 2 0 0 7 2 0 0 8 2 0 0 9 2 0 1 0 2 0 1 1 2 0 1 2 2 0 1 3 2 0 1 4 2 0 1 5
Year
White Black Other/ Unknown
Cour
t-Mar
tial R
ate
(per
1,0
00)
# - Disparity Index
1.48 1.57 1.53 1.64
1.68
1.691.91 1.95
1.861.85
0.970.90
0.98
1.13
2.15
1.56
1.05 1.03 1.12 1.09
0
5
10
15
20
25
30
35
40
2 0 0 6 2 0 0 7 2 0 0 8 2 0 0 9 2 0 1 0 2 0 1 1 2 0 1 2 2 0 1 3 2 0 1 4 2 0 1 5
NJP
Rat
e (p
er 1
,000
)
Year
White Black Other/ Unknown # - Disparity Index

6
MARINE CORPS (USMC)
The most significant racial disparities in the USMC were seen for black service members. From 2006 to 2015, black Marines were 1.32 times more likely than white Marines to receive a guilty finding at court-martial or NJP in an average year. The disparity persisted during each year analyzed, with the disparity index ranging from 1.23 to 1.48. Further, even as overall findings of guilt have fallen since 2006, the disparity between black and white Marines has grown.
FIGURE 4: GUILTY FINDINGS AT COURT-MARTIAL OR NJP AMONG USMC MEMBERS
The disparity between black and white Marines persisted at each type of proceeding and was highest in the most serious disciplinary forums (Figures 5-8). In an average year, black Marines were 2.61 times more likely to receive a guilty finding at a general court-martial than white Marines, while, at an NJP proceeding, black Marines were only 1.29 times more likely than white Marines to receive a guilty finding. General courts-martial are typically reserved for more serious offenses, and a guilty finding at general court-martial often carries more severe ramifications, including a criminal record and potential incarceration. Overall, the more serious the proceeding, the greater was the disparity between black and white Marines.
1.26
1.231.23 1.23 1.30
1.37
1.31
1.33
1.46
1.48
1.20
1.201.09 1.04
0.970.98
0.93
0.96
1.01
0.94
1.06
1.021.00 0.96
1.02
0.910.94
0.97 0.98 1.06
30
40
50
60
70
80
90
100
2 0 0 6 2 0 0 7 2 0 0 8 2 0 0 9 2 0 1 0 2 0 1 1 2 0 1 2 2 0 1 3 2 0 1 4 2 0 1 5
Year
White Black Other/ Unknown Hispanic
Cour
t-Mar
tial/N
JP G
uilty
Fin
ding
Rat
e (p
er 1
,000
)
# - Disparity Index

RACIAL DISPARITIES IN MILITARY JUSTICE7
FIGURE 5: GUILTY FINDINGS AT NJP AMONG USMC MEMBERS
FIGURE 6: GUILTY FINDINGS AT SUMMARY COURT-MARTIAL AMONG USMC MEMBERS
1.21
1.201.16
1.19 1.271.35
1.29
1.28
1.44
1.45
1.20
1.171.05 1.01
0.990.97
0.930.96
1.00
0.94
1.05
1.010.99
0.94
1.03
0.920.93
0.97 0.99 1.04
30
35
40
45
50
55
60
65
70
75
80
2 0 0 6 2 0 0 7 2 0 0 8 2 0 0 9 2 0 1 0 2 0 1 1 2 0 1 2 2 0 1 3 2 0 1 4 2 0 1 5
NJP
Gui
lty F
indi
ng R
ate
(per
1,0
00)
Year
White Black Other/ Unknown Hispanic # - Disparity Index
1.40
0.97
1.361.27
1.27
1.24
1.341.45
1.381.84
1.13
1.29
1.08
1.20
0.820.97
0.85 0.930.95
0.87
1.000.85 0.90
1.11
0.87
0.770.97
0.910.84
1.13
0
2
4
6
8
10
12
2 0 0 6 2 0 0 7 2 0 0 8 2 0 0 9 2 0 1 0 2 0 1 1 2 0 1 2 2 0 1 3 2 0 1 4 2 0 1 5
1,00
0)
Year
White Black Other/ Unknown Hispanic
Sum
mar
y Co
urt-M
artia
l Gui
lty F
indi
ng R
ate
(per
# - Disparity Index

8
FIGURE 7: GUILTY FINDINGS AT SPECIAL COURT-MARTIAL AMONG USMC MEMBERS
FIGURE 8: GUILTY FINDINGS AT GENERAL COURT-MARTIAL AMONG USMC MEMBERS
1.632.21
1.98
1.52
1.71 1.80
1.54
2.60
1.851.83
1.29
1.441.59
1.05
0.91
1.301.11
0.90
1.421.41
1.30
1.311.24
0.95 1.13 1.35
1.11 1.01
0.721.21
0
1
2
3
4
5
6
7
2 0 0 6 2 0 0 7 2 0 0 8 2 0 0 9 2 0 1 0 2 0 1 1 2 0 1 2 2 0 1 3 2 0 1 4 2 0 1 5Year
White Black Other/ Unknown Hispanic
Spec
ial C
ourt
-Martia
l Gui
lty F
indi
ng R
ate
(per
1,0
00)
# - Disparity Index

RACIAL DISPARITIES IN MILITARY JUSTICE9
Overall rates of guilty findings were similar among Hispanic, other/unknown, and non-Hispanic white Marines, though the size of any racial differences varied across types of disciplinary proceedings, with growing disparities for more serious proceedings (Figures 4-8). Marines of an other or unknown race were generally more likely than non-Hispanic white Marines to receive a guilty finding at general court-martial, though the inclusion of those of an unknown race complicates conclusions about this data. Hispanic Marines were 1.40 times more likely than non-Hispanic white Marines to receive a guilty finding at general court-martial in an average year.
There was little difference in combined military justice/NJP involvement between Hispanic and non-Hispanic Marines, though Hispanic Marines were somewhat less likely than non-Hispanic Marines to have a guilty finding at court-martial or NJP (Figure 9).
FIGURE 9: GUILTY FINDINGS AT COURT-MARTIAL OR NJP AMONG HISPANIC AND NON-HISPANIC USMC MEMBERS
1.01
0.970.97 0.93 0.98
0.88
0.91
0.930.93
1.00
30
35
40
45
50
55
60
65
70
75
80
2 0 0 6 2 0 0 7 2 0 0 8 2 0 0 9 2 0 1 0 2 0 1 1 2 0 1 2 2 0 1 3 2 0 1 4 2 0 1 5
(per
1,0
00)
Year
Non-Hispanic Hispanic
Cour
t-Mar
tial/N
JP G
uilty
Fin
ding
Rat
e
# - Disparity Index
10
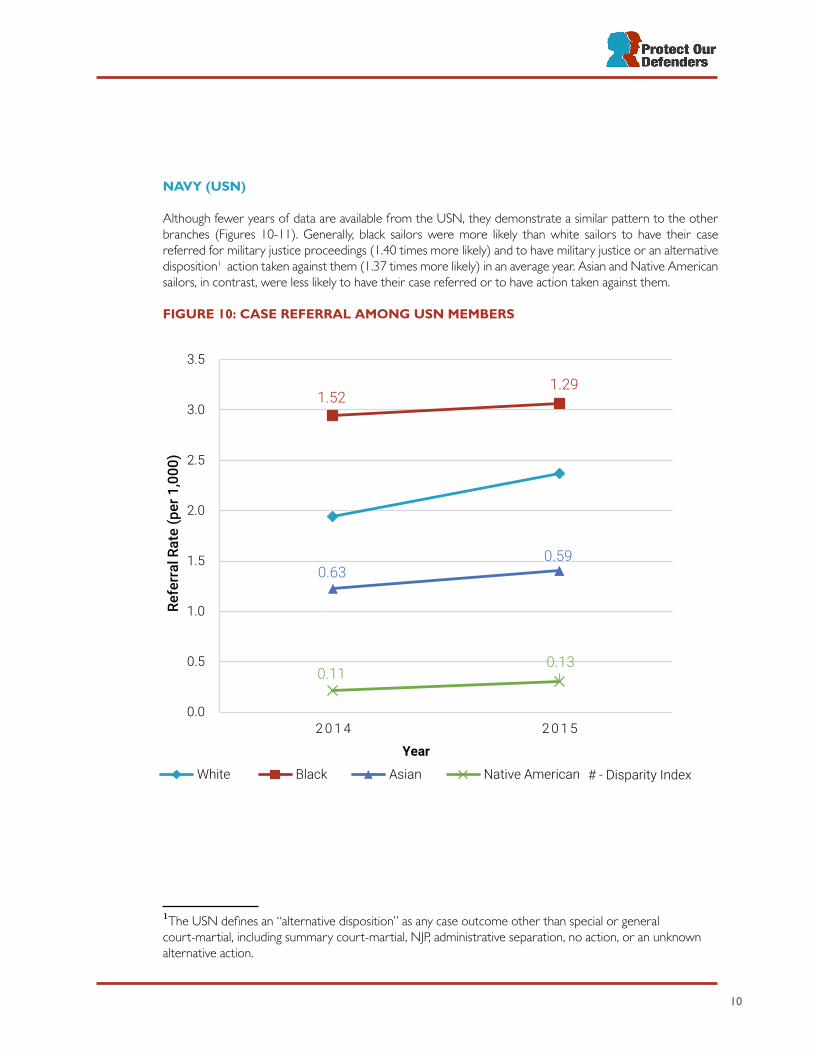
NAVY (USN)
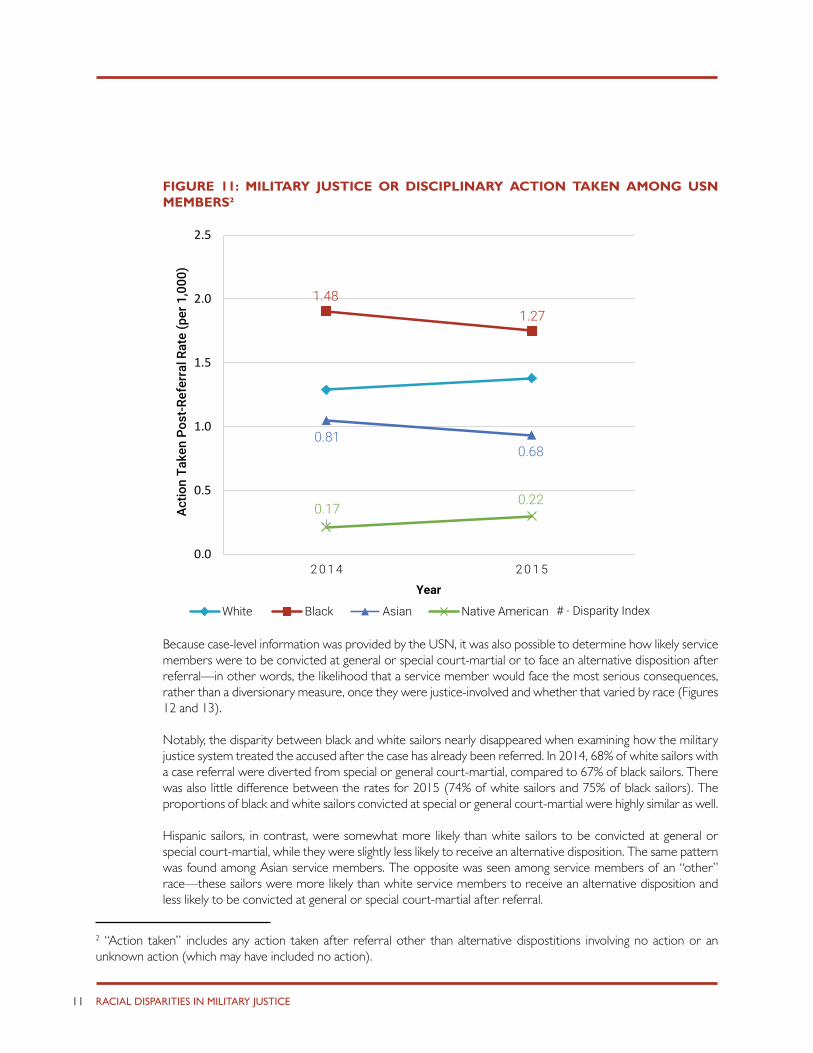
Although fewer years of data are available from the USN, they demonstrate a similar pattern to the other branches (Figures 10-11). Generally, black sailors were more likely than white sailors to have their case referred for military justice proceedings (1.40 times more likely) and to have military justice or an alternative disposition1 action taken against them (1.37 times more likely) in an average year. Asian and Native American sailors, in contrast, were less likely to have their case referred or to have action taken against them.
FIGURE 10: CASE REFERRAL AMONG USN MEMBERS
1The USN defines an “alternative disposition” as any case outcome other than special or general court-martial, including summary court-martial, NJP, administrative separation, no action, or an unknown alternative action.
1.521.29
0.630.59
0.110.13
0.0
0.5
1.0
1.5
2.0
2.5
3.0
3.5
2 0 1 4 2 0 1 5
Refe
rral
Rat
e (p
er 1
,000
)
Year
White Black Asian Native American # - Disparity Index
RACIAL DISPARITIES IN MILITARY JUSTICE11
FIGURE 11: MILITARY JUSTICE OR DISCIPLINARY ACTION TAKEN AMONG USN MEMBERS2
1.481.27
0.810.68
0.170.22
0.0
0.5
1.0
1.5
2.0
2.5
2 0 1 4 2 0 1 5
Year
White Black Asian Native American
Actio
n Ta
ken
Post
-Ref
erra
l Rat
e (p
er 1
,000
)
# - Disparity Index
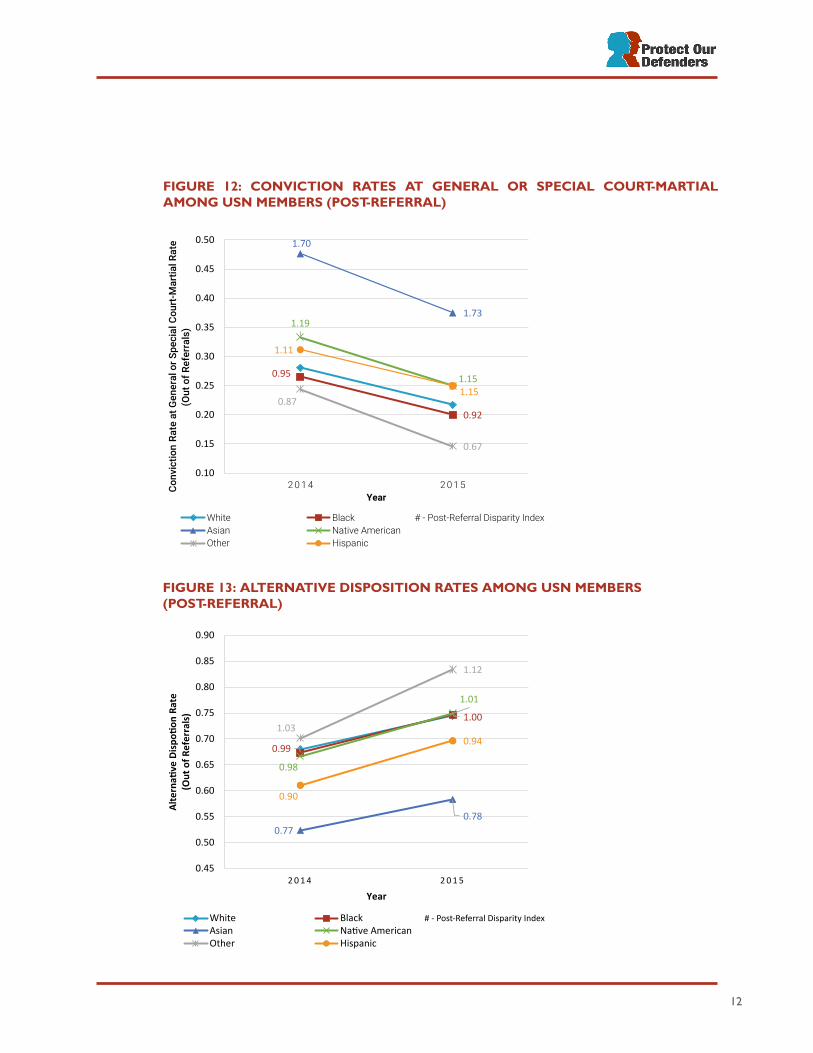
Because case-level information was provided by the USN, it was also possible to determine how likely service members were to be convicted at general or special court-martial or to face an alternative disposition after referral—in other words, the likelihood that a service member would face the most serious consequences, rather than a diversionary measure, once they were justice-involved and whether that varied by race (Figures 12 and 13).
Notably, the disparity between black and white sailors nearly disappeared when examining how the military justice system treated the accused after the case has already been referred. In 2014, 68% of white sailors with a case referral were diverted from special or general court-martial, compared to 67% of black sailors. There was also little difference between the rates for 2015 (74% of white sailors and 75% of black sailors). The proportions of black and white sailors convicted at special or general court-martial were highly similar as well.
Hispanic sailors, in contrast, were somewhat more likely than white sailors to be convicted at general or special court-martial, while they were slightly less likely to receive an alternative disposition. The same pattern was found among Asian service members. The opposite was seen among service members of an “other” race—these sailors were more likely than white service members to receive an alternative disposition and less likely to be convicted at general or special court-martial after referral.
2 “Action taken” includes any action taken after referral other than alternative dispostitions involving no action or an unknown action (which may have included no action).
12
FIGURE 12: CONVICTION RATES AT GENERAL OR SPECIAL COURT-MARTIAL AMONG USN MEMBERS (POST-REFERRAL)
FIGURE 13: ALTERNATIVE DISPOSITION RATES AMONG USN MEMBERS (POST-REFERRAL)
0.95
0.92
1.70
1.731.19
1.15
0.87
0.67
1.11
1.15
0.10
0.15
0.20
0.25
0.30
0.35
0.40
0.45
0.50
2 0 1 4 2 0 1 5
(Out
of R
efer
rals
)
Year
White BlackAsian Native AmericanOther Hispanic
Conv
ictio
n Ra
te a
t Gen
eral
or S
peci
al C
ourt
-Mar
tial R
ate
# - Post-Referral Disparity Index
0.99
1.00
0.770.78
0.98
1.01
1.03
1.12
0.90
0.94
0.45
0.50
0.55
0.60
0.65
0.70
0.75
0.80
0.85
0.90
2 0 1 4 2 0 1 5
Alte
rnati
ve D
ispo
tion
Rate
(Out
of R
efer
rals
)
Year
White BlackAsian Native AmericanOther Hispanic
# - Post-Referral Disparity Index

RACIAL DISPARITIES IN MILITARY JUSTICE13
ARMY (USA)
Black USA members were 1.61 times more likely to face general or special court-martial compared to white service members in an average year. This disparity existed every year from 2006 to 2015, with the disparity index ranging from 1.34 to 1.82. Although the highest disparity was seen in 2006 (1.82 times more likely), rates for 2015 (1.76 times more likely) remained high.
FIGURE 14: MILITARY JUSTICE INVOLVEMENT AMONG USA MEMBERS (1)
Military justice involvement varied across other racial groups (Figures 15-16). For example, Asian soldiers were less likely than white soldiers to face special or general court-martial during every year from 2006 to 2015, while the comparison between white soldiers and American Indian/Alaskan Native soldiers varied dramatically from year to year. Again, the other/unknown group appears to have higher military justice involvement than white soldiers, but because of the inclusion of service members of unknown race in this category, it is difficult to draw conclusions about this data.

14
FIGURE 15: MILITARY JUSTICE INVOLVEMENT AMONG USA MEMBERS (2)
FIGURE 16: MILITARY JUSTICE INVOLVEMENT AMONG USA MEMBERS (3)
0.62
0.95
0.49
0.67
0.62 0.59 0.48
0.61
0.96
0.55
1.06 0.94
1.04 0.93
0.81
1.09
1.17
0.71
1.25
1.87
0.5
1.0
1.5
2.0
2.5
3.0
2 0 0 6 2 0 0 7 2 0 0 8 2 0 0 9 2 0 1 0 2 0 1 1 2 0 1 2 2 0 1 3 2 0 1 4 2 0 1 5
Gen
eral
or S
peci
al C
ourt
-Martia
l Rat
e (p
er 1
,000
)
Year
White Asian American Indian/ Alaskan Native # - Disparity Index
0.650.85 0.86
0.66 0.67 0.690.69 0.71
0.55 0.59
1.25
1.62
1.08 1.161.36
2.65
3.06
2.58
2.57
3.78
0.5
1.5
2.5
3.5
4.5
5.5
6.5
2 0 0 6 2 0 0 7 2 0 0 8 2 0 0 9 2 0 1 0 2 0 1 1 2 0 1 2 2 0 1 3 2 0 1 4 2 0 1 5
Gen
eral
or S
peci
al C
ourt
-Martia
l Rat
e (p
er 1
,000
)
Year
White Hispanic Other /Unknown # - Disparity Index

RACIAL DISPARITIES IN MILITARY JUSTICE15
CONCLUSION
Over the past decade, racial disparities have persisted in the military justice system without indications of improvement. These disparities are particularly striking for black service members, who face military justice or disciplinary action at much higher rates than white service members in every service branch. In fact, the size of the disparity between white and black service members’ military justice involvement has remained consistent over the years and, in the case of the Air Force and Marine Corps, has increased.
Evidence for other racial groups was mixed. For example, Asian service members appear to have lower military justice or disciplinary involvement than their white counterparts, although this data was only available from the Army and the Navy. However, combined groups of non-black service members of color (and typically those of unknown race) often had higher military justice or disciplinary involvement. As such, it appears likely that disparities also exist for other racial groups, but the size and nature of these disparities may vary by race and service branch.
Troublingly, in the USMC, racial disparities grew worse for more serious proceedings. For example, while black Marines were more likely than white Marines to receive a guilty finding at an NJP proceeding, the size of this disparity doubled for general courts-martial. A similar pattern was seen for other non-black racial groups of color. This dynamic leaves non-white service members in the USMC at particular risk of severe military justice or disciplinary consequences, such as a criminal record and incarceration, with lifelong ramifications.
The existence of racial disparities within the military justice system is not atypical. Studies of the United States civilian justice system have found racial disparities at all stages of the justice system proceeding, from arrest to parole decisions. However, the military is unique in that due to its nature as an employer, its screening procedures for new recruits, and frequent random drug testing, it acts as a natural though imperfect control for several factors associated with criminal justice involvement. These factors include educational attainment, employment, prior or current illicit drug use, and prior criminal history3. Despite these equalizing factors, racial disparities are present at every level of military disciplinary and justice proceedings.
The persistence of racial disparities within military justice and disciplinary proceedings, particularly among black service members as compared to white service members, may indicate the existence of racial bias or discrimination among decision-makers in the military justice system. Within the military, these decision-makers are commanders.
It is critical that these disparities be further examined and addressed by the military, so that service members are assured access to fair, impartial justice. This is critical to maintaining a diverse force and vital to maintaining the strongest and most lethal military in the world.
3 Veronica Rose, “Military Service and Misdemeanor Convictions,” OLR Research Report, July 7, 2005, https://www.cga.ct.gov/2005/rpt/2005-r-0556.htm; “Join the Military,” USAGov, last accessed March 28, 2017, https://www.usa.gov/join-military; Christopher Diamond, “DoD expands drug testing for military applicants,” Military Times, March 9, 2017, http://www.militarytimes.com/articles/dod-expands-drug-testing-for-military-applicants; “Substance Abuse in the Military,” National Institute of Health National Institute on Drug Abuse, last modified March 2013, https://www.drugabuse.gov/publications/drugfacts/substance-abuse-in-military; Ashley Nellis, “The Color of Justice: Racial and Ethnic Disparity in State Prisons - Drivers of Disparity,” The Sentencing Project, http://www.sentencingproject.org/publications/color-of-justice-racial-and-ethnic-disparity-in-state-prisons/#IV.
16
RECOMMENDATIONS
To further understand and address these disparities, Protect Our Defenders makes the following recommendations:
1. The military justice process should be reformed to empower legally trained military prosecutors, instead of the commander of the accused, to determine when to refer a case to court-martial, thereby reducing the potential for bias based on familiarity, friendship, race, or ethnicity.
2. Each branch of the service should collect and publish consistent racial and ethnic data regarding military justice involvement and outcomes.
3. Data should also be tracked for victims of crimes to determine whether there might be bias regarding victims of particular races or ethnicities.
4. Research should be conducted to assess the underlying causes of existing racial and ethnic discrepancy within military disciplinary and justice systems and to explore steps that can be taken to address inequities.
RACIAL DISPARITIES IN MILITARY JUSTICEA1
APPENDIX A: INFORMATION RECEIVED FROM EACH SERVICE BRANCH
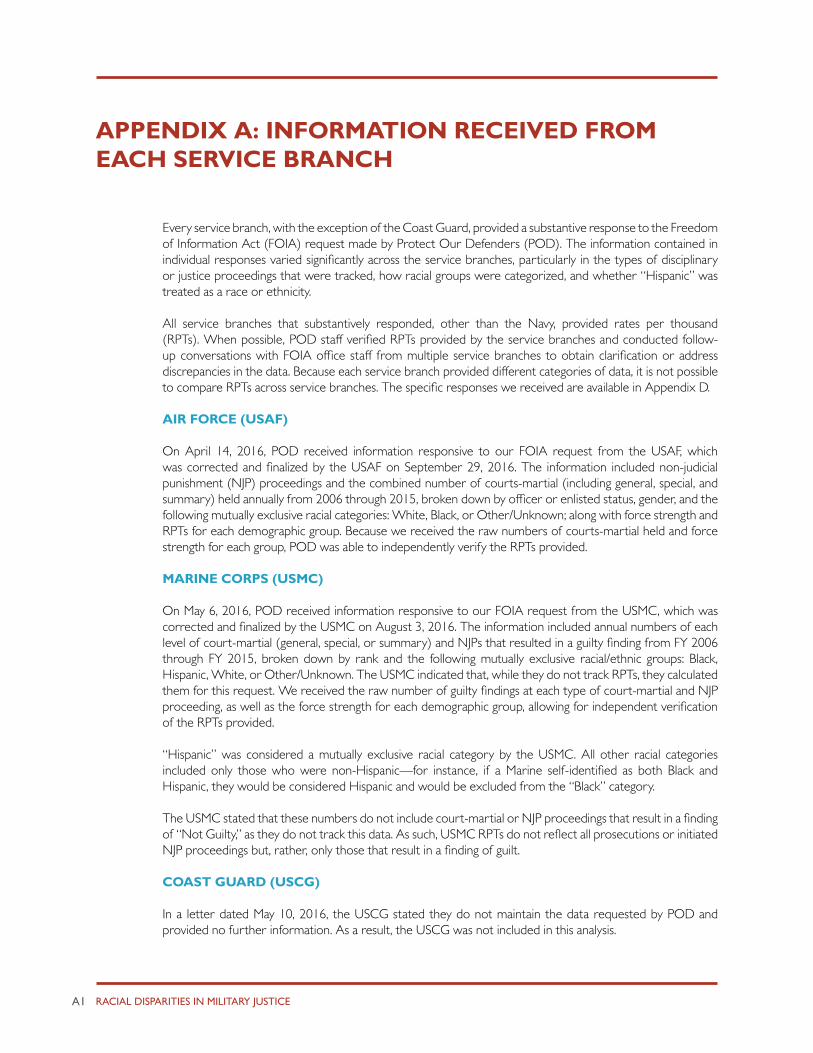
Every service branch, with the exception of the Coast Guard, provided a substantive response to the Freedom of Information Act (FOIA) request made by Protect Our Defenders (POD). The information contained in individual responses varied significantly across the service branches, particularly in the types of disciplinary or justice proceedings that were tracked, how racial groups were categorized, and whether “Hispanic” was treated as a race or ethnicity.
All service branches that substantively responded, other than the Navy, provided rates per thousand (RPTs). When possible, POD staff verified RPTs provided by the service branches and conducted follow-up conversations with FOIA office staff from multiple service branches to obtain clarification or address discrepancies in the data. Because each service branch provided different categories of data, it is not possible to compare RPTs across service branches. The specific responses we received are available in Appendix D.
AIR FORCE (USAF)
On April 14, 2016, POD received information responsive to our FOIA request from the USAF, which was corrected and finalized by the USAF on September 29, 2016. The information included non-judicial punishment (NJP) proceedings and the combined number of courts-martial (including general, special, and summary) held annually from 2006 through 2015, broken down by officer or enlisted status, gender, and the following mutually exclusive racial categories: White, Black, or Other/Unknown; along with force strength and RPTs for each demographic group. Because we received the raw numbers of courts-martial held and force strength for each group, POD was able to independently verify the RPTs provided.
MARINE CORPS (USMC)
On May 6, 2016, POD received information responsive to our FOIA request from the USMC, which was corrected and finalized by the USMC on August 3, 2016. The information included annual numbers of each level of court-martial (general, special, or summary) and NJPs that resulted in a guilty finding from FY 2006 through FY 2015, broken down by rank and the following mutually exclusive racial/ethnic groups: Black, Hispanic, White, or Other/Unknown. The USMC indicated that, while they do not track RPTs, they calculated them for this request. We received the raw number of guilty findings at each type of court-martial and NJP proceeding, as well as the force strength for each demographic group, allowing for independent verification of the RPTs provided.
“Hispanic” was considered a mutually exclusive racial category by the USMC. All other racial categories included only those who were non-Hispanic—for instance, if a Marine self-identified as both Black and Hispanic, they would be considered Hispanic and would be excluded from the “Black” category.
The USMC stated that these numbers do not include court-martial or NJP proceedings that result in a finding of “Not Guilty,” as they do not track this data. As such, USMC RPTs do not reflect all prosecutions or initiated NJP proceedings but, rather, only those that result in a finding of guilt.
COAST GUARD (USCG)
In a letter dated May 10, 2016, the USCG stated they do not maintain the data requested by POD and provided no further information. As a result, the USCG was not included in this analysis.

A2
UNITED STATES NAVY (USN)
In a reply dated June 7, 2016, POD received information responsive to our FOIA request from the USN. Like several other service branches, the USN does not internally calculate or track RPTs. Instead, the USN provided case-level information retrieved from the Navy Case Management System (CMS) for USN and USMC members whose cases were handled by a Navy Regional Legal Services Offices Trial Department from FY 2014 through the middle of FY 2016. The CMS tracks case outcomes for any case that is referred – i.e. when a military commander sends a case to special or general court-martial. Case outcomes included a guilty or not guilty finding at general or special court-martial, as well as the following “alternative dispositions:” summary court-martial, NJP, administrative separation, no action, and unknown alternative disposition. In the USN, any alternative disposition can be considered a diversionary measure from harsher military justice involvement.
The USN also provided total force data as of May 18, 2016 and a link to an online USN document containing force data for FY 2015 (data as of March 31, 2015). Personnel data for FY 2014 was retrieved from the Department of Defense (DOD) report, 2014 Demographics: Profile of the Military Community4.
Because individual case information was included, it was possible to separate out cases involving only USN members and to then compare those numbers to force strength information, allowing POD to calculate RPTs for the USN. However, due to differences in how the criminal justice and personnel data track demographics, these calculations may not be fully accurate. Specifically, criminal justice demographic groups included the following mutually exclusive categories: Asian, Black, Caucasian, Hispanic, Native American, Other, and Unknown. Personnel racial categories included the following, somewhat different, categories: American Indian/Alaskan Native, Asian, Black, Native Hawaiian/Other Pacific Islander, White, Multiple Race Codes, and Decline to Respond, with Hispanic treated as an ethnic category that overlaps with racial categories. Because “Hispanic” was treated as a mutually exclusive racial category in the criminal justice data and as an ethnicity that overlaps with racial groups in the personnel data, even identical-sounding racial groups (such as “Black”) were not fully consistent between the two datasets.
Due to the above inconsistencies, conclusions that rely on both USN criminal justice and personnel information (i.e. RPT and “disparity index” calculations for the USN) are limited. However, for the USN, POD was also able to calculate a “post-referral disparity index” using only criminal justice data, which did not suffer from the same underlying issues.
UNITED STATES ARMY (USA)
In a letter dated December 20, 2016, the USA provided POD with information responsive to our FOIA request. The information POD received included the combined number of general and special courts-martial held annually from 2006 through 2015, broken down by racial/ethnic group (White, Black, Asian, Hispanic, American Indian/Alaskan Native, or Other/Unknown), along with RPTs for each racial/ethnic group. The USA did not provide information regarding NJP proceedings. It seems likely, though we were unable to obtain confirmation, that Hispanic is considered a mutually exclusive group in the USA data. Because the USA response did not include force strength numbers, POD was unable to verify the RPTs provided.
4 Available here: http://download.militaryonesource.mil/12038/MOS/Reports/2014-Demographics-Report.pdf

RACIAL DISPARITIES IN MILITARY JUSTICEA3
APPENDIX B: DETAILED EXPLANATION OF THE ANALYTICAL PROCESS
To determine whether racial disparities exist within the military justice system, this report compares rates per thousand (RPTs) within each service branch through the calculation of disparity indices. These measures are explained in detail below.
RATES PER THOUSAND
The military calculates rates per thousand (RPTs) by dividing the number of individuals of a certain racial group who face a justice or disciplinary action by the total number of service members of that racial group currently serving and then multiplying by 1,000:
RPT=Number of Justice or Disciplinary Actions
x 1,000
Total Number of Service Members
For example, in 2015, 344 white airmen faced court-martial out of the 222,374 total white airmen serving that year—an RPT of 1.55. This number means that, for every 1,000 white service members in the USAF, 1.55 were court-martialed in 2006.
DISPARITY INDEX
POD calculated how much more or less likely each demographic group was to face court-martial or NJP proceedings compared to white service members (the majority demographic group in the military) in a given year. To compare RPTs across demographic groups, the RPT for people of color was divided by the RPT for white service members, thus calculating a “disparity index.” This was an annual measure.
Disparity Index =RPT for Service Members of Color
RPT for White Service Members
For example, as mentioned above, in 2015, for every 1,000 white airmen, 1.55 were court-martialed. The RPT was 2.58 for black airmen during the same time period. Dividing 2.58 by 1.55 gives a disparity index of 1.67, meaning that, in 2015, black airmen were court-martialed 1.67 times (67%) more often than white airmen. This report also averages disparity indices across years in order to measure the disparity for a particular group in an average year.
For the USMC, POD also received sufficient information to determine whether Hispanic Marines had disparate involvement in military justice and disciplinary systems compared to non-Hispanic Marines. For this comparison, the RPT for non-Hispanic service members was used as the denominator in the disparity index calculation.
Because “Hispanic” was treated differently among the service branches – as a mutually exclusive racial group in some cases and as an ethnicity that has overlap with racial groups in others – the comparison group for the above calculation varied slightly across the branches. Table 1 lays out these differences.

A4
Note regarding the Navy: POD calculated RPTs for the Navy (USN) using the data provided. However, there were complications caused by the conceptualization of “Hispanic.” Specifically, military justice demographic information for the USN appears to treat “Hispanic” as a mutually exclusive racial category, while force strength data consider this group to be an ethnicity that exists across racial groups. In other words, the numerator in the RPT calculation only includes Hispanic service members in one racial group (“Hispanic”) and not others, such as “White” or “Black”; the denominator, in contrast, likely includes Hispanic service members in all racial groups.
As a result, the numerator and denominator in the USN RPT calculation do not always refer to the same groups, adding uncertainty to this calculation. If Hispanic sailors are differentially impacted by the military justice system, this may have skewed the RPTs and, as a result, complicates any conclusions from the USN data for this analysis (though not for the post-referral disparity indices, as explained below). Due to this issue, RPTs were not calculated for Hispanic sailors. POD was also unable to determine what the “Other” category in the military justice data corresponded to in the USN personnel data, and therefore RPTs were not calculated for this group.
POST-REFERRAL DISPARITY INDICES FOR THE NAVY
Because the USN provided disposition information for individual cases, in addition to the above analyses, it was possible to determine whether cases were handled differently after referral. This was done by first determining the proportion of referred cases that had a particular outcome for each demographic group and then comparing these proportions through an adjusted disparity index calculation, as shown below:
TABLE 1: COMPARISON GROUP IN EACH SERVICE BRANCH
COMPARISON GROUP (DENOMINATOR) IN DISPARITY INDEX CALCULATION
ARMY White, although the Army did not indicate whether Hispanic soldiers were included in this category.
AIR FORCE White, including Hispanic and non-Hispanic
NAVY White, including Hispanic in part and excluding Hispanic in part. “Hispanic” was treated as a race in the criminal justice data and as an ethnicity in personnel data. Both data sets were used in the calculation of RPTs.
MARINE CORPS Non-Hispanic White (for comparison with other races)Non-Hispanic (for comparison with Hispanic)
Proportion =Number of USN Members with a Given Case Outcome in a Racial Group
Total Number of Case Referrals for Racial Group
Post-Referral Disparity Index =Proportion for USN Members of Color
Proportion for White USN Members
These post-referral disparity indices help demonstrate if there are differences in how harshly service members are treated after becoming involved with the military justice system.

RACIAL DISPARITIES IN MILITARY JUSTICEA5
APPENDIX C: DEMOGRAPHIC DATA & CALCULATIONS
The below data was provided by, or calculated based on data provided by, each service branch.
RPT=Number of Justice or Disciplinary Actions
x 1,000Total Number of Service Members
AIR FORCE (USAF)TABLE 1: RATES PER THOUSAND (USAF)
RPT: COURT-MARTIAL OR NJP
RPT: COURT-MARTIAL RPT: NJP
White Black Other/ White Black Other/ White Black Other/
2006 22.71 33.82 22.26 2.28 3.66 2.48 20.43 30.15 19.78
2007 21.35 33.37 19.58 2.16 3.15 2.33 19.19 30.22 17.25
2008 22.08 34.20 21.55 1.88 3.32 1.82 20.20 30.89 19.73
2009 20.89 34.09 24.79 1.99 3.00 3.41 18.90 31.09 21.38
2010 18.25 30.49 39.27 1.94 3.13 4.21 16.31 27.36 35.06
2011 19.61 32.61 30.16 2.13 3.02 2.84 17.47 29.59 27.32
2012 19.05 36.35 20.02 1.91 3.65 1.99 17.14 32.70 18.03
2013 18.34 35.60 18.54 2.05 3.88 1.81 16.29 31.71 16.73
2014 15.31 28.39 16.99 1.57 2.89 1.59 13.74 25.50 15.40
2015 14.07 25.73 16.08 1.55 2.58 2.37 12.52 23.15 13.71

A6
TABLE 2: DISPARITY INDICES – COMPARISON TO WHITE SERVICE MEMBERS (USAF)
DISPARITY INDEX: COURT-MARTIAL
OR NJP
DISPARI-TY INDEX:
COURT-MARTIAL
DISPARITY INDEX: NJP
Black Other/ Unknown
Black Other/ Unknown
Black Other/ Unknown
2006 1.49 0.98 1.60 1.08 1.48 0.97
2007 1.56 0.92 1.46 1.08 1.57 0.90
2008 1.55 0.98 1.77 0.97 1.53 0.98
2009 1.63 1.19 1.51 1.71 1.64 1.13
2010 1.67 2.15 1.62 2.18 1.68 2.15
2011 1.66 1.54 1.42 1.33 1.69 1.56
2012 1.91 1.05 1.91 1.04 1.91 1.05
2013 1.94 1.01 1.90 0.88 1.95 1.03
2014 1.85 1.11 1.84 1.01 1.86 1.12
2015 1.83 1.14 1.67 1.53 1.85 1.09
Average 1.71 1.21 1.67 1.28 1.72 1.20
Standard Deviation
0.16 0.38 0.18 0.41 0.17 0.38
MARINE CORPS (USMC)TABLE 3: RATES PER THOUSAND (USMC)
RPT: COURT-MARTIAL OR NJP RPT: NJP
WHITE BLACK OTHER/ UN-
KNOWN
HIS-PANIC
NON-HIS-PANIC
WHITE BLACK OTHER/ UN-
KNOWN
HISPANIC NON-HIS-PANIC
2006 71.44 89.81 85.92 75.85 75.35 60.72 73.47 72.99 63.85 63.69
2007 64.97 80.02 77.86 66.09 68.03 55.39 66.72 64.89 56.10 57.67
2008 69.22 84.89 75.25 69.12 71.59 59.61 69.23 62.81 59.06 61.02
2009 70.65 86.57 73.16 67.51 72.73 60.28 71.96 60.79 56.51 61.69
2010 67.19 87.06 65.09 68.26 69.33 57.23 72.87 56.42 59.06 58.99
2011 59.00 80.74 58.03 53.91 61.44 51.26 69.38 49.57 46.93 53.22
2012 51.87 67.83 48.34 48.67 53.42 46.46 59.92 43.00 43.07 47.72
2013 45.92 60.97 43.86 44.31 47.52 41.37 52.83 39.52 40.07 42.56

RACIAL DISPARITIES IN MILITARY JUSTICEA7
RPT: SUMMARY COURT-MARTIAL (GUILTY FINDING)
RPT: SPECIAL COURT-MARTIAL (GUILTY FIND-ING)
WHITE BLACK OTHER/ UN-
KNOWN
HIS-PANIC
NON-HIS-PANIC
WHITE BLACK OTHER/ UN-
KNOWN
HISPANIC NON-HIS-PANIC
2006 6.39 8.95 7.23 6.40 6.80 3.91 6.35 5.04 5.06 4.33
2007 6.40 6.22 8.23 5.42 6.56 2.74 6.06 3.93 3.58 3.25
2008 6.33 8.64 6.86 5.70 6.65 2.83 5.61 4.51 3.51 3.30
2009 7.25 9.21 8.73 8.04 7.61 2.63 4.01 2.78 2.50 2.81
2010 7.56 9.62 6.21 6.58 7.69 1.88 3.22 1.71 2.12 2.02
2011 5.44 6.76 5.29 4.19 5.58 1.69 3.04 2.20 2.27 1.89
2012 3.77 5.06 3.22 3.68 3.87 1.23 1.90 1.37 1.37 1.32
2013 3.04 4.39 2.81 2.75 3.18 1.04 2.70 0.94 1.05 1.22
2014 2.54 3.51 2.41 2.14 2.64 0.92 1.70 1.31 0.67 1.05
2015 1.64 3.01 1.43 1.85 1.79 0.72 1.32 1.02 0.88 0.82
RPT: SUMMARY COURT-MARTIAL (GUILTY FINDING)
WHITE BLACK OTHER/ UN-KNOWN
HISPANIC NON-HISPANIC
2006 0.42 1.04 0.66 0.54 0.53
2007 0.44 1.03 0.80 0.99 0.55
2008 0.45 1.41 1.08 0.86 0.62
2009 0.48 1.38 0.86 0.46 0.62
2010 0.52 1.35 0.75 0.50 0.63
2011 0.61 1.57 0.96 0.52 0.75
2012 0.41 0.95 0.75 0.55 0.50
2013 0.48 1.05 0.60 0.43 0.56
2014 0.34 1.08 0.69 0.63 0.46
2015 0.45 1.11 0.27 0.77 0.51
A8
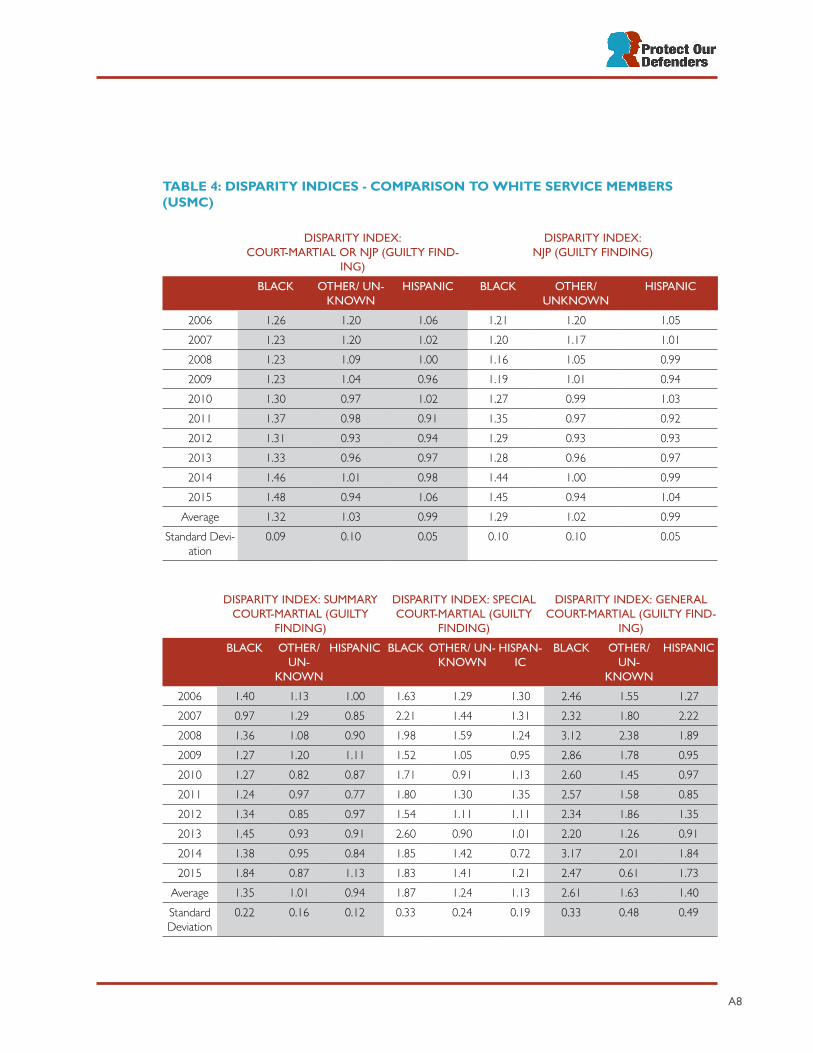
TABLE 4: DISPARITY INDICES - COMPARISON TO WHITE SERVICE MEMBERS (USMC)
DISPARITY INDEX: COURT-MARTIAL OR NJP (GUILTY FIND-
ING)
DISPARITY INDEX:NJP (GUILTY FINDING)
BLACK OTHER/ UN-KNOWN
HISPANIC BLACK OTHER/ UNKNOWN
HISPANIC
2006 1.26 1.20 1.06 1.21 1.20 1.05
2007 1.23 1.20 1.02 1.20 1.17 1.01
2008 1.23 1.09 1.00 1.16 1.05 0.99
2009 1.23 1.04 0.96 1.19 1.01 0.94
2010 1.30 0.97 1.02 1.27 0.99 1.03
2011 1.37 0.98 0.91 1.35 0.97 0.92
2012 1.31 0.93 0.94 1.29 0.93 0.93
2013 1.33 0.96 0.97 1.28 0.96 0.97
2014 1.46 1.01 0.98 1.44 1.00 0.99
2015 1.48 0.94 1.06 1.45 0.94 1.04
Average 1.32 1.03 0.99 1.29 1.02 0.99
Standard Devi-ation
0.09 0.10 0.05 0.10 0.10 0.05
DISPARITY INDEX: SUMMARY COURT-MARTIAL (GUILTY
FINDING)
DISPARITY INDEX: SPECIAL COURT-MARTIAL (GUILTY
FINDING)
DISPARITY INDEX: GENERAL COURT-MARTIAL (GUILTY FIND-
ING)
BLACK OTHER/ UN-
KNOWN
HISPANIC BLACK OTHER/ UN-KNOWN
HISPAN-IC
BLACK OTHER/ UN-
KNOWN
HISPANIC
2006 1.40 1.13 1.00 1.63 1.29 1.30 2.46 1.55 1.27
2007 0.97 1.29 0.85 2.21 1.44 1.31 2.32 1.80 2.22
2008 1.36 1.08 0.90 1.98 1.59 1.24 3.12 2.38 1.89
2009 1.27 1.20 1.11 1.52 1.05 0.95 2.86 1.78 0.95
2010 1.27 0.82 0.87 1.71 0.91 1.13 2.60 1.45 0.97
2011 1.24 0.97 0.77 1.80 1.30 1.35 2.57 1.58 0.85
2012 1.34 0.85 0.97 1.54 1.11 1.11 2.34 1.86 1.35
2013 1.45 0.93 0.91 2.60 0.90 1.01 2.20 1.26 0.91
2014 1.38 0.95 0.84 1.85 1.42 0.72 3.17 2.01 1.84
2015 1.84 0.87 1.13 1.83 1.41 1.21 2.47 0.61 1.73
Average 1.35 1.01 0.94 1.87 1.24 1.13 2.61 1.63 1.40
Standard Deviation
0.22 0.16 0.12 0.33 0.24 0.19 0.33 0.48 0.49

RACIAL DISPARITIES IN MILITARY JUSTICEA9
TABLE 5: DISPARITY INDICES: HISPANIC VS. NON-HISPANIC SERVICE MEMBERS (USMC)
Court-Martial or NJP (Guilty
Finding)
NJP (Guilty Finding)
Summary Court-Martial
(Guilty Finding)
Special Court-Martial (Guilty
Finding)
General Court-Martial (Guilty Finding)
2006 1.01 1.00 0.94 1.17 1.02
2007 0.97 0.97 0.83 1.10 1.80
2008 0.97 0.97 0.86 1.06 1.38
2009 0.93 0.92 1.06 0.89 0.74
2010 0.98 1.00 0.86 1.05 0.79
2011 0.88 0.88 0.75 1.21 0.69
2012 0.91 0.90 0.95 1.04 1.10
2013 0.93 0.94 0.87 0.86 0.78
2014 0.93 0.94 0.81 0.63 1.36
2015 1.00 0.99 1.04 1.06 1.51
Average 0.95 0.95 0.89 1.01 1.12
Standard Deviation 0.04 0.04 0.10 0.17 0.38
NAVY (USN)TABLE 6: RATES PER THOUSAND (USN)
RPT: Referral RPT: Action Taken
WHITE BLACK ASIAN NATIVE AMERICAN
WHITE BLACK ASIAN NATIVE AMERICAN
2014 1.94 2.94 1.22 0.21 1.29 1.91 1.05 0.21
2015 2.37 3.07 1.40 0.30 1.38 1.75 0.93 0.30
TABLE 7: DISPARITY INDICES - COMPARISON TO WHITE SERVICE MEMBERS (USN)
Disparity Index: Referral Disparity Index: Action Taken
BLACK ASIAN NATIVE AMERICAN
BLACK ASIAN NATIVE AMERI-CAN
2014 1.52 0.63 0.11 1.48 0.81 0.17
2015 1.29 0.59 0.13 1.27 0.68 0.22
Average 1.40 0.61 0.12 1.37 0.75 0.19
Standard Deviation
0.16 0.03 0.01 0.15 0.10 0.04

A10
TABLE 8: PROPORTION OF REFERRALS (USN)
Conviction at General or Special Court-Martial Alternative Disposition
White Black Asian Native American
Other Hispanic White Black Asian Native Ameri-
can
Other His-panic
2014 0.28 0.27 0.48 0.33 0.24 0.31 0.68 0.67 0.52 0.67 0.70 0.61
2015 0.22 0.20 0.38 0.25 0.15 0.25 0.74 0.75 0.58 0.75 0.83 0.70
TABLE 9: POST-REFERRAL DISPARITY INDICES - COMPARISON TO WHITE SERVICE MEMBERS (USN)
Conviction at General or Special Court-Martial Alternative Disposition
Black Asian Native Ameri-
can
Other Hispanic Black Asian Native Ameri-
can
Other Hispanic
2014 0.95 1.70 1.19 0.87 1.11 0.99 0.77 0.98 1.03 0.90
2015 0.92 1.73 1.15 0.67 1.15 1.00 0.78 1.01 1.12 0.94
Average 0.93 1.71 1.17 0.77 1.13 1.00 0.78 0.99 1.08 0.92
Standard Deviation
0.02 0.02 0.02 0.14 0.03 0.01 0.01 0.02 0.06 0.03
ARMY (USA)TABLE 10: RATES PER THOUSAND AT SPECIAL OR GENERAL COURT-MARTIAL (USA)
White Black Asian Hispanic American Indian/ Alaskan Native
Other/Unknown
2006 1.86 3.39 1.15 1.21 1.98 2.33
2007 2.01 3.50 1.91 1.71 1.89 3.26
2008 1.56 2.78 0.76 1.34 1.63 1.68
2009 1.60 2.44 1.07 1.05 1.49 1.86
2010 1.45 2.14 0.90 0.97 1.18 1.97
2011 1.53 2.21 0.91 1.06 1.67 4.06
2012 1.81 2.42 0.87 1.24 2.11 5.53
2013 1.73 2.67 1.06 1.22 1.23 4.46
2014 1.62 2.69 1.55 0.89 2.03 4.16
2015 1.48 2.61 0.81 0.88 2.77 5.60
RACIAL DISPARITIES IN MILITARY JUSTICEA11
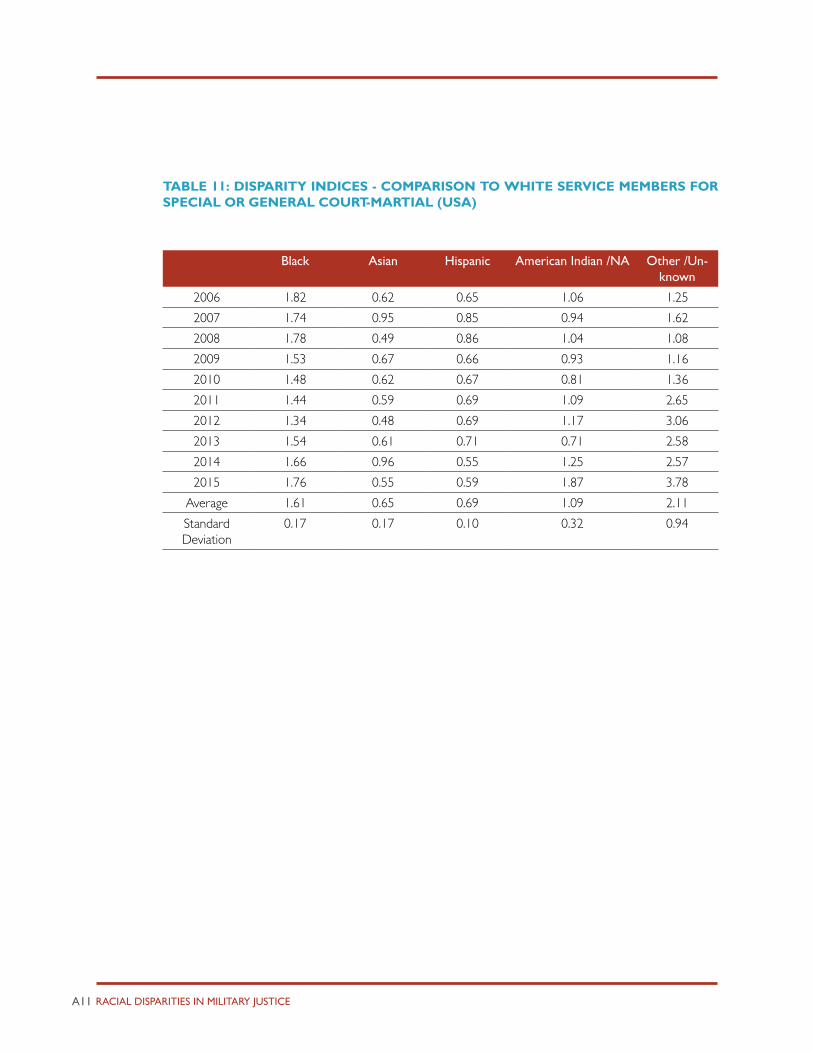
TABLE 11: DISPARITY INDICES - COMPARISON TO WHITE SERVICE MEMBERS FOR SPECIAL OR GENERAL COURT-MARTIAL (USA)
Black Asian Hispanic American Indian /NA Other /Un-known
2006 1.82 0.62 0.65 1.06 1.25
2007 1.74 0.95 0.85 0.94 1.62
2008 1.78 0.49 0.86 1.04 1.08
2009 1.53 0.67 0.66 0.93 1.16
2010 1.48 0.62 0.67 0.81 1.36
2011 1.44 0.59 0.69 1.09 2.65
2012 1.34 0.48 0.69 1.17 3.06
2013 1.54 0.61 0.71 0.71 2.58
2014 1.66 0.96 0.55 1.25 2.57
2015 1.76 0.55 0.59 1.87 3.78
Average 1.61 0.65 0.69 1.09 2.11
Standard Deviation
0.17 0.17 0.10 0.32 0.94

A12
DOWNLOAD APPENDIX D AT
www.protectourdefenders.com/disparity


