Racial Discrimination in Grading: Evidence from...
52
FERNANDO BOTELHO RICARDO MADEIRA MARCOS A. RANGEL WORKING PAPER SERIES Nº 2015-04 Department of Economics- FEA/USP Racial Discrimination in Grading: Evidence from Brazil
Transcript of Racial Discrimination in Grading: Evidence from...
FERNANDO BOTELHO
RICARDO MADEIRA
MARCOS A. RANGEL
WORKING PAPER SERIES Nº 2015-04
Department of Economics- FEA/USP
Racial Discrimination in Grading: Evidence from Brazil
DEPARTMENT OF ECONOMICS, FEA-USP WORKING PAPER Nº 2015-04
Racial Discrimination in Grading: Evidence from Brazil
Fernando Botelho ([email protected]) Ricardo Madeira ([email protected]) Marcos A. Rangel ([email protected])
JEL Codes: I21, J15, I24.
Keywords: race; schooling; grading; standardized tests; statistical discrimination. .
Abstract:
We investigate whether racial discrimination taking the form of the biased assessment of students is prevalent within Brazilian schools. Robust evidence is drawn from unique data pertaining to middle-school students and educators. After holding constant performance in blindly scored tests of proficiency and behavioral traits, we find that teacher-assigned Mathematics grades suffer from cardinal and ordinal biases. We unveil strong indications that these effects result from incomplete information issues highlighted in models of statistical discrimination which are made particularly salient by social promotion schemes currently operational in our context.
Racial Discrimination in Grading: Evidence from Brazil
By Fernando Botelho, Ricardo Madeira and Marcos A. Rangel∗
We investigate whether racial discrimination taking the form of
the biased assessment of students is prevalent within Brazilian
schools. Robust evidence is drawn from unique data pertaining
to middle-school students and educators. After holding constant
performance in blindly scored tests of proficiency and behavioral
traits, we find that teacher-assigned Mathematics grades suffer
from cardinal and ordinal biases. We unveil strong indications that
these effects result from incomplete information issues highlighted
in models of statistical discrimination which are made particularly
salient by social promotion schemes currently operational in our
context.
JEL: I21, J15, I24.
Keywords: race, schooling, grading, standardized tests, statistical
discrimination.
Evidence of a negative association between individual characteristics used to
infer African ancestry and educational attainment abounds.1 Equally notorious
is the resilience of achievement gaps across cohorts of Black and White children
∗ Botelho: University of Sao Paulo, Av. Prof. Luciano Gualberto 908, [email protected]. Madeira:University of Sao Paulo, Av. Prof. Luciano Gualberto 908, [email protected]. Rangel: Duke University,194 Rubenstein Hall, 302 Towerview Drive, Durham, NC 27708-0239, USA, [email protected] from CAPES-Brazilian Ministry of Education (Observatorio da Educacao FEA-USP, Project3313 ) and INEP-Brazilian Ministry of Education (Nucleo de Estudos da Educacao - Fipe) are gratefullyacknowledged. We benefited from comments received at the NBER Education Meeting, the PAA Meeting,the NEUDC Conference, the Economic Demography Workshop at PAA, and from seminar participants atDuke, Paris School of Economics, Vanderbilt, Princeton, PUC-Rio, EESP-FGV, Stanford, UC-Riverside,U. of Delaware, UIC, and USP. Part of the analysis presented here was performed while Rangel wasa visiting scholar at Princeton University. He is thankful for the hospitality of the Research Programin Development Studies and of the Program in Latin American Studies. Errors, omissions, and ideasexpressed in the text are the sole responsibility of the authors. These do not represent the views offunding agencies. Previous versions of this article have circulated under the title: “Discrimination Goesto School? Racial Differences in Performance Assessments by Teachers.”
1Data portraying such historically-rooted patterns have been drawn from different countries andunder a variety of institutional settings. For comparative international studies see Alexander et al.(2001); Herring et al. (2004); Telles (2004); and Telles and Steele (2012).
1
2 AMERICAN ECONOMIC JOURNAL MONTH YEAR
(Neal, 2006). These are further emphasized by longitudinal studies showing that
Black disadvantages emerge during infancy and remain pretty much intact while
children attend school.2 Because evidence regarding racial differences in expected
returns to human capital accumulation is scant, a better understanding of ob-
stacles to the acquisition of skills and educational credentials by Blacks seems
warranted.
Here, we propose discrimination within racially-integrated schools as a candi-
date explanation for the patterns described above and subsequently examine its
prevalence in Brazil. We recognize that such a phenomenon may manifest itself
in many different ways within a classroom. Yet, we focus on a very specific one: a
teacher’s biased evaluation of students with respect to their scholastic proficiency
and aptitude (i.e.: grading). We employ uniquely detailed administrative data
from the state of Sao Paulo covering approximately 277 thousand eighth-graders
spread across 10.6 thousand public-school classrooms in 2010. Our inference is
based on the careful contrasting of teachers’ subject-specific grades and scores
from end-of-year standardized (and blindly marked) proficiency tests covering
the same official curriculum delivered in regular classes.
The analyses show that portions of teachers’ assessments in Mathematics not
explained by proficiency scores are associated with pupils’ racial background. Our
most conservative estimates indicate that there are statistically significant under-
scoring and under-ranking of Blacks relative to Whites. The measured racial gap
in promotion rates between equivalently proficient and well-behaved students cor-
responds to a 4.1% increase in the retention probability for the average Black.
Focusing exclusively on the ordinality aspect we also uncover a gap that translates
into a 4.5% reduction on the probability of Blacks being graded above the class-
room median. In practice, these work as if teachers were “taxing” the average
Black student’s performance in proficiency tests by 0.03 to 0.04 of one standard
2See Phillips et al. (1998); Hedges and Nowell (1999); Reardon (2008); and Madeira and Rangel(2013). Cautionary notes on these findings can be found in Bond and Lang (2013).
VOL. VOL NO. ISSUE RACIAL DISCRIMINATION IN GRADING 3
deviation at the time her competence is being assessed. These results are shown
robust to possible omissions of behavioral attributes and to the likely incidence
of measurement error on scores from standardized tests used as covariates in our
estimations. They are also very much in line with the expected subtlety of this
particular form of discrimination.
Once the existence of racial gaps in teacher assessments is established, we rely
on economic theory to examine its likely source in our context. We draw from
a rich literature on statistical and screening discrimination.3 We map our set-
ting into these studies by focusing on two institutional aspects. First, teachers
are limited by imperfect screening technology in the process of scholastic com-
petence’s measurement and, once assigned to students of a given level (whose
admission is decided by a third party), are solely responsible for promotion and
ranking decisions. Second, due to a number of policies implemented since the
late 1990’s, a dramatic increase in access to public education has been observed.
We highlight in particular the adoption of social promotion schemes between the
fifth and seventh grades, which eliminated proficiency-based retention in those
grades. In practice, by establishing lenient standards for the admission of stu-
dents into eighth grade, such policy has disproportionally benefited Blacks (who
are over-represented among pupils with lower proficiency). In other words, social
promotion has operated as affirmative action within the Brazilian school system
we study. Eighth-grade teachers were well aware of the implications of such pol-
icy, and priors regarding students’ proficiency may have been downgraded as a
result. Therefore, we hypothesize that when teachers issue report cards assessing
the competence of their students, subtle biases may be generated by the weighted
combination of noisy information extracted from their own screening exams and
stereotyped priors.
We then present evidence on the validity of such theoretical reasoning. Em-
3Aigner and Cain (1977); Borjas and Goldberg (1978); Lundberg and Startz (1983); Coate and Loury(1993); Cornell and Welch (1996); Altonji and Pierret (2001); Blume (2006); Bjerk (2008); and Lehmann(2011).
4 AMERICAN ECONOMIC JOURNAL MONTH YEAR
ploying a strategy similar in spirit to the one in the seminal work of Altonji and
Pierret (2001), we examine whether the duration of interaction between teachers
and students produces different assessment patterns. The basic idea is that the
longer pupil and teacher interact, the smaller is the role of biased priors that
emphasize racial identity and the larger is the role of hard-to-measure signals of
proficiency.4 In this regard, our empirical exercises unveil that while racial gaps
in promotion rates and ranking are salient for Black and White students attend-
ing classes with a teacher for the first time, no significant disparities are found
among those that have already had classroom interactions with that instructor
before eighth grade. Teachers seem to learn about a student’s true “type” over
academic years and once they are fully aware of grading standards previously used
(i.e.: their own).5 These findings not only are compatible with a learning model
of statistical discrimination but also lend further support to our baseline results’
robustness with regards to potential omission of student-specific characteristics.
Despite the subtlety of the effects, there are a number of reasons to believe
they are quite relevant. The gaps we uncover are equivalent to 40% of the raw
(within-classroom) grade differential associated with having a mother with a col-
lege degree or more versus a mother with a high-school degree only. Alternatively,
they correspond to 30% of the effect of being a child of parents that own their
home. Ultimately, following the insightful discussion in Bond and Lang (2013),
our measure of racial discrimination depends on the translation of intrinsically
ordinal scales into meaningful quantities, something that could only be achieved
in case they were to be directly associated with longer-term outcomes such as
employment and wages.
With that argument in mind, we believe that the implication of our findings
can be far reaching, and certaily go beyond differentials on level promotion and
on ranking of students. There is an enormous potential for feedback effects in
4The same notion of interactions and learning is also central in Lundberg and Startz (2007).5Tests of learning in the context statistical discrimination can also be seen in Autor and Scarborough
(2008); Lange (2007); List (2004); and Farber and Gibbons (1998).
VOL. VOL NO. ISSUE RACIAL DISCRIMINATION IN GRADING 5
our context. This is the case because we detect discrimination in grading during
the transition between middle and high-schools, at a time when Brazilian parents
invariably find themselves in the position of investors relying on the asset-return
evaluations of more informed experts. For our purposes, the key element of this
reasoning is that teacher communications may steer investment decisions in one
way or the other.6 That is to say; parents (and children themselves) likely update
investment (and effort) decisions after extracting information from report cards
issued by teachers. Therefore, if children’s perceived competence increases the
returns or reduces the costs of investments, as in the traditional Beckerian human-
capital framework, this mechanism can reinforce racial gaps in the accumulation
of human capital. In this case, intra-classroom evaluation biases may very well
lead to gaps in attainment, school choice, future scholastic performance and,
ultimately, labor market outcomes.7
Considering the role played by misinformation in the results presented here,
and beyond its scientific interest, we draw three lessons for education policy from
our analysis. First, curbing teacher rotation can be particularly important for
Black students (over and beyond any effect on learning per se) because increas-
ing interactions between a group of students and a given teacher diminishes the
influence of noise on the evaluation of scholastic proficiency. The more a teacher
gets acquainted with a given student, the less relevant the pupil’s race becomes
for evaluation purposes.8 Second, direct investment in teacher training with re-
gard to the design of exams and tests may be warranted. Well-designed questions
are easier to grade and more likely to differentiate students on the most relevant
dimensions of proficiency. Finally, because blindly graded proficiency tests are
regularly taken by students under standard school accountability’ systems, and
6Lam et al. (2006) examines the significant effect of performance measurement’s precision over high-school dropout behavior in South Africa, for example.
7See Mechtenberg (2009) for a formalization of an argument like this. See also Lundberg and Startz(1983), who are explicit in modeling human capital investments’ response to the presence of discrimina-tion.
8This adds interesting elements to the beneficial effects of grade/subject-specific teacher experiencediscussed by Ost (2014).
6 AMERICAN ECONOMIC JOURNAL MONTH YEAR
despite the intrinsic noisy nature of such scores, the generation of individual re-
port cards could aid teachers in their competence evaluations. Particularly under
social promotion schemes like the one we study, this additional information should
make teachers better able to evaluate their students without resorting to racially
biased priors. Above all, public schools and respective education authorities could
do a better job on their use of performance information in order to maximize effi-
ciency. The reduction of grading discrimination of the sort we uncover would be
an added bonus.
We also believe our results can be used to conjecture on the effects of affirmative
action over access to education and accumulation of human capital, a theme
of prime importance as Brazil adopts racial quotas in access to college and in
allocation of publicly-funded scholarships. While the profession has focused on
behavioral responses among those targeted by such polices (the effort choices of
high-schoolers that are granted easier access to college), we advocate that the role
of instructors within colleges be considered.9 We believe that the latter’s priors
could be affected by the enactment of quota policies (stereotyping). Because GPA
and course performance are intimately connected with drop-out and graduation
rates, ceilings may be imposed on the progress of the population it was designed
to help by distorting subjectively assigned course grades.10 This is an indirect
policy implication we draw from our exercises.
The remainder of this article is organized as follows. Section 1 briefly reviews
the literature on teacher perceptions and grading discrimination. Section 2 dis-
cusses the institutional background and describes the data we employ. Section 3
outlines a conceptual framework that guides the empirical analysis we perform.
Section 4 presents our empirical strategy and the econometric identification strat-
egy. Results and discussions are presented in Section 5. Section 6 concludes.
9See Assuncao and Ferman (2013) on the early Brazilian experience with quotas, Cortes and Zhang(2012) for a discussion in the context of the Top 10% Program in Texas, and Cotton et al. (2014) for acontrolled experiment.
10In many ways this is similar to the original stereotyping-affirmative action nexus proposed by Coateand Loury (1993) in the context of labor markets.
VOL. VOL NO. ISSUE RACIAL DISCRIMINATION IN GRADING 7
I. Related literature
Despite being the first study to examine racial bias using Brazilian student-
level data in this degree of detail, we are well aware that the question of whether
teachers treat Black and White children differently is not new. In fact, there is
a tradition within the sociology literature of directly examining whether teacher
bias is a factor in course-grade assignment in the United States (Bowles and Gin-
tis, 1976; Farkas et al., 1990; Rist, 1973; Rosenthal and Jacobson, 1968; Sexton,
1961). Both large- (Sewell and Hauser, 1980; Williams, 1976) and small- (Leiter
and Brown, 1985; Natriello and Dornbusch, 1984) scale empirical studies do not
detect significant biases. There is also a considerable number of contributions
from the social psychology literature focusing on teacher’s perceptions of Black
and White children (see Ferguson, 1998, 2003 and references therein), which again
only unveils weak relationships between Black stereotypes and measures of dis-
criminatory actions.11
Our work complements more recent studies from the education and economics
literatures. Shay and Jones (2006) and Dorsey and Colliver (1995), examine
quasi-experimental variation provided by institution-level policy changes regard-
ing anonymity in the grading processes applied to college/graduate students and
fo not detect significant racial differentials. Figlio (2005) examines whether teach-
ers’ overall perception of a given student is affected by the “Blackness” of her first
name, even after controlling for performance in standardized examinations. Using
data from one school district in Florida, he uncovers evidence of lower teacher
expectations for those perceived to have African American ancestry. Burgess
and Greaves (2013) investigate differences in teacher grading according to ethnic
background using observational data from England, finding significant under-
assessment of Black Caribbean and Black African pupils. Finally, Hinnerich et al
(2011a, 2011b) conduct audit-like studies by transcribing and blindly re-grading
11See review of studies in Dovidio et al (1996). Demeis and Turner (1978), unlike most of this literature,find significant discrimination against Blacks in an experimental setting.
8 AMERICAN ECONOMIC JOURNAL MONTH YEAR
tests assessed by teachers in Sweden and estimate gender (insignificant) and na-
tionality (significant) gaps. Similar exercise conducted in Germany by Sprietsma
(2013) also uncovers biases against exam solutions which had Turkish-sounding
names randomly allocated to them (relative German-sounding names).
Particularly important and convincing studies detecting discrimination in grad-
ing are the ones reported by Lavy (2008) and Hanna and Linden (2012). Lavy
(2008) capitalizes on a natural experiment in Israeli high-schools. The author
cleverly explores the fact that students take two examinations that cover the same
material and have the same format during their senior year, and that the grading
of each exam happens under different anonymity regimes. Focusing on gender
differentials, his findings indicate that male students receive lower marks in the
non-blindly graded exams (relative to those blindly scored), and that these differ-
ences are larger (in absolute value) than among girls. Blind/non-blind contrasts
are also skillfully explored in a randomized control trial designed and implemented
by Hanna and Linden (2012). The authors identify statistically significant pos-
itive differences between blind and non-blind scores for members of lower castes
in India (relative to upper castes), which is clear evidence of discrimination.
The discussion presented here plays on three advantages of our context with
respect to other studies in the literature. First, the sheer size of and level of
detail in our data base allows us to convey a complete portrait of teacher and
student-body characteristics associated with discrimination in actual classroom
environments. Teachers grading in experimental settings may very well reveal
different discriminatory behavior due to the one-shot nature of the event (even
when hypothetical biases are curbed by incentivizing schemes). Regular teachers
are gatekeepers, being (and feeling) responsible for assigning credentials that will
follow a child for life. Second, in our context there are both weak regulation
of grading and non-disclosure of information regarding standardized test perfor-
mance to acting parties (teachers or students) before pupils’ final assessments
are processed. In this way, the present paper explores an environment in which:
VOL. VOL NO. ISSUE RACIAL DISCRIMINATION IN GRADING 9
i) subtle discriminatory behavior is hardly detected by school authorities or stu-
dents themselves, and ii) last minute reactions to performance information are not
sought by evaluators or by those being evaluated. It is also true that given the
nature of desegregation within schools and classrooms in Brazil we are nonethe-
less unlikely to observed racial disparities that are not subtle. After all, students
do interact at a level that gross misrepresentation of relative grades could easily
be observed (students do see each other’s graded exams) and lead to re-grading
petitions. Finally, here we can explore detailed information on the longitudinal
relation between teachers and pupils in order to closely examine theories of learn-
ing under statistical discrimination, and to shed light on the mechanism behind
grading discrimination in our context.
II. Data and institutional background
A. Student-level data
The Sao Paulo’s Secretary of Education collects detailed information on the
universe of students and teachers in the state’s educational system. Considering
only regular primary and secondary schools, official records indicate that enroll-
ment corresponded to approximately 6 million primary, middle and high-school
students in 2010. Among eighth-graders, 67% were served by schools directly
administered by the state authority, with the remaining share being evenly split
between municipal and private institutions. Using confidential individual iden-
tifiers we merged information from four distinct sections of the Secretary’s data
bank: matriculation information, teachers’ allocation to classrooms, transcript
records and standardized tests of proficiency.12 We turn to the description of
each one of these.
Matriculation information covers all schools in the state of Sao Paulo, be they
12The Secretary has never attempted to combine these data. There are different departments in chargeof each of these sections, and communication between them is scant. This is the first time these datahave been used in an integrated format.
10 AMERICAN ECONOMIC JOURNAL MONTH YEAR
private or public. These records are centralized by the Secretary of Education
through its role as a regulating agency for private and municipal schools. Matric-
ulation within the public system is defined in terms of a school’s catchment area
(districting). Parents apply for a slot and pupils are assigned to the school serving
the requested level closest to their residence. The centralization of information
allows tracking students within the school system, and across classroom over the
years. Our working data set covers the 2007-2012 period.
Records of teacher allocations to classrooms for the years 2007 to 2011 were
also obtained. These files contain basic demographics (race, age, gender) for all
the teachers in the system, and can be linked longitudinally. Combined with the
matriculation records, we are able to map all teachers with whom each student
had classes in the three years prior to eighth grade.
We also take advantage of the administrative data set on teachers’ assessments
of individual students between 2007 and 2011. This data set contains detailed
information regarding scores and attendance records for all students in schools
directly administered by the state’s school authority. The complete set of report
cards available to us includes information on every school subject. In eighth grade,
in which teachers are fully specialized by subject, these correspond to Language
(Portuguese), Mathematics, History, Geography, Sciences, Physical Education,
and the Arts.
Assessment data started being centrally recorded after the adoption of a uniform
criterion-referenced rule in 2007. According to official guidelines, all teachers
assign numeric integer grades ranging from 0 to 10, with a passing grade set at
5 points for all disciplines. Attendance is recorded in percentage points (0-100
interval). Teachers and school administrators are not given instructions on how to
attribute grades as a function of a student’s observed proficiency level beyond the
guidelines imposed by their uniform school curriculum. The state administration
provides pedagogical material and teachers are supposed to evaluate students
according to proficiency in its content. Nonetheless, no explicit guidance regarding
VOL. VOL NO. ISSUE RACIAL DISCRIMINATION IN GRADING 11
the design of evaluations is given (except for questions included in the back of
teachers’ booklets), and teachers still have great autonomy to define evaluation
technology/methods and to allocate students across the 11 grading categories.
The final data set employed in our analysis provides results from standardized
scores in the context of Sao Paulo’s Performance Evaluation System - (SARESP-
Sistema de Avaliacao de Rendimento do Estado de Sao Paulo). The system
consists of an annual statewide exam taken by public school students in grades
2 and 4 (elementary school), 6 and 8 (middle school), and 11 (high school).
Here we employ data from the 10th to the 13th editions (2007 to 2010), with
over 1.5 million test-takers in approximately 5,050 schools covered in the latter
year. Of this total, 420 thousand were eighth-graders (87.4% attendance rate
in this particular level). As an integral part of the testing procedures, parents,
students, and teachers also answer a survey that covers socioeconomic status,
demographics (including race), study habits, teaching and pedagogical practices,
and perceptions about the school environment, among other issues.
The main purpose of the SARESP exam is to measure the students’ proficiency
on the subjects assigned to each specific grade according to a predetermined
curriculum, which is imposed on schools by the state authority. The exam in
2010 had questions covering Math and Portuguese language. For students in
eighth grade, each exam contained 30 multiple choice questions. The exams were
taken in late November (Spring), right before the end of the academic year, during
regular-class meeting times, and in the same classrooms in which students sit for
lectures. Teachers from different schools and levels were mobilized to supervise
students during the test and grading was electronically conducted. Microdata
on these tests’ results were made available in the form of proficiency scores in
each subject. These scores were computed using Item Response Theory (IRT)
methods. Importantly, individual-level results from SARESP, past or current,
are never made available to children, parents, teachers or schools.13
13For years prior to 2010 we were also granted access to IRT-scores from proficiency tests in Science
12 AMERICAN ECONOMIC JOURNAL MONTH YEAR
B. Racial gaps in Brazil
The discussion of racial differentials in Brazil is somewhat paradoxical. On
the one hand, widespread racial mixing in marriage and the desegregation of
housing markets have helped spread the view of a Brazilian “haven of racial
reconciliation and affinity” (see Richman, 1999). On the other hand, there is
overwhelming evidence that such racial tolerance indicators coexist with pertinent
differences between Whites and non-Whites in terms of wages and other measures
of economic well-being (see Arias et al., 2004 and Perry et al., 2006). In fact, the
2005 Human Development Report (United Nations) states that racial difference
in economic achievement is one of the main social challenges facing Brazil. The
report goes on to suggest that anti-discrimination policies should be central to
any poverty reduction program implemented in the country. According to the
2010 Brazilian population census, adult male Whites have 8.4 years of completed
education while the corresponding quantity for Blacks is 6.4 years. This lower
educational attainment goes hand in hand with log-wage gaps of approximately
0.40 points. These gaps are of equal size when we restrict the sample to the state
of Sao Paulo, which is the geographic area of focus for our analysis.
There have been important recent advancements towards the (potential) clos-
ing of racial gaps coming about as a result of colorblind social policies, however.
Starting in the mid-1990s demand- and supply-side initiatives began to be un-
dertaken, including the early steps and expansion of Bolsa Familia’s conditional
cash-transfer program, and innovations in the allocation of federal budget toward
school maintenance and teacher salaries under the Fundo de Manutencao e De-
senvolvimento do Ensino Fundamental (FUNDEF). Under this new institutional
setting, standard educational policy targets rapidly improved: an unprecedented
and significant increase in the rates of enrollment of school-aged children all over
and evaluations of an essay-based portion of the Language exam. The latter covered four differentdimensions of writing ability: theme (ability to keep the text within the proposed theme); vocabularyand pronoun-noun concordance; cohesion and coherence (text organization); and syntax and subject-verb/time concordance.
VOL. VOL NO. ISSUE RACIAL DISCRIMINATION IN GRADING 13
the country. Based on household survey data, Madeira and Rangel (2013) show
trends in enrollment for children aged 6 or 7 in the state of Sao Paulo between
1989 and 2009 by race. Aggregate enrollment figures went from somewhere around
75% in 1990 to more than 95% (or nearly universal coverage) by 2010. Impor-
tantly, from a racial perspective this increased access to schooling had a major
influence on the composition of the student body, increasing the participation of
a deprived portion of the population (among which non-Whites were overrepre-
sented). In essence, Black-White gaps in enrollment among young children have
virtually been eliminated in the state by the end of the period studied.
The absence of racial gaps in initial enrollment does not imply a closing of
attainment gaps, however. For the country as a whole, the evidence on this di-
mension is mixed, while in Sao Paulo the patterns seem more favorable. We
conjecture (but do not directly examine) that the adoption of a social promotion
scheme in Sao Paulo is at least in part responsible for a faster convergence in
education attainment between Blacks and Whites. Starting in 1998 such policy
grouped contiguous primary school grades into two cycles, with retention only
occurring at the end of each of them. Cycle 1 encompasses grades 1 to 4 (elemen-
tary) and cycle 2 covers grades 5 to 8 (middle school). Under this regulation, a
student is promoted to the next level within a cycle if she attends more than 75%
of the classes (and has no record of extreme disciplinary problems), irrespective
of her mastery of the material covered during the academic year. Insufficient
performance can only result in retention at the end of each cycle.14
[Figure 1 here]
In fact, trends are more pronounced in Sao Paulo than in other parts of the
country, and the timing of convergence coincides with the policy’s adoption. Yet
what most substantiates this argument is the comparison of year-to-year attrition
probabilities between middle-schools directly managed by Sao Paulo’s school au-
14Several international organizations, including the World Bank, support this policy as an effectiveway to curb low grade completion and to decrease drop-out rates. The general lines of the argument arethat grade retention could adversely affect some of the students’ “non-cognitive” skills (like confidenceand self-esteem), increasing anxiety levels and hampering their learning process. See King et al. (2008).
14 AMERICAN ECONOMIC JOURNAL MONTH YEAR
thority, and those run by municipal authorities. The former were all under social
promotion during the 2006-2010 period we examine. Meanwhile, among the mu-
nicipality schools only a small minority were under the same promotion scheme
during that time. Figure 1 reproduces a simple computation of Black/White rel-
ative survival probabilities in both school systems. Assuming parity at 5th grade
(one Black student per White student) we see that within the system adopting
social promotion Blacks’ relative attrition is lower than within municipal systems
in every single year examined.15 We also observed in auxiliary exercises (Figure
2) that weaker students were relatively more likely to benefit from social promo-
tion between 6th and 7th grades in particular. Here, as in the case of increased
access, even if not aimed directly at racial issues, by benefiting students at the
bottom of the skill distribution, social promotion had a disproportional effect on
primary-school re-enrollment (higher) and retention (lower) rates among Blacks.
Importantly, the increase in access to higher levels of basic education was gender-
neutral. Both Black girls and Black boys were both more likely to reach eighth
grade as a result of this policy.
We keep these recent trends in racial inclusion in perspective. The analyses that
follow focus on how they are likely to affect the experiences of Black and White
children that reach the final grade of middle school, right before racial differentials
in enrollment rates and attrition dramatically increase at the high-school level.
C. Descriptive statistics
Our working data set was obtained after imposing restrictions based on the
availability of both transcripts and (concurrent and past) test scores data for at
least 75% of the students in a given 8th-grade classroom at the end of 2010.16
We also restricted our analysis to classrooms with non-homogeneous racial com-
15We use longitudinal matriculation records to compute these, and a description of the data is providedabove. It is important to note that they are unconditional average transition rates.
16Since we cannot be sure that those not taking the test are a random subsample of students, ouroption to restrict the sample in this way was to make sure that relative rankings were closer to berepresentative of what happens in the actual classroom.
VOL. VOL NO. ISSUE RACIAL DISCRIMINATION IN GRADING 15
position (at least one Black and one White student) and fifteen or more students.
We were left with observations on 277,444 students in 10,614 classrooms across
3,511 schools. Students that self-declared as Black or White are the main focus of
the analysis, but our models are estimated including (and identifying) individuals
classified under other races. As in most exercises in the social sciences that con-
sider race, we implicitly assume that those that discriminate (teachers/employers)
and those that are discriminated against (pupils/workers) agree on the racial clas-
sification captured in the records. We identify as Black all students that have been
declared as such in any survey or enrollment documentation between 2005 and
2012. Columns 1 to 3 of Table A1, in the Appendix, presents descriptive statistics
for our working data set. It is easy to see that, as expected, in pretty much every
dimension in which we compare Blacks and Whites (and that are later used as
control variables in our analysis), the former are unfavorably compared to the
latter.
Focusing more specifically on scholastic performance, Figure 3 plots the cumula-
tive distribution function of test scores (left) and teacher-assigned grades (right).
These represent the main control and the main dependent variables in the econo-
metric exercises that follow, respectively. Even with all of the observed progress
in attainment, we can still find sizable differences in achievement between Blacks
and Whites in Sao Paulo. For the students in our sample, differentials amount
to 0.25 of one standard deviation (holding constant classroom fixed-effects). A
similar pattern is observed in the distribution of teacher-assigned grades, with
a disproportionate concentration of Blacks among those obtaining lower marks.
Average differences in grades are approximately 5.6 points in a 0-100 scale.
[Figure 3 here]
Finally, in Figure 4 we plot the (Lowess) smoothed raw relationship between
teacher-assigned grades and test scores in our data. This figure summarizes the
main exercise of this article. For every level of test performance, Blacks receive
lower grades from their teachers. The econometric strategy described below and
16 AMERICAN ECONOMIC JOURNAL MONTH YEAR
all our empirical estimations are in essence an attempt to verify whether these
gaps are indeed there even after we both hold constant other productive attributes
that make Black and White students different in the eyes of their teachers and
address measurement error challenges. However, before examining the data in
more detail, we turn to a simple conceptual framework that guides our estimations
and orients the interpretation of results.
[Figure 4 here]
III. Conceptual framework
We focus our attention on a stylized description of grading that leads directly
into our empirical specifications. The model is by no means general, but rather
is used as a rhetorical device to emphasize a particular source of racial differ-
entiation in teachers’ assessments. In principle, there are two basic reasons for
teachers to systematically mis-evaluate the competence of students with certain
characteristics. First, teachers may merely like/dislike people with those traits,
imposing rewards/punishments that can take both cardinal and ordinal forms.
Second, teachers may attempt to be more sophisticated, evaluating (hard to mea-
sure) competence by also using observed characteristics perceived to be correlated
with the former. In this case, the characteristics themselves convey information,
and can “help” teachers generate better assessments. These alternative sources
of discrimination are well know in the economics literature. The first is a loose
representation of taste discrimination (Becker, 1957), whereas the second falls un-
der the realm of statistical discrimination (Arrow, 1971; Phelps, 1972; Aigner and
Cain, 1977). In our model we highlight the operation of the second, concentrating
sole attention on the screening role of eighth-grade instructors.
The basic intuition is that teachers have access to noisy signals of the stu-
dents’ proficiency in Math, and observe both their behavior in class and their
racial identities. We define an objective function for graders of school work by
assuming they operate as statisticians compelled to maximize the power of the
VOL. VOL NO. ISSUE RACIAL DISCRIMINATION IN GRADING 17
hypothesis test embedded in the evaluation of a student’s competence. In addi-
tion, we impose that teachers weight Type I and Type II errors symmetrically
(i.e.: excessive lenience and excessive rigor are equally unwelcome). Evaluation
errors can be reduced by exerting more screening effort, something we implicitly
assume teachers either dislike (utility costs) or have limited access to due to high
monetary/opportunity costs, or even that school authorities set the number of
tests that can be applied to students in a given year (costs of effort could then
be modeled as a function of distance to the “norm”, such as in Holmstrom and
Milgrom, 1991).17
Schematically, teacher r inelastically employs a grading/evaluation effort level
Tr and at the end of the school year assigns to each student i (in a group of size
nr) a grade gir taking into consideration i’s unobservable true competence (g∗ir)
in order to solve on expectation the following optimization problem:
(1) mingi
E
[n∑i=1
1
2(gi − g∗i )
2
],
where we omit teacher-level subscripts for clarity of exposition and impose sym-
metry and tractability by adopting a simple quadratic function for the disutility
generated by evaluation errors.
Importantly, we allow teachers to broadly define competence. As in Mechten-
berg (2009), they acknowledge true proficiency (p∗i ) and other directly observed
scholastic attributes (~ai) as elements to be rewarded. Mechtenberg (2009) refers
to the latter as attitudes, which we envision as a broad concept that includes
habits, styles, behavior, and any other personality trait deemed productive by
17One could also conceive a technological constraint that limits the choices of teaching and testingeffort.
18 AMERICAN ECONOMIC JOURNAL MONTH YEAR
teachers.18 That is to say:
(2) g∗i = α1p∗i + ~a′i ~α2
Teachers do not observe true proficiency directly, so we further assume that
they collect a sequence of noisy (yet unbiased) signals sti = p∗i +uti. Signals result
from formulating and grading tests/exams, and hence we associate them with
evaluation effort (t = 1, 2, ..., T ).19 The higher the effort, the more signals will
be gathered about each student’s proficiency. Teachers’ estimator of proficiency
can then be described as a combination of those signals and a prior for mean
proficiency:
(3) p∗i =σp∗
σp∗ + σusi +
σuσp∗ + σu
β1,
where si =ΣstiT , σu =
var(uti)T and σp∗ represents the variance of actual proficiency
within the student population, while β1 indicates the average student’s proficiency
(prior).
Combining all the elements in the model, and defining θ = σuσp∗+σu
, we reach
the following optimal rule for grading:
(4) gi = θα1β1 + (1− θ)α1si + ~ai′ ~α2.
From this formulation there are two ways in which statistical racial differen-
tiation can be depicted. The first, rational stereotyping, is based on the idea
18Our formulation could also allow for racial bias operating directly via teachers’ definition of com-petence (which we would recognize as taste-based discrimination, nonetheless). There is an interestingparallel between this variation and racial bias in the perception of others’ pain discussed in Trawalter etal. (2012).
19For clarity of exposition, measurement error in teacher’s tests is considered classical. We acknowledgethat, due the bounded nature of grading scales in most of these classroom tests, errors would be negativelycorrelated with the true proficiency level. As long as the absolute value of the covariance between the errorand the true proficiency is smaller than the noise variance (Black et al., 2000), introducing non-classicalmeasurement error does not alter in any way the main messages of the model.
VOL. VOL NO. ISSUE RACIAL DISCRIMINATION IN GRADING 19
that attributes including race (~bi) can be informative in the computation of pro-
ficiency’s best linear projection E[p∗i |s1
i , ..., sTi ,~bi, ~ai
].20 In other words, the for-
mualtion of priors regarding group’s average proficiency encompasses the use of
other individual characteristics.21
The case of racial discrimination at hand can be illustrated within our context.
Due to social promotion in earlier grades, eighth-grade teachers know that a
particularly lenient rule for promoting male and female students was used. They
likely assume that such scheme disproportionally affected promotion rates among
Blacks. In the absence of any other information teachers will therefore have
lower expectations regarding the latter’s proficiency levels. If we let ~bi be a scalar
corresponding to an indicator Blacki not included in ~ai, we can amend the optimal
grading equation to:
(5) gi = θα1β1 + (1− θ)α1si + ~ai′ ~α2 + θα1β2Blacki.
The second (and not mutually exclusive) possibility is that racial biases ma-
terialize as screening discrimination. This is the case when the reliability of
proficiency signals collected by teachers is a function of race. Lang (1986) raised
this as possible result of communication difficulties between Whites (teachers)
and Blacks (students), while Lundberg and Startz (2007) suggest that they are
the outcome of differential rates of social interaction. In our model screening
discrimination would be embeded on race-specific signal-to-noise ratios: θ1 and
θ1 + θ2Blacki. Under these circumstances, the practical distinction with respect
to Equation (5) would solely come from the inclusion of race-specific effects of
average proficiency signals (slopes).
Notice that in any of these representations, racial bias is derived from the im-
20At this point we do not take a stand on the elements shared by ~ai and ~bi, but elaborate on it in theempirical section below.
21Ben-Zeev et al (2014) provides interesting laboratory-based experimental evidence of racialized recallbiases. In particular, Black man are remembered as lighter when subjects are offered a counter-sterotypicstimulus (regarding educational attainment).
20 AMERICAN ECONOMIC JOURNAL MONTH YEAR
precision on the information about proficiency contained in the signals. It follows
that improvements in the signal-extraction technology should make race a less
relevant element of the grade assignment process. At the same time, the rela-
tionship between grades and individual test scores should be strengthened. This
would be the case if teachers were to (exogenously) increase grading effort, if new
information were distributed, or if tests were made less noisy. We take this sim-
ple model to the data, emphasizing its prediction regarding learning a child’s true
proficiency. Further discussions on alternative specifications and identification
challenges are presented in the empirical section below.
IV. Empirical strategy
A. Practical issues
The first practical challenge we face in our empirical strategy comes from the
way grades are reported. A conceptual issue arises from the heterogeneity in
different teachers’ application of the grade scale. As in the case of comparing
responses using a Likert scale, contrasting grades assigned by different teachers
is not clear cut. While a classroom fixed-effect added to the regression accounts
for different mean scores across classes, an issue of dispersion remains; that is,
even after factoring out the class average, a one point gain in class A can hardly
be compared to the same absolute gain in class B if they have different grading
standards in the spread of grades.22 At first we simply put aside this concern and
use grades as our dependent variable, but we do so recognizing that (within this
scale) measured gaps have both cardinal and ordinal meanings. Nonetheless, we
also focus solely on ordinal aspects by present results based on the converting of
grades assigned by teachers into classroom-specific percentile rankings.
In order to facilitate the interpretation of the practical impacts of our main
results we also present two alternative binary dependent variables. The first is
22In other words, the non-additive nature of this grading heterogeneity implies that linear fixed-effectswill not wash them out.
VOL. VOL NO. ISSUE RACIAL DISCRIMINATION IN GRADING 21
the only really cardinal measure available in our data: an indicator of minimum
competence. This was made common across teachers by the central authority’s
establishment of a passing grade (set at 5). So, independently of a teacher’s
choices regarding dispersion of grades within a classroom (or her subjective un-
derstanding of one additional point in the scale), it will always be the case that
those above or at grade 5 are deemed competent while those below are not. This
cardinal notion ought to be common across all classrooms, even if in different
levels of stringency (captured by a class fixed-effect). As an additional ordinal
measure we consider an indicator for grades above the classroom’s median grade.
A second practical concern is the different natures of the exams applied within
the school context by teachers and the standardized tests adopted for external
monitoring of learning. Since teachers receive a uniform curriculum, textbooks
and practice exercises from the external examiner, their evaluations regarding pro-
ficiency should reflect the same skills and cognitive abilities as the standardized
exam. Yet, it is plausible that proficiency in a given content can be measured by
examining performance using different tasks (format). Take the case of Language
evaluations, for example. Teachers most likely combine observations regarding
reading, writing, and speaking abilities when assessing a student’s language com-
petence. Paper-and-pencil standardized tests implemented in our context can
only capture reading skills using a multiple choice exam. This is a reason for
restricting our analysis to Mathematics: we expect the objectivity inherent in the
material to translate itself into skills more easily measured in a test-like format.
It is still possible that teacher-designed Math exams also reward writing skills so
that we flexibly include scores from past essays and concurrent Language tests as
controls in our empirical model.
B. Econometric issues
In essence, we explore our information regarding scores in standardized Math
and Language exams as a proxy for the average level of proficiency measured by
22 AMERICAN ECONOMIC JOURNAL MONTH YEAR
teachers in their own classroom examinations. Meanwhile, other skills also con-
sidered relevant by teachers are factored into the productive attributes term (~ai).
Therefore, we propose the following empirical representation that incorporates
teacher/classroom fixed-effects (ηr) and a pupil-level disturbance term (εir):
(6) gir = δ1f(scoresir) + ~xir′ ~δ21 + ~zir
′ ~δ22 + ~bir′ ~δ3 + ηr + εir,
where f(scoresir) is a function test performance available in our data that re-
places the “theoretical” average level of proficiency captured in teacher-designed
examinations (sir), and once again ~bir lists elements affecting teachers’ priors with
regard to proficiency. Meanwhile, in order to make explicit further challenges to
our empirical exercise, the elements in the vector of scholastic attributes (~ai)
were also be decomposed into observed and unobserved components, with ~xir
representing elements observed both by teachers and the econometrician and ~zir
standing for those only observed by the former.
Given that our central objective is to consistently estimate δ1 and ~δ3, this simple
empirical representation highlights the two main econometric problems we face:
a) measurement error in proficiency scores, and b) unobserved heterogeneity.23
Measurement error biases result from the fact that despite being associated to
the average proficiency measured by teachers, our measure is necessarily noisier.
An easy way to understand the discrepancy between the two is to consider that
while teachers “draw” observations from multiple and heterogeneous tests, the
econometrician only observes results from one of them. Those biases directly limit
our ability to test the predictions from the aforementioned conceptual framework.
Despite being graded in a scale, the measurement errors inherent to IRT scores we
use in our analysis can be treated as classical. There are two basic reasons for that
to be the case. First, the test scale in Sao Paulo is calibrated to cover proficiency
23For a discussion of the effects of measurement errors and omission biases when using test scores ascovariates, see Andrabi et al. (2011).
VOL. VOL NO. ISSUE RACIAL DISCRIMINATION IN GRADING 23
comparisons between 4th and 11th grades, so that its boundaries are unlikely to
be reached within the population of 8th graders we study. Second, despite being
based on exams with 30 items, the IRT estimation of proficiency is conducted
in such a mechanism that the number of points in the scale is proportional to
the number of possible combinations of the response-vector as well as on the
proficiency level of those correctly responding each item (and is, therefore, not
close to being a discrete scale). IRT scores are indeed less precise in the tails of
the distribution, due to the scarcer information available for maximum-likelihood
estimations embedded in those psychometric methods (see Samejima, 1994). This,
however, does not mean that the errors are non-classical, yet it necessarily makes
them heteroskedastic.24
In the empirical exercises below we explore the fact that the individual results
of standardized tests in Math and Language taken in previous years by each
student are available in our data and, similarly to Andrabi et al. (2011), employ
a fixed-effects instrumental variables estimation that should directly deal with the
measurement error problem we face. Since we also have access to past proficiency
tests covering Natural Sciences’ material, we are in addition able to perform
overidentification tests. Despite not being a panacea, such tests can be used to
inform if there is any clear evidence against the validity of our instruments.
Unobserved heterogeneity adds another layer of complications because even in
the absence of measurement error in scores, elements of ~bir may very well be
related to elements of ~zir. In particular, we worry about behavioral indicators
that are available to teachers during classroom interactions and are correlated
with racial identity.25 We take this very seriously and, in the exercises below,
consider a number of proxies for behavior in an attempt to check the sensitiv-
ity of our results. We have explored information correlated with behavior from
different sources such as: i) teacher attendance records, assuming the students
24We have in fact experimented with measurement-error-corrected estimations employing Lewbel(2012)’s identification via heteroskedasticity (Rigobon, 2003). Since no additional insight relative tothe estimations performed below was obtained, we have opted not to present it here.
25Cornwell et al. (2013) face a similar issue in the case of gender differentials in grading.
24 AMERICAN ECONOMIC JOURNAL MONTH YEAR
that miss more classes are disengaged or poorly behaved even when attending
(we used attendance to Language classes in the first half of the academic year
to avoid confounding feedback effects); ii) parent-reported perceptions of stu-
dent engagement, behavior, and effort in school-related activities; iii) student
self-reported indicators of class absence and procrastination with homework; and
iv) Physical Education (PE) grades (in the first half of the academic year). PE
grades are under the responsibility of a different teacher. Athletic equipment
and infrastructures, such as fields and tracks, are not available in most schools,
and students usually perform simple calisthenics and routines during classes. In
eighth grade, for instance, one can hardly argue that grades are assigned as a
function of athletic skills. Instead, other traits often valued by teachers, such as
obedience, respect for the other students, and the capacity to respond to simple
commands, are likely more relevant.
Ultimately, our main empirical model consists of regressing grades on race, gen-
der, age, essay scores, parental socio-demographics, and our proxies for behavior.
These are all considered elements of the vector ~xir while the remaining elements
of ~zir not observed by the econometrician are either absorbed by the classroom
fixed-effects or by the disturbance term. f(scoresir) is estimated as fourth-order
polynomials of Math scores, a linear term for Language scores, and interactions
between those.26
C. Learning
We also extend the analysis to explore the heterogeneity of the parameters
according to teacher and student-body characteristics. In particular we pay at-
tention to the amount of knowledge a given teacher has about each of her pupils.
Social interaction in the school neighborhood, tenure in a given school and dura-
tion of classroom-like interactions for a given student-teacher pair are our main
26The use of either splines or indicator variables after discretizing the scales does not alter the inferenceswe perform. Moreover, whenever F-tests indicated that the fourth-order elements were not significant,we opted for presenting results based on a more parsimonious third-order polynomial.
VOL. VOL NO. ISSUE RACIAL DISCRIMINATION IN GRADING 25
candidates. In this way we examine the central prediction from our statisti-
cal discrimination conceptual framework: learning of students’ true types should
preclude the use of race as an indicator of scholastic competence.
In practice, and in the spirit of Altonji and Pierret (2001), we test whether
racial differentials in teacher-assigned grades diminish as a teacher’s information
regarding students improves. By the same token we examine if such improved
information also translates into increased weight given to proficiency signals when
end-of-year Math evaluations are issued. If such coefficients are shown to conform
with these predictions, we can be more confident that statistical discrimination
is at play in our study’s environment.
V. Results
A. General results
Table 1 presents results illustrating the impact of the addition of controls over
racial differentials and over the marginal effect of proficiency scores (measured at
the average performance level) in our two main dependent variables.27 Panel A
focuses on the Black-White gaps in final grades (0-100 scale). Group averages are
presented in column 1. Considering all of the students in our sample, Whites are
graded at 61.4 on average while grades among Blacks average 55.7. This difference
is relatively unaffected by the inclusion of classroom fixed effects (column 3),
indicating that racial segregation in assignment to classrooms or schools is unlikely
to be behind the racial gaps. In column 4, individual demographic characteristics
(gender and a second order polynomial on age) the polynomial for Math and
Language contemporaneous standardized scores, and past performance in essays
are included. Measured racial gaps are, not suprisingly, significantly reduced.
Indeed, a large share of the competence differences seen by teachers is captured
by performance in standardized tests of proficiency.
27The sequential inclusion of controls should not be taken as representative of the influence they exertover the gaps we want to measure. See Gelbach (2009) for a methodological discussion.
26 AMERICAN ECONOMIC JOURNAL MONTH YEAR
[Table 1 here]
In column 5 we include family background and information on past year’s Math
grades as additional control variables, with the intention of capturing child-specific
(time-invariant) abilities and competence aspects relevant to teachers that were
not being previously controlled for. Proxies for a child’s behavioral attributes
(self-reported, parent-reported, school-reported), over and above those indirectly
captured by family socio-economic background, are included in column 6. The
inclusion of behavioral aspects has minimal impact on our estimates, suggesting
that at this point very little is left out of the model. An inspection of the direct ef-
fects of these behavioral traits indicates significant results that go in the expected
direction. Holding performance in tests and socio-demographics constant, Math
grades improve (and significantly do so) when the child attends a higher propor-
tion of classes, when she gets higher grades in physical education, when parents
report her as dedicated to and motivated with school work and, ultimately, when
she herself declares not to procrastinate on finishing homework.28 Despite the
reduction in size, estimated racial gaps are still statistically significant.
Finally, in columns 7 and 8 we tackle the robustness of our findings to the pres-
ence of measurement error on the proficiency score variables. As discussed above,
because these are used as covariates in our analysis, biases on the estimation of all
parameters are expected. We therefore employ polynomials of lagged test scores
(resulting from tests taken in the most recent school year prior to the current
one) as instrumental variables. Reflecting the cumulative nature of proficiency
exams, past scores are very correlated with current ones (see first-stage summary
statistics in the appendix Table A2). Moreover, over-identification tests suggest
we have no obvious reason to distrust the validity of the sets of instruments em-
ployed (of course, Hansen’s test remains only a necessary but not a sufficient
condition for exogeneity) and, therefore, hints to the absence of unobserved het-
28These coefficient estimates are not shown in Table 1 to preserve space, and are available uponrequest.
VOL. VOL NO. ISSUE RACIAL DISCRIMINATION IN GRADING 27
erogeneity issues. Once measurement error is accounted for, we encounter smaller
racial differentials and at the same time larger slope parameters in the relation
between Math grades and Math test scores (marginal effects at the average pro-
ficiency level). The racial gaps are still significant after this correction. Indeed,
they are statistically significant even when we employ the more stringent Schwarz
criterion.29
We find that Blacks’ average Math grades are 0.35 points below those of equally
proficient and well-behaved Whites, or that the former are regularly ranked 0.7
percentiles behind the latter. These amount to 6 and 7% of the unconditional
gaps, respectively. By taking the ratio of coefficients in the estimated model, we
see that the Black-White differentials in teacher-assigned grades are equivalent
to the marginal effect of a reduction of 0.03 to 0.04 of one standard deviation in
proficiency scores. Incidentally, despite differences in methods, scales and context,
our results are within range (in standardized-tests units) of those experimentally
obtained by Hanna and Linden (2012).
Moreover, one may even argue that some of our control variables are the result
of grading discrimination in their own right, inducing our models to underestimate
the size of Black-White gaps. We see merit in such argumentation, since biased
grading within the school year can indeed induce students to “misbehave”, but
prefer to be as conservative as possible in our empirical exercises. We restrict the
analysis that follows to the use of a fully controlled model.
There are a number of reasons to believe these gaps are quite relevant. The
gaps we uncover are equivalent to 40% of the raw (within-classroom) difference
in terms of grades associated with having a mother with a college degree or more
versus a mother with a high-school degree only. They equivalently correspond to
30% of the effect of being a child with parents that own their home. Ultimately,
our measures of racial discrimination depends on the translation of intrinsically
29Considering our very large sample, the Schwarz criterion, which sets critical values of significance asa function of sample sizes is indeed more appropriate to judge the statistical significance of results.
28 AMERICAN ECONOMIC JOURNAL MONTH YEAR
ordinal scales into meaningful quantities, something that could only be achieved
in case they were to be directly associated with longer-term outcomes such as
employment and wages (Bond and Lang, 2013). In the context of the present
study there is an enormous potential for feedback effects, nonetheless. Teacher
communications may steer educational investment decisions in one way or the
other, with parents (and children themselves) updating decisions (and effort)
after extracting information from report cards issued by teachers. In this case,
intra-classroom evaluation biases may very well lead to gaps in attainment, school
choice, future scholastic performance and, ultimately, labor market outcomes.
Column 9 in Table 1 reproduces these exercises with a focus on meaningful
binary variables that summarize cardinal and ordinal gaps. According to these
estimates, the measured racial gap in promotion rates between equivalently pro-
ficient and well-behaved students corresponds to a 4.1% increase in the 8th-grade
retention probability for the average Black (Panel A). Focusing exclusively on the
ordinality aspect (Panel B) we also estimate a gap that translates into a 4.5% re-
duction on the probability of Blacks being graded above the classroom median.30
These meaningful effects are very much in line with the subtleties we expect to
permeate racial discrimination in grading.
In order to gather a sense of the size of these effects and (possibly) the mechanics
behind grading discrimination, we explore a simple simulation exercise. We start
by converting the blindly graded proficiency scores into a classroom-specific 0-100
scale. Conversion is undertaken by: a) computing the difference between the score
of student i and the minimum score in her classroom; b) dividing this quantity by
the difference between the maximum and minimum score in that classroom, and;
c) distributing this quantity in the range given by the teacher-assigned grades
in that classroom. We then add a simulated discriminatory rounding routine
while converting from a continuous into a discrete grade scale. This is done by
30In principle, if Blacks take standardized tests more seriously than in-class examinations relative totheir White counterparts we would expect to find results like these. This stereotype-threat-like argumentis indeed valid, but one for which we do not have a direct empirical implication to be tested using ourdata. Such caveat applies to the whole literature on racial and gender gaps in test scores/grades.
VOL. VOL NO. ISSUE RACIAL DISCRIMINATION IN GRADING 29
assuming that every time a Black student’s score lies in the [h + 4.5, h + 5.4),
where h is an integer in the 0-90 scale, the resulting grade is necessarily h. White
students in the exact same situation have h+10 as their assigned grades, following
unbiased rounding rules. We then compare the average racial gap in the biased
and unbiased conditions. We find that this biased rounding generates racial gaps
of 0.94 (in end-of-year grades) and 1.94 (in percentile rankings). Notice, therefore,
that the differences between Blacks and Whites we estimate above are between a
third and half the size of the ones in the simulated exercise. This is an interesting
finding, as it gives us a notion that the results we find are in the ballpark of what
happens when such a subtle discriminatory action is imposed over a share of the
four times teachers edit report cards during the school year, for example. This
exercise provides additional confidence that the results we uncover are not only
important but also very plausible.
B. Robustness of main findings and modeling choices
We also explore expected heterogeneity in the size of racial differentials and
its relation to some teacher characteristics (grading practices) to further examine
the robustness of our findings to the omission of behavioral characteristics. In
Table 2 (columns 1 and 2), before moving into the comparison across different
data strata, we present a summary of the main effects under the full sample and
under the subsample for which we have additional teacher characteristics (from
survey questionnaires). The contrast between these indicate that we should not
expect selection biases when dealing with the smaller sample.
In the first set of stratifications (columns 3 to 5) we examine if the gaps in
evaluation we measure are not generated by unobserved heterogeneity biases. We
explore a section of the questionnaire answered by teachers in the context of
SARESP, in which opinions regarding the importance of objective instruments of
evaluation (tests and exams) and also the importance of using more observational
methods (classroom behavior, students’ motivation, oral examinations, etc.) were
30 AMERICAN ECONOMIC JOURNAL MONTH YEAR
gathered. These questions were posed in an independent manner, so that there
they are not excludable categories. We explore these responses to stratify teachers
in three (not necessarily distinct) groups. Those that believe objective methods
are very important, those to whom objective methods are not important, and
those to whom subjective/observational methods are very important. We find no
evidence that these groups discriminate against Blacks with different intensities.
In fact, if anything, larger effects are found among those that believe in the
objective evaluation of students. In our opinion, this is the first indication that
imperfect information plays a central role in our findings: racial bias seems to
occur among those that are trying to extract the most out of their noisy measures
of proficiency.31
[Table 2 here]
Columns 6 and 7 are solely based on teacher demographics (obtained combining
official assignment records and survey questionnaires). We re-estimate our model
using fixed-effects instrumental variables techniques for different strata according
to teacher’s race, which is examined here to investigate in-group biases. We
see that no clear pattern emerges from these. Despite significant results among
Whites and not among Black and mixed-race teachers, we cannot rule that point
estimates are the same. These findings seem incompatible with both the idea
of taste discrimination (at least in its simplest format) against members of the
out-group and the idea that teachers have more information about pupils of their
own racial group. The very small number of Black teachers in our sample is
surely a limitation when examining these hypotheses, but also give additional
hints regarding overall racial discrimination in Sao Paulo.
In Table A3 in the Appendix we investigate the robustness of our formulation by
examining if the marginal impact of proficiency tests over grades are different for
Black and White students, as predicted by the screening discrimination version of
31In another exercise that examines unobserved heterogeneity biases we estimate if the difference infuture drop-out rates between retained and non-retained Blacks were larger than among Whites. If theywere it could mean that teachers observe other productive aspects on retained Blacks that they do notsee in retained Whites. We find that this is not the case in our data covering 2011 and 2012, however.
VOL. VOL NO. ISSUE RACIAL DISCRIMINATION IN GRADING 31
the model above. From the estimates presented, we have no evidence to support
the idea that slope coefficients should be student-race specific.32
C. Learning-by-grading
In order to more directly examine the role of imperfect information we explore
data on pupil-teacher matches by utilizing the longitudinal information on stu-
dents’ and teachers’ assignment to classrooms. We actually map the individual-
level acquaintance level between every student and their current teacher. In this
case we emulate a student-specific change in grading-effort (T ) exerted by her
current teacher. Simply put, larger T ’s should increase signal to noise ratios, in-
creasing the marginal effect of (posterior) proficiency measures at the same time
it reduces the one related to characteristics used to construct priors.
[Table 3 here]
It is clear from estimates in Table 3 that longer-term teacher-student inter-
actions produce smaller grading gaps associated with racial identity. In other
words, this empirical exercise reveals that while Black-White gaps in grades and
rakings are salient for students attending classes with a teacher for the first time,
no significant disparities are found among those that have already had classroom
interactions with that instructor before eighth grade. It is also the case that ac-
quaintance between teacher and students increase the weight given to proficiency
scores on the determination of grades or rankings (steeper relation). Both these
differences (in intercept and in slope) are shown statistically significant. In prac-
tice, Black students that have not interacted with their current teacher before
eighth grade have their grades diminished by what is equivalent to a taxation of
0.06 of one standard-deviation over proficiency tests’ performance. Those that
are known to the teacher are not “taxed” at all. This is our main indication that
imperfect information lies at the heart of the discrimination results we estimate.
Further experimenting with these ideas we examine stratifications based on
32The conclusion remains unchanged if we restrict this analysis to classrooms with White teachers.
32 AMERICAN ECONOMIC JOURNAL MONTH YEAR
different levels of detail in the information teachers have about their students.
In Table 4 we start by reproducing in column 1 the differences estimated in
Table 3. Columns 2, 3 and 4 focus on the proportion of students in a classroom
that are “known” to the current teacher. The idea here is that by knowing a
sufficient number of students, teachers are able to employ relative references to
grade their pupils. We do observed that to be the case, particularly regarding
the ranking measures (which we would expect to be more prone to the use of
relative referencing). In practice, racial gaps are not observed in classrooms where
teachers have had past interactions with at least 50% of the students, while they
are in case teachers know relatively less students. Once again conforming to
the model, the former also give more weight to proficiency scores when assessing
competence and defining end-of-year grades.
[Table 4 here]
In columns 5, 6 and 7 we turn to the idea that information flows result from
teachers’ tenure in a given school (and with a given population of students or set of
co-workers). When we estimate racial gaps employing this idea we find that indeed
gaps are larger among teachers that have shorter tenure in the school. Differences
in slopes are less precisely estimated but still support the role of information flows.
We have also estimated models with teacher-student-specific acquaintance levels
among longer tenure teachers and found room for “learning a student’s type”
even among those (not shown). This most likely means that the level of detail
regarding a student’s competence is finer when classroom interactions do occur
than when information is provided via interactions with other teachers in the
same school.
Finally, in columns 8 to 10 we examine if information is also spread via social
interactions within the schools’ neighborhood. Interestingly, in this case those
that would supposedly know more about the student population seem to discrim-
inate more. This makes us believe that the information flows that translate into
reduced discrimination need to be somewhat related to Math abilities, something
VOL. VOL NO. ISSUE RACIAL DISCRIMINATION IN GRADING 33
that teachers do capture within classroom/school settings, but that neighbors
cannot easily infer.
The robustness of our learning argument can be further put to the test by ex-
amining an alternative explanation for the findings above. In particular, we inves-
tigate if the assignment of teachers to students captured in our proposed measure
of knowledge above is not simply revealing that schools that assign teachers to the
same students are culturally different (say, in terms of taste for discrimination)
or even that students with specific behavioral characteristics are selected into
longer-term interactions with teachers. In Table 5 (columns 1 to 3) we strongly
reject both these threats by presenting evidence that neither Math-grade racial
gap nor its relation to proficiency are a function of length of interaction time
between a student and her Language teacher. It is important to emphasize that
in our context the group of students is common for Math and Language teachers,
so if there were a particular rule for allocating students to the same teacher year
after year this should be true for both subjects.33
[Table 5 here]
We reach the the exact same conclusion when we employ the identity of future
Math teachers to measure acquaintance levels in columns 4 to 6. Teachers that
will spend more time with a given student do not discriminate more or less today
than those that will not. Alternatively, students that will spend more time in-
teracting with their current Math teachers in the future do not have their racial
identification playing a role on evaluations that is different than for those that
that will not.
We conclude our analysis in Table 6 by verifying that our finding regarding
learning and consequent reduction in racial gaps are not a result of the omission
(at the level of the interaction effect) of other characteristics in our economet-
ric specification. In particular, we examine if by including interactions between
33Even though this is implict in these robustness exercises, for completeness, we present descriptivestatistics of students that do and do not spend more than one year interacting with a given teacher incolumns 4 to 7 of Table A1 in the Appendix.
34 AMERICAN ECONOMIC JOURNAL MONTH YEAR
teacher-student relation indicators and other control variables we are able to elim-
inate the differences observed in the race coefficient. Strikingly, we see no reason
to believe this is the case. From what we can tell from the estimates, a student
racial identity is likely used in our context as an indicator of lower proficiency.
Its impact over grades is remediated if teachers get to know (and test) students
for longer than an academic year.
[Table 6 here]
From this exercise we incidentally uncover three other very interesting (yet less
significant) patterns. First, social economic background variables seem to have
a role similar to race in these grading decisions, with teachers looking at indica-
tors of those (which are not necessarily directly observed) to draw their priors
regarding a student’s competence. This would be the case if clothing, mobile
phone ownership, and their quality/brands were used to infer socio-economic sta-
tus, for example. Of course, socio-economic background can also be translated
into higher endowments of other productive skills, being legitimately evaluated as
competence (e.g.: maternal education translating into better manners or better
vocabulary) and considered even by teachers that know well the student. These
interpretations are compatible with our findings. Second, behavioral traits have
a role on the evaluation that is independent of how much a teacher knows about
a specific student. That is to say: both those that are well acquainted with a
student and those that are not weight behavioral traits in the same way when
evaluating competence. Finally, our estimates indicate that the sizeable gender
differentials in grading estimated by these models do not operate in the same
way as racial gaps when it comes to information availability. Therefore we are
inclined to believe that statistical discrimination of the form we modeled does not
fit the case of gender discrimination in grading (see Botelho et al., 2013 for a more
detailed discussion). We see this as reinforcing our interpretation of racial biases,
however. Since we have no reason to believe that gender carries any information
in terms of potential competence in our context (social promotion or other social
VOL. VOL NO. ISSUE RACIAL DISCRIMINATION IN GRADING 35
programs did not have any gendered effect on access to eight grade), a child’s sex
should not contribute to the formation of teachers priors in any particular way.
Taken together, main and auxiliary findings clearly substantiate the formula-
tion of a conceptual framework like the one we proposed, particularly with regards
to a well-defined channel of operation for information. Most importantly, how-
ever, our “dynamic” findings can be interpreted as reinforcing the robustness
of our basic results to unobserved heterogeneity biases (in the form of omitted
time-invariant student-specific characteristics). Since we see no indication that
students interacting with a given teacher for more than an academic year have
specific characteristics (among the many we indeed measure), there is no reason
to believe omission biases would only be operating within the sample of first-time
interactions between pupils and teachers.
Summing up, the econometric results presented here are not only robust to
possible omissions of behavioral attributes and to the likely incidence of measure-
ment error on scores from standardized tests, but are also very much in line with
the expected subtlety of this particular form of discrimination within Brazilian
schools.
VI. Conclusions
In this article, we empirically detect racial discrimination within racially in-
tegrated Brazilian eighth grade public-school classrooms. Math teachers’ assess-
ments of students with respect to scholastic proficiency and aptitude (grading) are
found to be biased. White students are less likely to be deemed non-competent
(below passing grade) than their equally proficient and equivalently well-behaved
Black classmates. The former are also relatively more likely to be graded above
their classroom median. Quantitatively, these correspond to a 4.1% increase in
the retention probability and a 4.5% reduction in the probability of Blacks being
at the top of their class grade distribution. Such effects are equivalent to “taxing”
Blacks’ performance in proficiency tests by 0.03 to 0.04 of one standard deviation.
36 AMERICAN ECONOMIC JOURNAL MONTH YEAR
These results are shown robust to possible omissions of a students’ behavioral at-
tributes and to the incidence of measurement error on scores from standardized
tests. It turns out that well intentioned teachers issue report cards for their stu-
dents with subtle biases (possibly incurred when rounding continuous marks into
a discrete scale, for example) and in, this way, may end up adding obstacles to
the acquisition educational credentials by Blacks. These are meaningful effects
resulting from racial discrimination in grading. They are equivalent to 40% of
the raw (within-classroom) difference in terms of grades associated with having a
mother with a college degree or more versus a mother with a high-school degree
only, or to 30% of the effect of being a child of parents that own their home.
We also find that these biases most likely result from imperfect information and
statistical discrimination or, in other words, from the weighted combination of
noisy proficiency signals extracted from teacher-designed exams and stereotyped
priors. In the case explored here, stereotyping seems to have resulted from le-
nient standards for admission of students into eighth grade (which have dispropor-
tionally benefited Blacks). Improvements in the signal-extraction “technology”
available to teachers make race a less relevant element of the grade assignment
process and, at the same time, strengthen the relationship between grades and
individual proficiency scores. This is clearly shown to be the case in our data,
particularly when we use the length of classroom-interaction time between the
teacher and a given student. In practice, Black students that have not interacted
with their current teacher before eighth grade have their grades diminished by
what is equivalent to a taxation of 0.06 of one standard-deviation over proficiency
tests’ performance. Those that are known to the teacher are not “taxed” at all.
Our findings lead to some education-policy implications. First, curbing teacher
rotation (which is very high in our context) can be particularly important for
Black students. Beyond their likely influence over learning, increased interactions
between a group of students and a given teacher diminishes the influence of noise
on the evaluation of scholastic proficiency. The more a teacher gets acquainted
VOL. VOL NO. ISSUE RACIAL DISCRIMINATION IN GRADING 37
with a given student, the less relevant the latter’s race becomes for screening pur-
poses. Second, direct investment in training of teachers with regards to the design
of exams and tests may be warranted when attempting to curb discriminatory
outcomes. If equipped with better signal extracting technologies, teachers would
not need to resort to distorted priors. Third, educational governing bodies could
promote the clear communication of (already collected) standardized test results
at the individual level to teachers as a way of widening their information set about
students’ abilities. Finally, our results point to important nuances on the overall
impact of affirmative action policies in admission to college (or social promotion
schemes in basic education for that matter) in environments where the progress
of those targeted by the policy depends on continued subjective evaluations of
performance. Facilitating access can also impose lower ceilings.
In scientific terms, the results presented here indicate that well-designed ran-
domized control trials focusing on the amount, type, and timing of information
about individual students available to teachers can go a long distance in help-
ing us understand the inner workings of grading discrimination within schools.
They also pave the road to studies that focus on parental/student responses to
school reports in terms of investments in the accumulation of human capital
(or to parent-school communication mechanisms in general) as well as to more
ambitious and controlled examinations of social promotion schemes effects over
students’ future outcomes. We leave these for our future research on such topics.
REFERENCES
Aigner, D. and G. Cain (1977); “Statistical theories of discrimination in the labor mar-ket”. Industrial and Labor Relations Review, 30, 175-187.
Alexander, N.; A Guimaraes; C. Hamilton; L. Huntley and W. James (2001); “BeyondRacism: Race and Inequality in Brazil, South Africa, and the United States,” L. RiennerPublisher, Boulder, CO.
Altonji, J. and C. Pierret (2001); “Employer Learning and Statistical Discrimination”.The Quartely Journal of Economics, Vol.116. No. 1 (Feb.2001), pp. 313-350.
38 AMERICAN ECONOMIC JOURNAL MONTH YEAR
Andrabi, T.; J. Das; A. Khwaja and T. Zajonc (2011); “Do Value-Added EstimatesAdd Value? Accounting for Learning Dynamics”, American Economic Journal: AppliedEconomics, 3(3): 29-54.
Arias, O.; G Yamada and L.Tejerina (2004); “Education, Family Background and RacialEarnings Inequality in Brazil”, manuscript, Inter-American Development Bank, Wash-ington, DC, USA.
Arrow, K. (1971); “Some Mathematical Models of Race in the Labor Market” in Pascal,A. (ed.) Racial Discrimination in Economic Life (Lexington, MA: Lexington Books) 187-204.
Assuncao, J. and B. Ferman (2013); “Does Affirmative Action Enhance or UndercutInvestment Incentives? Evidence from Quotas in Brazilian Public Universities”, unpub-lished manuscript, Sao Paulo School of Economics, Fundacao Getulio Vargas.
Autor, D. and D. Scarborough (2008); “Does Job Testing Harm Minority Workers?Evidence from Retail Establishments”, The Quarterly Journal of Economics, 123 (1):219-277.
Becker, G (1957); The Economics of Discrimination, The University of Chicago Press.
Ben-Zeev, Avi; Tara C. Dennehy; Robin I. Goodrich; Branden S. Kolarik; and Mark W.Geisler (2014); “When an “Educated” Black Man Becomes Lighter in the Mind’s Eye:Evidence for a Skin Tone Memory Bias”, SAGE Open, 4(1), January.
Bjerk, D. (2008); “Glass Ceilings or Sticky Floors? Statistical Discrimination in aDynamic Model of Promotion and Hiring”, The Economic Journal, 118 (July).
Black, D.; M. Berger and F. Scott (2000); “Bounding Parameter Estimates with Nonclas-sical Maeasurement Error”. Journal of the American Statistical Association, 95 (451),pp 739-748.
Blume, L. (2006); “The Dynamics of Statistical Discrimination”, The Economic Journal,Vol 116, November, pp. F480-F498.
Bond, T. and K. Lang (2013); “The Evolution of the Black-White Test Schore Gap inGrades K-3: The Fragility of Results”. The Review of Economics and Statistics, Vol95(5), pp 1468-1479.
Borjas, G. and A. Goldberg (1978); “Biased Screening and Discrimination in the LaborMarket”. The American Economic Review, Vol. 68, No. 5 (Dec.,1978), pp. 918-922.
Botelho, F.; R. Madeira and M. A. Rangel (2013); “Gender disparities in test scores andteacher assessments”, Working paper, PLAS Princeton and University of Sao Paulo.
Bowles, S. and H. Gintis (1976); Schooling in Capitalist America. New York: BasicBooks.
Burgess, S. and E. Greaves (2003); “Test Scores, Subjective Assessment, and Stereotyp-ing of Ethnic Minorities”. Journal of Labor Economics, Vol. 31(3), pp. 535-576.
Coate, S. and G. Loury (1993); “Will Affirmative-Action Policies Eliminate NegativeStereotypes?”, The American Economic Review, American Economic Association, vol.83(5), pages 1220-40, December.
VOL. VOL NO. ISSUE RACIAL DISCRIMINATION IN GRADING 39
Cornell, B. and I. Welch (1996); “Culture, Information, and Screening Discrimination”.Journal of Political Economy, 1996, vol. 104, no. 3
Cornwell, D.; B. Mustard and J. Van Parys (2013); “Noncognitive Skills and the GenderDisparities in Test Scores and Teacher Assessments: Evidence from Primary School.”Journal of Human Resources, Vol. 48(1), pp. 236-264.
Cortes, K. and L. Zhang (2012); “The Incentive Effects of the Top 10% Plan” unpub-lished manuscript, The Bush School of Government and Public Service.
Cotton, C.; B. Hickman and J. Price (2014); “Affirmative Action and Human CapitalInvestment: Evidence from a Randomized Field Experiment”. NBER Workin PaperSeries, WP No. 20397, August.
Demeis, D. and R. Turner (1978); “Effects of Students’ Race, Physical Attractiveness,and Dialect on Teachers’ Evaluations”. Contemporary Educational Psychology 3 (1):77-86.
Dorsey, J. K. and J. Colliver (1995); “Effect of Anonymous Test Grading on PassingRates as Related to Gender and Race”. Academic Medicine 70 (4): 321-23.
Dovidio, J. F.; J. Brigham; B. Johnson and S. Gaertner (1996); “Stereotyping, Prejudice,and Discrimination: Another Look” in N. Macrae; C. Stangor and M. Hewstone (eds.)Stereotypes and Stereotyping, New York, Guilford.
Farber, H. and R. Gibbons (1996); “Learning and Wage Dynamics” The QuarterlyJournal of Economics, 111 (4): 1007-1047.
Farkas, G.; R. Grobe; D. Sheehan and Y. Shuan (1990); “Cultural Resources and SchoolSuccess: Gender, Ethnicity, and Poverty Groups within an Urban School District” TheAmerican Sociological Review, 1990, Vol.55 (February: 127-142).
Ferguson, R. (1998); “Can Schools Narrow the Black-White Score Gap?” in C. Jencksand M. Phillips (eds.) The Black-white Test Score Gap, The Brookings Institution.
Ferguson, R. (2003); “Teachers’ Perceptions and Expectations and the Black-White TestScore Gap”. Urban Education 38 (4): 460-507.
Figlio, D. (2005); “Names, Expectations and the Black-White Test Score Gap”, NBERWorking Paper No. 11195.
Gelbach, J. (2009); “When Do Covariates Matter? And Which Ones, and How Much?”;Working Paper 09-07, University of Arizona 2009.
Hanna, R. and L. Linden (2012); “Discrimination in Grading”. American EconomicJournal: Economic Policy, 4(4): 146-168.
Hedges, L. and Nowell, A. (1999); “Changes in the Black-White Gap in AchievementTest Scores”.Sociology of Education, 72:2, 111-135.
Herring. C; V. Keith and K. Horton (2004); “Skin Deep: How Race and ComplexionMatter in the Color-Blind Era” Institute for Research on Race and Public Policy.
Hinnerich, B.; E. Hoglin and M. Johannesson (2011); “Are boys discriminated in Swedishhigh schools?” Economics of Education Review, Vol. 48(1), pp. 236-264.
40 AMERICAN ECONOMIC JOURNAL MONTH YEAR
Hinnerich, B.; E. Hoglin and M. Johannesson (2011); “Ethnic Discrimination in HighSchool Grading: Evidence from a Field Experiment.” SSE/EFI Working Paper Seriesin Economics and Finance, 733.
Holmstrom, B. and P. Milgrom (1991); “Multitask Principal-Agent Analysis: Incen-tive Contracts, Asset Ownership, and Job Design.” Journal of Law, Economics andOrganizations, Vol. 7, pp. 24-52.
King, E.; P. Orazem and E. Paterno (2008); “Promotion With and Without Learning”,World Bank Policy Research Working Paper, 10.1596/1813-9450-4722.
Lam, D.; C. Ardington and M. Leibbrandt (2006); “Schooling as a Lottery: RacialDifferences in School Advancement in Urban South Africa”, University of Cape Town,Working Paper Number 56.
Lang, K. (1986); “A Language Theory of Discrimination”, The Quarterly Journal ofEconomics 101 (2): 363-382.
Lavy, V. (2008); “Do Gender Steriotypes Reduce Girls’ or Boys’ Human Capital Out-comes? Evidence from a Natural Experiment”. Journal of Public Economics, 92 (10-11):2083-2105.
Lehmann, J. K. (2011); “Job Assignment and Promotion Under Statistical Discrimina-tion: Evidence from the Early Carrers of Lawyers”. Unpublished manuscript, Universityof Houston.
Leiter, J. and J. Brown (1985); “Determinants of Elementary School Grading”. Sociologyof Education 58: 166-80.
Lewbel, A. (2012); “Using Heteroskedasticity to Identify and Estimate Mismeasured andEndogenous Regressor Models”. Journal of Business and Economic Statistics, Volume30, Issue 1, pp. 67-80.
List, J. (2004); “The Nature and Extent of Discrimination in the Marketplace: Evidencefrom the Field”. The Quarterly Journal of Economics, 119 (1): 49-89.
Lundberg, S. and R. Startz (1983); “Private Discrimination and Social Intervention inCompetitive Labor Markets”. The American Economic Review, LXXIII, 340-347
Lundberg, S. and R. Startz (2007); “Information and racial exclusion”. Journal of Pop-ulation Economics, vol. 20(3), pages 621-642, July.
Madeira, R. and M. A. Rangel (2013); “Racial Achievement Gaps in Another America:Discussing Schooling Outcomes and Affirmative Action in Brazil” in J. Clarke (ed)Closing the Achievement Gap from an International Perspective, Springer Verlag.
Metchemberg, L. (2009); “Cheap Talk in the Classroom: How Biased Grading at SchoolExplains Gender Differences in Achievements, Career Choices and Wages”, The Reviewof Economic Studies, 76, 1431-1459.
Natriello, G. and S. Dornbusch (1984); “Bringing Behavior Back In: The Effects of Stu-dent Characteristics and Behavior on the Classroom Behavior of Teachers.” AmericanEducational Research Jounal 20: 29-43.
Neal, D. (2006); “Why has the Black-White Skill Convergence Stopped?” Handbook ofthe Economics of Education, Volume 1.
VOL. VOL NO. ISSUE RACIAL DISCRIMINATION IN GRADING 41
Ost, Ben (2014); “How Do Teachers Improve? The Relative Importance of Specificand General Human Capital.” American Economic Journal: Applied Economics, 6(2):127-51.
Perry, G.; O. Arias; J. H. Lopez; W. Maloney and L. Serven (2006); “Poverty Reductionand Growth: Virtuous and Vicious Circles”, The World Bank.
Phelps, E. (1972); “The Statistical Theory of Racism and Sexism”, The AmericanEconomic Review, American Economic Association, vol. 62(4), pages 659-61, September.
Phillips M.; J. Crouse and J. Ralph (1998); “Does the Black-White Test Score GapWiden After Children Enter School?” in C. Jencks and M. Phillips (eds.) The Black-white Test Score Gap, The Brookings Institution.
Reardon, S. (2008); “Differential Growth in the Black-White Achievement Gap Dur-ing Elementary School Among Initially High-and-Low-Scoring Students”. Institute forResearch on Education Policy and Practice, Working Paper: 2008-07.
Rigobon, R. (2003); “Identification through Heteroskedasticity”. The Review of Eco-nomics and Statistics, Vol. 85, No. 4, pp. 777-792.
Rist, R. (1973); The Urban School: A Factory for Failure. Cambridge, MA: MIT Press.
Rosenthal, L. and R. Jacobson (1968); Pygmalion in the Classroom. New York: Holt.
Samejima, F. (1994); “Estimation of Reliability Coefficients Using Test Informa-tion Function and its Modifications” Applied Psychological Measurement, Vol. 18 (3):September, pp. 229-244.
Sexton, P. (1961); Education and Income. New York: Viking.
Sewell, W. and R. Hauser (1984); “The Wisconsin Longitudinal Study of Social andPsychological Factors in Aspiration and Achievements”. Pp. 59-100 in Research in So-ciology of Education and Socialization, vol.1, edited by Alan C. Kerchkhoff. Greenwich,CT: JAI Press.
Shay, S. and B. Jones (2006), “Anonymous Examination Marking at University of CapeTown: The Quest for an Agonising-Free Zone”. South Africa Journal of Higher Educa-tion 20 (4): 528-46.
Sprietsma, M. (2012); “Discrimination in grading: experimental evidence from primaryschool teachers.” Empirical Economics, Vol. 45(1), pp. 523-538.
Telles, E. (2004); “Race in Another America: The Significance of Skin Color in Brazil”Princeton University Press.
Telles, E. and L. Steele (2012); “Pigmentocracy in the Americas: How is EducationalAttainment Related to Skin Color?”, Americas Barometer Insights, 2012, Number 73.
Trawalter, S.; K. Hoffman and A. Waytz (2012); “Racial Bias in Perceptions of Others’Pain”. PLOS ONE, November, Volume 7, Issue 11.
United Nations (2005); “Brazil: National Human Development Report”, New York,USA.
Williams, T. (1976); “Teacher Prophecies and the Inherittance of Inequality”. Sociologyof Education, 49: 223-36.
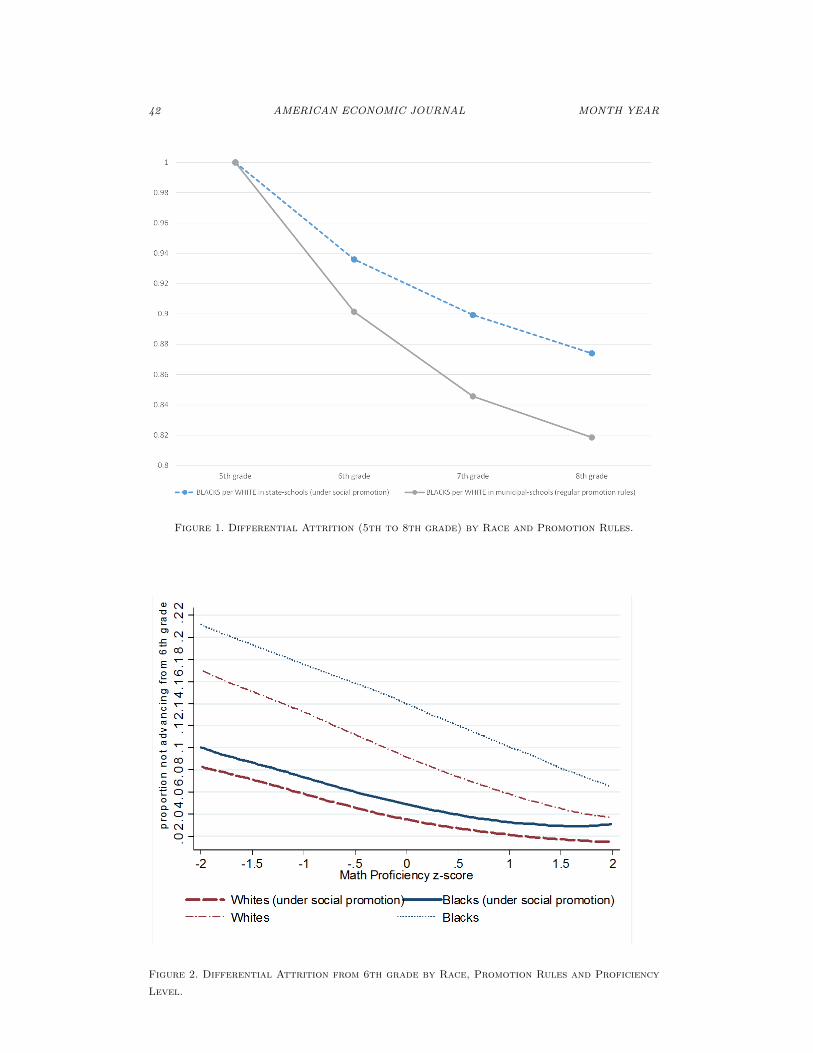
42 AMERICAN ECONOMIC JOURNAL MONTH YEAR
Figure 1. Differential Attrition (5th to 8th grade) by Race and Promotion Rules.
Figure 2. Differential Attrition from 6th grade by Race, Promotion Rules and Proficiency
Level.
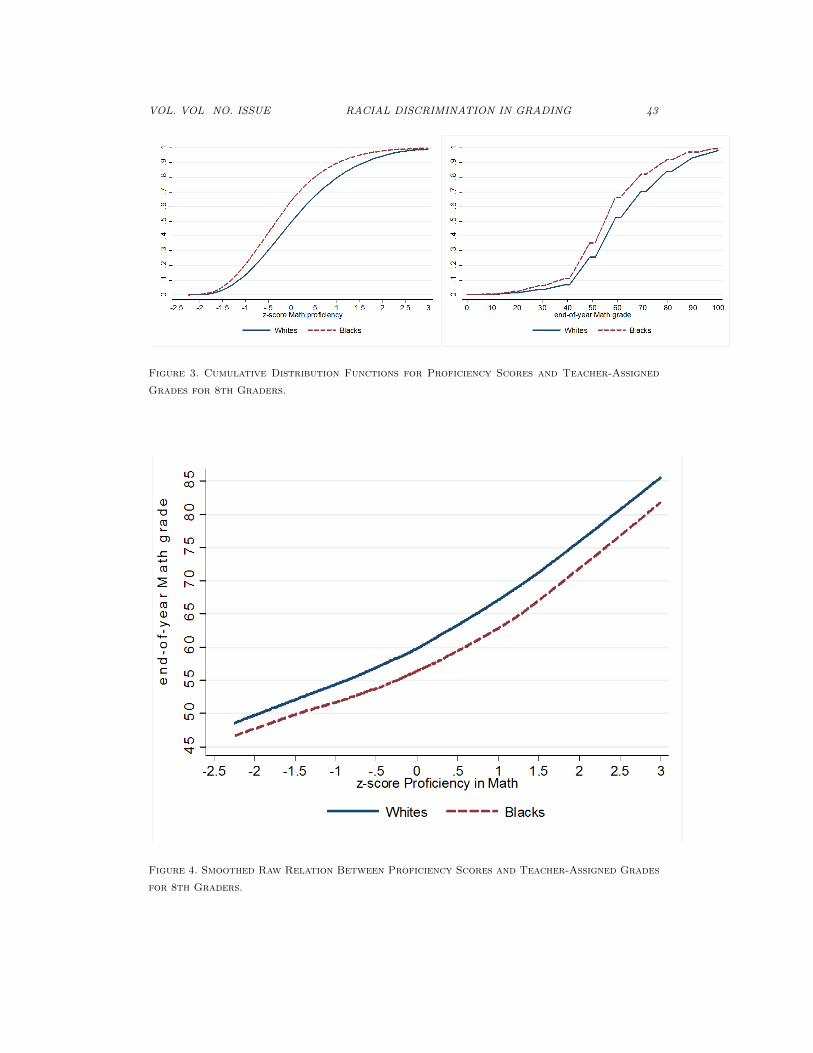
VOL. VOL NO. ISSUE RACIAL DISCRIMINATION IN GRADING 43
Figure 3. Cumulative Distribution Functions for Proficiency Scores and Teacher-Assigned
Grades for 8th Graders.
Figure 4. Smoothed Raw Relation Between Proficiency Scores and Teacher-Assigned Grades
for 8th Graders.
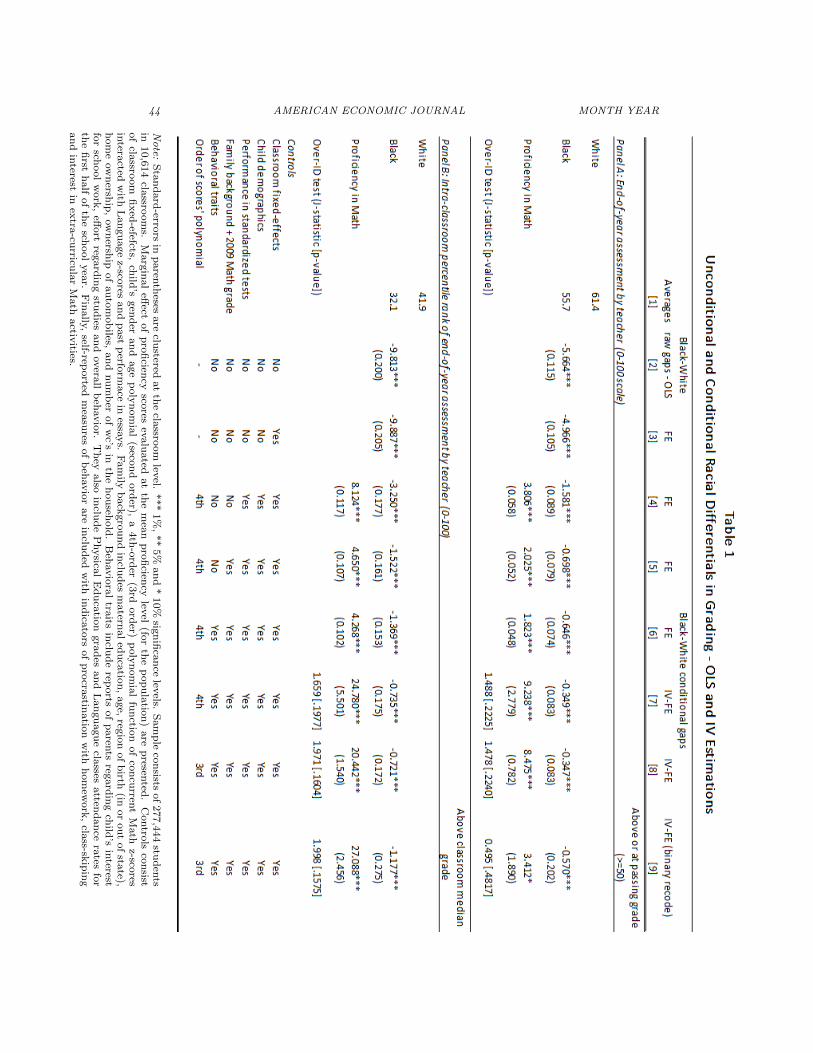
44 AMERICAN ECONOMIC JOURNAL MONTH YEAR
Note:
Sta
nd
ard
-errors
inp
aren
theses
are
clustered
at
the
classro
om
level.
***
1%
,**
5%
an
d*
10%
sign
ifica
nce
levels.
Sam
ple
con
sistsof
277,4
44
stud
ents
in10,6
14
classro
om
s.M
arg
inal
effect
of
pro
ficien
cysco
resev
alu
ated
at
the
mea
np
rofi
ciency
level
(for
the
pop
ula
tion
)are
presen
ted.
Contro
lsco
nsist
of
classro
om
fixed
-efefcts,ch
ild’s
gen
der
an
dage
poly
nom
ial
(secon
dord
er),a
4th
-ord
er(3
rdord
er)p
oly
nom
ial
fun
ction
of
con
curren
tM
ath
z-scores
intera
ctedw
ithL
an
gu
age
z-scores
an
dp
ast
perfo
rmace
inessa
ys.
Fam
ilyb
ack
gro
un
din
clud
esm
atern
al
edu
catio
n,
age,
regio
nof
birth
(inor
ou
tof
state),
hom
eow
nersh
ip,
ow
nersh
ipof
au
tom
ob
iles,an
dnu
mb
erof
wc’s
inth
eh
ou
sehold
.B
ehavio
ral
traits
inclu
de
reports
of
paren
tsreg
ard
ing
child
’sin
terestfo
rsch
ool
work
,eff
ort
regard
ing
stud
iesan
dovera
llb
ehavio
r.T
hey
also
inclu
de
Physica
lE
du
catio
ngra
des
an
dL
an
gu
agu
ecla
ssesatten
dan
cera
tesfo
rth
efi
rsth
alf
of
the
school
yea
r.F
inally,
self-reported
mea
sures
of
beh
avio
rare
inclu
ded
with
ind
icato
rsof
pro
crastin
atio
nw
ithh
om
ework
,cla
ss-skip
ing
an
din
terestin
extra
-curricu
lar
Math
activ
ities.
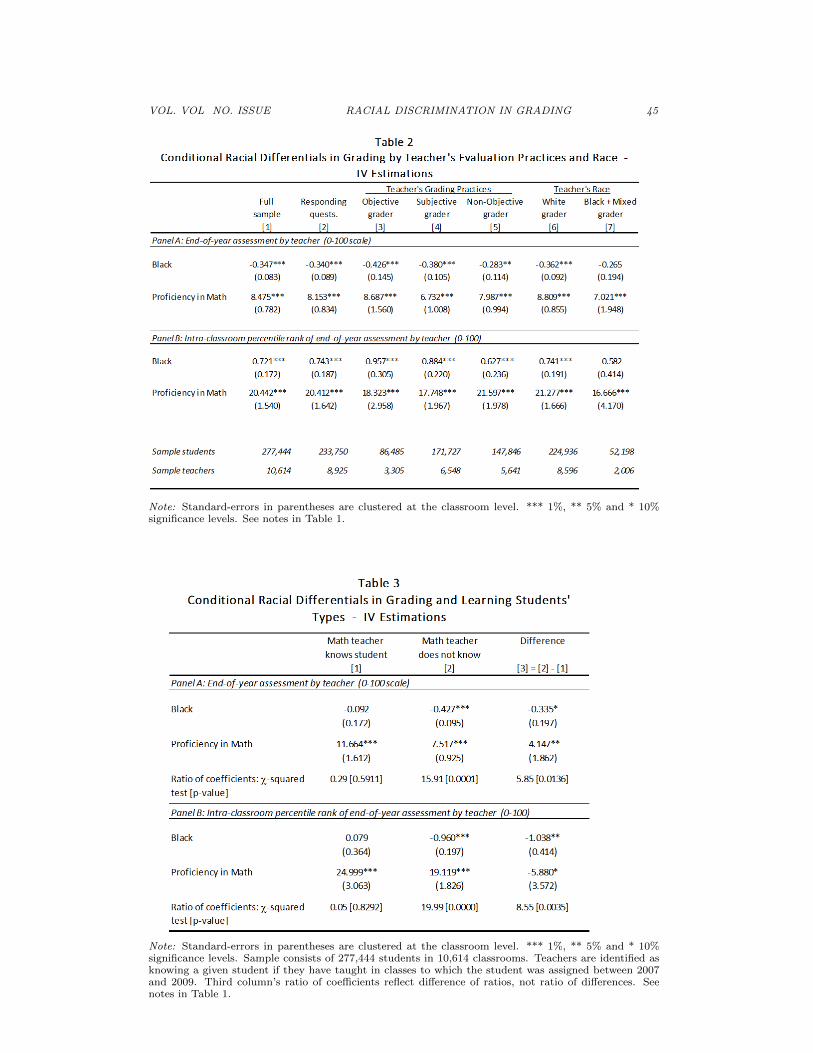
VOL. VOL NO. ISSUE RACIAL DISCRIMINATION IN GRADING 45
Note: Standard-errors in parentheses are clustered at the classroom level. *** 1%, ** 5% and * 10%significance levels. See notes in Table 1.
Note: Standard-errors in parentheses are clustered at the classroom level. *** 1%, ** 5% and * 10%significance levels. Sample consists of 277,444 students in 10,614 classrooms. Teachers are identified asknowing a given student if they have taught in classes to which the student was assigned between 2007and 2009. Third column’s ratio of coefficients reflect difference of ratios, not ratio of differences. Seenotes in Table 1.
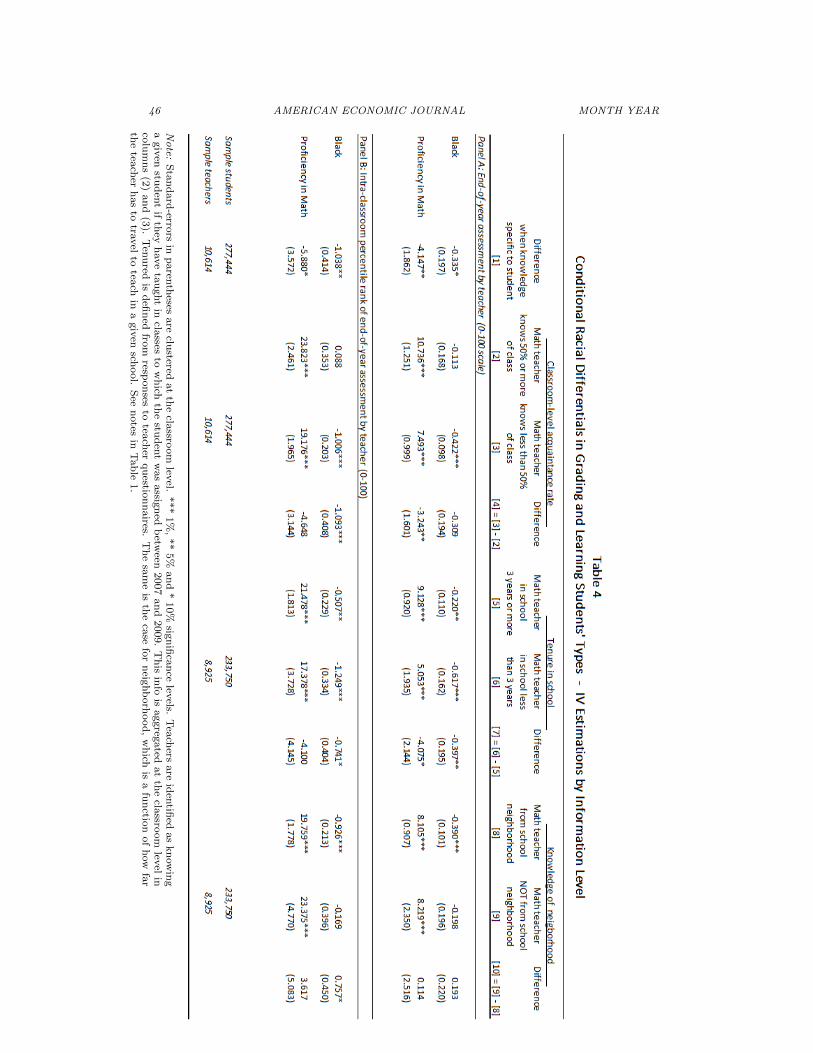
46 AMERICAN ECONOMIC JOURNAL MONTH YEAR
Note:
Sta
nd
ard
-errors
inp
aren
theses
are
clustered
at
the
classro
om
level.
***
1%
,**
5%
an
d*
10%
sign
ifica
nce
levels.
Tea
chers
are
iden
tified
as
kn
ow
ing
agiv
enstu
den
tif
they
have
tau
ght
incla
ssesto
wh
ichth
estu
den
tw
as
assig
ned
betw
een2007
an
d2009.
This
info
isaggreg
ated
at
the
classro
om
level
inco
lum
ns
(2)
an
d(3
).T
enu
redis
defi
ned
from
respon
sesto
teach
erqu
estion
naires.
Th
esa
me
isth
eca
sefo
rn
eighb
orh
ood
,w
hich
isa
fun
ction
of
how
far
the
teach
erh
as
totra
vel
totea
chin
agiv
ensch
ool.
See
notes
inT
ab
le1.
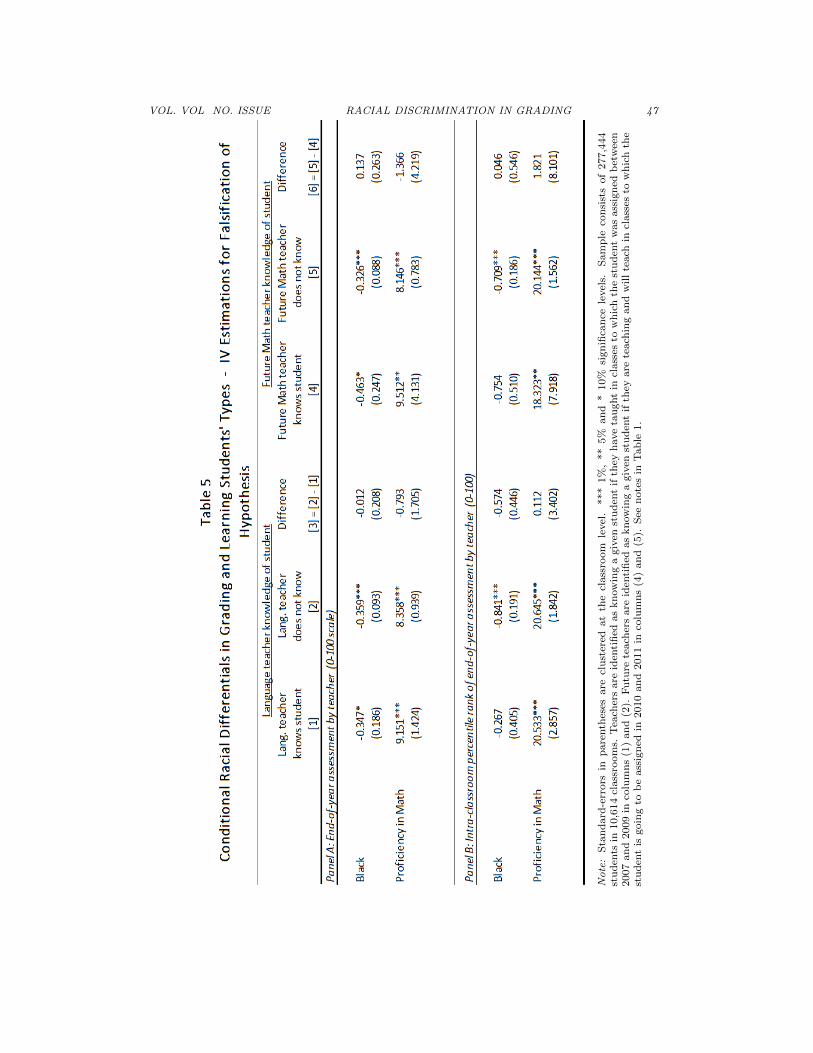
VOL. VOL NO. ISSUE RACIAL DISCRIMINATION IN GRADING 47
Note:
Sta
nd
ard
-err
ors
inp
are
nth
eses
are
clu
ster
edat
the
class
room
level
.***
1%
,**
5%
an
d*
10%
sign
ifica
nce
level
s.S
am
ple
con
sist
sof
277,4
44
stu
den
tsin
10,6
14
class
room
s.T
each
ers
are
iden
tifi
edas
kn
ow
ing
agiv
enst
ud
ent
ifth
eyh
ave
tau
ght
incl
ass
esto
wh
ich
the
stu
den
tw
as
ass
ign
edb
etw
een
2007
an
d2009
inco
lum
ns
(1)
an
d(2
).F
utu
rete
ach
ers
are
iden
tifi
edas
kn
ow
ing
agiv
enst
ud
ent
ifth
eyare
teach
ing
an
dw
ill
teach
incl
ass
esto
wh
ich
the
stu
den
tis
goin
gto
be
ass
ign
edin
2010
an
d2011
inco
lum
ns
(4)
an
d(5
).S
een
ote
sin
Tab
le1.
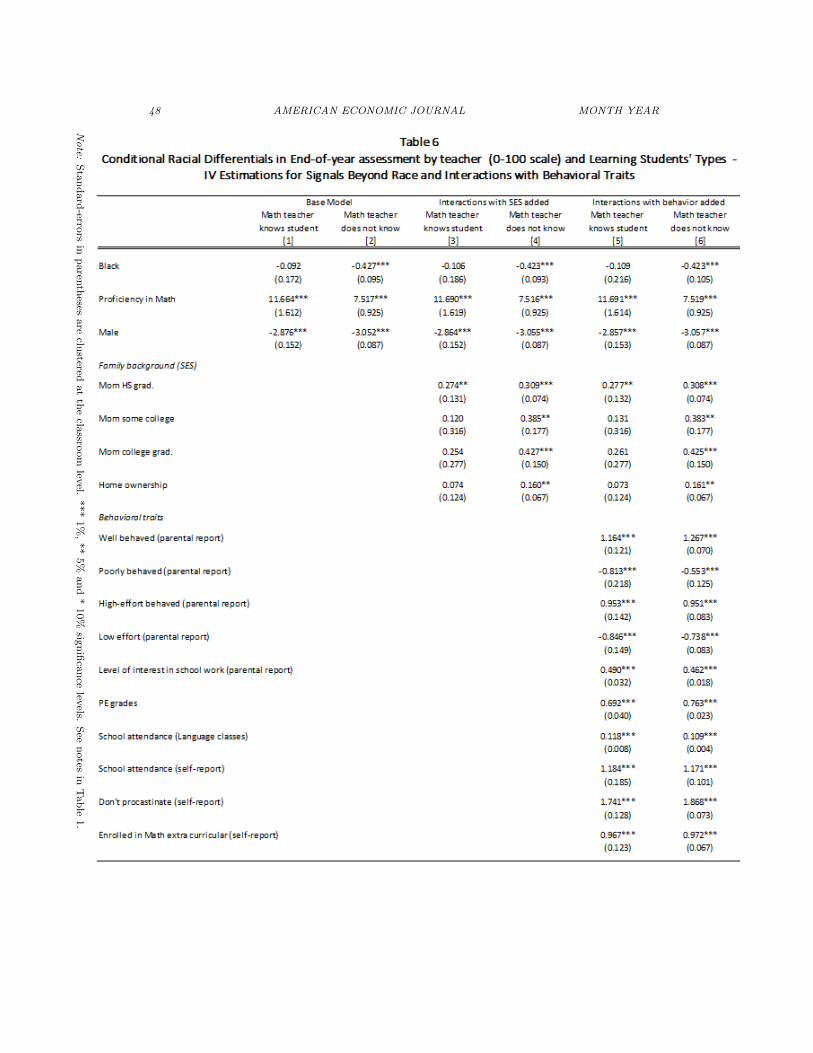
48 AMERICAN ECONOMIC JOURNAL MONTH YEAR
Note:
Sta
nd
ard
-errors
inp
aren
theses
are
clustered
at
the
classro
om
level.
***
1%
,**
5%
an
d*
10%
sign
ifica
nce
levels.
See
notes
inT
ab
le1.
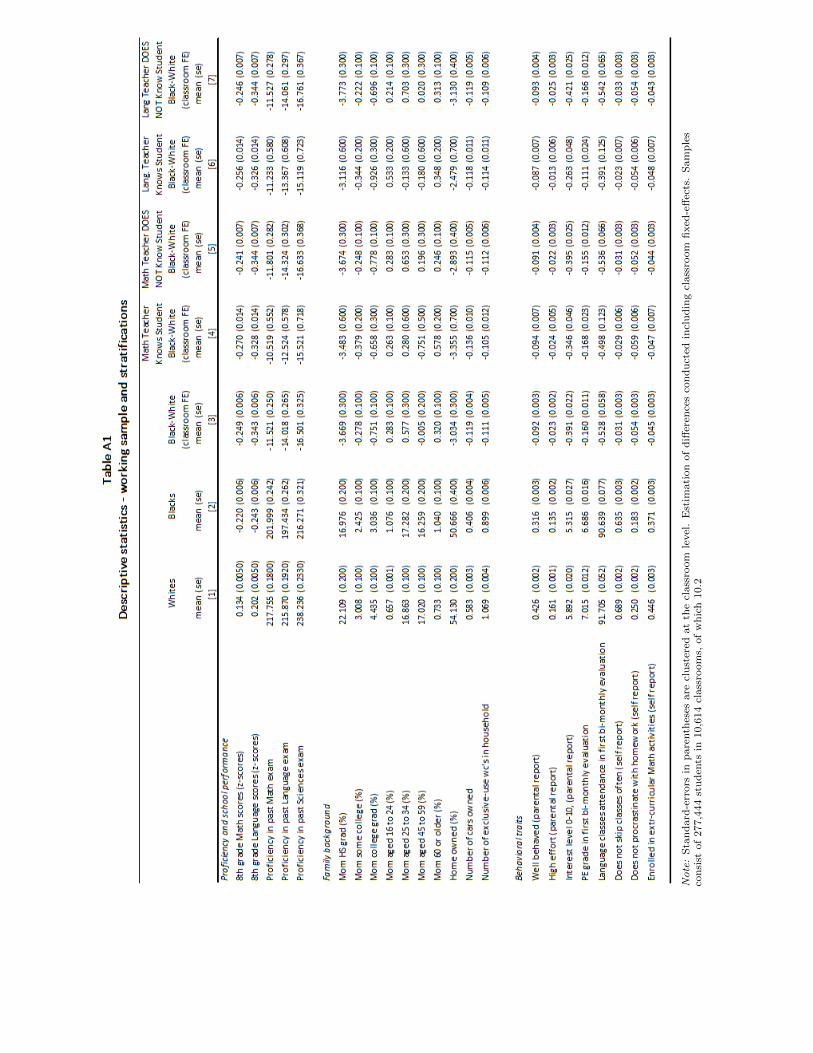
VOL. VOL NO. ISSUE RACIAL DISCRIMINATION IN GRADING 49
Note:
Sta
nd
ard
-err
ors
inp
are
nth
eses
are
clu
ster
edat
the
class
room
level
.E
stim
ati
on
of
diff
eren
ces
con
du
cted
incl
ud
ing
class
room
fixed
-eff
ects
.S
am
ple
sco
nsi
stof
277,4
44
stu
den
tsin
10,6
14
class
room
s,of
wh
ich
10.2
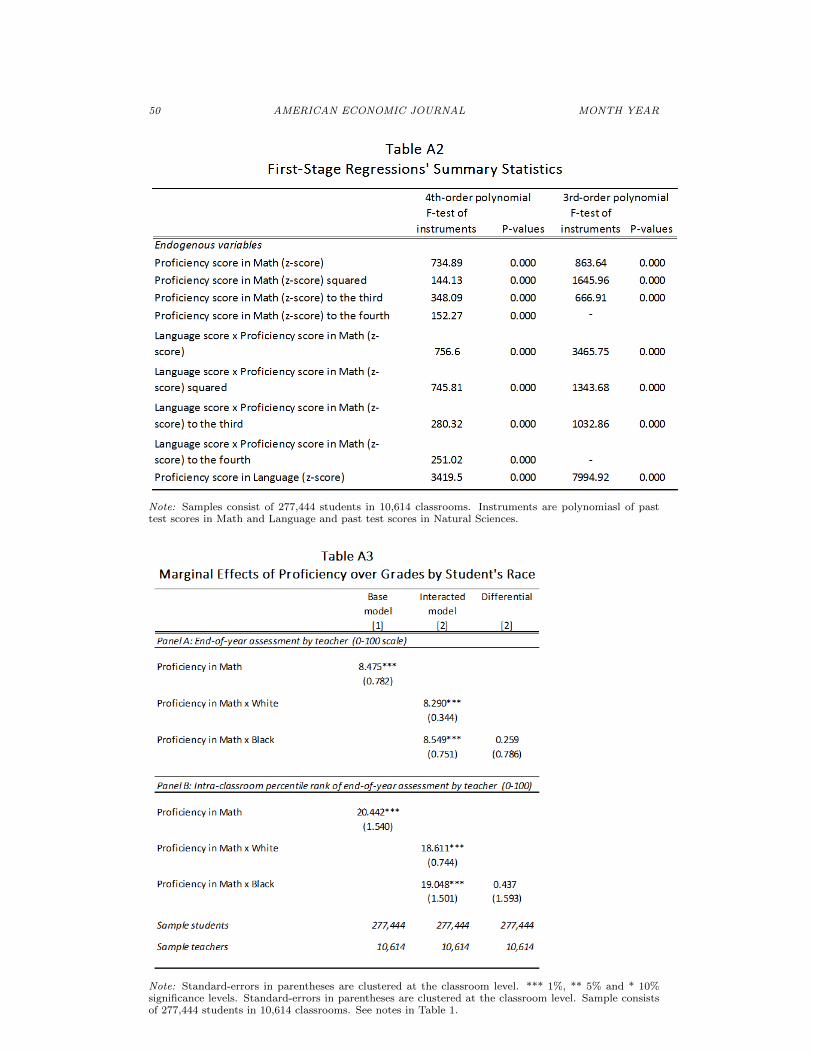
50 AMERICAN ECONOMIC JOURNAL MONTH YEAR
Note: Samples consist of 277,444 students in 10,614 classrooms. Instruments are polynomiasl of pasttest scores in Math and Language and past test scores in Natural Sciences.
Note: Standard-errors in parentheses are clustered at the classroom level. *** 1%, ** 5% and * 10%significance levels. Standard-errors in parentheses are clustered at the classroom level. Sample consistsof 277,444 students in 10,614 classrooms. See notes in Table 1.