R3: Recruiting, Retaining, and Rewarding Educators … · R3: Recruiting, Retaining, and Rewarding...
46
R3: Recruiting, Retaining, and Rewarding Educators through Multiple Career Pathways and Performance-Based Compensation Table of Contents (a) Significance 1-7 (b) Quality of the Project Design (1) The extent to which the proposed project is part of a comprehensive effort to improve teaching and learning and support rigorous academic standards for students supported; 8-23 (2) The extent to which the services to be provided by the proposed project involve the collaboration of appropriate partners for maximizing the effectiveness of project services; 23-24 (3) The extent to which the proposed project is supported by a strong theory; 24-27 (4) The extent to which the proposed project will integrate with or build on similar or related efforts to improve the relevant outcomes, using existing funding streams from other programs or policies supported by community, State, and Federal resources. 27-29 (c) Professional Development Systems 29-32 (d) Quality of the Management Plan 32-38 (e) Adequacy of Resources (1) The extent to which applicant demonstrates that Performance- Based Compensation Systems are developed with the input of teachers and school leaders in the schools and local educational agencies to be served by the grant. 38-40 (2) The extent to which the applicant demonstrates a plan to sustain financially the activities conducted and systems developed under the grant once the grant period has ended. 40 References 41-45 Appendices TIF Optional Application Requirements Checklist Appendix A TIF Optional High-Need School Checklist Appendix B Logic Model Appendix C Resumes of Key Personnel Appendix D Letters of Support Appendix E High-Need Documentation Appendix F Indirect Cost Appendix G
Transcript of R3: Recruiting, Retaining, and Rewarding Educators … · R3: Recruiting, Retaining, and Rewarding...
R3: Recruiting, Retaining, and Rewarding
Educators through Multiple Career Pathways and Performance-Based Compensation
Table of Contents
(a) Significance 1-7
(b) Quality of the Project Design
(1) The extent to which the proposed project is part of a comprehensive effort to improve teaching and learning and support rigorous academic
standards for students supported;
8-23
(2) The extent to which the services to be provided by the proposed project involve the collaboration of appropriate partners for
maximizing the effectiveness of project services;
23-24
(3) The extent to which the proposed project is supported by a strong theory;
24-27
(4) The extent to which the proposed project will integrate with or
build on similar or related efforts to improve the relevant outcomes, using existing funding streams from other programs or policies supported by community, State, and Federal resources.
27-29
(c) Professional Development Systems 29-32
(d) Quality of the Management Plan 32-38
(e) Adequacy of Resources
(1) The extent to which applicant demonstrates that Performance-Based Compensation Systems are developed with the input of teachers and school leaders in the schools and local educational
agencies to be served by the grant.
38-40
(2) The extent to which the applicant demonstrates a plan to sustain financially the activities conducted and systems developed under
the grant once the grant period has ended.
40
References 41-45
Appendices
TIF Optional Application Requirements Checklist Appendix A
TIF Optional High-Need School Checklist Appendix B
Logic Model Appendix C
Resumes of Key Personnel Appendix D
Letters of Support Appendix E
High-Need Documentation Appendix F
Indirect Cost Appendix G
R3: Recruit, Retain, Reward Pitt County Schools
1
(a) Significance
Madison is excited to go back to school after Christmas vacation because she learns in
the classroom of a creative, innovative, and engaging teacher. But her teacher Mr. Howard
didn’t start that way. Through on-going collaboration and co-teaching with a master teacher, he
is on his way to becoming truly exceptional. But if history is any predictor of the future, Mr.
Howard has only about a 50% chance of remaining in the classroom after five years, and his
absence will create a void for students like Madison (Ingersoll, 2012; Provini, 2014; US
Department of Education, n.d.).
Pitt County Schools (PCS) serves 23,500 students living in Pitt County, North Carolina,
located in the state’s coastal plain region. The county’s estimated population in July 2015 was
175,842, approximately half of which resides in the City of Greenville. The remainder of county
residents live in small towns and unincorporated communities surrounding this urban hub.
Greenville is the county seat and home of East Carolina University (ECU), the third largest
university in North Carolina, comprised of 12 colleges and schools including the Brody School
of Medicine, the School of Dental Medicine, the College of Business, and the College of
Education. Vidant Health Systems is headquartered in Greenville, with over 6,000 employees in
its eight county service region. Other employment sectors in Pitt County include manufacturing
and fabrication; pharmaceutical and chemical production; agricultural and natural resource
processing; marketing and retail sales; and service industries.
Despite its role as the center of education, commerce, employment, and health care in
eastern North Carolina, Pitt County posts an estimated poverty rate of 24% (U.S. Census, 2010-
2014 American Community Survey 5-Year estimates). Pitt is among the 10 North Carolina
counties classified by the US Department of Agriculture (USDA) Economic Research Service
R3: Recruit, Retain, Reward Pitt County Schools
2
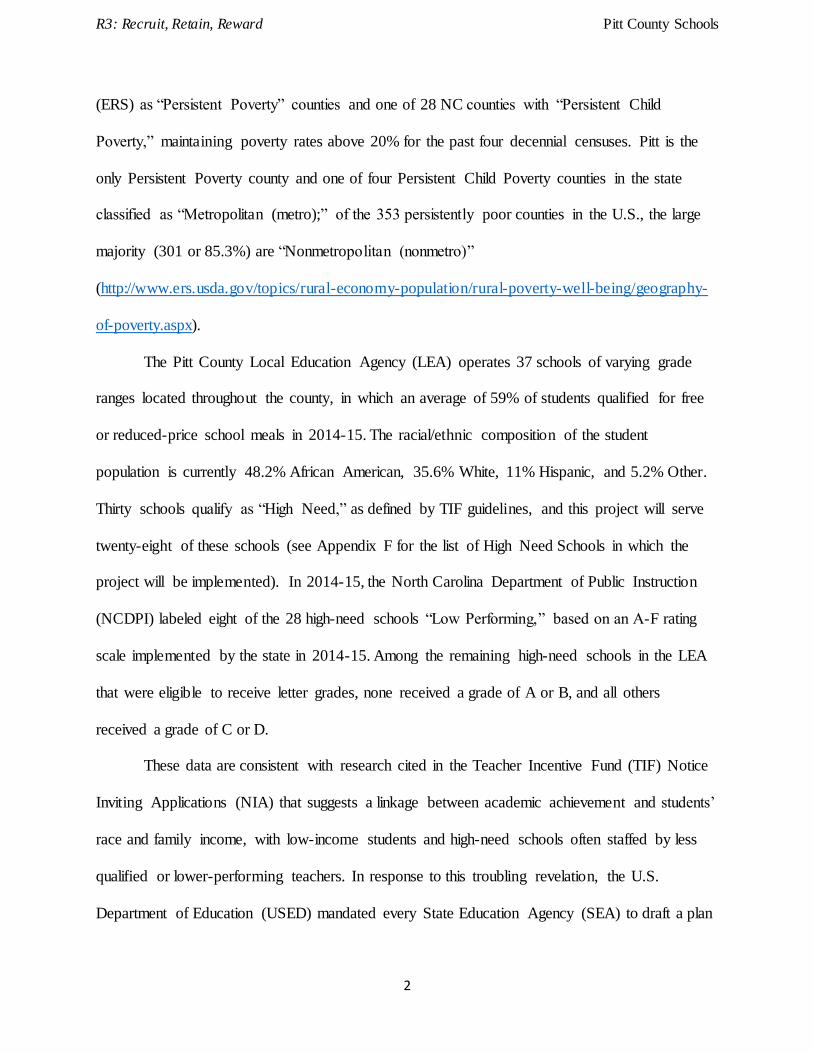
(ERS) as “Persistent Poverty” counties and one of 28 NC counties with “Persistent Child
Poverty,” maintaining poverty rates above 20% for the past four decennial censuses. Pitt is the
only Persistent Poverty county and one of four Persistent Child Poverty counties in the state
classified as “Metropolitan (metro);” of the 353 persistently poor counties in the U.S., the large
majority (301 or 85.3%) are “Nonmetropolitan (nonmetro)”
(http://www.ers.usda.gov/topics/rural-economy-population/rural-poverty-well-being/geography-
of-poverty.aspx).
The Pitt County Local Education Agency (LEA) operates 37 schools of varying grade
ranges located throughout the county, in which an average of 59% of students qualified for free
or reduced-price school meals in 2014-15. The racial/ethnic composition of the student
population is currently 48.2% African American, 35.6% White, 11% Hispanic, and 5.2% Other.
Thirty schools qualify as “High Need,” as defined by TIF guidelines, and this project will serve
twenty-eight of these schools (see Appendix F for the list of High Need Schools in which the
project will be implemented). In 2014-15, the North Carolina Department of Public Instruction
(NCDPI) labeled eight of the 28 high-need schools “Low Performing,” based on an A-F rating
scale implemented by the state in 2014-15. Among the remaining high-need schools in the LEA
that were eligible to receive letter grades, none received a grade of A or B, and all others
received a grade of C or D.
These data are consistent with research cited in the Teacher Incentive Fund (TIF) Notice
Inviting Applications (NIA) that suggests a linkage between academic achievement and students’
race and family income, with low-income students and high-need schools often staffed by less
qualified or lower-performing teachers. In response to this troubling revelation, the U.S.
Department of Education (USED) mandated every State Education Agency (SEA) to draft a plan
R3: Recruit, Retain, Reward Pitt County Schools
3
that would ensure all students have equitable access to excellent educators. The final version of
North Carolina’s Equity Plan, approved by USED in November 2015, can be found at the
following web link: http://www.ncpublicschools.org/docs/program-monitoring/titleIA/equity-
plan/equity-final.pdf. While Pitt County is not among the 15 LEAs with the highest poverty
rates in the state, it is one of 15 school districts in which more than 69% of enrolled students are
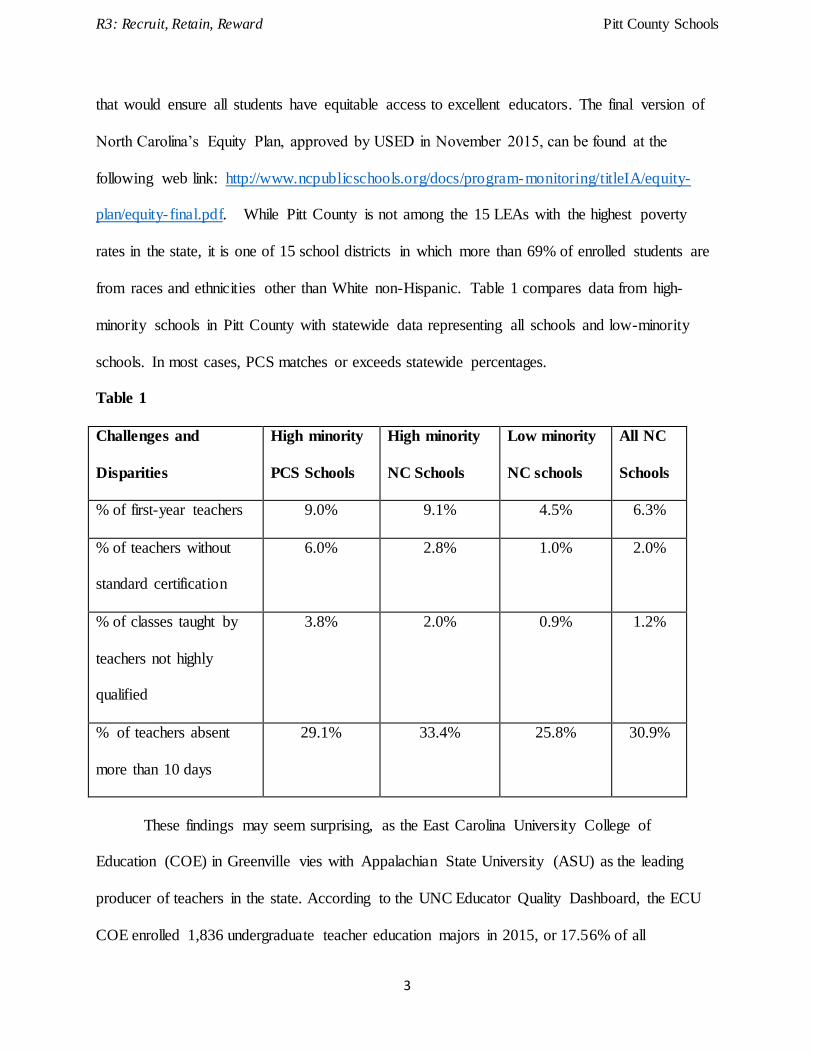
from races and ethnicities other than White non-Hispanic. Table 1 compares data from high-
minority schools in Pitt County with statewide data representing all schools and low-minority
schools. In most cases, PCS matches or exceeds statewide percentages.
Table 1
Challenges and
Disparities
High minority
PCS Schools
High minority
NC Schools
Low minority
NC schools
All NC
Schools
% of first-year teachers 9.0% 9.1% 4.5% 6.3%
% of teachers without
standard certification
6.0% 2.8% 1.0% 2.0%
% of classes taught by
teachers not highly
qualified
3.8% 2.0% 0.9% 1.2%
% of teachers absent
more than 10 days
29.1% 33.4% 25.8% 30.9%
These findings may seem surprising, as the East Carolina University College of
Education (COE) in Greenville vies with Appalachian State University (ASU) as the leading
producer of teachers in the state. According to the UNC Educator Quality Dashboard, the ECU
COE enrolled 1,836 undergraduate teacher education majors in 2015, or 17.56% of all
R3: Recruit, Retain, Reward Pitt County Schools
4
undergraduate teacher education majors in the state, with a licensure exam pass rate close to
100% (http://eqdashboard.northcarolina.edu/). PCS hosted 113 student teachers in 2014-15 and
174 student teachers in 2015-16. The majority of teachers who graduate from ECU initially
remain in eastern North Carolina, with ECU grads comprising half or more of the teaching force
in some LEAs like Pitt County (http://eqdashboard.northcarolina.edu/).
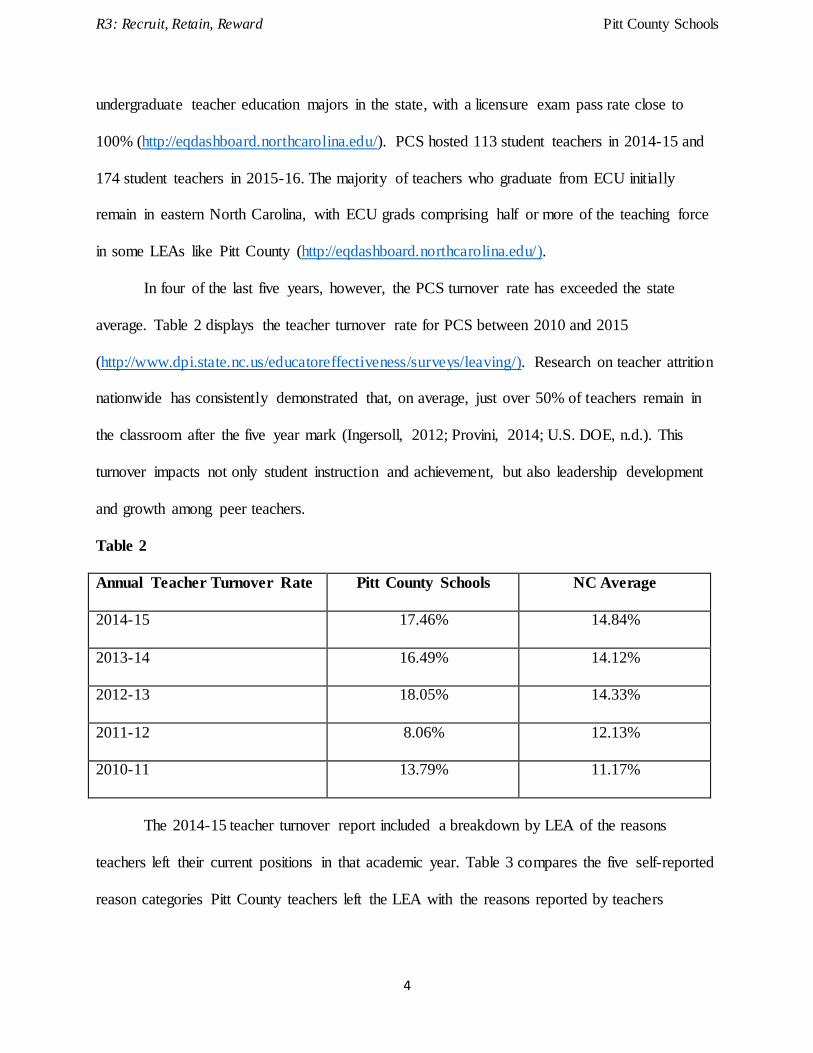
In four of the last five years, however, the PCS turnover rate has exceeded the state
average. Table 2 displays the teacher turnover rate for PCS between 2010 and 2015
(http://www.dpi.state.nc.us/educatoreffectiveness/surveys/leaving/). Research on teacher attrition
nationwide has consistently demonstrated that, on average, just over 50% of teachers remain in
the classroom after the five year mark (Ingersoll, 2012; Provini, 2014; U.S. DOE, n.d.). This
turnover impacts not only student instruction and achievement, but also leadership development
and growth among peer teachers.
Table 2
Annual Teacher Turnover Rate Pitt County Schools NC Average
2014-15 17.46% 14.84%
2013-14 16.49% 14.12%
2012-13 18.05% 14.33%
2011-12 8.06% 12.13%
2010-11 13.79% 11.17%
The 2014-15 teacher turnover report included a breakdown by LEA of the reasons
teachers left their current positions in that academic year. Table 3 compares the five self-reported
reason categories Pitt County teachers left the LEA with the reasons reported by teachers
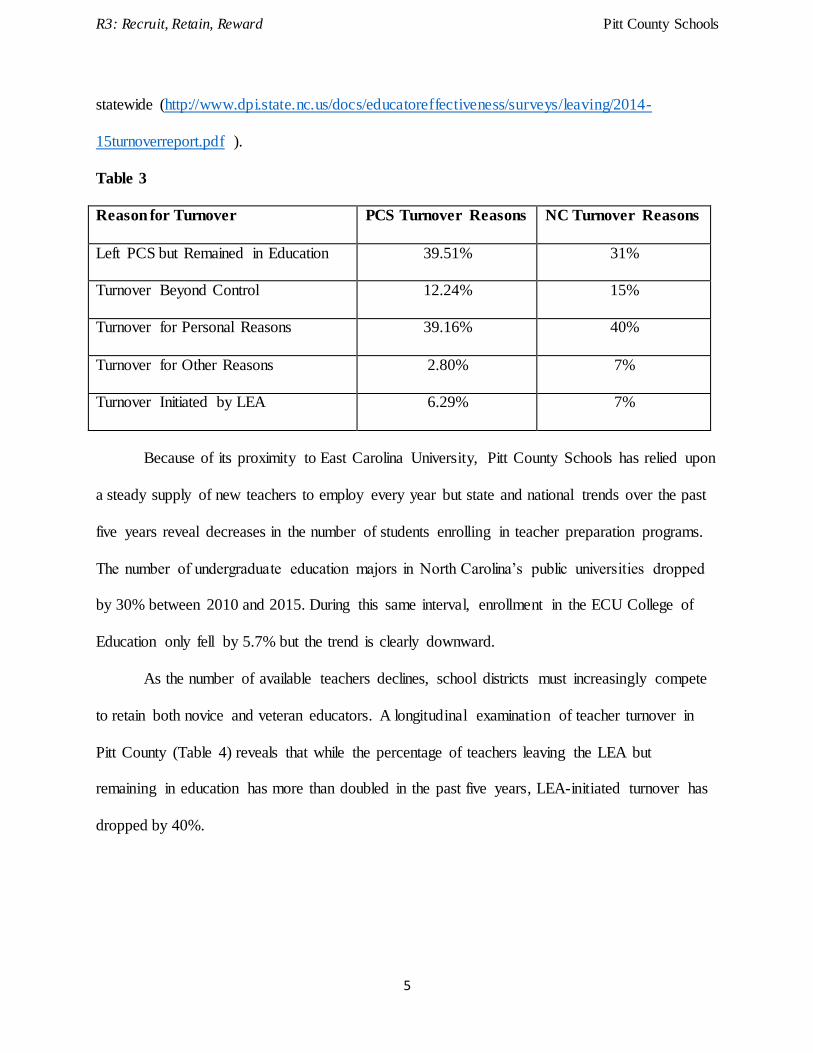
R3: Recruit, Retain, Reward Pitt County Schools
5
statewide (http://www.dpi.state.nc.us/docs/educatoreffectiveness/surveys/leaving/2014-
15turnoverreport.pdf ).
Table 3
Reason for Turnover PCS Turnover Reasons NC Turnover Reasons
Left PCS but Remained in Education 39.51% 31%
Turnover Beyond Control 12.24% 15%
Turnover for Personal Reasons 39.16% 40%
Turnover for Other Reasons 2.80% 7%
Turnover Initiated by LEA 6.29% 7%
Because of its proximity to East Carolina University, Pitt County Schools has relied upon
a steady supply of new teachers to employ every year but state and national trends over the past
five years reveal decreases in the number of students enrolling in teacher preparation programs.
The number of undergraduate education majors in North Carolina’s public universities dropped
by 30% between 2010 and 2015. During this same interval, enrollment in the ECU College of
Education only fell by 5.7% but the trend is clearly downward.
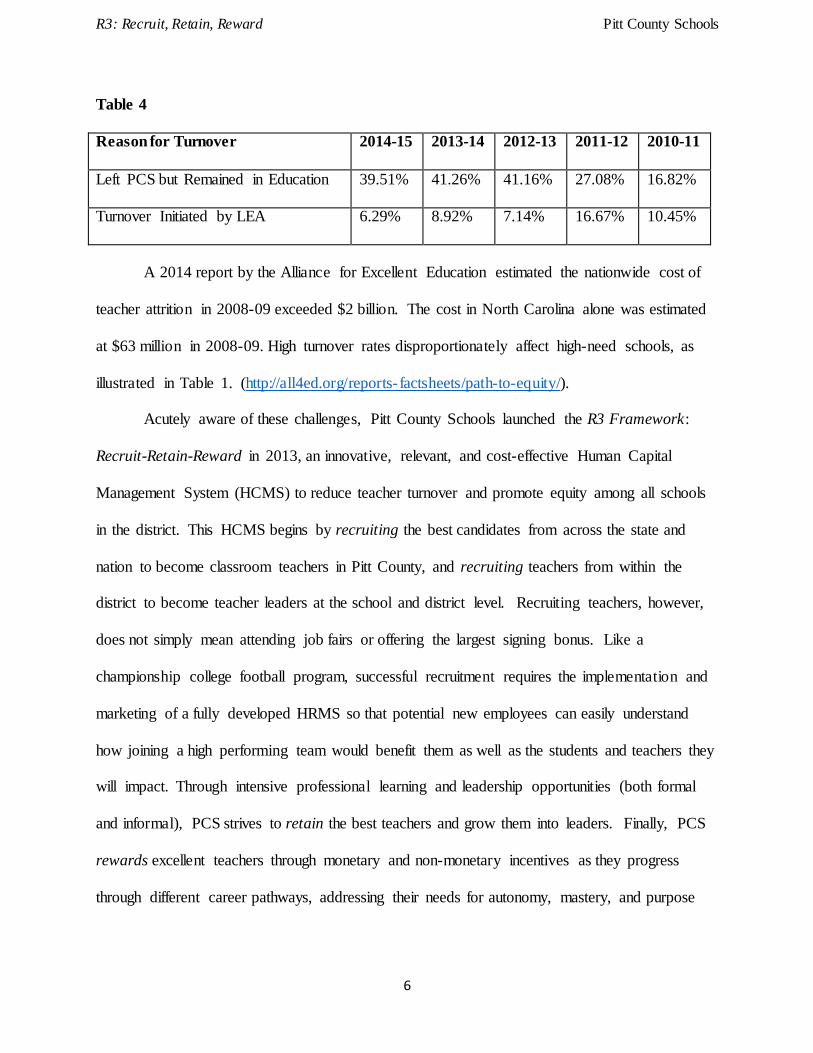
As the number of available teachers declines, school districts must increasingly compete
to retain both novice and veteran educators. A longitudinal examination of teacher turnover in
Pitt County (Table 4) reveals that while the percentage of teachers leaving the LEA but
remaining in education has more than doubled in the past five years, LEA-initiated turnover has
dropped by 40%.
R3: Recruit, Retain, Reward Pitt County Schools
6
Table 4
Reason for Turnover 2014-15 2013-14 2012-13 2011-12 2010-11
Left PCS but Remained in Education 39.51% 41.26% 41.16% 27.08% 16.82%
Turnover Initiated by LEA 6.29% 8.92% 7.14% 16.67% 10.45%
A 2014 report by the Alliance for Excellent Education estimated the nationwide cost of
teacher attrition in 2008-09 exceeded $2 billion. The cost in North Carolina alone was estimated
at $63 million in 2008-09. High turnover rates disproportionately affect high-need schools, as
illustrated in Table 1. (http://all4ed.org/reports- factsheets/path-to-equity/).
Acutely aware of these challenges, Pitt County Schools launched the R3 Framework:
Recruit-Retain-Reward in 2013, an innovative, relevant, and cost-effective Human Capital
Management System (HCMS) to reduce teacher turnover and promote equity among all schools
in the district. This HCMS begins by recruiting the best candidates from across the state and
nation to become classroom teachers in Pitt County, and recruiting teachers from within the
district to become teacher leaders at the school and district level. Recruiting teachers, however,
does not simply mean attending job fairs or offering the largest signing bonus. Like a
championship college football program, successful recruitment requires the implementation and
marketing of a fully developed HRMS so that potential new employees can easily understand
how joining a high performing team would benefit them as well as the students and teachers they
will impact. Through intensive professional learning and leadership opportunities (both formal
and informal), PCS strives to retain the best teachers and grow them into leaders. Finally, PCS
rewards excellent teachers through monetary and non-monetary incentives as they progress
through different career pathways, addressing their needs for autonomy, mastery, and purpose

R3: Recruit, Retain, Reward Pitt County Schools
7
(Pink, 2011) by offering opportunities to choose responsibilities and positions that align with
their strengths, interests, and school system needs.
Alignment to Absolute Priority
Pitt County Schools’ vision is to be a system of excellence partnering with families and
the community to prepare students to function effectively in a rapidly changing world by
developing global citizens through academic excellence. The mission of Pitt County Schools is
to ensure that every student is provided a rigorous and personalized education that prepares them
for the ever-changing challenges of the 21st century. Realizing the vision and mission of Pitt
County Schools requires the presence of a comprehensive Human Capital Management System.
Retaining great teachers has a significant impact on student learning. A student of an effective
teacher may achieve a gain of 1.5 grade level equivalents while an ineffective teacher will only
gain 0.5 year during a single academic year, with minority and economically disadvantaged
inner-city students being more vulnerable to that difference because they can’t overcome the
difference at home (Hanushek, 2014). The R3 program is designed not only to retain effective,
experienced teachers, but also works to mitigate the impact of the large number of inexperienced
teachers hired because of turnover. So the program both aims to keep experienced teachers, and
also decreases teacher turnover by supporting and retaining young teachers (Rivkin, Hanushek,
& Kain. 2005).
R3: Recruit, Retain, Reward Pitt County Schools
8
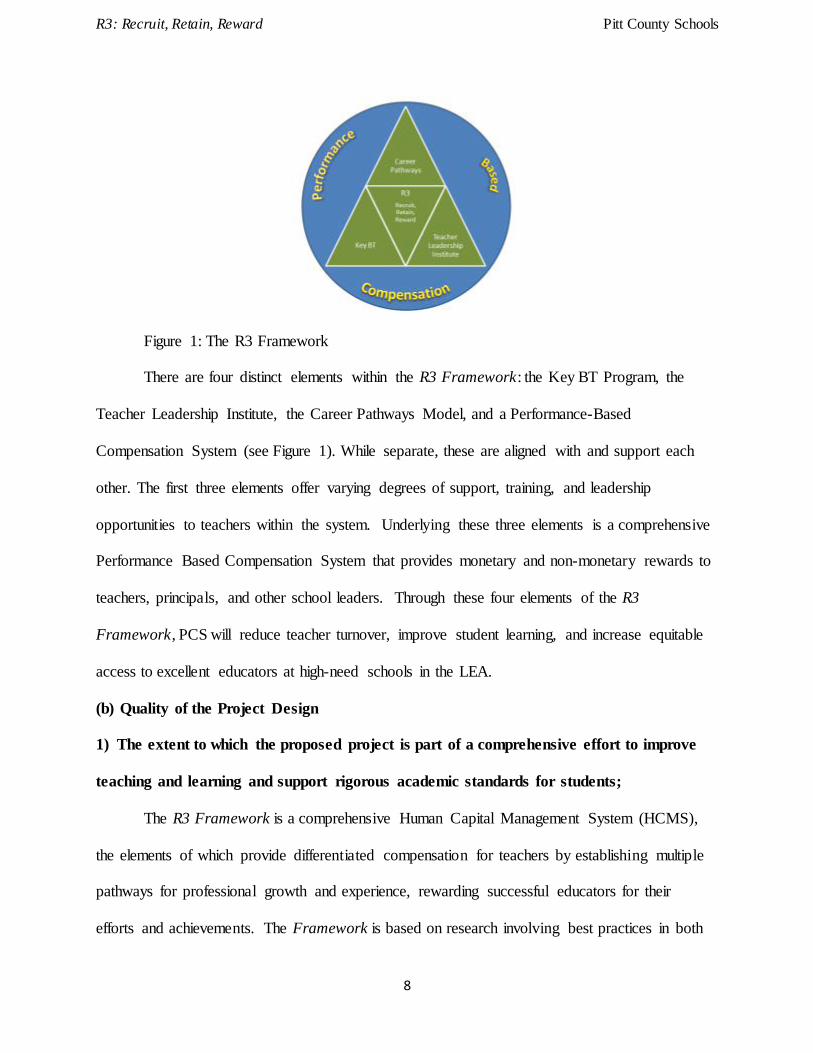
Figure 1: The R3 Framework
There are four distinct elements within the R3 Framework: the Key BT Program, the
Teacher Leadership Institute, the Career Pathways Model, and a Performance-Based
Compensation System (see Figure 1). While separate, these are aligned with and support each
other. The first three elements offer varying degrees of support, training, and leadership
opportunities to teachers within the system. Underlying these three elements is a comprehensive
Performance Based Compensation System that provides monetary and non-monetary rewards to
teachers, principals, and other school leaders. Through these four elements of the R3
Framework, PCS will reduce teacher turnover, improve student learning, and increase equitable
access to excellent educators at high-need schools in the LEA.
(b) Quality of the Project Design
1) The extent to which the proposed project is part of a comprehensive effort to improve
teaching and learning and support rigorous academic standards for students;
The R3 Framework is a comprehensive Human Capital Management System (HCMS),
the elements of which provide differentiated compensation for teachers by establishing multiple
pathways for professional growth and experience, rewarding successful educators for their
efforts and achievements. The Framework is based on research involving best practices in both
R3: Recruit, Retain, Reward Pitt County Schools
9
the medical and teaching professions. Developed in consultation and collaboration with teachers,
school administrators, district administrators, and representatives from East Carolina University,
the University of North Carolina Hospitals, and community businesses, the R3 Framework both
represents and illustrates the importance of collaboration.
Research consistently indicates that simply paying teachers more money based on student
test scores generates mixed results, and increased pay based on additional responsibilities does
not necessarily lead to increased student performance (Figlio & Kenny, 2007; Sawchuck, 2010).
However, increased pay based on effectiveness with students combined with increased influence
with adults improves both student learning and teacher morale (Reform Support Network, 2013).
In other words, providing incentives and support leads to improved performance. As teachers
are looking for both increased financial compensation and influence (Danielson, 2006; Feller, Jr.,
2013), the Pitt County Schools seeks to reward high-performing teachers who also serve as
teacher leaders within and across the system.
Unlike states in which unions or local school districts negotiate teacher salaries and
benefits, the North Carolina General Assembly is responsible for establishing a statewide salary
scale and allocating state revenue to fund the majority of public school salaries in the state. The
State took over funding of the public schools during the Great Depression in 1931 when the
General Assembly realized that county governments were unable to rescue their failing school
systems. In addition to that scale, individual LEAs are able to offer salary supplements or
bonuses.
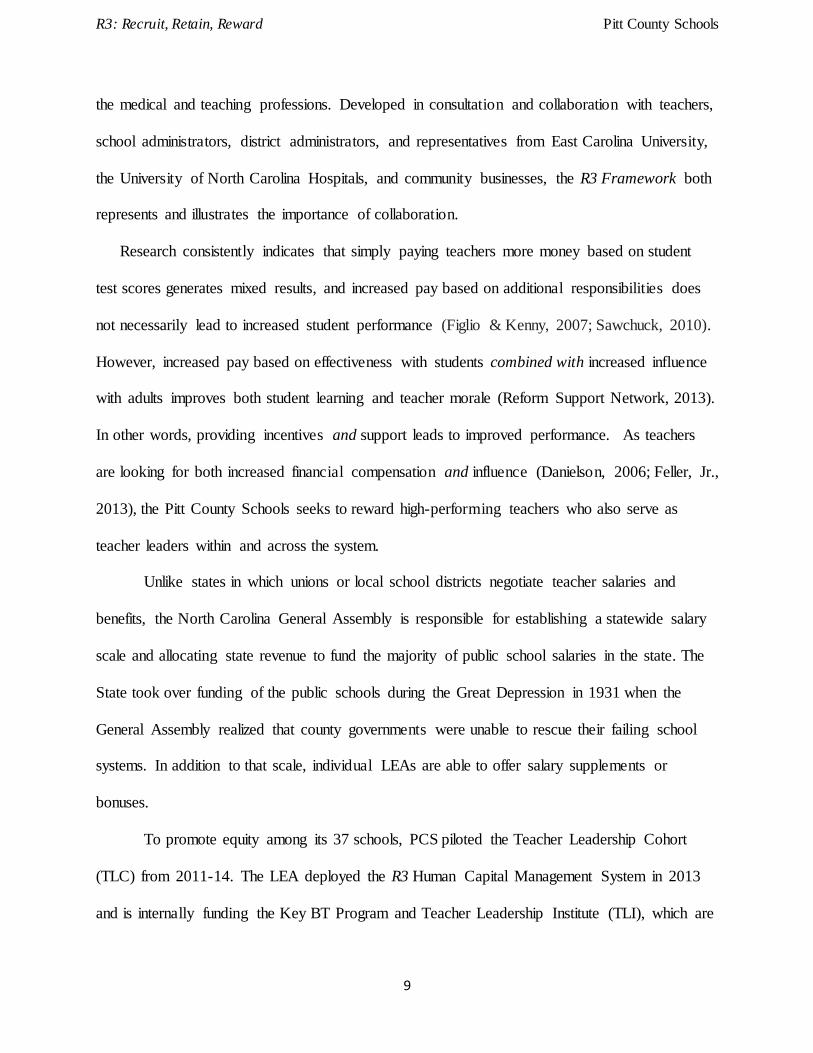
To promote equity among its 37 schools, PCS piloted the Teacher Leadership Cohort
(TLC) from 2011-14. The LEA deployed the R3 Human Capital Management System in 2013
and is internally funding the Key BT Program and Teacher Leadership Institute (TLI), which are
R3: Recruit, Retain, Reward Pitt County Schools
10
essentially the first two differentiated opportunities on the Career Pathways Model. All elements
of the R3 Framework provide some form of monetary or non-monetary performance-based
compensation to teachers participating in specific activities associated with these elements. The
narrative below describes the history of these efforts, their current status, and plans to use TIF
funds to enhance and expand specifically the Career Pathways Model and Performance-Based
Compensation System.
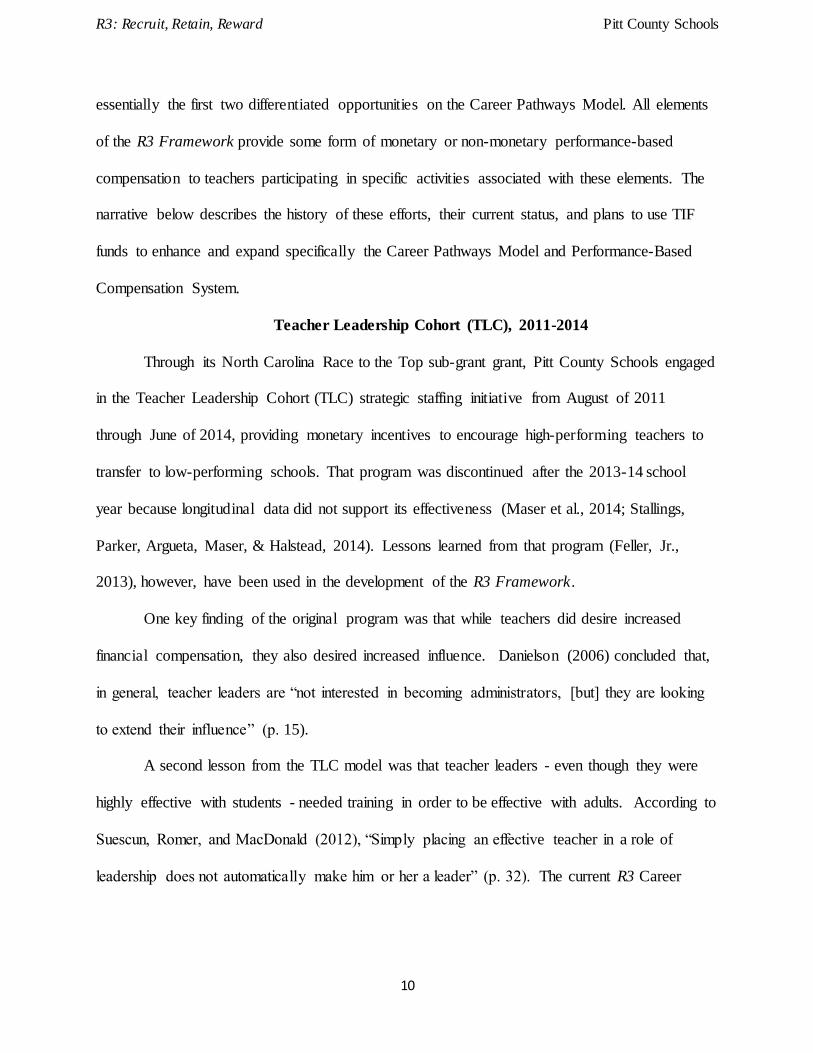
Teacher Leadership Cohort (TLC), 2011-2014
Through its North Carolina Race to the Top sub-grant grant, Pitt County Schools engaged
in the Teacher Leadership Cohort (TLC) strategic staffing initiative from August of 2011
through June of 2014, providing monetary incentives to encourage high-performing teachers to
transfer to low-performing schools. That program was discontinued after the 2013-14 school
year because longitudinal data did not support its effectiveness (Maser et al., 2014; Stallings,
Parker, Argueta, Maser, & Halstead, 2014). Lessons learned from that program (Feller, Jr.,
2013), however, have been used in the development of the R3 Framework.
One key finding of the original program was that while teachers did desire increased
financial compensation, they also desired increased influence. Danielson (2006) concluded that,
in general, teacher leaders are “not interested in becoming administrators, [but] they are looking
to extend their influence” (p. 15).
A second lesson from the TLC model was that teacher leaders - even though they were
highly effective with students - needed training in order to be effective with adults. According to
Suescun, Romer, and MacDonald (2012), “Simply placing an effective teacher in a role of
leadership does not automatically make him or her a leader” (p. 32). The current R3 Career
R3: Recruit, Retain, Reward Pitt County Schools
11
Pathways Model places teachers in leadership roles and compensates them accordingly, while
also providing professional learning so they can be successful in their new roles.
A final lesson learned from the TLC model was that when high-performing teachers were
assigned to low-performing schools by PCS leadership, they struggled to gain respect and build
rapport with other teachers in the building. There was distrust from the current staff and an
unwillingness to work with them. Involving School Improvement Teams in the teacher-leader
selection process would minimize this problem.
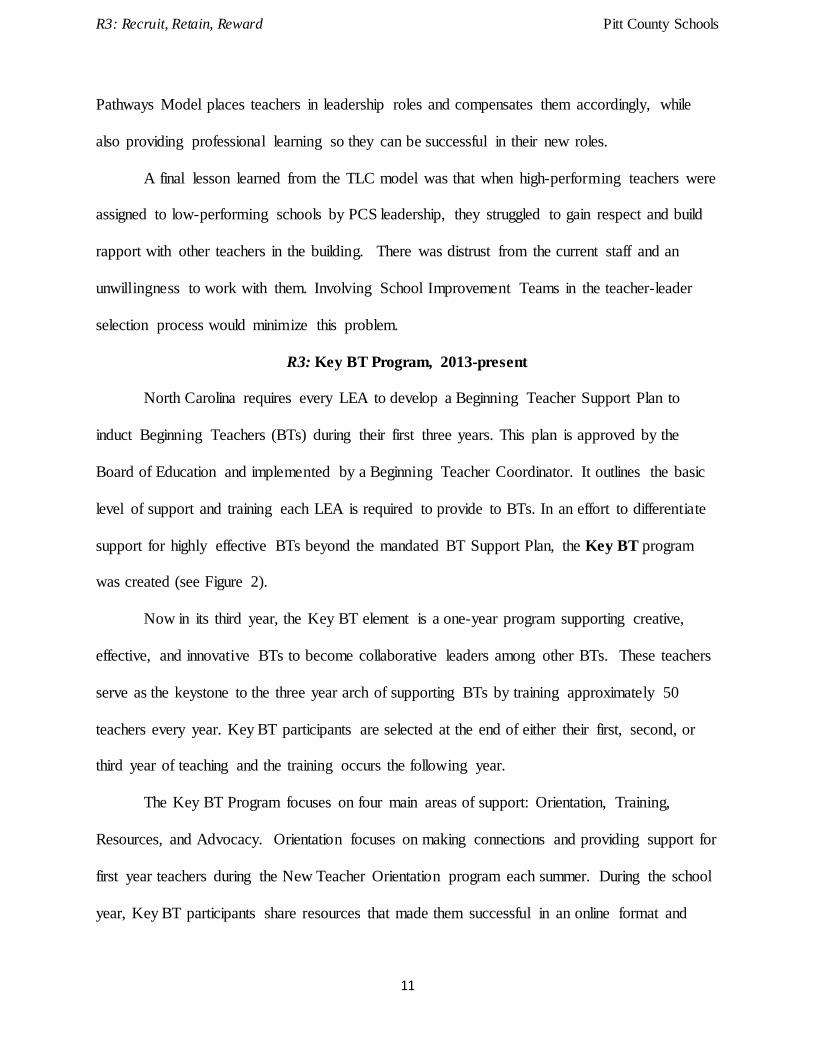
R3: Key BT Program, 2013-present
North Carolina requires every LEA to develop a Beginning Teacher Support Plan to
induct Beginning Teachers (BTs) during their first three years. This plan is approved by the
Board of Education and implemented by a Beginning Teacher Coordinator. It outlines the basic
level of support and training each LEA is required to provide to BTs. In an effort to differentiate
support for highly effective BTs beyond the mandated BT Support Plan, the Key BT program
was created (see Figure 2).
Now in its third year, the Key BT element is a one-year program supporting creative,
effective, and innovative BTs to become collaborative leaders among other BTs. These teachers
serve as the keystone to the three year arch of supporting BTs by training approximately 50
teachers every year. Key BT participants are selected at the end of either their first, second, or
third year of teaching and the training occurs the following year.
The Key BT Program focuses on four main areas of support: Orientation, Training,
Resources, and Advocacy. Orientation focuses on making connections and providing support for
first year teachers during the New Teacher Orientation program each summer. During the school
year, Key BT participants share resources that made them successful in an online format and

R3: Recruit, Retain, Reward Pitt County Schools
12
help facilitate monthly face-to-face training focused on providing proactive support for BTs.
Advocacy is the capstone experience for the Key BT program when participants travel as a group
to meet BTs from another county to plan priorities to share directly with state legislators. The
program coordinator facilitates this dialogue, offering teachers an opportunity to interact with
legislators who make decisions at the state level which impact them, while offering state
legislative leaders the opportunity to hear from and be informed by those who are “on the
ground,” so to speak, doing the day-to-day work in classrooms.
Figure 2: The Key BT Program
R3: Teacher Leadership Institute, 2015-present
The Teacher Leadership Institute (TLI) is a four-year program designed to offer
differentiated pay to teachers and build their leadership capacity in the school and district. The
district uses a research-based strategy that occurs within the context of a cohort of educators,
with results best attained through a multi-year effort to ensure incremental improvements are
both sustainable and driven by district goals (DuFour, 2004). Each year a new class of 25
teachers is accepted into the Institute, who begin a two-year intensive professional learning
experience focused on understanding the mental dispositions of leaders; building the skills
needed to collaborate with their colleagues; and influencing student success by applying best-
practices in the classroom. Training is also focused on five educational tenets of effective teacher
leadership during the four-year program cycle: Context, Curriculum, Instruction, Assessment,
R3: Recruit, Retain, Reward Pitt County Schools
13
and Learning. During the second year of the TLI, teachers complete a Capstone Project aligned
with one of three strands: Instructional Leadership, Association Leadership, or Policy
Leadership. Upon completion of the Capstone Project, participants are eligible to receive a
$4,800 supplement awarded incrementally during years three and four. TLI teachers are also
provided with financial and mentoring support during years three and four to pursue certification
by the National Board for Professional Teaching Standards.
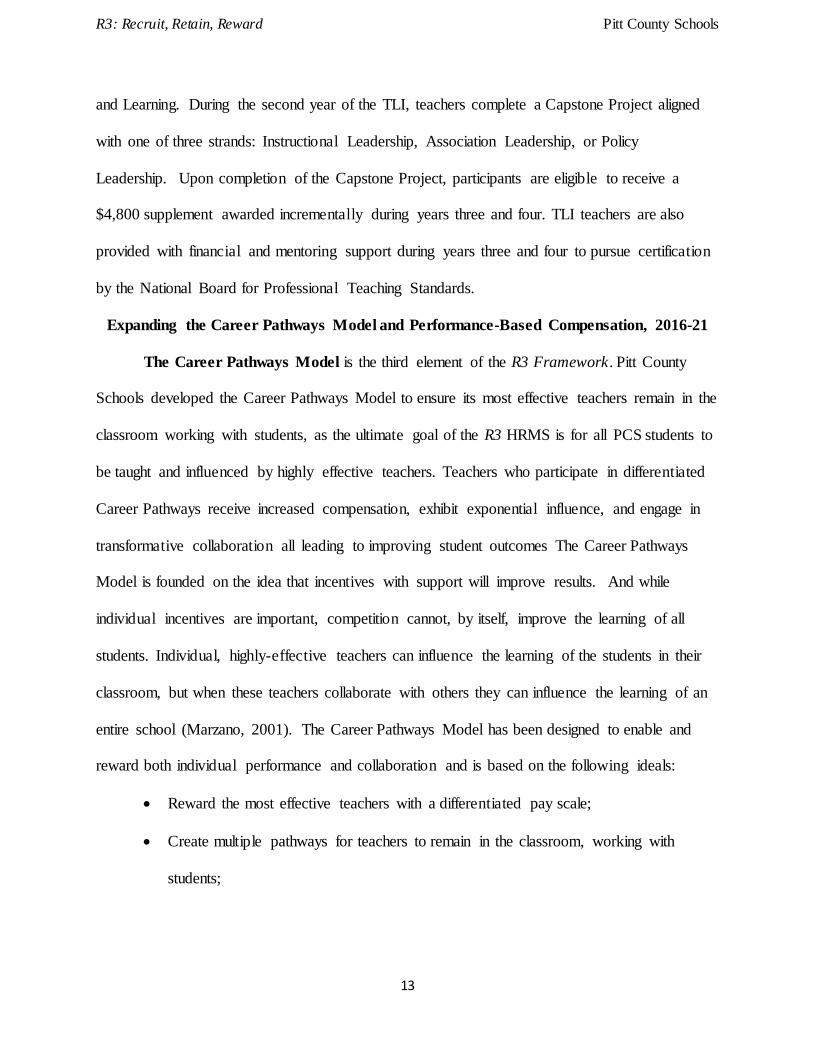
Expanding the Career Pathways Model and Performance-Based Compensation, 2016-21
The Career Pathways Model is the third element of the R3 Framework. Pitt County
Schools developed the Career Pathways Model to ensure its most effective teachers remain in the
classroom working with students, as the ultimate goal of the R3 HRMS is for all PCS students to
be taught and influenced by highly effective teachers. Teachers who participate in differentiated
Career Pathways receive increased compensation, exhibit exponential influence, and engage in
transformative collaboration all leading to improving student outcomes The Career Pathways
Model is founded on the idea that incentives with support will improve results. And while
individual incentives are important, competition cannot, by itself, improve the learning of all
students. Individual, highly-effective teachers can influence the learning of the students in their
classroom, but when these teachers collaborate with others they can influence the learning of an
entire school (Marzano, 2001). The Career Pathways Model has been designed to enable and
reward both individual performance and collaboration and is based on the following ideals:
Reward the most effective teachers with a differentiated pay scale;
Create multiple pathways for teachers to remain in the classroom, working with
students;
R3: Recruit, Retain, Reward Pitt County Schools
14
Empower teachers to collaborate, recognizing the synergetic capabilities of individual
teachers working together.
Through the Career Pathway Model, teachers currently have the option to pursue a
limited number of leadership positions within schools that increase both their influence and their
compensation, while at the same time keeping them in the classroom working with students. The
first two Pathways, Beginning Teacher and Professional Teacher, align with the state teacher
licensure and compensation model. Four additional Pathways, however, will be unique to Pitt
County Schools, offering differentiated pay and responsibilities to teachers within the system, in
addition to LEA-level Performance-Based Compensation System. These four Pathways are:
Facilitating Teachers, Multi-Classroom Teachers, Collaborating Teachers, and Co-Teachers.
Facilitating Teachers and Multi-Classroom Teachers represent new and proven roles highly
effective teachers may choose to pursue and still remain in the classroom and receive increased
pay and influence (Bacharah, Heck, & Dalhberg, 2010; Public Impact, 2012). Collaborating
Teachers receive differentiated pay to work with Facilitating Teachers, while both Collaborating
and Co-Teachers are able to improve instructional practice through the collaboration.
The FT and MCT pathways, in particular, are specifically designed to develop the
system’s vision for instructional improvement. Teachers in the FT and MCT positions have been
identified through multiple measures, including evaluations, classroom observations, student
performance data, or peer feedback, to be highly effective teachers. It will be their responsibility
to model, train, and mentor other teachers to help them improve their instructional practice.
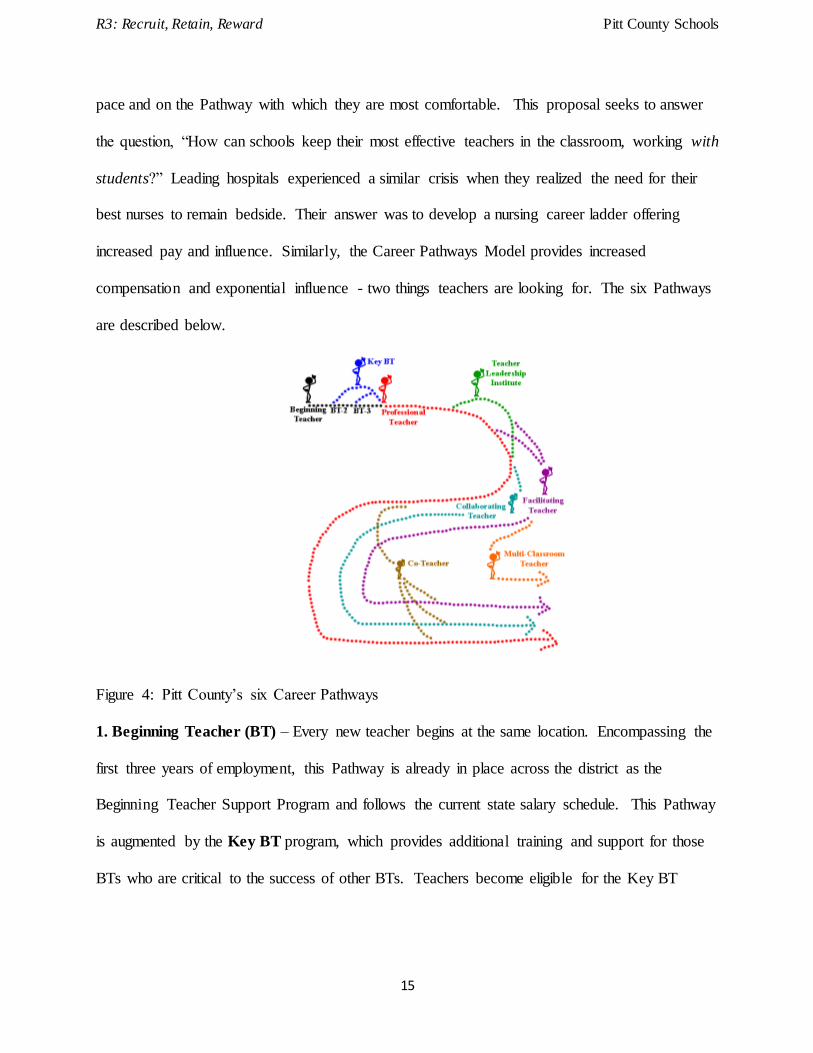
The six paths of the teacher Career Pathways Model (see Figure 4) provide options for
teachers in their career journey, leading to increased compensation and exponential influence
over time. Educators can choose, as professionals, to move towards increased effectiveness at a
R3: Recruit, Retain, Reward Pitt County Schools
15
pace and on the Pathway with which they are most comfortable. This proposal seeks to answer
the question, “How can schools keep their most effective teachers in the classroom, working with
students?” Leading hospitals experienced a similar crisis when they realized the need for their
best nurses to remain bedside. Their answer was to develop a nursing career ladder offering
increased pay and influence. Similarly, the Career Pathways Model provides increased
compensation and exponential influence - two things teachers are looking for. The six Pathways
are described below.
Figure 4: Pitt County’s six Career Pathways
1. Beginning Teacher (BT) – Every new teacher begins at the same location. Encompassing the
first three years of employment, this Pathway is already in place across the district as the
Beginning Teacher Support Program and follows the current state salary schedule. This Pathway
is augmented by the Key BT program, which provides additional training and support for those
BTs who are critical to the success of other BTs. Teachers become eligible for the Key BT
R3: Recruit, Retain, Reward Pitt County Schools
16
Program at the end of their first through third year in the teaching profession, and participation in
the program requires being nominated by both peers and school administration.
2. Professional Teacher - Teachers continue their journey automatically upon successful
completion of the Beginning Teacher Program. This path represents the current model for
teachers across the state and follows the state salary schedule with a local supplement of 5% paid
by the LEA. Teachers at this level have the opportunity, if they desire, to assume additional
leadership and academic responsibilities (School Improvement Team Chair, department chair,
club sponsor, mentor, etc.) and receive the local supplements (when available) associated with
those responsibilities. Professional Teachers also have the option of applying for the Teacher
Leadership Institute (TLI), which will help equip them for future leadership roles in the
district.
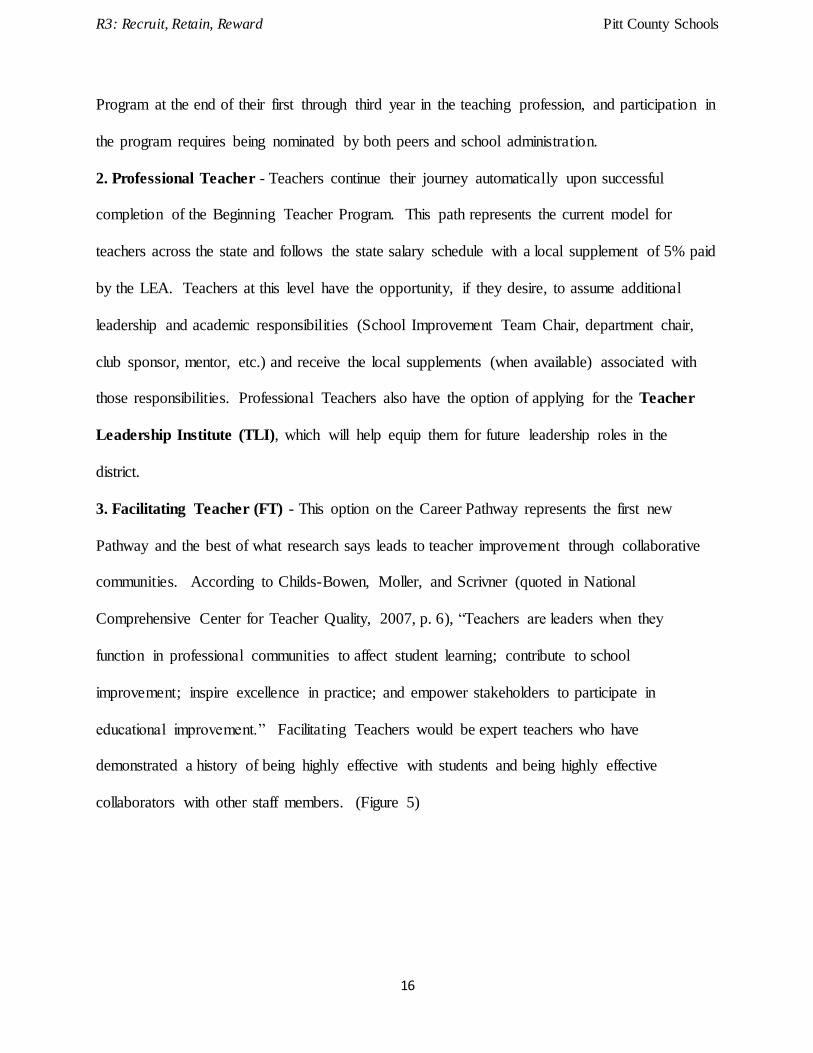
3. Facilitating Teacher (FT) - This option on the Career Pathway represents the first new
Pathway and the best of what research says leads to teacher improvement through collaborative
communities. According to Childs-Bowen, Moller, and Scrivner (quoted in National
Comprehensive Center for Teacher Quality, 2007, p. 6), “Teachers are leaders when they
function in professional communities to affect student learning; contribute to school
improvement; inspire excellence in practice; and empower stakeholders to participate in
educational improvement.” Facilitating Teachers would be expert teachers who have
demonstrated a history of being highly effective with students and being highly effective
collaborators with other staff members. (Figure 5)
R3: Recruit, Retain, Reward Pitt County Schools
17
Figure 5: The FT facilitates the collaborative teaching community
They will serve by leading a Collaborative Teaching Community where they work
side-by-side with a team of two to four other less-experienced teachers. This Collaborative
Teaching Community will co-plan together, allowing the Facilitating Teacher to indirectly
influence the learning in multiple classrooms. By working with less-experienced teachers, they
can model planning and assessment strategies, serve as an advisor and mentor, and help develop
either Beginning or Professional teachers. A key responsibility of the Collaborative Teaching
Community will be the completion of an annual Collaborative Action Research Project
focused on solving a classroom or school-level concern for learning. By becoming an expert in
this area, Facilitating Teachers will then have the ability to share the results of their
Collaborative Action Research with teachers across the district, building both individual and
organizational capacity. Specialized professional learning and coaching will be provided to the
Facilitating Teacher, as the leader of the team, with the expectation that the Facilitating Teacher
implement these practices and protocols to help guide the entire team through the Collaborative
Action Research Project. In order to apply for the Facilitating Teacher position, teachers must
hold an advanced credential, either National Board Certification, a master’s degree in the area in
R3: Recruit, Retain, Reward Pitt County Schools
18
which they are teaching, or an internal certification as identified by the district. FTs must also
have an EVAAS rating in excess of “+1”, which signifies the teacher is in the top approximately
25% of teachers in the district; for teachers without a state EVAAS score, they must submit
additional proof of a positive impact on student performance. EVAAS is a state system
measuring the impact of teachers on student growth and comparing that growth with the growth
of other teachers around the state. EVAAS is further described on page 22 of this application.
As a reward for this increased responsibility, Facilitating Teachers would receive a 15%
supplement above and beyond the professional teacher pay.
In year two, every high-need school in the district will have access to between one and
three Facilitating Teachers, and in year three of the project, an additional 19 Facilitating
Teachers will be hired so schools can request an additional position based on their need.
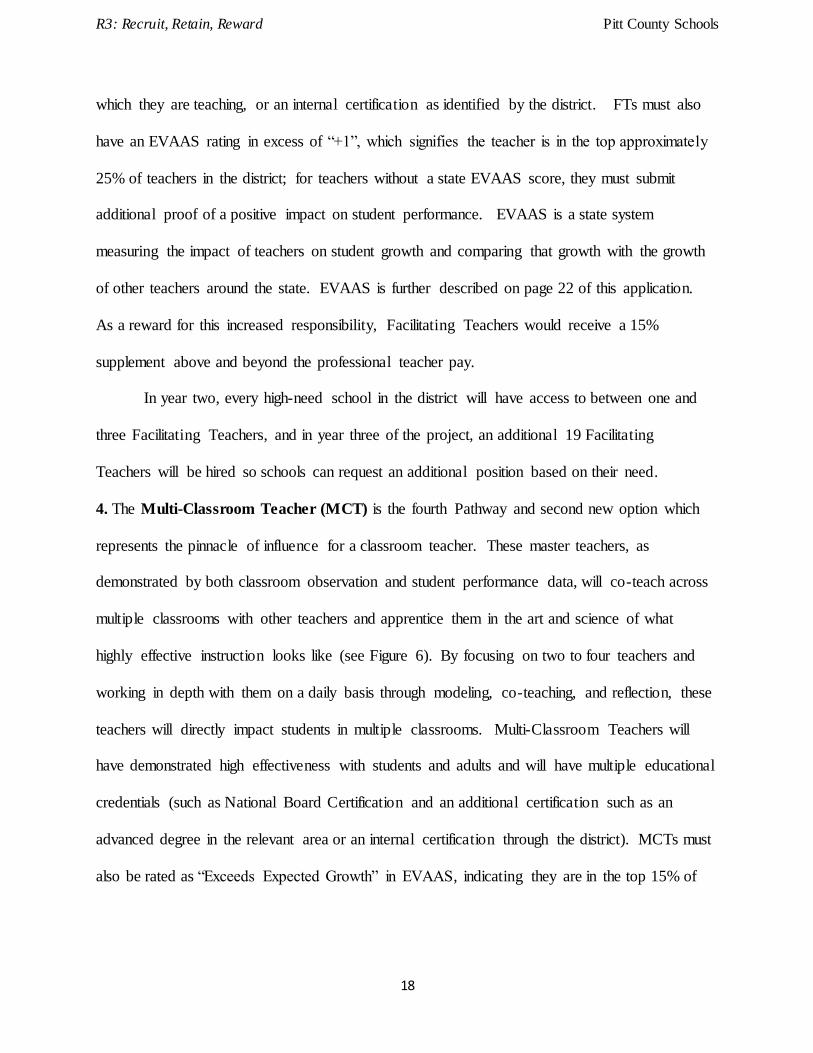
4. The Multi-Classroom Teacher (MCT) is the fourth Pathway and second new option which
represents the pinnacle of influence for a classroom teacher. These master teachers, as
demonstrated by both classroom observation and student performance data, will co-teach across
multiple classrooms with other teachers and apprentice them in the art and science of what
highly effective instruction looks like (see Figure 6). By focusing on two to four teachers and
working in depth with them on a daily basis through modeling, co-teaching, and reflection, these
teachers will directly impact students in multiple classrooms. Multi-Classroom Teachers will
have demonstrated high effectiveness with students and adults and will have multiple educational
credentials (such as National Board Certification and an additional certification such as an
advanced degree in the relevant area or an internal certification through the district). MCTs must
also be rated as “Exceeds Expected Growth” in EVAAS, indicating they are in the top 15% of

R3: Recruit, Retain, Reward Pitt County Schools
19
teachers in the district; for teachers without a state EVAAS score, they must submit additional
proof of a significant positive impact on student performance.
Figure 6: The Multi-Classroom Teacher teachers with multiple Co-Teachers
In the third year of the program, 12 Multi-Classroom Teachers will be placed at schools that
have a specific academic focus identified by the School Improvement Team and Principal, with
approval by the district office. Teachers assigned to work with the Multi-Classroom Teacher
will be involved in the interview process, thereby creating agreement and communicating a
willingness to work side-by-side with this master teacher in an effort to improve their own
instructional skill and influence the academic achievement of students in their respective
classrooms. The district may retain two of the MCTs for district-level MCT positions, who will
co-teach with teachers from different schools rather than within the same school. Multi-
Classroom Teachers, in recognition of their work, will receive a 15% supplement above the level
of the Facilitating Teacher.
5. Collaborating Teacher (CT) is a sub-set of the Facilitating Teacher pathway, as these
teachers work with a Facilitating Teacher to form a Collaborative Teaching Community.
Collaborating Teachers participate in the Collaborative Action Research Project and receive
additional compensation for their efforts. These teachers will not receive additional training
from the district, as this is the responsibility of the Facilitating Teacher. Collaborating Teachers

R3: Recruit, Retain, Reward Pitt County Schools
20
will receive an annual supplement of $1,200 for every year they work with a Facilitating
Teacher. Collaborating Teachers can remain on this pathway, return to the Professional Teacher
pathway, or apply for the Facilitating Teacher pathway.
6. Co-Teacher is the sixth Pathway, consisting of those teachers who apprentice themselves to a
Multi-Classroom Teacher. While these teachers will not receive a supplement as other teachers
do, they will receive specialized training in the co-teaching methodology; will engage in co-
planning, co-teaching, and co-reflecting with the Multi-Classroom Teacher; and upon
demonstration of success in the classroom with the Multi-Classroom Teacher, will have the
option to complete an internal certification making them eligible to apply for the Facilitating
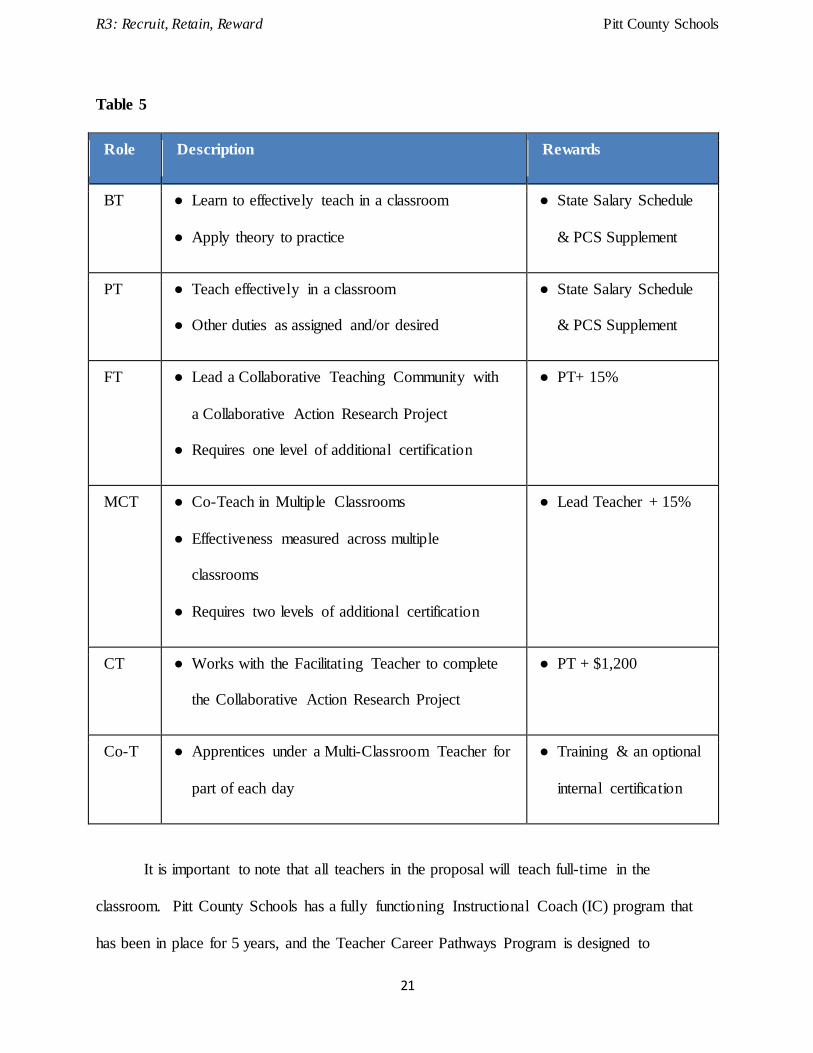
Teacher pathway. All six pathways of the Teacher Career Pathways Model are summarized in
Table 5.
Because there are only 12 MCTs across the district, the placement for these positions will
be prioritized based on schools with the highest need for their expertise, particularly those with
high percentages of low-income and minority students. The increased pay for these positions is
designed to both reward teachers for their high performance and provide an incentive for them to
transfer to high-needs schools. The presence of these highly-effective, master teachers will
expand the equitable access of low-income and minority students to highly effective
teachers. The fact that they will teach with Co-Teachers at these schools ensures their influence
extends beyond the walls of one single classroom. Students benefit directly by having two
teachers in the classroom rather than one to allow for more individualized instruction, thereby
aligning to the district’s vision and mission. It also expands the reach of these teachers so that
they can influence more students than if they remained in their own classroom.
R3: Recruit, Retain, Reward Pitt County Schools
21
Table 5
Role Description Rewards
BT ● Learn to effectively teach in a classroom
● Apply theory to practice
● State Salary Schedule
& PCS Supplement
PT ● Teach effectively in a classroom
● Other duties as assigned and/or desired
● State Salary Schedule
& PCS Supplement
FT ● Lead a Collaborative Teaching Community with
a Collaborative Action Research Project
● Requires one level of additional certification
● PT+ 15%
MCT ● Co-Teach in Multiple Classrooms
● Effectiveness measured across multiple
classrooms
● Requires two levels of additional certification
● Lead Teacher + 15%
CT ● Works with the Facilitating Teacher to complete
the Collaborative Action Research Project
● PT + $1,200
Co-T ● Apprentices under a Multi-Classroom Teacher for
part of each day
● Training & an optional
internal certification
It is important to note that all teachers in the proposal will teach full-time in the
classroom. Pitt County Schools has a fully functioning Instructional Coach (IC) program that
has been in place for 5 years, and the Teacher Career Pathways Program is designed to
R3: Recruit, Retain, Reward Pitt County Schools
22
complement, not compete against or replace, the IC program. Beginning, Professional,
Facilitating, Multi-Classroom, Collaborating, and Co-Teachers will be full-time classroom
teachers, working directly with students in classroom instruction for a minimum of 70% of the
day. In contrast, PCS instructional coaches spend 100% of their time working directly with and
supporting adults.
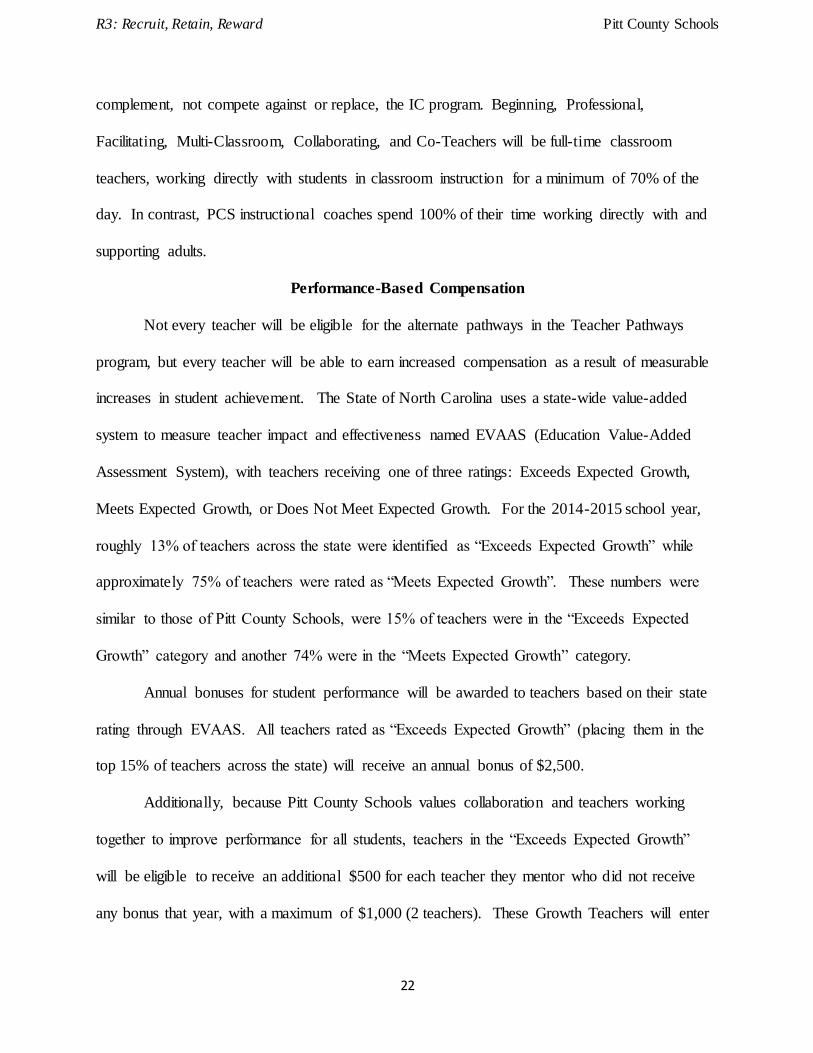
Performance-Based Compensation
Not every teacher will be eligible for the alternate pathways in the Teacher Pathways
program, but every teacher will be able to earn increased compensation as a result of measurable
increases in student achievement. The State of North Carolina uses a state-wide value-added
system to measure teacher impact and effectiveness named EVAAS (Education Value-Added
Assessment System), with teachers receiving one of three ratings: Exceeds Expected Growth,
Meets Expected Growth, or Does Not Meet Expected Growth. For the 2014-2015 school year,
roughly 13% of teachers across the state were identified as “Exceeds Expected Growth” while
approximately 75% of teachers were rated as “Meets Expected Growth”. These numbers were
similar to those of Pitt County Schools, were 15% of teachers were in the “Exceeds Expected
Growth” category and another 74% were in the “Meets Expected Growth” category.
Annual bonuses for student performance will be awarded to teachers based on their state
rating through EVAAS. All teachers rated as “Exceeds Expected Growth” (placing them in the
top 15% of teachers across the state) will receive an annual bonus of $2,500.
Additionally, because Pitt County Schools values collaboration and teachers working
together to improve performance for all students, teachers in the “Exceeds Expected Growth”
will be eligible to receive an additional $500 for each teacher they mentor who did not receive
any bonus that year, with a maximum of $1,000 (2 teachers). These Growth Teachers will enter
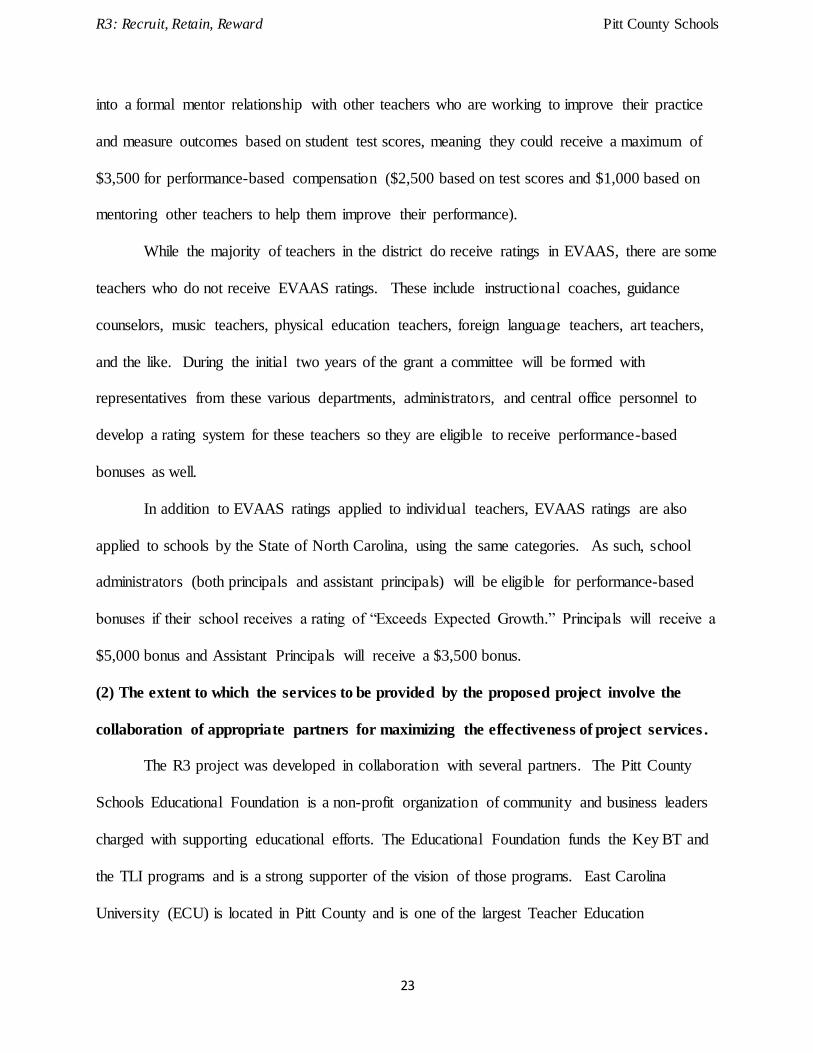
R3: Recruit, Retain, Reward Pitt County Schools
23
into a formal mentor relationship with other teachers who are working to improve their practice
and measure outcomes based on student test scores, meaning they could receive a maximum of
$3,500 for performance-based compensation ($2,500 based on test scores and $1,000 based on
mentoring other teachers to help them improve their performance).
While the majority of teachers in the district do receive ratings in EVAAS, there are some
teachers who do not receive EVAAS ratings. These include instructional coaches, guidance
counselors, music teachers, physical education teachers, foreign language teachers, art teachers,
and the like. During the initial two years of the grant a committee will be formed with
representatives from these various departments, administrators, and central office personnel to
develop a rating system for these teachers so they are eligible to receive performance-based
bonuses as well.
In addition to EVAAS ratings applied to individual teachers, EVAAS ratings are also
applied to schools by the State of North Carolina, using the same categories. As such, school
administrators (both principals and assistant principals) will be eligible for performance-based
bonuses if their school receives a rating of “Exceeds Expected Growth.” Principals will receive a
$5,000 bonus and Assistant Principals will receive a $3,500 bonus.
(2) The extent to which the services to be provided by the proposed project involve the
collaboration of appropriate partners for maximizing the effectiveness of project services .
The R3 project was developed in collaboration with several partners. The Pitt County
Schools Educational Foundation is a non-profit organization of community and business leaders
charged with supporting educational efforts. The Educational Foundation funds the Key BT and
the TLI programs and is a strong supporter of the vision of those programs. East Carolina
University (ECU) is located in Pitt County and is one of the largest Teacher Education

R3: Recruit, Retain, Reward Pitt County Schools
24
Institutions in North Carolina. There is a current partnership with ECU to train pre-service
teachers using a co-teaching model and they will provide the co-teaching training for R3.
State and local foundations have also partnered with Pitt County Schools to support the
early implementation of the R3 program. Funding for the Teacher Leadership Institute is
supported by grants from the Z. Smith Reynolds and the Wells Fargo Foundation. There is also
a pending grant request for the TLI to the Eddie and JoAllison Smith Family Foundation, a local
charity connected to Grady-White Boats.
3) The extent to which the proposed project is supported by a strong theory.
The Pitt County Schools R3 Program is based on research aimed at creating self-directed
teacher leaders empowered to solve many of their own problems in their classroom, school, and
district. One of the key lessons learned from the Pitt County Schools Teacher Leadership Cohort,
(TLC) which was part of the RttT grant, is that simply providing money to highly-effective
teachers was not an effective way to support and engage teachers to make systematic changes in
learning. Daniel Pink (2011) found that simple monetary rewards are not effective to motivate
individuals in creative and complex professions, like teaching. Instead, a more productive way
to motivate individuals is to allow mastery, autonomy, and purpose. This is one of the core
foundations from which the R3 program was developed.
Mastery means that individual teachers are engaged at growing their own skills, abilities,
and capabilities. When impacting long term professional growth that will sustain changes in
teacher’s behaviors, it is important for teachers to shift their identity, beliefs, values, and/or
capabilities (Costa et al., 2016; Diltz, 1990). This means that effective professional learning
often happens over time during job-embedded trials with peers the teacher trust. Working with
teachers to change the internal locus of control and the resources teachers can pull from to be

R3: Recruit, Retain, Reward Pitt County Schools
25
self-directed has the highest chance of impacting classroom changes (Joyce & Showers, 2002;
Knight, 2007).
Teaching is an adaptive process that is complex, full of changes, non-linear, and based on
the multiple differences among humans (Costa et al., 2016; Garmston & Wellman, 2013; Joyce
& Showers, 2002; Knight, 2007; Lipton, 1993). This means that simple, technical solutions will
often fail because of all the variety in the problems that arise in teaching humans. Building
something as complex as the Saturn V rocket can be replicated because it is technically
complicated, but not adaptively complex, like humans. Practicing mastery means the best
teachers are able to change what they do based on context in the school while maintaining a clear
understanding of who they are by being adaptive and self-directed (Costa et al., 2016; Garmston
& Wellman, 2013).
The focus on mastery is an interdependent and collaborative effort where teacher leaders
support each other as well as the other teachers they work with in order to create an exponential
impact on student learning. Joyce and Showers (2002) approximate as much as a ninety-five
percent attainment of outcomes and implementation in classrooms from training when paired
with peer coaching. The coach allows a teacher to grow, learn, and master her craft by mediating
the thinking of the teacher instead of directing or manipulating her thinking. The goal of a coach
is to mediate the thinking of a teacher at what Diltz (1990) calls the identity level because change
that occurs at the deep structure of a person’s identity will have sustaining and self-perpetuating
impact (Feuerstein et al., 2010). That, in the end, is how a coach produces “self-directed persons
with the cognitive capacity for excellence both independently and as members of a community”
(Costa et al., 2016, pp. 15–16).
R3: Recruit, Retain, Reward Pitt County Schools
26
Autonomy or self-directedness is another core structure to the R3 program. Morris Cogan
and other supervisors in Harvard’s Masters of Arts in Teaching program developed a theory of
supporting teachers as they become professionally responsible for their own performance,
accepting of help from others, and being self-directed in 1973 (Cogan, 1972, 1976; Costa,
Garmston, Hayes, & Ellison, 2016; Garmston, Linder, & Whitaker, 1993). Carl Rogers
summarized his central philosophy that each individual has the resources within himself to be
self-directed and self-understanding (Kirschenbaum, 1991), which guides the R3 program to
have the faith in individual teachers to be autonomous learners in a framework of scaffolded
support.
The purpose of autonomy and self-directedness is to allow individuals permission to
improve their practice in order to improve the entire school. The concept of holonomy (Koestler,
1972) recognizes the dual identity of teachers and learners to both be individuals and at the same
time be part of a group. When adopting a new teaching practice the concept of holonomy
provides a mental map for teachers to think through what they need to do to succeed in adopting
the practice. Even though teachers can be autonomous in their individual classrooms, they are
also bound to be part of a team, a grade, a faculty, or a committee. Teacher leadership is about
developing collaborative relationships with others while inspiring them to join in the journey
(Danielson, 2006) because teacher leaders influence the performance of their peers as well as
their school leaders (Reeves, 2008).
One of paradigm shifts in Pink’s (2011) motivational theory is that once individuals earn
enough money to not worry about basic needs, having a noble purpose is more important than
extra money. If an individual understands why a change is needed or why a strategy will help
students learn, then she is more likely to adopt and be motivated to rally behind that noble

R3: Recruit, Retain, Reward Pitt County Schools
27
purpose (Yost, 2016; Sinek, 2009). Teaching teachers is a very different skill set from teaching
students and often the teachers who are among the best in impacting student achievement gains
feel inadequate in leading other teachers towards a common purpose. In defining a clear purpose,
it is important that teachers are able to clarify a group’s identity while changing practices to align
to that purpose (Garmston & Wellman, 2013).
In order to engage great teachers in making the changes needed it is necessary to
compensate them to a level that is competitive and fair, so they are able to then focus on mastery,
autonomy, and purpose. Henry, Fortner, & Thompson (2010) found that in school districts with
high concentrations of disadvantaged students, increasing teachers’ compensation may allow
these districts to more effectively recruit and retain effective teachers and improve the effort and
morale of those teachers. R3 aims to compensate teachers by rewarding performance, incentivize
collaboration, and offering training and support leading to improve student and adult outcomes.
(4) The extent to which the proposed project will integrate with or build on similar or
related efforts to improve the relevant outcomes (as defined in 34 C.F.R. 77.1(c)), using
existing funding streams from other programs or policies supported by community, State
and Federal resources.
Beginning in 2012, North Carolina’s political leadership has passed a series of laws to
shift state employees away from traditional, fixed pay scales toward Performance-Based
Compensation Systems. Section 25.2D of North Carolina Session Law 2012-142, House Bill
950, states that “It is the intention of the General Assembly to create and implement a
modernized, fair, and fully functional Performance-Based Compensation System for employees
of State agencies.” In the same Section of S.L. 2012-142, legislators struck language to evaluate
payment of salary supplements to teachers based “on account or master’s degrees, attainment of
R3: Recruit, Retain, Reward Pitt County Schools
28
other advanced degrees, and national board certification, including the relationship to student
performance, if any. This evaluation should also include recommendations as to whether these
salary supplements should be continued or modified based upon the effect on student
performance, if any, and human resource best practices.”
In 2014 the North Carolina General Assembly ratified Senate Bill 744, Session Law
2014-100, which included Section 8.41, entitled “Differentiated Pay for Highly Effective
Teachers. Stating its intent “to provide local boards of education additional State funds for local
programs to provide differentiated pay for highly effective classroom teachers,” the law
mandated local boards of education to submit proposals to establish a local program to provide
differentiated pay for highly effective classroom teachers to the Senate Appropriations/Base
Budget Committee, the House Committee on Appropriations, and the Joint Legislative Education
Oversight Committee by January 15, 2015. The proposal submitted by Pitt County Schools in
response to this mandate constitutes the foundation on which the Teacher Incentive Fund (TIF)
application is based.
Section 8.7(a) of North Carolina House Bill 1030, ratified on July 1, 2016, appropriated
$9.8 million to establish a “three year pilot program (pilot) to develop advanced teaching roles
and organizational models that link teacher performance and professional growth to salary
increases in selected local school administrative units.” Up to 10 LEAs of varying sizes will be
awarded grants to implement performance-based compensation programs between 2017 and
2020.
Beginning in 2016-17, all teachers in North Carolina will also be eligible to receive
performance-based bonuses if their students perform at specified levels in third grade reading;
R3: Recruit, Retain, Reward Pitt County Schools
29
earn industry certifications and credentials; or achieve passing scores on Advanced Placement
(AP) or International Baccalaureate (IB) examinations.
(c) Professional Development Systems to Support the Needs of Teachers and Principals
Identified through the Evaluation Process (15 Points)
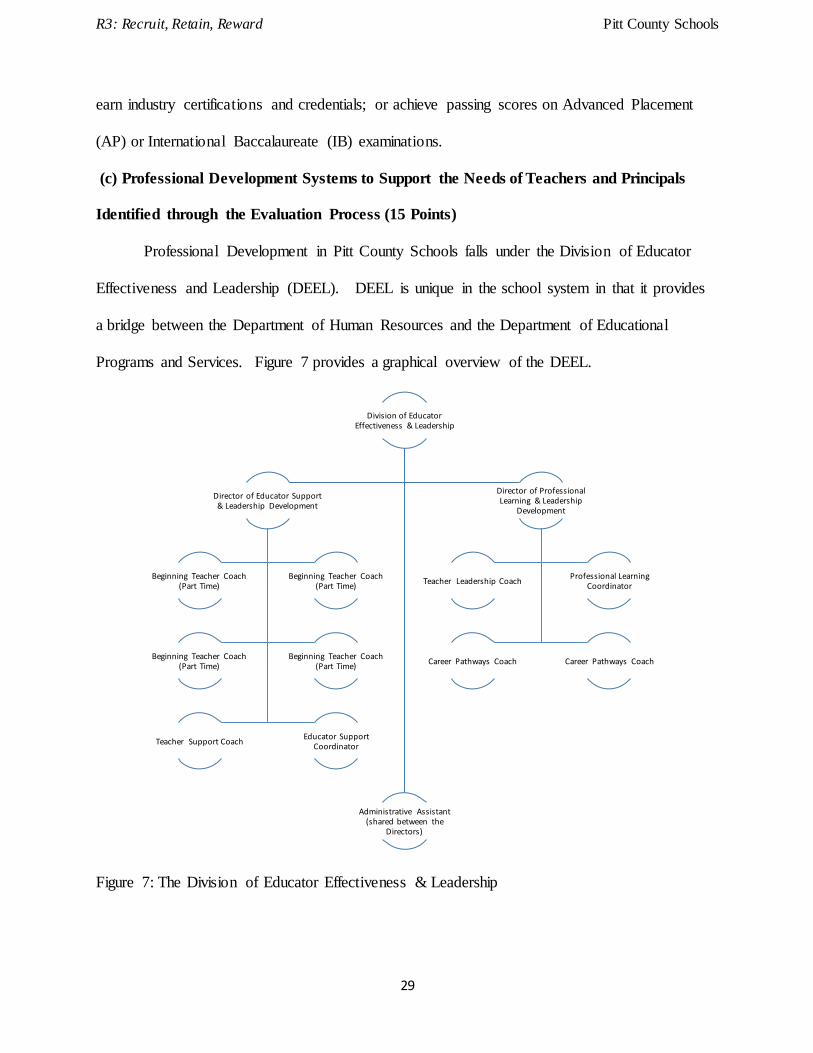
Professional Development in Pitt County Schools falls under the Division of Educator
Effectiveness and Leadership (DEEL). DEEL is unique in the school system in that it provides
a bridge between the Department of Human Resources and the Department of Educational
Programs and Services. Figure 7 provides a graphical overview of the DEEL.
Figure 7: The Division of Educator Effectiveness & Leadership
Division of Educator Effectiveness & Leadership
Administrative Assistant (shared between the
Directors)
Director of Educator Support & Leadership Development
Beginning Teacher Coach (Part Time)
Beginning Teacher Coach (Part Time)
Beginning Teacher Coach (Part Time)
Beginning Teacher Coach (Part Time)
Teacher Support CoachEducator Support
Coordinator
Director of Professional Learning & Leadership
Development
Teacher Leadership CoachProfessional Learning
Coordinator
Career Pathways Coach Career Pathways Coach
R3: Recruit, Retain, Reward Pitt County Schools
30
The State of North Carolina uses a state-wide evaluation system for all teachers and
administrators, called the North Carolina Educator Evaluation System (NCEES). Through
NCEES, all teachers participate in a standardized evaluation process which includes annual
classroom observations, conferences with their administrator, the development of individual
professional learning goals, and a review of student performance and growth data. The
electronic system housing all evaluation information is capable of combining all evaluation
ratings and markings, which is then used by schools and the district to design and deliver
professional learning. All teachers, regardless of their location on the Career Pathways model,
are evaluated using this standard rubric. Similarly, all principals and assistant principals use a
school-leader specific rubric. The evaluation process for administrators includes a minimum of
three conferences between the administrator and their central-services evaluator, a review of
student growth and achievement data, and the development of an individualized, personalized
professional learning plan.
For those teachers who are on a differentiated Career Pathway (e.g., Facilitating Teacher,
Multi-Classroom Teacher, Teacher Leadership Institute, etc.), a customized rubric will
additionally be used to measure and evaluate performance regarding those positions and identify
and develop professional learning for the teachers. For example, all teachers who participate in
the Teacher Leadership Institute use the Teacher Leader Competencies, a rubric developed by
the National Board for Professional Teaching Standards, the National Education Association,
and the Center for Teacher Quality. The use of a customized rubric for individuals at different
locations on the Pathways allows for professional learning, goal setting, and feedback to be
targeted based on the unique needs of the individual and aligned to the goals of the position.
R3: Recruit, Retain, Reward Pitt County Schools
31
Professional development in the district is evaluated using a multi-pronged approach that
looks beyond the initial responses of participants to the training and rather examines the level of
impact on teacher practice and student learning (Breidenstein, Glickman, Fahey, & Hensley,
2012; Drago-Severson, 2012; Guskey, 2000; Killion, 2008; Zepeda, 2012). Impact of
professional learning is measured through classroom walkthroughs, examination of student
performance data, and even a review of teacher evaluation ratings. Combined with a district-
wide annual PD needs assessment, these data are used to design and deliver professional learning
across the district. The district does not grant continuing education units (CEUs) for any
trainings of less than 10 hours or that happen in less than two days, with programs like the Key
BT and the Teacher Leadership Institute requiring multi-day trainings over the course of months
or years. These requirements for professional learning respond to research indicating that
effective professional learning which leads to changes in teacher practice requires a minimum of
80-100 hours of adult learning over an extended time (Carr, Herman, & Harris, 2005; Guskey &
Yoon, 2009; Harwell, 2003; Joyce & Showers, 2002). The district also employs Instructional
Coaches at every school, with the job of providing on-going, job-embedded, timely feedback and
coaching to teachers as they apply new skills they are learning (Costa, Garmston, & Zimmerman,
2013; Costa & Garmston, 2016; Joyce & Showers, 2002; Killion, 2008).
As specifically relates to the professional learning of teachers in the various paths of the
Career Pathway model, both Facilitating and Multi-Classroom teachers will receive intensive,
specialized training aligned to best practices in developing and facilitating groups, analyzing
data, conducting collaborative action research, and working with adults. The transformative
collaboration will require on-going professional learning, support, and coaching, necessitating
the addition of certified coaches to support the teachers beyond what Instructional Coaches can
R3: Recruit, Retain, Reward Pitt County Schools
32
provide. Grant funds will be used to hire Career Pathway Coaches, a Teacher Leadership Coach,
and a Teacher Support Coach. Training for these positions is vital, and they will become in-
house trainers so that the cost of continued training for new participants will be funded
completely in-house. Certified coaches will augment the support provided in formal training
sessions by conducting regular, on-going coaching sessions with each teacher. Finally, as both
the FT and MCT positions will place teachers into leadership positions within the school, 360-
degree leadership surveys with intense follow-up coaching will be administered every 12-18
months for all Facilitating and Multi-Classroom teachers. Program directors and coaches will be
certified to administer all required surveys as well as receive a minimum of 90 hours of coaching
training prior to working with the teachers. Over the past three years Pitt County Schools has
invested over $100,000 to have two certified coaching trainers on staff, and these trainers will
provide additional training and support for the coaches who support teachers. The project Co-
Directors will be responsible to oversee and develop the Career Pathway, Teacher Leadership,
and Teacher Support Coaches, which will include video reflections and feedback sessions on
their coaching and professional learning delivery.
(d) Quality of the Management Plan
Pitt County Schools is the applicant and fiscal agent responsible for execution and
oversight of this project. Pitt County Schools has been the prior recipient of multiple federal
grants and has the capacity and experience to oversee the proposed project. The PCS Finance
Department ensures, supports, and monitors the financial resources of the school system and
individual schools, assuring that Generally Accepted Accounting Procedures (GAAPs) are
followed as required by state and federal law. The district engages in a comprehensive annual
financial report that encompasses all the funds and account groups of the school system. The

R3: Recruit, Retain, Reward Pitt County Schools
33
audit is performed as soon as possible after the close of each fiscal year by a certified public
accountant or by an accountant certified by the Local Government Commission as qualified to
audit local government accounts.
The full R3 Framework, including the expanded Career Pathways project and the
performance based compensation system, will be overseen by the PCS Division of Educator
Effectiveness and Leadership (DEEL). The project will be co-directed by DEEL administrators
Thomas Feller and Seth Brown. Mr. Feller has been employed by PCS for 13 years and currently
serves as the Professional Learning Coordinator, and will serve as the Director for Professional
Learning and Leadership Development. Mr. Brown has been employed by PCS for 19 years and
is the Teacher Support Coordinator, and will serve as the Director for Educator Support and
Leadership Development. Both Mr. Feller and Mr. Brown are certified by Thinking
Collaborative as Agency Trainers for the Cognitive CoachingSM Model and the Adaptive Schools
Model, each of which required a two-year commitment and hundreds of training hours to obtain.
They have experience as teachers, school-based administrators, and district- level administrators
and have been involved in implementing new programs for leadership development and training
at both the district and state level. Resumes for both co-directors are attached in Appendix D.
Mr. Feller was the district’s Race to the Top (RttT) Grant Coordinator from 2010-2015,
responsible for the management of a $4 million RttT subgrant from the North Carolina
Department of Public Instruction. Mr. Brown has served as a teacher and building-level principal
at high-need schools. As principal of a Title I school, he was responsible for managing and
reporting use of federal funds. The district received a $9 million School Improvement Grant
(SIG) in 2009 to turn around three low-performing schools. Between 2009 and 2014, PCS
collaborated with East Carolina University on an $8 million Teacher Quality Partnership (TQP)

R3: Recruit, Retain, Reward Pitt County Schools
34
grant. The school district has also received numerous other grants from public, private, and
governmental sources.
In addition to the Directors, grant funds will be used to hire four full-time coach/trainers
who will provide on-going support and training for teachers involved in the various elements of
the R3 Framework (see Figure 7). Upon full implementation, all components of the framework
will involve working directly with over 200 teachers across the district annually (approximately
40-50 for the Key BT program, 50 in the Teacher Leadership Institute, 75 Facilitating Teachers,
12 Multi-Classroom Teachers, and 24-36 Co-Teachers). These coaches will invest their time
meeting with, mentoring, and coaching the teachers. Upon hire, the coaches will receive nearly
150 hours of training in coaching, leadership coaching, and 360o surveys administration during
the first year. They will also become certified to deliver any required trainings teacher
participants may need.
Upon approval of the Department of Education in October 2016, Pitt County Schools will
begin advertising for key leadership and implementation positions associated with the project.
Between October and December 2016, training will be provided for those responsible for
program implementation. The program will be phased in over five years to allow for adequate
training for teachers in these new roles. During the 2016-2017 school year the district will
provide training and planning with the school principal, school improvement team, and staff to
prepare for the implementation of the new teaching roles at the participating schools. The district
will hire the first cohort of Facilitating Teachers, totaling 56 teachers, providing 1-3 facilitating
teachers for each of the participating schools to begin working during the 2017-2018 school year;
in 2018-2019 the district will hire an additional 19 teachers, to be allotted at participating schools
that need and request an additional position. The 2018-2019 school year will also begin the
R3: Recruit, Retain, Reward Pitt County Schools
35
Multi-Classroom Teacher component of the program, with 12 MCTs hired and placed at schools
who receive approval to have them. Finally, during the 2018-2019 school year the district will
allot funds for the first round of perform the performance-based bonuses.
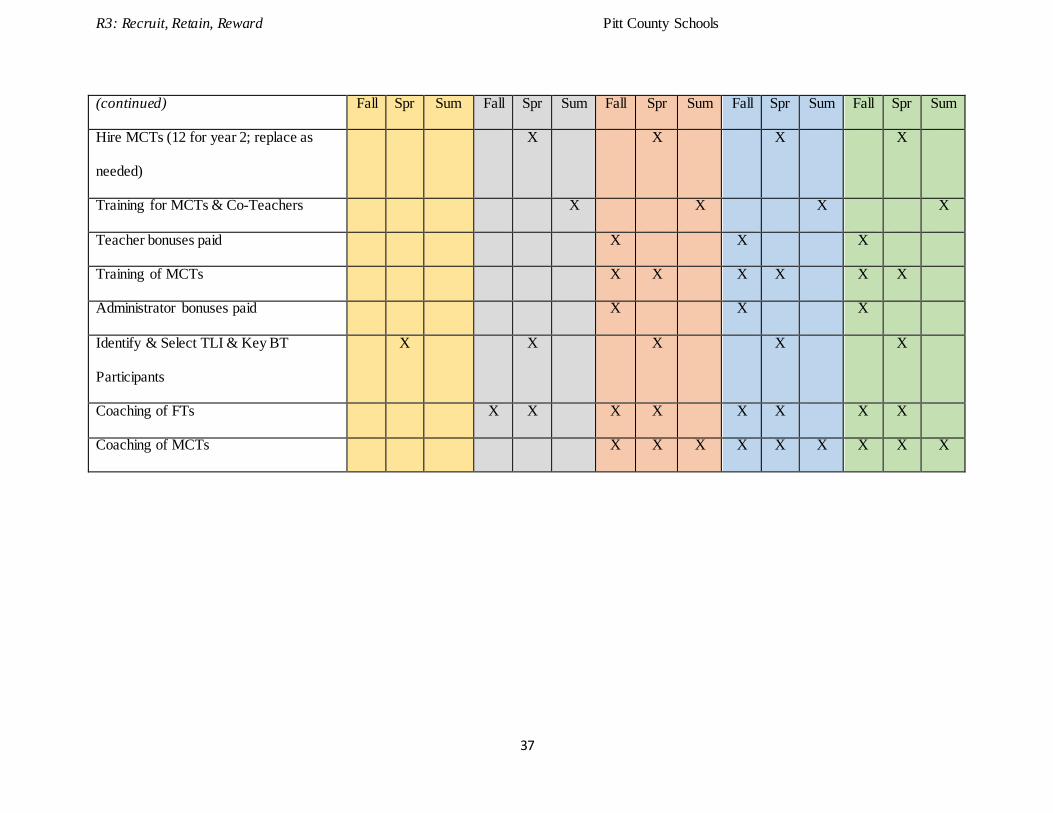
Table 6 recaps the timeline of major project activities throughout the grant cycle.
Evaluation
The school district will contract with a highly qualified evaluator following the open bid
process. The selection of this consultant will be based on familiarity with professional
development and instructional improvement initiatives, familiarity with PCS, and the
consultant’s years of experience in education research and program evaluation. While acting in
the role of independent consultant, this evaluator will also provide ongoing feedback and
recommendations to assist PCS with implementing continuous improvement and achieving
project objectives.
With the guidance of the consultant, PCS will conduct formative and summative
evaluations of the project, and the consultant will handle production of the Annual Performance
Report submitted to the U.S. Department of Education. The process evaluation will focus on how
the project is being implemented, how the project is operating, the services it delivers, and the
functions it performs, documenting the decisions made in carrying out the project. The formative
evaluation will address whether the project is being implemented as originally designed and is
providing services as intended. This will be an ongoing activity, occurring through the period of
project operations, and will be a vehicle for periodically organizing and providing feedback
information to key personnel, school administrators, and the R3 management team—information
that will be useful in introducing refinements and improvements in the project.

R3: Recruit, Retain, Reward Pitt County Schools
36
Table 6: Project Timeline
2016-2017 2017-2018 2018-2019 2019-2020 2020-2021
Fall Spr Sum Fall Spr Sum Fall Spr Sum Fall Spr Sum Fall Spr Sum
Hire leadership & classified support X
Certification training for co-directors X X
Hire & certification training: coaches X X
Open invitations for schools for FT &
MCT positions
X X X
Hire PD Coordinator & Educator
Support Coordinator
X
School-Based training for school
leadership teams to prepare for and
support FT and MCT positions
X X X X X X X X X X X
Hire FTs (56 for Year 1 & 19 in Year 2;
replace as needed)
X X X X X
Train FTs X X X X X X X X
2016-2017 2017-2018 2018-2019 2019-2020 2020-2021
R3: Recruit, Retain, Reward Pitt County Schools
37
(continued) Fall Spr Sum Fall Spr Sum Fall Spr Sum Fall Spr Sum Fall Spr Sum
Hire MCTs (12 for year 2; replace as
needed)
X X X X
Training for MCTs & Co-Teachers X X X X
Teacher bonuses paid X X X
Training of MCTs X X X X X X
Administrator bonuses paid X X X
Identify & Select TLI & Key BT
Participants
X X X X X
Coaching of FTs X X X X X X X X
Coaching of MCTs X X X X X X X X X

R3: Recruit, Retain, Reward Pitt County Schools
38
The summative outcome evaluation will measure the progress being made toward
achieving the goals, objectives, and outcomes identified for this proposal. The summative
evaluation will be conducted annually and answer the overarching question, “What difference is
the project making?” providing a statement about the impact of the project at annual intervals
and quantifying the changes in desired outcomes occurring as a result of the project.
In coordination with the independent consultant, PCS will also produce a summary
impact statement at the end of the grant performance period. This statement will focus on the
broad, long-term impact of project activities, as well as assess the secondary benefits of the
project expected to develop over its course, such as the extension of program activities across the
district. Serving as an executive summary for the project, this statement will guide the continued
development of project strategies and activities in years following the end of grant funding.
Evaluation methods will include collecting both qualitative and quantitative data from
teachers and principals. The number of teachers completing Capstone and Collaborative Action
research projects, teacher effectiveness ratings, and student achievement and academic growth
will be documented. Teacher recruitment and retention data will be recorded. Teacher and
principal surveys, interviews, and observations, and feedback on professional development will
also be recorded. Data will also be collected regarding support for the R3 project.
(e) Adequacy of Resources
(1) The extent to which the applicant demonstrates that Performance-based Compensation
Systems are developed with the input of teachers and school leaders in the schools and local
educational agencies to be served by the grant.
The R3 Framework was developed with input from multiple stakeholders including
teachers, principals, instructional coaches, central office personnel, university partners, business
R3: Recruit, Retain, Reward Pitt County Schools
39
partners, and the Pitt County Board of Education between August 2014 and January 2015 in
response to NC Session Law 2014-100, Section 8.41, entitled “Differentiated Pay for Highly
Effective Teachers.” With the 2013 launch of the R3 Framework, PCS was already invested in
the creation of a Human Capital Management System with differentiated pay elements when the
state’s General Assembly called for proposals. The PCS “Teacher Career Ladder” plan submitted
to the State in January 2015 requested funds to enable implementation of R3 Framework
components that were funding-dependent, although Senate Bill 744/S.L. 2014-100 did not
include funds to implement the proposals. The project described in this application is an
expanded version of the concept approved by PCS stakeholders in 2014-15 and submitted to the
State Legislature. The timeline of this process is listed below:
● Senate Bill 744 - Signed by Governor Pat McCrory on August 7, 2014
● August 2014 – PCS Central Office personnel begin research &collaboration with UNC
Hospitals regarding nursing career ladder; 1st Cohort of Key BT Program begins
● October 2014- Brainstorming and collaboration with East Carolina University.
● November 2014 - Teacher and Principal Advisory Committees provide feedback
● December 2014/January 2015 - Proposal adopted by the Pitt County Board of Education
& additional presentation to principals and business and university partners
● January 2015 - Submission of the proposal to the NC General Assembly
● August 2015 – 2nd Cohort of Key BT Program begins
● October 2015– Initial funding secured for the Teacher Leadership Institute
● January 2016 – First class of Teacher Leadership Institute begins
● June 2016 – Second class of Teacher Leadership Institute begins
● June 2016 – R3 Framework further refined and presented to a group of teachers leaders
R3: Recruit, Retain, Reward Pitt County Schools
40
● July 2016 – R3 Framework submitted to US Department of Education
(2) The extent to which the applicant demonstrates a plan to sustain financially the
activities conducted and systems developed under the grant once the grant period has
expired.
The receipt of the TIF grant will allow Pitt County Schools to dramatically accelerate the
plans already in place at both the local and state level to implement the elements identified
throughout the application. By investing in leadership and building capacity across the district,
Pitt County Schools is committed to sustaining the project long-term. Additionally, as
demonstrated in the budget narratives, significant expenditures are gradually shifted from TIF
funds to non-TIF funds in years 4 and 5 of the grant. The entire program budget for the R3
Framework is approximately $20 million, with an estimated 25% contributed directly by Pitt
County Schools over the five years of the grant through internal appropriations and
business/community support. By gradually shifting funding for the program during the project,
PCS will build the capacity to sustain the project in the long-term.
Another aspect of sustainability is that two of the four elements of the R3 Framework
have already been implemented and funded by the district: the Key BT program and the Teacher
Leadership Institute. In addition, the first two pathways of the Career Pathway model are also
fully funded. Finally, with the ratification of North Carolina House Bill 1030, the State of North
Carolina has demonstrated both an interest in and commitment to developing Performance-Based
Compensation plans, including career pathways. Of particular note is the fact the State will
begin offering significant performance-based bonuses to third grade reading teachers and high
school teachers of Advanced Placement, International Baccalaureate, and Career and Technical
Education courses beginning in the 2016-2017 school year.
R3: Recruit, Retain, Reward Pitt County Schools
41
References
Alliance for Excellent Education (2014). On the Path to Equity: Improving the effectiveness of
Beginning Teachers. Retrieved from (http://all4ed.org/reports-factsheets/path-to-equity/).
Bacharah, N., Heck, T., & Dalhberg, K. (201). Changing the face of student teaching through
coteaching. Action in Teacher Education, 32(1), 3-14.
Breidenstein, A., Glickman, C., Fahey, K., & Hensley, F. (2012). Leading for powerful learning:
A guide for instructional leaders [Kindle edition] . Downloaded from Amazon.com.
Carr, J., Herman, N., & Harris, D. (2005). Creating dynamic schools through mentoring,
coaching, and collaboration. Alexandria, VA: ASCD.
Cogan, M. L. (1972). Clinical supervision. Boston: Houghton Mifflin.
Costa, A., Garmston, R., & Zimmerman, D. (2013). Cognitive capital: Investing in teacher
quality. New York, NY: Teacher’s College Press.
Costa, A. L., & Garmston, R. (2016). Cognitive coaching: Developing self-directed leaders and
learners (Third Edition). Lanham: Rowman & Littlefield.
Danielson, C. (2006). Teacher leadership that strengthens professional practice. Alexandria,
VA: ASCD.
Diltz, R. (1990). Changing belief systems with NLP. Capitola, CA: Meta Publications.
Drago-Severson, E. (2012). Helping educators grow: Strategies and practices for leadership
development [Kindle edition]. Downloaded from Amazon.com.
Dufour, R. (2004). What is a professional learning community? Educational Leadership, 61(8).
Feller, Jr., T. (2013). Bringing Great Teachers Into High-Needs Schools. Educational
Leadership, 71(2), Online.
Feller, Jr., T., & Jackson, D. (2014a). A model for instructional coaching. Presented at the
NCDPI Region 1 Summer Institute, Washington, NC.
R3: Recruit, Retain, Reward Pitt County Schools
42
Feller, Jr., T., & Jackson, D. (2014b). A model for instructional coaching. Presented at the
NCDPI Region 3 Summer Institute, Rocky Mount, NC.
Feller, Jr., T., Jackson, D., Olmsted, C., & Tate, L. (2014). A model for instructional coaching.
Presented at the NCASCD Conference, Pinehurst, NC.
Feuerstein, R., Feuerstein, R., & Falik, L. (2010). Beyond smarter: Mediated learning and the
brain’s capacity for change. New York: Teachers College Press.
Figlio, D. N., & Kenny, L. W. (2007). Individual teacher incentives and student
performance. Journal of Public Economics, 91(5), 901–914.
Garmston, R. J., Linder, C., & Whitaker, J. (1993). Reflections on Cognitive Coaching.
Educational Leadership, 51(2), 57–61.
Garmston, R. J., & Wellman, B., M. (2013). The adaptive school: A sourcebook for developing
collaborative groups (2nd ed.). Lanham, MD: Rowman & Littlefield Publishers.
Guskey, T. (2000). Evaluating professional development. Thousand Oaks, CA: Corwin Press.
Guskey, T., & Yoon, K. S. (2009). What works in professional development? Phi Delta Kappan,
90(7), 495–500.
Hanushek, E. A. (2014). Boosting teacher effectiveness. What Lies Ahead for America’s
Children and Their Schools, 23–35.
Harwell, S. H. (2003). Teacher professional development: It’s not an event, it’s a process. Waco,
TX: CORD. Retrieved January, 21, 2004.
Henry, G. T., Fortner, C. K., & Thompson, C. L. (2010). Targeted Funding for Educationally
Disadvantaged Students: A Regression Discontinuity Estimate of the Impact on High School
Student Achievement. Educational Evaluation and Policy Analysis, 32(2), 183–204.
http://doi.org/10.3102/0162373710370620
R3: Recruit, Retain, Reward Pitt County Schools
43
Ingersoll, S. (2012, May 16). Beginning teacher induction: What the data tell us. Retrieved
January 5, 2015, from
http://www.edweek.org/ew/articles/2012/05/16/kappan_ingersoll.h31.html
Joyce, B., & Showers, B. (2002). Student achievement through staff development (3rd ed.).
Alexandria, VA: ASCD.
Killion, J. (2008). Assessing impact (2nd Edition). Thousand Oaks, CA: Corwin Press.
Kirschenbaum, H. (1991). Denigrating Carl Rogers: William Coluson’s last crusade. Journal of
Counseling & Development, 69(May/June), 411–413.
Knight, J. (2007). Instructional coaching: A partnership approach to improving instruction.
Corwin Press.
Koestler, A. (1972). The roots of coincidence. New York: Vintage Books.
Lipton, L. (1993). Transforming information into knowledge: Structured reflection in
administrative practice. Retrieved from http://eric.ed.gov/?id=ED361903
Maser, D., Janda, L., Stafford, B., Maser, R., Argueta, R., Parker, B., & Stallings, T. (2014).
Strategic staffing in North Carolina: A summative review of local and state implementation
across the Race to the Top period. Center for Educational Research and Evaluation - North
Carolina. Retrieved from http://cerenc.org/wp-content/uploads/2014/09/State-and-Local-
Strategic-Staffing-Final-Summative-Report-9-4-14.pdf
Marzano, R. (2001). New Era of School Reform, Presented at the NSDC National Conference,
Denver.
National Comprehensive Center for Teacher Quality. (2007). Enhancing teacher leadership.
National Comprehensive Center for Teacher Quality. Retrieved from
http://www.tqsource.org/strategies/leadership/EnhancingTeacherLeadership.pdf
R3: Recruit, Retain, Reward Pitt County Schools
44
Pink, D. H. (2011). Drive: The surprising truth about what motivates us. New York: Penguin
Group.
Pitt County Schools. (2014, June). K-12 Instructional coaching evaluation framework and
rubric. Pitt County Schools.
Provini, C. (2014). Why are teachers leaving the profession? Retrieved January 5, 2015, from
http://www.educationworld.com/a_curr/why-are-teachers- leaving-profession.shtml
Public Impact. (2012). Teacher pay & career advancement: A leader’s guide to sustainably
funded excellence. Chapel Hill, NC: Author. Retrieved from
http://opportunityculture.org/wp-
content/uploads/2012/10/Teacher_Pay_and_Career_Advancement-Public_Impact.pdf
Reeves, D. (2008). Reframing teacher leadership to improve your school. Alexandria, VA:
ASCD.
Reform Support Network. (2013, February). Baltimore’s career pathways initiative for teachers.
United States Department of Education. Retrieved from
www2.ed.gov/about/inits/ed/implementation-support-unit/tech-assist/baltimore-model-
pathway.pdf
Rivkin, S. G., Hanushek, E. A., & Kain, J. F. (2005). Teachers, schools, and academic
achievement. Econometrica, 73(2), 417–458.
Sinek, S. (2009). Start with why: How great leaders inspire everyone to take action. New York:
Portfolio.
Stallings, T., Parker, B., Argueta, R., Maser, R., & Halstead, E. (2014). Local strategic staffing
in North Carolina: A review of plans and early implementation. Center for Educational
R3: Recruit, Retain, Reward Pitt County Schools
45
Research and Evaluation - North Carolina. Retrieved from http://cerenc.org/wp-
content/uploads/2011/10/Strategic-staffing_1stYear-Report_-FINAL-09-24-2012.pdf
Suescun, M., Romer, T., & MacDonald, E. (2012). Buoyed on All Sides. JSD, 33(6), 32–36.
US Department of Education. (n.d.). Facts about the teaching profession for a national
conversation about teaching. United States Department of Education. Retrieved from
http://www2.ed.gov/documents/respect/teaching-profession-facts.doc
Yost, Jon. (2016) Leading with Why. Solution Tree, Inc. retrieved online:
http://www.allthingsplc.info/blog/view/319/leading-with-why
Zepeda, S. J. (2012). Professional development: What works. Larchmont, NY: Eye on Education.
http://cerenc.org/wp-content/uploads/2011/10/Strategic-staffing_1stYear-Report_-FINAL-09-24-2012.pdf