
search.jsp?R=20010019789 2018-11-09T21:57:58+00:00Z · NASA/CP--2000-210530 234. Short Distance...
20
2.4 - Special Effects: Antenna Wetting, Short Distance Diversity and Depolarization By Roberto J. Acosta NASA Glenn Research Center Cleveland, Ohio 44135 Phone: 216-433-6640: Fax: 216-433-6371 E-mail: [email protected] Abstract The Advanced Commtmication Technology Satellite (ACTS) commtmications system operates in the Ka frequency band. ACTS uses multiple, hopping, narrow beams and very small aperture terminal (VSAT) technology to establish a system availability of 99.5% for bit-error-rates of 5x 10 .7or better over the continental United States. In order maintain this minimum system availability in all US rain zones, ACTS uses an adaptive rain fade compensation protocol to reduce the impact of signal attenuation resulting from propagation effects. The purpose of this paper is to present the results of system and sub-system characterizations considering the statistical effects of system variances due to antenna wetting and depolarization effects. In addition the availability enhancements using short distance diversity in a sub-tropical rain zone are investigated. I. Introduction The Advanced Communications Technology Satellite (ACTS) was launched in September 1993 and is now operating in inclined orbit of 0.8 degrees per year. The primary objective of the technology verification experiment (TVE)program is to obtain a deeper understanding and full statistical characterization of ACTS Ka band sub-systems. These measurements, obtained in an operational space environment, are needed to accurately evaluate ACTS technology and to promote the development and characterization of prototype Ka band sub- system technologies This paper describes two propagation effects and a rain fade compensation technique that should be considered when designing a Ka-band satellite system. The contribution of wet reflector antennas and depolarization to the signal path losses in a Ka-band, low margin system is statistically documented. Two-station diversity is experimentally investigated in a sub-tropical rain zone. The amount of water in ground reflector antennas (reflector and feed radomes) can cause additional signal loss (up to 4 to 5dB) from the expected propagation attenuation due to rain at Ka-band. This is one reason that the standard techniques for predicting rain fade statistics (using propagation models) are not aligned with ACTS Ka- band RF beacon measurements. All ACTS ground reflectors, including the propagation terminal (APT) utilized off-the-shelf hardware that was mainly designed for Ku-band operations. The ACTS reflector surfaces were coated with a very thick and rugged dielectric layer, that in the presence of water, created a large reflection coefficient causing larger (2-5 dB) attenuation of the signal. The problem of wet antenna can be described as high perturbation on the feed standing wave ratio. In contrast, the reflector losses can be explained by an additional scattering losses and absorption due to raindrops' size at the surface of the reflector. Borsholm, Crane and Acosta [1,2,3] have studied the problem of signal loss due to wet reflector antenna and radome surfaces. In this paper, e_ensive measurements are presented to statistically characterize the wetting effect. Rain induced depolarization is produced from a differential attenuation and phase shift caused by non-spherical raindrops. As the size of raindrops increase, their shape tends to change from spherical (the preferred shape because of surface tension forces) to oblate spheroids with an increasingly pronounced flat or concave base produced from aerodynamic forces acting upward on the drops. A second source of depolarization on an Earth-space path, in addition to rain, is the presence of ice crystals in clouds at high altitudes. Ice crystal depolarization is caused primarily by differential phase shift rather than differential attenuation, which is the major mechanism for raindrop depolarization. Ice crystal depolarization NASA/CP--2000-210530 233 https://ntrs.nasa.gov/search.jsp?R=20010019789 2018-11-22T18:48:57+00:00Z
Transcript of search.jsp?R=20010019789 2018-11-09T21:57:58+00:00Z · NASA/CP--2000-210530 234. Short Distance...

2.4 - Special Effects: Antenna Wetting, Short Distance Diversity and Depolarization
By Roberto J. AcostaNASA Glenn Research CenterCleveland, Ohio 44135Phone: 216-433-6640: Fax: 216-433-6371E-mail: [email protected]
Abstract
The Advanced Commtmication Technology Satellite (ACTS) commtmications system operates in the Kafrequency band. ACTS uses multiple, hopping, narrow beams and very small aperture terminal (VSAT)technology to establish a system availability of 99.5% for bit-error-rates of 5x 10 .7or better over the continentalUnited States. In order maintain this minimum system availability in all US rain zones, ACTS uses an adaptiverain fade compensation protocol to reduce the impact of signal attenuation resulting from propagation effects.The purpose of this paper is to present the results of system and sub-system characterizations considering thestatistical effects of system variances due to antenna wetting and depolarization effects. In addition theavailability enhancements using short distance diversity in a sub-tropical rain zone are investigated.
I. Introduction
The Advanced Communications Technology Satellite (ACTS) was launched in September 1993 and is nowoperating in inclined orbit of 0.8 degrees per year. The primary objective of the technology verificationexperiment (TVE)program is to obtain a deeper understanding and full statistical characterization of ACTS Kaband sub-systems. These measurements, obtained in an operational space environment, are needed to accuratelyevaluate ACTS technology and to promote the development and characterization of prototype Ka band sub-system technologies
This paper describes two propagation effects and a rain fade compensation technique that should be consideredwhen designing a Ka-band satellite system. The contribution of wet reflector antennas and depolarization to thesignal path losses in a Ka-band, low margin system is statistically documented. Two-station diversity isexperimentally investigated in a sub-tropical rain zone.
The amount of water in ground reflector antennas (reflector and feed radomes) can cause additional signal loss(up to 4 to 5dB) from the expected propagation attenuation due to rain at Ka-band. This is one reason that thestandard techniques for predicting rain fade statistics (using propagation models) are not aligned with ACTS Ka-band RF beacon measurements.
All ACTS ground reflectors, including the propagation terminal (APT) utilized off-the-shelf hardware that wasmainly designed for Ku-band operations. The ACTS reflector surfaces were coated with a very thick and ruggeddielectric layer, that in the presence of water, created a large reflection coefficient causing larger (2-5 dB)attenuation of the signal.
The problem of wet antenna can be described as high perturbation on the feed standing wave ratio. In contrast,the reflector losses can be explained by an additional scattering losses and absorption due to raindrops' size atthe surface of the reflector. Borsholm, Crane and Acosta [1,2,3] have studied the problem of signal loss due towet reflector antenna and radome surfaces. In this paper, e_ensive measurements are presented to statisticallycharacterize the wetting effect.
Rain induced depolarization is produced from a differential attenuation and phase shift caused by non-sphericalraindrops. As the size of raindrops increase, their shape tends to change from spherical (the preferred shapebecause of surface tension forces) to oblate spheroids with an increasingly pronounced flat or concave baseproduced from aerodynamic forces acting upward on the drops.
A second source of depolarization on an Earth-space path, in addition to rain, is the presence of ice crystals inclouds at high altitudes. Ice crystal depolarization is caused primarily by differential phase shift rather thandifferential attenuation, which is the major mechanism for raindrop depolarization. Ice crystal depolarization
NASA/CP--2000-210530 233
https://ntrs.nasa.gov/search.jsp?R=20010019789 2018-11-22T18:48:57+00:00Z

can occur with little or no co-polarized attenuation. The amplitude and phase of the cross-polarized componentcan exhibit abrupt changes with large excursions.
Atmospheric depolarization effects were measured using the ACTS beacons and collected for ½ of a station
year. Depolarization due to rain is not an issue at Ka-band since the cross-pol and co-pol signals are attenuated
by the same amount; therefore making the system margin a dominant fimction of the co-pol attenuation.
Another depolarization effect is due to ice crystals. This depolarization phenomenon is characterized by an
increase ofeross-pol level and a small but negligible co-pol attenuation. Experimental data using the ACTS
beacon at 20.185 GHz showed that the cross-pol can increase by 10 dB with negligible co-pol attenuation. This
effect is important when designing polarization reuse, and multiple beam systems at Ka-band.
Spatially diversified ground stations must be close enough to minimize the cost of connecting terrestrial lines,
but still realize an increase in link availability. By utilizing the signal from whichever station is experiencing the
least attenuation, the overall link availability is increased. Site diversity is a method for increasing the system
availability at the expense of adding at least one more grotmd station. In tropical and sub-tropical rain zones
the rain cells are compact (<10-km) therefore implying that short distance diversity might be employed. The
data collected in this investigation use two-station diversity geometry with a separation distance of 1.2 krn. The
experiment shows typical diversity gain of 5 to 10 dB. These measurements clearly establishes a method forcompensating rain fades in a sub-tropical rain zones.
The primary objective of this paper is to experimentally determine the magnitude of the signal loss when the
ACTS antenna reflector is wet. depolarization effects on cross-pol, and gain enhancement of short distancediversity in a sub-tropical rain zone.
H. Experiment Description
Antenna Wetting Experiment
The objective of the antenna wetting experiment consisted in measuring the magnitude of the effect and its
correlation to rain rate for the ACTS 0.6-m Ultra Small Aperture Terminal (USAT) reflector antenna. Figure 1.
describes the outdoor experiment set-up. It consisted into two identical reflector systems located side-by-side,
one reflector was protected from rain and the other exposed to rain. The protected reflector is covered
everywhere except in the aperture plane. The received continuous wave 20 GHz RF signal is digitally recorded
at ½ sec sampling rate and filtered at 40 kHz with a bandbpass filter centered at 70 MHz. The receiver has a
signal to noise ratio of at least 30 dB, therefore fades up to 30 dB can be recorded without distortion.
The antenna-wetting factor is defined as the difference between the dry reflector signal and the wet reflector. In
addition to measuring the signal power, a small weather station is operated next to the USAT terminals.
Rainfall data are collected using a tipping bucket rain gage. The experiment was located in sub-tropical region
in Cocoa, Florida. The data collection period extended between April 1999 to April 2000.
Depolarization Experiment
The objective of the depolarization experiment consisted of measuring the magnitude of the received beacon
cross polarization signal in wet and dry conditions. Figure 2a. depicts the experiment outdoor unit and Figure
2b. describes the system block diagram. The experiment terminal is a modified ACTS propagation terminal
(APT) with a 4 channel, dual polarization receiver. The experiment was located in medium rain zone region in
Ahburn, Virginia. The data collection period extended between August to December 1999.
The hardware modifications made to original APT RF enclosure were basically to remove the 27 GHz
components and replace them with 20 GHz components. Within each receiver enclosures are the co-pol and
cross-pol IF, The digital receivers are configured so that the co-pol units are the master subassemblies at the
physical location of the original APT 20 GHz hardware and the cross-pol are the slave subassemblies at the
physical location of the original APT 27 GHz hardware. The significance of this is that the master
subassemblies provide the fixed 65 MHz 2nd LO and 3 rd LO (--4.54 MHz) from digital receiver and the digitalreceiver clock to slave subassemblies.
Several modifications were made to the original APT data collection software to accomplish the measurementgoals and to accommodate the hardware modification.
NASA/CP--2000-210530 234

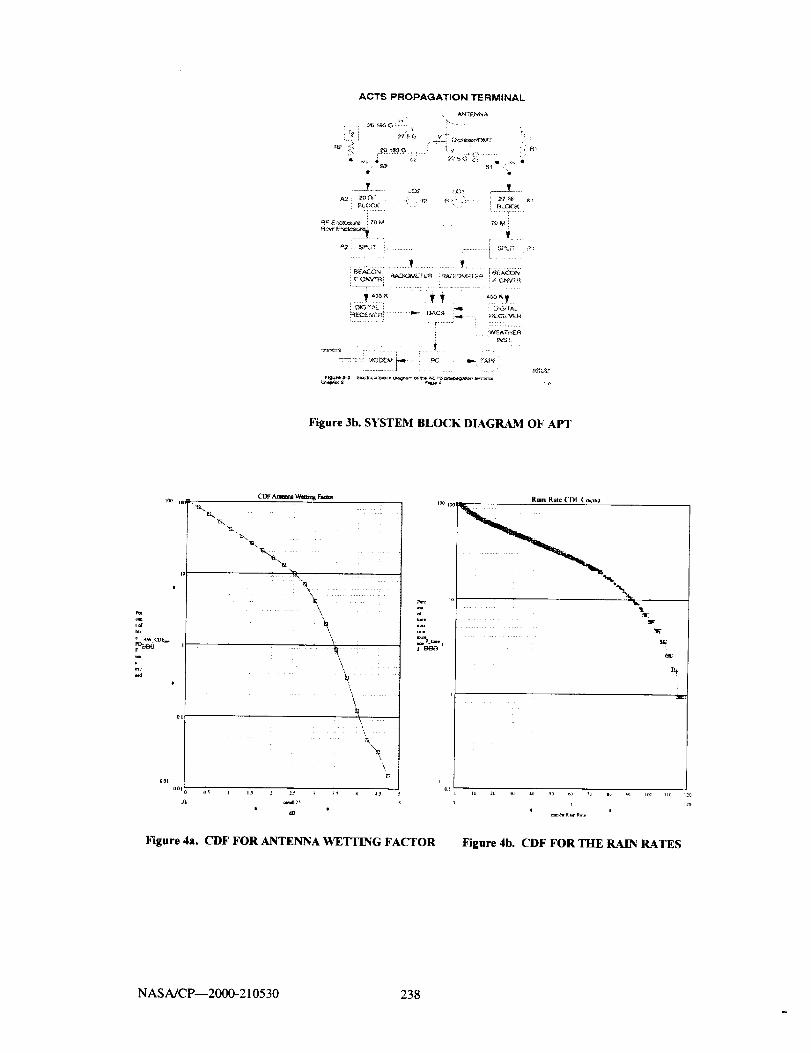
Short Distance Diversity Experiment
The objective of the short distance experiment consisted of measuring the magnitude of site diversity gain using
two ACTS APT 1.2-m VSAT reflector antenna separated by 1.2-km. Figure 3a. describes the experiment
outdoor units during checkout and Figure 3b. shows a block diagram of the APT. The experiment was located in
sub-tropical region in Tampa, Florida. The data collection period extended between September 1999 toDecember 1999.
The experiment consisted of locating two identical propagation terminals separated by a distance of 1.2 km. The
propagation terminals are capable of tracking and receiving the ACTS beacons at 20 and 27 GHz co-polarized
beacon signals. The terminals also measured the sky noise temperature close to the beacon frequencies. This
allows the elimination of equipment effects from the measured beacon signal levels and accurate isolation of
propagation effects during post processing of the collected data. Most of the RF hardware used in the terminalsis identical. The APT uses digital receiver technology. In addition to the beacon signals, several meteorological
parameters are recorded at the two sites. These include rain intensity, ambient temperature, humidity and
pressure. The auxiliary parameters are useful in calibrating the radiometer channels and interpreting the
propagation results.
I1]. Experiment Results
Antenna Wetting Experiment
This paper discusses the impact of signal loss as a result of water layer on the USAT antenna reflector surfaces
and the antenna feed horn radomes. The measured impact of wet antennas proved to be significant. Figure 4a.
shows the cumulative distribution function (CDF) of two station years for the antenna-wetting factor. Figure 4b.
presents the tipping bucket rain rate CDF for the site and notice that it describes a typical sub-tropical region
behavior. Notice the antenna-wetting factor exceeds 2.5 dB for 10 % of the time. At this percent of time rain
rates are greater than 90 mm/hr, which is considered extremely heavy rain. At low rain rates I< 5 mn_hr) the
antenna-wetting factor is about 1 dB.
In order to minimize the effect of wet reflectors the dielectric thickness of the reflector needs to be minimized to
reduce the losses in the presence of a water layer. The feed radome can be easily covered o,1 thc topside to
protect the phased center of the horn from being exposed to water. If an extended radomc is tt, cd. careful offset
design needs to be used in order to prevent signal loss or blockage loss.
Depolarization Experiment
The experiment studied the effect of the cross-polarization signal in rainy and faded conditl_,n, ! ,gurc 5.
depicts the two orthogonal components CDF's. The antenna misalignment effects can b_. seen Ir_mt the dr3.
CDF. Notice there is an increase ofcross-pol signal for about 0.1% of the time. We can tn|t-¢ that this is due to
ice-depolarization since it is the only probable cause for increase ofcross-pol signal under la&.'d conditions
when compared to dry or clear sky conditions. Also from Figure 5. it can be seen that both com_ments increase
by about the same amount, therefore confirming the expectation that ice-depolarization is non-polari,,t_l event.
The data contains a total of about 7 weeks of clear sky and about 2 weeks of faded conditions In order to make
a complete assessment of depolarization due to ice, a complete set of amplitude and phase measurements are
required with at least one year of data collection.
Although the experiment goals were met, future work is still required for a complete statistical characterizationof the ice-depolarization. For system design the effect of ice-depolarization appears to be small (t0. ! % of total
time the signal was faded) and only needs to considered in polarization reuse systems.
Short Distance Diversity
This experiment documents the gain enhancement that can be obtained in sub-tropical rain zone when using 2
stations separated by a distance of 1.2 kin. Figure 6a. shows the corresponding CDF for the sites at both 20 GHz
and 27 GHz. Notice that they are very close over the useful fade range of 20 dB. The diversity gain is defined
in this experimental study as the difference in fade observed simultaneously by the two stations. Figure 6b.
presents the CDF for the gain at 20 and 27 GHz. Notice that 27 GHz gains are larger than expected at 20 GHz.
Gain enhancement exceeding 10 dB occurs at about 5% of time. A typical expected enhancement of greater than
5 dB is more likely to be achievable in systems operating in tropical and subtropical regions.
NASA/CP 2000-210530 235

Thisexperiment documents the boundaries for what is achievable in two-station diversity in the sub-tropical
region. To complete the characterization of short distance diversity, a more extensive data set needs to be
collected and station separation needs also to be investigated.
VI. References
[1]
[21
131
[4]
I51
Atle Borsholm, "'Modeling and Experimental Validation of the Surface Attenuation Effects of Rain onComposite Antenna Structure at Ka-Band", May 1999, NMSU-ECE-99-004.
g. Crane. "'Wet Antenna Studies,"10 thACTS Propagation Studies
Workshop (APSW X)", Boca Raton, Florida. September 1997
R. Acosta, "Wet Antenna Effect on Ka-Band Low Margin Systems", 4 thKa Band Utilization
Conference, Nov. 2-4, 1998, Venice. ltaly
H. Helmken, J. Duvail and R. Henning, "ACTS Ka-Band Diversity Measurements in Florida", National
Radio Science Meeting, Boulder, Colorado, 4-8 January 1999.
C. Emrich. "'ACTS Ka-Band Propagation Research in Spatially Diversified Network
With Two USATs", Final Contract report. FSEC-CR-1090, May 25, 1999.
!
Figure 1. ANTENNA WETTING UNITS
Figure 2a. DEPOLARIZATION UNIT
NASA/CP---2000-210530 236

Figure2b. SYSTEM BLOCK DIAGRAM FOR THE MODIFIED ACTS PROPAGATION TERMINAL
Figure 3a. SYSTEM UNITS AT CHECKOUT
NASA/CP--2000-210530 237
ACTS PROPAGATION TERMINAL
/ ;t:t 5 G V "" _'!
e' S:_ R_ "s4"
_'z st-'."_ ............... i P_
[ i
......... ! .................. _ _ ........
.......... k .............
..................... T......... ::::::::::.L, .::.:
............ J .......
_e
Figure 3b. SYSTEM BLOCK DIAGRAM OF APT
Io
i
tm
F_
me
ool
ool
&
CDF Ammna Wetm_, Faom
\.
"\k
\
i idB
P_
,,f
o,.
Figure 4a. CDF FOR ANTENNA WETTING FACTOR
| |
!,j¢
Figure 4b. CDF FOR THE RAIN RATES
NASA/CP---2000-210530 238

:t
_ii_.°.......
!
Figure 5. CROSS-POLARIZATION SIGNAL, DRY VS. WET
o
Figure 6a. ATTENUATION CDFS FOR BOTH SITES AND FREQUENCIES
NASA/CP--2000-210530 239

7
_o.e
D iver_it_,rG aln C D F
_m -de
Figure 6b. CDF SITE DIVERSITY GAIN AT 20 GHZ AND 30 GHZ
NASA/CP---2000-210530 240

2.4- Special Effects: Antenna Wetting,Short Distance Diversity and
Depolarization
Dr. Roberto Acosta
NASA Glenn Research Center
Cleveland, Ohio
Sixth Ka-Band Utilization Conference/ACTS Conference 2000, May 31 - June 2, 2000, Cleveland, Ohio
Outline of Presentation
18
18
18
18
08
B8
Antenna Wetting Physics and Modeling
Antenna Wetting Experiment and Model validation
Propagation Data Correction Example
Depolarization Experiment and Results
Short Distance Diversity Experiment and Results
Conclusive Remarks
NASAJCP--2000-210530 85

Team Members
ITT Industries• Cynthia Grinder
• Lynn Ailes-Sengers
Westenhaver Wizard Works Inc.• David Westenhaver
Florida Atlantic and South Florida Universities• Henry Helmken
• Rudolph Henning
Florida Solar Energy Center• Carol Emrich
• Jerry Ventry
NASA Glenn Research Center• Bill Gauntner• Dave Kifer
• Walber Feliciano
FADE CHARACTERISTICS
Rain Induced (random)
Srec(t ) = Sclear(t ) X AT(t) + n(t)
Attenuation(t) = Ar(t ) + Aw(t ) + Ad(t ) + A,(t) + Ag(t) +Ac(t ) +Am(t )
Rain fade depthWet-antenna
DepolarizationRain
Ice
Tropospheric Scintillation effects
Gaseous absorption
Cloud attenuation
Melting layer attenuation
(Ar)
(Aw)
(A)
(A,)
(Ag)
(A°)(Am)
NASA/CP--2000-210530 86

Impact of Wet Antenna
Propagation model verification
and system designmml_Required the attenuation measurements to
be referenced to clear sky (no antenna wetting
or gaseous attenuation)
Ka band ground station reflector
designRequired minimum attenuation due towet surfaces (reflector and feed)
Wet Antenna Attenuation Physics
Reflector attenuatiorMechanism
Feed attenuation ,_L--
,m
mechanism
rFee, i
ii_ii_i!!iiiili!!ili!i!,i̧ ¸¸
5iiii_iiii?!!ii!ii!ii_ii_i_i_iil,i,
_i_i_iili_iiiiiiiii_ii_iiii_!i_
_i!!iiiil!iii_illi_,
i_,iliiii-i!i!i'iiii_,_"ii' ,_,_ _i_ii_i_'ii,__
JmL_
0G}
m
t._al
NASAJCP--2000-210530 87

Wet Antenna ModelSteo #2: Water Thickness for each dS i
3 rr i p
i dS:_,xX
Step #1: Segmented Reflector(1.2 m - 80 x 80 points)
1/3 rr _: rain rate normal vectorg_ : gravity normal vectorI_ : Viscosity of waterdl : Square lengthp : Density of Water"_ : Water Thickness
Step #3: Reflection Coefficient for each dS i
IZ y-ax_
Reflector
%
....i I/,,iLi,, ..........
' :i_i!jilli ii
? .....W_ _c ...... _ -a_
: 12
iiil
0-'--0 _=infinite
F
Wet AntenDa ModelStep #4: Feed Reflection Coefficient 1;
lrr nor = rr cos Ol
nj !
i
gtan = g sin O i
rrnormaJ
Jrfeed T_-__ AirMedium ]
Dielectr--icThicknmess_/,-_D
!Water Thickness _"_r_]
)
prrn dt/3tI:= LP g tan
NASA/CP--2000-210530 88

Wet Reflector Antenna ModelStep #5: Antenna Gain Calculation
-_s_= _ /_ .Fa.r-field
2 (_ ® Hincl"Feed) Y'Reflector//_O n Pattern
_"_ _/1 G(F---1) : GDry
Reflector _'-..\ _ /
____J_"_ Feed G(F=F) -- Gwe t
I Antenna Wetting Factor = GDr Y - Gwetl
Dry Antenna
NASA/CP--2000-210530 89

100
Experiment ResultsTipping BucketMeasurements
o_° 10- --I
_ | (10%, 90 mm/hr)E I
f i ....
0,1
lO
0 10 20 30 40 50 60 70 80 90 100 110 120
Rain Rata (mm/hr)
"8
G}
PO.
001
2 3 4 5 6
Attenuation AFW (dB)
Model Validation
Theory vs. ExperimentCDF Antenna Wetting Factor
100'
Theory
10
0 0.5 1 1.5
Attenuation2 2.5 3
ExpG riment
NASA/CP--2000-210530 90

Propagation Site Parameters
Ref,Feed Plate Tilt Plate
LOCATION Latitude Longitude Height Elevation Azimuth Angle Angle Ang.(Deg.) (Deg.) (Km) (Deg,) (Deg.) From From From
Hodz, Horiz. Horiz.
(Deg) (Deg.) (Deq,)
Fairbanks, AK 64.85 147.82 0.18 8.0 129.3 53.4 70.6 84.6
Vancouver, BC 49.25 123.22 0.01 29.3 150.5 74.7 71.1 76.9
Greeley, CO 40.33 104.61 1.90 43.1 i172.8 88.5 84.6 59.1
Tampa, FL 28.06 82.42 0.05 52.0 _>14.0 97.4 60.4 47.0
Reston,VA 38.95 77.33 0.08 39.2 213.3 84.6 64.4 64.3
Las Cruces, NM 32.54 106.61 1.46 51.5 1167.8 96.9 79.7 47.7
Norman, OK 35.21 97.44 0.42 49.1 184.4 94.5 86.4 50.9
Measured Rain Rates
0,1
o_
E,mI=- 0.01
0
e-
Ui._
a. 110 -_
1 to TM
t ipping Bucket
Measurements
,_'_.. - r 0_Florida l
"._.."_-'-_ -"--.. o.o,._ot,o_rl _,or,°,
10 20 30 40 50 60 70 80 90 100
Kr-_'O( Ataska
B.,_=co,..,=._Rain Rates (mm/hr)_ Fl_da
)OO( New Mexico
,.H-f. Oklahoma
NASA/CP--2000-210530 91

Example of Correctionfor Wet Antenna - CDFs
101 .........
-_.i85 GHzFlorida APT !,
Ep-
"6
0.
oa_ t ....
10 3 0 05 1 1.5 2 25 3 3.5 4
Attenuation AWF (dB)
Acosta' s
Crane's
Borsholm'
t
4.5 $
Reflector Design ProcedureStep #1 - Smooth Surface
i ,
o08!
EE
007
Elevation Angle-: 30 e
_70= '_60" 50° 20* !J
_ S'_
f .
io- i "_o_ ""_ .061 ram, 30mm_
006 S
p. , ; ,"
003
'IK Ka Band design uso.= u band off-the-shelf reflectors I
Rough Surface J
0 10 20 3o 40 5o
Rain Rate (mm/hr)
q.og i
0.08 1
E007
0 o 10
(0.029 ram, 30mm,_r)
20 30 40 50 60
Rain Rate (mm/hr)
NASA/CP--2000-210530
92

Reflector Design Procedure5 --
4 "5
45
: \
35
325
"o
c0 _TS
I_ 25
C 225¢11
<l: 2 10.2ram, 2.25 I1_s dB) I
1 25
Step #2- Minimize Dielectric Thickness
Ka Band design using _ s
Ku band off-the-self reflectors I ,Ts
i
Q75 _"
D 5 "
Q25 ;¢
( 005 Ol D15 02 02S 03 635 04 045 05
Thickness Water (ram)
45
425
4
375
35
_ 325
3
,_ 275
2,25
,_ 2
175
New Ka band design I
7_
r_
/:
?
f
f
¢:
I (0.2 mm,O,75dB) J f!f
1 5 '"
125
075 l
0 5 ,_:
025 _r _:_
0 0.05 01 015 0.2 0.25 0 3 0,35 04 045 05
Thickness Water (ram)
0
-s
A
"o
r-.o ,
cQ
<-H
16 t
Reflector Design Procedure
'%
Step #3 - Offset Reflector Geometry
Current Design
.......7 ElevationJ
...._ _1 io.2-.,., I
c,o) o] o_s o2 _2) O3 o)s o_ 0_.5 _'_
Thickness Water (ram)
0<90 0
New Design
......._ Elevation
t,. j
_._'_ >90°
NASA/CP--2000-210530 93

Depolarization Experiment
------'CVV 2
Co-poi = _ %o-po_+ de-pot
= V + V2Cross-pol a _r2e-pol C Co-pol
10O
Depolarization Experiment--It
Faded(dB)
Clear Sky (dB)
Clear Sky (dB)
2.5 dB
Attenuation (dB)
NAS A/CP_2000-210530
001!
94
_0 15 20
Attenuation (dB)
3O

Depolarization Experiment
_k.\l Crr°oSS;P°,l."
_ ,
Faded (dB) _"6
C,.rS+
0"0140 35 30 25 20 15 10
10C
i="6
0.01
20.195 GHz
Cross-Pol.
Horizontal Pol_
0 5 10 15 20 25
Attenuation (dB) Attenuation(dB)
Short Distance Diversity Experiment
Station during check out
W_E
S
Terminal
ACTS l_eam Scale: one inch = approx. 0.7 nd.
NASA/CP--2000-210530 95

Short Distance Diversity Experiment100 _
10
o_
£omp-
PG)
G.
01
_'0 _ .,,.
0'010 5 10
i
L
'C].
(4%, 10 dB) 20 GHzo (4%, 1_ dB) 27 GHz
O
1%._. ¢)
[
r4
!15 20 25
Diversity Gain (dB)
Conclusive Remarks
I_tn order to minimize the effect of wet reflectors, the dielectricthickness of the reflector needs to be reduced and the surface has to
be smooth in order to reduce the losses in the presence of a water
layer.
,The feed radome can be easily covered on the topside to protect
the phase center of the horn from being exposed to water. Offset
geometry optimize for each elevation angle.
For system design the effect of ice depolarization appearsto be small in occurrence.
I_A typical expected enhancement of greater than 5 dB ismore likely to be achievable in systems operating in
tropical and sub-tropical rain zones using short distance
diversity.
NASA/CP--2000-210530 96


![TAPAtion fSLer clinical practice guidanc:t of˜patients … · 2021. 5. 24. · 2005 Muratorietal.[28] ItalianandCaucasian 1and2 B8-DR3-DQ2 – 2006 Teufeletal.[29] German 1 B8-DR3-DQ2](https://static.fdocuments.net/doc/165x107/614633ac8f9ff81254201cd7/tapation-fsler-clinical-practice-guidanct-ofoepatients-2021-5-24-2005-muratorietal28.jpg)


