search.jsp?R=19680016281 2018-04-10T17:12:12+00:00Z · c goddard space flight center greenbelt,...
38
https://ntrs.nasa.gov/search.jsp?R=19680016281 2018-06-11T23:52:14+00:00Z
Transcript of search.jsp?R=19680016281 2018-04-10T17:12:12+00:00Z · c goddard space flight center greenbelt,...

https://ntrs.nasa.gov/search.jsp?R=19680016281 2018-06-11T23:52:14+00:00Z

c
GODDARD SPACE FLIGHT CENTER Greenbelt, Maryland
X-523-68 -152 PREPRINT
HYDROGEN STANDARD WORK AT
GODDARD SPACE FLIGHT CENTER
H. E. Peters T. E. McGunigal
E. H. Johnson NASA

E’ M .
HYDROGEN STANDARD WORK AT
GODDARD SPACE FLIGHT CENTER
H. E. Peters T. E. McGunigal E. H. Johnson
NASA
ABSTRACT
This paper reviews hydrogen standard work at GSFC during the past two years (January 1966 to April 1968). Research and development has been di- rected primarily toward the realization of field operable time and frequency standards based upon the atomic hydrogen maser. As a result, several im- provements have been made in the performance characteristics, while the de - sign simplicity, maintenance free life, and other features have been enhanced. Particular areas covered include experiments with thermal control, design of a large storage bulb - high line Q maser using an all metal cavity, more effi- cient state selection, improved RF dissociator design, and a new digital auto- matic cavity tuning system which requires only a good quartz crystal as the reference oscillator. A second hydrogen maser has been required for this pur- pose in the past. Prototype standards are under construction which embody the features described.
iii


INTRODUCTION
CONTENTS
.................................................. (A) LARGE BULB . METAL CAVITY DESIGN ..................... (B) THERMAL CONTROL ......................................... IC) AUTOMATIC CAVITY TUNING ................................
STATE SELECTION .......................................... (E) R . F . DISSOCIATOR .......................................... (F) PROTOTYPE HYDROGEN STANDARDS ......................... REFERE.CES ....................................................
ILLUSTRATIONS
Figure
1 NASA HydrogenMaser .................................... 2
3
4
5
6
8
9
10
Thermal Control Experiment ............................... Thermistor Drift ......................................... Thermistor Stability ...................................... Auto Tuner Elementary Diagram ........................... Averager Operation ....................................... Auto Tuner Block Diagram ................................. Probability Analysis ...................................... Auto Tuner Equations .....................................
V
Page
1
2
3
6
8
11
12
13
Page
15
16
17
18
19
20
21
22
23

ILLUSTRATIONS (Continued)
Figure
11
12
13
14
15
16
1 7
18
19
Page
Auto Tuner Time Constant.. ............................... 24
Auto Tuner Data. . ........................................ 25
State Selection Techniques ................................. 26
Angular Intensity Distribution. ............................. 27
Total Intensity Distribution ................................ 28
State Selection Calculated Results .......................... 29
30 Source Oscillator Schematic ............................... Prototype Standard System. ................................ 31
Prototype Standard Parts .................................. 32
Vi

HYDROGEN STANDARD WORK AT
GODDARD SPACE FLIGHT CENTER
INTRODUCTION
The capability of the hydrogen maser as an ultrastable oscillator, as an invaluable research tool , and as an incomparable frequency standard, has been shown by the published works of several researchers. Notable is the work of Professor Norman Ramsey, Dr. Daniel Kleppner, and others at Harvard Univer- sity, where the basic hydrogen maser concepts originated; Dr. Robert Vessot and co-workers, now with the Hewlett Packard Company; P. Kartaschoff and colleagues, at the LSRH in Neuchatel, Switzerland; and H. Andresen and others with the U.S. Army Electronics Command, Ft. Monmouth, N.J. (References 1-4). The widespread and accelerating interest in hydrogen masers is evidenced by their present use as laboratory instruments in over a dozen laboratories in the United States and abroad (Reference 5), and by active research in at least five United States Laboratories, and five foreign laboratories (Reference 6) , including the Soviet Union (Reference 7).
There are many applications which would benefit from the stability and re- producibility of the hydrogen maser. These include space tracking and naviga- tion (GSFC ' s primary interest) , radio astronomy (stellar interferometry) , geodesy and earth navigation, timekeeping, and use as laboratory comparison standards. While the applications and capabilities are evident , the cost size , and weight have been listed as principle disadvantages to its application (Refer- ence 8). Also, the need for special training to operate the maser has deterred some users. Thus a program was begun at GSFC with the goals of improving the maser, and of developing auxiliary systems so as to better adapt it to use by non-specialists .
The first year and a half of this program was devoted primarily to study and experiment with physical and electronic subsystems. As results accumu- lated an experimental apparatus was assembled into a first approximation of a complete standard, "NASA I". This has been operating continuously since Sep- tember 1967, providing stable signals for our own use and for transmission to other laboratories as well as providing much further experimental data. Present efforts are directed largely to design and construction of four prototypes , with completion and the beginning of tests anticipated during 1968.
The prototype maser design includes several refinements o r improvements which have resulted from the experimental work. Thus the large bulb - metal
1

cavity design has been made possible largely by the solution of problems in thermal control and cavity isolation, and by the realization of accurate and simple automatic cavity tuning techniques. Before discussing these topics and other subsystem research, some important features of this new design will be discussed.
(A) LARGE BULB - METAL CAVITY DESIGN
Figure 1 shows the basic elements of the maser design. The aluminum cavity has several desirable attributes. It is electrically opaque, has a repro- ducible high Q , is mechanically stable , readily available > and inexpensive. The good thermal conductivity assures uniformity of temperature, while the large thermal expansion, fifty times that of fused silica may be used advantageously to tune the cavity. This eliminates the need for problematic mechanical tuners, o r varactor diode tuning methods while providing an exceptionally linear tuning curve with a simple connection to the thermal control bridge circuit.
One of the most convenient features of a machinable cavity is the design flexibility it provides. Thus the use of a bulb much larger than the usual is based upon operation of the cavity very near waveguide cutoff diameter, where the frequency depends primarily upon diameter and loading, while the length may be increased as desired. Preliminary adjustment of resonant frequency is easily accomplished by turning the inside diameter to the required size.
Since the Q , as well as the frequency of the cavity, is largely independent of length for L ? 1,5D, the bulb volume may be increased as desired by making it longer. The filling factor, a very important oscillation parameter, is optimized for bulb diameter and cavity diameter related by d, = .52Dc, while the optimum bulb length is given by 1, = .83Lc. A 5.5 inch diameter by 17 inch long bulb, having a volume of 5.76 liters, is used in the experimental maser (which is ap- proximately the same as those to be used in the prototypes), and this has a filling factor of .5, which is exceptionally high. The measured cavity Q , unloaded but with bulb, is 49,000. In general this optimization permits a wide latitude in operating conditions while generally improving the important stability charac - teristics. Oscillation occurs over a large range of input flux values, on the order of 100 to 1, which permits a great flexibility in choosing flux values and power levels as required for automatic tuning. The power output capability is improved somewhat more than in proportion to the bulb volume. For example, if complete optimization for maximum power output is the goal, the large bulb would allow approximately 3.5 times the power output using a 6.5 inch diameter sphere, o r 2.53 times the power output of an optimum bulb (Reference 4) in a cavity with the length equal to the diameter. The use of the elongated 5.76 liter
2

bulb results in a mean distance between atomic collisions with the wall equivalent to that of a 6.75 inch diameter spherical bulb. The largest bulb practical in the elongated configuration, about 8.5 inches diameter by 18 inches long, is equiva- lent in this respect to a sphere 10.75 inches in diameter. This very large bulb would be of primary use with oscillating masers designed for the greatest ac- curacy, and in experiments to determine the wall shift. Bulbs differing in diame- ter as much as possible a re used for this purpose; the effect, as is well known, is inversely proportional to the effective spherical diameter, Since this design of maser will also oscillate readily with a long bulb 3 inches in diameter (effec- tive spherical diameter approximately 3.5 inches), the precision of the wall shift determination will be improved significantly. The total wall effect using a 10.75 inch diameter bulb is only 1-34 x It is clear that a great precision is not required in the determination to give the correction with errors well below one part in 1 0 l 2
Because of optimization of maser parameters, and because of the large bulb volume, it is expected that the line Q should improve in the elongated bulb design. The experimental maser was planned partly to test the extent of this improve- ment, A bulb collimator giving a calculated bulb time constant of four seconds was used with the 5.76 liter bulb. Measurement of the line Q at low flux by ob- servation of the slope of the output frequency versus cavity frequency curve gives a value of 4.91 x I O 9 , This is 2.5 times typical good values under similar conditions in other designs.
(B) THERMAL CONTROL
The requirement for high thermal stability is primarily related to the fact that the maser output frequency changes when the cavity frequency is changed,
QC
as given by the relation ( f m 2 - fm 1) = ( f c - f c 1) ~1 where Q, and Q1 are the
cavity and atomic resonance (line Q) quality factors. Thus thermal control is but one aspect of the more general problem of cavity isolation, It is not the drift or unstable performance of thermal sensors o r electronic servo systems, as will presently be shown, which is necessarily responsible for apparent cavity frequency instabilities a But rather, it is the more important threefold problem of electrical isolation, mechanical isolation, and thermodynamic system physical design. This point may be demonstrated by consideration of the results of an experiment in thermal control e
Figure 2 shows the schematic of an experiment performed to determine the stability characteristics of thermistor sensors 1) and of a typical maser servo
3

system using such a sensor. A massive copper block, placed within a three foot cube of foam insulation, was controlled in temperature by a servo system with a glass bead thermistor probe typical of that used in the most stable maser sys- tems (Reference 1). Several glass bead thermistor probes connected as shown, were embedded in the block, After initial balance adjustment, the apparent temperature deviation of each bead was determined by measuring the change in voltage across the bead with a high impedance, chopper stabilized, microvolt- meter. A quartz crystal thermometer probe (Reference 9) was used as a check on common long term drift.
Figure 3 shows the relative drift determined in this way over a period of 320 days. Figure 4 shows the results plotted in a more significant way for the purpose at hand. If thermal control systems characterized by these results were the determining factor in cavity instability, the effect is easily shown to be almost negligible. For a typical fused silica cavity of the usual design, with thermal compensation to one -third of the linear expansion coefficient, the ex- pected rate of change of cavity frequency with temperature is approximately 2 .x C. With a cavity Q of 40,000, and a line Q of 2 x l o 9 , the thermal pulling of the maser frequency would be 4 x 10-12'oC. It can be seen that use of the "worst case" probe would result in a yearly drift of only 3 x 10- l3 in fre- quency! Shorter term, o r diurnal effects, should be one thousand times smaller. This has not been the case in reality. Diurnal, or other periodic fluctuations about the average frequency do occur in masers with silica cavities, typically one to three parts in 1 0 1 3 , even with well stabilized ambient temperatures. We can thus with confidence, look for other contributing factors to cavity frequency instability. Five important mechanisms can be identified readily. (1) The in- herently thin or noncontinuous silvering required on dielectric cavities permits electromagnetic coupling of the cavity to the external environment. (2) Low thermal conductivity of the silica results in temperature differences between cavity parts of both a transient and steady state nature, and voids the function of the compensatory design usually used. (3) The temperature sensor is not placed close to the region to be stabilized, and does not represent the actual average temperature of the cavity. Note, however, that when a silica or other dielectric cavity is used, the situation could be improved greatly in regard to all of the first three items by enclosing the cavity in a subsidiary enclosure of high elec- trical and thermal conductivity within the vacuum envelope, and controlling the temperature of the enclosure. (4) Large mechanical tuners contribute mechani- cal, electrical, and thermal instabilities. The thermal effects may be due to both undesired heat conduction, and to relative expansion problems. (5) Coupling of the cavity to the external environment through the coaxial output connection.
The solutions to these problems incorporated in the present design are readily identified in Figure 1, These concepts were put to a critical test in the
4

experimental maser , where the automatic cavity tuning correction to the high expansion cavity continuously reflected the change in the cavity frequency. Initially, the correction corresponded to one part in 1 0 l 2 per week in maser frequency, while at this writing, six months later, the correction has become a few parts in 1 0 l 3 per week. This data is completely consistent with the long term drift of sensors shown in Figure 3. The probes to be used in the prototype masers have been specifically aged and thermally treated, and have tested and guaranteed stability corresponding to .025"C on a yearly basis. This drift per- formance results in a maximum expected yearly rate of 6.25 X to be corrected by the automatic tuner. The short term variations of the frequency, as can be seen from Figure 4, can be expected to be very small. This has actu- ally been the case. With the experimental maser the diurnal or other short term variations are not resolvable in reference to H-10 standards, while the daily RMS statistical variations of the cavity tuning corrections are on the order of one part in 10 3 .
A very interesting possibility, which can be tested only when the new proto- type masers are completed, now confronts us. If the systematic effects are as small as Figure 4 indicates they will be, it may now be possible to see the fundamental thermodynamically limited noise level of the maser oscillator. This is due to the thermal noise within the bandwidth of the cavity which per- turbs the oscillation. This has always been masked at the short term stability
limit by additive noise (f > 1 x
times) and at the longer term stability limit by systematic effects (best results A f f = 8 x lom1' for 3,000 secs measuring time2). The perturbing noise term
A f r-.., for one second o r shorter measuring
is given by (Reference 10) F)p = 2 2Pr.
With typical operating conditions for the new design, P = watts, Q1 =
4 x PO9, the perturbing noise term is calculated as g) = 3.7 x divided P
by where r is the measuring time. For r = 100 secs it is found 6) = P
3.7 x lo-'' which is comparable to the systematic instabilities expected from a thermistor sensor (Figure 4) without consideration of the stabilizing effect of the high thermal mass of the metal cavity.
While the short term variations in frequency may thus be very small with a metal cavity, the long term drift of the sensor would produce unacceptable long term drift in maser frequency, were it not possible to eliminate it by continuously
5
tuning the cavity. This does not unduly complicate the design however, and additionally, automatic cavity tuning is a very desirable adjunct to any maser.
(C) AUTOMATIC CAVITY TUNING
The automatic tuner developed during this period is unique in its ability to remove cavity pulling and spin exchange shifts using a much less stable cavity reference oscillator than has been required in the past. The results presented here also illustrate that these two corrections to maser frequency, traditionally considered limitations to performance, are no longer of great significance. An added benefit is that the cost of a complete system is now reduced greatly since now only one rather than two masers are required.
The most important concept involved in this development is that the pre- cision of measurement of a time invariant quantity grows as the square root of the number of observations. Basically the extremely good stability of the hy- drogen maser, over time periods long compared to the required averaging time 1)
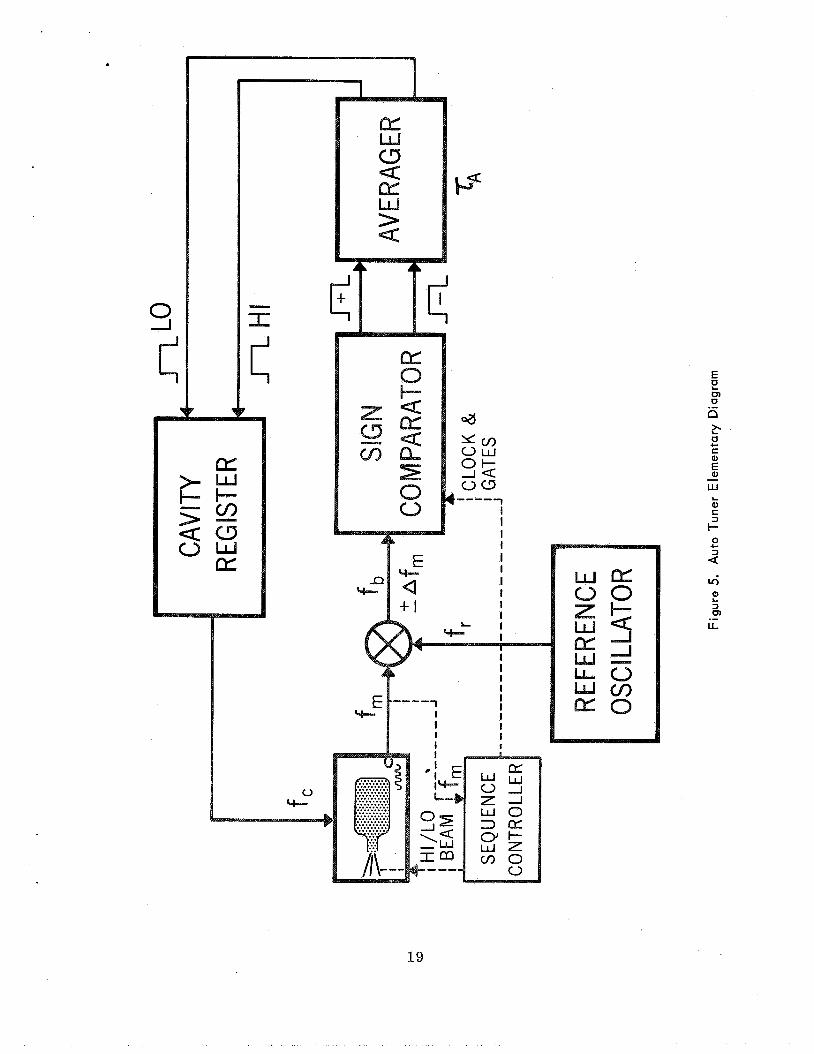
permits many observations of a periodic change of the maser frequency with reference to a much less stable oscillator, N th the precision of the average result being much greater than the precision of a single measurement. Figure 5 shows, in simplified form, how this is done.
When the maser is detuned, variations in beam intensity produced by a beam attenuator, produce corresponding variations in maser frequency, A fm. A com- parator circuit determines the relative sign. of the variation by means of meas- urement of successive frequency differences and produces an appropriate pulse at one output (+) or another (-). An averager circuit decides whether the mean of a number of these pulses is plus or minus, and produces another pulse (either "Hi" o r "LO") that then passes to a register circuit which algebraically sums the Hi and Lo pulses and produces an output cavity control voltage proportional to this sum. At this point, it can be seen that a random, unstable reference oscil- lator, o r one which is unstable a great deal of the time, produces, on the average, no change in cavity frequency. Furthermore, large random perturbations of the reference oscillator do not have a proportionally large effect on the operation since no magnitude information is retained at the comparator output. A further important characteristic of the averager circuit actually used, is that the num- ber of pulses averaged grows larger as the inputs become more and more random. Figure 6 shows how this is accomplished. The (+) o r (-) inputs a re added algebraically in a forward-reverse preset counter, which, when the count reaches a given number, No & Ns, produces an output pulse of the proper sign, and then resets itself to No for another cycle. For completely random inputs, it requires , on the average, N: pulses to reach a limit, while with the successive
6

input pulses all of one sign, the number required is N a . With a 20 second sign comparator period, and Na = 7 (typical values) nearly random data is averaged (on the average) for 16 minutes, while only 2.3 minutes elapses for *rgood" data.
The action of the register circuit is very similar to that of the averager. Pulses accumulate in a forward-reverse counter, with the stored number trans- lated by a digital to analogue converter network to a cavity control voltage. If random data is presented to the register a "random walk'' accumulation will occur also. The importance of this action in reducing the effect of statistical variations in the reference oscillator is illustrated by the following example. Let Nr be a register error accumulated due to random input data in time 'ST . The time required i s given by tr = N," N: rc . For unidirectional input signals to tune out such an accumulation requires a time t u = Na Nr 7 c . For one part in 10 l 2 offset N r is typically 100 and using N a = 7, rc = 20 seconds, it is found that zr = 4 months, while tu = 4 hours.
Except for a consideration of the magnitude of the small statistical varia- tions in tuned maser frequency due to the random fluctuations in input pulse signs, which will be Considered later, the transient response and the response to periodic cavity perturbations of the overall system may be calculated on a probabilistic consideration of the rate of accumulation of correct tuning pulses e
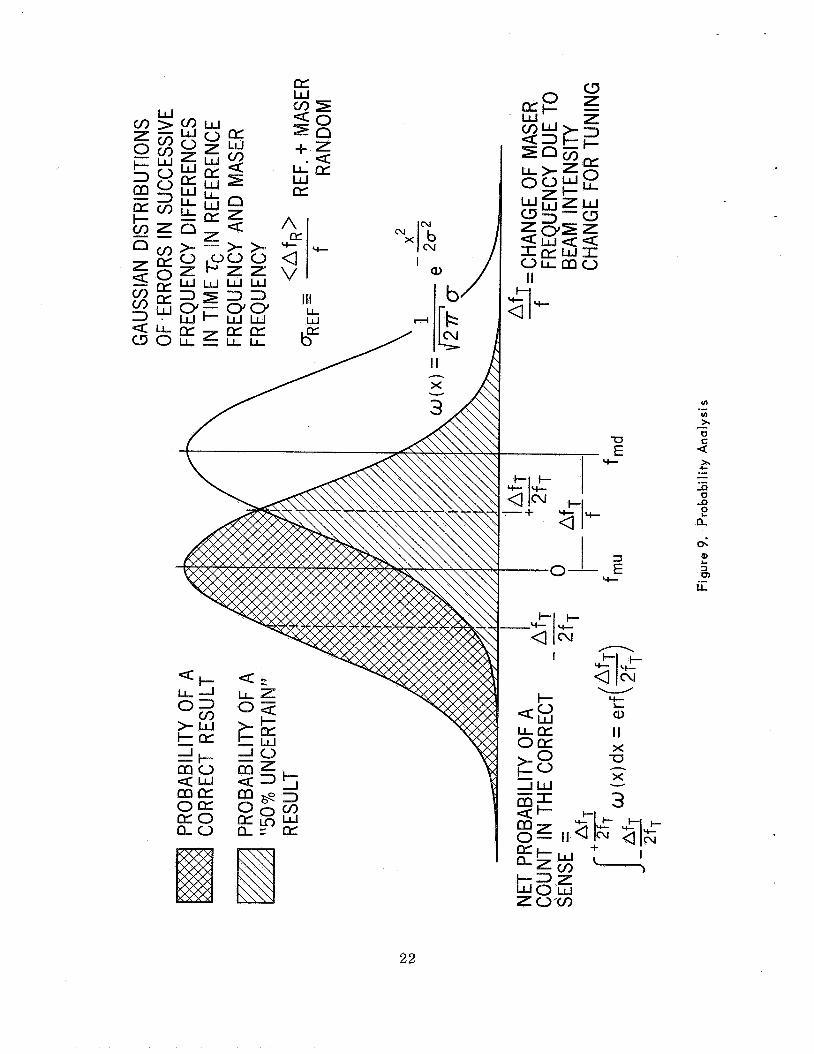
Figure 8 gives a block diagram of the overall system showing the operation in more detail. Note that a sign comparison is made at each change in beam in- tensity, producing two output pulses per cycle. No e r ror results from linear drift of the reference oscillator; a slight reduction in the total probability rate of correct pulses occurs, but more detailed calculations show this is insignificant for typical good quality reference oscillators. Figure 9 outlines the derivation of the probable rate of correct sense input pulses to the averager circuit. Figure 1 0 presents some relations resulting from further analysis which are useful in considering the influence of the various constants and parameters as they affect results. Used in these derivations are the facts that
2 x L i m ( x >> 5 ) e r f (x) = 1, and L i m (x < < 5) e r f (x) =
The auto tuner response is characterized, it is seen, by a rapid linear return
towards the tuned condition when the tuning modulation (y) 'v > 2 5 while when
the statistical variations in the reference oscillator are greater than the tuning
modulation, 5 ?
t
an exponential asymptotic approach to the tuned condition
7
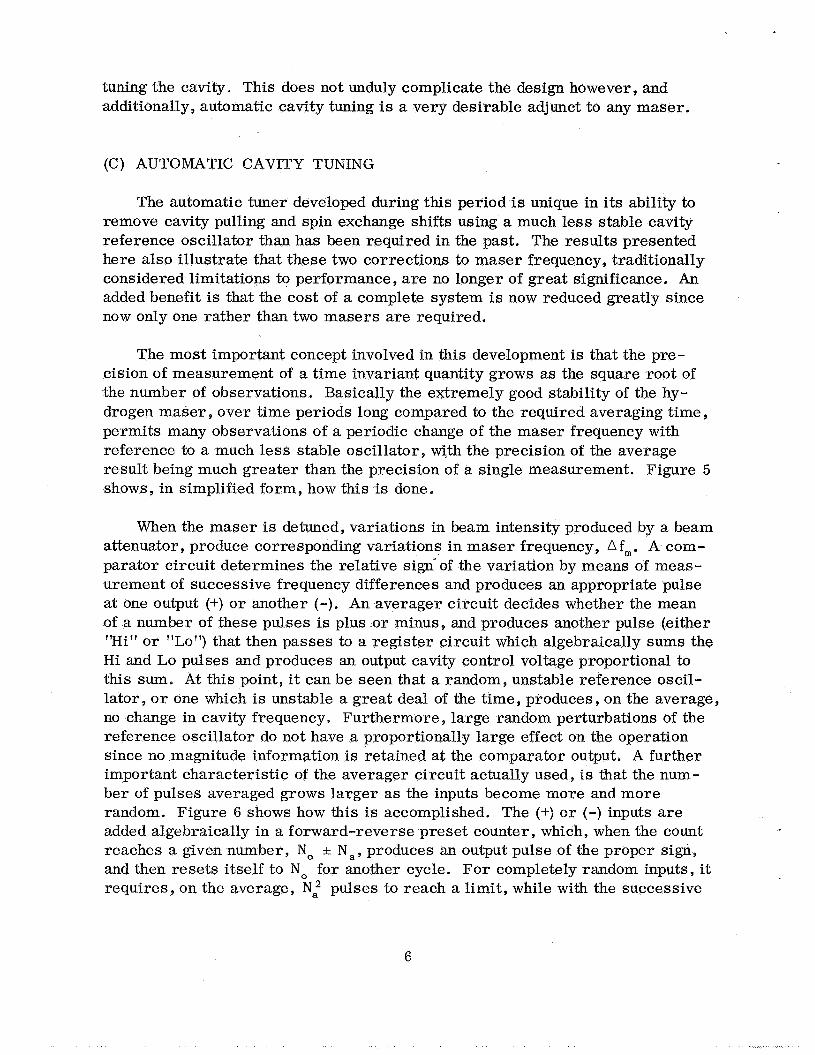
characterized by a time constant, T, results. Figure 11 shows the calculated time constants resulting from use of reference oscillators of different merit. The parameters used in this calculation are those for the prototype masers.
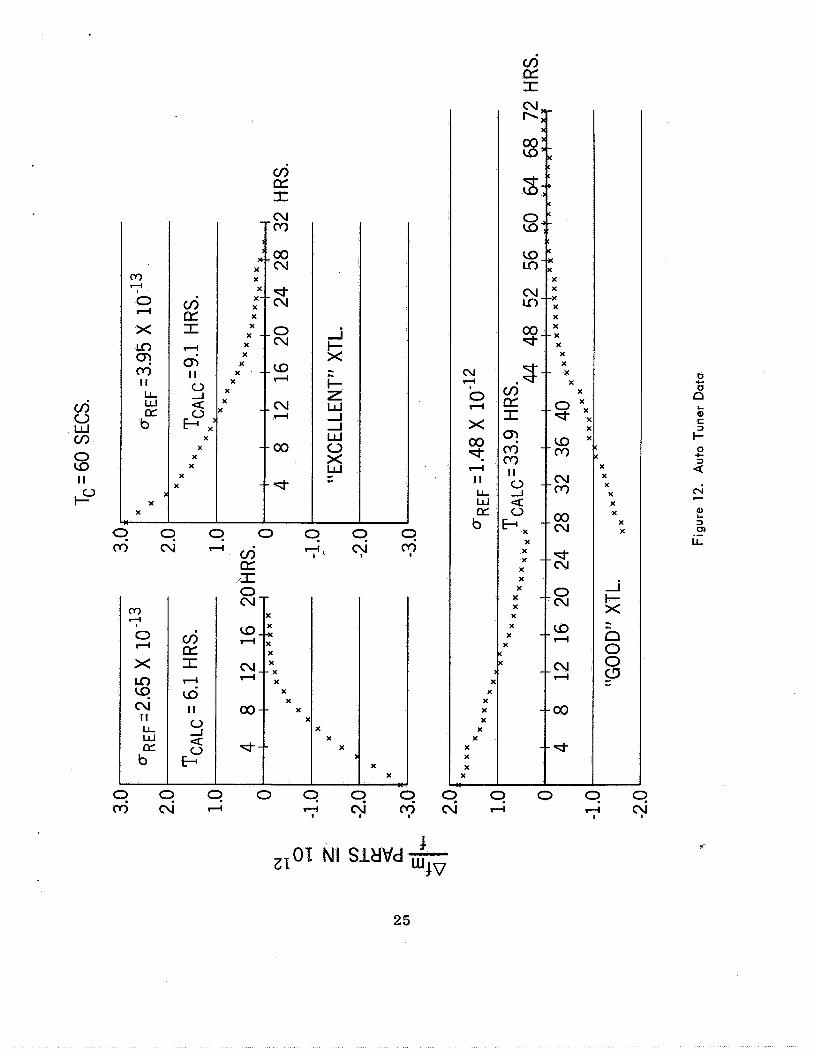
Results obtained using this tuner with the experimental maser and three different references are presented in Figure 12. The parameters of this maser are a bit different than those assumed in Figure 11, due to less than optimum adjustment of the maser operation conditions, and this required the longer counting time of 60 seconds. The time constant calculated for each case is seen to be in good agreement with the data. Note that the reference deviations given, oref , are measured values; in the case of the crystals, for two unselected high quality commercial crystal oscillators. The deviation given in the other case is for a signal obtained from a hydrogen maser which is located in another labora- tory several hundred feet away and the deviation is much larger than that of the maser signal itself due to noise picked up in the connecting cable.
Remaining to be considered is the theoretical noise level due to the tuner - the variations in maser frequency when tuned due to the probabilistic random excursions in pulse sequences at the input to the auto tuner as they are balanced by the tuning error corrections. There is no real lower limit to these variations, but practical limits a r e set by the requirements of sufficiently small tuning time constant to remove systematic variations of cavity frequency. A consideration of the random walk probable "departure rate" as it is countered by the probable tuning rate, leads to the following expression for the average random offset in maser frequency from the, tuned position
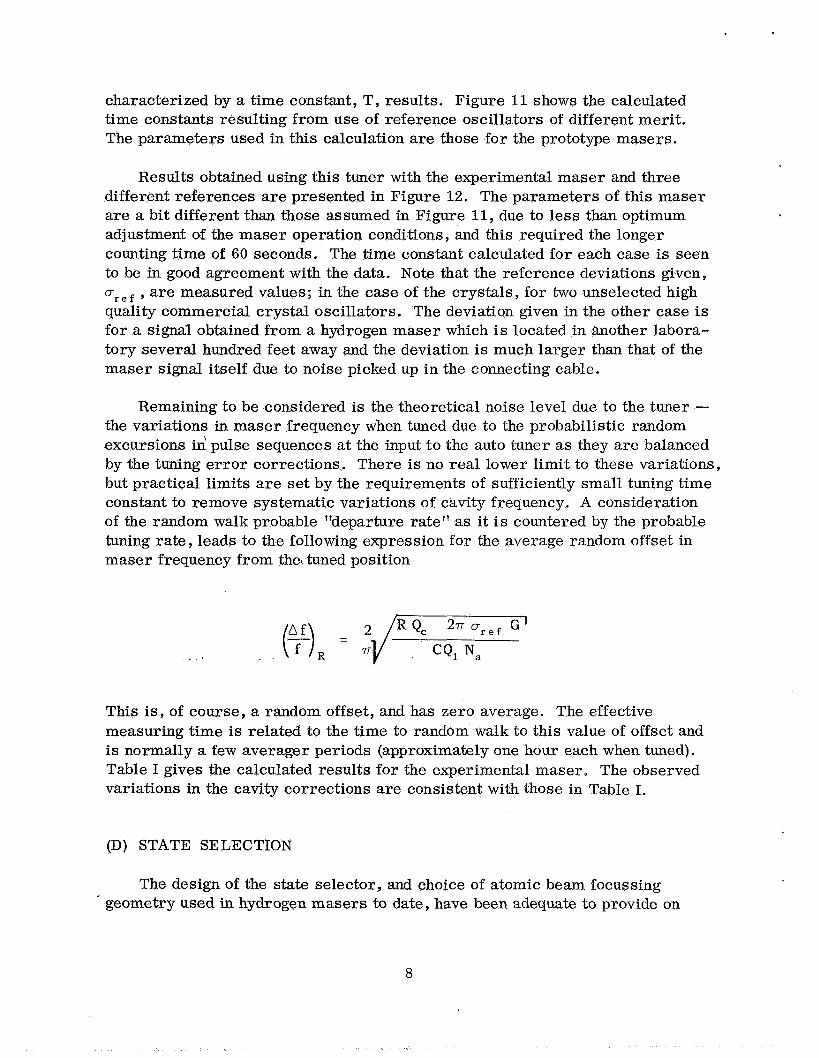
This is, of course, a random offset, and has zero average. The effective measuring time is related to the time to random walk to this value of offset and is normally a few averager periods (approximately one hour each when tuned). Table I gives the calculated results for the experimental maser. The observed variations in the cavity corrections are consistent with those in Table I.
(D) STATE SELECTION
The design of the state selector, and choice of atomic beam focussing ' geometry used in hydrogen masers to date, have been adequate to provide on
8
Table I
4 x (Excellent Crystal)
1 x (Average Low Power Maser)
Probable Average Random Offset in Frequency
4.8 x 10⁻¹⁴
2.4 x 10⁻¹⁴
I I I I 1.5 x (Good Crystal) 9.4 x 10⁻¹⁴
the order of two years operating life between pump element changes, using a typical 250 l/sec Ion Pump (GSFC Varian H-10 masers). Further experience and new design approaches now give confidence that even these excellent results may be improved greatly, and we may now design for higher beam flux and power output , and for continuous operation far above threshold conditions while maintaining pump pressures well below those required in the Fast. The experi- mental maser 'NASA I" is presently operating continuously at a flux level ap- proximately twenty times threshold, with total hydrogen flow less than one fifth that typical of the GSFC H-10 masers. While small modifications, which are now known to be possible, such as decreasing the state selector to bulb entrance distance , would provide very significant improvements by themselves , a recon- sideration of the overall philosophy of the techniques involved has resulted in an approach which is inherently much more efficient. Figure 13 shows in the upper section the traditional approach, while the lower section illustrates the new tech- nique. In the past, it has been considered best to focus atoms representative of the most probable of the velocity distribution into the bulb without multiple crossings of the axis within the magnet. In the new approach a long, small bore, high flux multipole magnet is used to "capture" the maximum possible flux of upper state atoms emanating from the source, and to remove entirely from the beam the lower state atoms. A hexapole magnet is being used at the present, since these are on hand, but a quadrupole would work as well, and probably be less expensive. The beam stop shown in the short focusser is found to be in- dispensable with the large bulb entrance diameter and short magnet to bulb distance presently used. The large solid angle subtended by the bulb entrance resulting from this same geometry assures that a large fraction of the atoms captured in the long magnet actually enters the bulb. New calculations have been made, (the results of which are presented below), which take into account the angular distributions of atoms from a collimated source, rather than making the usual assumption of a cosine law distribution from a zero length orifice.
9

Figure 14 shows the angular distribution of atoms from a tubular collimator for various ratios of length to radius (l/a). These distributions have been newly calculated for our present purposes, but agree exactly with previously published data (References 12, 13) which is available for l/a 2 10. While the distribution given in Figure 13 is very useful for visualization of the effects of a collimator , a more useful distribution calculated from the above, is given ip Figure 15. This gives the total relative number of atoms emerging from the source at the angle 6’ in the increment M. Values of the ordinate , weighted by the velocity distribution, may be used directly in further trajectory calculations, These curves assume that the velocity distribution is independent of the angle. We can see, from this figure, the relative total number of atoms available for focussing at the angle 8. Using the data from Figure 15 for (l/a) = 100, which applies for the source collimator to be used in the prototype masers, the relative num- ber of atoms captured in the magnet, and the relative number which enter the bulb have been calculated. The results a re shown in Figure 16. The integral of the curve A gives the total relative number of atoms captured in the bulb with the design parameters to be used initially in the prototype masers. This bulb has a calculated 2 second bulb time constant , and is judged to be about optimum for intermediate and long term stability. For maximurn power output, and short term stability, a bulb will be used in future tests which has a time constant of .1 second, for which the curve A (e), has been calculated. The dotted line shows the calculated distribution using a typical optimum short mag- net with bulb distance and entrance diameter as used with A ment to be expected with the long configuration is very evident. These calcula- tions all assume a uniform 315°K modified maxwellian velocity distribution. Actually, on consideration of the physical processes in the source discharge at the pressures, etc., used, this assumption may not be entirely valid. It is pos- sible that much higher temperatures (energies) and non-maxwellian distributions may be typical of atoms emerging from the bulk of the discharge, and these ac- count for a large percentage of the total. The atoms leaving the collimator tube walls, however, are likely to be characteristic of the conditions usually assumed. Figure 16 is very useful in estimating the effects of this. For higher than as- sumed velocities, the intensity captured by the magnet at larger angles will de- crease - the distribution will be pushed to the left in the figure. The maximum possible fluxes are still obtained with the long magnet, while the effects on the short magnet trajectories are very bad. The beam stop, more than ever now, is needed to intercept lower state atoms, but a greater percentage of the upper state atoms are also stopped.
The improve-
The above conclusions a re born out by experiments. For state selector evaluations the experimental maser source was modified so as to provide a very limited supply of atoms by using a single hole collimator .01 inch diameter by .1 inch long in place of the usual efficient multitude collimator. State selector
10

magnets of different lengths, bore diameters, and field strengths were tested, with and without a stopping disk. Variable beam attenuators were used in esti- mation of the resultant relative flux intensity into the bulb., With a magnet which approximated the optimum conditions on the basis of traditional short magnet considerations (Magnet A), the maser barely oscillated without beam attenuation. This magnet was 3.75 inches long with a bore diameter of .14 inch, and had a maximum field strength of approximately 7 kilogauss. U s e of a similar magnet with a smaller bore diameter (.08 inch) and a maximum field of approximately 9 kilogauss, resulted in an improvement by approximately a factor of 2. When magnet A was used with a stopping disk which shaded the bulb entrance from the source aperture oscillation was obtained without beam attenuation, at approxi- mately four times threshold beam intensity. These results indicate that the velocity distribution tends toward higher velocities than those usually assumed, and that it may be broader than the modified maxwell distribution.
The long magnet configuration was approximated by using two 3.75 inch long magnets in series. The first had a bore diameter o€ .06 inch, the second a diame- ter of .08 inch. The maximum field strengths were estimated to be approximately 10 kilogauss. A beam shutter at the magnet exit was used which had a .032 inch diameter hole oriented on the beam axis when at the low beam position. This provided an attenuation of the beam of approximately 7/1. The maser now oscil- lated strongly over all practical source pressure ranges in the low beam condi- tion. The oscillation level in the high beam position was estimated as between 20 and 30 times threshold.
In the prototype masers the state selector will be four inches long, have a bore diameter of .05 inch, and have a maximum magnetic field strength of ap- proximately 12 kilogauss. With the efficient source collimator to be used and at normal operating beam strengths, the net flux of atoms from the source is esti- mated to be less than 1/20 that considered normal in the past. A conservative calculation indicates that pump element replacement due to hydrogen accumula- tion is not likely to be required for ten o r twenty years of operating time.
(E) R. F. DISSOCIATOR
Consideration of available data indicates that the RF dissociator is basically reliable and long lived, requires far less power, and is subject to fewer prob- lems of control than other possible sources, such as thermal dissociators. RF discharge type sources have now been operating continuously for years in several masers. From experience with design variations that work well , and with some that have not worked so well , sources may now be designed with high confidence in their consistently trouble-free performance e However, the conditions of
11

operation of the most successful hydrogen maser sources are peculiar. Pub- lished data and texts on gas discharges provide some broad guidance, but a detailed understanding of the interaction of hydrogen atoms with the walls, and with molecules, ions, and other atoms, is lacking at the pressures, powers, fre- quencies, flow rates, and with the materials and geometries used. While the physics and chemistry of sources is somewhat obscure, the latest designs per- form very well. Thus, the primary reason why the source is still one area of research of great interest and importance is that the actual dissociation effi- ciencies the energies and the angular and velocity distributions of atoms from such sources are unknown. This information would permit more realistic calcu- lations of atomic trajectories to be made and provide data for a more realistic consideration of various alternative state selection techniques.
The source design configuration to be used on the prototype masers is illustrated in Figure 17 , along with a simple solid state RF power circuit which excites it. This has worked well in the experimental maser. It is the logical outgrowth of consideration of tests at different frequencies, sizes, etc. of sources used in several masers, both at GSFC and elsewhere. The pyrex bulb has a diameter of two inches and is two and a half inches long. The entrance tube is a one inch long 1/2 millimeter diameter capillary, which reduces loss of atoms at the entrance due to external recombination. A multitube collimator (not shown) with 97 tubes each, 50 micrometers diameter by .1 inch long, will be placed over the exit. The source operates at 120 MHz and uses electric field excitation with electrodes of relatively small contact area. Such a source has been tested at various frequencies and pow& levels, and the one on the experimental maser has operated well continuously for the past eight months. About two watts mini- mum power is required, while 4 or 5 watts appears to be desirable to assure that the discharge starts spontaneously.
The RF circuit shown is a simple Colpitts oscillator. The most important feature, which accounts for its efficient, self-starting, trouble free operation, is that the frequency is primarily determined by a single LC tuned circuit, of which the variable impedance of the discharge bulb forms a part. Thus, there are none of the usual problems with coupling to coaxial lines or fixed frequency circuits. In addition, localization of the entire circuit within an aluminum enclosure housing the source effectively eliminates problems with RFI. The circuit as used on the experimental maser operates with a 20 volt supply voltage and a total current of .4 to .65 ampere. The RF power is approximately 5 watts.
(F) PROTOTYPE HYDROGEN STANDARDS
For general use a standard frequency outputs provide time
of time and frequency must have several integral signals, have a clock and contain all the operating
12

electronics such as a synthesizer for changing time scales as well as facility for emergency battery operation, etc. It should be as self-contained as possible and require a minimum of attention from the users. Figure 18 shows an artist's conception of one of the four prototype standards now under construction and gives a block diagram of the system. The standard is contained within a frame- work of standard rack width, six feet high, and 27 inches deep. The maser assembly itself is 46 inches high by 18 inches diameter and occupies the upper rear section, while modularized electronics and controls are located in the front upright section in accessible subassemblies which fold out. Power supplies and batteries are located in a lower compartment which also has space for mounting auxiliary equipment in standard rack widths and depths. Figure 19, is a photo- graph showing many of the parts as they now exist prior to final assembly.
ACKNOWLEDGE ME NTS
The authors wish to acknowledge the valuable contribution of M r . Gordon Wood in performance of the thermal control experiment, and of Mr. James Akers for his enthusiastic contributions in many areas.
REFERENCES
1.
2.
3.
4.
5.
D. Kleppner et al. - "Hydrogen Maser Principles and Techniques". Phys. Rev., Vol. 138, No. 4A, pp A972-A983, May 1965.
R. Vessot et al. - "An Intercomparison of Hydrogen and Cesium Frequency Standards". IEEE Trans. I. & M., Vol. 1M-15, No. 4, pp 165-176, December 1966.
Ch. Menoud, J. Racine and P. Kartaschoff - "Atomic Hydrogen Maser Work at LSRH Neuchatel, Switzerland", Proceedings of the 21st Annual Frequency Control Symposium , Atlantic City , 1967.
R. Vessot et al. - 'The Design of an Atomic Hydrogen Maser System for Satellite Experiments ", Proceedings of the 2 1st Annual Frequency Control Symposium, Atlantic City, 1967.
NRL, NASA (GSFC), NBS (Boulder, Colorado), Harvard University, MIT (Haystack Site) , JPL, Hewlett-Packard Co. (Beverly, Massachusetts) , USAEC (Ft. Monmouth), NASA (MSC), PTB (Braunschweig, Germany) , NRC (Canada) , RRL (Tokyo, Japan), LSRH (Neuchatel , Switzerland).
13
6.
7.
8.
9.
10.
11.
12.
13.
Harvard University, Hewlett-Packard Co. (Beverly, Massachusetts) , USAEC (Ft. Monmouth) , NBS (Boulder , Colorado) , NASA (GSF C) , NRC (Canada) , LSRH (Switzerland, RRL (Tokyo), PTB (Braunschweig, Germany), JPL, LHA (France) . A. I. Nikitin and G. M. Strakhouskii - "Quantum Generator Using a Beam of Hydrogen Atoms with a Superinvar Resonator". Pribory i Teckhnika gksperimenta, No. 1, pp 129-131, January-February 1967.
A. I. Livshitz - "Focusing a Thermal Beam of Hydrogen Atoms and Parame- ter Optimization in the Hydrogen Maser". Zhurnal Tekhnicheskoi Fisiki, V O ~ . 37, NO. 7, pp 1304-1313, July 1, 1967.
A. 0. McCoubrey - "A Survey of Atomic Frequency Standards", Proc. IEEE, Vol. 54, No. 2, pp 116-135, February 1966.
H. P. Model 2801A Quartz Thermometer.
L. S. Cutter and C. L. Searle - "Some Aspects of the Theory and Measure- ment of Frequency Fluctuations in Frequency Standards ". Proceedings of the IEEE Vol. 54, No. 2, pp 136-154, February 1966.
R. Vessot et al. - "The Specification of Oscillator Characteristics from Measurements Made in the Frequency Domain". Proceedings JEEE , Vol. 54, No. 2 , pp 199-207, February 1966.
Dayton, B. B. - "Gas Flow Patterns at Entrance and Exit of Cylindrical Tubes". Com. on Vacuum Techniques, 1956 Vacuum Symposium Trans. pp 5-11.
Harlan Cook and Edward A. Richley - "Measurements of Efflux Patterns and Flow Rates from Cylindrical Tubes in Free-Molecule and Slip Flows". NASA Tech. Note TND-2480, Washington, D. C., 1964.
14

0 Y- o
.I =- I-a O Z
15
cn 0 I-
0 0 --I
CT w I- w I
- a
a
3
W CT 3 c
Y - 0 O n 1 w LL
I I I
-
L al vi
s C al CJ)
2 -0 x I

n n. n m z
W
W
W
CT w z n o
\
0 cv
n: z W I-
1 0 CT I- ZL 0 0
0 > CT W v,
> 0 7-l
I I-
. I
t C a -E .- L 0 Q X w
16

\
0 cv M
0 00 cv
0 d- cv
0 0 cv
0 a ?-I
0 cv ?-I
0 00
0 4-
0 0 0 0 0 0 0 0 0 0" 0 0 0 a * c v c v d - a 0 0 d I I I I
3 s33t133allllw 1'V
17

m t - - 0 ril
18
0 1
c I E
+ I
19
W L Q) C
rl
d 0 c
ui

i t. I--
a: t. I--
Z - m
a Z
I I Z -
Z -
Z a 0
1 I I I I I
0 .-.I
20

I ‘1 1
z z- z E
cc E v cc
v
E
rr, 0 .- n
rn
Y u 0 - L 0 C
t2 d 0 t
od L 3 CI,
LL .-
t
21
A - + - a V
E
111 II
SI-
3 I+- -+
-”&- a I
I- QY
n
$15 W
+- I a
LLE OCr
n
-- m < m 0 Cr a.
L I- Z -
L Z
I- z x 0 0
II x U x h
v
3 t ++ a IN
I
22

C= *NR = CAVITY CALIBRATION
= “LINEAR T N l N G RATE” VZ7u REF
T -13
PRACTICAL RATES: 10 /Hr < k m < 101l/Hr
IN THE PRESENCE OF NOISE
SOLUTl ON: +
Figure 10. Auto Tuner Equations
23

W 0 Z W LT LLl L W LT 1
t- u, t- LT 0
0 0
a
n
111
N
I l-l
m l-l
I 0
X -3-
T-4
24
LT W u, a
m
X
u, LT I
-0,
- c,j
-cn
0
c C 0 c VI C s al
-E F L al C z d 0 t
cr) -? 0
x L n oz cr)
1 1
l-l
L L w
b"
X X
LL
# 07: NI SltlVd- 21 9 7
25
z 0 4
x 00 ? l-l II LL w
tF
I X
X X X
X X
X X
X X
X x
< < < K K K X X X X X
X X
K X X X X X
X X
i I- X
b 0 0 53 -
..
0 c <

Figure 13. State Selection Techniques
26
k m

0
"\
27
.i 0
co

0 n
28

.7
.6
z m 5 .5
g .4
LL 0
v, 7 W I- 7
03 Q
.3 - L
.2
.1
Am@) CAPTURED BY MAGNET 77-
-M’
0 1 2 3 4 5 6 7 8 9 0
e - ANGLE INTO MAGNET - DEGREES
Figure 16. State Selection Calculated Results
29

RFC
- 10
- -
SOURCE
.............. .............. ..............
* I
BULB
+
F C IT
Figure 17. Source Oscillator Schematic
30

31

32