BESIII DAQ System BESIII Review Meeting IHEP · Beijing · China Sep. 16 - 17, 2002
Upload
marjory-fergusonCategory
view
216download
0
R Scan and QCD Study at BESIII
Haiming Hu
R Group, IHEPJanuary 13-15, 2004, Beijing

Outline
MotivationR scanQCD related topicsSummary

Motivation (R value)
R value is an important parameter in the test of the Standard Model .
In 1998 -1999, two R scans were done in
2-5GeV with about error 7% at BES2. In order to decrease the uncertainty of the
calculations of the Standard Model parameters, more precision R measurement at BES3 are appealed.

Motivation (QCD topics)QCD is the unique candidate theory of strong interacti
on. QCD can describe the evolutions of the quark and gluo
n with large momentum transferring.QCD can not give complete calculations from the pri
mary qurks and gluons to hadrons. The knowledge of hadronization at low energy are rather poor or even blank.The pQCD needs more experiments to test and to deve
lop.

The low energy accelerators in the world
DANE
(Italy)
VEPP2000
(Russian)
BEPC3
(China)
CLEO-c
(US)
Ecm (GeV)
0.5 – 1.4 0.5 –2.0 2 –4 3.1 – 12
Luminosity(1030cm-2s-1)
50 (500) 100 [email protected]
500

R value measurement

R values between 2-5 GeV at BES2(1998 and 1999)
Broad resonant structure

R value status at some energy pointsPhys.Rev.Lett.88,(2002)101802-1
Ecm
(GeV)
Nhad N+N
L(nb-1) had 1+obs R
2.0 1155.4 19.5 47.3 49.50 1.024 2.18
3.0 2055.4 24.3 135.9 67.55 1.038 2.21
4.0 768.7 58.0 48.9 80.34 1.055 3.16
4.8 1215.3 93.6 84.4 86.79 1.113 3.66
Ecm
(GeV)
Nhad
error (%)
trig
error (%)
Lerror (%)
had
error (%)
1+obs
error (%)
Total
%
2.0 7.07 0.5 2.81 2.62 1.06 8.13
3.0 3.30 0.5 2.30 2.66 1.32 5.02
4.0 2.64 0.5 2.43 2.25 1.82 4.64
4.8 3.58 0.5 1.74 3.05 1.02 5.14

QED running coupling constant
Before BES experiments, the ratio of R error contribution to s) in 2-5 GeV account for about 53%.
After BES measurement of R, the ratio of error contribution reduce to about 30% in 2-5GeV.
decrease

Error estimation of the R measurement in 2004(estimated according to R scan in 1999)blue figures : R99 pink figures : R04
Ecm
(GeV)
Nhad events
selct
(%)
Lum.
(%)
1+δ
(%)
εhad
(%)
error
stat
(%)
error
sys
(%)
error
total
(%)
2.2 1,444
2,000
5.54
4.0
2.48
2.2
1.29
1.0
3.49
2.5
2.88
2.2
7.04
5.0
7.61
5.5
2.6 1,734
20,000
4.43
2.0
2.77
1.5
1.26
1.0
3.83
2.0
2.71
0.8
6.50
3.3
7.04
3.5
3.0 2,055
20,000
3.30
2.0
1.70
1.5
1.32
1.0
2.66
2.0
2.49
0.8
5.02
3.3
5.61
3.5
Hadronic efficiency εhad will be determined by using new developed
detector simulation Monte Carlo (BIMBES) based on GEANT3
In 2004, R value at 2.2 Gev, 2.6GeV, 3.0 GeV will be measured
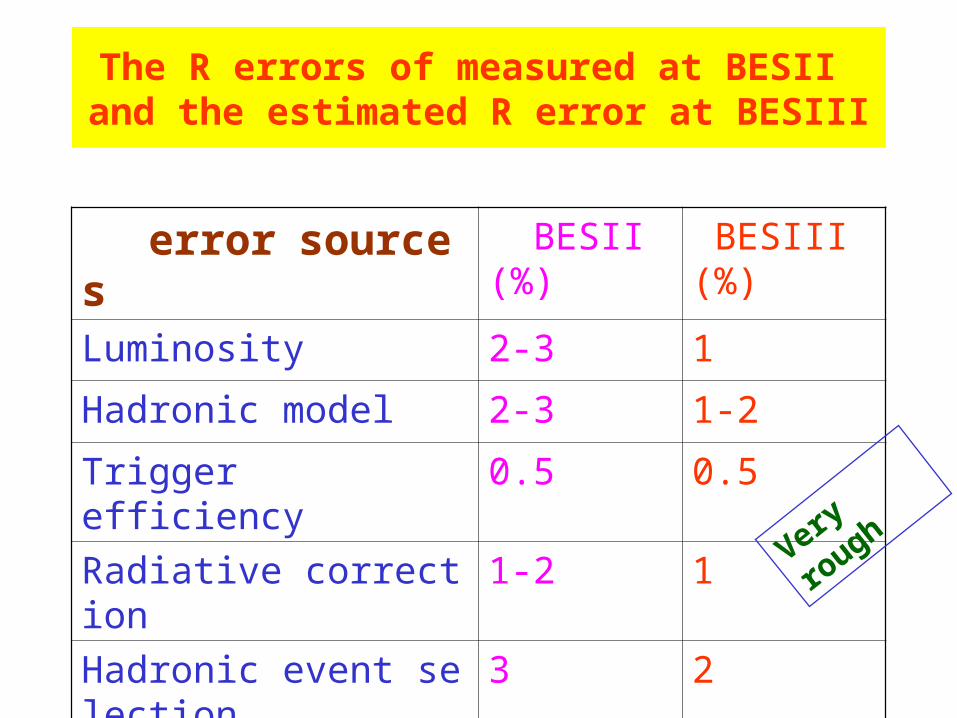
The R errors of measured at BESII and the estimated R error at BESIII
error sources BESII (%) BESIII (%)
Luminosity 2-3 1
Hadronic model 2-3 1-2
Trigger efficiency 0.5 0.5
Radiative correction 1-2 1
Hadronic event selection 3 2
Total systematic error 7 2.5– 4
Very ro
ugh

The change of the uncertainty of QED s with the decrease of R error in 2-5 GeV
R error in 2-5 GeV
5.9 % 0.02761±0.00036
3.0 % 0.02761±0.00030
2.0 % 0.02761±0.00029
(If R error in other energy region fixed)
The aim of the precision of R measurement at BES3 (2-4%) is reasonable and hopeful

Some methods used in R measurement at BESII
(Some of them may be used at BES3)

LuminosityTwo independent ways were used to select wide-a
ngle Bhabha events, one sample to calculate the luminosity, another to estimate the efficiency.
The main luminosity error was the statistical error of the two samples. Large event sample will help for reducing the luminosity error.
Use Bhabha, two-photon and events to analysis luminosity and to find systematic errors.

Integrated luminosity cross check
Ecm
(GeV)
Lee (nb-1) Lμμ (nb-1) Lγγ (nb-1)
2.6 292.9±6.5 268.2±18.9 266.7±12.0
3.2 109.3±3.4 108.9± 8.6 106.0± 5.9
3.4 135.3±4.0 125.1± 9.8 130.7± 7.1
3.55 200.2±5.2 192.1±14.5 191.1± 9.7

BackgroundsUse M.C to estimate the residual QED backgrounds
Nll= ll ·L · ll , (l=e,,) N= · L ·
Use vertex-fitting to estimate
beam-associated backgrounds.
The better track resolution of
BES3 is benefit for reducing
beam associated backgrounds Gaussian+2 order polynomial fitting

Initial state radiative corrections Some schemes are studied
(1) G.Bonneau, F.Martin Nucl.Phys.B27,(1971)381 (2) F.A.Berends, R.Kleiss Nucl.Phys. B178, (1981)141 (3) E.A.Kureav, S.V.Fadin Sov.J.Nucl.Phys.41,(1985)3 (4) A.Osterheld et.al.
No.SLAC-PUB-4160(1986) (used)
In BES3 experiments more precision schemes are needed
Fenyman figures for ISR (to α3 order)

Formula used for ISR calculation
The difference of (1+) between scheme (3)
and (4), which is 1% in non-resonant region The radiative correction factor
calculated by scheme (4)

Hadronization Picture

Lund area law

Lund area law

Lund area law
Phase space
Partition function
Define n-particle multiplicity distribution
N and p are two free parameters tuned by data
Pn is used for controlling fragmentation hadron number in MC

BES raw data spectrum compared with LUARLW + detector simulation at 2.2 GeV

BES raw data spectrum compared with LUARLW + detector simulation at 2.5 GeV

BES raw data spectrum compared with LUARLW + detector simulation at 3.0 GeV

Check RQCD prediction
Central value of Rexp and RQCD agree well.
Is it true or due to error?
RQCD has 1σdeviation from both BES and measurements.
Is this the experimental error or new physics?

Determination of the running s
R value is predicted by pQCD
Where,
Solving the equation
One may obtain s
QCDRR
exp

Determination of the running s
Charged particle differential cross section
In QCD
Measure the differential cross section, one may get s
q : momentum
ηch : neutral particle correction

QCD Related topics

① Inclusive distribution e+ e- → h + X (h : π, K etc) The inclusive spectrums are governed by hadronization dynamics. In general, the single particle distributions are the function of (s, p// ,p ) .
The two questions are needed to answer: (i) how do the inclusive distributions change with (p// ,p) when s fixed? depends on the type of the initial state and the final state. (ii) how do the distributions change with the center of mass energy s? Feynman scaling assume the distributions are the function of the scaling variable x and p at large energies. Scaling assumption is a good approximate behave at high energy, but it has not been tested precisely at low energy.
The αs may be determined by the scaling deviation.

② Spectrum (to be published in PRD)
Variable :
Parameters :
BES data are reasonably well described by MLLA/LPHD.
MLLA : Modified leading log approximation
LPHD : Local parton and hadronic duality
Veriation of KLPHD as the function of Ecm
eff from different experiments
BES2
BES2

③ Form Factors Exclusive cross section is expressed as the product
of the phase space factor and form factor. The measurement of the form factor may check th
e phenomenological model, which is also the effective method to find short life-time particle.
The following channels may be measured with large sample obtained at BES3
e+ e- π+π- π+π-, π+π- π+π- π0 ,
π+π- π0π0 , π+π-, π+π-K+K-,
π+π-, K+K-, ppbar
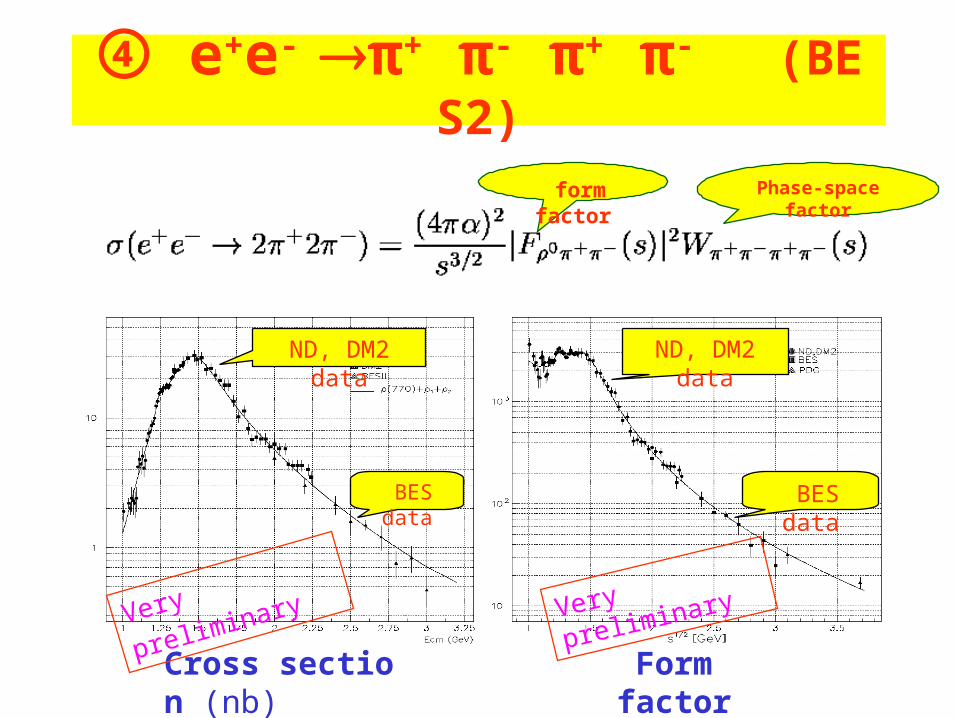
④ e+e- π+ π- π+ π- (BES2)
Cross section (nb)
Form factor
form factor Phase-space factor
BES data
ND, DM2 data ND, DM2 data
BES data
Very
preliminary Very
preliminary

e+e- 2(π+ π- ) at BES3
M4πdistribution Ptotal distribution
2.2GeV 2.2GeV
BES3 BES3
BES2
2.6GeV 2.6GeVBES3 BES3
BES2
BES3 has better momentum resolution and larger acceptance than BES2, which will be helpful to the events selection and reduce the backgrounds.

⑤ e+ e- →p pbar at BES2
Form factor
Form factor by BES2 Form factor combined other experiments

⑤ e+ e- →p pbar ( momentum resolution of BES2 and BES3)
Ecm pexp p p p p
2.0 0.347 0.315 0.022 0.346 0.006
2.2 0.575 0.563 0.024 0.574 0.008
2.4 0.748 0.739 0.027 0.747 0.010
2.6 0.900 0.891 0.032 0.898 0.012
2.8 1.039 1.029 0.038 1.037 0.015
3.0 1.171 1.161 0.039 1.168 0.018
<===BES2===> <=== BES3===>experiment
Momentum resolution at BES3 is much better than BES2

⑤ e+ e- →p pbar (efficiencies of BES2 and BES3)
Ecm (GeV) |cosθ|≤0.75 |cosθ|≤0.75 |cosθ|≤0.90
2.0 0.6328 0.3567 0.4288
2.2 0.6752 0.5847 0.7183
2.4 0.6217 0.6067 0.6764
2.6 0.6467 0.6209 0.6937
2.8 0.6248 0.6077 0.6823
3.0 0.6448 0.6014 0.6774
BES2 BES3

⑥ Multiplicity Distribution The multiplicity is the basic quantity in reactions:
multiplicity distribution: Pn(s)
average multiplicity: <nch(s)>=nPn(s)
pQCD predicts the ratio of multiplicity of the gluon fragmentation to qurk fragmentation r=<nG>/<nF
> → CA /CF =9/4. This may be tested by analyzing : J/ data (gluon-fragmentation events account for 95%) 3.07 GeV data (gluon events may be neglected).

Multiplicity Distribution of BES2
The results of BES2
(To be published in PRD)
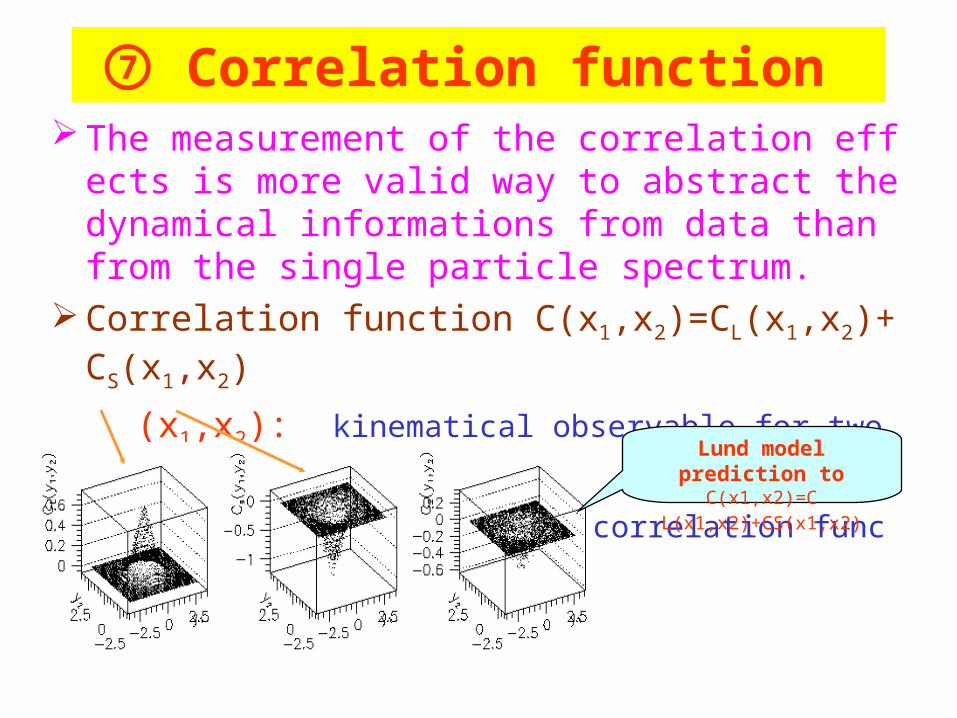
⑦ Correlation function The measurement of the correlation effects is more va
lid way to abstract the dynamical informations from data than from the single particle spectrum.
Correlation function C(x1,x2)=CL(x1,x2)+CS(x1,x2)
(x1,x2): kinematical observable for two particles,
CL/CS : long/short-range correlation functions.Lund model prediction to
C(x1,x2)=C
L(x1,x2)+CS(x1,x2)
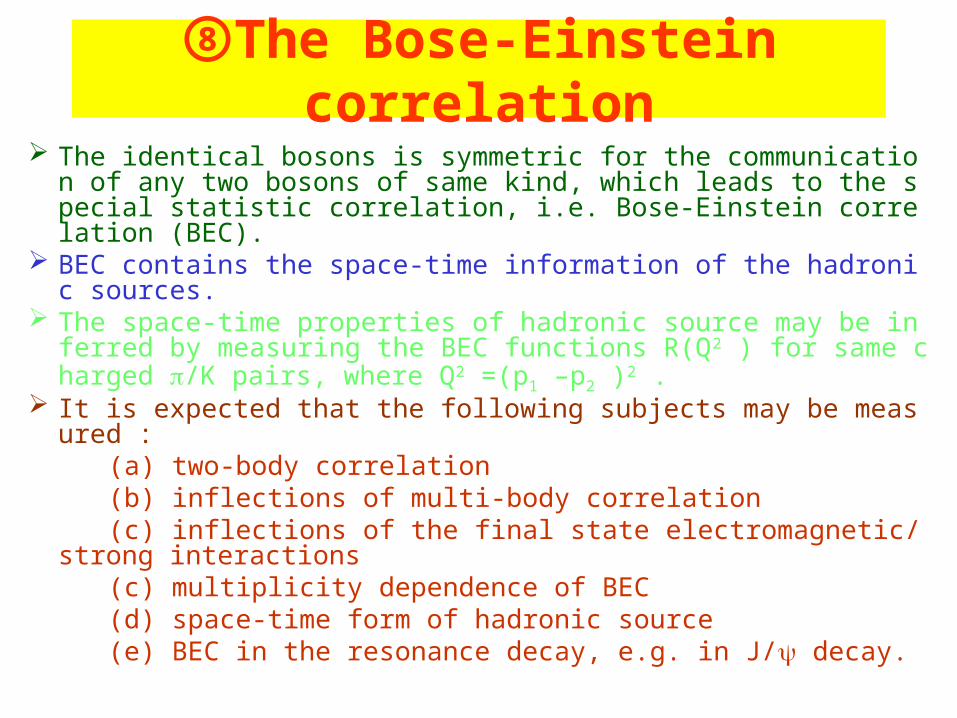
⑧The Bose-Einstein correlation
The identical bosons is symmetric for the communication of any two bosons of same kind, which leads to the special statistic correlation, i.e. Bose-Einstein correlation (BEC).
BEC contains the space-time information of the hadronic sources. The space-time properties of hadronic source may be inferred by m
easuring the BEC functions R(Q2 ) for same charged /K pairs, where Q2 =(p1 –p2 )2 .
It is expected that the following subjects may be measured : (a) two-body correlation (b) inflections of multi-body correlation (c) inflections of the final state electromagnetic/strong interactions (c) multiplicity dependence of BEC (d) space-time form of hadronic source (e) BEC in the resonance decay, e.g. in J/ decay.

⑨ Fractal properties at low energy
One usually paid the attention to averaged distributions only.
The fluctuations are thought as the statistical phenomena for the finite particles number.
The events with abnormal high particle density condensed in small phase-space have been observed in several kinds of reactions at high energy.
The important questions to these discover are: (a) do the anomalous fluctuations have their intrinsic dynamics origins? (b) is the phase-space of the final state the isotropic or not? (c) is the phase-space the continuous or fractal? (d) do the intermittency observed at high energy exist at low energy? (e) can the intermittency be explained by the known theories (cascade , BEC)?

⑨ Fractal properties at low energy
The study of this topic has two aspects: (i) experiment aspect : - measure the fractal moments - measure the Hurst index (ii) mechanism problem : - whether the asymptotic fractal behavior in the
perturbative evolution of partons may be kept after the hadronization processes?
- and so on…

Summary
The high luminosity of BEPC2, the large geometry acceptance, good space and momentum resolution, good particle identification of BES3 will be beneficial to the R measurement and QCD studies at low energy.
The goal of the R measurement at BEPC2/BES3 is to reach the precision about 2-4%.
Some subjects which are interesting to low energy QCD will be studied experimentally with high precision.