R. DHAWAN Jan 1411
26
Is Federal Reserve Bank Policy Working in the US? DR. RAJEEV DHAWAN Director, Economic Forecasting Center Georgia State University Presented at the Global Interdependence Center’s Meeting at the Central Bank of Chile in Santiago • January 17, 2011
-
Upload
global-interdependence-center -
Category
Documents
-
view
227 -
download
1
description
DR. RAJEEV DHAWAN Director, Economic Forecasting Center Georgia State University Presented at the Global Interdependence Center’s Meeting at the Central Bank of Chile in Santiago • January 17, 2011 AGENDA 1. Define the latest Federal Reserve Bank policy aka Quantitative Easing 2. Effectiveness metrics 3. Impediments to boosting aggregate demand; what creates job growth? 4. Ability and willingness of commercial banks to make loans to businesses (especially to small firms) 5. Concluding remarks
Transcript of R. DHAWAN Jan 1411

Is Federal Reserve Bank Policy
Working in the US?DR. RAJEEV DHAWAN
Director,
Economic Forecasting Center
Georgia State University
Presented at the Global Interdependence Center’s Meeting at the
Central Bank of Chile in Santiago • January 17, 2011

1. Define the latest Federal Reserve Bank policy aka Quantitative Easing
2. Effectiveness metrics
3. Impediments to boosting aggregate demand; what creates job growth?
4. Ability and willingness of commercial banks to make loans to businesses (especially to small firms)
5. Concluding remarks
AGENDA

• Quantitative Easing refers to changes in the composition and/or size of a central bank’s balance sheet that are designed to ease liquidity and/or credit constraints (Blinder 2010)
• The central bank hopes that by reducing interest rate spreads/risk premiums the central bank can boost aggregate demand even at the zero lower bound for the policy interest rate
Quantitative Easing: The Second Round (QE2)

Jim Bullard’s Fear and Solution
The FOMC’s “extended period” language may be increasing the probability of a Japanese-style outcome for the United States.
…on balance, the U.S. quantitative easing program offers the best tool to avoid such an outcome.
Source : James Bullard, “Seven Faces of “the Peril”, September/October 2010

-4.0
-3.0
-2.0
-1.0
0.0
1.0
2.0
3.0
4.0
1 4 7 10 13 16 19 22 25 28 31 34 37 40 43 46 49 52 55 58 61 64 67 70 73 76 79 82
US Deflator (starting in 2000)
Japan Deflator (starting in 1990)
(%, PCHYA)
U.S. Inflation Compared to Japan

FOMC’s December Statement
Source: FOMC statement & FRB of NY, November 3, 2010
To promote a stronger pace of economic recovery and to help ensure that inflation, over time, is at levels consistent with its mandate…. The Committee…. intends to purchase a further $600 billion of longer-term Treasury securities by the end of the second quarter of 2011.
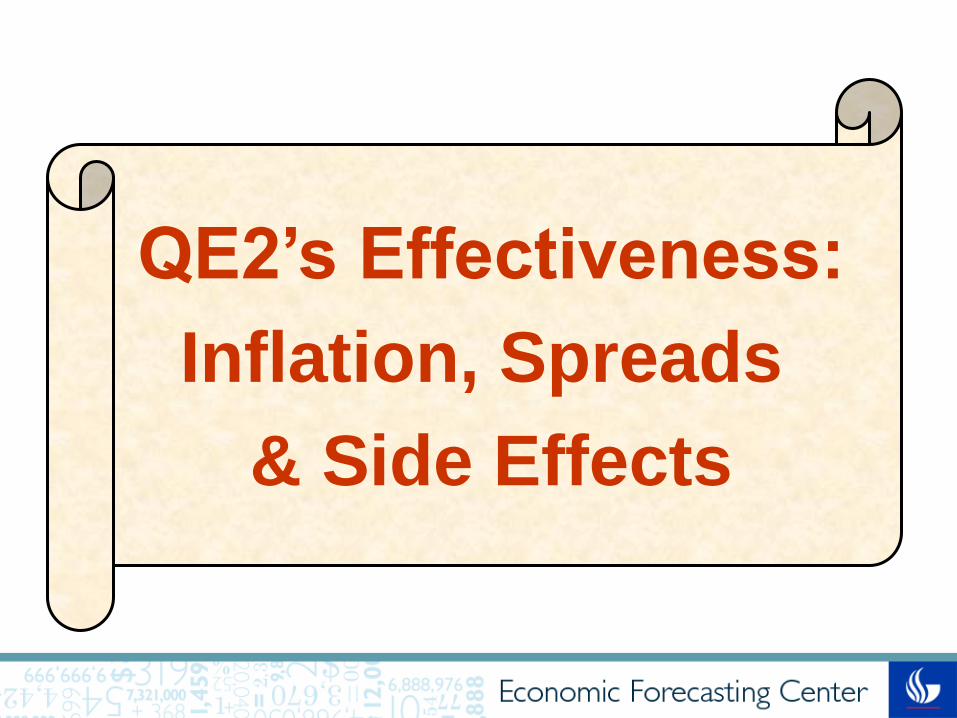
QE2’s Effectiveness:
Inflation, Spreads
& Side Effects

JANOCTJULAPRJANOCTJULAPRJANOCTJULAPRJANOCTJULAPRJANOCTJULAPRJAN
201120102009200820072006
4
3
2
1
0
-1
(%)
Expected vs. Actual Inflation
10-Y Bon d Ra t e Less T IPS Ra t e
Core In fla t ion (3-m ont h A n n . Growt h )
DECJULFEBSEPAPRNOVJUNJANAUGMAROCT
20102009200820072006
12
10
8
6
4
2
0
(%)
Risk Premium in Investment Grade BondsBB+ Corporate v s. 10-Year T-Bond
JANDECNOVOCTSEPAUG20112010
12000
11500
11000
10500
10000
9500
1450
1400
1350
1300
1250
1200
1150
($/Troy ounce)
Stock Market and Gold
DOW30 (Left) Gol d (Ri ght)
Instead of Flattening
the Yield Curve
has steepened

JANDECNOV
20112010
1.50
1.40
1.30
1.20
1.10
1.00
0.90
(%)
Long-Term Rates: Germany vs. Japan vs. US vs. UK
German 10-Y Bond UK 10-Y Bond
US 10-Y Bond Japanese 10-Y Bond

NOVSEPJULMAYMARJANNOVSEPJULMAYMARJAN
20102009
-20
-25
-30
-35
-40
-45
-50
-55
($ bil.)
Trade Balance
Source: May 2005, Forecast of the Nation, EFC@GSU
10-Year Bond Regression
10-Year Bond Rate and Trade Deficit

20102009200820072006200520042003200220012000
120
110
100
90
80
70
(Index 2000 = 100)
US Trade Weighted Currency Index
Emerging Currencies
Major Currencies

Impediments to
Boosting Aggregate
Demand

DECAUGAPRDECAUGAPRDECAUGAPRDECAUGAPRDECAUGAPR
20102009200820072006
120
100
80
60
40
20
16000
14000
12000
10000
8000
6000
(Index 1966 = 100)
Consumer Confidence and Stock Market Wealth
Consu m er Confiden ce (Left ) Wilsh ire 5000 (Righ t )20102009200820072006200520042003200220012000199919981997
200
180
160
140
120
100
80
Hom e Prices: Case-Shiller National Average
Home Price Expectations Survey
Source: MaroMarkets Home Price Expectations Survey, December 2010
EFC
Median
Low
High
Employment Recovery

So What
Creates Jobs?

2010200820062004200220001998199619941992199019881986198419821980
5.0
4.5
4.0
3.5
3.0
2.5
2.0
(%)
Investment in Tech Equipment andSoftware as a % of GDP
Golden 90’s
Job Growth:
240K/Month
2003-2007
Job Growth:
132K/Month
12%
6%
-15%2008-2009
Job Loss:
400K/Month
+19%
2010 YTD:
87K/Month

Rajeev DhawanProfessor & DirectorEconomic Forecasting CenterGeorgia State University
Harold Vasquez Research Specialist
Economic Forecasting CenterGeorgia State University
Source: “U.S. Employment Growth and Tech Investment: A New Link” By Rajeev Dhawan & Harold Vasquez, 2010
The improvements in CEO’s perceptions about the future increases TECH investment spending.
TECH investment significantly increases employment growth via durable goods ORDERS channel.
Employment growth
(Job additions)
CEO:1% CEO 0.034% TECH
1% CEO 0.11% ORDERS
TECH:
1% TECH 0.059% EMP:
ORDERS:1% ORDERS 0.45% TECH
Job Growth and Tech Investment

IVIIIVIIIVIIIVIIIVIIIVIIIVIIIVIIIVIIIVIIIVIIIVII201020092008200720062005200420032002200120001999
70
60
50
40
30
20
10
0
-10
-20
-30
-40
(%, Y -O-Y )
Chief Executive Confidence & Durable Goods OrdersExpectati ons of Busi ness Condi ti ons i n Own Industry 6 Months Ahead
CEO Confi dence (Left) Durabl e Goods Orders Growth (Ri ght)

-2500
-2000
-1500
-1000
-500
0
500
1000
1500
2000
2500
-20%
-15%
-10%
-5%
0%
5%
10%
15%
20%
2001 2002 2003 2004 2005 2006 2007 2008 09q1 09q2 09q3 09q4 10q1 10q2 10q3
DOW 30 (Left) Private Job Gains (Right)
(‘000 Jobs)(%, Y-O-Y)
Dow30 Revenue Growth and Job Gains
-20%
-15%
-10%
-5%
0%
5%
10%
15%
20%
25%
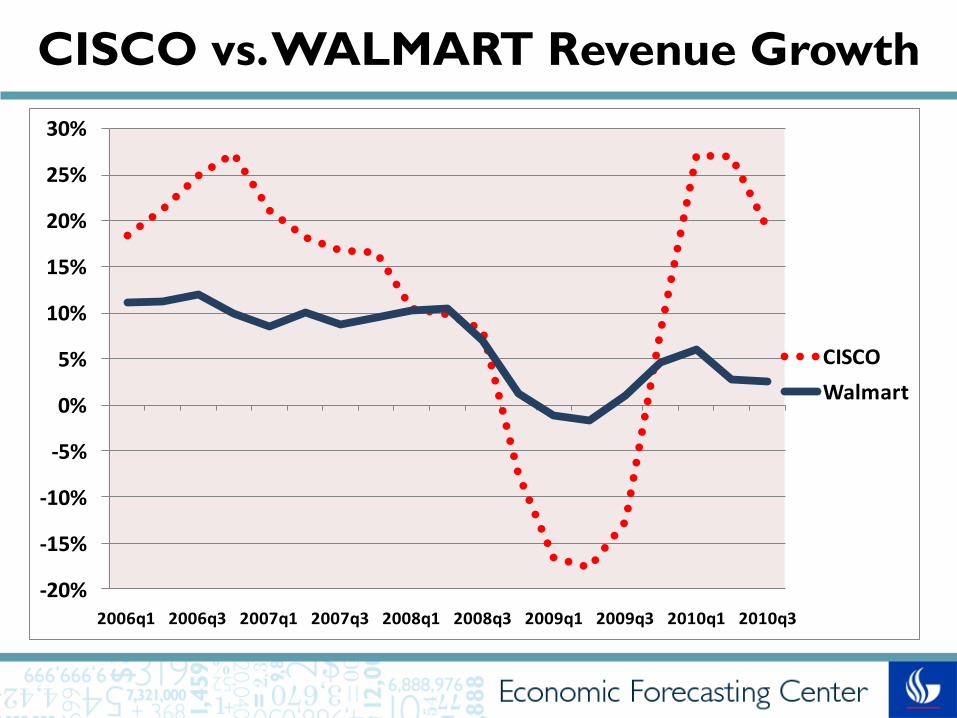
30%
2006q1 2006q3 2007q1 2007q3 2008q1 2008q3 2009q1 2009q3 2010q1 2010q3
CISCO
Walmart
CISCO vs. WALMART Revenue Growth

WALMART CEO Mike Duke
Source: Bloomberg Businessweek, December 6, 2010
Three issues that we often talk about: tax, trade, and health care.

But What About the
Ability/Willingness
of Banks to Lend?
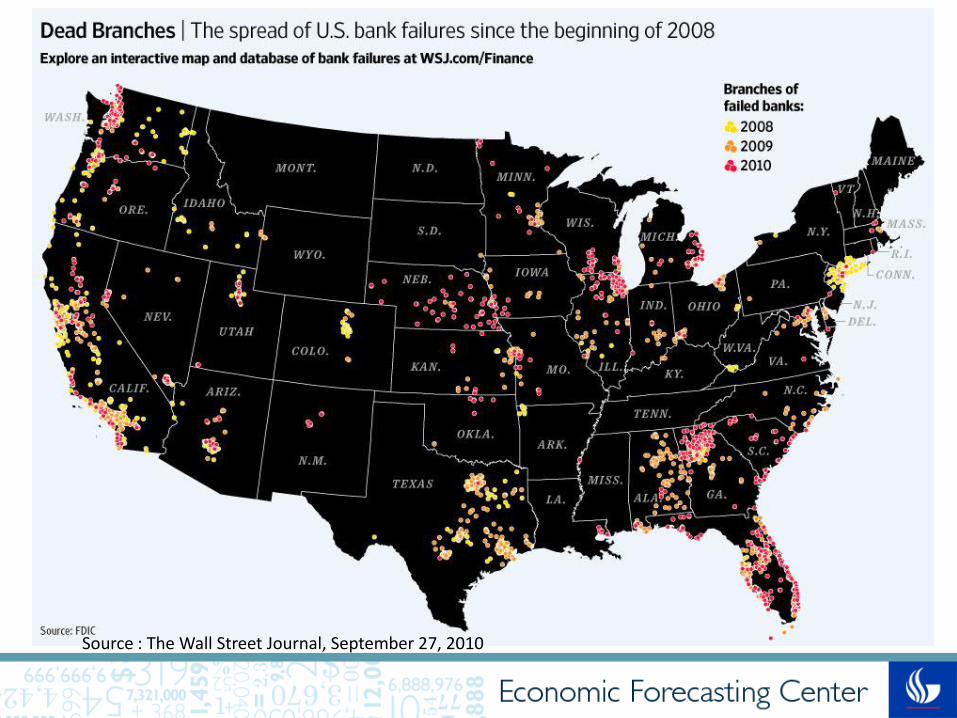
Source : The Wall Street Journal, September 27, 2010

DECOCTAUGJUNAPRFEBDECOCTAUGJUNAPRFEBDECOCTAUG
201020092008
1200
1000
800
600
400
200
0
-200
($ Bil.)
Excess Reserves of Depository Institutions

an “overhang” of impaired banks that may be
forced to sell soon can reduce the current price of illiquid securities sufficiently that banks have no interest in selling. This
creates high expected returns to holding cash for potential buyers and an aversion to making term loans.
Source: NBER working paper #14925, April 2009
Douglas Diamond Professor of FinanceUniversity of Chicago
Raghuram Rajan Professor of Finance
University of Chicago
Fear of Fire Sales and
the Credit Freeze

• Job growth is a function of “tech” investment that in turn is dependent upon confidence levels (CEO’s and consumers)
• Can a central bank do anything here? • Not directly, but by easing the flow of credit it
can help small firms that are primarily bank finance dependent
• How to do it? • Clean up the toxic debt by using the QE power
(Explore setting up a Resolution Trust Corporation as in early 90’s? Reviving Treasury’s PPIP?)
Food-For-Thought

Special Thanks to the Center’s
Carl R. ZwernerChair of Family
Owned Businesses
Executive Sponsors
Sponsors