R Barnsley, Moscow, Nov 2003.1 ADAS/SANCO (Atomic data and impurity transport codes) - Evaluation of...
26
R Barnsley, Moscow, Nov 2 003. 1 ADAS/SANCO (Atomic data and impurity transport codes) - Evaluation of suitable impurities and ionization stages. - Simulations of line and continuum emission. - Impurity contributions to Prad and Zeff. Integration into ITER - Vertical coverage with 2-D curved crystal optics and 2-D detectors. - Two or more graphite reflectors for the region inaccessible by direct views. Instrument performance - Optimization of sensitivity. - Simulation of signal-to-noise ratios. Data reduction - Study of quasi-tomographic derivation of rotation and Ti. ITER plasma rotation and Ti profiles from high-resolution crystal spectroscopy R Barnsley, L-C Ingesson, A Malaquias & M O’Mullane
-
Upload
natalie-gundy -
Category
Documents
-
view
225 -
download
0
Transcript of R Barnsley, Moscow, Nov 2003.1 ADAS/SANCO (Atomic data and impurity transport codes) - Evaluation of...

R Barnsley, Moscow, Nov 2003. 1
ADAS/SANCO (Atomic data and impurity transport codes)
- Evaluation of suitable impurities and ionization stages.
- Simulations of line and continuum emission.
- Impurity contributions to Prad and Zeff.
Integration into ITER
- Vertical coverage with 2-D curved crystal optics and 2-D detectors.
- Two or more graphite reflectors for the region inaccessible by direct views.
Instrument performance
- Optimization of sensitivity.
- Simulation of signal-to-noise ratios.
Data reduction
- Study of quasi-tomographic derivation of rotation and Ti.
ITER plasma rotation and Ti profiles from high-resolution crystal spectroscopy
R Barnsley, L-C Ingesson, A Malaquias & M O’Mullane

R Barnsley, Moscow, Nov 2003. 2
0.5 0.6 0.7 0.8 0.9 10
0.0002
0.0004
0.0006
0.0008
H-like ClHe-like Cl Li-like ClH-like Ar
r/a
E (w
/cm^3
)
0.7 0.75 0.8 0.85 0.9 0.95 1 1.050
0.0005
0.001
0.0015
H-like O H-like C H-like Be
r/a
E (w
/cm^3
)
0 0.2 0.4 0.6 0.8 10
0.002
0.004
0.006
H-like Fe He-like Fe Li-like Fe (x5)Ne-like Fe (x5)
r/a
E (w
/cm
^3)
0 0.2 0.4 0.6 0.8 10
0.0002
0.0004
0.0006
H-like Kr He-like KrLi-like KrNe-like Kr (x10)
r/a
E (w
/cm
^3)
ITER-98 impurity profiles

R Barnsley, Moscow, Nov 2003. 3
0 0.5 10
0.2
0.4
0.6
0.8
1
H-like Kr 35+ 1s-2p
Line-peak/continuum ratio for f-Kr=10^-5
r/a
0 0.5 10
1
2
3
4
He-like Kr 34+ 1s^2-1s2p
Line-peak/continuum ratio for f-Kr=10^-5
r/a
ADAS / SANCO modelled line/continuum ratios for H- and He-like Kr:
- Chord-integrated ratios.
- Reference case: f-Kr = 10-5 . Ne, Prad ~ 700 kW.
0 0.2 0.4 0.6 0.8 110
0
10
20
30
Ne (10^19/m^-3) Te (keV) Ti (keV)Vtor (*10 km/s)Vpol (km/s)
ITER Reversed-Shear Profiles
r/a
ITER profiles used for SANCO and signal modelling

R Barnsley, Moscow, Nov 2003. 4
ADAS / SANCO results for f-Kr = 10-5 . ne:
- (Left) Ionization balance. (Right) Radiated power components and total.
- Prad ~ 700 kW (integrated over plasma volume).
- Zeff ~ 0.01
- Kr ionization stages down to ~ Kr 26+ have x-ray lines suitable for crystal Doppler spectroscopy.
- Most of the radiated power is not in the H- and He-like stages.
R Barnsley, Moscow, Nov 2003. 5
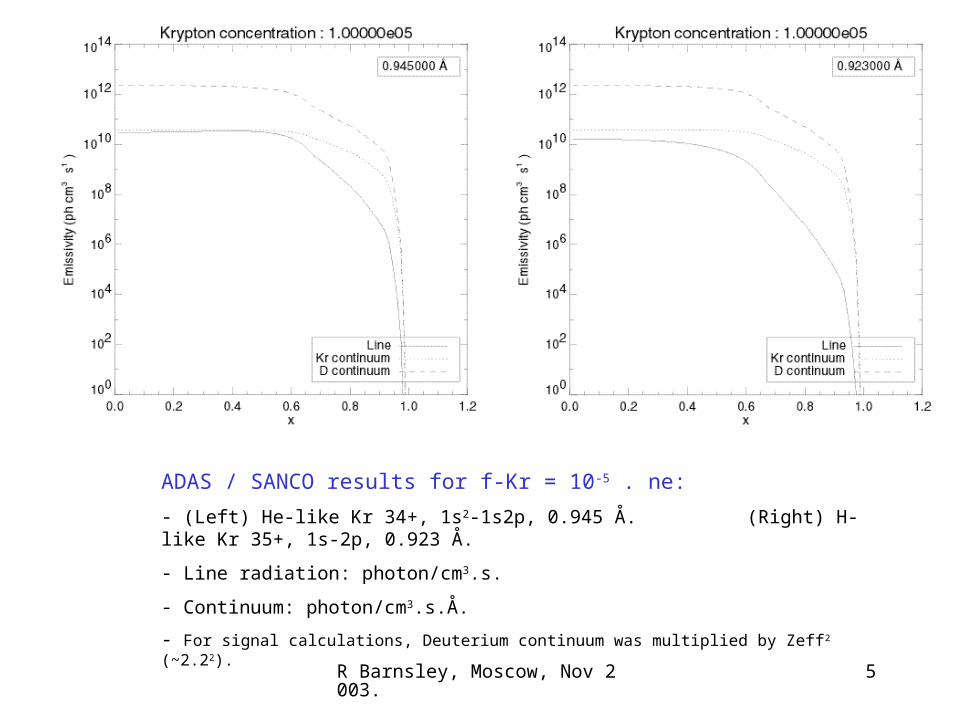
ADAS / SANCO results for f-Kr = 10-5 . ne:
- (Left) He-like Kr 34+, 1s2-1s2p, 0.945 Å. (Right) H-like Kr 35+, 1s-2p, 0.923 Å.
- Line radiation: photon/cm3.s.
- Continuum: photon/cm3.s.Å.
- For signal calculations, Deuterium continuum was multiplied by Zeff2 (~2.22).
R Barnsley, Moscow, Nov 2003. 6
Crystal, radius R
Detector
ShieldGraphite prereflector
Input cone
Rowland circle, diameter R
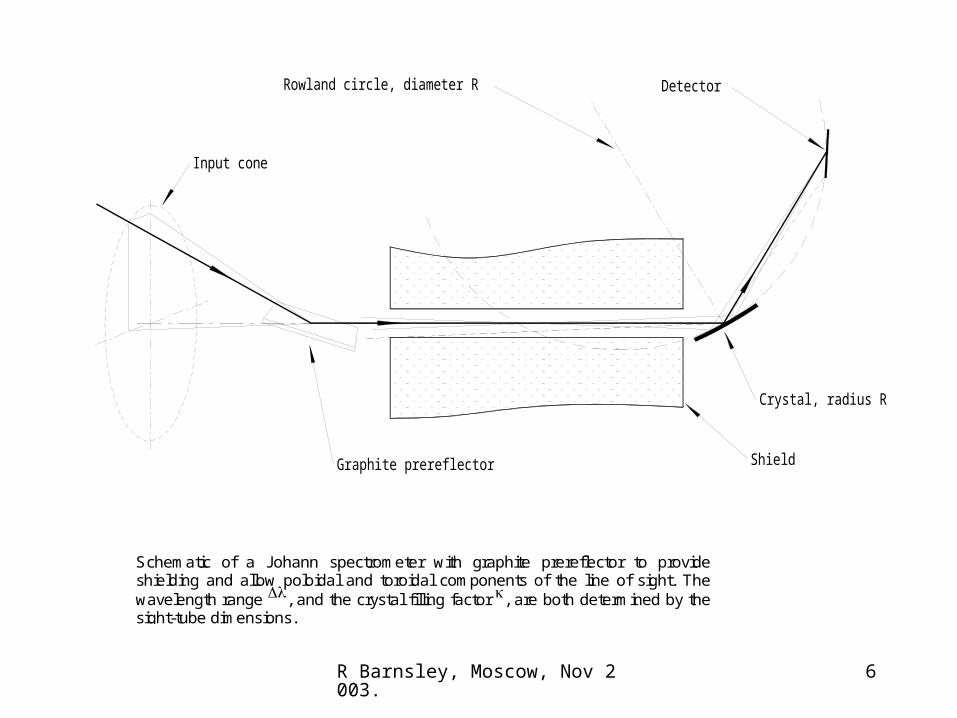
Schematic of a Johann spectrometer with graphite prereflector to provideshielding and allow poloidal and toroidal components of the line of sight. Thewavelength range , and the crystal filling factor , are both determined by thesight-tube dimensions.
R Barnsley, Moscow, Nov 2003. 7
1.8 1.85 1.90
5 109
1 108
1.5 108
2 108
2.5 108
3 108
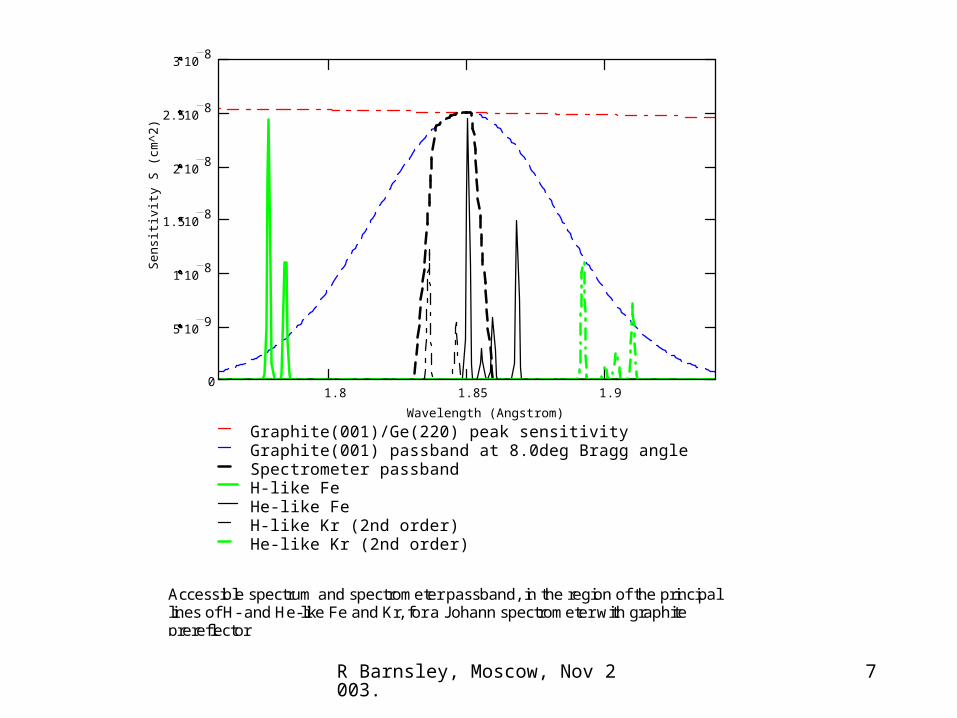
Graphite(001)/Ge(220) peak sensitivityGraphite(001) passband at 8.0deg Bragg angleSpectrometer passbandH-like FeHe-like FeH-like Kr (2nd order)He-like Kr (2nd order)
Wavelength (Angstrom)
Sen
siti
vity
S (
cm^2
)
Accessible spectrum and spectrometer passband, in the region of the principallines of H- and He-like Fe and Kr, for a Johann spectrometer with graphiteprereflector

R Barnsley, Moscow, Nov 2003. 8
ITER-98 x-ray spectrometer array (XCS-A)
5 lines of sight
• Provides good neutron shielding • Access to plasma remote areas
- Signal attenuation (10% transmission) - Reflection from graphite implies narrow bandwidth (~1%)

R Barnsley, Moscow, Nov 2003. 9
X-ray discrete multi-chord option
The new system is integrated at eport9 (16 LOS)and uport3 (5 LOS)
Direct viewing lines without graphite reflectors.
Two spectral arms are used for each viewing line:
•One for He like Ar (edge)•One for He like Kr (core)

R Barnsley, Moscow, Nov 2003. 10
Multi-chord X-ray spectrometer option
ISO views of eport9

R Barnsley, Moscow, Nov 2003. 11
- Upper and lower systems give continous coverage of the plasma core r/a <~ 0.7
- Compatible with the option of discrete lines of sight, by inserting/removing shield.
- Reduced number of crystals and Be windows
- Spatial resolution ~10 mm.
- Plasma vertical position control with soft x-ray array.
- Plasma rotation measurements can still be performed by two parallel views.
Upper view
Lower view
‘L’
‘U’
Core views with continuous coverage on equatorial port 9

R Barnsley, Moscow, Nov 2003. 12
Two or more discreet views –graphite reflectors
Continuously resolved withimaging crystal optic
Two or more graphite reflector based lines of sight will complete plasma coverage

R Barnsley, Moscow, Nov 2003. 13
Option for equatorial port
- Allows continuous imaging
- Minimises blanket aperture

R Barnsley, Moscow, Nov 2003. 14
Imaging Multichord or Imaging
Discrete, graphite
X-ray Views Referred to Mid-plane Profiles
Approximate coverage of the combined upper-port and mid-plane x-rayarrays, referred to the mid-plane profiles.
The region between 0.7 < r/a < 0.9 cannot be viewed directly from either port.This gap is covered by two or more graphite reflectors.

R Barnsley, Moscow, Nov 2003. 15
+ Allows plasma imaging
+ Improves S/N ratio with smaller entrance aperture and smaller detector
fs/fm = -1/cos(2B)
- No real focus for B < 45°
fs: Sagittal focus fm: Meridional focus B: Bragg angle
Spherically Bent Crystal

R Barnsley, Moscow, Nov 2003. 16
When combined with asymmetric crystal cut, gives considerable freedom in location of foci.
Toroidally Bent Crystal
A Hauer, J D Kilkenny & O L Landen. Rev Sci Instrum 56(5), 1985.

R Barnsley, Moscow, Nov 2003. 17
2-D bent crystal
(not to scale)
The source is deep and optically thin.
A toroidally-bent crystal is required, to place the spatial focus in the plasma.
Raw spatial resolution depends on:
- Crystal height
- Chord length in plasma
- Chord-weighted emission
- Optical aberrations and crystal bending
Requires / ~ 10-3 (cf. / ~ 10-4 for -focus)
For a crystal of height h:
- r(Uport) ~ h/6 ~ 1 cm
- r(Eport) ~ h/3 ~ 2 cm
- r/r ~ 100 (optically)

R Barnsley, Moscow, Nov 2003. 18
T h e c o u n t - r a t e N ’ ( c o u n t / s ) f r o m a s p e c t r a l l i n e w i t h i n t e n s i t y I ( p h o t o n / c m 2 . s ) , i s g i v e n b y
N' .I S
w h e r e , f o r a J o h a n n s p e c t r o m e t e r w i t h g r a p h i t e p r e r e f l e c t o r , t h e s e n s i t i v i t y f u n c t i o nS ( c m 2 ) i s g i v e n b y
S ....Pgr
.. Rc .4
hx hy
T h e t e r m s a r e : g r a p h i t e p e a k r e f l e c t i v i t y P g r , v e r t i c a l d i v e r g e n c e ( r a d ) , c r y s t a l r e f l e c t i o ni n t e g r a l R c ( r a d ) , p r o j e c t e d c r y s t a l w i d t h h x ( c m ) , c r y s t a l h e i g h t h y ( c m ) , a n d t h e c o m b i n e dd e t e c t o r a n d w i n d o w e f f i c i e n c i e s . T h e f r a c t i o n o f t h e c r y s t a l a p e r t u r e f i l l e d a t a g i v e nw a v e l e n g t h d e p e n d s o n t h e s o u r c e a n d b e a m l i n e g e o m e t r y .

R Barnsley, Moscow, Nov 2003. 19
Crystal
Detector
Factors leading to choice of Bragg angle
Low Bragg angle (~30°) :
+ Reduced dispersion: = /tan.
a) Smaller first-wall penetration for a given bandwidth.
b) Smaller detector movement for tuneable spectrometer.
+ Larger crystal radius for a given crystal-detector arm - helpful with long sight-line.
+ Greater choice of crystals for short wavelengths.
+ Detector more remote from port plug.
+ Reduced effect of conical ray geometry for imaging optics.
- Shallower input angle to detector - parallax problems with gas-chamber detector.
~ Requires a toroidal crystal for imaging at B < 45°

R Barnsley, Moscow, Nov 2003. 20
Effect of input geometry on Johann sensitivity
Shield “a”
“a”
Shield “b”
Shield “c” 1 2 3
1
a b
c
Crystal
Detector
Crystal filling factor
Johann optics allow us to trade S/N with band-pass, while maintaining peak sensitivity at the central wavelength
R Barnsley, Moscow, Nov 2003. 21
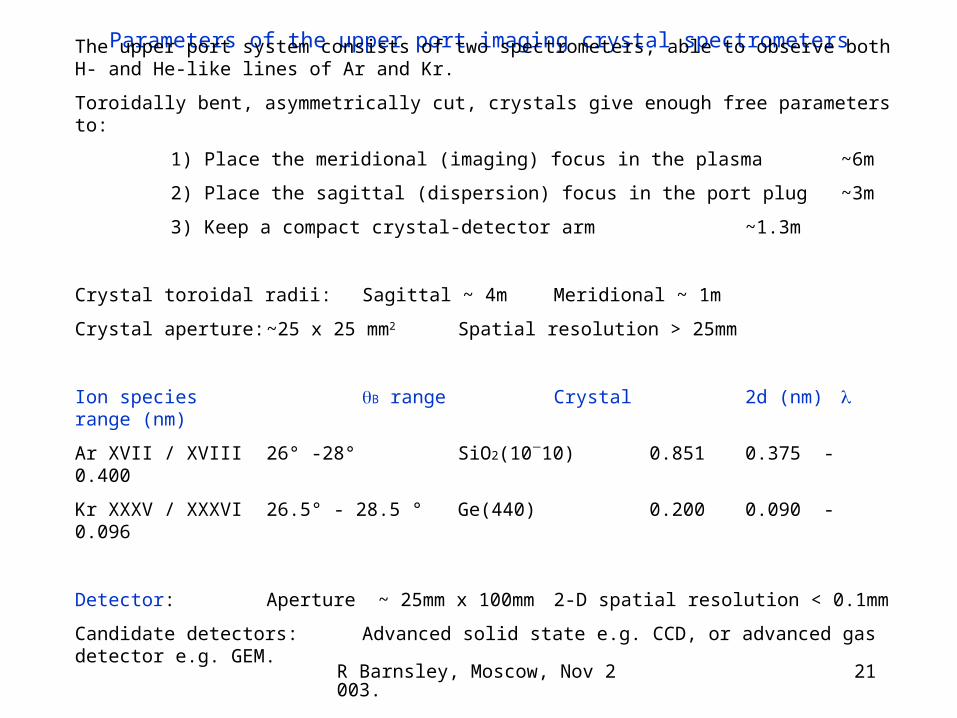
Parameters of the upper port imaging crystal spectrometers
The upper port system consists of two spectrometers, able to observe both H- and He-like lines of Ar and Kr.
Toroidally bent, asymmetrically cut, crystals give enough free parameters to:
1) Place the meridional (imaging) focus in the plasma ~6m
2) Place the sagittal (dispersion) focus in the port plug ~3m
3) Keep a compact crystal-detector arm ~1.3m
Crystal toroidal radii: Sagittal ~ 4m Meridional ~ 1m
Crystal aperture: ~25 x 25 mm2 Spatial resolution > 25mm
Ion species B range Crystal 2d (nm) range (nm)
Ar XVII / XVIII 26° -28° SiO2(1010) 0.851 0.375 - 0.400
Kr XXXV / XXXVI 26.5° - 28.5 ° Ge(440) 0.200 0.090 - 0.096
Detector: Aperture ~ 25mm x 100mm 2-D spatial resolution < 0.1mm
Candidate detectors: Advanced solid state e.g. CCD, or advanced gas detector e.g. GEM.

R Barnsley, Moscow, Nov 2003. 22
T h e c o u n t - r a t e N ’ ( c o u n t / s ) f r o m a s p e c t r a l l i n e w i t h i n t e n s i t y I ( p h o t o n / c m 2 . s ) , i s g i v e n b y
N ' .I S
F o r a J o h a n n s p e c t r o m e t e r w i t h g r a p h i t e p r e r e f l e c t o r , t h e s e n s i t i v i t y f u n c t i o n S ( c m 2 ) i s :
S ....P g r
.. R c .4
h x h y
C r y s t a l f i l l i n g f a c t o r = 1 . T o t a l v e r t i c a l d i v e r g e n c e t o t . N o . o f v i e w i n g c h a n n e l s n c h ,
V e r t i c a l d i v e r g e n c e p e r c h a n n e l c h ( r a d ) i s :
c h = t o t / n c h
t o t ~ 0 . 5 r a d n c h = 3 5
R e f e r e n c e F e i n 1 s t o r d e r
R e f e r e n c e K r i n 2 n d o r d e r
H i g h s e n s i t i v i t y o p t i o n . O n l y K r o n g r a p h i t e ( I s t o r d e r )
G r a p h i t e p l a n e s
( 0 0 2 )
( 0 0 4 )
( 0 0 2 )
G r a p h i t e p e a k R e f l e c t i v i t y P g r
0 . 3
0 . 2
0 . 5
G e r m a n i u m c u t
( 2 2 0 )
( 4 4 0 )
( 2 2 0 )
G e r e f l e c t i o n i n t e g r a l R c
r a d
6 6
9
3 4
C r y s t a l a p e r t u r e h x , h y
c m 2
5 x 5
5 x 5
5 x 5 { 1 0 x 1 0 }
W i n d o w / d e t e c t o r e f f i c i e n c y
0 . 5
0 . 5
0 . 5 { 0 . 8 }
S D D i r e c t v i e w s
1 0 - 7 c m 2
9 . 4
1 . 3 *
4 . 7 { 3 0 }
S G r G r a p h i t e v i e w s
1 0 - 7 c m 2
2 . 8
0 . 2 5
2 . 4 { 1 5 }

R Barnsley, Moscow, Nov 2003. 23
Outline detector specification
Total detector height (~800 mm) = observed plasma height (~4 m) x demagnification (~0.2)
Individual detector height: ~160 mm for 5 detectors
Detector width in direction: ~50 mm
Vertical resolution: ~5 mm, for >100 resolvable lines of sight
Horizontal resolution: ~0.1 mm
QDE / Energy range: > 0.7, 6 – 13 keV (Uport also 3 – 6 keV)
Average count rate density: ~106 count/cm2.s
Peak count rate density: ~107 count/cm2.s
n- background count density:~104 count/cm2.s
(flux of 106 n-/cm2.s, 10% sensitivity. 90% shielding)
Candidate detectors
This performance is typical of detectors in use or in development for high-flux sources such as synchrotrons.
- Gas-microstructure proportional counters.
- Solid state arrays with individual pulse processing chain for each pixel.

R Barnsley, Moscow, Nov 2003. 24
0 10 20 300
5000
1 104
1.5 104
2 104
2.5 104
I20 i
I215 i
I218 i
I221 i
I223 i
i
0 10 20 3010
100
1 103
1 104
1 105
Ch 0 (central chord)Ch 18Ch 22 Krypton fraction = 10^-5 Ch 24 Integration time = 100 msCh 26Ch 28Ch 35 (r/a = 1)
Simulated He-like Kr signals with noise
Detector Channel
Cou
nts
per
Cha
nnel
0 10 20 300
5000
1 104
1.5 104
2 104
2.5 104
Ch 0 (central chord)Ch 18Ch 22 Krypton fraction = 10^-5 Ch 24 Integration time = 100 msCh 26
Simulated He-like Kr signals with noise
Detector Channel
Cou
nts
per
Cha
nnel
Calculated signals for reference case:
- f-Kr = 10-5 . Ne Prad ~ 700 kW Zeff ~ 0.01
- Vertical image binned into 35 chords.
- Poisson noise added for 100 ms integration time.

R Barnsley, Moscow, Nov 2003. 25
0 0.2 0.4 0.6 0.8 10.1
1
10
100
1 103
1 104
f-Kr = 10^-4, delta-Prad = 7 MWf-Kr = 10^-5, delta-Prad = 700 kWf-Kr = 10^-6, delta-Prad = 70 kWf-Kr = 10^-7, delta-Prad = 7 kW
100 ms S/N Ratio for He-like Kr 34+
r/a
S/N
rat
io
1 108
1 107
1 106
1 105
1 104
1
10
100
1 103
1 s integration time100 ms10 ms1 ms
Central-chord S/N Ratio for He-like Kr
Krypton fractional abundance
S/N
rat
io
Estimated Poisson signal-to-noise ratios based on counting statistics
- SNR ~ (Integral counts in line) / sqrt(line + continuum + n-background).
- Main noise source for data reduction is continuum, not n-background.
- A wide operational space is available between 10-7 < f-Kr < 10-4.
- Uses a modest instrument sensitivity of 1.4 . 10-7 cm2 per chord. (10x higher is possible).

R Barnsley, Moscow, Nov 2003. 26
0 0.2 0.4 0.6 0.8 10
10
20
30
Ti profile (Rev shear)Chord-weighted Ti (100 ms, fKr=10^-5)
Chord-weighted Ti for He-like Kr 34+
r/a
Ti
(keV
)
0 0.2 0.4 0.6 0.8 10
50
100
150
Toroidal rotation profile (rev shear)Chord-weighted Vtor (100 ms, fKr=10^-5)
Chord-weighted Vtor for He-like Kr 34+
r/a
Vto
r (k
m/s
)
0 0.2 0.4 0.6 0.8 10
10
20
30
Ti profile (Rev shear)Chord-weighted Ti (100 ms, fKr=10^-5)
Chord-weighted Ti for H-like Kr 35+
r/a
Ti
(keV
)
Fits to the simulated noisy raw data
- Illustrative of the raw data quality – (obviously) not the best method of analysis.
- Due to the narrower profile, chord-integral effects are less for H-like Kr than for He-like.
- For r/a > 0.7, lower-ionized Kr ions or lower-Z impurities are required.
- Under favourable conditions, a quasi-tomographic deconvolution is possible (L-C Ingesson et al).