Quinnipiac Christie New Jersey Poll
11
FOR RELEASE: JANUARY 22, 2015 CLINTON, CHRISTIE LEAD PRIMARY PACKS IN NEW JERSEY, QUINNIPIAC UNIVERSITY POLL FINDS; BUT VOTERS SOUR ON GOV AS 2016 CANDIDATE New Jersey voters are staying local in the 2016 White House race, as Gov. Christopher Christie and former Secretary of State Hillary Clinton from neighboring New York both lead their respective presidential primary fields, according to a Quinnipiac University poll released today. But the prospect of a Gov. Christie presidential bid is unpopular with Garden State voters, who give Secretary Clinton a 52 – 39 percent lead over Christie in the main event, the independent Quinnipiac (KWIN-uh-pe-ack) University Poll finds. Christie leads the Republican primary pack with 24 percent, followed by 2012 standard- bearer Mitt Romney with 18 percent and former Florida Gov. Jeb Bush with 13 percent. No other candidate tops 6 percent and 14 percent are undecided. Clinton owns the Democratic primary with 65 percent of voters, followed by Massachusetts Sen. Elizabeth Warren with 11 percent and Vice President Joseph Biden with 7 percent. No other candidate tops 3 percent and 11 percent are undecided. “A year from now, we’ll be focused on the first presidential primary in New Hampshire. If New Jersey primary voters were to decide, it would be the Native Son, Gov. Christopher Christie, vs. the Girl Next Door, Hillary Clinton,” said Quinnipiac University Poll Assistant Director Maurice Carroll. “His home-state Republicans give the Gov a primary-election lead over two-time loser Mitt Romney and the other brother, former Florida Gov. Jeb Bush. “But the lady from across the Hudson River in Chappaqua continues to dominate presidential predictions in New Jersey. She rules the Democratic roost and leads all the Republicans – easily. “She has more than 50 percent against every one of the Republicans, including Christie.” -more- Maurice Carroll, Assistant Director, Quinnipiac University Poll (203) 582-5334 Rubenstein Associates, Inc. Public Relations Contact: Pat Smith (212) 843-8026
-
Upload
philadelphiamagazine -
Category
Documents
-
view
315 -
download
6
description
January 22, 2015 - Clinton, Christie Lead Primary Packs In New Jersey, Quinnipiac University Poll Finds; But Voters Sour On Gov As 2016 Candidate
Transcript of Quinnipiac Christie New Jersey Poll
FOR RELEASE: JANUARY 22, 2015
CLINTON, CHRISTIE LEAD PRIMARY PACKS IN NEW JERSEY,
QUINNIPIAC UNIVERSITY POLL FINDS;
BUT VOTERS SOUR ON GOV AS 2016 CANDIDATE
New Jersey voters are staying local in the 2016 White House race, as Gov. Christopher Christie
and former Secretary of State Hillary Clinton from neighboring New York both lead their
respective presidential primary fields, according to a Quinnipiac University poll released today.
But the prospect of a Gov. Christie presidential bid is unpopular with Garden State
voters, who give Secretary Clinton a 52 – 39 percent lead over Christie in the main event, the
independent Quinnipiac (KWIN-uh-pe-ack) University Poll finds.
Christie leads the Republican primary pack with 24 percent, followed by 2012 standard-
bearer Mitt Romney with 18 percent and former Florida Gov. Jeb Bush with 13 percent. No
other candidate tops 6 percent and 14 percent are undecided.
Clinton owns the Democratic primary with 65 percent of voters, followed by
Massachusetts Sen. Elizabeth Warren with 11 percent and Vice President Joseph Biden with 7
percent. No other candidate tops 3 percent and 11 percent are undecided.
“A year from now, we’ll be focused on the first presidential primary in New Hampshire.
If New Jersey primary voters were to decide, it would be the Native Son, Gov. Christopher
Christie, vs. the Girl Next Door, Hillary Clinton,” said Quinnipiac University Poll Assistant
Director Maurice Carroll. “His home-state Republicans give the Gov a primary-election lead
over two-time loser Mitt Romney and the other brother, former Florida Gov. Jeb Bush.
“But the lady from across the Hudson River in Chappaqua continues to dominate
presidential predictions in New Jersey. She rules the Democratic roost and leads all the
Republicans – easily.
“She has more than 50 percent against every one of the Republicans, including Christie.”
-more-
Maurice Carroll, Assistant Director,
Quinnipiac University Poll
(203) 582-5334
Rubenstein Associates, Inc.
Public Relations
Contact: Pat Smith (212) 843-8026
2
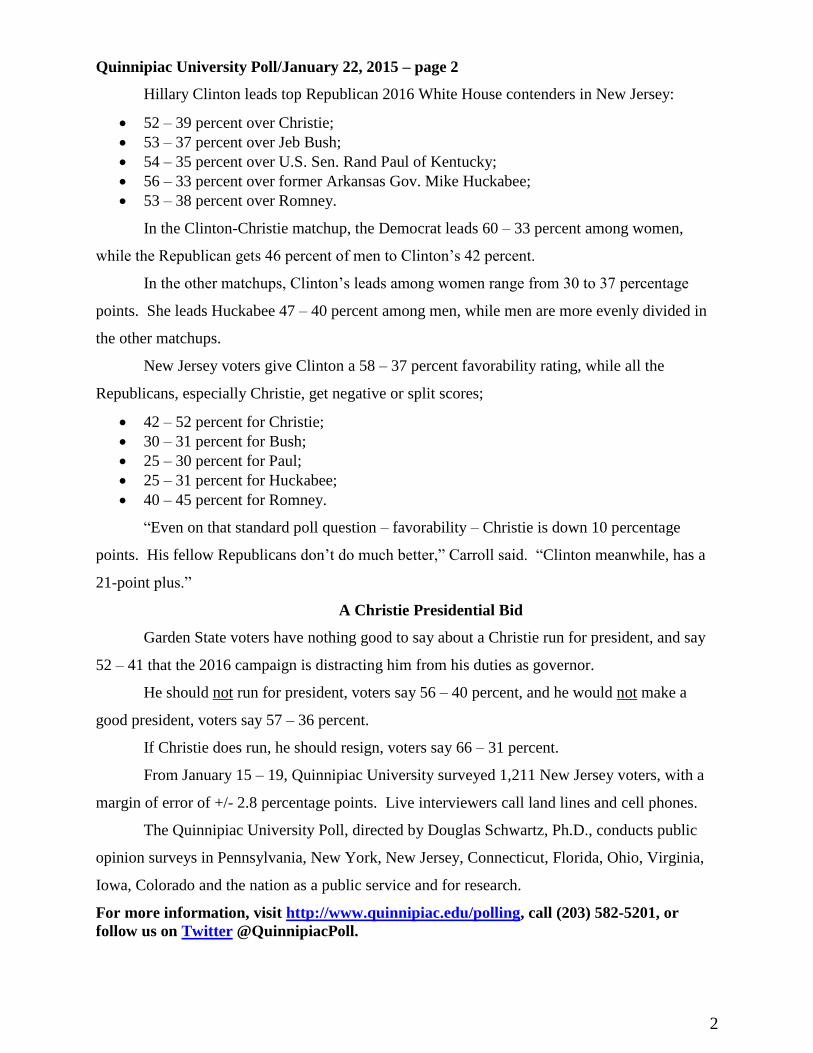
Quinnipiac University Poll/January 22, 2015 – page 2
Hillary Clinton leads top Republican 2016 White House contenders in New Jersey:
52 – 39 percent over Christie;
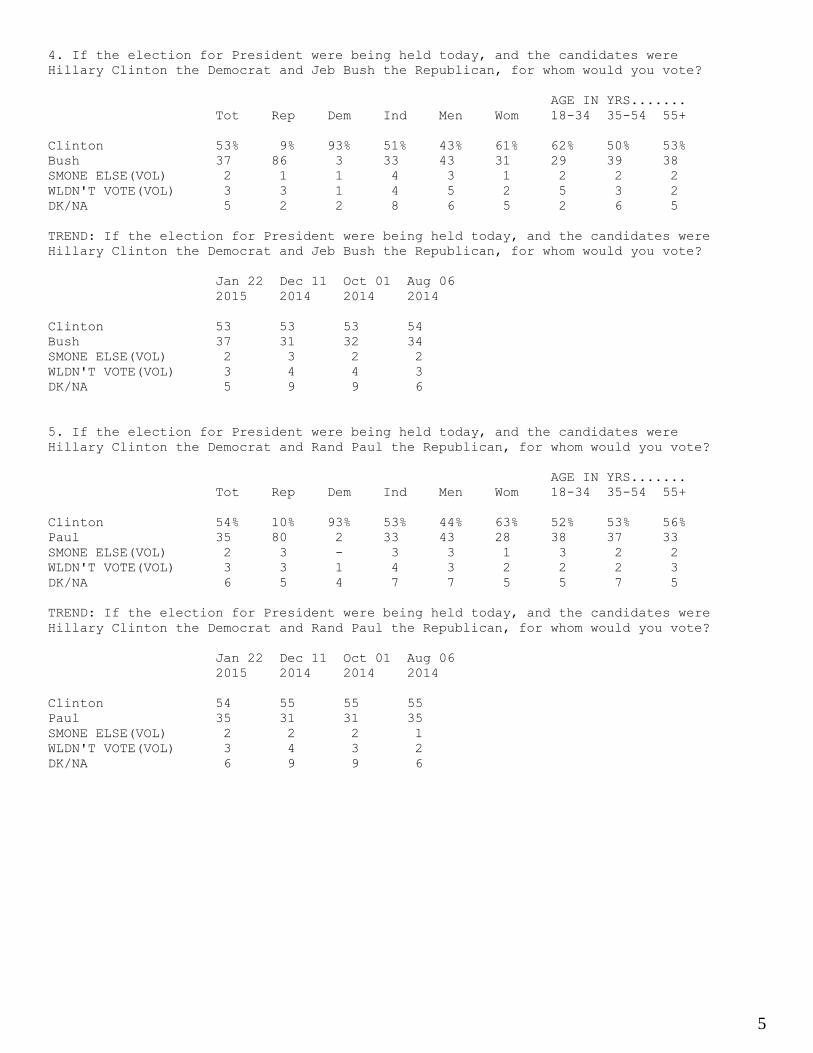
53 – 37 percent over Jeb Bush;
54 – 35 percent over U.S. Sen. Rand Paul of Kentucky;
56 – 33 percent over former Arkansas Gov. Mike Huckabee;
53 – 38 percent over Romney.
In the Clinton-Christie matchup, the Democrat leads 60 – 33 percent among women,
while the Republican gets 46 percent of men to Clinton’s 42 percent.
In the other matchups, Clinton’s leads among women range from 30 to 37 percentage
points. She leads Huckabee 47 – 40 percent among men, while men are more evenly divided in
the other matchups.
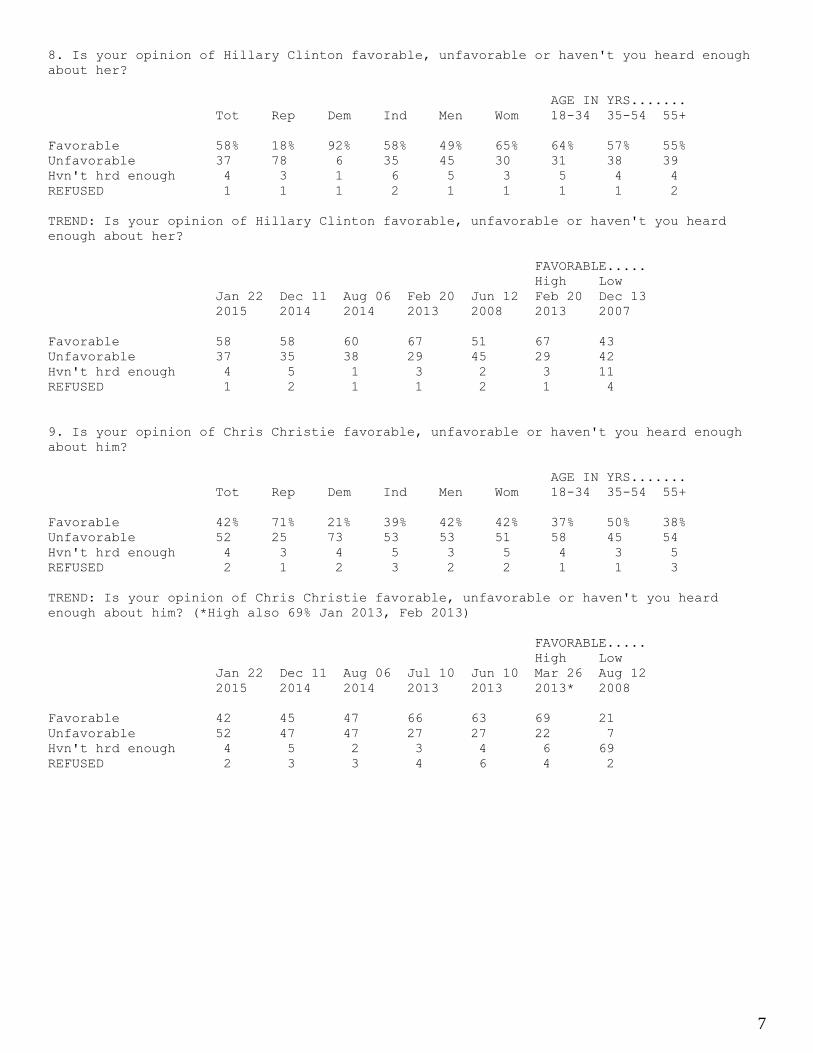
New Jersey voters give Clinton a 58 – 37 percent favorability rating, while all the
Republicans, especially Christie, get negative or split scores;
42 – 52 percent for Christie;
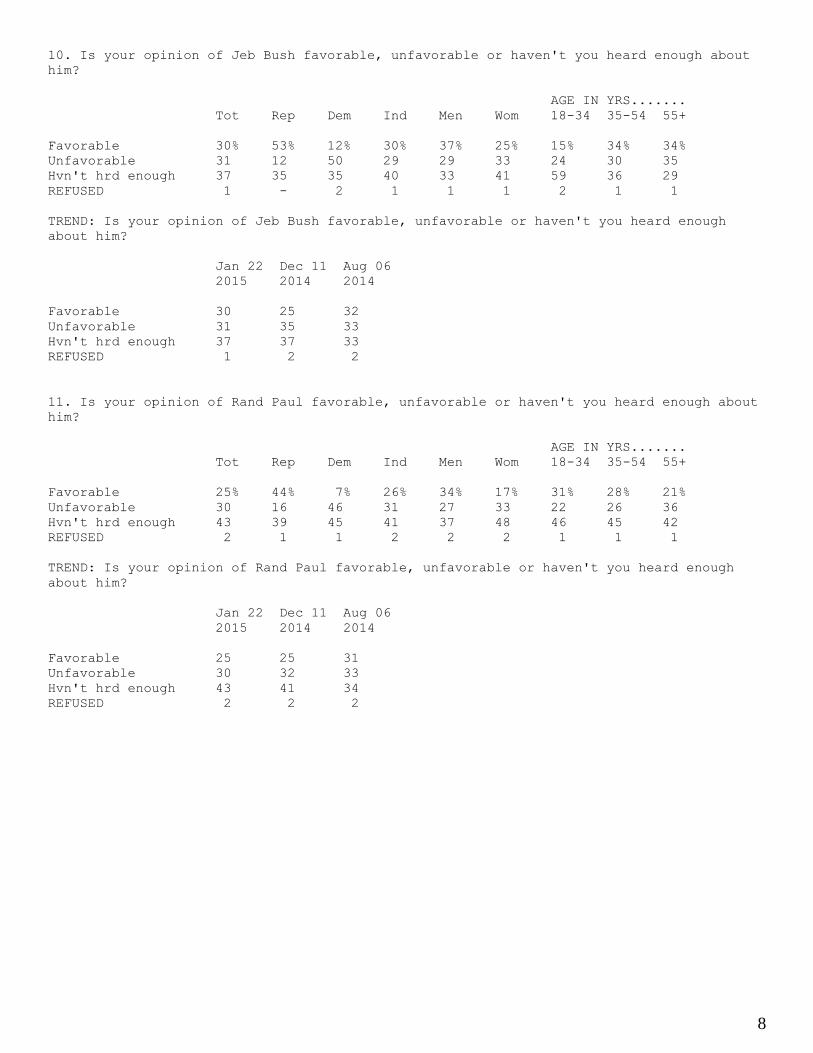
30 – 31 percent for Bush;
25 – 30 percent for Paul;
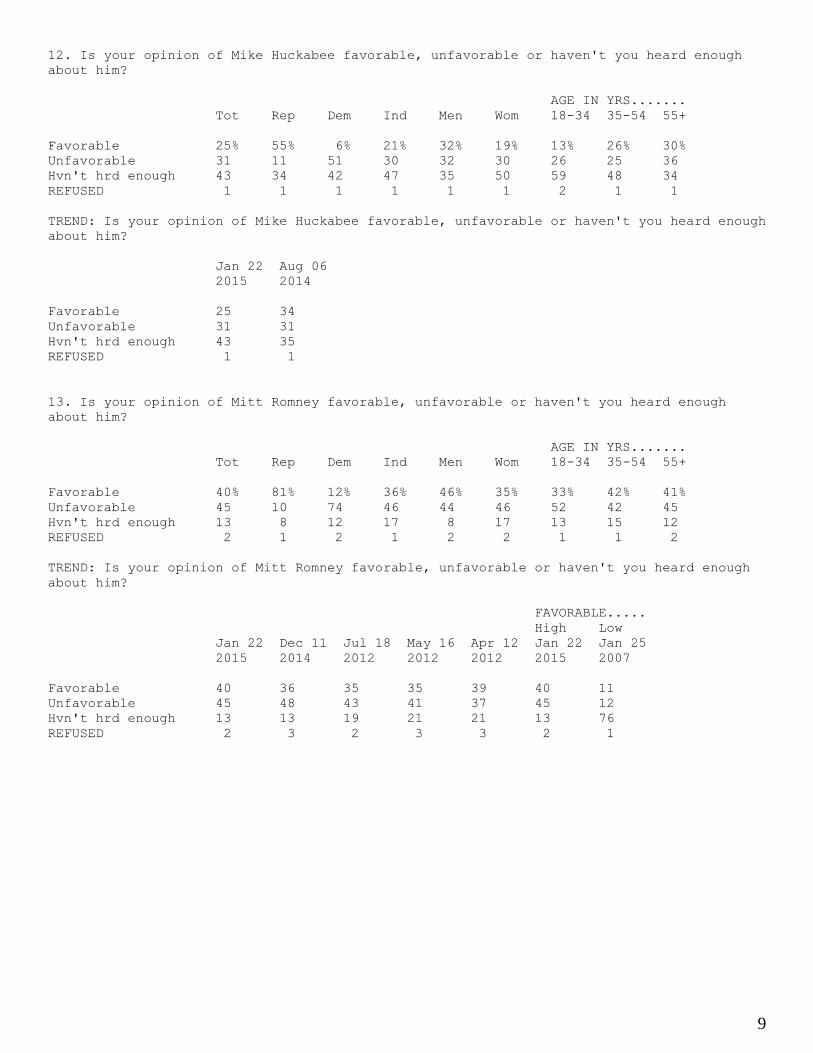
25 – 31 percent for Huckabee;
40 – 45 percent for Romney.
“Even on that standard poll question – favorability – Christie is down 10 percentage
points. His fellow Republicans don’t do much better,” Carroll said. “Clinton meanwhile, has a
21-point plus.”
A Christie Presidential Bid
Garden State voters have nothing good to say about a Christie run for president, and say
52 – 41 that the 2016 campaign is distracting him from his duties as governor.
He should not run for president, voters say 56 – 40 percent, and he would not make a
good president, voters say 57 – 36 percent.
If Christie does run, he should resign, voters say 66 – 31 percent.
From January 15 – 19, Quinnipiac University surveyed 1,211 New Jersey voters, with a
margin of error of +/- 2.8 percentage points. Live interviewers call land lines and cell phones.
The Quinnipiac University Poll, directed by Douglas Schwartz, Ph.D., conducts public
opinion surveys in Pennsylvania, New York, New Jersey, Connecticut, Florida, Ohio, Virginia,
Iowa, Colorado and the nation as a public service and for research.
For more information, visit http://www.quinnipiac.edu/polling, call (203) 582-5201, or
follow us on Twitter @QuinnipiacPoll.

3
1. (If Registered Republican) If the Republican primary for President were being held
today, and the candidates were, Jeb Bush, Ben Carson, Chris Christie, Ted Cruz,
Mike Huckabee, Bobby Jindal, John Kasich, Rand Paul, Rick Perry, Mitt Romney,
Marco Rubio, Rick Santorum and Scott Walker, for whom would you vote?
REGISTERED REPUBLICANS
Tot Men Wom
Bush 13% 17% 9%
Carson 6 7 4
Christie 24 26 22
Cruz 6 8 3
Huckabee 4 4 4
Jindal 2 2 1
Kasich - - 1
Paul 5 6 3
Perry 1 1 -
Romney 18 13 23
Rubio 3 2 4
Santorum - - -
Walker 4 6 3
SMONE ELSE(VOL) 1 1 1
WLDN'T VOTE(VOL) 1 1 -
DK/NA 14 7 22
1a. (If candidate chosen q1) Who is your second choice?
REGISTERED REPUBLICANS
CANDIDATE CHOSEN Q1
Tot Men Wom
Bush 12% 11% 13%
Carson 5 7 3
Christie 13 12 14
Cruz 4 3 5
Huckabee 5 4 6
Jindal 5 7 1
Kasich - - -
Paul 6 8 3
Perry 2 3 2
Romney 19 19 20
Rubio 8 6 10
Santorum 5 5 5
Walker 6 8 4
SMONE ELSE(VOL) - 1 -
WLDN'T VOTE(VOL) - - -
DK/NA 9 6 13
4
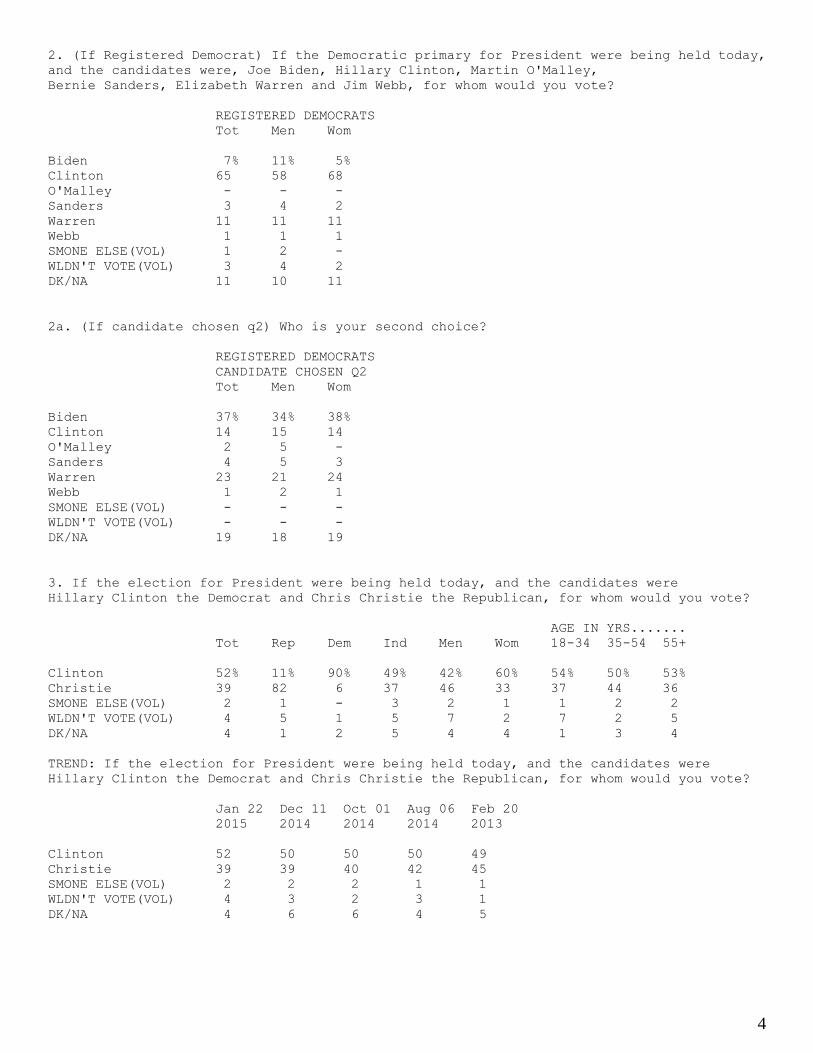
2. (If Registered Democrat) If the Democratic primary for President were being held today,
and the candidates were, Joe Biden, Hillary Clinton, Martin O'Malley,
Bernie Sanders, Elizabeth Warren and Jim Webb, for whom would you vote?
REGISTERED DEMOCRATS
Tot Men Wom
Biden 7% 11% 5%
Clinton 65 58 68
O'Malley - - -
Sanders 3 4 2
Warren 11 11 11
Webb 1 1 1
SMONE ELSE(VOL) 1 2 -
WLDN'T VOTE(VOL) 3 4 2
DK/NA 11 10 11
2a. (If candidate chosen q2) Who is your second choice?
REGISTERED DEMOCRATS
CANDIDATE CHOSEN Q2
Tot Men Wom
Biden 37% 34% 38%
Clinton 14 15 14
O'Malley 2 5 -
Sanders 4 5 3
Warren 23 21 24
Webb 1 2 1
SMONE ELSE(VOL) - - -
WLDN'T VOTE(VOL) - - -
DK/NA 19 18 19
3. If the election for President were being held today, and the candidates were
Hillary Clinton the Democrat and Chris Christie the Republican, for whom would you vote?
AGE IN YRS.......
Tot Rep Dem Ind Men Wom 18-34 35-54 55+
Clinton 52% 11% 90% 49% 42% 60% 54% 50% 53%
Christie 39 82 6 37 46 33 37 44 36
SMONE ELSE(VOL) 2 1 - 3 2 1 1 2 2
WLDN'T VOTE(VOL) 4 5 1 5 7 2 7 2 5
DK/NA 4 1 2 5 4 4 1 3 4
TREND: If the election for President were being held today, and the candidates were
Hillary Clinton the Democrat and Chris Christie the Republican, for whom would you vote?
Jan 22 Dec 11 Oct 01 Aug 06 Feb 20
2015 2014 2014 2014 2013
Clinton 52 50 50 50 49
Christie 39 39 40 42 45
SMONE ELSE(VOL) 2 2 2 1 1
WLDN'T VOTE(VOL) 4 3 2 3 1
DK/NA 4 6 6 4 5
5
4. If the election for President were being held today, and the candidates were
Hillary Clinton the Democrat and Jeb Bush the Republican, for whom would you vote?
AGE IN YRS.......
Tot Rep Dem Ind Men Wom 18-34 35-54 55+
Clinton 53% 9% 93% 51% 43% 61% 62% 50% 53%
Bush 37 86 3 33 43 31 29 39 38
SMONE ELSE(VOL) 2 1 1 4 3 1 2 2 2
WLDN'T VOTE(VOL) 3 3 1 4 5 2 5 3 2
DK/NA 5 2 2 8 6 5 2 6 5
TREND: If the election for President were being held today, and the candidates were
Hillary Clinton the Democrat and Jeb Bush the Republican, for whom would you vote?
Jan 22 Dec 11 Oct 01 Aug 06
2015 2014 2014 2014
Clinton 53 53 53 54
Bush 37 31 32 34
SMONE ELSE(VOL) 2 3 2 2
WLDN'T VOTE(VOL) 3 4 4 3
DK/NA 5 9 9 6
5. If the election for President were being held today, and the candidates were
Hillary Clinton the Democrat and Rand Paul the Republican, for whom would you vote?
AGE IN YRS.......
Tot Rep Dem Ind Men Wom 18-34 35-54 55+
Clinton 54% 10% 93% 53% 44% 63% 52% 53% 56%
Paul 35 80 2 33 43 28 38 37 33
SMONE ELSE(VOL) 2 3 - 3 3 1 3 2 2
WLDN'T VOTE(VOL) 3 3 1 4 3 2 2 2 3
DK/NA 6 5 4 7 7 5 5 7 5
TREND: If the election for President were being held today, and the candidates were
Hillary Clinton the Democrat and Rand Paul the Republican, for whom would you vote?
Jan 22 Dec 11 Oct 01 Aug 06
2015 2014 2014 2014
Clinton 54 55 55 55
Paul 35 31 31 35
SMONE ELSE(VOL) 2 2 2 1
WLDN'T VOTE(VOL) 3 4 3 2
DK/NA 6 9 9 6

6
6. If the election for President were being held today, and the candidates were
Hillary Clinton the Democrat and Mike Huckabee the Republican, for whom would you vote?
AGE IN YRS.......
Tot Rep Dem Ind Men Wom 18-34 35-54 55+
Clinton 56% 13% 94% 57% 47% 64% 62% 56% 55%
Huckabee 33 79 2 27 40 27 26 35 34
SMONE ELSE(VOL) 2 3 - 4 3 2 3 1 3
WLDN'T VOTE(VOL) 3 3 1 5 4 2 5 3 2
DK/NA 5 3 2 7 6 5 4 4 6
TREND: If the election for President were being held today, and the candidates were
Hillary Clinton the Democrat and Mike Huckabee the Republican, for whom would you vote?
Jan 22 Aug 06
2015 2014
Clinton 56 57
Huckabee 33 34
SMONE ELSE(VOL) 2 2
WLDN'T VOTE(VOL) 3 3
DK/NA 5 4
7. If the election for President were being held today, and the candidates were
Hillary Clinton the Democrat and Mitt Romney the Republican, for whom would you vote?
AGE IN YRS.......
Tot Rep Dem Ind Men Wom 18-34 35-54 55+
Clinton 53% 6% 95% 51% 43% 62% 58% 52% 53%
Romney 38 88 2 35 45 32 33 40 39
SMONE ELSE(VOL) 1 1 - 3 2 1 2 1 1
WLDN'T VOTE(VOL) 3 2 2 5 5 2 5 2 3
DK/NA 4 2 1 7 5 4 1 5 4
TREND: If the election for President were being held today, and the candidates were
Hillary Clinton the Democrat and Mitt Romney the Republican, for whom would you vote?
Jan 22 Dec 11 Sep 26 Apr 19 Jan 25
2015 2014 2007 2007 2007
Clinton 53 52 52 50 53
Romney 38 35 33 31 29
SMONE ELSE(VOL) 1 3 3 3 2
WLDN'T VOTE(VOL) 3 3 5 3 3
DK/NA 4 6 7 12 13
7
8. Is your opinion of Hillary Clinton favorable, unfavorable or haven't you heard enough
about her?
AGE IN YRS.......
Tot Rep Dem Ind Men Wom 18-34 35-54 55+
Favorable 58% 18% 92% 58% 49% 65% 64% 57% 55%
Unfavorable 37 78 6 35 45 30 31 38 39
Hvn't hrd enough 4 3 1 6 5 3 5 4 4
REFUSED 1 1 1 2 1 1 1 1 2
TREND: Is your opinion of Hillary Clinton favorable, unfavorable or haven't you heard
enough about her?
FAVORABLE.....
High Low
Jan 22 Dec 11 Aug 06 Feb 20 Jun 12 Feb 20 Dec 13
2015 2014 2014 2013 2008 2013 2007
Favorable 58 58 60 67 51 67 43
Unfavorable 37 35 38 29 45 29 42
Hvn't hrd enough 4 5 1 3 2 3 11
REFUSED 1 2 1 1 2 1 4
9. Is your opinion of Chris Christie favorable, unfavorable or haven't you heard enough
about him?
AGE IN YRS.......
Tot Rep Dem Ind Men Wom 18-34 35-54 55+
Favorable 42% 71% 21% 39% 42% 42% 37% 50% 38%
Unfavorable 52 25 73 53 53 51 58 45 54
Hvn't hrd enough 4 3 4 5 3 5 4 3 5
REFUSED 2 1 2 3 2 2 1 1 3
TREND: Is your opinion of Chris Christie favorable, unfavorable or haven't you heard
enough about him? (*High also 69% Jan 2013, Feb 2013)
FAVORABLE.....
High Low
Jan 22 Dec 11 Aug 06 Jul 10 Jun 10 Mar 26 Aug 12
2015 2014 2014 2013 2013 2013* 2008
Favorable 42 45 47 66 63 69 21
Unfavorable 52 47 47 27 27 22 7
Hvn't hrd enough 4 5 2 3 4 6 69
REFUSED 2 3 3 4 6 4 2
8
10. Is your opinion of Jeb Bush favorable, unfavorable or haven't you heard enough about
him?
AGE IN YRS.......
Tot Rep Dem Ind Men Wom 18-34 35-54 55+
Favorable 30% 53% 12% 30% 37% 25% 15% 34% 34%
Unfavorable 31 12 50 29 29 33 24 30 35
Hvn't hrd enough 37 35 35 40 33 41 59 36 29
REFUSED 1 - 2 1 1 1 2 1 1
TREND: Is your opinion of Jeb Bush favorable, unfavorable or haven't you heard enough
about him?
Jan 22 Dec 11 Aug 06
2015 2014 2014
Favorable 30 25 32
Unfavorable 31 35 33
Hvn't hrd enough 37 37 33
REFUSED 1 2 2
11. Is your opinion of Rand Paul favorable, unfavorable or haven't you heard enough about
him?
AGE IN YRS.......
Tot Rep Dem Ind Men Wom 18-34 35-54 55+
Favorable 25% 44% 7% 26% 34% 17% 31% 28% 21%
Unfavorable 30 16 46 31 27 33 22 26 36
Hvn't hrd enough 43 39 45 41 37 48 46 45 42
REFUSED 2 1 1 2 2 2 1 1 1
TREND: Is your opinion of Rand Paul favorable, unfavorable or haven't you heard enough
about him?
Jan 22 Dec 11 Aug 06
2015 2014 2014
Favorable 25 25 31
Unfavorable 30 32 33
Hvn't hrd enough 43 41 34
REFUSED 2 2 2
9
12. Is your opinion of Mike Huckabee favorable, unfavorable or haven't you heard enough
about him?
AGE IN YRS.......
Tot Rep Dem Ind Men Wom 18-34 35-54 55+
Favorable 25% 55% 6% 21% 32% 19% 13% 26% 30%
Unfavorable 31 11 51 30 32 30 26 25 36
Hvn't hrd enough 43 34 42 47 35 50 59 48 34
REFUSED 1 1 1 1 1 1 2 1 1
TREND: Is your opinion of Mike Huckabee favorable, unfavorable or haven't you heard enough
about him?
Jan 22 Aug 06
2015 2014
Favorable 25 34
Unfavorable 31 31
Hvn't hrd enough 43 35
REFUSED 1 1
13. Is your opinion of Mitt Romney favorable, unfavorable or haven't you heard enough
about him?
AGE IN YRS.......
Tot Rep Dem Ind Men Wom 18-34 35-54 55+
Favorable 40% 81% 12% 36% 46% 35% 33% 42% 41%
Unfavorable 45 10 74 46 44 46 52 42 45
Hvn't hrd enough 13 8 12 17 8 17 13 15 12
REFUSED 2 1 2 1 2 2 1 1 2
TREND: Is your opinion of Mitt Romney favorable, unfavorable or haven't you heard enough
about him?
FAVORABLE.....
High Low
Jan 22 Dec 11 Jul 18 May 16 Apr 12 Jan 22 Jan 25
2015 2014 2012 2012 2012 2015 2007
Favorable 40 36 35 35 39 40 11
Unfavorable 45 48 43 41 37 45 12
Hvn't hrd enough 13 13 19 21 21 13 76
REFUSED 2 3 2 3 3 2 1
10
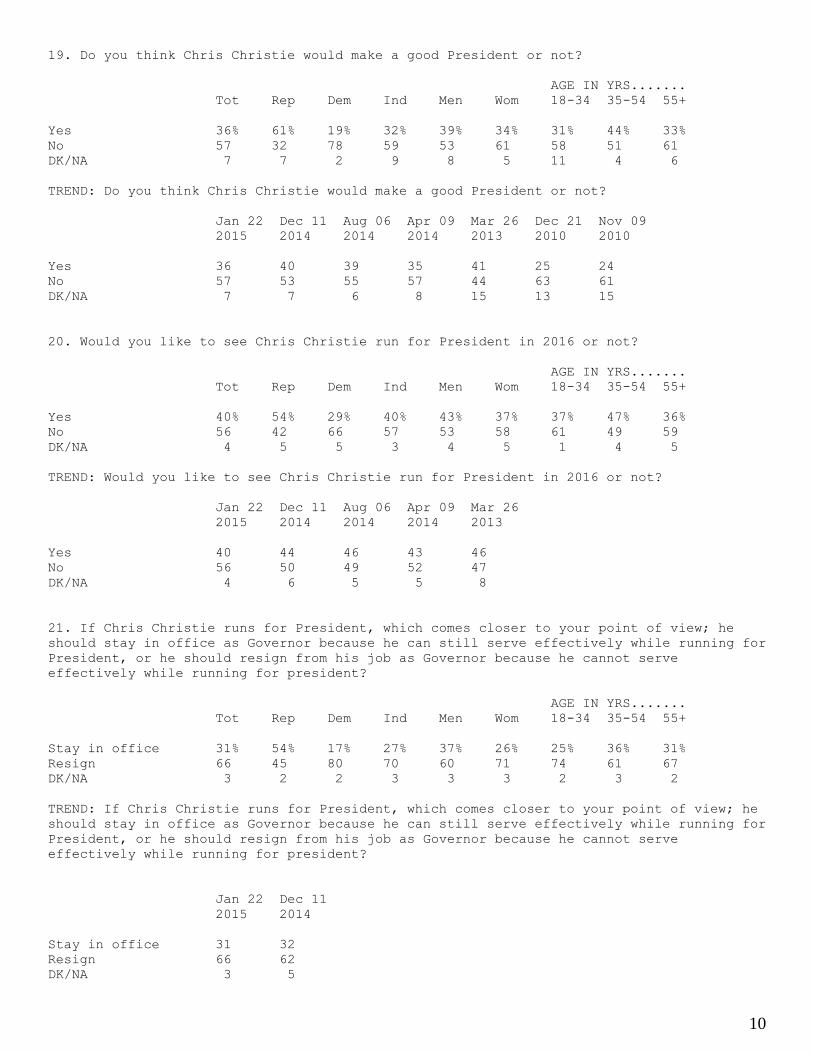
19. Do you think Chris Christie would make a good President or not?
AGE IN YRS.......
Tot Rep Dem Ind Men Wom 18-34 35-54 55+
Yes 36% 61% 19% 32% 39% 34% 31% 44% 33%
No 57 32 78 59 53 61 58 51 61
DK/NA 7 7 2 9 8 5 11 4 6
TREND: Do you think Chris Christie would make a good President or not?
Jan 22 Dec 11 Aug 06 Apr 09 Mar 26 Dec 21 Nov 09
2015 2014 2014 2014 2013 2010 2010
Yes 36 40 39 35 41 25 24
No 57 53 55 57 44 63 61
DK/NA 7 7 6 8 15 13 15
20. Would you like to see Chris Christie run for President in 2016 or not?
AGE IN YRS.......
Tot Rep Dem Ind Men Wom 18-34 35-54 55+
Yes 40% 54% 29% 40% 43% 37% 37% 47% 36%
No 56 42 66 57 53 58 61 49 59
DK/NA 4 5 5 3 4 5 1 4 5
TREND: Would you like to see Chris Christie run for President in 2016 or not?
Jan 22 Dec 11 Aug 06 Apr 09 Mar 26
2015 2014 2014 2014 2013
Yes 40 44 46 43 46
No 56 50 49 52 47
DK/NA 4 6 5 5 8
21. If Chris Christie runs for President, which comes closer to your point of view; he
should stay in office as Governor because he can still serve effectively while running for
President, or he should resign from his job as Governor because he cannot serve
effectively while running for president?
AGE IN YRS.......
Tot Rep Dem Ind Men Wom 18-34 35-54 55+
Stay in office 31% 54% 17% 27% 37% 26% 25% 36% 31%
Resign 66 45 80 70 60 71 74 61 67
DK/NA 3 2 2 3 3 3 2 3 2
TREND: If Chris Christie runs for President, which comes closer to your point of view; he
should stay in office as Governor because he can still serve effectively while running for
President, or he should resign from his job as Governor because he cannot serve
effectively while running for president?
Jan 22 Dec 11
2015 2014
Stay in office 31 32
Resign 66 62
DK/NA 3 5

11
29. Do you think the 2016 presidential campaign is or is not distracting Chris Christie
from his duties as governor?
AGE IN YRS.......
Tot Rep Dem Ind Men Wom 18-34 35-54 55+
Distracting 52% 37% 60% 55% 53% 51% 60% 42% 56%
Not distracting 41 59 28 38 41 40 31 52 37
DK/NA 7 3 12 7 5 9 8 6 7