Quickscan Fokker Services (Casper Sterkman)
63
LOGISTICAL IMPACT OF ADDITIVE MANUFACTURING ON THE AFTER-SALES SERVICE SUPPLY CHAIN AT FOKKER SERVICES B.V. BACHELOR THESIS INDUSTRIAL ENGINEERING AND MANAGEMENT, UNIVERSITY OF TWENTE July 2015 Casper Sterkman S1366807 Supervisors: - Dr. M.C. (Matthieu) van der Heijden (University of Twente) - K. Alizadeh (Fokker Services, Product Manager) - N. Knofius (University of Twente) In collaboration with: Fokker Services: - M. Samsom (Obsolescence Engineer) - V. van Vliet (Reliability Engineer) - M. Bunck (Business Analyst) - J. Boot (Category Manager Manufacturing) - K. Bouwma (Design Engineer ELAV) - R. Casteel (System Engineer STRUCT) - F. Tol (Production & Maintenance Engineer) - R. Huisman (Airworthiness) DEPARTMENT OF INDUSTRIAL ENGINEERING AND BUSINESS INFORMATION SYSTEMS
-
Upload
sintas -
Category
Technology
-
view
42 -
download
0
Transcript of Quickscan Fokker Services (Casper Sterkman)
L O G I S T I C A L I M P A C T O F A D D I T I V E M A N U F A C T U R I N G O N T H E A F T E R - S A L E S
S E R V I C E S U P P L Y C H A I N A T F O K K E R S E R V I C E S B . V .
BACHELOR THESIS INDUSTRIAL ENGINEERING AND MANAGEMENT, UNIVERSITY OF TWENTE
July 2015
Casper Sterkman S1366807
Supervisors: - Dr. M.C. (Matthieu) van der Heijden (University of Twente) - K. Alizadeh (Fokker Services, Product Manager) - N. Knofius (University of Twente)
In collaboration with: Fokker Services: - M. Samsom (Obsolescence Engineer) - V. van Vliet (Reliability Engineer) - M. Bunck (Business Analyst) - J. Boot (Category Manager Manufacturing) - K. Bouwma (Design Engineer ELAV) - R. Casteel (System Engineer STRUCT) - F. Tol (Production & Maintenance Engineer) - R. Huisman (Airworthiness)
DEPARTMENT OF INDUSTRIAL ENGINEERING AND BUSINESS INFORMATION SYSTEMS
2
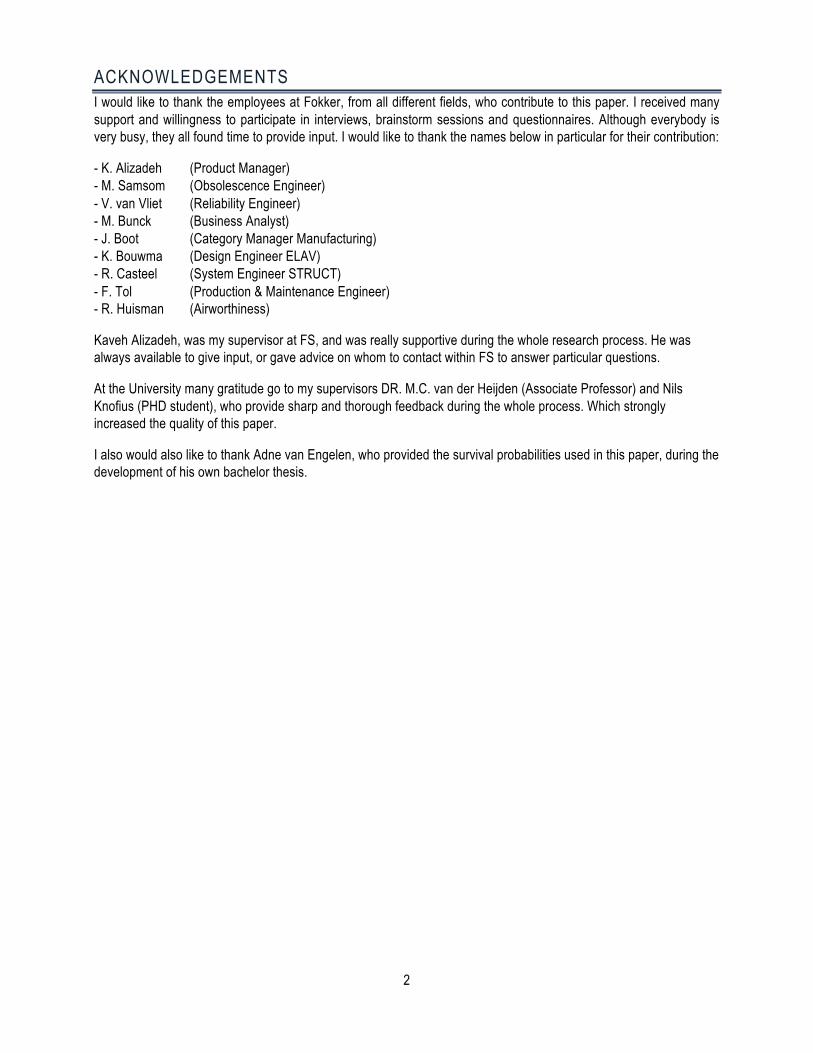
ACKNOWLEDGEMENTS I would like to thank the employees at Fokker, from all different fields, who contribute to this paper. I received many support and willingness to participate in interviews, brainstorm sessions and questionnaires. Although everybody is very busy, they all found time to provide input. I would like to thank the names below in particular for their contribution:
- K. Alizadeh (Product Manager) - M. Samsom (Obsolescence Engineer) - V. van Vliet (Reliability Engineer) - M. Bunck (Business Analyst) - J. Boot (Category Manager Manufacturing) - K. Bouwma (Design Engineer ELAV) - R. Casteel (System Engineer STRUCT) - F. Tol (Production & Maintenance Engineer) - R. Huisman (Airworthiness)
Kaveh Alizadeh, was my supervisor at FS, and was really supportive during the whole research process. He was always available to give input, or gave advice on whom to contact within FS to answer particular questions.
At the University many gratitude go to my supervisors DR. M.C. van der Heijden (Associate Professor) and Nils Knofius (PHD student), who provide sharp and thorough feedback during the whole process. Which strongly increased the quality of this paper.
I also would also like to thank Adne van Engelen, who provided the survival probabilities used in this paper, during the development of his own bachelor thesis.
3
MANAGEMENT SUMMARY This paper is part of a project that started in autumn 2014 called “Sustainability Impact of New Technology on After-sales service Supply chains” (SINTAS). The project focuses on the impact that Additive Manufacturing can have on the after sales services supply chains. Additive Manufacturing (AM) technologies have developed in recent years and start to become a serious alternative for conventional production techniques. New opportunities in the application of these technologies arise. This paper supports the first phase of this SINTAS project to conduct a quick scan at different companies to identify where these new opportunities can be applied. The host company for this paper is Fokker Services. The research question is therefore:
How and for which spare parts could additive manufacturing change the after sales services at Fokker Services B.V. to reduce cost?
Fokker Services B.V. is a business unit of the company Fokker Technologies. Fokker Services (FS) focuses on the delivery of spare parts, lease programs, and conversions & repairs of namely aircraft of the old Fokker fleet.
Industrial AM has become a mature technology that is expected to growth rapidly the coming years. It finds itself at the brink of mass application as supported by the Gartner Hype Cycle (Hart, 2013) and Technology Adoption Cycle (Mellor, 2014). The technology recently became suitable for high quality metal and plastic end products.
According to the ASTM (American Society for Testing and Materials), there are 7 different AM process: Power Bed Fusion, Directed Energy Deposition, Material Jetting, Binder Jetting, Material extrusion, Vat Photopolymerization and Sheet Lamination. The most suitable AM technology for FS for metal parts is SLM/DMLS, for plastic parts SLS. This is because of their good material properties and precision. Both technologies are based on the Powder Bed Fusion process.
At this moment, AM can better be outsourced. This is more favourable because: AM machines are still expensive, low utilization cannot justify these investment costs, rapid technology developments are expected and there will be need for specialised personnel. Besides this, there are already resellers that have obtained the right certifications for application in the aerospace industry (AS9100).
According to the literature study conducted during this research, the most important advantages of AM are: low setup cost, less indirect cost, mass customization, complex design, weight reduction, part consolidation, shorter lead time, sustainability and decentralization. There are also still some limitations: high production costs compared to mass production, limited materials, limited material quality, slow build speed, limited dimensions. The advantages lead to four major areas in the after sales services of FS were AM could be applied:
1 Obsolescence problem: When an order is received, but the original vendor or original production method is not available anymore, FS is still determined to fulfill the remaining demand anyway. AM can provide a cost effective alternative production method, due to its relatively low setup costs and suitability for low volume production.
2 Production Alternative: Most spare parts sold were designed for high volume production. Due to the suitability of AM for low quantities, limited setup costs, less warehousing cost and tooling cost, AM can provide an economical sensible alternative for the current production of some parts.
3 Part consolidation: After the first parts are successfully produced using AM, part consolidation should be the next step. The number of piece parts in an assembly can be reduced significantly when redesigned for AM. This results in a reduction of material and assembly costs, and a potential weight reduction.
4 Decentralization: In the far future in is expected that airline operators will invest in AM solutions themselves. In such a market environment FS could explore new business models in which digital drawings are sold instead of physical products.
4
For application area ‘2’ (Production Alternative) a data-selection model is built, to select parts that can be an economical sensible production alternative. This process is conducted in three phases: 1. Data Cleaning, 2. Data Scoring and 3. Manual Evaluation.
1 The Data Cleaning resulted in 6190 PPPT parts (design owned by Fokker) that appear likely to favor AM. 2 Using 9 criteria all these 6190 parts were scored on a scale from 0 to 1, parts that receive a score of 0,6 or
higher (235 parts) have attributes that strongly favor AM and are therefore likely to provide a positive business case.
3 15 Of those parts were manually analyzed, 4 of which are suitable to print and very likely to be economical sensible alternatives.
Out of those 4 recommended parts, a metal ‘Fittting Stud’ and plastic ‘Clip’ were selected for a business case. The recurring costs of AM is for both parts significantly lower than the conventional production method: 490,00 vs 57,41 Euro (Fitting Stud) & 322,00 vs 6,40 Euro (Clip). Although this price does not include the additional certification and design cost that should be made, this large difference in costs provides the opportunity to still be a sensible solution when those additional costs incur. AM can also reduce lead-times and inventory levels, which result in an additional cost savings that favor AM application. In the two business cases for example, the lead-time can be reduced from 26 days, to just 7 days. Only 15 of the 235 ‘very interesting parts’ were analyzed manually in this research. This already provided 4 parts that are suitable to print and are likely to provide a positive business case. When this manual evaluation will conducted for the other 220 parts, it is very likely a lot more suitable parts will be found and significant savings can be made. This project has proven that it is likely that AM can be used as an economically sensible production alternative. Besides that, it provides an efficient, analytical tool to identify the parts for which sensible alternatives can be achieved. Three other application areas are also identified where AM can be beneficial for FS.
Some further research is recommended to ensure successful AM application at FS:
1. Start printing some selected parts to acquire more ‘first hand’ experience with AM. 2. Start a research project with a ‘bottom up’ approach to analyze AM application for obsolescence problems. 3. Acquire more experience with the certification of production alternatives (like AM). 4. Explore the possibilities of redesigns for AM to enable part consolidation and weight reduction. 5. Start 5 years from now a research project to analyze if decentralization (AM machines at airline operators)
could lead to new business models.
5
TABLE OF CONTENTS Acknowledgements ............................................................................................................................... 2
Management Summary ......................................................................................................................... 3
Table of Contents .................................................................................................................................. 5
List of Abbreviations .............................................................................................................................. 7
1. Introduction ...................................................................................................................................... 8 1.1 Problem Definition .............................................................................................................................. 8 1.2 Research Approach ............................................................................................................................. 8 1.3 Research Scope .................................................................................................................................... 9
2. Fokker Services and Industry ........................................................................................................... 10 2.1 Organizational Structure ................................................................................................................... 10 2.2 Certification ....................................................................................................................................... 11 2.3 Conclusion Chapter 2 ......................................................................................................................... 11
3. Additive Manufacturing ................................................................................................................... 12 3.1 AM Current State & Examples ........................................................................................................... 12 3.2 AM Advantages & Challenges ........................................................................................................... 13
3.2.1 Advantages ................................................................................................................................. 13 3.2.2 Challenges .................................................................................................................................. 14
3.3 AM Technologies ............................................................................................................................... 16 3.3.1 Powder Bed Fusion ..................................................................................................................... 16 3.3.2 Directed Energy Deposition ....................................................................................................... 16 3.3.3 Material Jetting .......................................................................................................................... 16 3.3.4 Binder Jetting ............................................................................................................................. 16 3.3.5 Material Extrusion ...................................................................................................................... 16 3.3.6 Vat Photopolymerization ........................................................................................................... 16 3.3.7 Sheet Lamination ....................................................................................................................... 17 3.3.8 Comparison ................................................................................................................................ 17
3.4 AM Design ......................................................................................................................................... 17 3.5 Conclusion Chapter 3 ......................................................................................................................... 17
4. Application at Fokker ....................................................................................................................... 19 4.1 AM Opportunities For Fokker Services .............................................................................................. 19
4.1.1 Obsolescence problem (today) .................................................................................................. 19 4.1.2 Production Alternative (today) .................................................................................................. 19 4.1.3 Part Redesign (short term future) .............................................................................................. 19 4.1.4 Decentraliazation (long term future) ......................................................................................... 19 4.1.5 Additional Advantages AM ......................................................................................................... 20
4.2 Preferred AM Technology .................................................................................................................. 20 4.3 Conclusion Chapter 4 ......................................................................................................................... 20
5. Spare part selection ......................................................................................................................... 22 5.1 Data-‐Cleaning (phase 1) .................................................................................................................... 22 5.2 Data-‐Scoring (phase 2) ...................................................................................................................... 24
5.2.1 Identify the decision-‐makers ...................................................................................................... 24
6
5.2.2 Identify the issue of issues ......................................................................................................... 24 5.2.3 Identify the Alternatives ............................................................................................................. 24 5.2.4 Identify the criteria .................................................................................................................... 24 5.2.5 Assign values for Each criterion ................................................................................................. 25 5.2.6 Determine the weight of each of the criteria ............................................................................. 29 5.2.7 Calculate a weighted average of the values assigned to each alternative ................................. 30 5.2.8 Make a provisional decision ....................................................................................................... 30 5.2.9 Perform sensitivity analysis ........................................................................................................ 31
5.3 Manual Evaluation (phase 3) ............................................................................................................ 32 5.3.1 Technological Feasibility ............................................................................................................ 32 5.3.2 Economical Viability ................................................................................................................... 32
5.4 Conclusion Chapter 5 ......................................................................................................................... 33
6. Case Study ....................................................................................................................................... 34 6.1 Fitting Stud, Safety Strap (D20496-‐001) ............................................................................................ 34
6.1.1 Technological Feasibility ............................................................................................................ 35 6.1.2 Economical Viability ................................................................................................................... 35
6.2 Clip in Access hatch (D28198-‐031) .................................................................................................... 36 6.2.1 Technological Feasibility ............................................................................................................ 36 6.2.2 Economical Viability ................................................................................................................... 37
6.3 Logistical Impact Business cases ....................................................................................................... 37 6.4 Conclusion Chapter 6 ......................................................................................................................... 38
7. Conclusions ..................................................................................................................................... 39
8. Futher Research ............................................................................................................................... 40
Bibliography ........................................................................................................................................ 41
Appendix ............................................................................................................................................. 44 A: Organizational chart and processes .................................................................................................... 44 B: Minor / Major Classification ............................................................................................................... 46 C: Techniques explained .......................................................................................................................... 47 D: Keyword Y/N (1/2) .............................................................................................................................. 50 E: ATA Chapters and Scores ..................................................................................................................... 52 F: Scorings Table results .......................................................................................................................... 53 G: Sensitivity Analysis .............................................................................................................................. 54
G1: Score Distributions: ...................................................................................................................... 54 G2: Weight Sensitifiy graphs: .............................................................................................................. 55
H: Cost Breakdown AM ........................................................................................................................... 56 I: Industry Prices EOS ............................................................................................................................... 57 J: Manual Evalution ................................................................................................................................. 58 K: Fitting Stud, Safety Strap (D20496-‐001) #30 ....................................................................................... 59
K1: Visualisation .................................................................................................................................. 59 K2: Technical drawing ......................................................................................................................... 60
L: Clip in Access hatch (D28198-‐031) ...................................................................................................... 61 L1: Visualisation .................................................................................................................................. 61 L2: Technical Drawing ......................................................................................................................... 62
M: Vendor Lists FS ................................................................................................................................... 63
7
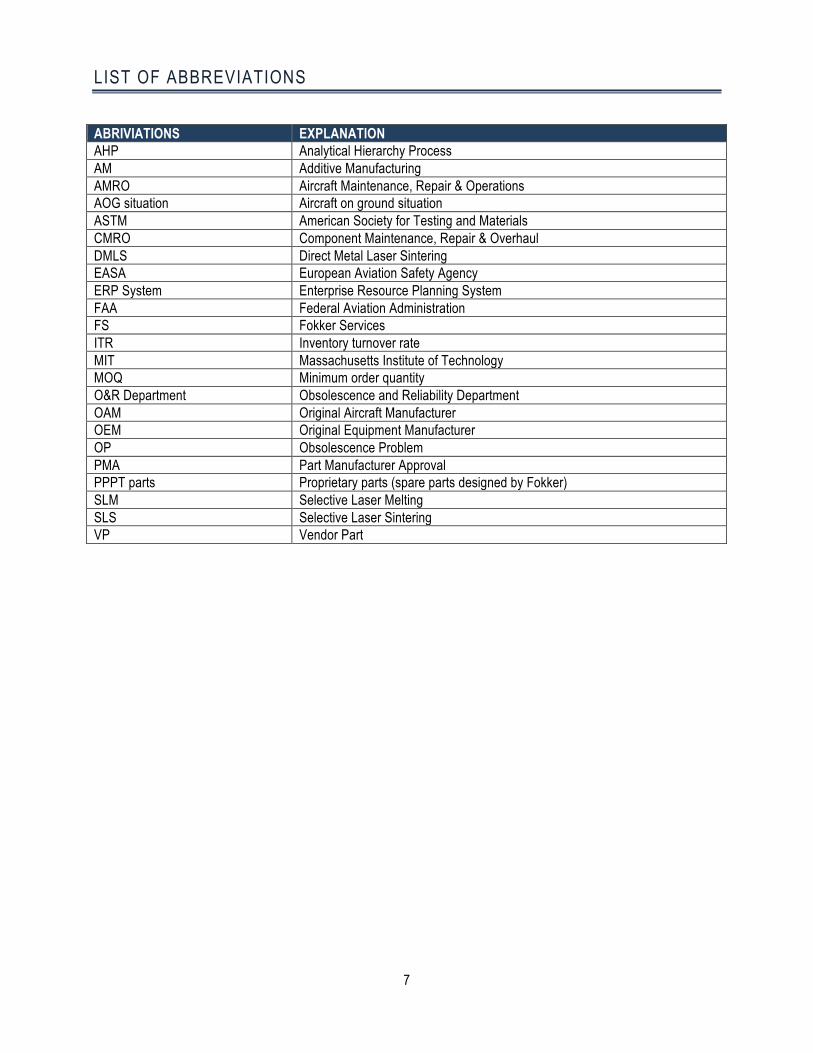
LIST OF ABBREVIATIONS
ABRIVIATIONS EXPLANATION AHP Analytical Hierarchy Process AM Additive Manufacturing AMRO Aircraft Maintenance, Repair & Operations AOG situation Aircraft on ground situation ASTM American Society for Testing and Materials CMRO Component Maintenance, Repair & Overhaul DMLS Direct Metal Laser Sintering EASA European Aviation Safety Agency ERP System Enterprise Resource Planning System FAA Federal Aviation Administration FS Fokker Services ITR Inventory turnover rate MIT Massachusetts Institute of Technology MOQ Minimum order quantity O&R Department Obsolescence and Reliability Department OAM Original Aircraft Manufacturer OEM Original Equipment Manufacturer OP Obsolescence Problem PMA Part Manufacturer Approval PPPT parts Proprietary parts (spare parts designed by Fokker) SLM Selective Laser Melting SLS Selective Laser Sintering VP Vendor Part
8
1. INTRODUCTION This research assignment is part of a project that was initiated by the University of Twente in cooperation with Eindhoven University and started in autumn 2014, This project is called “Sustainability Impact of New Technology on After-sales service Supply chains”(SINTAS). The project focuses on the impact that Additive Manufacturing can have on the after sales services supply chain. This paper supports the first phase of this project by conducting a quick scan at a specific company to identify where this technology can bring new opportunities in the supply chain. This research assignment is conducted at Fokker Services B.V. In 12 weeks, the current and future possibilities of additive manufacturing, to enhance the efficiency in spare part delivery, are analyzed and the potential implications for Fokker Services are explained. An overview is given about which spare parts could be printed and 2 case studies are conducted to analyze parts that can be printed more extensively.
1.1 PROBLEM DEFINITION Additive manufacturing (AM) technologies have developed in recent years and start to become a serious alternative for conventional production techniques. New opportunities in the application of these technologies arise. Fokker Services (FS) could apply these new technologies to reduce costs and benefit from the opportunities of AM application. This results in the following research question:
How and for which spare parts could additive manufacturing change the after sales services at Fokker Services B.V. to reduce cost?
To answer the research question, the following sub-questions can be defined:
1. What is the organizational structure of Fokker Services? (H2) 2. What are typical certification requirements in the aerospace industry? (H2)
3. What are the advantages and disadvantages of additive manufacturing? (H3) 4. What are the technologies for additive manufacturing and what are their limitations? (H3) 5. Which AM opportunities are relevant for Fokker Services? (H4) 6. Which technology for AM is most appropriate for Fokker Services? (H4)
7. Which spare parts appear most promising for additive manufacturing at Fokker Services? (H5)
8. What is the potential cost reduction when specific parts are printed? (H6)
1.2 RESEARCH APPROACH The following steps are completed during this research assignment:
1. Make an overview of the current situation and logistic process at Fokker Services B.V. 2. Conduct a literature study to determine what the current state is of this technology, what the possible
advantages and limitations are for implementation and determine which technologies are used for AM. 3. When the results from the literature study are combined with the company specific aspects of FS,
conclusions can be made, where AM provides advantages for FS. 4. Based on these advantages, a data-selection and classification is conducted to find the most promising
parts. 5. A few samples of these parts are further Manually Evaluated to verify the selection process and to determine
if the stated advantages will actually lead to a cost reduction.
9
1.3 RESEARCH SCOPE This research assignment is conducted at Fokker Services, one of the four business units of Fokker Technologies. The assignment is focused on the spare part delivery activity of FS because this is most in line with the SINTAS project. The precise organization structure of Fokker will be explained in Section 2.1.
For the data analysis only the non-military parts designed by Fokker are taken into account. Access to military data requires extensive screening to comply with Dutch and American safety regulations, which is barely provided for internships. The scope is limited to proprietary parts (parts designed by Fokker) because ownership of the drawings ensures that FS is allowed to print the parts.
The scope is also limited to the direct replacement of single spare parts or low-level assembled PPPT parts. Higher-level Assemblies (roughly ten parts or more) exceed this scope due to their technical complexity.
10
2. FOKKER SERVICES AND INDUSTRY
2.1 ORGANIZATIONAL STRUCTURE In 1911, the 21-year-old Anthony Fokker flew his home-built aircraft ‘the Spider’ over the city of Haarlem. In the following years he identified the market potential of his expertise and founded the company Fokker in 1919. By 1925 this organization became the world largest aircraft manufacturer. In 1996 Fokker stopped aircraft production and transformed itself from an aircraft manufacturer to a Tier 1 supplier to OAM (Original Aircraft Manufacturers). The company name changed to Fokker Technologies (Fokker, 2014).
Fokker Technologies consist of 4 business units: Fokker Aerostructures, Fokker Landing Gear, Fokker Elmo (electrical wiring) and Fokker Services (FS). This research project is conducted at Fokker Services. This business unit consists of two departments: Redelivery services and Availability services.
The Redelivery Services consists of three main activities: i. Component Maintenance, Repair & Overhaul (CMRO), ii. Aircraft Maintenance, Repair & Overhaul (AMRO) and iii. Modification & VIP Completions. Availability Services supports customers around the globe with spare parts & logistic programs to make their aircraft available during all phases of the aircraft life cycle, from start-up, to maturity and phase-out. This also includes CMRO (Fokker, 2014). The parts of Fokker that are relevant in this perspective are shown in the organizational chart (Appendix A, Figure 1).
The Availability services also conducts: CMRO, besides this, it delivers: Exchanges Services and Spare Part Deliveries. The main exchange program of spare parts of FS is called Abacus (Appendix A, Figure 3). When a part malfunctions it will be sent to FS for repair. The customer does not have to wait until the repair is finished, but can replace the part by either his own lease stock (owned by FS) or from another warehouse that is part of the Fokker Lease pool. The repaired item will replace the used stocked item.
The scope of this research will focus on the Spare Part Delivery Service. This division of FS handles all orders for spare parts. Most orders come from operators that use aircraft produced by Fokker between the 1970’s and 1990’s. FS strives to support this fleet until at least 2030. This means that all requests from the customers have to be processed, even when the item is no longer available.
In general the incoming orders are low quantities, often batches containing only one or a few spare parts. Fokker has three large warehouses: Hoofddorp (Netherlands), Atlanta (USA) and Singapore. If the requested parts are still available in the warehouse, an invoice can be sent based on their book value in the ERP system (Pentagon 2000). When the customer agrees, the part will be shipped for the price agreed upon. When the part is not in stock, the original vendor will be contacted. The vendor can also be another department of Fokker Technologies. When the vendor is no longer able to produce the part, a solution has to be found to fulfill the customer needs. At FS this is called an Obsolescence Problem (OP). The issue will be sent to the Obsolescence and Reliability Department (O&R). This is a frequently recurring problem, due to the relatively long lifespan of aircraft. When vendors do not receive any orders for a long period of time, some start to depose their original casting molds or other tools. The O&R Department has to search for alternatives, often far more expensive than the original. This process can be completed within a week, but will sometimes take almost a year to finish. In Appendix A (Figure 2), this process from customer order, till invoice sent, is visualized.
The spare parts can be divided in 5 categories: 1. Proprietary Parts (PPPT), Fokker has developed these parts, and owns the (exclusive) right to produce
these parts. 2. Vendor Parts (VP), spare parts that have designs and drawings that are not owned by Fokker. 3. Parts Manufacturer Approval (PMA), parts that are counterfeited based on old design and drawings in
agreement with the original OEMs. 4. Standard parts, these are very simple piece parts like: screws, nuts and bolts. 5. Tooling, parts required for installation, removal or repair of other spare parts.
11
2.2 CERTIFICATION All aircraft that are used in commercial operations need a valid ‘Certificate of Airworthiness’ from the authority in which the operator is located. The certification is used to ensure the aircraft suitability for safe flights. In Europe, the industry is regulated by the EASA (European Aviation Safety Agency). In the United States this is the FAA (Federal Aviation Administration).
A standard airworthiness certificate remains valid as long as the aircraft meets its approved type design and is in a condition for safe operation. All parts in the original design of the aircraft are part of the approved type design, stated in the ‘Type Certificate’, which signifies its airworthiness. Once issued, the design cannot be changed, unless an amendment to the Type Certificate or a ‘Supplemental Type Certificate’ has to be request by the relevant applicant. This is may be a very expensive process.
Some OEM’s (Original Equipment Manufacturer), like Fokker Technologies, have acquired the right to certify parts, classified as ‘minor’ (Appendix B) without having to contact the regulating authority. They have proven the ability to ensure airworthiness without interference of an authority. When the design of a PPPT part is changed, FS can therefore acquire an ‘Amended Type Certificate’ in house. Different departments within the company make sure the new design complies with the applicable design requirements.
At FS, the Engineering department regularly makes redesigns of specific parts. After the redesign is made, they have to prove that the new design is equal or better than the previous design that was approved by EASA. Depending on the original requirements and importance of the part, different departments have to evaluate the new design. Examples of aspects that have to be taken in consideration are: fire resistance, sharpness, material strength, evacuation obstruction, smoke density, toxic gasses. For all these aspects, prove has to be delivered. The airworthiness department will thereafter evaluate if the provided prove complies with the applicable requirements. If they approve the new design, the part can be used in commercial operations. Depending on the requirements and importance of the part this process can take up to 2 weeks in man-hours (80 hours), This can therefore still be an expensive process, give the internal cost price of an Engineer at FS is around 100 Euros per hour.
The manufacturer of the parts should also be certified before they can produce for the Aerospace industry. All manufacturers should have AS9100 certification. This is a quality management system standard, which makes sure the manufacturer provides the quality needed in the Aerospace industry.
Besides this official AS9100 certification, Fokker also demands that a representative of FS will visit the manufacturer to check whether it complies with Fokker’s quality standards. When this is the case, the supplier will be added to the ‘Approved Supplier List’ and collaboration is possible.
2.3 CONCLUSION CHAPTER 2 In Section 1.1 the following two sub questions are stated:
1. What is the organizational structure of Fokker Services? 2. What are typical certification requirements in the aerospace industry?
Fokker Services is one of the four business units of Fokker Technologies, beside: Fokker Aerostructures, Fokker Landing Gear and Fokker Elmo. FS focuses on spare part-, component delivery, repair and modification for mostly aircraft of the old Fokker fleet.
Aircraft require certification from government authorities before they can be used in commercial operations. FS can get design changes certified without contacting this agency, but it has to prove internally that the design change does not compromises the Airworthiness of the aircraft.
12
3. ADDITIVE MANUFACTURING
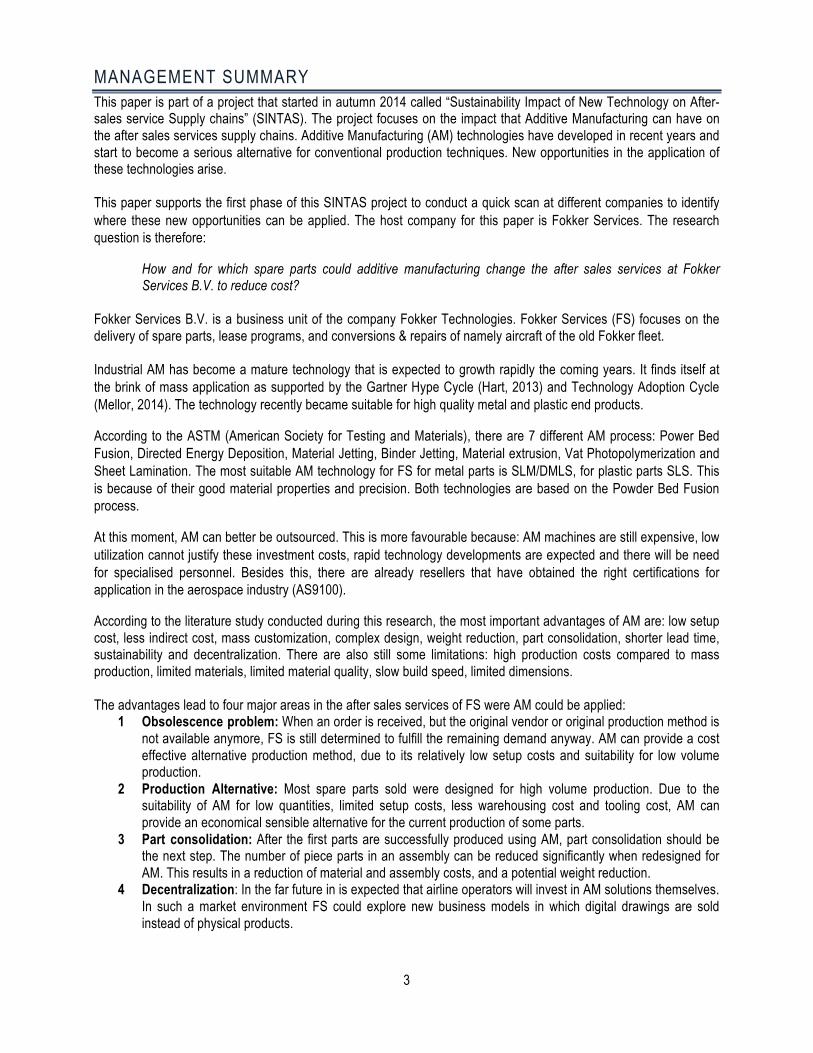
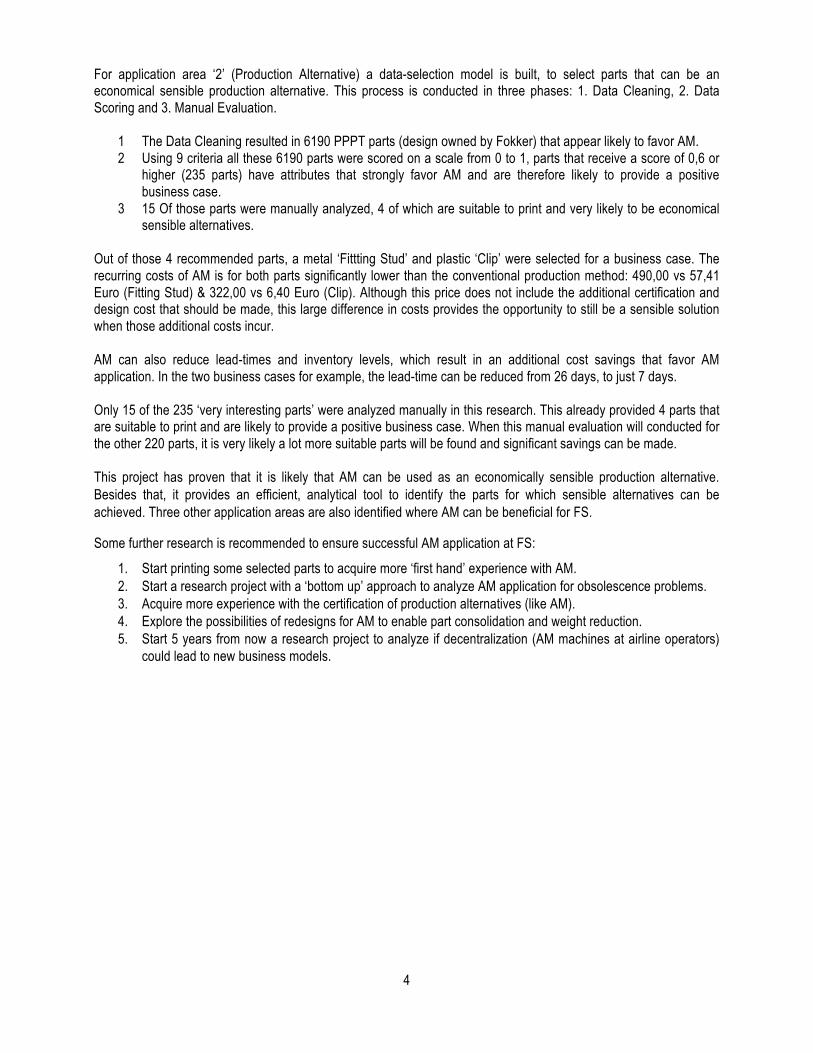
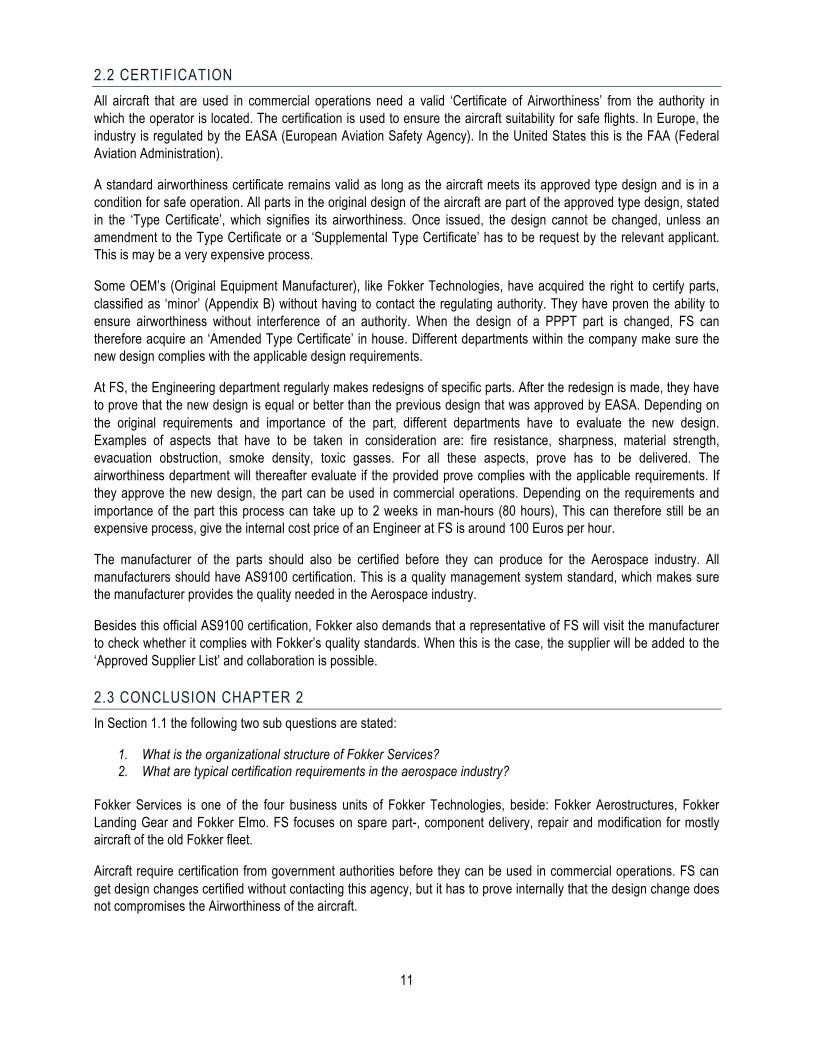
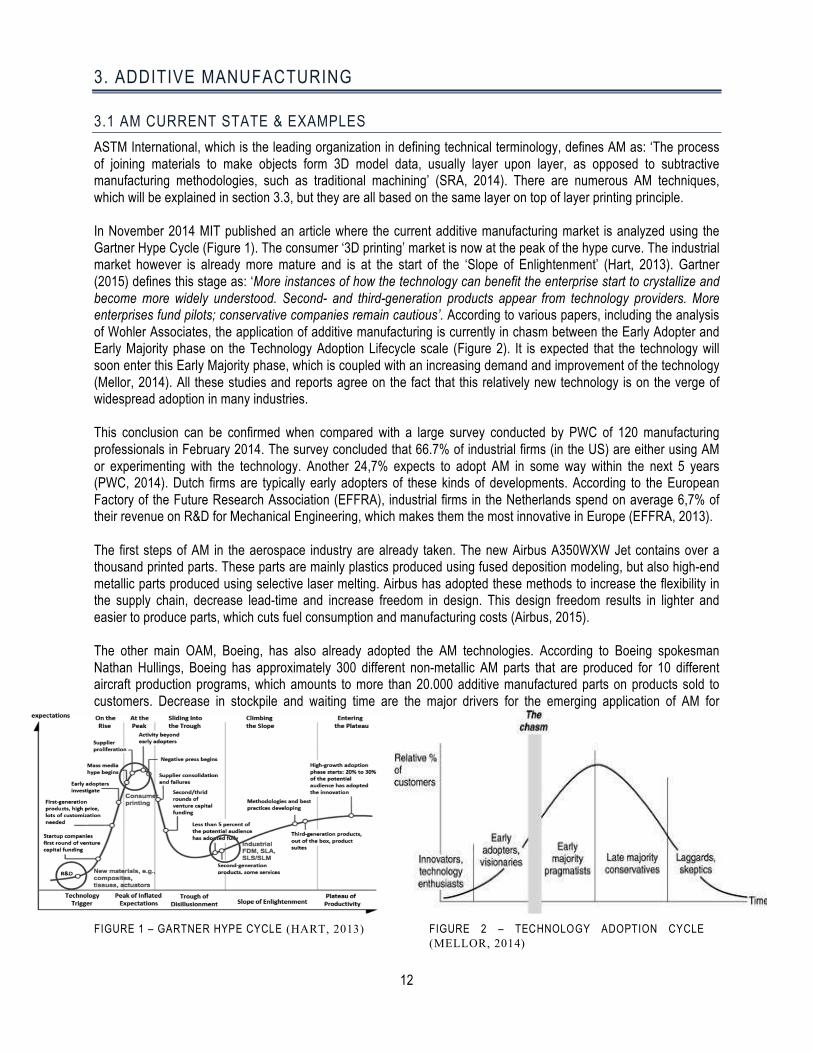
3.1 AM CURRENT STATE & EXAMPLES ASTM International, which is the leading organization in defining technical terminology, defines AM as: ‘The process of joining materials to make objects form 3D model data, usually layer upon layer, as opposed to subtractive manufacturing methodologies, such as traditional machining’ (SRA, 2014). There are numerous AM techniques, which will be explained in section 3.3, but they are all based on the same layer on top of layer printing principle. In November 2014 MIT published an article where the current additive manufacturing market is analyzed using the Gartner Hype Cycle (Figure 1). The consumer ‘3D printing’ market is now at the peak of the hype curve. The industrial market however is already more mature and is at the start of the ‘Slope of Enlightenment’ (Hart, 2013). Gartner (2015) defines this stage as: ‘More instances of how the technology can benefit the enterprise start to crystallize and become more widely understood. Second- and third-generation products appear from technology providers. More enterprises fund pilots; conservative companies remain cautious’. According to various papers, including the analysis of Wohler Associates, the application of additive manufacturing is currently in chasm between the Early Adopter and Early Majority phase on the Technology Adoption Lifecycle scale (Figure 2). It is expected that the technology will soon enter this Early Majority phase, which is coupled with an increasing demand and improvement of the technology (Mellor, 2014). All these studies and reports agree on the fact that this relatively new technology is on the verge of widespread adoption in many industries. This conclusion can be confirmed when compared with a large survey conducted by PWC of 120 manufacturing professionals in February 2014. The survey concluded that 66.7% of industrial firms (in the US) are either using AM or experimenting with the technology. Another 24,7% expects to adopt AM in some way within the next 5 years (PWC, 2014). Dutch firms are typically early adopters of these kinds of developments. According to the European Factory of the Future Research Association (EFFRA), industrial firms in the Netherlands spend on average 6,7% of their revenue on R&D for Mechanical Engineering, which makes them the most innovative in Europe (EFFRA, 2013). The first steps of AM in the aerospace industry are already taken. The new Airbus A350WXW Jet contains over a thousand printed parts. These parts are mainly plastics produced using fused deposition modeling, but also high-end metallic parts produced using selective laser melting. Airbus has adopted these methods to increase the flexibility in the supply chain, decrease lead-time and increase freedom in design. This design freedom results in lighter and easier to produce parts, which cuts fuel consumption and manufacturing costs (Airbus, 2015). The other main OAM, Boeing, has also already adopted the AM technologies. According to Boeing spokesman Nathan Hullings, Boeing has approximately 300 different non-metallic AM parts that are produced for 10 different aircraft production programs, which amounts to more than 20.000 additive manufactured parts on products sold to customers. Decrease in stockpile and waiting time are the major drivers for the emerging application of AM for
FIGURE 1 – GARTNER HYPE CYCLE (HART, 2013)
FIGURE 2 – TECHNOLOGY ADOPTION CYCLE (MELLOR, 2014)
13
Boeing. Although Boeing currently only produces non-metallic parts with AM, patents reveal that application for metallic parts is being developed (Catalono, 2015). General Electric, the 9-th largest corporation in the world with a 6 billion dollar annual R&D budget (Fortune, 2014), announced May 2015 that they successfully produced a foot long fully functional Jet Engine which was almost entirely produced using AM. They completely redesigned the engine and could reduce the amount of parts needed significantly. Earlier this year GE received the first approval from the FAA for an additive manufactured fuel nozzle that will be used in the ‘CFM LEAP’ Jet engine for commercial aircraft (GE-Reports, 2015). Even operators, like for example KLM, are experimenting with the application of additive manufacturing. According to René de Groot, Senior Vice President Operations Engineering & Maintenance, at the moment experiments are conducted with replaceable plastic spare parts that are applied within the cabin (Somsen, 2014).
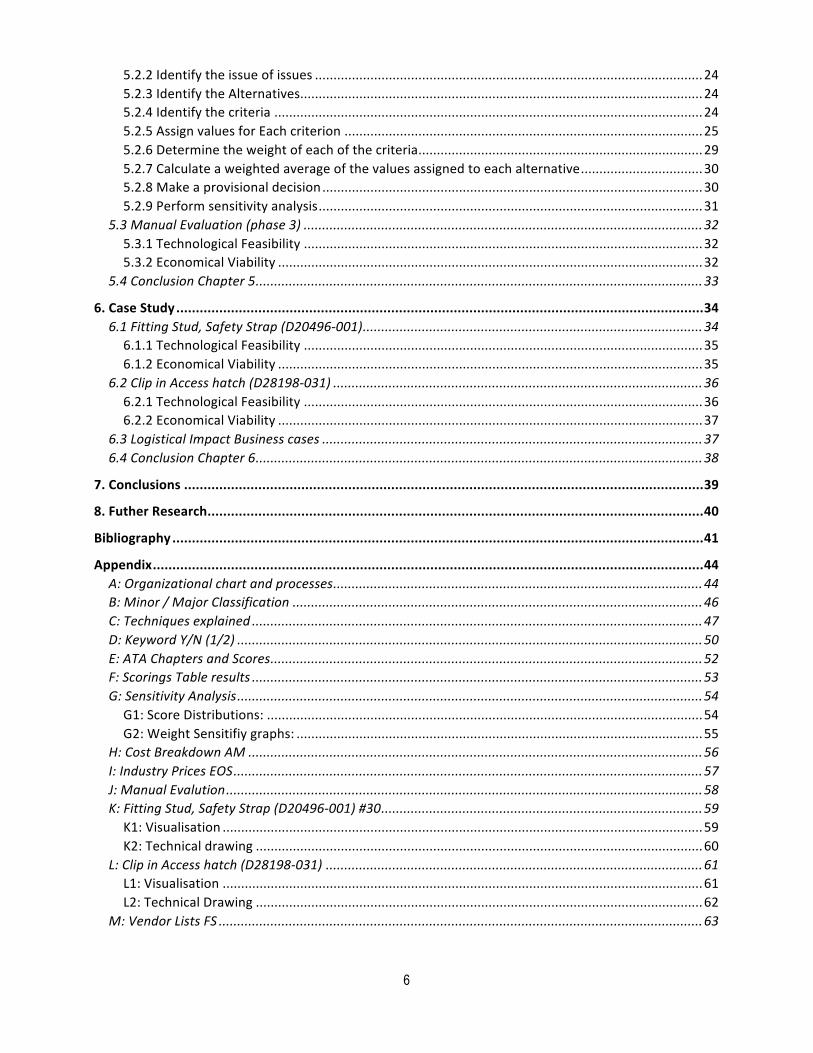
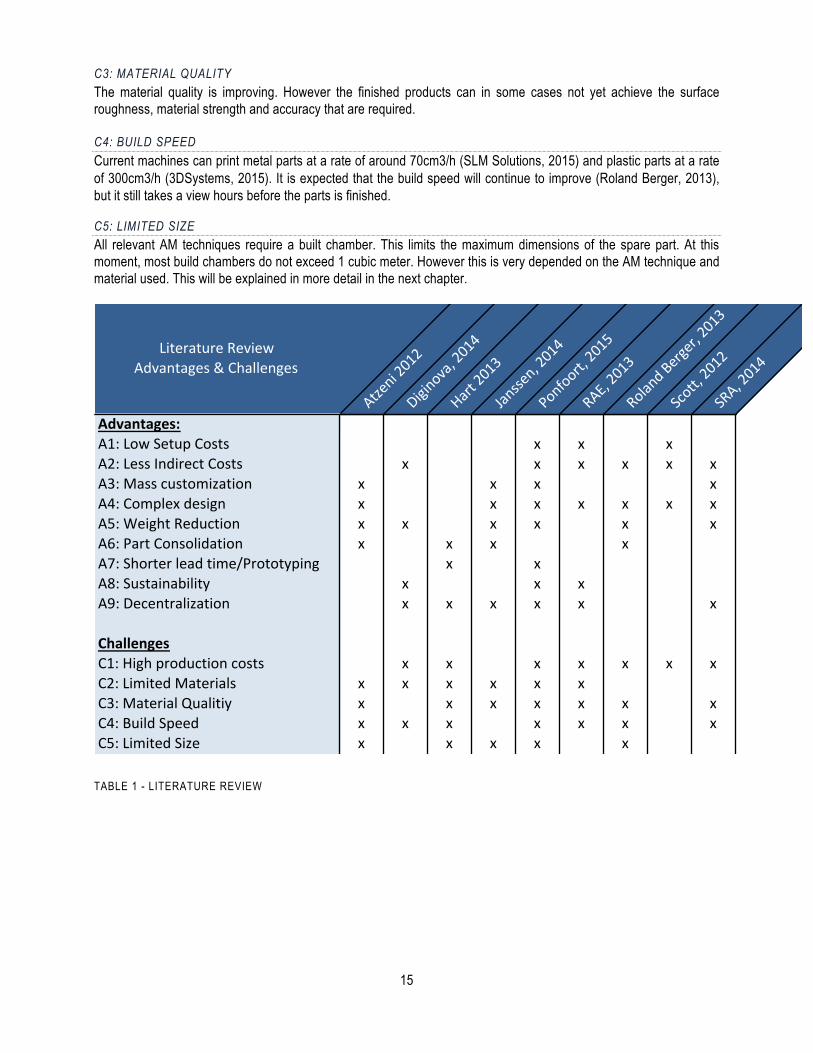
3.2 AM ADVANTAGES & CHALLENGES Different studies and papers have been reviewed to identify the advantages and challenges for AM. The points most agreed upon will be explained below. The results of this literature research can be found in Table 1, at the end of this Section.
3.2.1 ADVANTAGES A1: LOW SETUP COSTS Conventional production techniques like casting molds are designed for high volume production. This results in a high level of efficiency at mass production, but for single products or small batches the process becomes very expensive. With AM, there are less setup costs. Costs are nearly independent of the batch size, which makes this technology more suitable for low volume production.
A2: LESS INDIRECT COSTS AM can print a part on demand. Therefore the size of inventory can be reduced, which results in a decrease of warehousing costs. This inventory reduction also results in a decrease of capital cost. It also decreases the likelihood of despond of excess inventories. AM also can require less production steps and tools to produces the final product, which reduces tooling cost.
A3: MASS CUSTOMIZATION AM is well suitable for mass customization. Due to the reduction of specialized tooling and economy of scale advantages, each single product can be slightly different without increasing the production costs significantly.
A4: COMPLEX DESIGN AM enables the production of parts that were impossible to produce before due to the limitations of casting and subtractive production methods. This design freedom enables for example honeycomb structures that can be produced inside the actual part. Complexity comes for free as well, because AM costs will remains nearly the same for simple and complex structures.
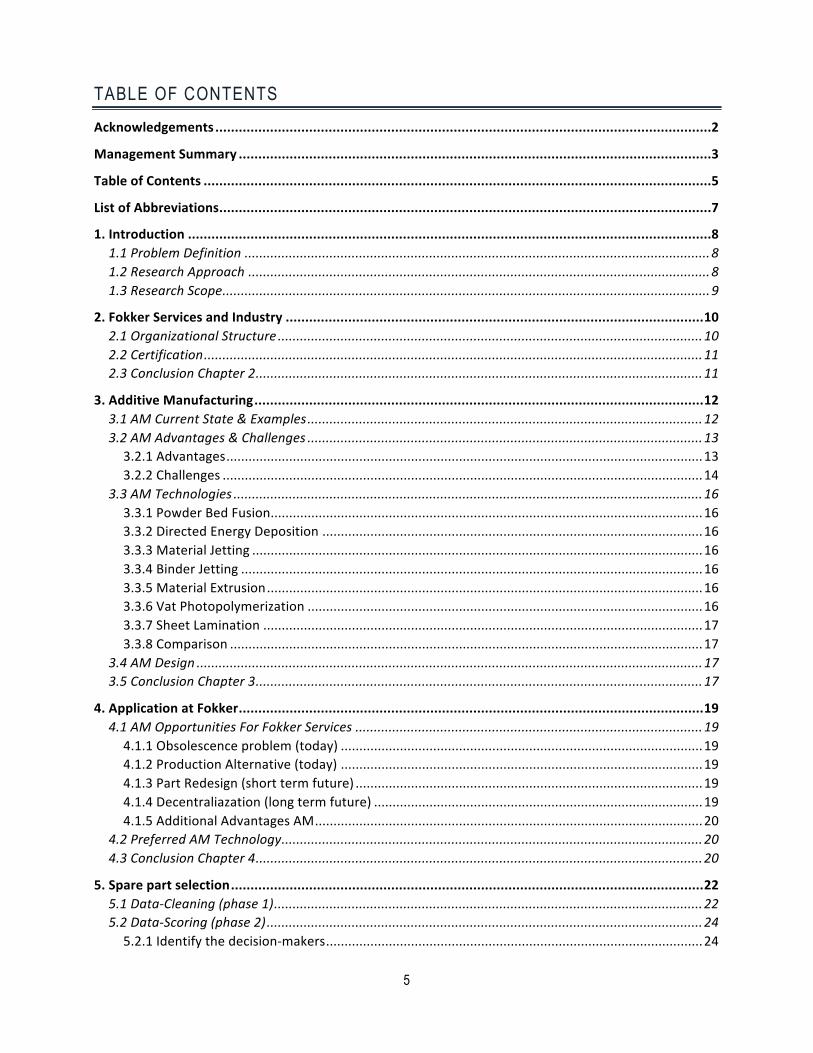
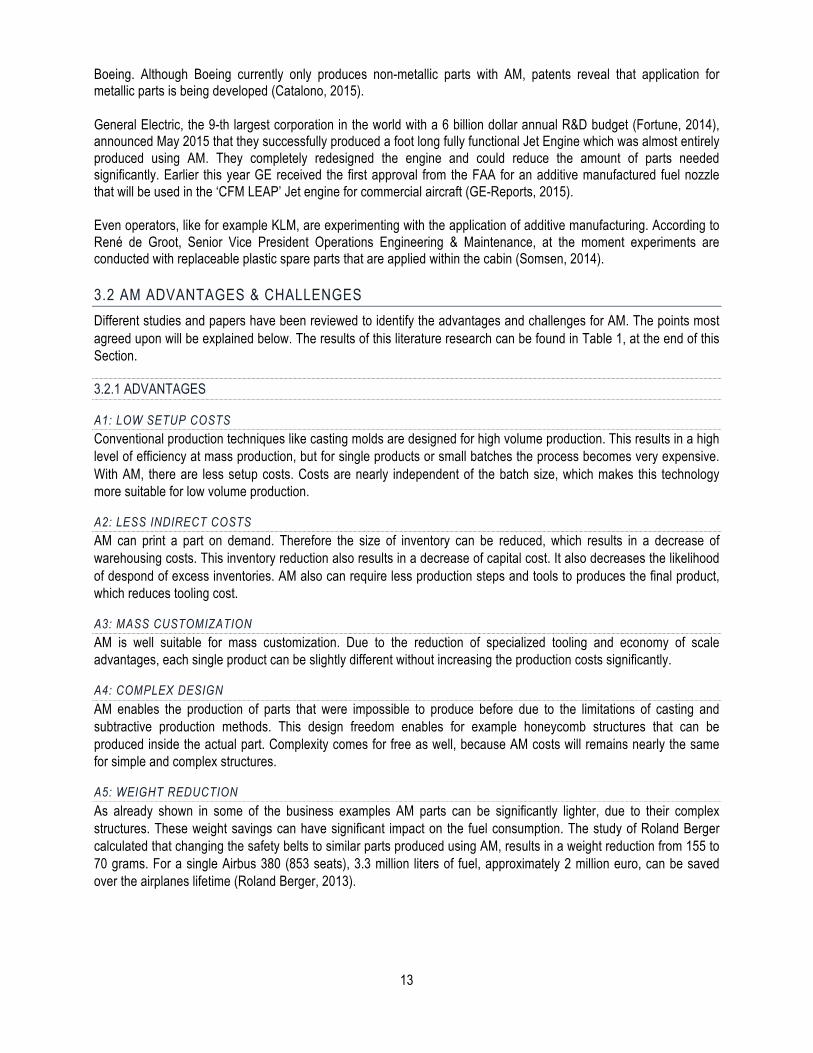
A5: WEIGHT REDUCTION As already shown in some of the business examples AM parts can be significantly lighter, due to their complex structures. These weight savings can have significant impact on the fuel consumption. The study of Roland Berger calculated that changing the safety belts to similar parts produced using AM, results in a weight reduction from 155 to 70 grams. For a single Airbus 380 (853 seats), 3.3 million liters of fuel, approximately 2 million euro, can be saved over the airplanes lifetime (Roland Berger, 2013).
14
The Wohler associates (2013) made a comparable calculation: a big airliner (like Emirates) could save 2.5 million dollars per year if all metal brackets used to connect cabin structures were printed (up to a thousand per aircraft, with a 50-80% weight reduction) (Mellor, 2014)
. FIGURE 3 - REDESIGN SAFETY BELT (ROLAND BERGER, 2013)
A6: PART CONSOLIDATION The increased design freedom of AM also enables engineers to develop designs where various piece parts can be combined in one single part. The number of parts needed for the final product can sometimes be decreased significantly, which will reduce production and assembly costs. A7: SHORTER LEAD-TIME / PROTOTYPING Due to absence of specialized molds or tooling, there is a relatively short period needed to turn an idea or design into a physical product. Therefore AM is often applied in prototyping, but this attribute of AM can also provide solutions for OP’s and decrease lead-time significantly. Airbus showed an example in one of its corporate videos of a plastic seat part, which had a 30-year-old design with tools that were scrapped and had an annual demand of just 100 parts per year. They made a redesign of the part in a week and within 2 weeks the part was back on the shelf and ready for application in the repair Centre (Airbus, Airbus 3D Printing technology transformation underway, 2014).
A8: SUSTAINABILITY Beside some support material, AM results in almost zero waste. All powder and liquid that does not end up in the final product can be reused. Besides that, the reduction in tooling, warehousing and transportation also reduces the environmental footprint.
A term often referred to within the aerospace community is the Buy-to-Fly ratio. The Buy-to-Fly ratio is the weight ratio between the raw material used for a component and the weight of the component itself. Due to the importance of weight optimization it is not uncommon with Buy-to-Fly ratio as high as 15-20 for flying components, resulting in a lot of costs and a high environmental footprint. AM can produce lightweight components with a Buy-to-Fly ratio very close to 1.
A9: DECENTRALIZATION Parts that were previously bought from a distant supplier can be printed at a local AM facility. This reduces transportation costs and shortens lead-time. This can also provide for a new business model, where the digital drawings are traded and shipped digitally, instead of the spare part itself. 3.2.2 CHALLENGES C1: HIGH PRODUCTION COST Due to relatively high material prices and high machine costs, AM is in many cases not competitive with the production costs of conventional mass production. However due to the advantages described above, there are different scenarios where AM can reduce costs. C2: LIMITED MATERIALS Although the different ranges of materials that can be used for AM is increasing, it does not cover the variety of materials that is possible with most other production methods.
15
C3: MATERIAL QUALITY The material quality is improving. However the finished products can in some cases not yet achieve the surface roughness, material strength and accuracy that are required. C4: BUILD SPEED Current machines can print metal parts at a rate of around 70cm3/h (SLM Solutions, 2015) and plastic parts at a rate of 300cm3/h (3DSystems, 2015). It is expected that the build speed will continue to improve (Roland Berger, 2013), but it still takes a view hours before the parts is finished.
C5: LIMITED SIZE All relevant AM techniques require a built chamber. This limits the maximum dimensions of the spare part. At this moment, most build chambers do not exceed 1 cubic meter. However this is very depended on the AM technique and material used. This will be explained in more detail in the next chapter.
Literature(Review(((((((((((((((Advantages(&(Challenges((
Atzeni(2012
Diginova,(2014
Hart(2013
Janssen,(2014
Ponfoort,(2015
RAE,(2013
Roland(Berger,(2013
Scott,(2012
SRA,(2014
Advantages:A1:(Low(Setup(Costs x x xA2:(Less(Indirect(Costs x x x x x xA3:(Mass(customization x x x xA4:(Complex(design x x x x x x xA5:(Weight(Reduction x x x x x xA6:(Part(Consolidation x x x xA7:(Shorter(lead(time/Prototyping x xA8:(Sustainability x x xA9:(Decentralization x x x x x x
ChallengesC1:(High(production(costs x x x x x x xC2:(Limited(Materials x x x x x xC3:(Material(Qualitiy x x x x x x xC4:(Build(Speed x x x x x x xC5:(Limited(Size x x x x x
TABLE 1 - LITERATURE REVIEW
16
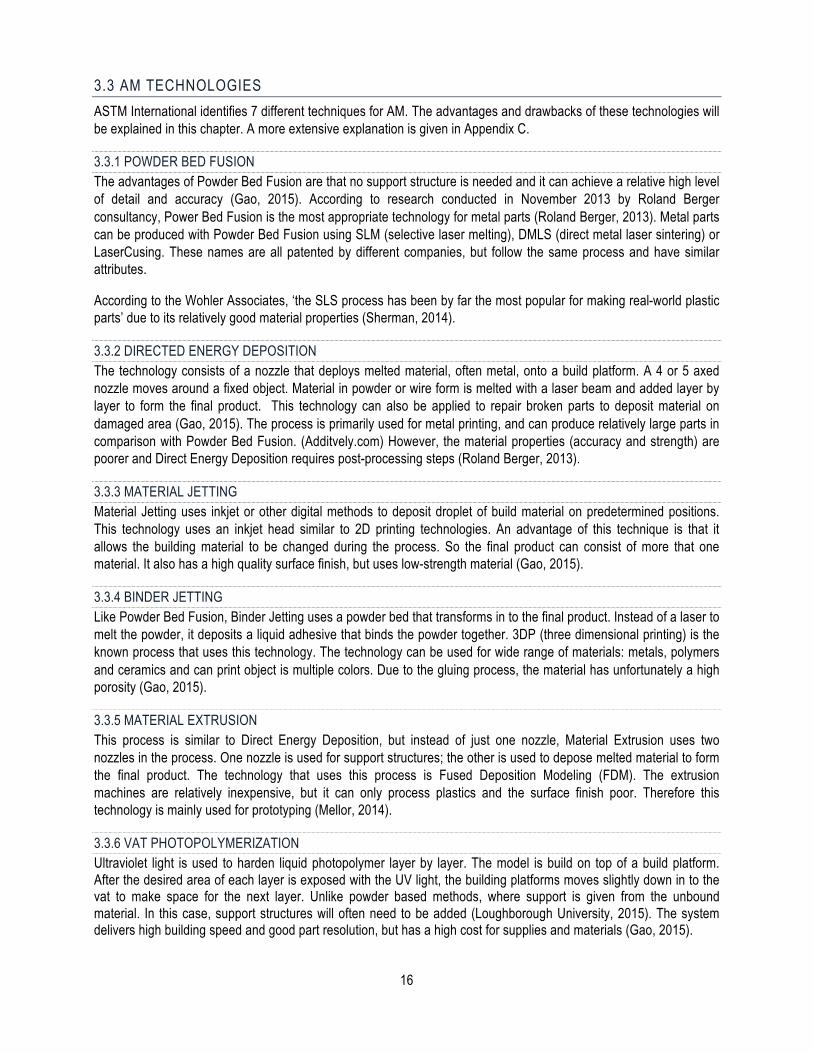
3.3 AM TECHNOLOGIES ASTM International identifies 7 different techniques for AM. The advantages and drawbacks of these technologies will be explained in this chapter. A more extensive explanation is given in Appendix C.
3.3.1 POWDER BED FUSION The advantages of Powder Bed Fusion are that no support structure is needed and it can achieve a relative high level of detail and accuracy (Gao, 2015). According to research conducted in November 2013 by Roland Berger consultancy, Power Bed Fusion is the most appropriate technology for metal parts (Roland Berger, 2013). Metal parts can be produced with Powder Bed Fusion using SLM (selective laser melting), DMLS (direct metal laser sintering) or LaserCusing. These names are all patented by different companies, but follow the same process and have similar attributes.
According to the Wohler Associates, ‘the SLS process has been by far the most popular for making real-world plastic parts’ due to its relatively good material properties (Sherman, 2014).
3.3.2 DIRECTED ENERGY DEPOSITION The technology consists of a nozzle that deploys melted material, often metal, onto a build platform. A 4 or 5 axed nozzle moves around a fixed object. Material in powder or wire form is melted with a laser beam and added layer by layer to form the final product. This technology can also be applied to repair broken parts to deposit material on damaged area (Gao, 2015). The process is primarily used for metal printing, and can produce relatively large parts in comparison with Powder Bed Fusion. (Additvely.com) However, the material properties (accuracy and strength) are poorer and Direct Energy Deposition requires post-processing steps (Roland Berger, 2013).
3.3.3 MATERIAL JETTING Material Jetting uses inkjet or other digital methods to deposit droplet of build material on predetermined positions. This technology uses an inkjet head similar to 2D printing technologies. An advantage of this technique is that it allows the building material to be changed during the process. So the final product can consist of more that one material. It also has a high quality surface finish, but uses low-strength material (Gao, 2015).
3.3.4 BINDER JETTING Like Powder Bed Fusion, Binder Jetting uses a powder bed that transforms in to the final product. Instead of a laser to melt the powder, it deposits a liquid adhesive that binds the powder together. 3DP (three dimensional printing) is the known process that uses this technology. The technology can be used for wide range of materials: metals, polymers and ceramics and can print object is multiple colors. Due to the gluing process, the material has unfortunately a high porosity (Gao, 2015).
3.3.5 MATERIAL EXTRUSION This process is similar to Direct Energy Deposition, but instead of just one nozzle, Material Extrusion uses two nozzles in the process. One nozzle is used for support structures; the other is used to depose melted material to form the final product. The technology that uses this process is Fused Deposition Modeling (FDM). The extrusion machines are relatively inexpensive, but it can only process plastics and the surface finish poor. Therefore this technology is mainly used for prototyping (Mellor, 2014).
3.3.6 VAT PHOTOPOLYMERIZATION Ultraviolet light is used to harden liquid photopolymer layer by layer. The model is build on top of a build platform. After the desired area of each layer is exposed with the UV light, the building platforms moves slightly down in to the vat to make space for the next layer. Unlike powder based methods, where support is given from the unbound material. In this case, support structures will often need to be added (Loughborough University, 2015). The system delivers high building speed and good part resolution, but has a high cost for supplies and materials (Gao, 2015).
17
3.3.7 SHEET LAMINATION It is a solid based process, where multiple layers of metals sheets are stacked on top of each other. Each layer is cut with a laser to get the desired form and is bound together using ultrasonic welding. Although the machine and material costs are relatively low (Gao, 2015), this method is not favourable for industrial uses because high efforts must applied to remove the metal plates (Loughborough University, 2015).
3.3.8 COMPARISON Based on the technologies described in this chapter, the research of Roland Berger (2013), the paper of Gao (2015) and the website additively.com (2015), the following table is compiled:
Classification Known Process
Typical Markets*
Relevance for Metal*
Relevance for Plastics**
Material Strength**
Maximum Dimensions*** Tolerance***
Powder Bed Fusion
SLS, SLM, DMLS, EMBS
Prototyping, direct part +++ + ++
550x380x580mm3 400x400x400 mm3 (Metal)
+/- 0.25 mm +/- 0.05 mm (Metal)
Directed Energy Deposition
LENS, DMD, CLAD
Direct part, repair ++ - + 2,000x1,500x750
mm3 0.125-0.25 mm
Material Jetting Polyjet and Thermojet
Prototyping, casting parts - + - 300 x 185 x 200
mm3 +/-0.025 mm
Binder Jetting 3DP Prototyping, direct parts, casting molds
+ + +/- 4,000 x 2,000 x 1,000 mm3 +/-0.13 mm
Material Extrusion FDM Prototyping - + - 914x610x914 mm3 +/-0.178 mm
Vat Photo- polymerization SLA Prototyping - +/- + 2,100 x 700 x 800
mm3 +/-0.15 mm
Sheet Lamination LOM, UC Prototyping, direct part + - ++ 256 x 169 x 150
mm3 +/- 0.20 mm * stated by: Roland Berger, 2013 ** deducted from: Gao, 2015 *** stated by: Additively, 2015
3.4 AM DESIGN For almost all PPPT parts, no digital drawing exist. Most parts only have old scanned paper drawings of the original design. Engineering can translate this original drawing manually to a 3D model (CAD Model). This can be achieved with different software packages. At FS engineers already use the program CATIA. This program is also suitable for AM designs (Sculpteo, 2015). For simple parts (most spare parts) this takes around 4 man-hours. The internal cost price of an Engineer at FS is about 100 euros. Therefore the costs for designing a (simple) 3D design can be estimated at roughly 320 euro (values are based on an interview with K. Bouwma, and are purely indicative). When there is still a part on stock, reversed engineering is also possible. A 3D scanner can be used to scan the original spare part and translate its outer walls to a CAD Model. This form of reversed engineering is already multiple times successfully applied on the redesign of casting molds. Although this method is faster and cheaper than an entire redesign, it is less accurate and it requires still one item in stock
3.5 CONCLUSION CHAPTER 3 In this Chapter the following two sub questions were answered:
What are the advantages and disadvantages of additive manufacturing? What are the technologies for additive manufacturing and what are their limitations?
TABLE 2 - TECHNOLOGIES OVERVIEW

18
Industrial AM becomes a mature technology which is expected to growth rapidly the coming years. According to the literature study the most important advantages are: low setup cost, less indirect cost, mass customization, complex design, weight reduction, part consolidation, shorter lead time, sustainability, decentralisation. There are also still some limitations: high production costs compared to mass production, limited materials, limited material quality, slow build speed, limited dimensions. According to the ASTM, there are 7 different AM process: Power Bed Fusion, Directed Energy Deposition, Material Jetting, Binder Jetting, Material extrusion, Vat Photopolymerization and Sheet Lamination. Before the part can be printed, a digital CAD Model should be made. This can be achieved by making a digital redesign of reversed engineering with a 3D scanner.
19
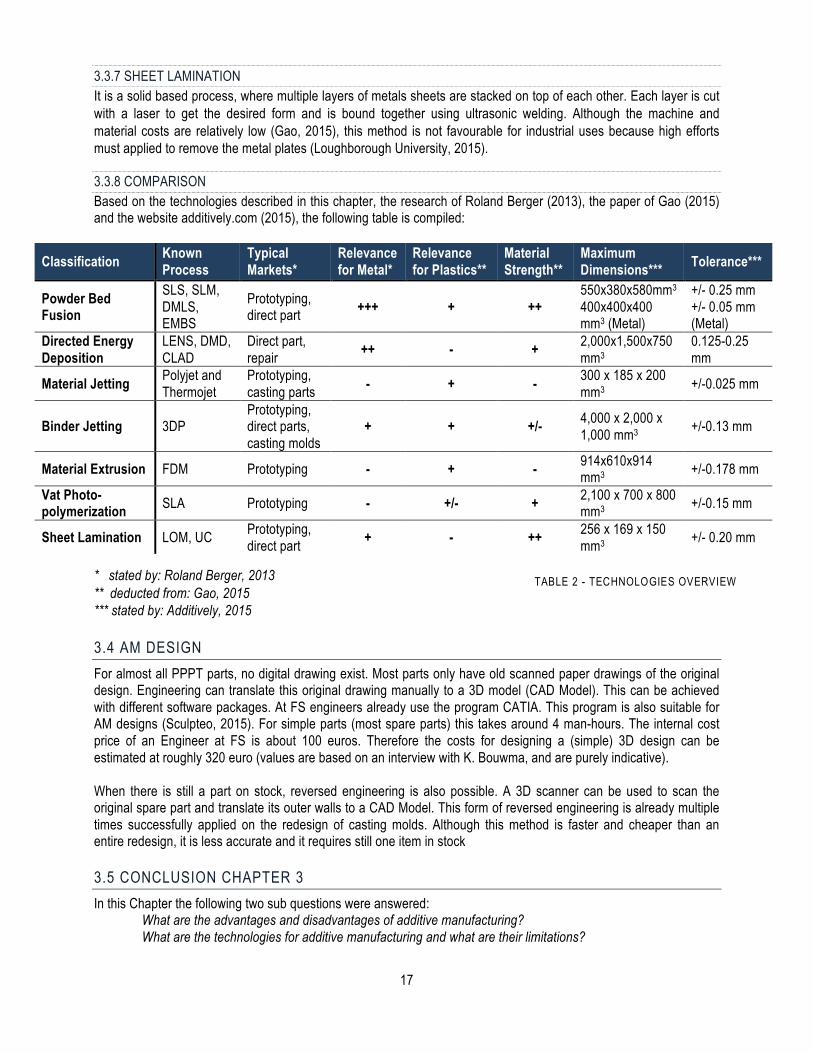
4. APPLICATION AT FOKKER When the business model of FS (Chapter 2) is compared to the advantages stated in Chapter 3, the advantages that may already be applicable today or in the near future can be identified. This results in four possible application areas, which will be explained in Section 4.1. The most suitable AM technologies for FS are concluded in Section 4.2.
4.1 AM OPPORTUNITIES FOR FOKKER SERVICES 4.1.1 OBSOLESCENCE PROBLEM (TODAY) As explained in Chapter 2, FS often receives low quantity orders for parts that are obsolete; the original vendor scrapped the tools or moulds to produce the part. FS is determined to fulfil the remaining demand anyway. Conventional production methods are designed for high volume production and are therefore often too expensive for one-offs or small batch productions. A new casting mold for example cost in general over 30.000 Euros. Often, spare parts can be obtained from competitor inventories, but this is in most cases very expensive. Therefore low quantities methods like ‘rubber pad forming’ or subtractive methods like ‘milling’ are currently used to solve this problem. However, this is often much more expensive than the previous method and in some cases even impossible.
When this Obsolescence Problem (OP) occurs, AM can be an appropriate alternative. As explained in Section 3.2, AM is most suitable in low volume productions due to the low setup costs (A1). Normally, It can sometimes take up to a year before a solution for the OP is found. Due to the short lead-time of AM (A7), it is possible to make a redesign (if necessary), get certification and produce the AM-part within the expected lead-time.
This application of AM will in most cases be reactive, AM can only be applied when the OP occurs. Current research efforts of the Erasmus University (Rotterdam) however try to predict obsolescence (Jaarsveld & Dekker, 2011) (Li, 2014). For this purpose a tool is made to make a prediction of obsolescence at FS. Therefore, for some parts AM can also be used before the OP actually occurs (proactive).
4.1.2 PRODUCTION ALTERNATIVE (TODAY) Almost all PPPT parts were designed for and produced using high volume production during the time Fokker was still an aircraft manufacturer. As explained, orders received today are usually only small batches or single parts. For some parts this has led to significant prices increase. For these parts with small quantities AM has the potential to provide cost savings due to its low setup costs, cost are almost independent of quantiy (A1). Moreover, AM requires less warehousing and tooling and cost of capital, which is often hard to exactly quantify but also results in a costs reduction (A2).
4.1.3 PART REDESIGN (SHORT TERM FUTURE) Due to the complex designs that are possible for AM (A4), higher-level assemblies (parts that consist of multiple piece-parts) can be redesigned to enable part consolidation (A6). This exceeds the scope of this project, but can be a next step for AM adoption at FS. The quality of these assemblies, the weight (A5) and production costs can be reduced when part consolidation is applied. As shown in the General Electric example in Section 3.1, part consolidation is already applied in the aerospace industry. When the AM industry further matures and the experience in this field increases, this will be a logical step.
4.1.4 DECENTRALIAZATION (LONG TERM FUTURE) The AM market and technologies are expected to continue to grow, develop and prices are expected to drop (Roland Berger, 2013). It is probable that most airliners, the main customers of FS, also realise the potential of this development. More customers will search for solutions to utilize the benefits AM promises. The maintenance department of KLM is already conducting similar experiments as discussed in Section 3.2. FS should not see this change as a threat, but rather as an opportunity to modify its business model to meet customer needs. FS can exploit the advantages of being the owner of the original design of the parts. When the design is converted as a digital
20
drawing, FS can sell or licence the drawing, instead of the physical part. Transportation cost and lead-time (A7) can be significantly reduced due to this decentralisation (A9).
4.1.5 ADDITIONAL ADVANTAGES AM Beside the four areas were AM can be applied as stated above, there are additional advantages of this technology which will favor all AM applications at FS. When a digital drawing is made for AM, the design freedom of AM can be utilized (A4) to make the part lighter (A5). As shown in Section 3.2, little weight reductions can result in significant fuel savings. This can be used as an additional selling point for the AM parts sold by FS.
Due to the efficiency of AM, the process is also more sustainable (A8). Within a world where sustainability continues to become more important for businesses (Revell, 2005), this can also be an additional selling point to (potential) customers. Due to the fact that AM parts require fewer inventories (A2), the chance parts on stock will never be sold also decreases. This results in less waste and also provides a cost reduction.
4.2 PREFERRED AM TECHNOLOGY There are two ways to actually manufacture with this technology. An investment can be made in one or more AM machines or the production can be outsourced to a specialised AM parts supplier. A similar study made a similar trade-off for Philips, who are also starting to exploit the benefits of AM for a select group of parts. It was concluded that, at this moment, outsourcing is more favourable because: AM machines are still expensive, low utilization cannot justify these investment costs, rapid technology developments are expected and there will be need for specialised personnel (Wullms, 2014). At this moment there are already partners available that have the right certification obtained for the Aerospace industry. One of the leading resellers of industrial AM parts, Materialise NV (headquartered in Belgium), recently acquired AS/EN9100 and EASA 21G certification, which certifies that an organisation can deliver parts with a Form-1 and indicates that the parts are ‘’ready to fly’’ (Griffiths, 2015). This is a necessary requirement for all suppliers of FS. Therefore FS should find a similar strategic partner that uses the appropriate technology that can answer their specific needs. At this moment FS have is already in contact with NLR, Layerwise and Additive Industries, which are the most likely candidates for this partnership. In section 3.3, 7 different AM processes are explained and the techniques that these processes apply. Based on the advantages and disadvantages and specifications of these processes, the most suitable technology for FS can be concluded. Many of the metal spare parts used at FS have to fulfil high quality standards. Most spare parts have a maximum tolerance of 0.15 mm. Based on these high quality demands and the advice of Roland Berger, the SLM/DMLS technology of Power Based Fusion is the most appropriated technology for FS.
For plastic parts, Powder Bed Fusion (SLS) is also the most relevant technology. This is also confirmed in a research of the Wohlers Associates, which stated that: for high quality functional parts SLS is the most applied process (Sherman, 2014). SLS cannot yet achieve the large dimensions and low tolerance as some of the alternatives. However it is the only technology that delivers the high material strength required for most functional spare parts.
4.3 CONCLUSION CHAPTER 4 In this Chapter the following two sub questions were answered:
Which AM opportunities are relevant for Fokker Services? Which technology for AM is most appropriate for Fokker Services?
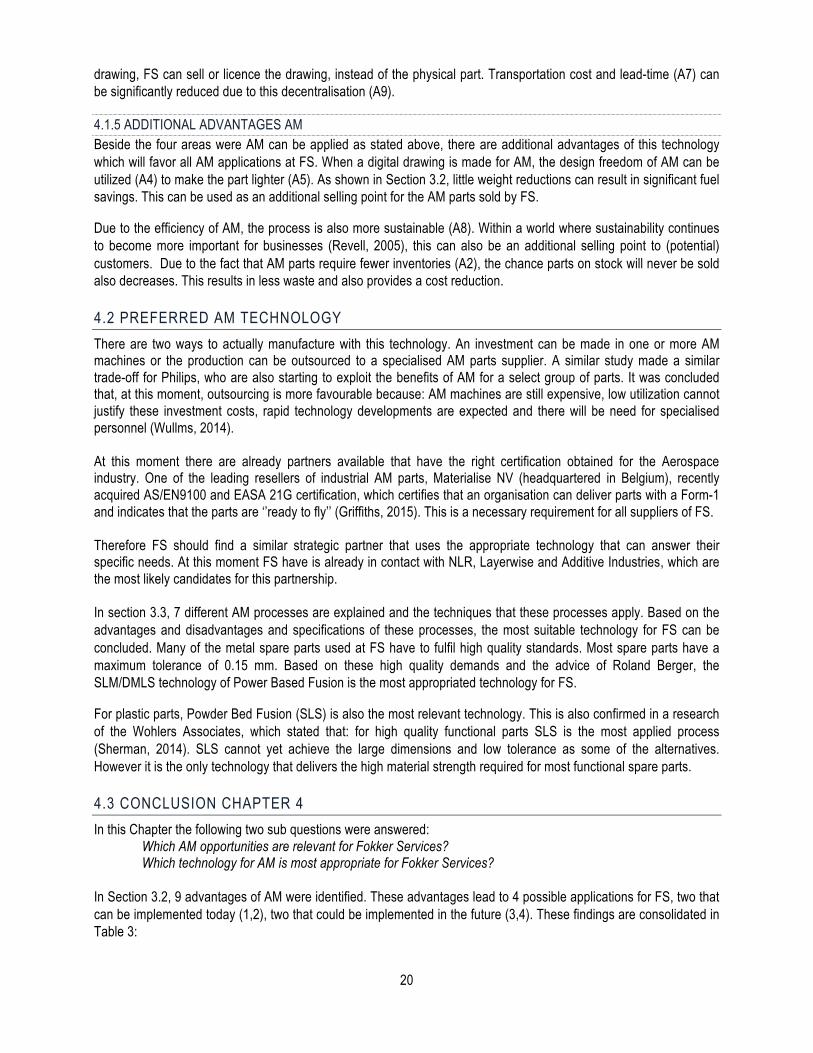
In Section 3.2, 9 advantages of AM were identified. These advantages lead to 4 possible applications for FS, two that can be implemented today (1,2), two that could be implemented in the future (3,4). These findings are consolidated in Table 3:
21
Advantages: ApplicationA1:$Low$Setup$Costs 1,2A2:$Less$Indirect$Costs 1,2,3,4 Application0AreasA3:$Mass$customization None 1. Obsolescence problem A4:$Complex$design 1,2,3,4 2. Production Alternative A5:$Weight$Reduction 1,2,3,4 3. Part consolidation A6:$Part$Consolidation 3 4. DecentrailisationA7:$Shorter$lead$time/Prototyping 1,4A8:$Sustainability 1,2,3,4A9:$Decentralization 4
TABLE 3 - ADVANTAGES & APPLICATION AM
The most suitable AM technology at FS for metal parts is SLM/DMLS, for Plastic parts SLS. This is because of the good material properties and precision of the technique. It is recommended to find a strategic partner to print the parts with those technologies instead of investing in a Power Bed Fusion Machine.
22
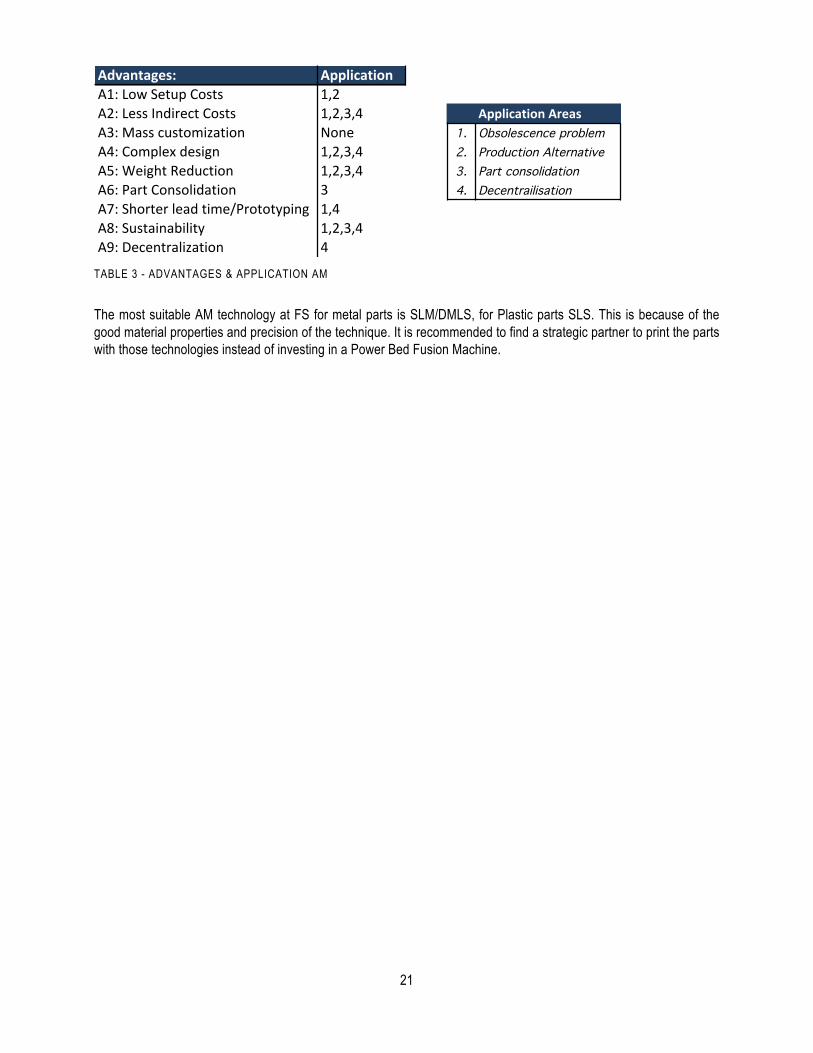
5. SPARE PART SELECTION In the previous chapters it is explained in which areas AM can provide opportunities for cost reduction and increased efficiency at FS and what the advantages and limitations are of this technology with a focus on the application of powder bed fusion. Based on these findings, the PPPT parts (spare parts designed by Fokker) are analyzed and scored for suitability for AM. This selection process is conducted in three phases:
Phase 1: The first step is to reduce the amount of data (400.000 PPPT parts) to a set that is relevant for this research project. This process is called ‘Data-Cleaning’.
Phase 2: Hereafter the relevant parts are scored based on available characteristics; for example: historic demand or lead-time. This ‘Data-Scoring’ process provides a list of parts that are most suitable to print based on (mostly) economical criteria.
Phase 3: For the most suitable parts a further ‘Manual Evaluation’ is necessary to check whether it is actually possible and beneficial to apply AM for the manufacturing of the pre-selected parts. Therefore the technical drawings should be analyzed and a cost estimation should be made. For this process the most important characteristics and design limitations of powder bed fusion are considered. A cost indication is also given based on the volume and used material, to be able to make a (cost) comparison with the conventional production method.
5.1 DATA-CLEANING (PHASE 1) FS uses an ERP system called Pentagon 2000. This system was implemented at FS in 2006 to create one integrated ERP solution. Before, several separate systems were used: for sales the system ‘SPIN’, for parts owned by Fokker ‘EUC Portal’ and for specific departments specialized systems were applied. The data from these systems were all integrated into Pentagon. Besides Pentagon, the system ‘Team Centre’ is used for all technical information like patents and drawings.
To identify which spare parts qualify for AM all PPPT Parts that are not used in any defense program were selected. This resulted in an initial data set of around 320,000 parts. A large proportion of these parts are ‘non-movers’ (sold 0 times over the last 10 years). This data set also contains parts that do not qualify for AM like pieces of carpet, cables or entire assemblies. All these parts should be filtered out to acquire a relevant dataset that can be further scored.
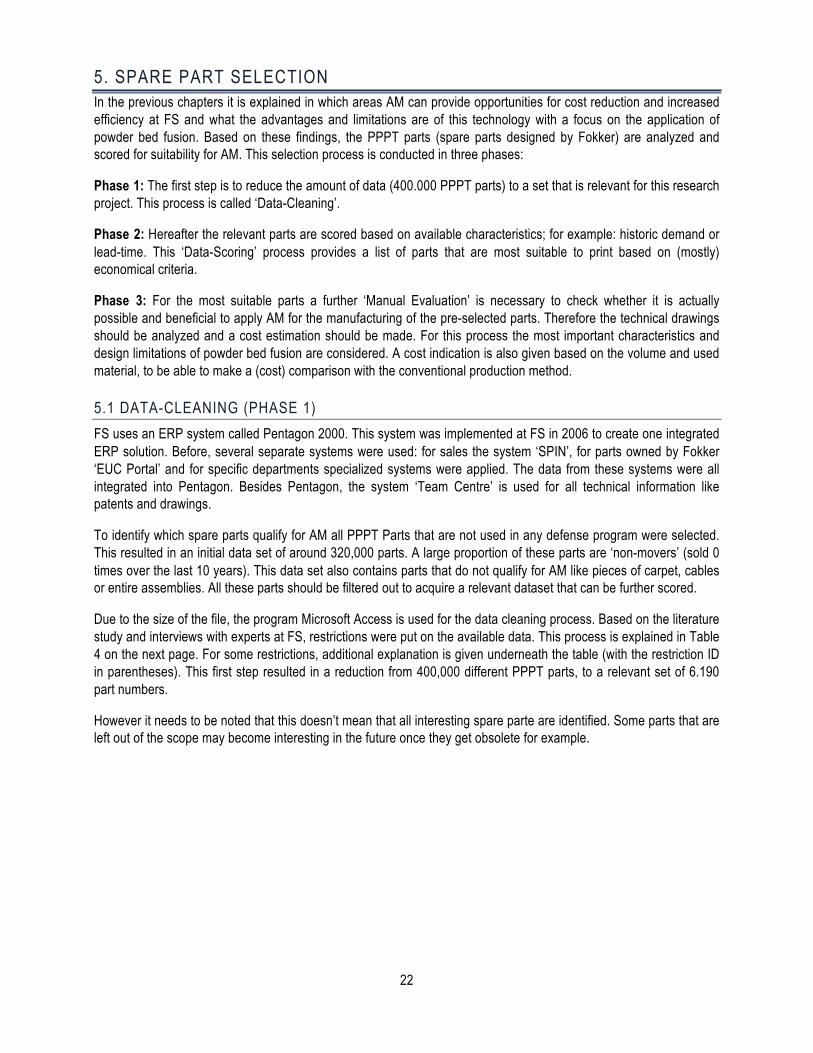
Due to the size of the file, the program Microsoft Access is used for the data cleaning process. Based on the literature study and interviews with experts at FS, restrictions were put on the available data. This process is explained in Table 4 on the next page. For some restrictions, additional explanation is given underneath the table (with the restriction ID in parentheses). This first step resulted in a reduction from 400,000 different PPPT parts, to a relevant set of 6.190 part numbers.
However it needs to be noted that this doesn’t mean that all interesting spare parte are identified. Some parts that are left out of the scope may become interesting in the future once they get obsolete for example.
23
ID Field Restriction Reason Remaining parts
1 All parts in Pentagon 2000 starting point, all digitalized partnumbers at FS + 1.000.000
2 Stock type: Proprietary Parts spare parts designed by Fokker 400.000
3 ITAR: “=N” military parts
4 DualUse: “=N” military parts 320.000
5 Multiple:Include if: Sellprice > 0 OR Userprice > 0 OR MinQty > 0
If these parts where sold/bought since 2006, at least one of these fields should contain information 151.932
6 MFG: Is Not Null If recent manufactured, this field should be filled 110.131
7 Partnumber:
0 < Right(Partnumber;3) <400 699 < Right(Partnumber;3) <800 899 < Right(Partnumber;3) <1000
Check last three digits of partnumber: Parts that are excluded are higher assemblies or installations; they contain a large number of piece parts
72.875
8 Keyword: Min {irrelevant keywords*}
If the part contains a keyword that indicates it is not suitable for printing (like carpet or cable), it will be deleted
39.866
9 Subs: "=1" Remove duplicate partnumbers, result: zero duplicates 38.735
10 Pricedate > 1999If the sell price did not changed since 1-1-2000, the part can be considered a non-mover 35.949
11 Historic sales # Sales orders since 2006 > 0When not sold since 2006 expected demand to low for non-recuring costs (one time costs; certification e.g.) 13.559
12 Baseprice > 20 When base price is low, AM is not competitive 6.190
TABLE 4 - DATA CLEANING
(2) As stated in Section 1.3, the research focuses on the PPPT parts of FS. (3, 4) These restrictions have been combined: ITAR is the code name for military parts, ‘DualUse’ means the spare
part is used both in commercial and military aircraft. In Section 1.3, it is explained why these parts cannot be taken into account in this study.
(5) If neither a ‘SellPrice’ (average price for which the part is sold), ‘UserPrice’ (average price for which the part is bought or produced) or ‘MinQty’ (minimum order quantity) is recorded for a part, the part will be left out. This means that the part is not sold or bought since the transition to the new ERP system in 2006.
(7) Most part numbers in the database follow a special structure; parts that end with 400-699 & 800-899 are higher Assemblies. This means they contain multiple piece parts, which exceeds the scope of this project as stated in Section 1.3.
(8) Every part in the database contains a keyword that describes the part and is indicative of suitability of a part for AM (a bracket is suitable, a carpet or wire is not suitable for AM). The database used contained 647 different keywords. In collaboration with a product manager and material expert of FS all keywords that contained 10 part numbers or more were analyzed (353 keywords). A value ‘Y’ or ‘N’ were assigned to these keywords: Y = suitable for printing, N = not suitable for printing. The results of this process can be found in Appendix D. The parts that were not analyzed because they contained less than 10 part number receive the default ‘Yes’ for suitability for AM.
(10) When a part is sold, the price will often be updated (especially if the price date is already old). A price date that is older than the year 2000 is almost certainly a non-mover.
(11) When the part is not sold since 2006, it is unlikely that the part will ordered regularly in the future. To acquire this information, a special query is needed that took around half our to complete for only 10,000 parts. Therefore, this query is conducted at a late stage of data cleaning. The expected demand is
(12) Low value parts are not interesting to be replaced by AM, due to the relatively expensive production process. According to the research of Berenschot, from a production/purchase price of 20 euros AM starts to become a feasible alternative (Ponfoort & Schotel, 2015).
24
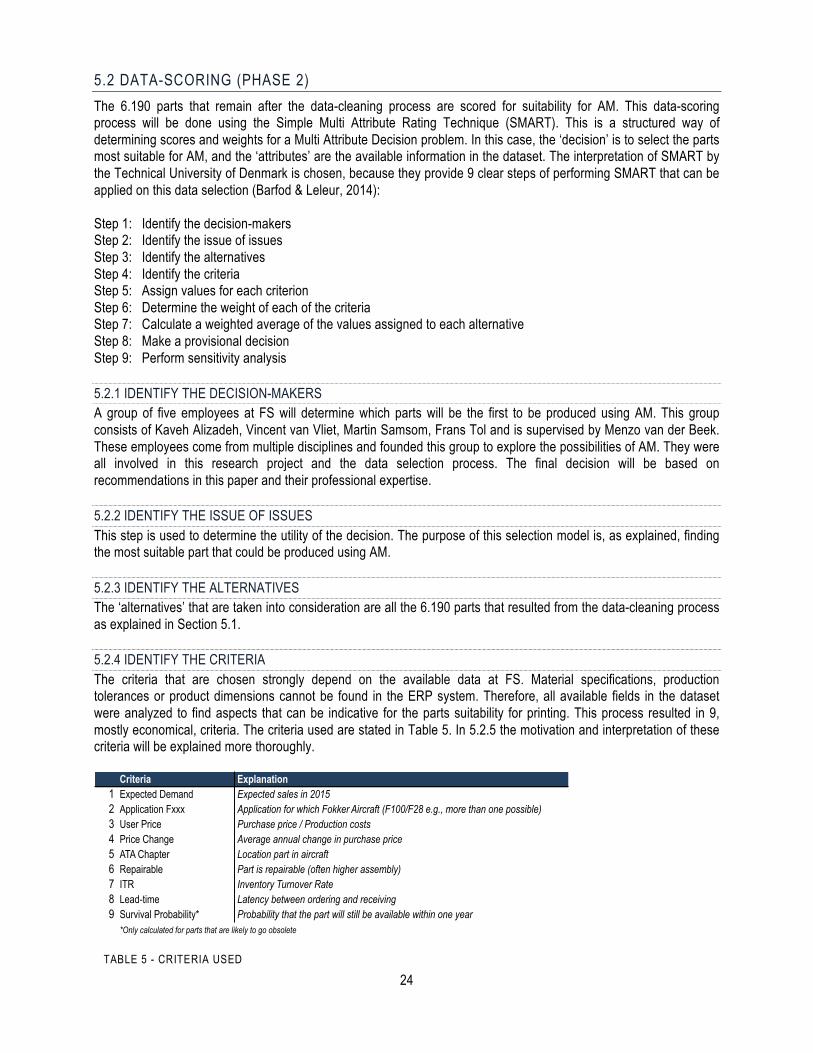
5.2 DATA-SCORING (PHASE 2) The 6.190 parts that remain after the data-cleaning process are scored for suitability for AM. This data-scoring process will be done using the Simple Multi Attribute Rating Technique (SMART). This is a structured way of determining scores and weights for a Multi Attribute Decision problem. In this case, the ‘decision’ is to select the parts most suitable for AM, and the ‘attributes’ are the available information in the dataset. The interpretation of SMART by the Technical University of Denmark is chosen, because they provide 9 clear steps of performing SMART that can be applied on this data selection (Barfod & Leleur, 2014): Step 1: Identify the decision-makers Step 2: Identify the issue of issues Step 3: Identify the alternatives Step 4: Identify the criteria Step 5: Assign values for each criterion Step 6: Determine the weight of each of the criteria Step 7: Calculate a weighted average of the values assigned to each alternative Step 8: Make a provisional decision Step 9: Perform sensitivity analysis 5.2.1 IDENTIFY THE DECISION-MAKERS A group of five employees at FS will determine which parts will be the first to be produced using AM. This group consists of Kaveh Alizadeh, Vincent van Vliet, Martin Samsom, Frans Tol and is supervised by Menzo van der Beek. These employees come from multiple disciplines and founded this group to explore the possibilities of AM. They were all involved in this research project and the data selection process. The final decision will be based on recommendations in this paper and their professional expertise. 5.2.2 IDENTIFY THE ISSUE OF ISSUES This step is used to determine the utility of the decision. The purpose of this selection model is, as explained, finding the most suitable part that could be produced using AM. 5.2.3 IDENTIFY THE ALTERNATIVES The ‘alternatives’ that are taken into consideration are all the 6.190 parts that resulted from the data-cleaning process as explained in Section 5.1. 5.2.4 IDENTIFY THE CRITERIA The criteria that are chosen strongly depend on the available data at FS. Material specifications, production tolerances or product dimensions cannot be found in the ERP system. Therefore, all available fields in the dataset were analyzed to find aspects that can be indicative for the parts suitability for printing. This process resulted in 9, mostly economical, criteria. The criteria used are stated in Table 5. In 5.2.5 the motivation and interpretation of these criteria will be explained more thoroughly.
Criteria Explanation1 Expected Demand Expected sales in 2015 2 Application Fxxx Application for which Fokker Aircraft (F100/F28 e.g., more than one possible)3 User Price Purchase price / Production costs4 Price Change Average annual change in purchase price5 ATA Chapter Location part in aircraft 6 Repairable Part is repairable (often higher assembly)7 ITR Inventory Turnover Rate8 Lead-time Latency between ordering and receiving9 Survival Probability* Probability that the part will still be available within one year
*Only calculated for parts that are likely to go obsolete
TABLE 5 - CRITERIA USED
25
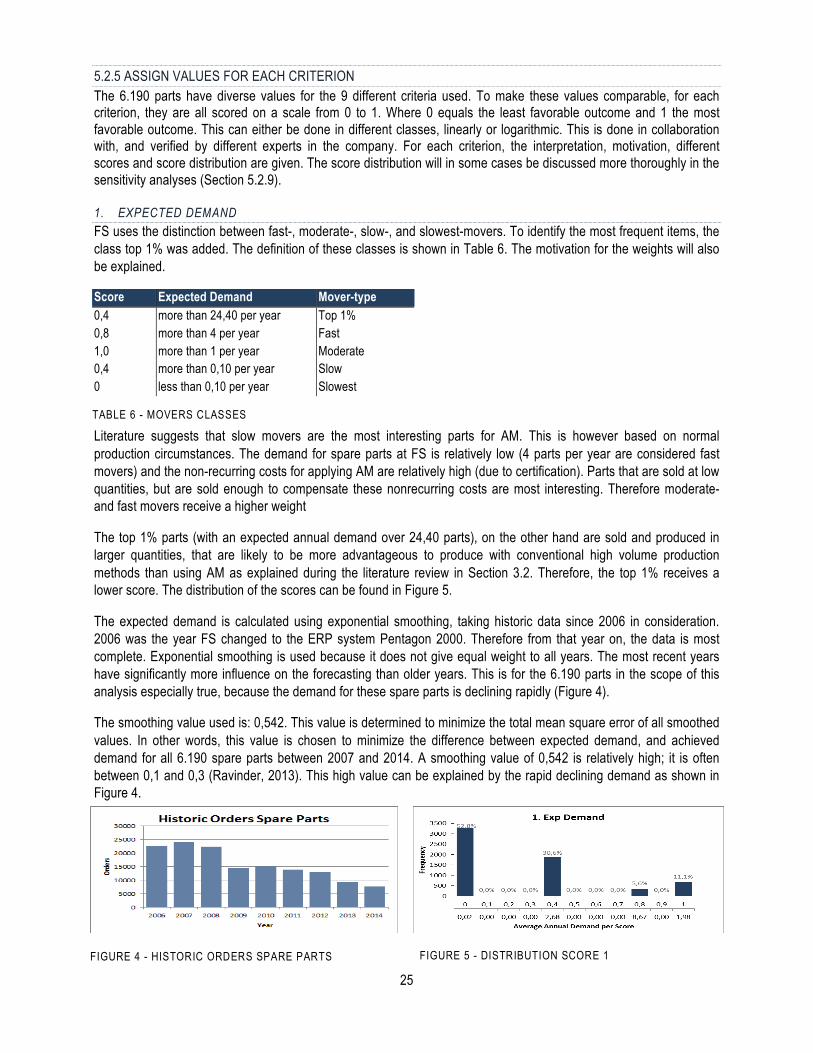
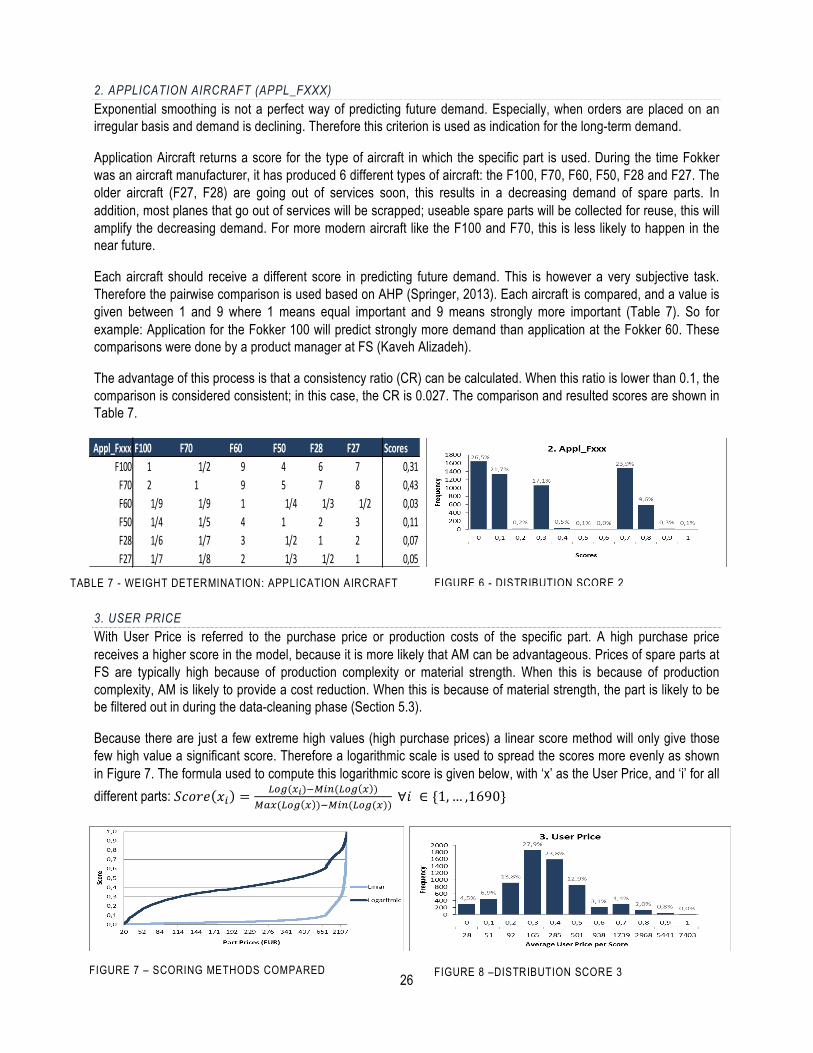
5.2.5 ASSIGN VALUES FOR EACH CRITERION The 6.190 parts have diverse values for the 9 different criteria used. To make these values comparable, for each criterion, they are all scored on a scale from 0 to 1. Where 0 equals the least favorable outcome and 1 the most favorable outcome. This can either be done in different classes, linearly or logarithmic. This is done in collaboration with, and verified by different experts in the company. For each criterion, the interpretation, motivation, different scores and score distribution are given. The score distribution will in some cases be discussed more thoroughly in the sensitivity analyses (Section 5.2.9). 1. EXPECTED DEMAND FS uses the distinction between fast-, moderate-, slow-, and slowest-movers. To identify the most frequent items, the class top 1% was added. The definition of these classes is shown in Table 6. The motivation for the weights will also be explained.
Score Expected Demand Mover-type 0,4 more than 24,40 per year Top 1% 0,8 more than 4 per year Fast 1,0 more than 1 per year Moderate 0,4 more than 0,10 per year Slow 0 less than 0,10 per year Slowest
Literature suggests that slow movers are the most interesting parts for AM. This is however based on normal production circumstances. The demand for spare parts at FS is relatively low (4 parts per year are considered fast movers) and the non-recurring costs for applying AM are relatively high (due to certification). Parts that are sold at low quantities, but are sold enough to compensate these nonrecurring costs are most interesting. Therefore moderate- and fast movers receive a higher weight
The top 1% parts (with an expected annual demand over 24,40 parts), on the other hand are sold and produced in larger quantities, that are likely to be more advantageous to produce with conventional high volume production methods than using AM as explained during the literature review in Section 3.2. Therefore, the top 1% receives a lower score. The distribution of the scores can be found in Figure 5.
The expected demand is calculated using exponential smoothing, taking historic data since 2006 in consideration. 2006 was the year FS changed to the ERP system Pentagon 2000. Therefore from that year on, the data is most complete. Exponential smoothing is used because it does not give equal weight to all years. The most recent years have significantly more influence on the forecasting than older years. This is for the 6.190 parts in the scope of this analysis especially true, because the demand for these spare parts is declining rapidly (Figure 4).
The smoothing value used is: 0,542. This value is determined to minimize the total mean square error of all smoothed values. In other words, this value is chosen to minimize the difference between expected demand, and achieved demand for all 6.190 spare parts between 2007 and 2014. A smoothing value of 0,542 is relatively high; it is often between 0,1 and 0,3 (Ravinder, 2013). This high value can be explained by the rapid declining demand as shown in Figure 4.
FIGURE 4 - HISTORIC ORDERS SPARE PARTS FIGURE 5 - DISTRIBUTION SCORE 1
TABLE 6 - MOVERS CLASSES
26
2. APPLICATION AIRCRAFT (APPL_FXXX) Exponential smoothing is not a perfect way of predicting future demand. Especially, when orders are placed on an irregular basis and demand is declining. Therefore this criterion is used as indication for the long-term demand.
Application Aircraft returns a score for the type of aircraft in which the specific part is used. During the time Fokker was an aircraft manufacturer, it has produced 6 different types of aircraft: the F100, F70, F60, F50, F28 and F27. The older aircraft (F27, F28) are going out of services soon, this results in a decreasing demand of spare parts. In addition, most planes that go out of services will be scrapped; useable spare parts will be collected for reuse, this will amplify the decreasing demand. For more modern aircraft like the F100 and F70, this is less likely to happen in the near future.
Each aircraft should receive a different score in predicting future demand. This is however a very subjective task. Therefore the pairwise comparison is used based on AHP (Springer, 2013). Each aircraft is compared, and a value is given between 1 and 9 where 1 means equal important and 9 means strongly more important (Table 7). So for example: Application for the Fokker 100 will predict strongly more demand than application at the Fokker 60. These comparisons were done by a product manager at FS (Kaveh Alizadeh).
The advantage of this process is that a consistency ratio (CR) can be calculated. When this ratio is lower than 0.1, the comparison is considered consistent; in this case, the CR is 0.027. The comparison and resulted scores are shown in Table 7.
3. USER PRICE With User Price is referred to the purchase price or production costs of the specific part. A high purchase price receives a higher score in the model, because it is more likely that AM can be advantageous. Prices of spare parts at FS are typically high because of production complexity or material strength. When this is because of production complexity, AM is likely to provide a cost reduction. When this is because of material strength, the part is likely to be be filtered out in during the data-cleaning phase (Section 5.3).
Because there are just a few extreme high values (high purchase prices) a linear score method will only give those few high value a significant score. Therefore a logarithmic scale is used to spread the scores more evenly as shown in Figure 7. The formula used to compute this logarithmic score is given below, with ‘x’ as the User Price, and ‘i’ for all different parts: 𝑆𝑐𝑜𝑟𝑒 𝑥! = !"#(!!)!!"#(!"# ! )
!"#(!"# ! )!!"#(!"#(!)) ∀𝑖 ∈ {1,… ,1690}
FIGURE 6 - DISTRIBUTION SCORE 2
FIGURE 8 –DISTRIBUTION SCORE 3 FIGURE 7 – SCORING METHODS COMPARED
Appl_Fxxx F100 F70 F60 F50 F28 F27 ScoresF100 1 1/2 9 4 6 7 0,31F70 2 1 9 5 7 8 0,43F60 1/9 1/9 1 1/4 1/3 1/2 0,03F50 1/4 1/5 4 1 2 3 0,11F28 1/6 1/7 3 1/2 1 2 0,07F27 1/7 1/8 2 1/3 1/2 1 0,05
TABLE 7 - WEIGHT DETERMINATION: APPLICATION AIRCRAFT
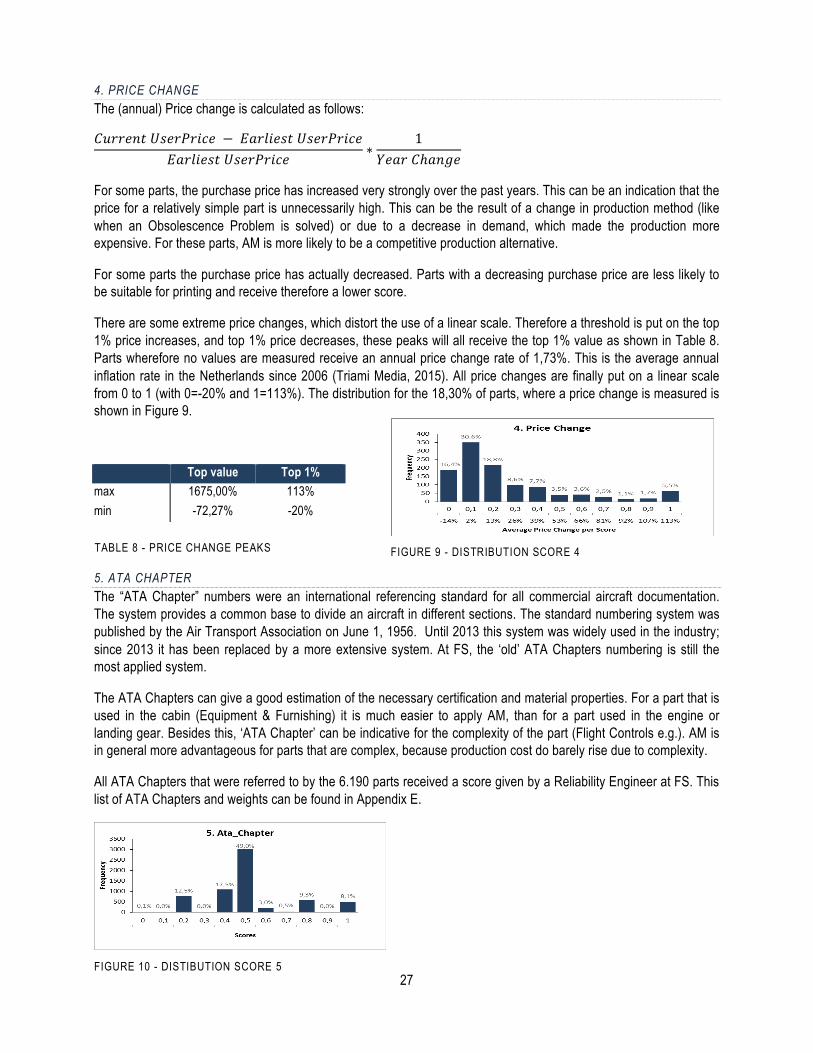
27
4. PRICE CHANGE The (annual) Price change is calculated as follows:
𝐶𝑢𝑟𝑟𝑒𝑛𝑡 𝑈𝑠𝑒𝑟𝑃𝑟𝑖𝑐𝑒 − 𝐸𝑎𝑟𝑙𝑖𝑒𝑠𝑡 𝑈𝑠𝑒𝑟𝑃𝑟𝑖𝑐𝑒𝐸𝑎𝑟𝑙𝑖𝑒𝑠𝑡 𝑈𝑠𝑒𝑟𝑃𝑟𝑖𝑐𝑒
∗1
𝑌𝑒𝑎𝑟 𝐶ℎ𝑎𝑛𝑔𝑒
For some parts, the purchase price has increased very strongly over the past years. This can be an indication that the price for a relatively simple part is unnecessarily high. This can be the result of a change in production method (like when an Obsolescence Problem is solved) or due to a decrease in demand, which made the production more expensive. For these parts, AM is more likely to be a competitive production alternative.
For some parts the purchase price has actually decreased. Parts with a decreasing purchase price are less likely to be suitable for printing and receive therefore a lower score.
There are some extreme price changes, which distort the use of a linear scale. Therefore a threshold is put on the top 1% price increases, and top 1% price decreases, these peaks will all receive the top 1% value as shown in Table 8. Parts wherefore no values are measured receive an annual price change rate of 1,73%. This is the average annual inflation rate in the Netherlands since 2006 (Triami Media, 2015). All price changes are finally put on a linear scale from 0 to 1 (with 0=-20% and 1=113%). The distribution for the 18,30% of parts, where a price change is measured is shown in Figure 9.
Top value Top 1% max 1675,00% 113% min -72,27% -20%
5. ATA CHAPTER The “ATA Chapter” numbers were an international referencing standard for all commercial aircraft documentation. The system provides a common base to divide an aircraft in different sections. The standard numbering system was published by the Air Transport Association on June 1, 1956. Until 2013 this system was widely used in the industry; since 2013 it has been replaced by a more extensive system. At FS, the ‘old’ ATA Chapters numbering is still the most applied system.
The ATA Chapters can give a good estimation of the necessary certification and material properties. For a part that is used in the cabin (Equipment & Furnishing) it is much easier to apply AM, than for a part used in the engine or landing gear. Besides this, ‘ATA Chapter’ can be indicative for the complexity of the part (Flight Controls e.g.). AM is in general more advantageous for parts that are complex, because production cost do barely rise due to complexity.
All ATA Chapters that were referred to by the 6.190 parts received a score given by a Reliability Engineer at FS. This list of ATA Chapters and weights can be found in Appendix E.
TABLE 8 - PRICE CHANGE PEAKS FIGURE 9 - DISTRIBUTION SCORE 4
FIGURE 10 - DISTIBUTION SCORE 5
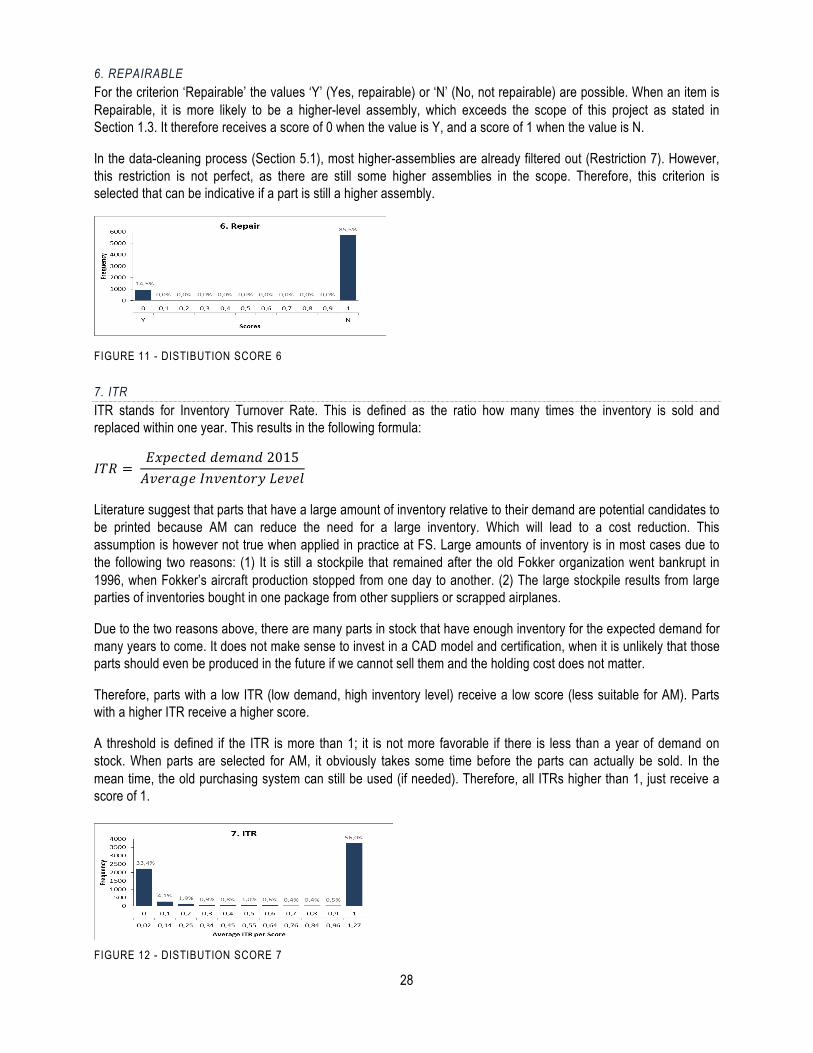
28
6. REPAIRABLE For the criterion ‘Repairable’ the values ‘Y’ (Yes, repairable) or ‘N’ (No, not repairable) are possible. When an item is Repairable, it is more likely to be a higher-level assembly, which exceeds the scope of this project as stated in Section 1.3. It therefore receives a score of 0 when the value is Y, and a score of 1 when the value is N.
In the data-cleaning process (Section 5.1), most higher-assemblies are already filtered out (Restriction 7). However, this restriction is not perfect, as there are still some higher assemblies in the scope. Therefore, this criterion is selected that can be indicative if a part is still a higher assembly.
7. ITR ITR stands for Inventory Turnover Rate. This is defined as the ratio how many times the inventory is sold and replaced within one year. This results in the following formula:
𝐼𝑇𝑅 = 𝐸𝑥𝑝𝑒𝑐𝑡𝑒𝑑 𝑑𝑒𝑚𝑎𝑛𝑑 2015𝐴𝑣𝑒𝑟𝑎𝑔𝑒 𝐼𝑛𝑣𝑒𝑛𝑡𝑜𝑟𝑦 𝐿𝑒𝑣𝑒𝑙
Literature suggest that parts that have a large amount of inventory relative to their demand are potential candidates to be printed because AM can reduce the need for a large inventory. Which will lead to a cost reduction. This assumption is however not true when applied in practice at FS. Large amounts of inventory is in most cases due to the following two reasons: (1) It is still a stockpile that remained after the old Fokker organization went bankrupt in 1996, when Fokker’s aircraft production stopped from one day to another. (2) The large stockpile results from large parties of inventories bought in one package from other suppliers or scrapped airplanes.
Due to the two reasons above, there are many parts in stock that have enough inventory for the expected demand for many years to come. It does not make sense to invest in a CAD model and certification, when it is unlikely that those parts should even be produced in the future if we cannot sell them and the holding cost does not matter.
Therefore, parts with a low ITR (low demand, high inventory level) receive a low score (less suitable for AM). Parts with a higher ITR receive a higher score.
A threshold is defined if the ITR is more than 1; it is not more favorable if there is less than a year of demand on stock. When parts are selected for AM, it obviously takes some time before the parts can actually be sold. In the mean time, the old purchasing system can still be used (if needed). Therefore, all ITRs higher than 1, just receive a score of 1.
FIGURE 11 - DISTIBUTION SCORE 6
FIGURE 12 - DISTIBUTION SCORE 7
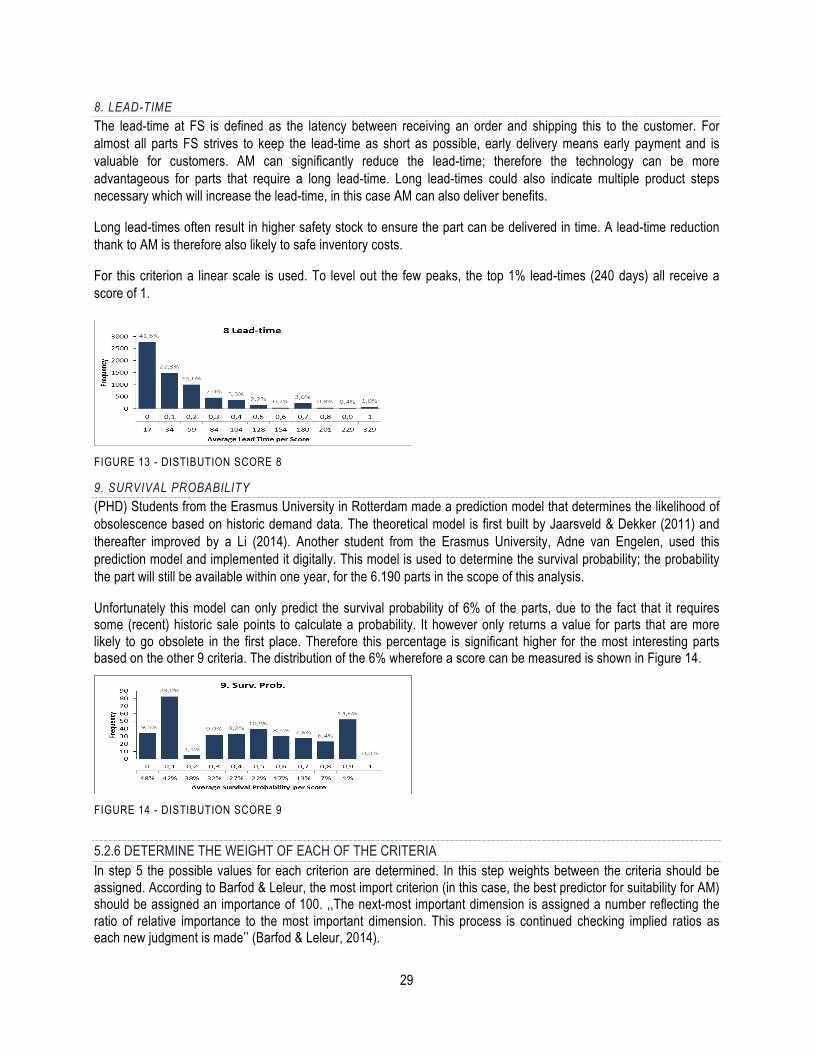
29
8. LEAD-TIME The lead-time at FS is defined as the latency between receiving an order and shipping this to the customer. For almost all parts FS strives to keep the lead-time as short as possible, early delivery means early payment and is valuable for customers. AM can significantly reduce the lead-time; therefore the technology can be more advantageous for parts that require a long lead-time. Long lead-times could also indicate multiple product steps necessary which will increase the lead-time, in this case AM can also deliver benefits.
Long lead-times often result in higher safety stock to ensure the part can be delivered in time. A lead-time reduction thank to AM is therefore also likely to safe inventory costs.
For this criterion a linear scale is used. To level out the few peaks, the top 1% lead-times (240 days) all receive a score of 1.
9. SURVIVAL PROBABILITY (PHD) Students from the Erasmus University in Rotterdam made a prediction model that determines the likelihood of obsolescence based on historic demand data. The theoretical model is first built by Jaarsveld & Dekker (2011) and thereafter improved by a Li (2014). Another student from the Erasmus University, Adne van Engelen, used this prediction model and implemented it digitally. This model is used to determine the survival probability; the probability the part will still be available within one year, for the 6.190 parts in the scope of this analysis.
Unfortunately this model can only predict the survival probability of 6% of the parts, due to the fact that it requires some (recent) historic sale points to calculate a probability. It however only returns a value for parts that are more likely to go obsolete in the first place. Therefore this percentage is significant higher for the most interesting parts based on the other 9 criteria. The distribution of the 6% wherefore a score can be measured is shown in Figure 14.
5.2.6 DETERMINE THE WEIGHT OF EACH OF THE CRITERIA In step 5 the possible values for each criterion are determined. In this step weights between the criteria should be assigned. According to Barfod & Leleur, the most import criterion (in this case, the best predictor for suitability for AM) should be assigned an importance of 100. ,,The next-most important dimension is assigned a number reflecting the ratio of relative importance to the most important dimension. This process is continued checking implied ratios as each new judgment is made’’ (Barfod & Leleur, 2014).
FIGURE 13 - DISTIBUTION SCORE 8
FIGURE 14 - DISTIBUTION SCORE 9
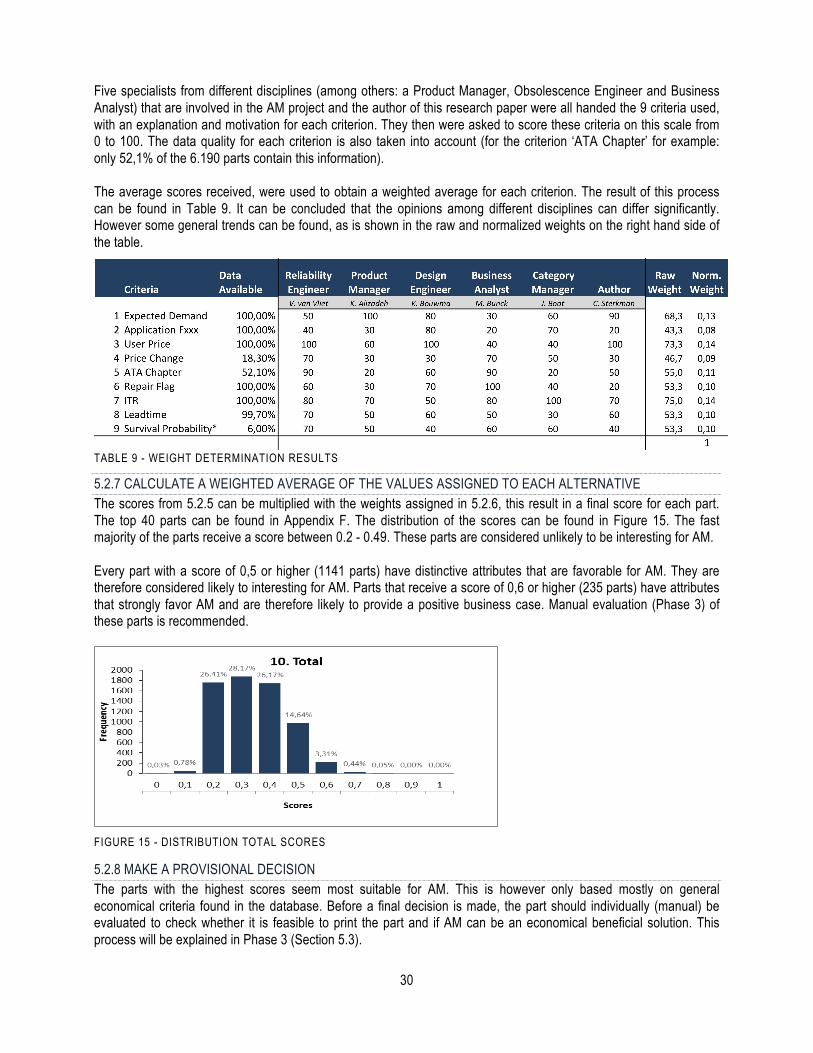
30
Five specialists from different disciplines (among others: a Product Manager, Obsolescence Engineer and Business Analyst) that are involved in the AM project and the author of this research paper were all handed the 9 criteria used, with an explanation and motivation for each criterion. They then were asked to score these criteria on this scale from 0 to 100. The data quality for each criterion is also taken into account (for the criterion ‘ATA Chapter’ for example: only 52,1% of the 6.190 parts contain this information). The average scores received, were used to obtain a weighted average for each criterion. The result of this process can be found in Table 9. It can be concluded that the opinions among different disciplines can differ significantly. However some general trends can be found, as is shown in the raw and normalized weights on the right hand side of the table.
TABLE 9 - WEIGHT DETERMINATION RESULTS
5.2.7 CALCULATE A WEIGHTED AVERAGE OF THE VALUES ASSIGNED TO EACH ALTERNATIVE The scores from 5.2.5 can be multiplied with the weights assigned in 5.2.6, this result in a final score for each part. The top 40 parts can be found in Appendix F. The distribution of the scores can be found in Figure 15. The fast majority of the parts receive a score between 0.2 - 0.49. These parts are considered unlikely to be interesting for AM. Every part with a score of 0,5 or higher (1141 parts) have distinctive attributes that are favorable for AM. They are therefore considered likely to interesting for AM. Parts that receive a score of 0,6 or higher (235 parts) have attributes that strongly favor AM and are therefore likely to provide a positive business case. Manual evaluation (Phase 3) of these parts is recommended.
5.2.8 MAKE A PROVISIONAL DECISION The parts with the highest scores seem most suitable for AM. This is however only based mostly on general economical criteria found in the database. Before a final decision is made, the part should individually (manual) be evaluated to check whether it is feasible to print the part and if AM can be an economical beneficial solution. This process will be explained in Phase 3 (Section 5.3).
FIGURE 15 - DISTRIBUTION TOTAL SCORES
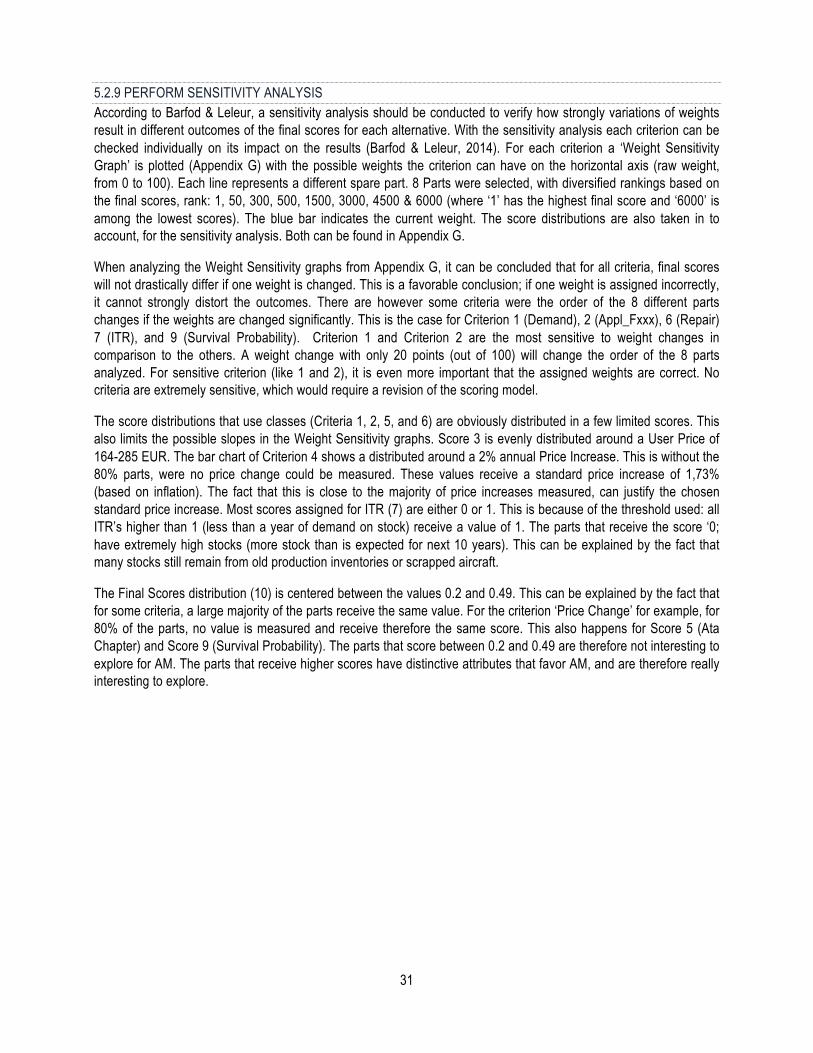
31
5.2.9 PERFORM SENSITIVITY ANALYSIS According to Barfod & Leleur, a sensitivity analysis should be conducted to verify how strongly variations of weights result in different outcomes of the final scores for each alternative. With the sensitivity analysis each criterion can be checked individually on its impact on the results (Barfod & Leleur, 2014). For each criterion a ‘Weight Sensitivity Graph’ is plotted (Appendix G) with the possible weights the criterion can have on the horizontal axis (raw weight, from 0 to 100). Each line represents a different spare part. 8 Parts were selected, with diversified rankings based on the final scores, rank: 1, 50, 300, 500, 1500, 3000, 4500 & 6000 (where ‘1’ has the highest final score and ‘6000’ is among the lowest scores). The blue bar indicates the current weight. The score distributions are also taken in to account, for the sensitivity analysis. Both can be found in Appendix G.
When analyzing the Weight Sensitivity graphs from Appendix G, it can be concluded that for all criteria, final scores will not drastically differ if one weight is changed. This is a favorable conclusion; if one weight is assigned incorrectly, it cannot strongly distort the outcomes. There are however some criteria were the order of the 8 different parts changes if the weights are changed significantly. This is the case for Criterion 1 (Demand), 2 (Appl_Fxxx), 6 (Repair) 7 (ITR), and 9 (Survival Probability). Criterion 1 and Criterion 2 are the most sensitive to weight changes in comparison to the others. A weight change with only 20 points (out of 100) will change the order of the 8 parts analyzed. For sensitive criterion (like 1 and 2), it is even more important that the assigned weights are correct. No criteria are extremely sensitive, which would require a revision of the scoring model.
The score distributions that use classes (Criteria 1, 2, 5, and 6) are obviously distributed in a few limited scores. This also limits the possible slopes in the Weight Sensitivity graphs. Score 3 is evenly distributed around a User Price of 164-285 EUR. The bar chart of Criterion 4 shows a distributed around a 2% annual Price Increase. This is without the 80% parts, were no price change could be measured. These values receive a standard price increase of 1,73% (based on inflation). The fact that this is close to the majority of price increases measured, can justify the chosen standard price increase. Most scores assigned for ITR (7) are either 0 or 1. This is because of the threshold used: all ITR’s higher than 1 (less than a year of demand on stock) receive a value of 1. The parts that receive the score ‘0; have extremely high stocks (more stock than is expected for next 10 years). This can be explained by the fact that many stocks still remain from old production inventories or scrapped aircraft.
The Final Scores distribution (10) is centered between the values 0.2 and 0.49. This can be explained by the fact that for some criteria, a large majority of the parts receive the same value. For the criterion ‘Price Change’ for example, for 80% of the parts, no value is measured and receive therefore the same score. This also happens for Score 5 (Ata Chapter) and Score 9 (Survival Probability). The parts that score between 0.2 and 0.49 are therefore not interesting to explore for AM. The parts that receive higher scores have distinctive attributes that favor AM, and are therefore really interesting to explore.
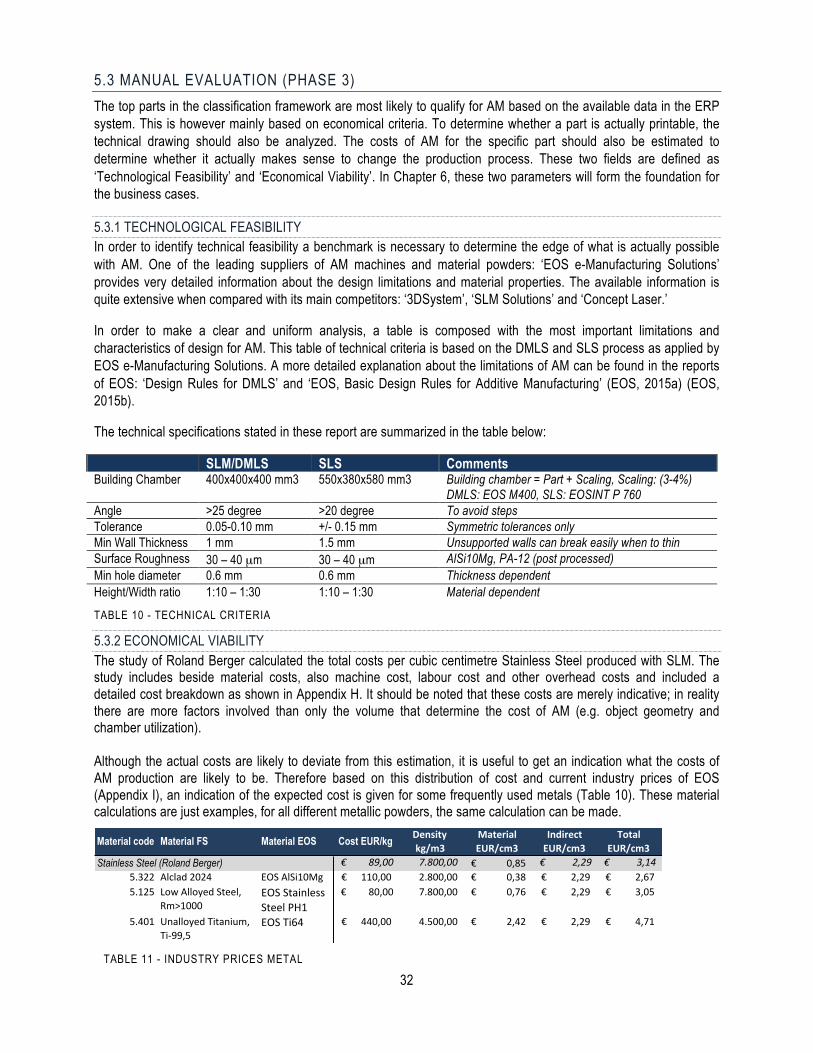
32
5.3 MANUAL EVALUATION (PHASE 3) The top parts in the classification framework are most likely to qualify for AM based on the available data in the ERP system. This is however mainly based on economical criteria. To determine whether a part is actually printable, the technical drawing should also be analyzed. The costs of AM for the specific part should also be estimated to determine whether it actually makes sense to change the production process. These two fields are defined as ‘Technological Feasibility’ and ‘Economical Viability’. In Chapter 6, these two parameters will form the foundation for the business cases.
5.3.1 TECHNOLOGICAL FEASIBILITY In order to identify technical feasibility a benchmark is necessary to determine the edge of what is actually possible with AM. One of the leading suppliers of AM machines and material powders: ‘EOS e-Manufacturing Solutions’ provides very detailed information about the design limitations and material properties. The available information is quite extensive when compared with its main competitors: ‘3DSystem’, ‘SLM Solutions’ and ‘Concept Laser.’
In order to make a clear and uniform analysis, a table is composed with the most important limitations and characteristics of design for AM. This table of technical criteria is based on the DMLS and SLS process as applied by EOS e-Manufacturing Solutions. A more detailed explanation about the limitations of AM can be found in the reports of EOS: ‘Design Rules for DMLS’ and ‘EOS, Basic Design Rules for Additive Manufacturing’ (EOS, 2015a) (EOS, 2015b).
The technical specifications stated in these report are summarized in the table below:
SLM/DMLS SLS Comments Building Chamber 400x400x400 mm3 550x380x580 mm3
Building chamber = Part + Scaling, Scaling: (3-4%) DMLS: EOS M400, SLS: EOSINT P 760
Angle >25 degree >20 degree To avoid steps Tolerance 0.05-0.10 mm +/- 0.15 mm Symmetric tolerances only Min Wall Thickness 1 mm 1.5 mm Unsupported walls can break easily when to thin Surface Roughness 30 – 40 µm 30 – 40 µm AlSi10Mg, PA-12 (post processed) Min hole diameter 0.6 mm 0.6 mm Thickness dependent Height/Width ratio 1:10 – 1:30 1:10 – 1:30 Material dependent
TABLE 10 - TECHNICAL CRITERIA
5.3.2 ECONOMICAL VIABILITY The study of Roland Berger calculated the total costs per cubic centimetre Stainless Steel produced with SLM. The study includes beside material costs, also machine cost, labour cost and other overhead costs and included a detailed cost breakdown as shown in Appendix H. It should be noted that these costs are merely indicative; in reality there are more factors involved than only the volume that determine the cost of AM (e.g. object geometry and chamber utilization). Although the actual costs are likely to deviate from this estimation, it is useful to get an indication what the costs of AM production are likely to be. Therefore based on this distribution of cost and current industry prices of EOS (Appendix I), an indication of the expected cost is given for some frequently used metals (Table 10). These material calculations are just examples, for all different metallic powders, the same calculation can be made.
Material code Material FS Material EOS Cost EUR/kg Density(kg/m3
!€!!!!!!!!!89,00! !!!!!!!7.800,00!5.322 Alclad*2024 EOS*AlSi10Mg 110,00€******* *******2.800,00*
5.125 Low*Alloyed*Steel,*
Rm>1000
EOS*Stainless*
Steel*PH1
*€*********80,00* *******7.800,00*
5.401 Unalloyed*Titanium,*
TiH99,5
EOS*Ti64 440,00€******* *******4.500,00*
Stainless Steel (Roland Berger)
Material(EUR/cm3
Indirect(EUR/cm3
Total(EUR/cm3
0,85€************* !€!!!!!!!!!!!2,29! !€!!!!!!!!!!!3,14!0,38€************* 2,29€*********** 2,67€***********
0,76€************* 2,29€*********** 3,05€***********
2,42€************* 2,29€*********** 4,71€***********
TABLE 11 - INDUSTRY PRICES METAL
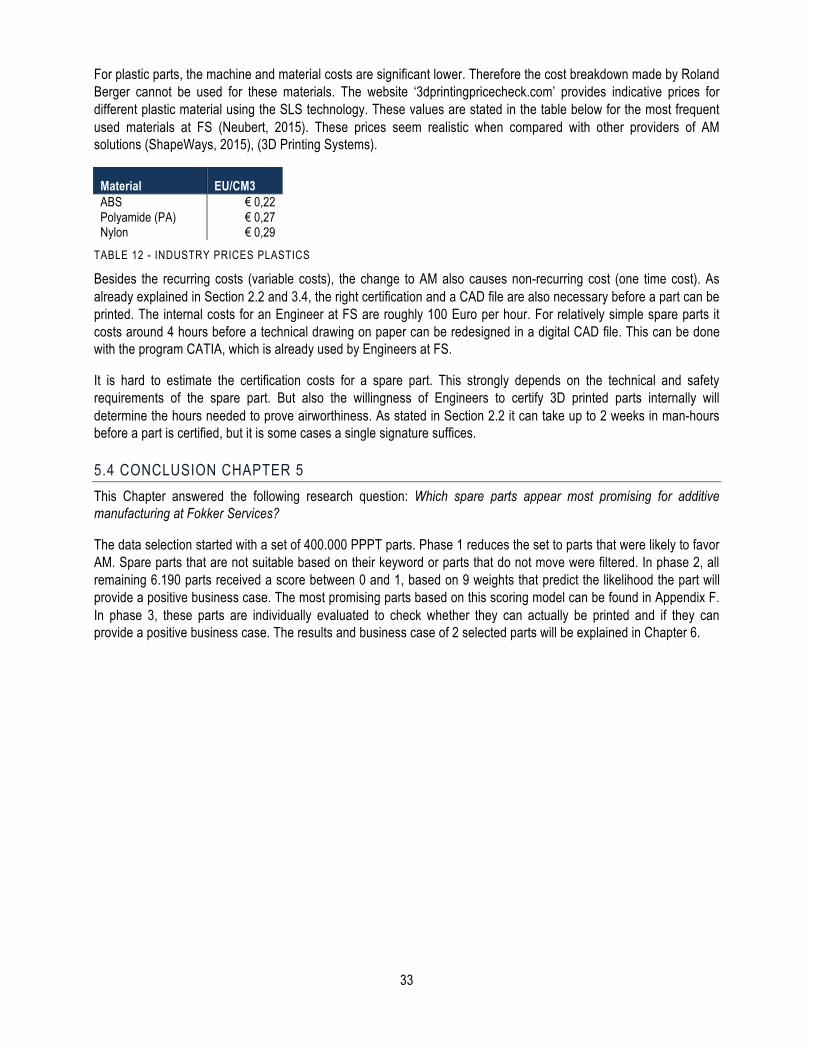
33
For plastic parts, the machine and material costs are significant lower. Therefore the cost breakdown made by Roland Berger cannot be used for these materials. The website ‘3dprintingpricecheck.com’ provides indicative prices for different plastic material using the SLS technology. These values are stated in the table below for the most frequent used materials at FS (Neubert, 2015). These prices seem realistic when compared with other providers of AM solutions (ShapeWays, 2015), (3D Printing Systems).
Material EU/CM3 ABS € 0,22 Polyamide (PA) € 0,27 Nylon € 0,29
TABLE 12 - INDUSTRY PRICES PLASTICS
Besides the recurring costs (variable costs), the change to AM also causes non-recurring cost (one time cost). As already explained in Section 2.2 and 3.4, the right certification and a CAD file are also necessary before a part can be printed. The internal costs for an Engineer at FS are roughly 100 Euro per hour. For relatively simple spare parts it costs around 4 hours before a technical drawing on paper can be redesigned in a digital CAD file. This can be done with the program CATIA, which is already used by Engineers at FS.
It is hard to estimate the certification costs for a spare part. This strongly depends on the technical and safety requirements of the spare part. But also the willingness of Engineers to certify 3D printed parts internally will determine the hours needed to prove airworthiness. As stated in Section 2.2 it can take up to 2 weeks in man-hours before a part is certified, but it is some cases a single signature suffices.
5.4 CONCLUSION CHAPTER 5 This Chapter answered the following research question: Which spare parts appear most promising for additive manufacturing at Fokker Services?
The data selection started with a set of 400.000 PPPT parts. Phase 1 reduces the set to parts that were likely to favor AM. Spare parts that are not suitable based on their keyword or parts that do not move were filtered. In phase 2, all remaining 6.190 parts received a score between 0 and 1, based on 9 weights that predict the likelihood the part will provide a positive business case. The most promising parts based on this scoring model can be found in Appendix F. In phase 3, these parts are individually evaluated to check whether they can actually be printed and if they can provide a positive business case. The results and business case of 2 selected parts will be explained in Chapter 6.
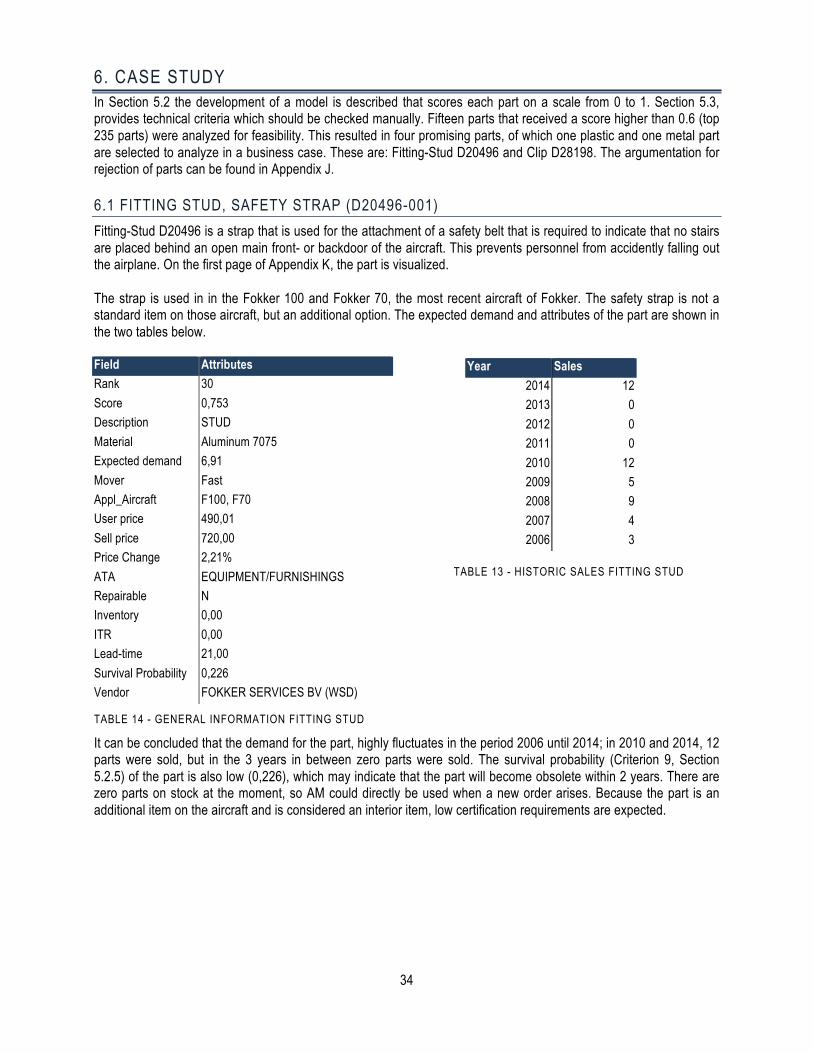
34
6. CASE STUDY In Section 5.2 the development of a model is described that scores each part on a scale from 0 to 1. Section 5.3, provides technical criteria which should be checked manually. Fifteen parts that received a score higher than 0.6 (top 235 parts) were analyzed for feasibility. This resulted in four promising parts, of which one plastic and one metal part are selected to analyze in a business case. These are: Fitting-Stud D20496 and Clip D28198. The argumentation for rejection of parts can be found in Appendix J.
6.1 FITTING STUD, SAFETY STRAP (D20496-001) Fitting-Stud D20496 is a strap that is used for the attachment of a safety belt that is required to indicate that no stairs are placed behind an open main front- or backdoor of the aircraft. This prevents personnel from accidently falling out the airplane. On the first page of Appendix K, the part is visualized. The strap is used in in the Fokker 100 and Fokker 70, the most recent aircraft of Fokker. The safety strap is not a standard item on those aircraft, but an additional option. The expected demand and attributes of the part are shown in the two tables below. Field Attributes Rank 30 Score 0,753 Description STUD Material Aluminum 7075 Expected demand 6,91 Mover Fast Appl_Aircraft F100, F70 User price 490,01 Sell price 720,00 Price Change 2,21% ATA EQUIPMENT/FURNISHINGS Repairable N Inventory 0,00 ITR 0,00 Lead-time 21,00 Survival Probability 0,226 Vendor FOKKER SERVICES BV (WSD)
TABLE 14 - GENERAL INFORMATION FITTING STUD
It can be concluded that the demand for the part, highly fluctuates in the period 2006 until 2014; in 2010 and 2014, 12 parts were sold, but in the 3 years in between zero parts were sold. The survival probability (Criterion 9, Section 5.2.5) of the part is also low (0,226), which may indicate that the part will become obsolete within 2 years. There are zero parts on stock at the moment, so AM could directly be used when a new order arises. Because the part is an additional item on the aircraft and is considered an interior item, low certification requirements are expected.
Year Sales 2014 12 2013 0 2012 0 2011 0 2010 12 2009 5 2008 9 2007 4 2006 3
TABLE 13 - HISTORIC SALES FITTING STUD
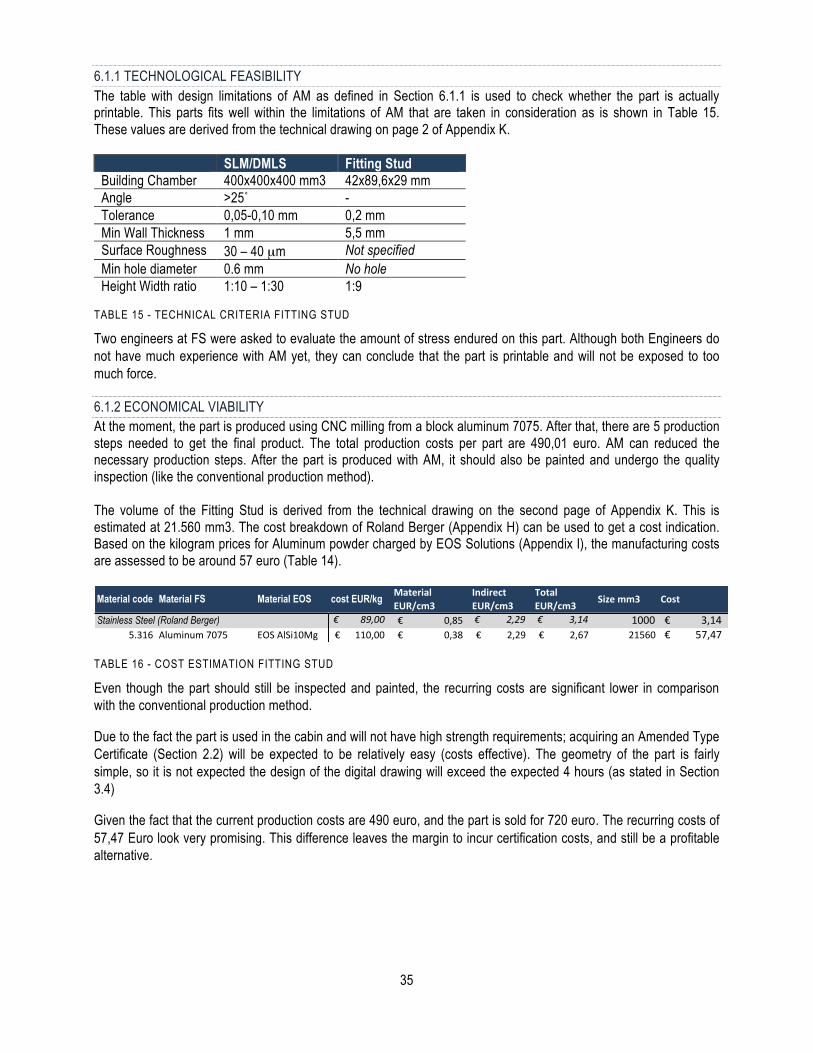
35
6.1.1 TECHNOLOGICAL FEASIBILITY The table with design limitations of AM as defined in Section 6.1.1 is used to check whether the part is actually printable. This parts fits well within the limitations of AM that are taken in consideration as is shown in Table 15. These values are derived from the technical drawing on page 2 of Appendix K.
SLM/DMLS Fitting Stud Building Chamber 400x400x400 mm3 42x89,6x29 mm Angle >25˚ - Tolerance 0,05-0,10 mm 0,2 mm Min Wall Thickness 1 mm 5,5 mm Surface Roughness 30 – 40 µm Not specified Min hole diameter 0.6 mm No hole Height Width ratio 1:10 – 1:30 1:9
TABLE 15 - TECHNICAL CRITERIA FITTING STUD
Two engineers at FS were asked to evaluate the amount of stress endured on this part. Although both Engineers do not have much experience with AM yet, they can conclude that the part is printable and will not be exposed to too much force.
6.1.2 ECONOMICAL VIABILITY At the moment, the part is produced using CNC milling from a block aluminum 7075. After that, there are 5 production steps needed to get the final product. The total production costs per part are 490,01 euro. AM can reduced the necessary production steps. After the part is produced with AM, it should also be painted and undergo the quality inspection (like the conventional production method). The volume of the Fitting Stud is derived from the technical drawing on the second page of Appendix K. This is estimated at 21.560 mm3. The cost breakdown of Roland Berger (Appendix H) can be used to get a cost indication. Based on the kilogram prices for Aluminum powder charged by EOS Solutions (Appendix I), the manufacturing costs are assessed to be around 57 euro (Table 14). Material code Material FS Material EOS cost EUR/kg
!€!!!!!!!!!89,00!5.316 Aluminum,7075 EOS,AlSi10Mg 110,00€,,,,,,,
Stainless Steel (Roland Berger)
Material(EUR/cm3
Indirect(EUR/cm3
Total(EUR/cm3 Size(mm3 Cost
0,85€,,,,,,,,,,,,,,,, !€!!!!!!!!!!!2,29! !€!!!!!!!!!!!3,14! 1000 3,14€,,,,,,,,,,,,0,38€,,,,,,,,,,,,,,,, 2,29€,,,,,,,,,,, 2,67€,,,,,,,,,,, 21560 57,47€,,,,,,,,,,
TABLE 16 - COST ESTIMATION FITTING STUD
Even though the part should still be inspected and painted, the recurring costs are significant lower in comparison with the conventional production method.
Due to the fact the part is used in the cabin and will not have high strength requirements; acquiring an Amended Type Certificate (Section 2.2) will be expected to be relatively easy (costs effective). The geometry of the part is fairly simple, so it is not expected the design of the digital drawing will exceed the expected 4 hours (as stated in Section 3.4)
Given the fact that the current production costs are 490 euro, and the part is sold for 720 euro. The recurring costs of 57,47 Euro look very promising. This difference leaves the margin to incur certification costs, and still be a profitable alternative.
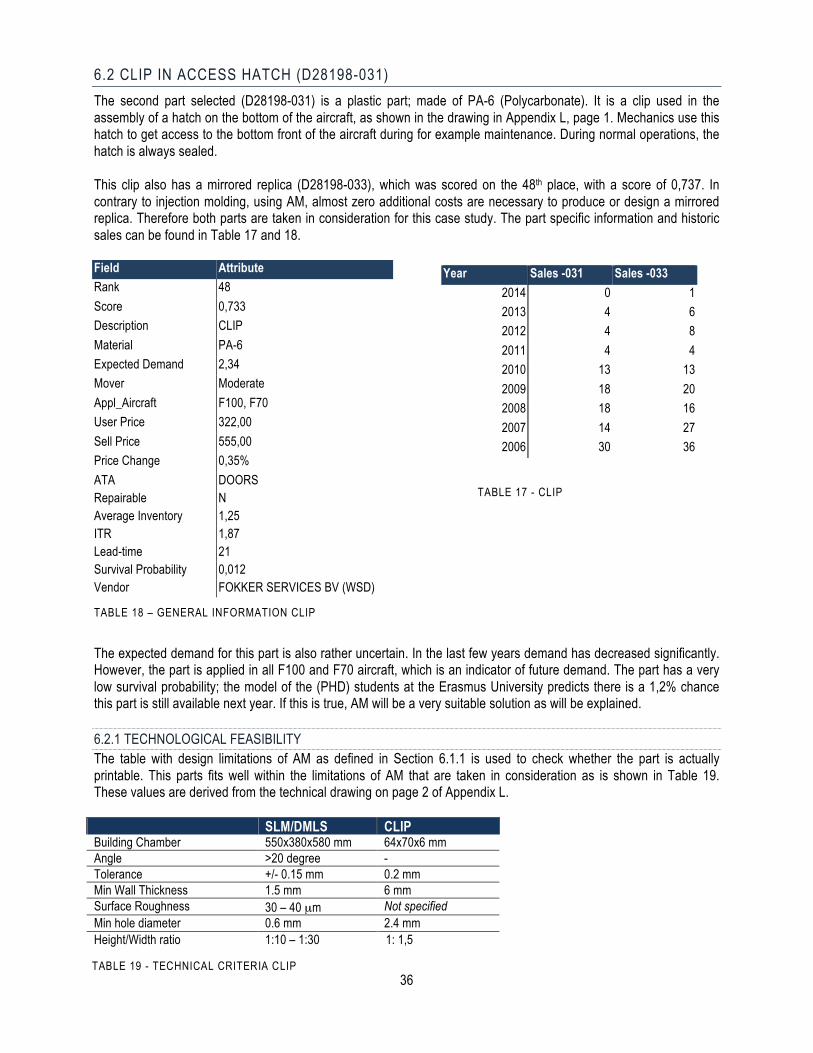
36
6.2 CLIP IN ACCESS HATCH (D28198-031) The second part selected (D28198-031) is a plastic part; made of PA-6 (Polycarbonate). It is a clip used in the assembly of a hatch on the bottom of the aircraft, as shown in the drawing in Appendix L, page 1. Mechanics use this hatch to get access to the bottom front of the aircraft during for example maintenance. During normal operations, the hatch is always sealed. This clip also has a mirrored replica (D28198-033), which was scored on the 48th place, with a score of 0,737. In contrary to injection molding, using AM, almost zero additional costs are necessary to produce or design a mirrored replica. Therefore both parts are taken in consideration for this case study. The part specific information and historic sales can be found in Table 17 and 18. Field Attribute Rank 48 Score 0,733 Description CLIP Material PA-6 Expected Demand 2,34 Mover Moderate Appl_Aircraft F100, F70 User Price 322,00 Sell Price 555,00 Price Change 0,35% ATA DOORS Repairable N Average Inventory 1,25 ITR 1,87 Lead-time 21 Survival Probability 0,012 Vendor FOKKER SERVICES BV (WSD)
TABLE 18 – GENERAL INFORMATION CLIP
The expected demand for this part is also rather uncertain. In the last few years demand has decreased significantly. However, the part is applied in all F100 and F70 aircraft, which is an indicator of future demand. The part has a very low survival probability; the model of the (PHD) students at the Erasmus University predicts there is a 1,2% chance this part is still available next year. If this is true, AM will be a very suitable solution as will be explained. 6.2.1 TECHNOLOGICAL FEASIBILITY The table with design limitations of AM as defined in Section 6.1.1 is used to check whether the part is actually printable. This parts fits well within the limitations of AM that are taken in consideration as is shown in Table 19. These values are derived from the technical drawing on page 2 of Appendix L. SLM/DMLS CLIP Building Chamber 550x380x580 mm 64x70x6 mm Angle >20 degree - Tolerance +/- 0.15 mm 0.2 mm Min Wall Thickness 1.5 mm 6 mm Surface Roughness 30 – 40 µm Not specified Min hole diameter 0.6 mm 2.4 mm Height/Width ratio 1:10 – 1:30 1: 1,5
TABLE 17 - CLIP
Year Sales -031 Sales -033 2014 0 1 2013 4 6 2012 4 8 2011 4 4 2010 13 13 2009 18 20 2008 18 16 2007 14 27 2006 30 36
TABLE 19 - TECHNICAL CRITERIA CLIP
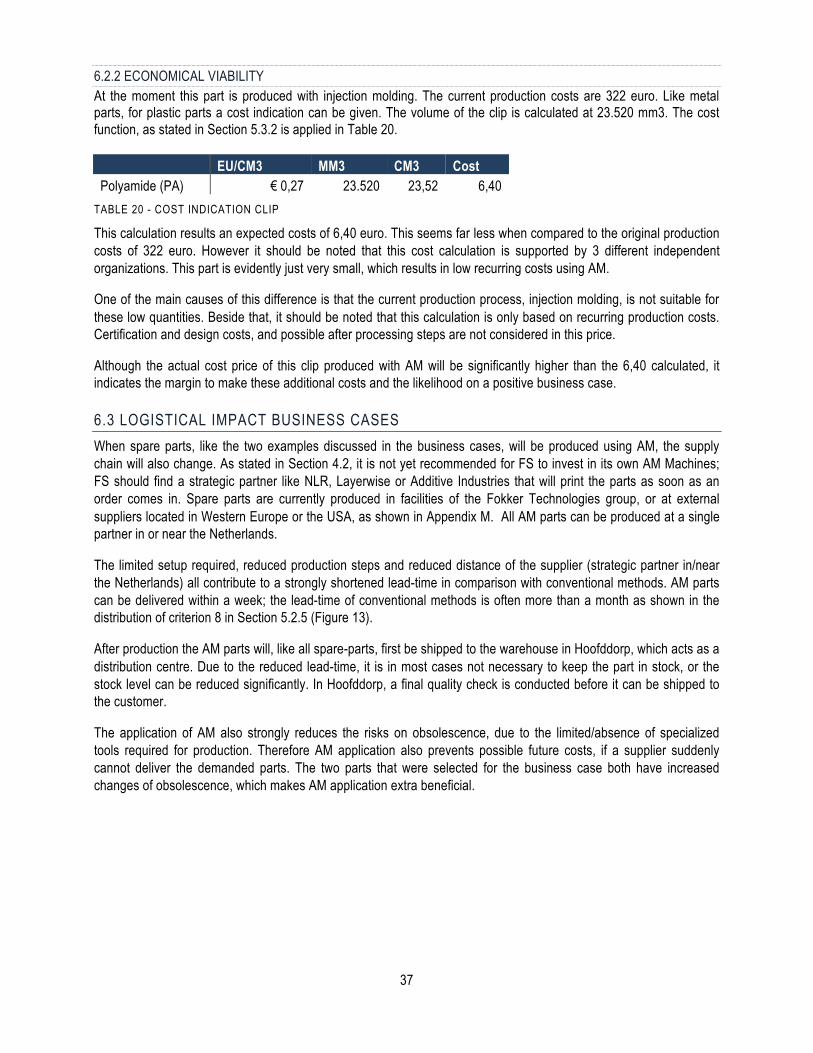
37
6.2.2 ECONOMICAL VIABILITY At the moment this part is produced with injection molding. The current production costs are 322 euro. Like metal parts, for plastic parts a cost indication can be given. The volume of the clip is calculated at 23.520 mm3. The cost function, as stated in Section 5.3.2 is applied in Table 20. EU/CM3 MM3 CM3 Cost Polyamide (PA) € 0,27 23.520 23,52 6,40
TABLE 20 - COST INDICATION CLIP
This calculation results an expected costs of 6,40 euro. This seems far less when compared to the original production costs of 322 euro. However it should be noted that this cost calculation is supported by 3 different independent organizations. This part is evidently just very small, which results in low recurring costs using AM.
One of the main causes of this difference is that the current production process, injection molding, is not suitable for these low quantities. Beside that, it should be noted that this calculation is only based on recurring production costs. Certification and design costs, and possible after processing steps are not considered in this price.
Although the actual cost price of this clip produced with AM will be significantly higher than the 6,40 calculated, it indicates the margin to make these additional costs and the likelihood on a positive business case.
6.3 LOGISTICAL IMPACT BUSINESS CASES When spare parts, like the two examples discussed in the business cases, will be produced using AM, the supply chain will also change. As stated in Section 4.2, it is not yet recommended for FS to invest in its own AM Machines; FS should find a strategic partner like NLR, Layerwise or Additive Industries that will print the parts as soon as an order comes in. Spare parts are currently produced in facilities of the Fokker Technologies group, or at external suppliers located in Western Europe or the USA, as shown in Appendix M. All AM parts can be produced at a single partner in or near the Netherlands.
The limited setup required, reduced production steps and reduced distance of the supplier (strategic partner in/near the Netherlands) all contribute to a strongly shortened lead-time in comparison with conventional methods. AM parts can be delivered within a week; the lead-time of conventional methods is often more than a month as shown in the distribution of criterion 8 in Section 5.2.5 (Figure 13).
After production the AM parts will, like all spare-parts, first be shipped to the warehouse in Hoofddorp, which acts as a distribution centre. Due to the reduced lead-time, it is in most cases not necessary to keep the part in stock, or the stock level can be reduced significantly. In Hoofddorp, a final quality check is conducted before it can be shipped to the customer.
The application of AM also strongly reduces the risks on obsolescence, due to the limited/absence of specialized tools required for production. Therefore AM application also prevents possible future costs, if a supplier suddenly cannot deliver the demanded parts. The two parts that were selected for the business case both have increased changes of obsolescence, which makes AM application extra beneficial.
38
6.4 CONCLUSION CHAPTER 6 The sub question that is answered in this Section is: What is the potential cost reduction when specific parts are printed?
Fifteen parts with a score higher than 0.6 (top 235 parts) were analyzed for feasibility. This resulted in four promising parts, of which one plastic and one metal part are selected to analyze in a business case.
The first part is an aluminum Fitting Stud. It has the right economical attributes that favor AM. The current production costs are assessed on 490,01 euro. The recurring costs of AM are estimated around 57 euros. Given the fact the part is fairly easy to design and certify, it is likely to provide a positive business case.
The second part that was analyzed is a plastic Clip. The part does not have high stress demands and stays within the boundaries of what is technological feasible. It also has the right economical attributes that favor AM. The production costs with AM are significantly lower (6,40 euro instead of 322 euros), which also provide room for possible certification costs and makes a positive business case very likely. Especially given the high change to get obsolete, as predicted by the model made by (PHD) students of the Erasmus University.
Beside the potential reductions in production costs, AM can also reduce the inventory and warehousing costs significantly due to the reduced lead-time as stated in Section 6.3. Given that only a small fraction of the most interesting parts are manually analyzed. It is expected that much more parts will provide a positive business case.
39
7. CONCLUSIONS The research question is defined as follows:
How and for which spare parts could additive manufacturing change the after sales services at Fokker Services B.V. to reduce cost?
Industrial Additive Manufacturing (AM) finds itself at the brink of mass application as supported by the Gartner Hype Cycle (Hart, 2013) and Technology Adoption Cycle (Mellor, 2014). The technology recently became suitable for high quality metal and plastic end products. The most suitable AM technology for FS is Powder Bed Fusion. This system melts metal and plastic powder together, layer-by-layer, which results in the highest material strength in comparison to alternative methods. It is recommended to outsource this AM production. There are four major areas in the after sales services of Fokker Services (FS) were AM could be applied:
1 Obsolescence problem: When an order is received, but the original vendor or original production method is not available anymore, FS is still determined to fulfill the remaining demand anyway. AM can provide a cost effective alternative production method, due to its relatively low setup costs and suitability for low volume production.
2 Production Alternative: Most spare parts sold were designed for high volume production. Due to the suitability of AM for low quantities, limited setup costs, less warehousing cost and tooling cost, AM can provide an economical sensible alternative for the current production of some parts.
3 Part consolidation: After the first parts are successfully produced using AM, part consolidation should be the next step. The number of piece parts in an assembly can be reduced significantly when redesigned for AM. This results in a reduction of material and assembly costs, and a potential weight reduction.
4 Decentralization: In the far future in is expected that airline operators will invest in AM solutions themselves. In such a market environment FS could explore new business models in which digital drawings are sold instead of physical products.
For application area ‘2’ (Production Alternative) a data-selection model is built, to select parts that can be an economical sensible production alternative. This process is conducted in three phases: 1. data-cleaning, 2. data-scoring and 3. manual evaluation. Parts that in phase 2 receive a score of 0,6 or higher (235 parts) have attributes that strongly favor AM and are therefore likely to provide a positive business case. 15 of those parts were manually analyzed (phase 3), 4 of which are suitable to print and very likely to be economical sensible alternatives. Out of those 4 recommended parts, a metal ‘Fittting Stud’ and plastic ‘Clip’ were selected for a business case. The recurring costs of AM is for both parts significantly lower than the conventional production method: 490,00 vs 57,41 Euro (Fitting Stud) & 322,00 vs 6,40 Euro (Clip). Although this price does not include the additional certification and design cost that should be made, this large difference in costs provides the opportunity to still be a sensible solution when those additional costs are made. AM can also reduce lead-times and inventory levels, which result in an additional cost savings that favor AM application. In the two business cases for example, the lead-time can be reduced from 26 days, to just 7 days. Only 15 of the 235 ‘very interesting parts’ were analyzed manually in this research. This already provided 4 parts that are suitable to print and are likely to provide a positive business case. When this manual evaluation will conducted for the other 220 parts, it is very likely a lot more suitable parts will be found and significant savings can be made. This project has proven that it is likely that AM can be used as an economically sensible production alternative. Besides that, it provides an efficient, analytical tool to identify the parts for which sensible alternatives can be achieved. Three other application areas are also identified where AM can be beneficial for FS.
40
8. FUTHER RESEARCH This project is intended as a quick scan to find areas were Additive Manufacturing (AM) can provide opportunities for Fokker Services (FS), and to for which types of parts this technology is suitable. Now that this process is completed, it is recommended to conduct further research on different fields (as will be explained) before AM will be widely used across the company.
It is first of all recommended acquire first hand experience with AM. The four parts that were identified as suitable for AM should be sent to an industry partner (like NLR or Materialise) to actually be printed. The data-selection model has shown that the part is likely to be an economical sensible option. When the parts will be printed, complications that may arise with technical capabilities or certification can improve the selection criteria.
This research took a ‘top down’ approach; from a large dataset, parts were selected that should be printed. For application of future obsolescence problems (OP) a ‘bottom up’ approach should be conducted. Old OP’s should be analyzed and checked whether AM could have been a better alternative than the chosen solution. This will help acquire the experience needed for future application in this area.
An extensive research from a student with a technical or legal background is recommended to get a better understanding of the actual certification cost and to explore possibilities to develop a generic certification process for AM parts. Certification is one of the major points that could delay successful AM application across FS.
When more experience with AM is acquired a student could explore the possibilities of redesigns of existing parts the further benefit from opportunities AM promises: part consolidation and weight reduction.
Five years from now, around the year 2020, when AM is even more adopted in the industry it is recommended to explore the possibilities of a business model around decentralization as explained in Section 4.1.4.
41
BIBLIOGRAPHY 3D Printing Systems. (n.d.). What is the cost of 3D printing. Retrieved from http://3dprintingsystems.com/faq/
3DSystems. (2015). Production 3D printers. Retrieved June 2, 2015, from http://www.3dsystems.com/files/sls-series-0214-usen-web_1.pdf
Additvely.com. (n.d.). Retrieved 5/1/2015 , from https://www.additively.com/en/learn-about/binder-jetting.
Airbus. (2014, June 13). Airbus 3D Printing technology transformation underway. Retrieved June 1, 2015, from https://www.youtube.com/watch?v=Cy3V3KR1LWc
Airbus. (2015, March 3). Printing the future: Airbus expands its applications of the revolutionary additive layer manufacturing process. Retrieved June 1, 2015, from http://www.airbus.com/presscentre/pressreleases/press-release-detail/detail/printing-the-future-airbus-expands-its-applications-of-the-revolutionary-additive-layer-manufacturi/
Atzeni, E. (2012, 02 08). Economics of additive manufacturing for end-usable metal parts. Springer-Verlag London Limited 2012 .
Barfod, M. B., & Leleur, S. (2014). Multi-criteria decision analysis for use in transport decision making. Department of Transport, Technical University of Denmark.
Catalono, F. (2015, March 6). Boeing files patent for 3D-printed aircraft parts — and yes, it’s already using them. Retrieved June 1, 2015, from http://www.geekwire.com/2015/boeing-files-patent-for-3d-printing-of-aircraft-parts-and-yes-its-already-using-them/
Diginova. (2014). Roadmap for Digital Fabrication . Océ Technologies B.V., .
EASA. (2012). AMC and GM to Part 21 . European Aviation Safety Agency .
EFFRA. (2013). Factories of the Future. Policy Research Europian Commision.
EOS. (2015, 06 19). Retrieved from http://www.eos.info/en
EOS. (2015b). Basic Design Rules for Additive Manufacturing.
EOS. (2015a). Design Rules for DMLS.
Fokker. (2014). Annual Report 2014. Fokker Holdings B.V.
Fortune. (2014). Fortune 500 2014. Retrieved June 1, 2015, from http://fortune.com/fortune500/2014
Gao, W. Z. (2015). The status, challenges and future of additive manufacturing in engineering. Computer-Aided Design.
Gartner. (2015). Gartner Hype Cycle. Retrieved 05 15, 2015, from http://www.gartner.com/technology/research/methodologies/hype-cycle.jsp
GE-Reports. (2015, May 25). These Engineers 3D Printed a Mini Jet Engine, Then Took it to 33,000 RPM. Retrieved June 1, 2015, from http://www.gereports.com/post/118394013625/these-engineers-3d-printed-a-mini-jet-engine-then
Griffiths, L. (2015, 4 13). Materialise achieves certification for 3D printing end-use parts for aerospace industry - See more at: http://www.tctmagazine.com/3D-printing-news/materialise-achieves-certification-for-3d-printing-end-use-
42
parts-aerospace-industry/#sthash.5igOBjE2.dpuf. Retrieved 6 12, 2015, from http://www.tctmagazine.com/3D-printing-news/materialise-achieves-certification-for-3d-printing-end-use-parts-aerospace-industry/
Hart, J. (2013). Additive Manufacturing. MIT.
Jaarsveld, W. v., & Dekker, R. (2011). Estimating obsolescence risk from demand data to enhance inventory control : a case study. International journal of production economics .
Janssen, R. (2014). THE IMPACT OF 3-D PRINTING ON SUPPLY CHAIN MANAGEMENT . TNO.
Li, X. (2014, 02). Assessing End-of-Supply Risk of Spare Parts Using the Proportional Hazard Model (Manustript). Decision Scieces, A Journal of the Decision Scieces Institue .
Loughborough University. (2015). VAT Photopolymerisation. Retrieved June 2, 2015, from http://www.lboro.ac.uk/research/amrg/about/the7categoriesofadditivemanufacturing/vatphotopolymerisation/
Mellor, S. (2014). n Implementation Framework for Additive Manufacturing. University of Exeter.
Neubert, J. (2015, 06 20). Retrieved from http://3dprintingpricecheck.com/
Noe, R. (18-02-2014,). ‘ Direct Metal Laser Sintering, Laser Melting and LaserCusing’. Retrieved 05-01-2015, from http://www.core77.com/posts/26457/production-methods-whats-the-difference-between-selective-laser-sintering-direct-metal-laser-sintering-laser-melting-and-lasercusing-26457,
Ponfoort, O., & Schotel, H. (2015). OPPORTUNITEITEN VAN 3DP VOOR DE LOGISTIEK VAN WISSELSTUKKEN. Berenschot.
PWC. (2014). 3D printing and the new shape of industrial manufacturing. PWC.
RAE. (2013). Additive manufacturing: opportunities and constraints . London: Royal Academy of Engineering.
Ravinder, H. V. (2013, June). Determining The Optimal Values Of Exponential Smoothing Constants.
Revell, T. B. (2005, July). The Business Case for Sustainability?An Examination of Small Firms in the UK’s Construction andRestaurant Sectors. InerScience .
Roland Berger. (2013). Additive manufacturing A game changer for the manufacturing industry? Roland Berger Strategy Consultants.
Scott, J. (2012). Additive Manufacturing: Status and Opportunities. IDA, Science and Technology Policy Institute.
Sculpteo. (2015). Prepare your model for 3D printing with CATIA V5. Retrieved june 28, 2015, from http://www.sculpteo.com/en/prepare-your-model-3d-printing-catia/
ShapeWays. (2015). Strong & Flexible Plastic Material Information. Retrieved 22 06, 2015, from https://www.shapeways.com/materials/strong-and-flexible-plastic?li=nav
Sherman, L. M. (2014, March). Additive Manufacturing: Materials for ‘Real-World’ Parts. Retrieved June 2, 2015, from http://www.ptonline.com/articles/additive-manufacturing-materials-for-real-world-parts
SLM Solutions. (2015). Retrieved June 2, 2015, from http://stage.slm-solutions.com/index.php?slm-500_en
Somsen, R. (2014, 10 25). Rob Somsen. Retrieved June 1, 2015, from http://www.luchtvaartnieuws.nl/nieuws/categorie/2/airlines/em-directeur-ziet-kansen-voor-onderhoudsdivisie-klm
43
Springer. (2013). Improved Multiple Attribute Decision Making Methods. Decision Making in Manufacturing Environment Using Graph Theory and Fuzzy Multiple Attribute Decision Making Methods .
SRA. (2014). Addititve Manufacturing: Strategic Research Agenda. AM Platform. SRA.
Triami Media. (2015). CPI Inflatie. Retrieved 07 08, 2015, from http://nl.inflation.eu/inflatiecijfers/nederland/historische-inflatie/cpi-inflatie-nederland.aspx
Tumbleston, J. (2015, March 20). Continuous liquid interface production of 3D objects. Science AAAS .
Wullms, B. (2014, August). Additive manufacturing in the spare parts supply chain . University of Technology Eindhoven .
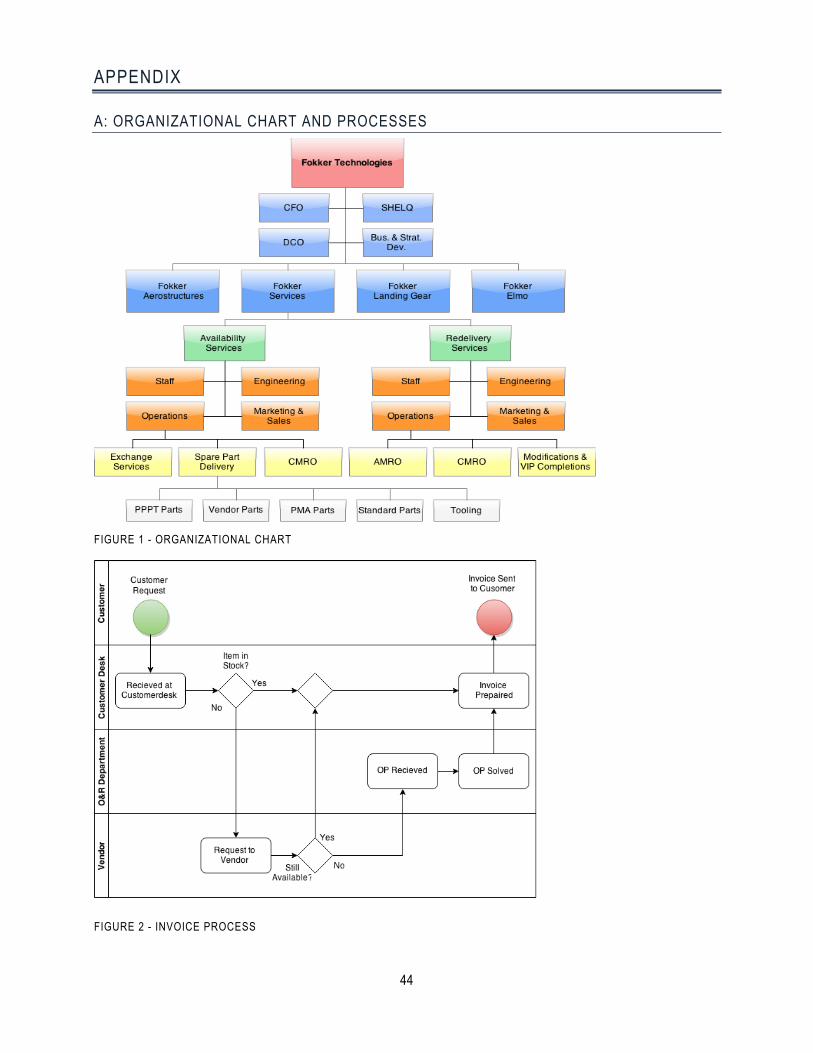
44
APPENDIX
A: ORGANIZATIONAL CHART AND PROCESSES
FIGURE 1 - ORGANIZATIONAL CHART
FIGURE 2 - INVOICE PROCESS
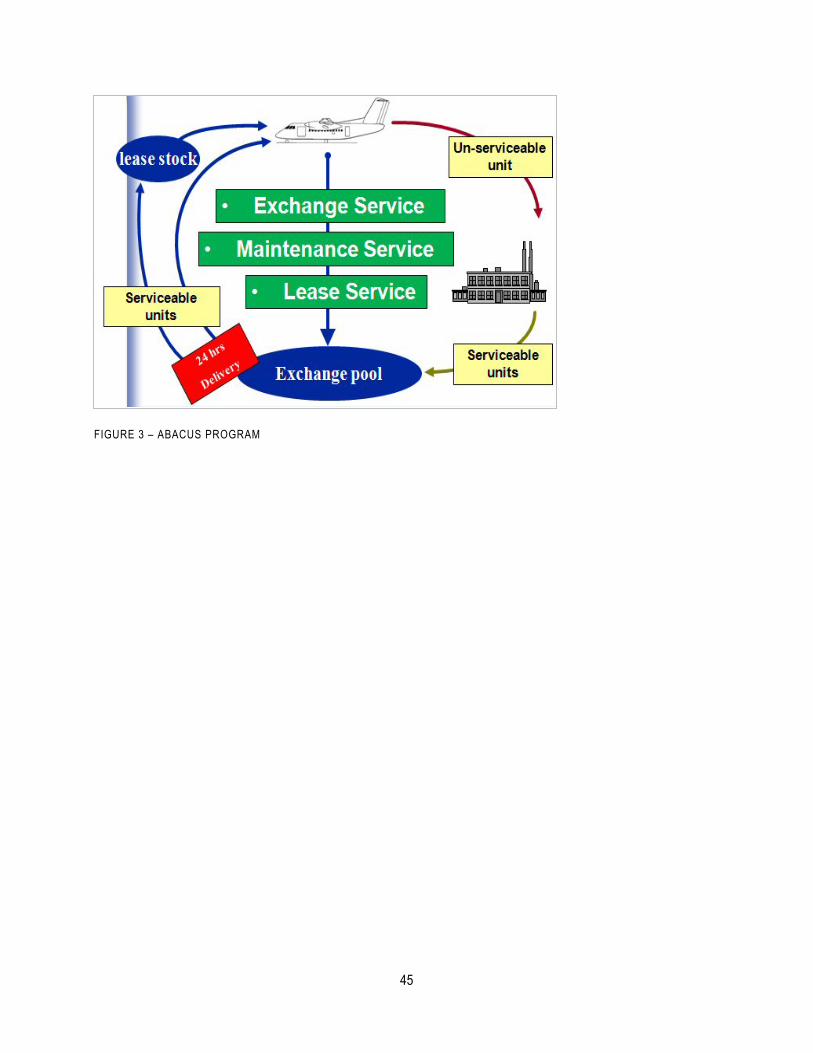
45
FIGURE 3 – ABACUS PROGRAM
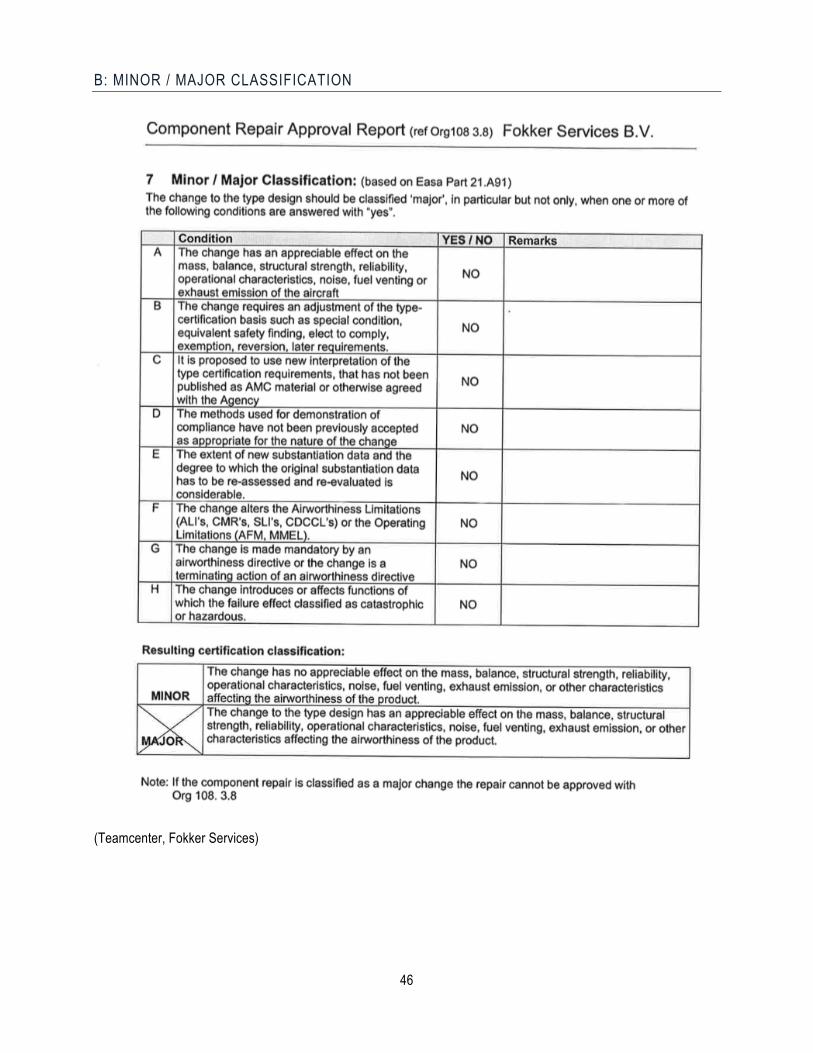
46
B: MINOR / MAJOR CLASSIFICATION
(Teamcenter, Fokker Services)
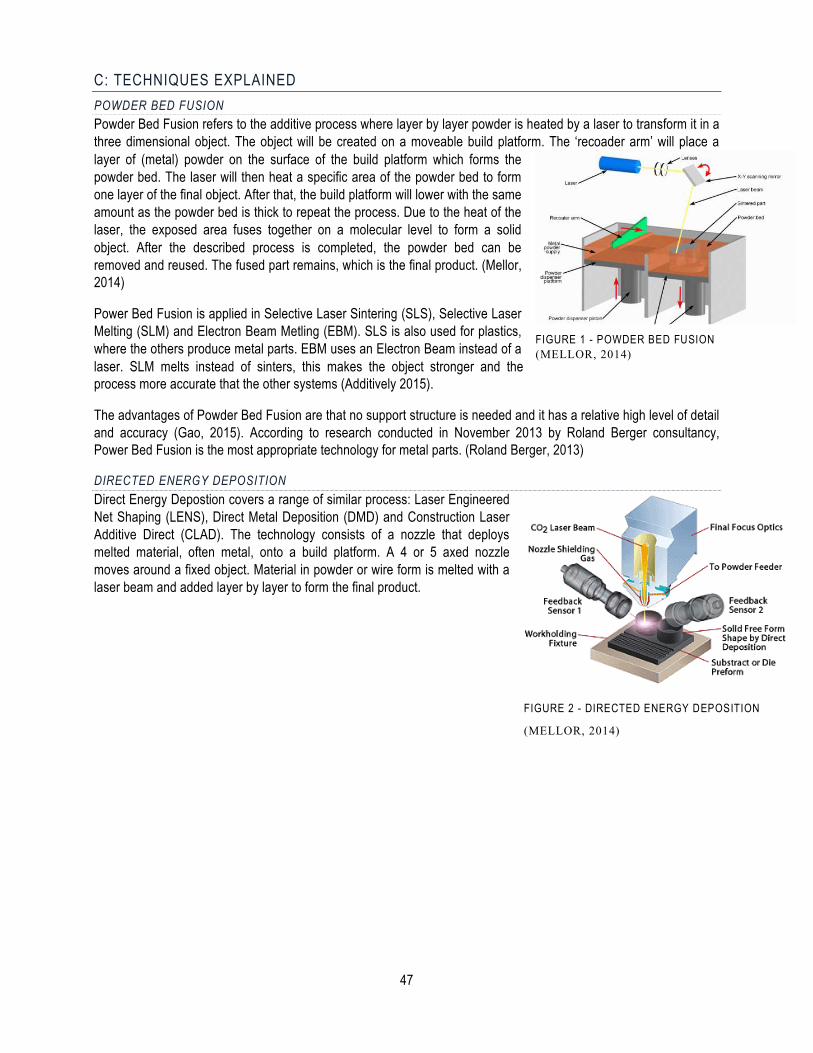
47
C: TECHNIQUES EXPLAINED POWDER BED FUSION Powder Bed Fusion refers to the additive process where layer by layer powder is heated by a laser to transform it in a three dimensional object. The object will be created on a moveable build platform. The ‘recoader arm’ will place a layer of (metal) powder on the surface of the build platform which forms the powder bed. The laser will then heat a specific area of the powder bed to form one layer of the final object. After that, the build platform will lower with the same amount as the powder bed is thick to repeat the process. Due to the heat of the laser, the exposed area fuses together on a molecular level to form a solid object. After the described process is completed, the powder bed can be removed and reused. The fused part remains, which is the final product. (Mellor, 2014)
Power Bed Fusion is applied in Selective Laser Sintering (SLS), Selective Laser Melting (SLM) and Electron Beam Metling (EBM). SLS is also used for plastics, where the others produce metal parts. EBM uses an Electron Beam instead of a laser. SLM melts instead of sinters, this makes the object stronger and the process more accurate that the other systems (Additively 2015).
The advantages of Powder Bed Fusion are that no support structure is needed and it has a relative high level of detail and accuracy (Gao, 2015). According to research conducted in November 2013 by Roland Berger consultancy, Power Bed Fusion is the most appropriate technology for metal parts. (Roland Berger, 2013)
DIRECTED ENERGY DEPOSITION Direct Energy Depostion covers a range of similar process: Laser Engineered Net Shaping (LENS), Direct Metal Deposition (DMD) and Construction Laser Additive Direct (CLAD). The technology consists of a nozzle that deploys melted material, often metal, onto a build platform. A 4 or 5 axed nozzle moves around a fixed object. Material in powder or wire form is melted with a laser beam and added layer by layer to form the final product.
FIGURE 1 - POWDER BED FUSION (MELLOR, 2014)
FIGURE 2 - DIRECTED ENERGY DEPOSITION
(MELLOR, 2014)
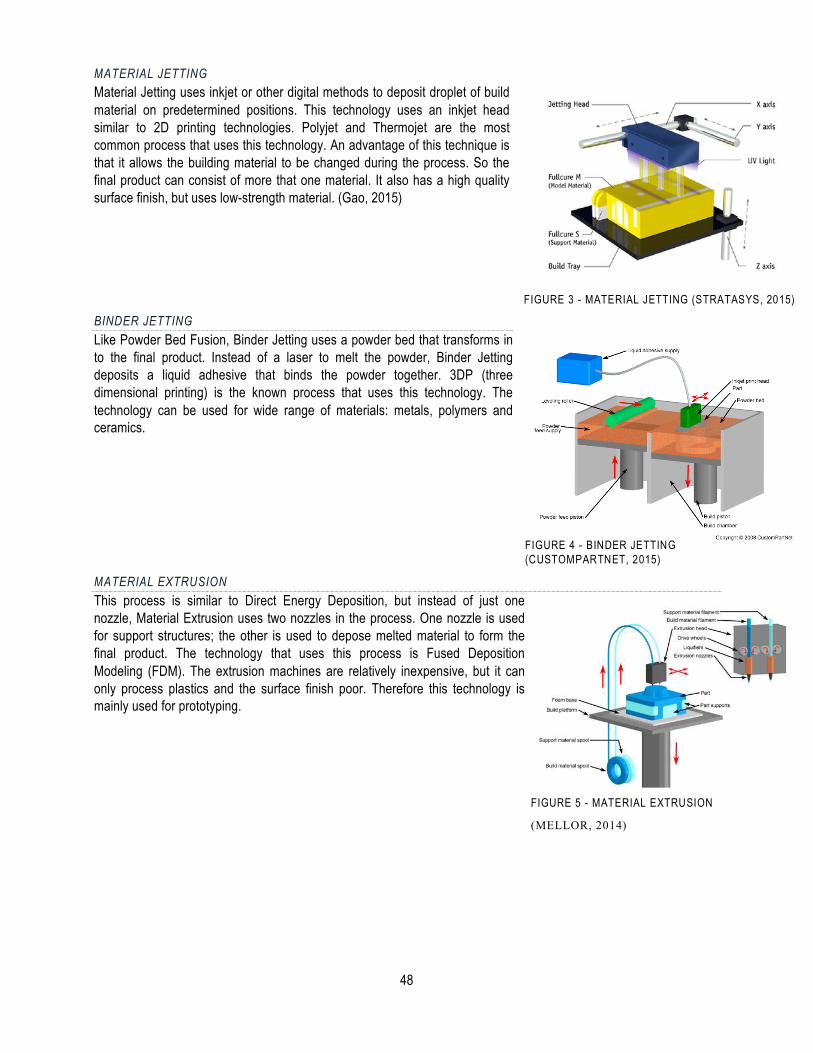
48
MATERIAL JETTING Material Jetting uses inkjet or other digital methods to deposit droplet of build material on predetermined positions. This technology uses an inkjet head similar to 2D printing technologies. Polyjet and Thermojet are the most common process that uses this technology. An advantage of this technique is that it allows the building material to be changed during the process. So the final product can consist of more that one material. It also has a high quality surface finish, but uses low-strength material. (Gao, 2015)
BINDER JETTING Like Powder Bed Fusion, Binder Jetting uses a powder bed that transforms in to the final product. Instead of a laser to melt the powder, Binder Jetting deposits a liquid adhesive that binds the powder together. 3DP (three dimensional printing) is the known process that uses this technology. The technology can be used for wide range of materials: metals, polymers and ceramics.
MATERIAL EXTRUSION This process is similar to Direct Energy Deposition, but instead of just one nozzle, Material Extrusion uses two nozzles in the process. One nozzle is used for support structures; the other is used to depose melted material to form the final product. The technology that uses this process is Fused Deposition Modeling (FDM). The extrusion machines are relatively inexpensive, but it can only process plastics and the surface finish poor. Therefore this technology is mainly used for prototyping.
FIGURE 3 - MATERIAL JETTING (STRATASYS, 2015)
FIGURE 4 - BINDER JETTING (CUSTOMPARTNET, 2015)
FIGURE 5 - MATERIAL EXTRUSION
(MELLOR, 2014)
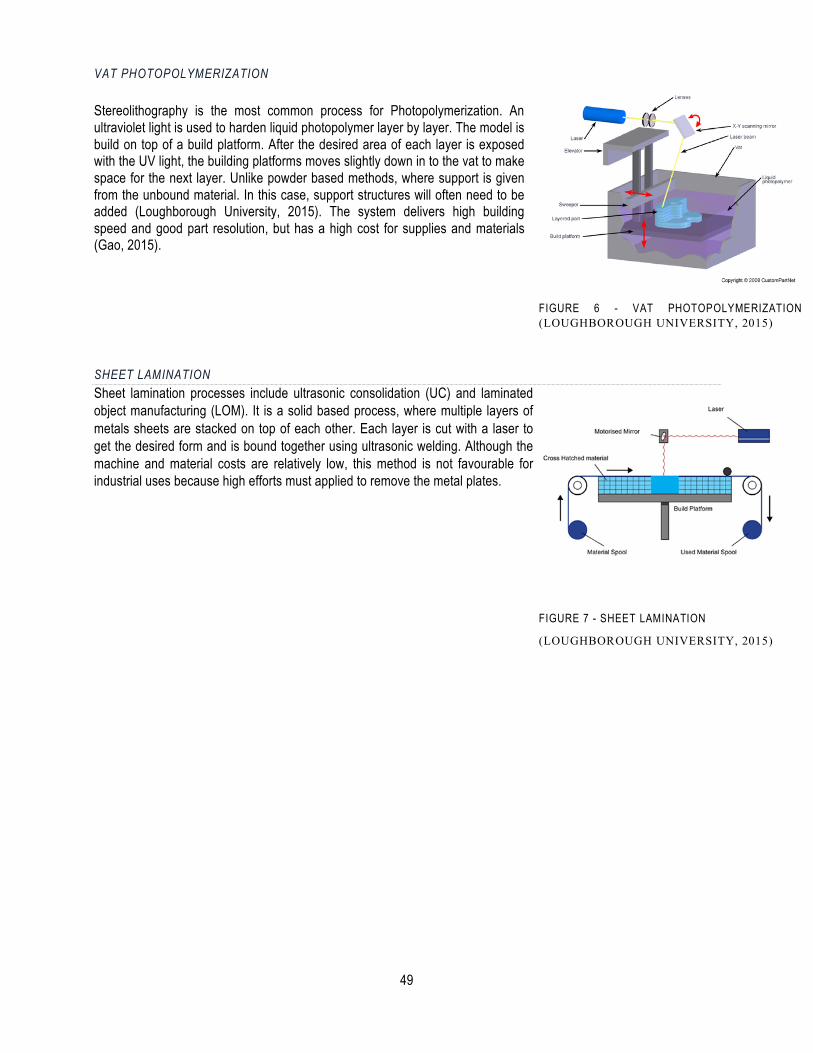
49
VAT PHOTOPOLYMERIZATION
Stereolithography is the most common process for Photopolymerization. An ultraviolet light is used to harden liquid photopolymer layer by layer. The model is build on top of a build platform. After the desired area of each layer is exposed with the UV light, the building platforms moves slightly down in to the vat to make space for the next layer. Unlike powder based methods, where support is given from the unbound material. In this case, support structures will often need to be added (Loughborough University, 2015). The system delivers high building speed and good part resolution, but has a high cost for supplies and materials (Gao, 2015).
SHEET LAMINATION Sheet lamination processes include ultrasonic consolidation (UC) and laminated object manufacturing (LOM). It is a solid based process, where multiple layers of metals sheets are stacked on top of each other. Each layer is cut with a laser to get the desired form and is bound together using ultrasonic welding. Although the machine and material costs are relatively low, this method is not favourable for industrial uses because high efforts must applied to remove the metal plates.
FIGURE 6 - VAT PHOTOPOLYMERIZATION (LOUGHBOROUGH UNIVERSITY, 2015)
FIGURE 7 - SHEET LAMINATION
(LOUGHBOROUGH UNIVERSITY, 2015)
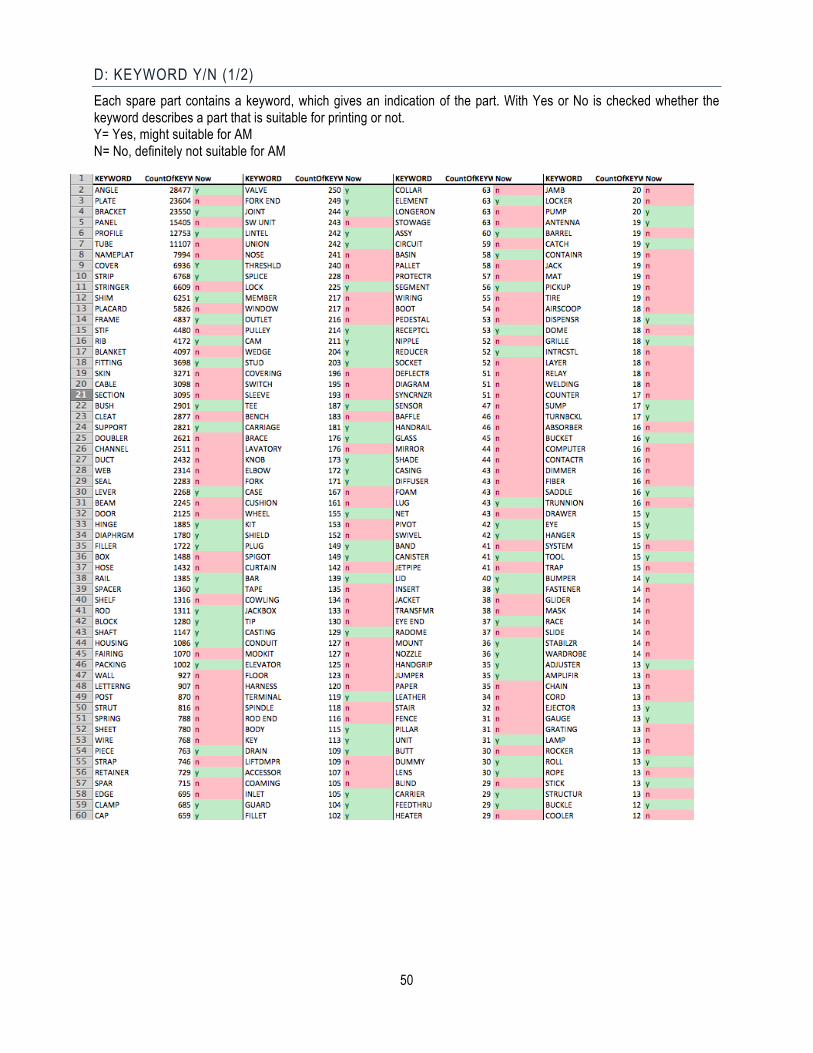
50
D: KEYWORD Y/N (1/2) Each spare part contains a keyword, which gives an indication of the part. With Yes or No is checked whether the keyword describes a part that is suitable for printing or not. Y= Yes, might suitable for AM N= No, definitely not suitable for AM
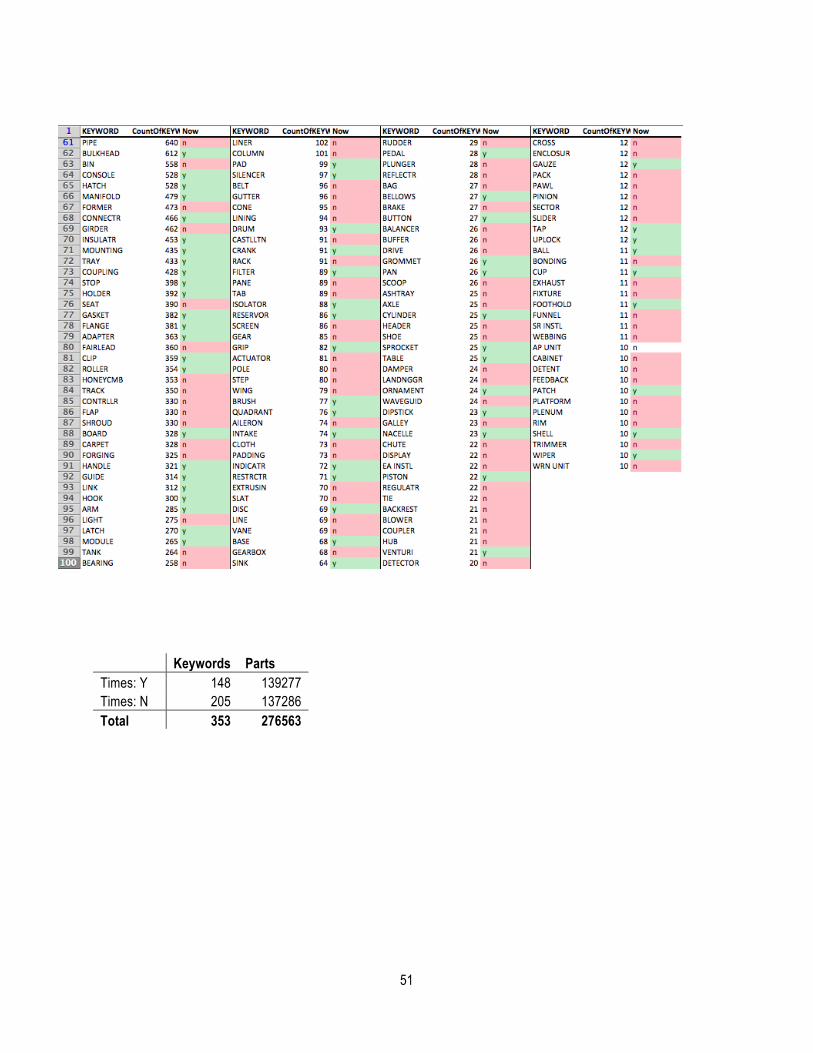
51
Keywords Parts Times: Y 148 139277 Times: N 205 137286 Total 353 276563
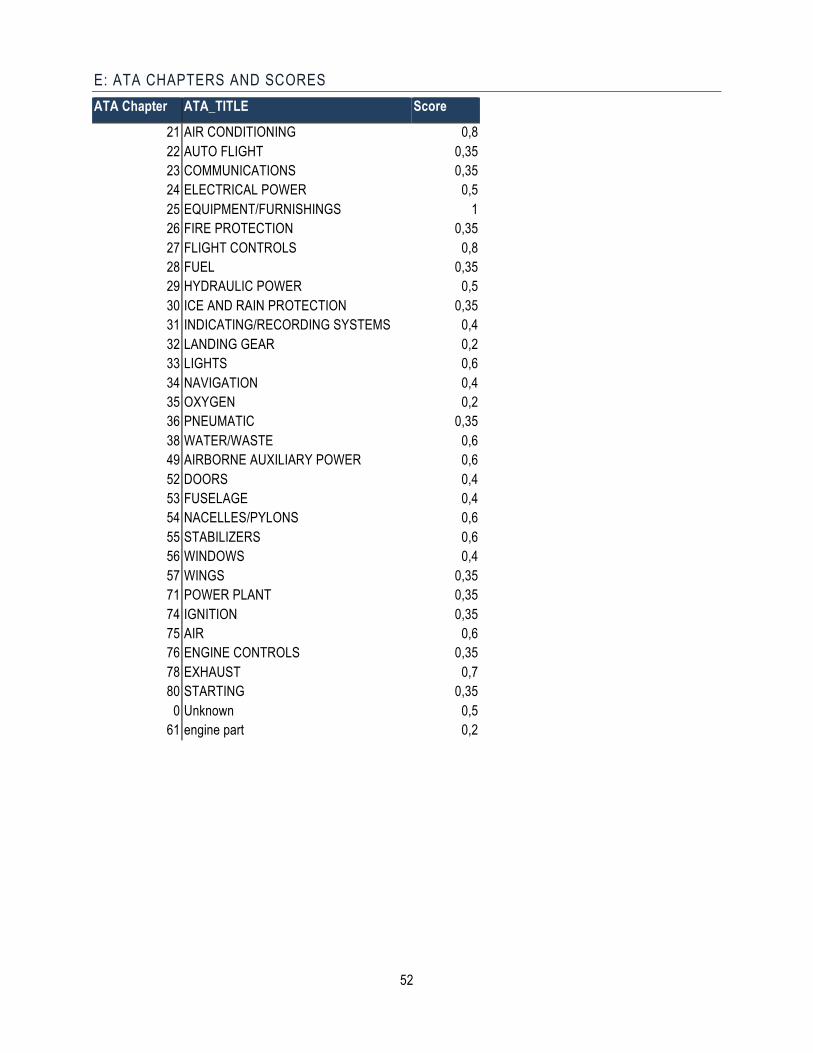
52
E: ATA CHAPTERS AND SCORES ATA Chapter ATA_TITLE Score
21 AIR CONDITIONING 0,8 22 AUTO FLIGHT 0,35 23 COMMUNICATIONS 0,35 24 ELECTRICAL POWER 0,5 25 EQUIPMENT/FURNISHINGS 1 26 FIRE PROTECTION 0,35 27 FLIGHT CONTROLS 0,8 28 FUEL 0,35 29 HYDRAULIC POWER 0,5 30 ICE AND RAIN PROTECTION 0,35 31 INDICATING/RECORDING SYSTEMS 0,4 32 LANDING GEAR 0,2 33 LIGHTS 0,6 34 NAVIGATION 0,4 35 OXYGEN 0,2 36 PNEUMATIC 0,35 38 WATER/WASTE 0,6 49 AIRBORNE AUXILIARY POWER 0,6 52 DOORS 0,4 53 FUSELAGE 0,4 54 NACELLES/PYLONS 0,6 55 STABILIZERS 0,6 56 WINDOWS 0,4 57 WINGS 0,35 71 POWER PLANT 0,35 74 IGNITION 0,35 75 AIR 0,6 76 ENGINE CONTROLS 0,35 78 EXHAUST 0,7 80 STARTING 0,35
0 Unknown 0,5 61 engine part 0,2
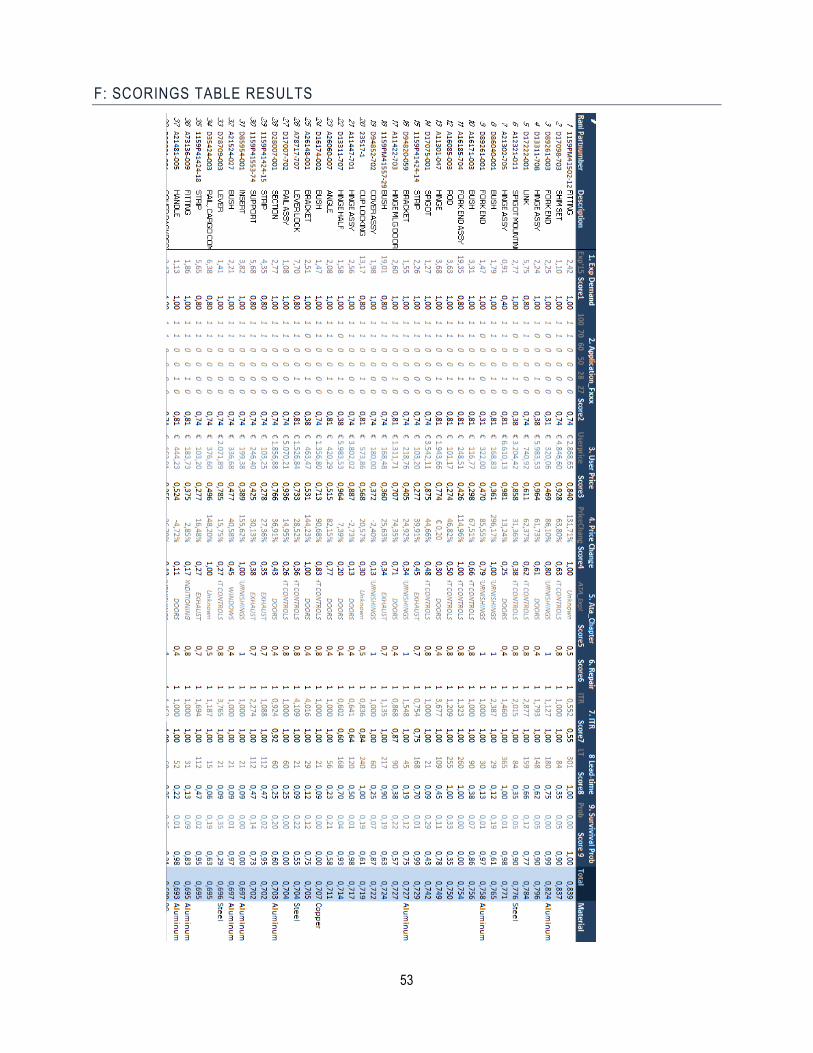
53
F: SCORINGS TABLE RESULTS
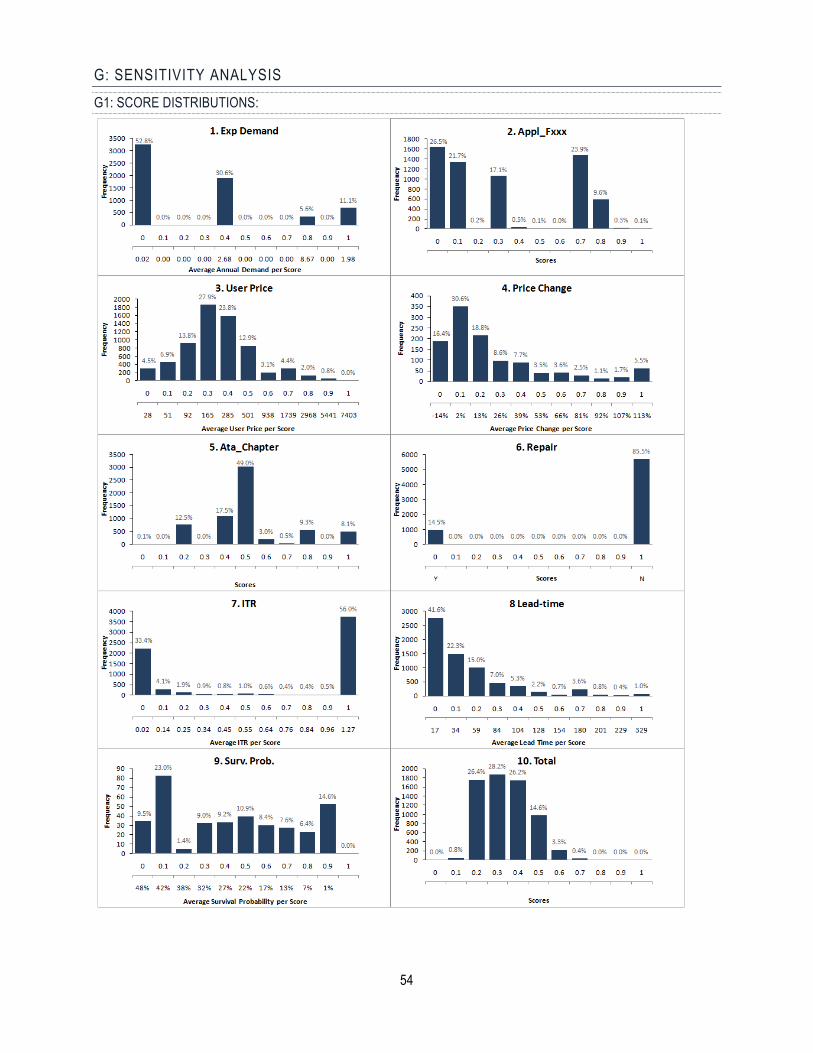
54
G: SENSITIVITY ANALYSIS G1: SCORE DISTRIBUTIONS:
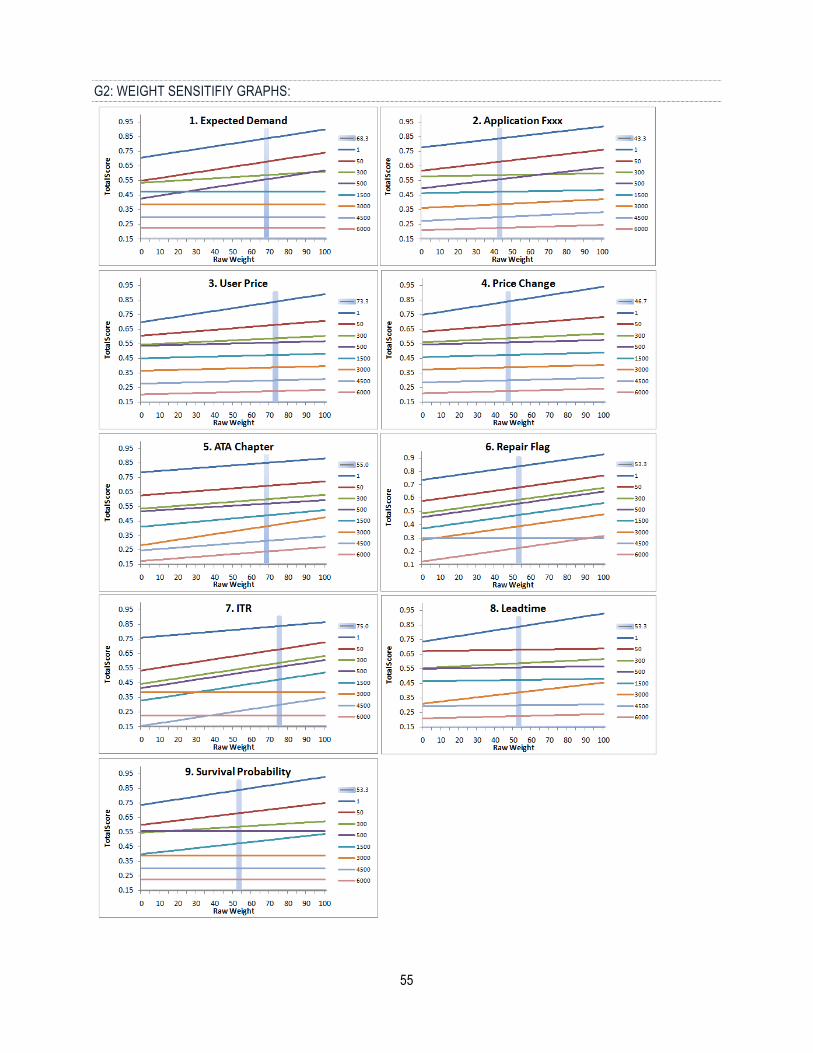
55
G2: WEIGHT SENSITIFIY GRAPHS:
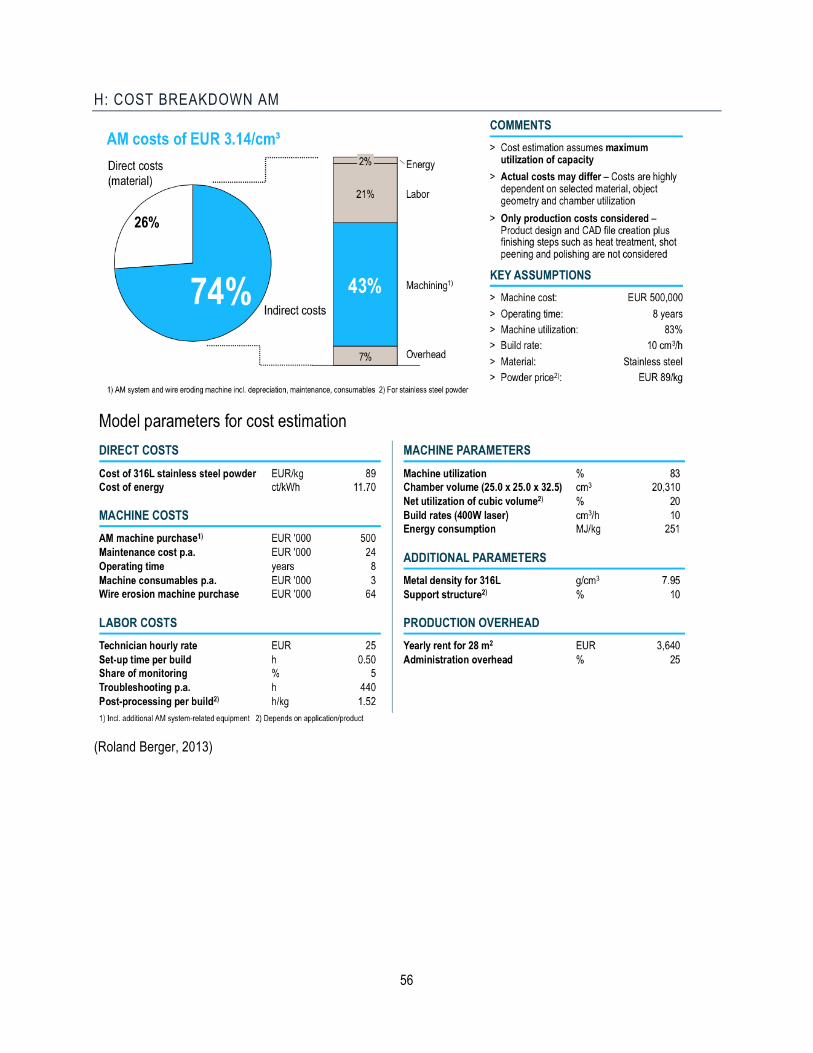
56
H: COST BREAKDOWN AM
(Roland Berger, 2013)
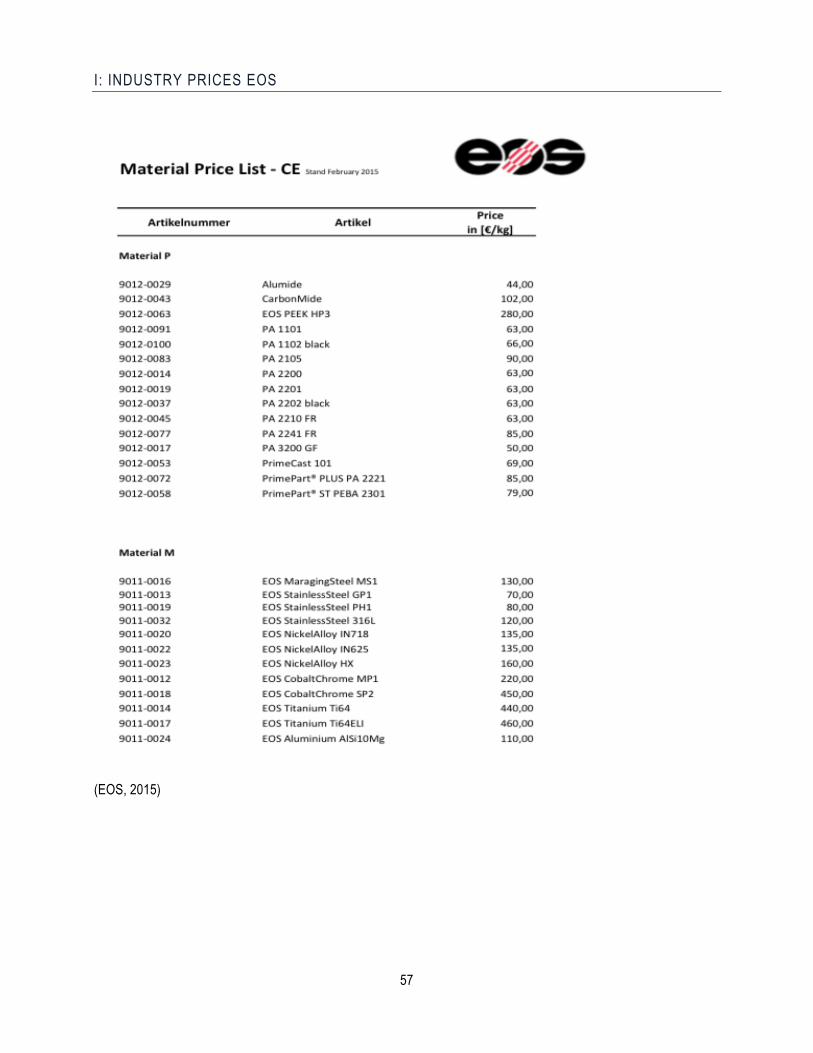
57
I: INDUSTRY PRICES EOS
(EOS, 2015)
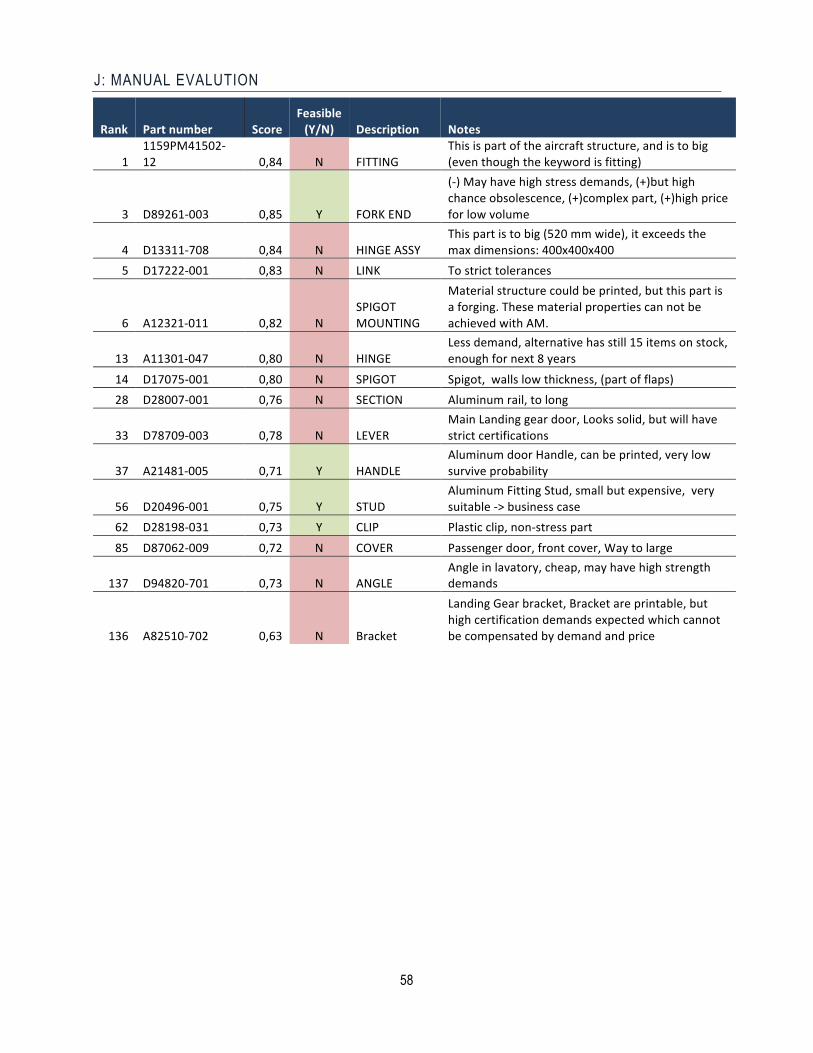
58
J: MANUAL EVALUTION
Rank Part number Score Feasible (Y/N) Description Notes
1 1159PM41502-‐12 0,84 N FITTING
This is part of the aircraft structure, and is to big (even though the keyword is fitting)
3 D89261-‐003 0,85 Y FORK END
(-‐) May have high stress demands, (+)but high chance obsolescence, (+)complex part, (+)high price for low volume
4 D13311-‐708 0,84 N HINGE ASSY This part is to big (520 mm wide), it exceeds the max dimensions: 400x400x400
5 D17222-‐001 0,83 N LINK To strict tolerances
6 A12321-‐011 0,82 N SPIGOT MOUNTING
Material structure could be printed, but this part is a forging. These material properties can not be achieved with AM.
13 A11301-‐047 0,80 N HINGE Less demand, alternative has still 15 items on stock, enough for next 8 years
14 D17075-‐001 0,80 N SPIGOT Spigot, walls low thickness, (part of flaps) 28 D28007-‐001 0,76 N SECTION Aluminum rail, to long
33 D78709-‐003 0,78 N LEVER Main Landing gear door, Looks solid, but will have strict certifications
37 A21481-‐005 0,71 Y HANDLE Aluminum door Handle, can be printed, very low survive probability
56 D20496-‐001 0,75 Y STUD Aluminum Fitting Stud, small but expensive, very suitable -‐> business case
62 D28198-‐031 0,73 Y CLIP Plastic clip, non-‐stress part
85 D87062-‐009 0,72 N COVER Passenger door, front cover, Way to large
137 D94820-‐701 0,73 N ANGLE Angle in lavatory, cheap, may have high strength demands
136 A82510-‐702 0,63 N Bracket
Landing Gear bracket, Bracket are printable, but high certification demands expected which cannot be compensated by demand and price
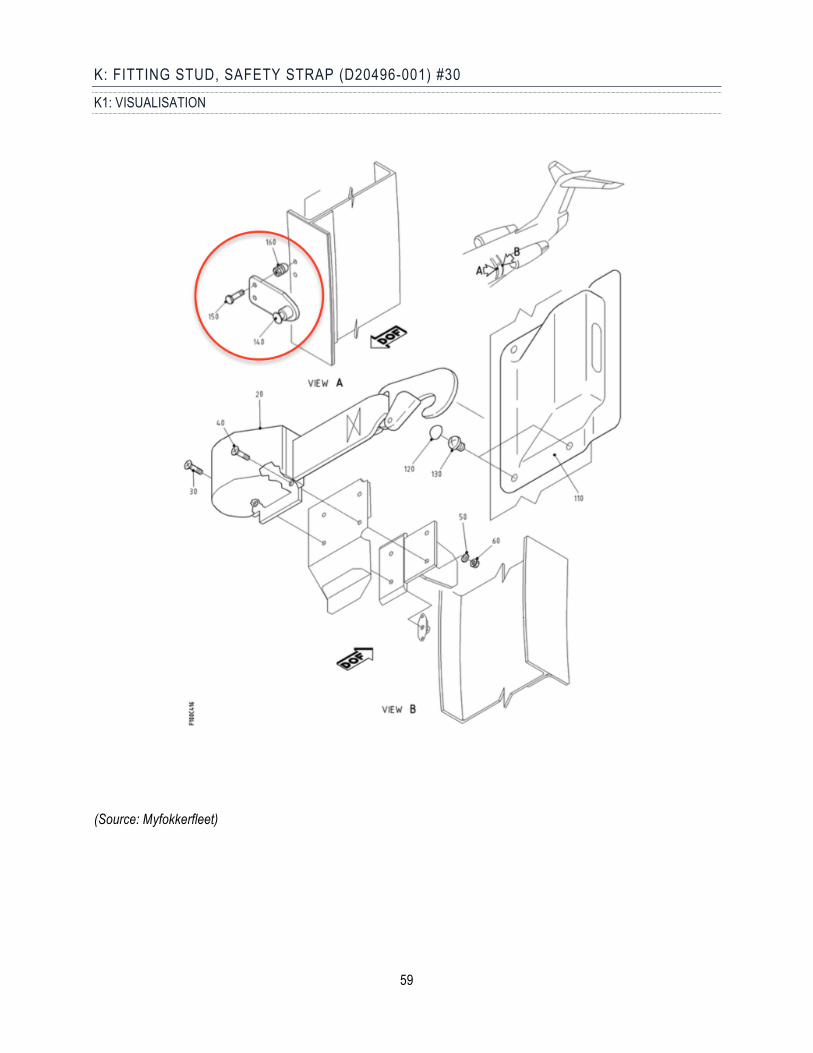
59
K: FITTING STUD, SAFETY STRAP (D20496-001) #30 K1: VISUALISATION
(Source: Myfokkerfleet)
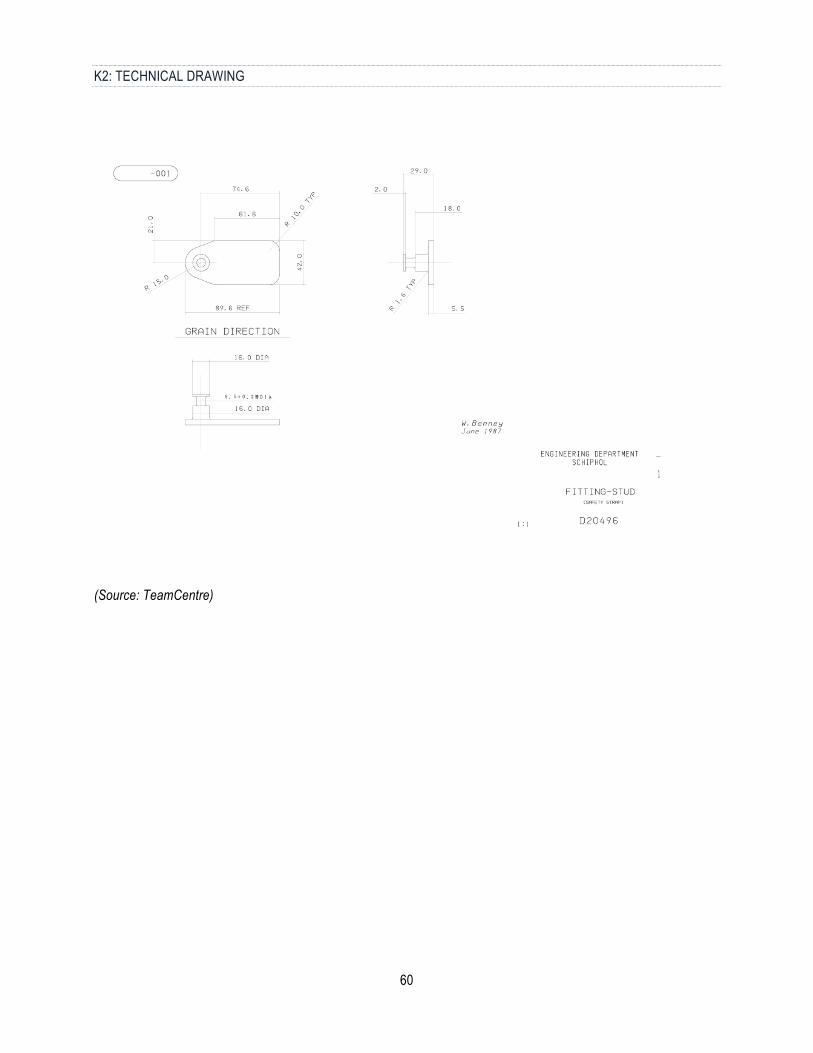
60
K2: TECHNICAL DRAWING
(Source: TeamCentre)
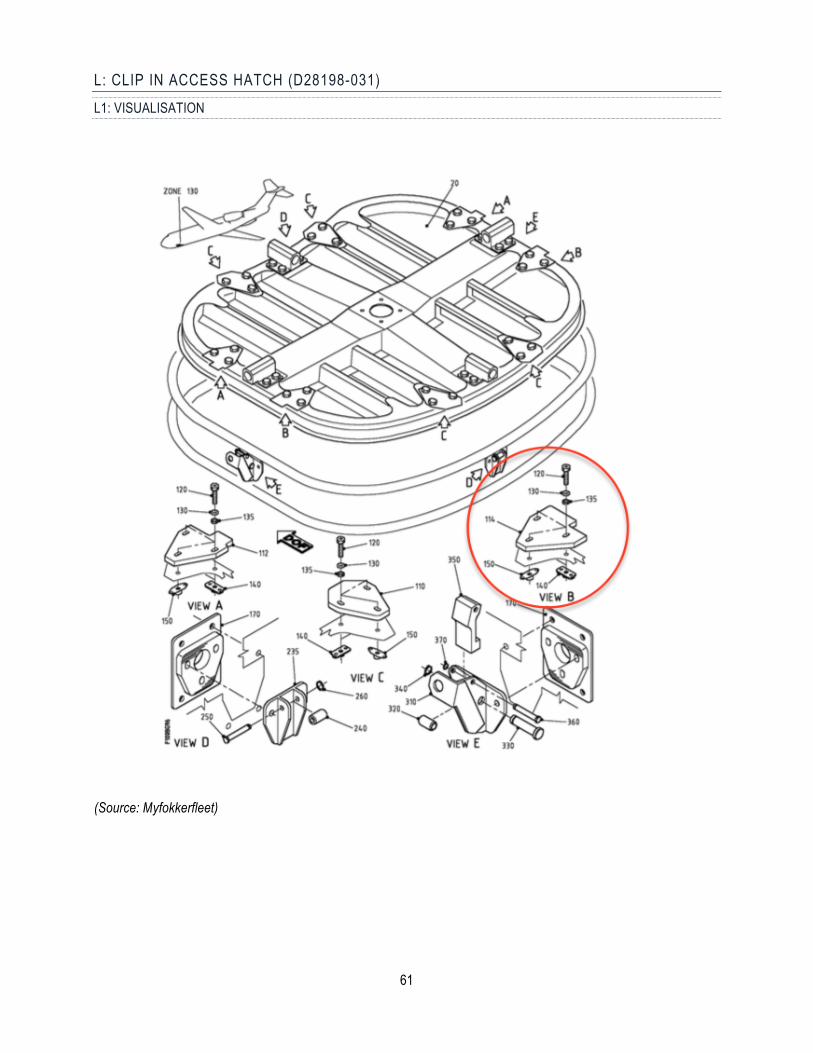
61
L: CLIP IN ACCESS HATCH (D28198-031) L1: VISUALISATION
(Source: Myfokkerfleet)
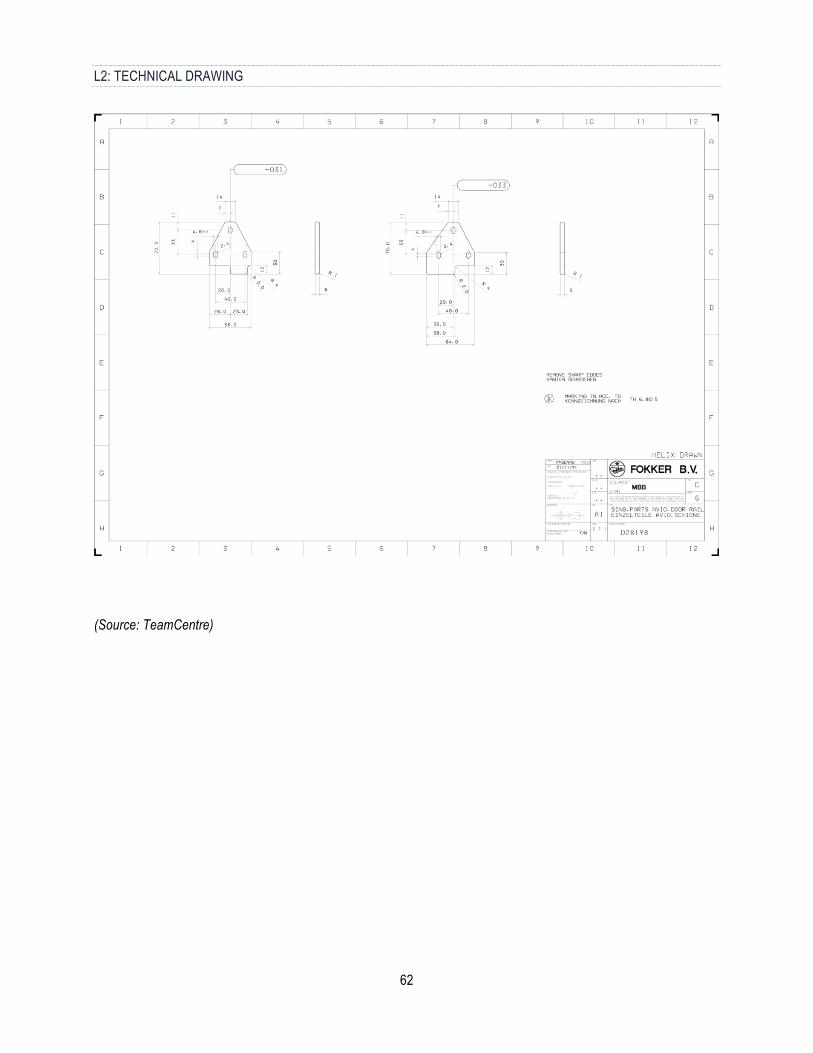
62
L2: TECHNICAL DRAWING
(Source: TeamCentre)
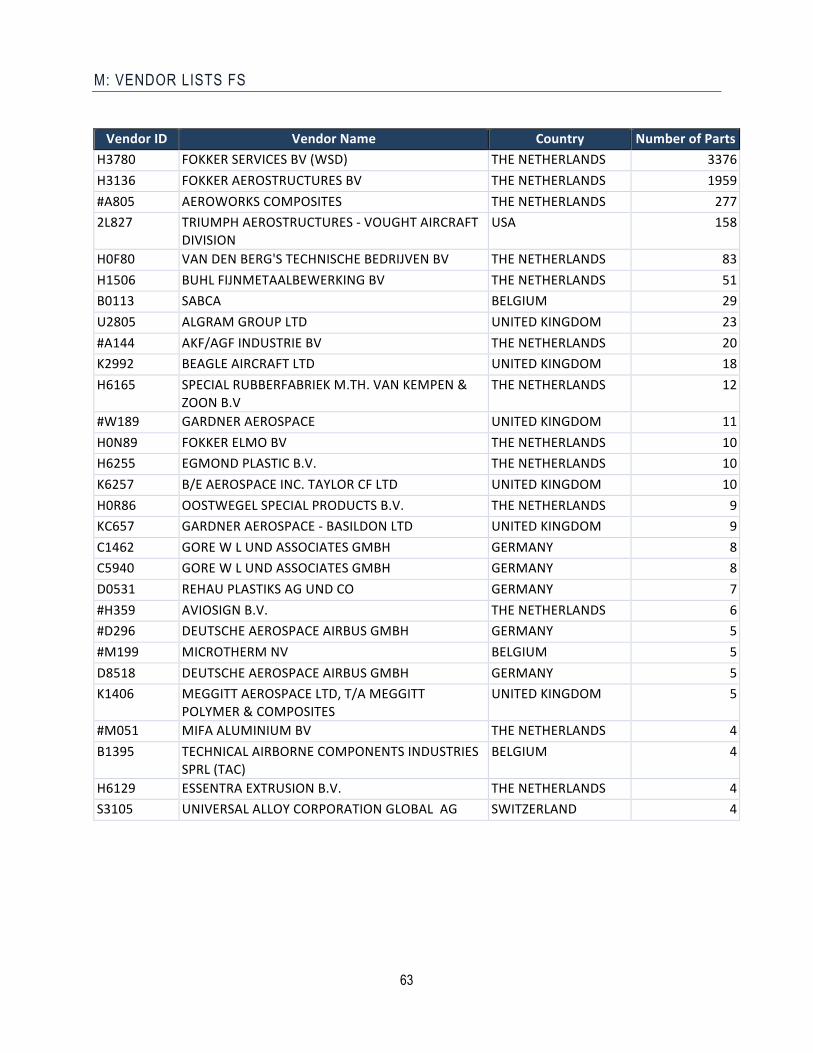
63
M: VENDOR LISTS FS
Vendor ID Vendor Name Country Number of Parts H3780 FOKKER SERVICES BV (WSD) THE NETHERLANDS 3376 H3136 FOKKER AEROSTRUCTURES BV THE NETHERLANDS 1959 #A805 AEROWORKS COMPOSITES THE NETHERLANDS 277 2L827 TRIUMPH AEROSTRUCTURES -‐ VOUGHT AIRCRAFT
DIVISION USA 158
H0F80 VAN DEN BERG'S TECHNISCHE BEDRIJVEN BV THE NETHERLANDS 83 H1506 BUHL FIJNMETAALBEWERKING BV THE NETHERLANDS 51 B0113 SABCA BELGIUM 29 U2805 ALGRAM GROUP LTD UNITED KINGDOM 23 #A144 AKF/AGF INDUSTRIE BV THE NETHERLANDS 20 K2992 BEAGLE AIRCRAFT LTD UNITED KINGDOM 18 H6165 SPECIAL RUBBERFABRIEK M.TH. VAN KEMPEN &
ZOON B.V THE NETHERLANDS 12
#W189 GARDNER AEROSPACE UNITED KINGDOM 11 H0N89 FOKKER ELMO BV THE NETHERLANDS 10 H6255 EGMOND PLASTIC B.V. THE NETHERLANDS 10 K6257 B/E AEROSPACE INC. TAYLOR CF LTD UNITED KINGDOM 10 H0R86 OOSTWEGEL SPECIAL PRODUCTS B.V. THE NETHERLANDS 9 KC657 GARDNER AEROSPACE -‐ BASILDON LTD UNITED KINGDOM 9 C1462 GORE W L UND ASSOCIATES GMBH GERMANY 8 C5940 GORE W L UND ASSOCIATES GMBH GERMANY 8 D0531 REHAU PLASTIKS AG UND CO GERMANY 7 #H359 AVIOSIGN B.V. THE NETHERLANDS 6 #D296 DEUTSCHE AEROSPACE AIRBUS GMBH GERMANY 5 #M199 MICROTHERM NV BELGIUM 5 D8518 DEUTSCHE AEROSPACE AIRBUS GMBH GERMANY 5 K1406 MEGGITT AEROSPACE LTD, T/A MEGGITT
POLYMER & COMPOSITES UNITED KINGDOM 5
#M051 MIFA ALUMINIUM BV THE NETHERLANDS 4 B1395 TECHNICAL AIRBORNE COMPONENTS INDUSTRIES
SPRL (TAC) BELGIUM 4
H6129 ESSENTRA EXTRUSION B.V. THE NETHERLANDS 4 S3105 UNIVERSAL ALLOY CORPORATION GLOBAL AG SWITZERLAND 4