Quicker and More Accurate Insight into Supply Chain Data ... · PDF file• SAP Predictive...
63
Produced by Wellesley Information Services, LLC, publisher of SAPinsider. © 2015 Wellesley Information Services. All rights reserved. Quicker and More Accurate Insight into Supply Chain Data: An Updated Guide to Leveraging the Latest Analytical Capabilities from SAP Matt Campbell SCMO2
Transcript of Quicker and More Accurate Insight into Supply Chain Data ... · PDF file• SAP Predictive...

Produced by Wellesley Information Services, LLC, publisher of SAPinsider. © 2015 Wellesley
Information Services. All rights reserved.
Quicker and More Accurate Insight into Supply Chain Data: An Updated Guide to Leveraging the Latest Analytical Capabilities from SAP
Matt Campbell SCMO2

1
What We’ll Cover
• What’s required to have a robust supply chain analytics strategy?
• Why has it been so challenging and costly to build in the past?
• What SAP analytics solutions are available?
• How to determine which solution is right for you
• How to be successful with an analytics transformation project
• Wrap-up

2
What Supply Chain Performance Analytics Are Needed for Your Business?
• Metrics should help you answer three questions
1. Where do we want to go?
2. How do we get there?
3. How will we know when we have arrived?
• Tracking metrics allows your business to:
Assess performance improvement over time
Compare your performance to industry benchmarks
Align individual or department behaviors with corporate goals

3
What Type of Analytics Are Required in Supply Chain Planning
• Can classify analytics into categories
Key Performance Indicators (KPIs) and Operational
Measurements to drive value
System Usage/Plan Quality

4
Linking the Vision to Operations
• Start by establishing the vision and mission
• Align KPIs with the vision and mission
Identify products,
customers, competition,
socioeconomic environment
Overall missions & goals of
the company, recognition of
distinct core competencies
Corporate Strategy
Competitive
Priorities (Cost,
Quality, Time,
Price, etc.)
Future Direction
(Global strategy,
new products &
services, etc.)
Functional Area Strategies
(Supply Chain, Marketing,
Finance, etc.)
Key
Performance
Indicators
Link Corporate
Strategy with
Competitive Priorities
The Corporate Strategy
and associated needs
drive the performance
management process
Market & External
Environment Analyses

5
How to Determine What You Should Measure
• Aligning KPIs with the vision and mission
Vision Business
Model
Competitive
Priorities KPIs
• Performance Management is a “Top-Down” Process
• Important to link KPIs to every employee’s personal compensation
• Earn a
premium on
our cost of
capital
• Help our
customer
improve
• Ensure
sustainability
• Commodity
Products
• Transparent
Pricing
• Difficult to
Differentiate
• Lower Price
• Reliable
Delivery
• Consistent
Quality
• Supply Chain
Costs
• On-Time
Delivery
• First-Pass
Prime Yield

6
Value Creation Drivers
Sale
Revenue
Fixed
Assets
Variable
Costs
Fixed
Costs
Working
Capital Cost of
Capital
Profit
EVA After
Cost of
Capital
Pricing
Product mix
Delivery performance
Variable manufacturing
cost
Raw material costs
Fix manufacturing costs
Process innovation
Inventories
Receivables
Forecast reliability
New investments
Investments in expansions
De-bottlenecking
Innovation
(product and
business models)
Shipping costs
Packaging costs
Transport costs
Payment terms/
dunning
Value Drivers

7
Analytics for Driving Value
• Reducing costs and increasing profitability analytics
Total manufacturing cost per unit excluding materials
Manufacturing cost as a percentage of revenue
Net operating profit
Productivity in revenue per employee
Average unit contribution margin
Return on asset/return on net assets
Energy cost per unit
Cash-to-cash cycle time
Customer fill rate/on-time delivery/perfect order percentage

8
Analytics for Driving Value (cont.)
• Optimizing inventory analytics
Inventory turns
Working capital: inventory as % of NCS
End of month inventory
Case fill service rate
Days of supply
Forecast bias, variation, accuracy
Inventory aging
SKU management
Donation/destruction

9
Analytics for Driving Value (cont.)
• Improving efficiency
Throughput
Capacity utilization
Overall equipment effectiveness (OEE)
Schedule or production attainment
Downtime in proportion to operating time

10
Analytics for Driving Value (cont.)
• Customer experience and responsiveness analytics
On-time delivery to commit
Manufacturing cycle time
Time to make changeovers
• Improving quality
Yield
Customer rejects/returns
Supplier quality incoming
• Increasing flexibility and innovation analytics
Rate of new product introduction
Engineering change order cycle time

11
Analytics for Measuring Plan Quality and Adherence
• Manufacturing schedule adherence (the absolute variance of
actual production to scheduled production)
When manufacturing over or under against plan, either service
level or inventory investment is adversely affected
• Solution quality (for advanced planning)
Measure the percentage of orders that are manually changed by
planners before they are executed (production, purchases, and
shipments)

12
What We’ll Cover
• What’s required to have a robust supply chain analytics strategy?
• Why has it been so challenging and costly to build in the past?
• What SAP analytics solutions are available?
• How to determine which solution is right for you
• How to be successful with an analytics transformation project
• Wrap-up

13
APO Integrated with SAP BW (Not on HANA)
Advanced
Planning and
Optimization
(APO)
SAP Business
Warehouse
(BW)
SAP
ERP
CIF
• No standard reports in APO
(only some alerts)
• Data must be replicated
from APO planning areas
into BW to get updated
information
• APO Datamart not designed
for performance required to
run reports
• So, custom reports must be
developed in SAP BW
• This can be very slow
depending on data volume

14
Customer Pain Points with APO/BW Reporting Solutions
• Missing decision support for ad hoc inquiries
• Dashboarding/reporting for APO data is not available without BW
• Data loading is very time consuming, no delta load capabilities
“I have to wait until the next business day to see updates in my
reports”
• Sub-daily planning processes may not be possible due to long
loading times
• No delivered standard reports or business content in APO
• No aggregated views available to look at product groups, regions,
and other hierarchy levels
There is too much information at lower levels
• APO is not as user friendly as desired
• Visualization into APO data has always been a gap

15
Complex, Confusing, Inflexible, Slow, Costly
• Every time a new supply chain reporting requirement is requested …

16
What Customers Require in a Supply Chain Analytics Solution
• Better decision making with near real-time information
• Ability to quickly analyze relevant planning situations at multiple
levels of aggregation
• Visibility into key supply chain planning data in an easily
consumable way
• Less time spent compiling, generating, and waiting for reports
• Ability to easily create ad hoc data models for analyze scenarios
• Standard delivered business content

17
What We’ll Cover
• What’s required to have a robust supply chain analytics strategy?
• Why has it been so challenging and costly to build in the past?
• What SAP analytics solutions are available?
• How to determine which solution is right for you
• How to be successful with an analytics transformation project
• Wrap-up

18
SAP Business Intelligence Platform
• Most of the business intelligence tools available can be utilized to
build custom supply chain reports, dashboards, and alerts
• The architecture is the key differentiator
SAP BW (not on HANA) requires periodic full data loads
SAP BW on HANA allows for reporting with near real-time data
• SAP BusinessObjects Business Intelligence platform 4.1 bundles
many of the BI tools available into one product offering
• No supply chain standard analytics delivered with the tool

19
SAP Business Warehouse on HANA Solution
Data source
(APO, BW, ECC) SAP HANA
database
BI tools
ANALYZE LOAD
MODEL
SAP HANA
Studio

20
Simplifying the SAP BusinessObjects BI Portfolio
Reporting
Dashboards
and
Applications
Office
Integration
Discovery
and
Analysis
Inte
rop
era
bilit
y
SAP Crystal Reports
SAP BusinessObjects Web Intelligence
SAP BusinessObjects Desktop
Intelligence
SAP Predictive Analysis
SAP Lumira
SAP BusinessObjects Set Analysis
SAP BusinessObjects Explorer
SAP BusinessObjects Analysis,
edition for OLAP
SAP BusinessObjects Design Studio
SAP BusinessObjects Dashboards
SAP BusinessObjects Analysis,
edition for Microsoft Office
SAP BusinessObjects Live Office
SAP BusinessObjects BI Widgets
SAP Crystal Reports
SAP BusinessObjects Web Intelligence
SAP Lumira
SAP BusinessObjects Design Studio
SAP BusinessObjects Analysis,
edition for Microsoft Office
• Because SAP’s Business Intelligence product offering has grown over the past several years, it has become confusing for customers to know what to use
• SAP has simplified things by bundling the offering in SAP BusinessObjects Business Intelligence platform 4.1

21
SAP BusinessObjects BI Portfolio
• Ability to connect BI clients for ad hoc, self-service reporting by experienced
business users
create visual appealing
Ad Hoc Reports using
SAP Lumira
Create tabular reports
allowing drill down in an
Excel like environment
Stay connected and
updated to Data in
SAP HANA
Custom Calculation Views
SAP Data Model
SAP HANA DB
Source: SAP

22
SAP Lumira
• Tool for easily building custom data visualizations on a
lightweight in-memory server
• Can quickly analyze large volumes of data and create data stories
Source: SAP

23
SAP HANA – Predictive Analysis Library
• Although the SAP Business Intelligence tools do not have many
standard delivered supply chain reports, SAP Predictive Analysis
Library (PAL) has a robust analytics library
• SAP Predictive Analytics is a statistical analysis, data mining, and
predictive analytics solution that can be utilized with SAP
BusinessObjects BI
• Allows more sophisticated analysis using Big Data (ideal for data
scientists)
• Large list of algorithms provided for: Associated Analysis
Cluster Analysis
Outlier detection
Data Preparation
Classification Analysis
Probability Distribution
Time Series Analysis
Regression
Statistical Functions (Univariate)
Statistical Functions (Multivariate)
Link Prediction

24
Supply Chain Info Center (SCIC) – Powered by HANA For APO Reporting • Solution
Out-of-the-box analytical reporting with streamlined data load
Decision support based on near real-time information
Pre-defined dashboards for different use cases for APO Planning
Use cases based on best practices for operational reporting on APO data leveraging the full potential of HANA
Jump right from Analysis into APO Transactions
• Key benefits
Increased performance for APO analytics by order of magnitudes allows close to real-time reporting
Highly attractive, user-friendly UI design
Simplified approach for operative reporting (e.g., no BW reporting framework)
Reporting on Data aggregates possible (product family grouping)
Source: SAP
Source: SAP

25
Supply Chain Info Center (SCIC) Use Cases
• Demand Planning
Forecast Accuracy
Forecast Bias
Current Consumption
Demand Waterfall Analytics
• Supply Network Planning
Supply Projection Analytics
Stock Coverage Analytics
Capacity Analytics
• Other
Order Fulfilment, Custom KPIs
Source: SAP
Source: SAP

26
Supply Chain Info Center (SCIC) – Mobility
• Fiori allows planners to track short-
term supply shortages, order
confirmation, or demand
fluctuations on different levels of
aggregation; available on your
tablet or any mobile device
KPI Overview Dashboard
views can be easily
personalized and made
available on mobile devices
See how demand
is developing over time
using Forecast Waterfall
Analysis Source: SAP
Source: SAP

27
Supply Chain Info Center (SCIC) Capacity Analytics Available in SCIC
• Resource-centric view
Aggregated views on location or resource groups
Visual alerting of critical load situations
Analyze capacity patterns between resources
Simulate resource overtime (planned)
User-friendly, graphical drill down to consuming products
Material Groups Drill down to products Drill down to location
Source: SAP
Jump right into APO
Source: SAP

28
Supply Chain Info Center – Custom Analytics
Can incorporate custom
defined KPIs to dashboards
within same look and feel
Can Analyze custom Key Figures
from APO Planning Books
Create custom
calculation views
for specific KPIs
Custom Calculation Views
SAP Data Model
SAP HANA DB
Source: SAP Source: SAP
Can analyze custom
key figures from APO
planning books

29
Deployment Options for Supply Chain Info Center
SAP APO with SAP HANA
Side-by-Side
SAP APO on SAP HANA database
SCM Server
SCM Basis
… SNC
APO
HanaDB
Analytics
SAP Data
Model
Live
Cache
SCM Server
Classical
DB
SCM Basis
… SNC
APO
HanaDB
Analytics
SAP Data
Model
SAP Landscape
Transformation (SLT)
Replication
LC replication
LC replication
Live
Cache
• Full and delta replication of APO data for snapshot and near to
real time analytics

30
Supply Chain Info Center – Value Proposition
• View data by aggregates: time based, product, location, and
resource
• Out-of-the-box support for custom key figures and characteristics
• 25+ pre-delivered KPIs for demand and supply planning
• Personalization features for user-specific views
• User-based favorite selection IDs
• Insight-to-action navigation to SAP APO interactive planning
books directly from dashboard
• KPI Framework to support custom KPI calculations
• State-of the-art usability with HTML5 UIs on any device

31
Integrated Business Planning – Supply Chain Control Tower
• Solution
Enable supply chain professionals to navigate, analyze and profitably manage the end-to-end supply chain in real-time
Understand current supply chain status with flexible dashboards
Provides historical and forward looking KPIs in a single view
Enable user-configured dashboards and analytics
Monetized impact of exceptions
• Key benefits
Increased on-time delivery performance
Reduce supply chain cost
Increase supply chain agility
Decrease overall inventory levels while reducing risk
Demand Inventory Supply
Response
Sales & Operations
User Experience
Supply Chain Control Tower
SAP HANA Platform
Source: SAP

32
Supply Chain Control Tower – Homepage and Analytics
• Flexible, role-based,
tile dashboards
• Tile resizing and
positioning on
dashboards with
single-value display
of KPI values based
on key figure
• Dashboard sharing by
role and user
• Option for adding
process
visualizations to
dashboards
Source: SAP
Source: SAP

33
Supply Chain Control Tower Architecture
• Integrates supply chain performance data from multiple systems
Supply Chain Control Tower Integrated Business
Planning
Event
Management
Transportation
Management
Advanced
Planning and
Optimization
Supply Network
Collaboration
SAP
ERP
3rd Party DB

34
SAP Supply Chain Control Tower – Use Cases
KPI Dashboard
Alerting to Action Task and Case Management
Global Visibility Source: SAP
Source: SAP
Source: SAP Source: SAP

35
Day in the Life Use for a Global Supply Chain Manager
Understand the
global supply chain
status
Identify the most important issues
Analyze the
Situation in
more detail
Perform rapid what-if analysis
on how to resolve?
Collaborate with
key people to
resolve the issue
Supply Chain
Control Tower
36
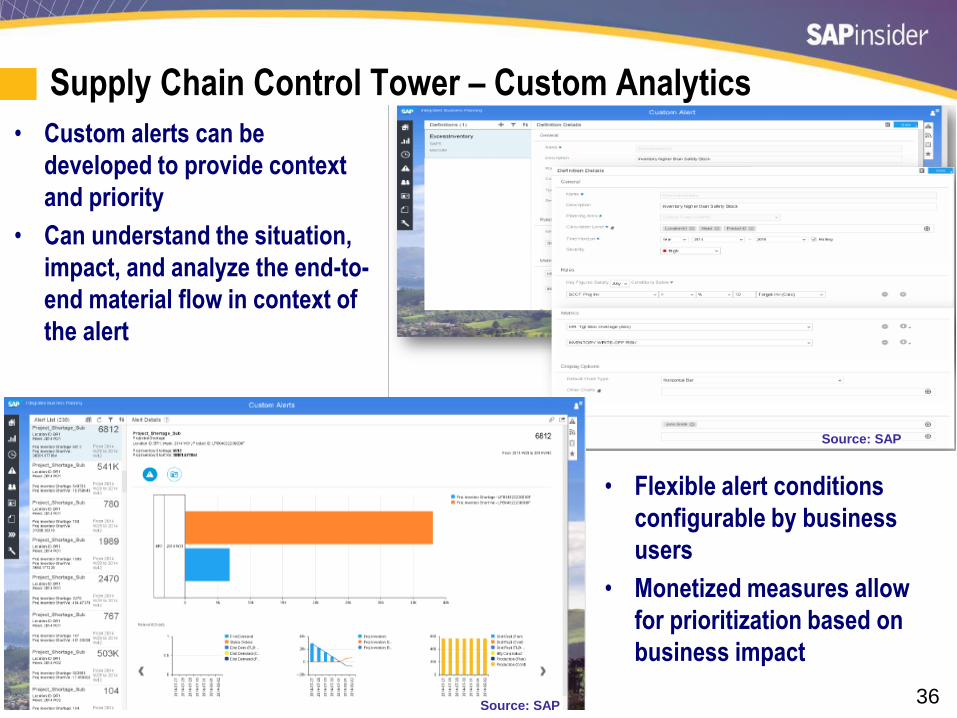
Supply Chain Control Tower – Custom Analytics
• Custom alerts can be
developed to provide context
and priority
• Can understand the situation,
impact, and analyze the end-to-
end material flow in context of
the alert
• Flexible alert conditions
configurable by business
users
• Monetized measures allow
for prioritization based on
business impact
Source: SAP
Source: SAP

37
Control Tower KPI Definitions Available
• 37 SAP pre-delivered KPIs currently available in IBP-Control Tower (Version 4.0)
20 generic SCM KPIs (i.e., Supply shortage %)
17 SCOR based KPIs (i.e., POF Delivery Date Accuracy)
• Should expect more KPIs to be released in future releases
• Build you own KPIs available now
• Flexible model for customer defined:
Attributes
Hierarchies
Key figures
Calculations

38
IBP – More Embedded Analytics
• Most of the new SAP Supply Chain products are being developed
and released with analytics included in the product offerings
• Analytics included in all of the IBP modules and DSiM
IBP - Dashboard & KPIs
IBP - Supply
IBP - Inventory
Source: SAP

39
SAP APO Demand Planning Add-In for Excel
• Use of the Demand Planning add-in for easy data entry to SAP APO
• Extension of Excel worksheets with local content (chart, formulas)
• Integrated management of SAP APO notes and Excel comments
• Excel flexibility for
data analyses
• No SAP GUI needed
• No SAP APO
knowledge is
necessary for casual
users
• Enter data in Online
or Offline mode Can add rows and
columns on the fly to do
calculations in Excel.
Can add
conditional
formatting.
Source: SAP

40
SAP APO Demand Planning Add-In for Excel (cont.)
• Graphics that are filtered to specific combinations may also be
viewed in table form
• Not designed for reporting, but has limited use cases for DP

41
What About Supply Chain Performance Management (SCPM)?
• 350+ Supply Chain KPIs delivered in SCPM
• SCPM has been removed from the SAP Price List
• Expect that some of the 350 KPIs will eventually be incorporated
into IBP-Control Tower
42
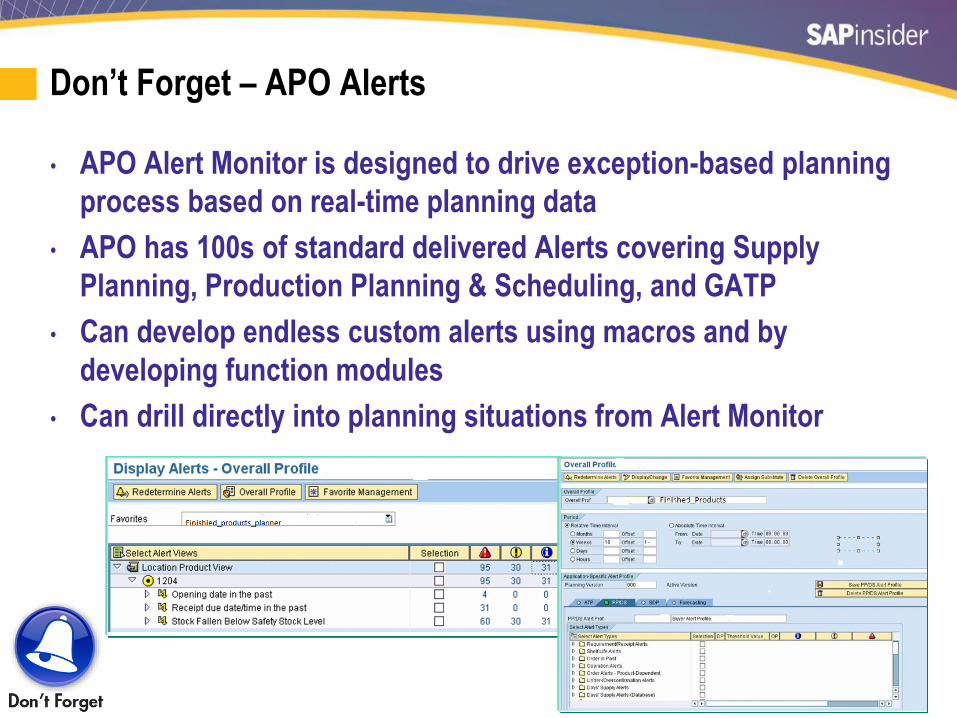
Don’t Forget – APO Alerts
• APO Alert Monitor is designed to drive exception-based planning
process based on real-time planning data
• APO has 100s of standard delivered Alerts covering Supply
Planning, Production Planning & Scheduling, and GATP
• Can develop endless custom alerts using macros and by
developing function modules
• Can drill directly into planning situations from Alert Monitor

43
APO Enhancements – Enhanced Product Planning (SCM7.0 EHP3)
Cross-system navigation (direct navigation to ERP orders)
New product-centric view
providing element list
New concept for notes
management
Side panels for
additional data
and information
Source: SAP

44
APO Enhancements – Enhanced Product Planning (SCM7.0 EHP3) (cont.)
New navigation panel
with order exploration
and KPI information
View with order details,
alerts, & pegging context
Source: SAP

45
APO Enhancements – Planner’s Home Page (SCM7.0 EHP2)
Micro chart showing Trend of
KPIs/Series in my Objects
Favorite Selections
and Reports
Date Selection
and Filtering
Personalized Alert KPIs for quick overview Collaboration on
latest events and
planning activities

46
What We’ll Cover
• What’s required to have a robust supply chain analytics strategy?
• Why has it been so challenging and costly to build in the past?
• What SAP analytics solutions are available?
• How to determine which solution is right for you
• How to be successful with an analytics transformation project
• Wrap-up
47
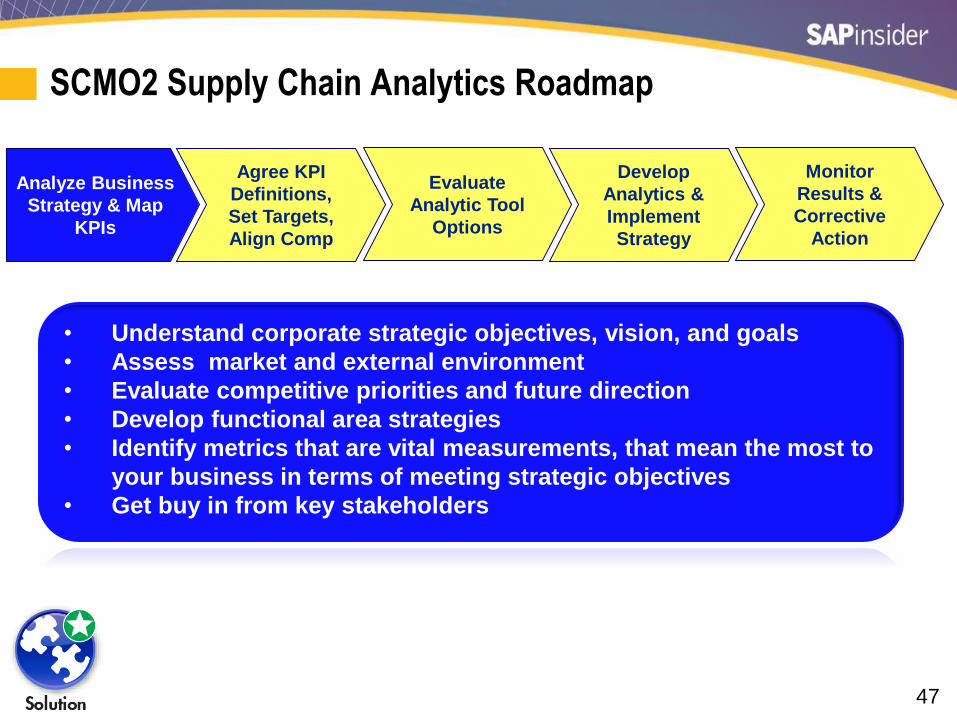
SCMO2 Supply Chain Analytics Roadmap
Agree KPI
Definitions,
Set Targets,
Align Comp
Analyze Business
Strategy & Map
KPIs
Evaluate
Analytic Tool
Options
Develop
Analytics &
Implement
Strategy
Monitor
Results &
Corrective
Action
• Understand corporate strategic objectives, vision, and goals
• Assess market and external environment
• Evaluate competitive priorities and future direction
• Develop functional area strategies
• Identify metrics that are vital measurements, that mean the most to
your business in terms of meeting strategic objectives
• Get buy in from key stakeholders

48
SCMO2 Supply Chain Analytics Roadmap (cont.)
Agree KPI
Definitions,
Set Targets,
Align Comp
Analyze Business
Strategy & Map
KPIs
Evaluate
Analytic Tool
Options
Develop
Analytics &
Implement
Strategy
Monitor
Results &
Corrective
Action
• Understand and agree the meaning of each of the metrics
• Understand the mechanics of each of the measurements, and what
factors influence your results
• Identify any areas for improvement in your existing processes
• Set goals based on improvement areas
• Aggressive yet attainable
• Benchmarked against like companies, or % improvement year
over year
• Align compensation plans for all employees with KPIs and targeted
improvement

49
SCMO2 Supply Chain Analytics Roadmap (cont.)
Agree KPI
Definitions,
Set Targets,
Align Comp
Analyze Business
Strategy & Map
KPIs
Evaluate
Analytic Tool
Options
Develop
Analytics &
Implement
Strategy
Monitor
Results &
Corrective
Action
• Understand the corporate reporting and analytic tools available in-
house and the long-term SAP reporting strategy
• Evaluate costs of SCM analytics tools not currently owned
• Consider how KPIs will need to be consumed across different user
groups (executive dashboards, data analysis, reports, and mobility)
• Evaluate how many KPIs can be met using standard calculations
available in each of the tools being considered
• Perform an analysis of development costs, performance, scalability
for each of the tools considered
• Agree strategy and begin development

50
SAP Supply Chain Planning Tool Comparison
Agree KPI
Definitions,
Set Targets,
Align Comp
Analyze
Business
Strategy & Map
KPIs
Evaluate
Analytic Tool
Options
Develop
Analytics &
Implement
Strategy
Monitor
Results &
Corrective
Action
APO Integrated with
BW/BusinessOjbects
BW/BusinessObjects
on HANA SCIC IBP-Control
Tower
Standard Delivered Supply Chain
KPIs
None None 25+ for Demand &
Supply, some GATP
Currently 37 KPIs,
but this will increase
Flexibility to build custom KPIs Yes Yes Limited Yes
Near Real-time Integration, High
Performance
Very Slow APO to BW
data Replication
Yes (HANA based) Yes (HANA based) Yes (HANA based)
Delta Replication No Yes Yes Yes
Cloud or On-Premise Both On-premise or Hosted
using HEC by SAP
On-premise or Hosted
using HEC by SAP
Only Cloud
(currently)
Mobility/Fiori Enabled Limited Yes Yes Yes
Cost to Implement High (all custom) High (all custom) Low Medium
Ready for Prime Time? Yes, but not the long-
term solution due to
performance issues
Yes - good platform to
develop full SC
reporting capabilities,
but everything will be
custom built
Limited number of
KPIs and not much
future development
planned
Still a new product,
but will be a good
solution when more
KPIs & connectors
are added

51
SCMO2 Supply Chain Analytics Roadmap
Agree KPI
Definitions,
Set Targets,
Align Comp
Analyze Business
Strategy & Map
KPIs
Evaluate
Analytic Tool
Options
Develop
Analytics &
Implement
Strategy
Monitor
Results &
Corrective
Action
• Develop specifications for each custom KPI
• Build reports and dashboards
• Develop a robust training and change management strategy
• Begin measuring KPIs to get a baseline
• Implement compensation incentive structure
• Deploy analytics across organization

52
SCMO2 Supply Chain Analytics Roadmap (cont.)
Agree KPI
Definitions,
Set Targets,
Align Comp
Analyze Business
Strategy & Map
KPIs
Evaluate
Analytic Tool
Options
Develop
Analytics &
Implement
Strategy
Monitor
Results &
Corrective
Action
• Continuous monitoring of KPIs
• Agree frequency of KPI review and perform root cause analysis
• Develop detailed action plans for improvement including who,
what, and when
• Make sure that actions do not negatively effect other areas
• Track progress, manage resources, and adjust goals as required
• Ensure strong leadership, committed participation, and confident
employees to drive results

53
What We’ll Cover
• What’s required to have a robust supply chain analytics strategy?
• Why has it been so challenging and costly to build in the past?
• What SAP analytics solutions are available?
• How to determine which solution is right for you
• How to be successful with an analytics transformation project
• Wrap-up

54
Keys to Success on Analytics Projects
• Focus on a few (3-5) key metrics in each area
• Supply chain measurements should have an owner (person or
department) responsible for achieving agreed upon target on the
metric
Tying incentives to metrics can be very effective
• Supply Chain Management needs to encourage and support the
process changes to achieve the desired targets
• Spend time harmonizing metrics and KPI definitions early in the
project before you start developing reports and dashboards
Empower someone to make hard decisions about global
definitions
55
Pitfalls to Avoid on SCM Analytics Projects
• Don’t get too hung up on the definition
It is better to agree on a definition and start measuring
improvement, than spending months debating the options
• Measurements alone are not the solution to your weak areas!
Need to develop action plans for corrective action
• Depending on your starting point, analytics projects often require
a major change management effort to be successful

56
What We’ll Cover
• What’s required to have a robust supply chain analytics strategy?
• Why has it been so challenging and costly to build in the past?
• What SAP analytics solutions are available?
• How to determine which solution is right for you
• How to be successful with an analytics transformation project
• Wrap-up

57
Where to Find More Information
• Free Trial – SAP Lumira System Access
http://global.sap.com/campaign/na/usa/CRM-US13-HXM-
AIIMCSIG/index.html?source=video-eChannels-lumira-YouTube
• Alan L. Milliken, “How to Measure, Monitor & Improve S&OP
Performance” (May 2012).
www.advcoretech.com/ConfPres/BASF%201.pdf
• Supply Chain Metric.com
http://supplychainmetric.com/
• “SAP HANA SPS 08 – What’s New? Predictive Analysis Library”
(SAP, 2014).
www.slideshare.net/SAPTechnology/hana-sps08-
newpredictiveanalysislibrary

58
7 Key Points to Take Home
• Make sure you define your company vision and mission before
defining which KPIs to measure
• SAP Business Intelligence on HANA will provide a high-
performance platform to build your own custom analytics with
near real time data
• The Supply Chain Control Tower is a new HANA-based platform
that provides pre-delivered supply chain analytics and allows for
custom analytics to be built based on data from APO, ECC, IBP, or
any external data source
• The Supply Chain Info Center also is a HANA-based platform that
provides some pre-delivered supply chain analytics and allows for
some custom analytics based on APO data

59
7 Key Points to Take Home (cont.)
• There are many considerations when determining which tool will
best meet your needs, including the timing for implementation,
performance requirements, mobility, and budget
• Make sure to have management buy-in and a top down approach
to be successful
• Tie KPI improvement to individual’s compensation to align
behaviors with desired business results

60
Your Turn!
How to contact me:
Matt Campbell
@GetMoreSCMO2
Please remember to complete your session evaluation

61
Disclaimer
SAP and other SAP products and services mentioned herein as well as their respective logos are trademarks or registered trademarks of SAP SE (or
an SAP affiliate company) in Germany and other countries. All other product and service names mentioned are the trademarks of their respective
companies. Wellesley Information Services is neither owned nor controlled by SAP SE.

Wellesley Information Services, 20 Carematrix Drive, Dedham, MA 02026 Copyright © 2015 Wellesley Information Services. All rights reserved.